march 29, 2021 s tock tales
TRANSCRIPT

Stock Tales are concise, holistic stock reports across wider spectrum of sectors. Updates will not be periodical but based on significant events or change in price.
Stock_____
TALES
March 29, 2021

ICIC
I S
ecurit
ies –
Retail E
quit
y R
esearch
Stock T
ale
s
March 29, 2021
CMP: | 3624 Target: | 4270 (18%) Target Period: 15 months
Dixon Technologies (India) (DIXTEC)
BUY
Rising star in domestic manufacturing space...
Dixon Technologies (DTL) is India’s leading electronic manufacturing service
(EMS) provider to various multinational/domestic companies in India. The
company is one of the biggest beneficiaries of the government’s production
linked incentive (PLI) scheme for mobile phones and other electronic
products. We believe PLI benefits will start flowing in from Q4FY21E
onwards while in future DTL’s mobile revenue will grow multi-fold (~14x
jump) over FY20-23E. DTL has also applied for PLI in the lighting, electronic
wearables and other electronic products (laptop/notebooks). This opens up
a significant growth opportunity for DTL, going forward (we see 4x jump in
revenue FY20-23E). Further, prudent working capital management and
future expansion through internal accruals will keep balance sheet light and
return ratios elevated (RoE: 39%, RoCE: 44%) for DTL, going forward.
Strong play in emergent domestic EMS industry
The Indian electronic manufacturing services (EMS) industry is likely to grow
at a CAGR of 45% over the next five years to become a ~US$152 billion (bn)
industry. We believe the China+1 strategy by various MNCs alongside
various government measures will help boost domestic EMS industry, going
forward. DTL being one of the largest EMS players, is well set to reap the
benefits of said growth opportunities. The company’s manufacturing
capacity in the LED TV, washing machines and LED lighting can serve ~26%,
28% and 45% of total domestic requirements (in volume term), respectively.
Focus to improve ODM for customer retention
DTL’s share of original design manufacturer (ODM) revenue has increased
from 22% in FY17 to 34% by FY20, which has also helped in ~140 bps
expansion in EBITDA margin. DTL plans to increase ODM revenue share in
consumer electronics from current 6% to 15% in the next two years, which
will help drive segment EBITDA margin higher. However, overall EBITDA
margin is expected to remain flat in FY20-23E considering a significant rise
in revenue from mobile business (OEM model).
Lean balance sheet supports strong RoEs, RoCEs
DTL has registered healthy RoE, RoCE of 22%, 26%, respectively, in FY20.
The future capex will largely be funded through internal accruals. We believe
prudent working capital management and higher asset turn in the mobile
business will result in higher RoE, RoCE, going forward.
Valuation & Outlook
We believe significant future growth potential in domestic electronic
manufacturing coupled with DTL’s plan to increase backward integration can
bring in more customers and would lead to a revenue & earnings CAGR of
56% & 66%, respectively, in FY20-23E. We believe DTL may continue to
command premium valuation due to its significant future growth
opportunities, high return ratios and lean working capital days. We assign a
BUY rating to the stock with a target price of | 4270/share, valuing the
company at 45x FY23E earnings.
Key Financial Summary
| Crore FY19 FY20E FY21E FY22E FY23E (CAGR 20-23E)
Net sales 2984.5 4400.1 6268.2 11843.8 16539.2 55.5
EBITDA 134.9 223.1 302.5 554.1 814.5 54.0
EBITDA Margin(%) 4.5 5.1 4.8 4.7 4.9
Net Profit 63.3 120.5 173.1 367.6 549.5 65.8
EPS (|) 11.2 20.6 29.6 62.8 93.9
P/E(x) 324.0 176.1 122.6 57.7 38.6
RoE (%) 16.7 22.3 25.4 37.6 38.6
RoCE (%) 22.4 26.3 26.3 40.1 43.9
Source: ICICI Direct Research, Company
Stock Data
Particular Amount
Market Cap (| Crore) 21,222.1
Total Debt (FY20) (| Crore) 82.8
Cash & Inv (FY20) (| Crore) 100.1
EV (| Crore) 21,204.8
52 week H/L 4588/ 624
Equity capital (| Crore) 11.6
Face value (|) 2.0
Price Performance `f
0
5000
10000
15000
20000
0
1000
2000
3000
4000
5000
May-18
Oct-18
Mar-19
Aug-19
Jan-20
Jun-20
Nov-20
Dixon NSE
Key Highlights
Strong play in government approved
PLI scheme for mobile phones
manufacturing. Mobile phone revenue
would see ~14x jump over FY20-23
Lean Balance sheet, strong return
rations and quality management
Risk to our call
Delay/less volume offtake by key
clients in mobile segment
Strong competition from global and
domestic EMS player restrict margin
movement
Research Analyst
Sanjay Manyal
Hitesh Taunk

ICICI Securities | Retail Research 2
ICICI Direct Research
Stock Tales | Dixon Technologies (India)
Company Background
Business profile
Dixon Technologies (DTL) was started in 1993. In 1994, the company
commenced manufacturing of colour television. At present, DTL’s six
business segments 1) consumer electronics (mainly TV), 2) lighting solutions
(LED lights), 3) home appliances (washing machines), 4) mobile & EMS, 5)
security devices (CCTV, DVR), 6) reverse logistics contribute 48%, 26%, 9%,
12%, 5% and 0.4%, respectively, to the company’s total topline. The
company mainly operates through two business models: 1) original
equipment manufacturer (OEM), 2) original design manufacturer (ODM). The
ODM revenue contribution for the company increased from 22% in FY17 to
38% in FY20. This is largely due to expansion in backward integration and
improved ability in designing & developing products through in-house R&D.
While a significant chunk of the business comes from the OEM business, the
company has increased focus on increasing the mix of ODM share in
consumer electronics and lighting business in future. Marquee clients
include global MNCs such as Samsung, Xiaomi, Motorola, Panasonic,
Phillips, etc and domestic majors such as Voltas-Beko, Havells-Lloyd,
Godrej, Bajaj Electricals, Crompton Greaves, etc.
DTL recorded strong revenue CAGR of 39% in FY17-20 to | 4400 crore led
by 35%, 28% and 27% revenue CAGR in the consumer electronics, home
appliances and lighting segments, respectively. The company has a strong
balance sheet with a stringent working capital cycle of a mere six days along
with RoCE & RoE of 26% and 22%, respectively.
Exhibit 1: DTL’s business profile
Revenue
(| crore)
EBITDA
Margin
Consumer
Electronics
Smart TVs, ultrahigh
definition,commercial
and signage display
3.6 2095 2.4% 48% 6% 35% 26%
Lighting
Solutions
Indoor lighting and LED
bulbs
Bulb- 240
Batens- 24
Downlighters- 6
1140 8.6% 26% 87% 27% LED- 45%
Home
appliances
Washing machines-
Semi automatic, top
loading
Semi auto-1.2
Top loading- 0.6
396 11.6% 9% 100% 28% 28%
Mobile &
EMS
Feature phones
Smart Phones
Feature- 27
Smart phone- 3
537 3.6% 12% Nil NM 10%**
Security
Devices
CCTV, Digital Video
Recorders
(DVRs).
CCTV- 27
DVR- 1.8
216 3.3% 5% 100% 93%* 25%^
Reverse
Logistics
Repair & Refurbishment -
Set up box, Mobile
phones, LED Tv
- 16 16.9% 0.4% NM NM _
Capacity % of
total industryRevenue CAGR
(FY17-20)
FY20
Product Product discription
Production Capacity
(mn units/annum)
Revenue
contr. % of
total
ODM Share
(%) of
segment
Source: Company, ICICI Direct Research, * YoY growth in FY20, ** plans 5x expansion in smart phone capacity in next two years, ^ value market share

ICICI Securities | Retail Research 3
ICICI Direct Research
Stock Tales | Dixon Technologies (India)
Exhibit 2: Major clientele as on FY20
Source: Company, ICICI Direct Research,
Exhibit 3: Journey of Dixon so far
Assembly
Capability
CTV and VCR
assembly started
Added assembly of PCBs,
DVDs, CFL bulbs & STBs
Added ODM for CTV,
DVD & CFL bulbs
Started LCD/LED TVs,
Mobile Phones, CCTVs
Achievements
Joined hands with
the Global Consumer
Electronics Giants
Acquired leading Indian
Consumer Durable brands
as Customers
1st Indian company
to develop STB-ODM
solution
PLI, Significant client addition,
exploring export oppertunities
Manufacturing
First manufacturing
facility operational at
Noida
Established Multilocation
footprint
Started Sheet metal &
plastic moulding
Washing Machine & LED
Lighting, Magnetic and power
supplies , Security Cameras
Prescriptive
EMS
Operations
Operational
Sophistication
ODM &
Backward
Integration
High Value- Added
Products
Mid to late 90's 2000-2008 2008-2010 Last 10 years
Source: Company, ICICI Direct Research,
ICICI Securities | Retail Research 4
ICICI Direct Research
Stock Tales | Dixon Technologies (India)
Investment Rationale
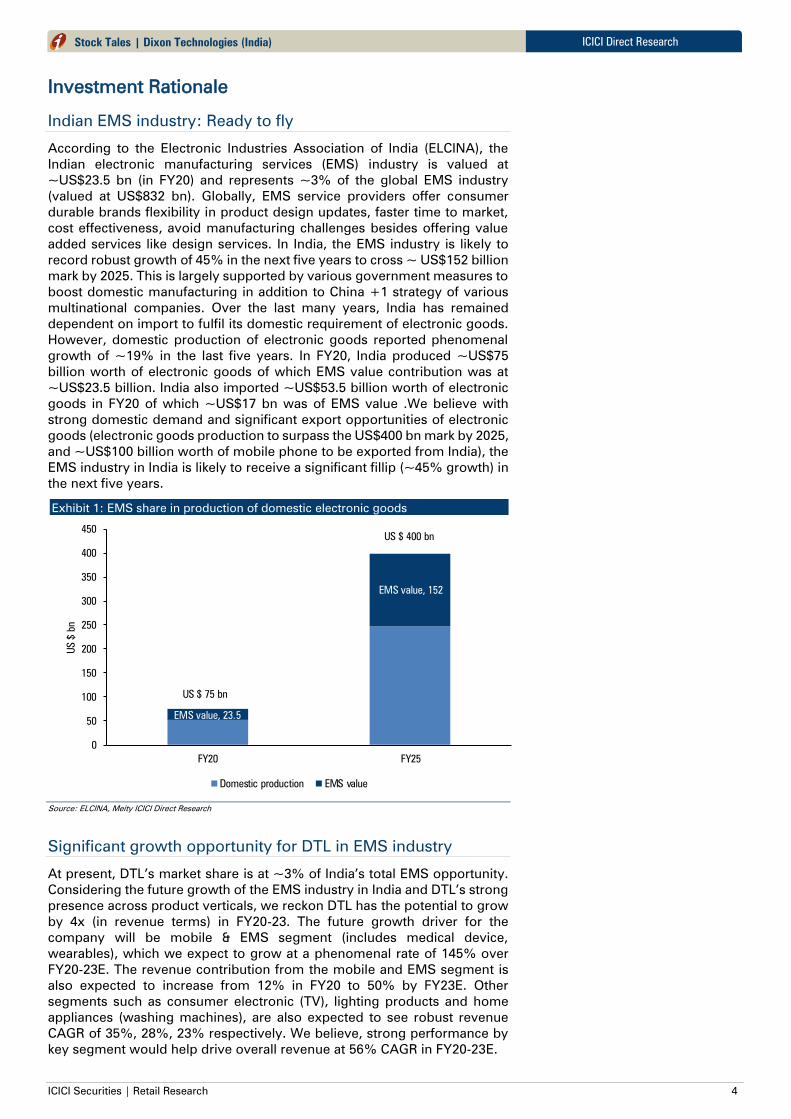
Indian EMS industry: Ready to fly
According to the Electronic Industries Association of India (ELCINA), the
Indian electronic manufacturing services (EMS) industry is valued at
~US$23.5 bn (in FY20) and represents ~3% of the global EMS industry
(valued at US$832 bn). Globally, EMS service providers offer consumer
durable brands flexibility in product design updates, faster time to market,
cost effectiveness, avoid manufacturing challenges besides offering value
added services like design services. In India, the EMS industry is likely to
record robust growth of 45% in the next five years to cross ~ US$152 billion
mark by 2025. This is largely supported by various government measures to
boost domestic manufacturing in addition to China +1 strategy of various
multinational companies. Over the last many years, India has remained
dependent on import to fulfil its domestic requirement of electronic goods.
However, domestic production of electronic goods reported phenomenal
growth of ~19% in the last five years. In FY20, India produced ~US$75
billion worth of electronic goods of which EMS value contribution was at
~US$23.5 billion. India also imported ~US$53.5 billion worth of electronic
goods in FY20 of which ~US$17 bn was of EMS value .We believe with
strong domestic demand and significant export opportunities of electronic
goods (electronic goods production to surpass the US$400 bn mark by 2025,
and ~US$100 billion worth of mobile phone to be exported from India), the
EMS industry in India is likely to receive a significant fillip (~45% growth) in
the next five years.
Exhibit 1: EMS share in production of domestic electronic goods
EMS value, 23.5
EMS value, 152
0
50
100
150
200
250
300
350
400
450
FY20 FY25
US
$ bn
Domestic production EMS value
US $ 75 bn
US $ 400 bn
Source: ELCINA, Meity ICICI Direct Research
Significant growth opportunity for DTL in EMS industry
At present, DTL’s market share is at ~3% of India’s total EMS opportunity.
Considering the future growth of the EMS industry in India and DTL’s strong
presence across product verticals, we reckon DTL has the potential to grow
by 4x (in revenue terms) in FY20-23. The future growth driver for the
company will be mobile & EMS segment (includes medical device,
wearables), which we expect to grow at a phenomenal rate of 145% over
FY20-23E. The revenue contribution from the mobile and EMS segment is
also expected to increase from 12% in FY20 to 50% by FY23E. Other
segments such as consumer electronic (TV), lighting products and home
appliances (washing machines), are also expected to see robust revenue
CAGR of 35%, 28%, 23% respectively. We believe, strong performance by
key segment would help drive overall revenue at 56% CAGR in FY20-23E.

ICICI Securities | Retail Research 5
ICICI Direct Research
Stock Tales | Dixon Technologies (India)
Domestic mobile production to grow 5x under PLI
The central government aims to create a self-reliant India (Atmanirbhar
Bharat) in the field of electronic manufacturing wherein India will not only
stand to fulfil its domestic requirements but also be a manufacturing hub of
the world. To make India a global manufacturing hub for electronics the
government launched three schemes on April 2020, which are production
linked incentives (PLI) scheme, scheme for promotion of manufacturing of
electronic components and semiconductors (SPECS) and modified
electronic manufacturing cluster (EMC).
PLI for large scale electronics manufacturing proposes a financial incentive
to boost domestic manufacturing and attract large investments in the
electronics value chain (including components and semiconductor
packaging). In case of mobile phones, the scheme will extend an incentive
of 4% to 6% on incremental sales (over base year) of goods manufactured
in India for five years subsequent to the base year (FY20 will be treated as
base year). The government has outlined ~ | 40, 951 crore under the PLI for
a tenure of five years. Similarly, the SPECS notified for manufacturing of
electronics components and semiconductors has a budget outlay of | 3,285
crore spread over eight years. The notified EMC 2.0 has a total incentive
outlay of | 3,762 crore spread over eight years with the objective to create
10 lakh direct and indirect jobs under the scheme.
Exhibit 2: PLI scheme eligibility criteria
Source: PLI Presentation Government of India, ICICI Direct Research
On the domestic front, Padget Electronic (100% of subsidiary of Dixon
Technologies), Lava, Bhagwati (Micromax), UTL Neolyncs and Optiemus
Electronics have received approval under PLI schemes for the
manufacturing of mobile phones (invoice value below | 15,000). These
domestic companies have proposed a production output of | 1.25 lakh crore
over the next five years.
International companies such as Samsung, Foxconn Hon Hai, Rising Star,
Wistron and Pegatron have received PLI approvals (for manufacturing
mobile invoice value | 15,000 and above). Apple (37%) and Samsung (22%)
together account for nearly 60% of global sales of mobile phones.
In the last four years, domestic mobile production witnessed strong growth
of ~34% to | 2.25 lakh crore backed by strong domestic demand and import
curb by central government (through increased custom duty). Further, with
China + 1 strategy of global brands/manufacturers and increased value
addition (to 35-40% from 15-20% currently) through PLI, domestic
ICICI Securities | Retail Research 6
ICICI Direct Research
Stock Tales | Dixon Technologies (India)
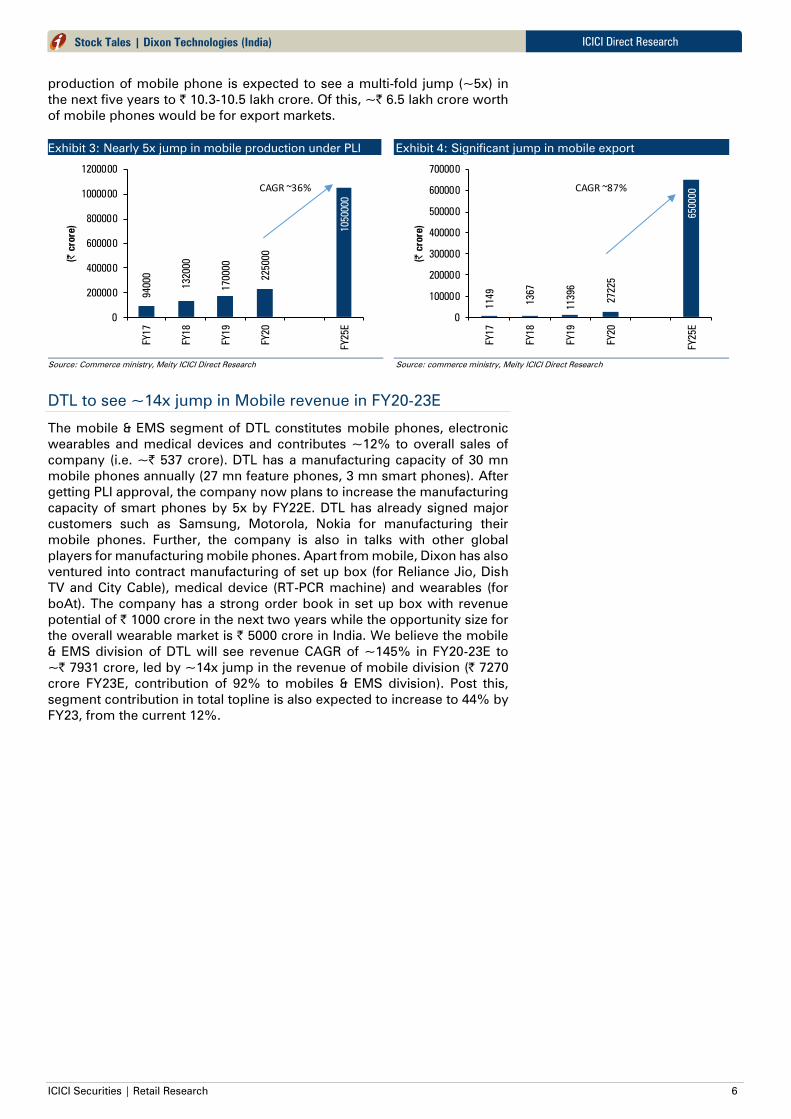
production of mobile phone is expected to see a multi-fold jump (~5x) in
the next five years to | 10.3-10.5 lakh crore. Of this, ~| 6.5 lakh crore worth
of mobile phones would be for export markets.
Exhibit 3: Nearly 5x jump in mobile production under PLI 94000
132000
170000
225000
1050000
0
200000
400000
600000
800000
1000000
1200000
FY17
FY18
FY19
FY20
FY25E
(| crore)
CAGR ~36%
Source: Commerce ministry, Meity ICICI Direct Research
Exhibit 4: Significant jump in mobile export
1149
1367
11396
27225
650000
0
100000
200000
300000
400000
500000
600000
700000
FY17
FY18
FY19
FY20
FY25E
(| crore)
CAGR ~87%
Source: commerce ministry, Meity ICICI Direct Research
DTL to see ~14x jump in Mobile revenue in FY20-23E
The mobile & EMS segment of DTL constitutes mobile phones, electronic
wearables and medical devices and contributes ~12% to overall sales of
company (i.e. ~| 537 crore). DTL has a manufacturing capacity of 30 mn
mobile phones annually (27 mn feature phones, 3 mn smart phones). After
getting PLI approval, the company now plans to increase the manufacturing
capacity of smart phones by 5x by FY22E. DTL has already signed major
customers such as Samsung, Motorola, Nokia for manufacturing their
mobile phones. Further, the company is also in talks with other global
players for manufacturing mobile phones. Apart from mobile, Dixon has also
ventured into contract manufacturing of set up box (for Reliance Jio, Dish
TV and City Cable), medical device (RT-PCR machine) and wearables (for
boAt). The company has a strong order book in set up box with revenue
potential of | 1000 crore in the next two years while the opportunity size for
the overall wearable market is | 5000 crore in India. We believe the mobile
& EMS division of DTL will see revenue CAGR of ~145% in FY20-23E to
~| 7931 crore, led by ~14x jump in the revenue of mobile division (| 7270
crore FY23E, contribution of 92% to mobiles & EMS division). Post this,
segment contribution in total topline is also expected to increase to 44% by
FY23, from the current 12%.

ICICI Securities | Retail Research 7
ICICI Direct Research
Stock Tales | Dixon Technologies (India)
Exhibit 5: PLI schemes to support nearly strong growth in
mobile & EMS division revenues
811
670
355
537
1074
4817
7931
0
1000
2000
3000
4000
5000
6000
7000
8000
9000FY17
FY18
FY19
FY20
FY21E
FY22E
FY23E
(| crore)
CAGR ~145%
Source: Company, ICICI Direct Research
Exhibit 6: Mobiles & EMS division margin expected to
normalise post FY21
0.6
1.0
2.1
3.6
5.2
4.04.2
0
1
2
3
4
5
6
FY17 FY18 FY19 FY20 FY21E FY22E FY23E
(%
)
Source: Company, Meity ICICI Direct Research
Consumer electronics: Import restrictions, customer addition to
drive segment sales
The Indian LED TV market is estimated to grow at a CAGR of 10% in FY19-
23E from 14 million units in FY19 to 21 mn units by FY23. In value terms, the
industry is expected to grow at | 32,200 crore in FY23E from | 22,000 crore
in FY19 supported by an improved mix and volume growth. The demand is
expected to be largely driven by higher internet penetration, rising content
consumption, falling price of entry level smart TVs, low levels of multi-TV
homes in urban markets and rising work from home culture. This, along with
restrictions on import of LED TVs by government (import value of TV set in
FY19 was at ~| 7000 crore) is expected to boost domestic manufacturing of
LED TV, which is a significant positive for Dixon Technologies.
Dixon is a market leader in the LED TV manufacturing. DTL has LED TV
manufacturing capacity of 3.6 mn units by the end of FY20, which has
increased to 4.4 mn in FY21E i.e. 22% YoY growth. The company further
plans to increase LED TV manufacturing capacity by 25% in FY22E to 5.5 mn
units. The 52% increase in LED TV manufacturing capacity in two years was
mainly due to rising demand from existing customers (for new SKUs) and
addition of new clients. Dixon has marquee customers in this segment
including both domestic & global brands. The major customers in this
segment are Xiaomi, Samsung, Panasonic, TCL, Lloyd, Flipkart, Philips,
Toshiba, Vu, One Plus, etc. Unlike lighting and home appliances segment
(where ODM revenue share is 87% and 100%, respectively), the ODM share
in consumer electronics is at 6%. With increased backward integration
(increased SMT line by 80% YoY to 1.8 mn in FY20) the company is looking
to increase ODM share in consumer electronics from the current 6% to 15-
20% in the next two to three years, which would help increase the EBITDA
margin of the segment, going forward. We build-in revenue CAGR of 35%
for the consumer electronic segment in FY20-23E.

ICICI Securities | Retail Research 8
ICICI Direct Research
Stock Tales | Dixon Technologies (India)
Exhibit 7: TV industry to continue to grow at CAGR 10%
18291
19776
22189
32104.2
0
5000
10000
15000
20000
25000
30000
35000
FY17
FY18
FY19
FY23E
(| crore)
CAGR ~10%
Source: commerce ministry, ICICI Direct Research
Exhibit 8: India’s TV import increases 11% in FY15-19
4709
3071
3636
4658
7120
0
1000
2000
3000
4000
5000
6000
7000
8000
FY15
FY16
FY17
FY18
FY19
(| crore)
CAGR ~11%
Source: Commerce ministry, ICICI Direct Research
Exhibit 9: Customer addition to help drive growth for DTL
845
1073
1194 2
095
3527
4479 5
167
0
1000
2000
3000
4000
5000
6000
FY17
FY18
FY19
FY20
FY21E
FY22E
FY23E
(| crore)
CAGR ~35%
Source: Company, ICICI Direct Research
Exhibit 10: Expect marginal improvement in EBITDA margin
3.0
2.22.1
2.4
2.82.9
3.1
1.0
1.5
2.0
2.5
3.0
3.5
4.0
FY17 FY18 FY19 FY20 FY21E FY22E FY23E
(%)
Source: Company, Meity ICICI Direct Research
Lighting segment: Focus on improving product mix, export
opportunities
According to industry estimates, the global LED lighting market is valued at
~US$76 billion in 2020 and is expected to continuously grow at ~14%
CAGR to cross US$160 billion by 2026 supported by growing needs of
energy efficient products across the globe. The Indian LED lighting industry,
which is valued at | 18,000 crore, recorded phenomenal growth of 29% in
FY15-20 mainly due to replacement of conventional lighting products to LED
lights. The LED lighting industry is likely to continue to grow at a CAGR of
11% in FY20-23E backed by government’s Unnat Jyoti by Affordable LEDs
for All (Ujala) and Street Lighting National Programme (opportunity size of
| 8000 crore).
Dixon is the key supplier to Signify (earlier Phillips), Panasonic Life solutions,
Wipro, Bajaj, Syska, Orient, Havells, Polycab, Luminous etc for their lighting
requirements (LED bulbs, battens and down lighters). Dixon has ~ 240
million (mn) LED bulbs manufacturing capacity (which is ~45% of India’s
total LED bulb requirements) and 24 mn & 14.4 mn manufacturing capacity
of battens & down lighters, respectively (~25% of India’s total
requirements). While the company sees commercial LED lightings and LED
street lighting as a big opportunity for future growth drivers in the domestic
markets, it is also exploring export opportunities for lighting products. The
central government aims to promote domestic manufacturing of LED lights
in India for which a PLI has also been approved (a PLI worth | 6238 crore
has been approved for AC and LED lighting products).

ICICI Securities | Retail Research 9
ICICI Direct Research
Stock Tales | Dixon Technologies (India)
Dixon’s ODM share of lighting revenue is 87% due to its backward
integration capabilities (in sheet metal, plastic moulding & wound
components) and strong R&D backup to develop low cost products. As a
result, the lighting division segment EBITDA margin at 8.6% (in FY20) is
much higher compared to company level EBITDA margin of ~5%. Further,
for FY20-23E we build in ~28% revenue CAGR for lighting segment revenue
and margin improvement of ~100 bps over the same period.
Exhibit 11: Better mix, export opportunities to drive growth
of lighting division
551
774 919
1140
1084
1657
2386
0
500
1000
1500
2000
2500
3000
FY17
FY18
FY19
FY20
FY21E
FY22E
FY23E
(| crore)
CAGR ~28%
Source: Company, ICICI Direct Research
Exhibit 12: Improved product mix to drive EBITDA margin in
FY20-23E
3.2
6.1
7.2
8.6
9.39.6 9.7
0.0
2.0
4.0
6.0
8.0
10.0
12.0
FY17 FY18 FY19 FY20 FY21E FY22E FY23E
(%
)
Source: Company, Meity ICICI Direct Research
Home appliances: New capacity, client addition to drive future
growth
The home appliances segment of the company mainly comprises washing
machines. DTL was mainly present in the semi-automatic washing machines
category until FY20. However, the company has now started manufacturing
top loading automatic washing machines with initial capacity of ~0.6 million
units annually (revenue flow will start from FY21). The company currently
has 140 models from 6.0 Kg to 10 Kg in the semi-automatic machine
category and has the largest capacity in India of ~1.2 million units (almost
28% of the Indian market requirement). The home appliances business is a
100% ODM business and DTL has acquired in-house capabilities for
designing the complete range of semi-automatic washing machines. Also,
the company has in-house development of new design concepts with
additional features like magic filter, water fall, side scrubber and air dry. The
major customers in this segment are Samsung, Godrej, Panasonic, Lloyd,
Flipkart, Haier, Voltas- Beko, Reliance Industries, etc.
The Indian washing machine industry is pegged at | 10,600 crore and is likely
to surpass the | 15000 mark by FY23 at a CAGR of ~12%. The growth would
largely be driven by growing working population, increasing in number of
nuclear families, absence of domestic helps (amid pandemic) and rising
trend of working women to drive urban consumption. We believe the home
appliances segment of the company will grow at a CAGR of 23% in FY20-
23E to | 740 crore led by addition of newer top loading washing machine
categories and client additions in the existing product category. On the
margin front, we believe EBITDA margin is likely to normalise from FY20
level and settle at ~10.6% in FY23.

ICICI Securities | Retail Research 10
ICICI Direct Research
Stock Tales | Dixon Technologies (India)
Exhibit 13: Client addition to drive growth in home appliance
188 2
50
374
396
409
619
739
0
100
200
300
400
500
600
700
800
FY17
FY18
FY19
FY20
FY21E
FY22E
FY23E
(| crore)
CAGR ~23%
Source: Company, ICICI Direct Research
Exhibit 14: Gradual margin improvement FY21-23
16.3
12.3
9.9
11.6
10.310.1
10.6
4.0
6.0
8.0
10.0
12.0
14.0
16.0
18.0
FY17 FY18 FY19 FY20 FY21E FY22E FY23E
(%
)
Source: Company, ICICI Direct Research
Security Systems: Improved discretionary spend to drive
segment performance
DTL entered into a security surveillance system in FY18 through a JV with
Aditya Infotech for manufacturing security devices including CCTVs & digital
video recorders (DVRs). “CP Plus”, trademark owned by Aditya Infotech, is
one of the leading industry players in the field of physical security with a
marker share of 24% and has been No.1 security and surveillance brand for
the past six years. DTL’s security systems contribute ~5% to the company’s
overall revenue (FY20 revenue at ~ | 216 crore).
The Indian security industry is consistently growing and expanding with
opportunities emanating from the government and private sector verticals.
The key drivers of this growth are increase in organised real estate sector,
rise in threat perception, growing crime rates, data thefts, remote
monitoring, growth of public infrastructure. Growth would be aided by
government initiatives leading to rise in demand for security equipment. We
build in ~11% revenue CAGR for security system in FY20-23E with a slight
improvement in EBITDA margin at 3.3%.
Exhibit 15: Moderate growth in segment
112
216
161
254
297
0
50
100
150
200
250
300
350
FY19
FY20
FY21E
FY22E
FY23E
(| crore)
CAGR ~11%
Source: Company, ICICI Direct Research
Exhibit 16: Margin to remain at FY20 level
1.1
3.3
3.1
3.3 3.3
0.0
0.5
1.0
1.5
2.0
2.5
3.0
3.5
4.0
FY19 FY20 FY21E FY22E FY23E
(%
)
Source: Company, Meity ICICI Direct Research
Reverse logistics: Expect flattish revenue growth
The reverse logistics business of the company involves repair &
refurbishment of set top boxes, LED TV panels & mobile phones. It is one of
the few companies to have panel repairing and LED TV refurbishment
facilities. This business is more strategic in nature, more to enhance the
stickiness with customers and provide them end-to-end solution. The
segment’s contribution in topline is miniscule at 0.4% (| 16 crore in FY20).
We build in flattish revenue for the segment with improvement in EBITDA
margin at ~10%.

ICICI Securities | Retail Research 11
ICICI Direct Research
Stock Tales | Dixon Technologies (India)
Focus to increase share of ODM business
Dixon Technologies operates under two business models, original
equipment manufacturer (OEM) and original design manufacturer (ODM). In
OEM, Dixon provides fully integrated end-to-end product and solution suite
to original equipment manufacturers ranging from global sourcing,
manufacturing, quality testing and packaging to logistics. Here R&D and
designing portion is done by the customers themselves. In the ODM model,
the complete value chain is controlled by the EMS player on behalf of a
leading brand. The scope of work starts right from design and development
of products, manufacturing and supply. While the OEM business is less
capital intensive, the ODM business requires additional investment in R&D
as well as working capital. However, the ODM model commands
significantly high margin compared to OEM and increased customer
stickiness.
While at present Dixon has a meaningful revenue contribution from OEM
segment (~66% of revenue in FY20), the revenue contribution of ODM has
grown notably. In the last four years, ODM revenue contribution to total
revenue increased from 22% in FY17 to 34% in FY20. Dixon’s share in ODM
is higher in the home appliances i.e. washing machine (100%), lighting
(~9870%) and consumer electronics i.e. TV (6%). Dixon further aims to
increase share of ODM in the lighting and consumer electronic segment to
95-96% and 15-20%, respectively, in the near future.
Exhibit 17: Strong growth in ODM revenue
537 624
1135
1514
0
200
400
600
800
1000
1200
1400
1600
FY17
FY18
FY19
FY20
(| crore)
CAGR ~41%
Source: Company, ICICI Direct Research
Exhibit 18: ODM share of business
6%
87%
100%
0%
20%
40%
60%
80%
100%
120%
Consum
er
Ele
ctronic
s
Lig
htin
gs
Hom
e a
ppliances
Source: Company, Meity ICICI Direct Research

ICICI Securities | Retail Research 12
ICICI Direct Research
Stock Tales | Dixon Technologies (India)
Financials
Revenue CAGR of 56% in FY20-23 led by mobile & EMS division
DTL is likely to see consolidated revenue CAGR of 56% to | 16,539 crore in
FY20-23E led by the company’s mobile & EMS division, which is likely to
grow strongly at ~145% CGAR during the same period. We believe
opportunities in the newer segment (like wearables, top loading automatic
washing machines) addition of new clients and increased wallet share from
existing clients would help drive revenue for DTL.
Exhibit 19: Strong revenue growth over FY20-23E
2457
2842
2984
4400 6
268
11844
16539
0
2000
4000
6000
8000
10000
12000
14000
16000
18000
FY17
FY18
FY19
FY20
FY21E
FY22E
FY23E
(| crore)
CAGR ~56%
Source: Company, ICICI Direct Research
Operating leverage, higher ODM share of lighting & consumer
electronics to help maintain EBITDA margin
DTL recorded an EBITDA margin expansion by ~140 bps in FY17-20E led by
higher operating leverage and sharp increase in revenue contribution of the
ODM business. The ODM revenue of the company recorded phenomenal
growth of 41% in FY17-20E while its contribution in revenue increased from
22% to 34% during the same period. The EBITDA margin of the ODM
business was up ~600-700 bps compared to the OEM segment margin.
However, for FY20-23E, we believe the EBITDA margin will remain at ~5%
given a significant rise in the contribution of mobile & EMS business (which
will be OEM in nature). Finally, strong revenue growth coupled with saving
in interest cost would help drive PAT at a CAGR of 66% in FY20-23E.
Exhibit 20: EBITDA to grow strongly in FY20-23
91113
135
223
305
554
814
0.0
1.0
2.0
3.0
4.0
5.0
6.0
0
100
200
300
400
500
600
700
800
900
FY17
FY18
FY19
FY20
FY21E
FY22E
FY23E
(%
)
(| crore)
EBITDA EBITDA Margin
Source: Company, ICICI Direct Research
Exhibit 21: Robust PAT CAGR of 66% in FY20-23E
48
61
63
121 1
73
368
550
0
100
200
300
400
500
600
FY17
FY18
FY19
FY20
FY21E
FY22E
FY23E
(| crore)
CAGR ~66%
Source: Company, Meity ICICI Direct Research

ICICI Securities | Retail Research 13
ICICI Direct Research
Stock Tales | Dixon Technologies (India)
Robust profitability, lean b/s lead to strong RoCE, RoE
DTL posted healthy RoE, RoCE of 22%, 26%, respectively, in FY20. The
company is aiming at a capex of ~| 150-160 crore in the next two years,
which will largely be used to increase the capacity of mobile & EMS (mobile
manufacturing capacity will increase from current 30 mn to 50 mn by FY23).
The capex will largely be funded through internal accruals. This, coupled
with prudent working capital management, going forward, is likely to result
in strong RoE, RoCE of 39% and 44% in FY23E.
Exhibit 22: Trend of return ratios, going forward
34
28
22
26 26
40
44
24
19
17
22
25
3839
0
5
10
15
20
25
30
35
40
45
50
FY17 FY18 FY19 FY20 FY21E FY22E FY23E
(%
)
RoCE RoE
Source: Company, ICICI Direct Research
Exhibit 23: Valuation Matrix (Peer)
FY20 FY21E FY22E FY23E FY20 FY21E FY22E FY23E FY20 FY21E FY22E FY23E FY20 FY21E FY22E FY23E FY20FY21E FY22E FY23E FY20FY21E FY22E FY23E FY20 FY21EFY22E FY23E
Dixon Tech 21,222 4400.1 6268.2 11843.8 16539.2 5.1 4.8 4.7 4.9 120.5 173.1 367.6 549.5 0.2 0.3 0.2 0.1 22.3 25.4 37.6 38.6 26.3 26.3 40.1 43.9 176.1 122.6 57.7 38.6
Amber Ent 9,670 3962.8 3277.1 5375.8 6695.2 7.8 7.1 8.2 8.7 164.1 100.5 229.8 328.7 0.3 0.2 0.2 0.1 14.5 6.5 13.0 15.8 14.3 8.4 15.3 18.7 58.9 103.0 45.1 31.5
D/E RoE RoCE PEMcap
| crore
Sales EBITDA margin PAT
Source: Company, ICICI Direct Research

ICICI Securities | Retail Research 14
ICICI Direct Research
Stock Tales | Dixon Technologies (India)
Risks & Concerns
Higher dependence on key customers
At present, the company has high dependency on a few customers on its
key products consumer electronic (Samsung and Xiaomi contribute ~75%
in segment revenue) and mobile division (new customers signed are
Motorola and Nokia under PLI). While the company is planning to add more
customers for said divisions, buy no renewal or delay/cancelation of orders
from existing customers poses risk on revenue growth going forward.
Competition from global EMS players
The international companies such as Foxconn Hon Hai, Rising Star, Wistron
and Pegatron have received PLI approvals along with the world’s largest
players in the EMS industry. Their scale and strong backward integration in
the component manufacturing capacity (in mobile phones) could be a risk
for Dixon in getting large margin orders.
Global shortage of semiconductor may delay order execution
Globally, electronic manufacturing services providers are facing shortage of
chips (semiconductors) for manufacturing electronic goods. This is largely
due to trade war with China and a significant rise in demand for cell phones,
laptops, other work-from-home devices amid pandemic. This coupled with
shortage of containers may lead to delay in procurement of key electronic
inputs. This may delay order execution for EMS providers like Dixon
Technologies.
Margin risk amid volatility in input prices
The company is largely dependent on import for key components (~55% of
total COGS is imported) for its products (for example open cell panels make
up for ~60% of the cost of manufacturing LED TV sets, which is fully
imported. While the company works with complete pass through
mechanism of cost to its customers, we believe a delay in passing on of raw
material prices amid high volatility scenario may dent margins.

ICICI Securities | Retail Research 15
ICICI Direct Research
Stock Tales | Dixon Technologies (India)
Financial Summary (consolidated)
Exhibit 24: Profit & Loss Statement
(Year-end March) FY20 FY21E FY22E FY23E
Revenue 4,400.1 6,268.2 11,843.8 16,539.2
Growth (%) 47.4 42.5 88.9 39.6
Raw material expense 3,913.3 5,547.5 10,697.5 14,858.9
Employee expenses 118.0 126.5 204.3 284.5
Other expenses 198.9 226.7 387.9 581.3
Total Operating Exp 4,177.1 5,962.9 11,289.7 15,724.8
EBITDA 223.1 305.3 554.1 814.5
Growth (%) 65.4 36.8 81.5 47.0
Depreciation 36.5 40.7 47.4 67.8
Interest 35.0 28.7 19.3 17.8
Other Income 5.2 0.7 3.6 5.0
PBT 156.8 236.5 491.0 733.9
Total Tax 36.3 60.4 123.3 184.3
PAT 120.5 176.2 367.6 549.5
Source: Company, ICICI Direct Research
Exhibit 25: Cash Flow Statement
(Year-end March) FY20 FY21E FY22E FY23E
Profit after Tax 120.5 173.1 367.6 549.5
Add: Depreciation 36.5 42.6 47.4 67.8
(Inc)/dec in Current Assets 27.3 -524.9 -1350.3 -1107.2
Inc/(dec) in CL and Provisions 7.0 430.4 1312.1 1071.2
Others 35.0 28.7 19.3 17.8
CF from operating activities 226.3 149.9 396.1 599.2
(Inc)/dec in Investments 7.6 0.0 -120.0 -170.0
(Inc)/dec in Fixed Assets -192.3 -150.0 -150.0 -150.0
Others 67.4 19.3 5.0 5.0
CF from investing activities -117.2 -130.7 -265.0 -315.0
Issue/(Buy back) of Equity 0.2 0.1 0.0 0.0
Inc/(dec) in loan funds -53.3 120.0 -20.0 -10.0
Dividend paid & dividend tax -8.3 -35.1 -70.3 -105.4
Others 15.7 -27.6 -19.3 -17.8
CF from financing activities -45.6 57.4 -109.5 -133.2
Net Cash flow 63.4 76.6 21.5 151.0
Opening Cash 36.7 100.1 176.8 198.3
Closing Cash 100.1 176.8 198.3 349.3
Source: Company, ICICI Direct Research
Exhibit 26: Balance Sheet
(Year-end March) FY20 FY21E FY22E FY23E
Liabilities
Equity Capital 11.6 11.7 11.7 11.7
Reserve and Surplus 529.8 668.9 966.2 1,410.3
Total Shareholders funds 541.3 680.6 977.9 1,422.1
Total Debt 82.8 202.8 182.8 172.8
Other non current liabilities 104.4 106.4 111.4 116.4
Total Liabilities 728.5 989.8 1,272.1 1,711.3
Assets
Gross Block 488.4 638.4 788.4 938.4
Less: Acc Depreciation 82.5 125.1 172.5 240.3
Total Fixed Assets 415.5 522.8 625.5 707.7
Investments 0.0 0.0 120.0 290.0
Inventory 497.8 807.1 1,395.3 1,993.8
Debtors 515.1 738.4 1,460.2 1,903.1
Loans and Advances 0.0 0.0 0.0 0.0
Other CA 133.1 125.4 165.8 231.5
Cash 100.1 176.8 198.3 349.3
Total Current Assets 1,246.2 1,847.7 3,219.6 4,477.8
Creditors 939.1 1,356.7 2,595.9 3,625.0
Provisions 10.9 15.7 64.9 87.0
Other CL 18.7 26.7 50.4 70.4
Total Current Liabilities 968.7 1,399.1 2,711.2 3,782.5
Net current assets 277.5 448.6 508.4 695.3
Other non current assets 35.6 18.3 18.3 18.3
Total Assets 728.5 989.8 1,272.1 1,711.2
Source: Company, ICICI Direct Research
Exhibit 27: Key Ratios
(Year-end March) FY20 FY21E FY22E FY23E
Per share data (|)
EPS 20.6 29.6 62.8 93.9
Cash EPS 26.8 36.9 70.9 105.4
BV 92.5 116.2 167.0 242.9
DPS 1.4 6.0 12.0 18.0
Operating Ratios (%)
EBITDA Margin 5.1 4.8 4.7 4.9
PAT Margin 2.7 2.8 3.1 3.3
Asset Turnover 9.0 9.8 15.0 17.6
Inventory Days 41.3 47.0 43.0 44.0
Debtor Days 42.7 43.0 45.0 42.0
Creditor Days 77.9 79.0 80.0 80.0
Return Ratios (%)
RoE 22.3 25.4 37.6 38.6
RoCE 26.3 26.3 40.1 43.9
RoIC 31.0 32.0 51.9 67.0
Valuation Ratios (x)
P/E 176.1 122.6 57.7 38.6
EV / EBITDA 95.1 70.2 38.1 25.5
EV / Net Sales 4.8 3.4 1.8 1.3
Market Cap / Sales 4.8 3.4 1.8 1.3
Price to Book Value 39.2 31.2 21.7 14.9
Solvency Ratios
Debt / Equity 0.2 0.3 0.2 0.1
Current Ratio 1.2 1.2 1.1 1.1
Quick Ratio 0.7 0.6 0.6 0.6
Source: Company, ICICI Direct Research

ICICI Securities | Retail Research 16
ICICI Direct Research
Stock Tales | Dixon Technologies (India)
RATING RATIONALE
ICICI Direct endeavors to provide objective opinions and recommendations. ICICI Direct assigns ratings to its
stocks according to their notional target price vs. current market price and then categorizes them as Buy, Hold,
Reduce and Sell. The performance horizon is two years unless specified and the notional target price is defined
as the analysts' valuation for a stock
Buy: >15%
Hold: -5% to 15%;
Reduce: -15% to -5%;
Sell: <-15%
Pankaj Pandey Head – Research [email protected]
ICICI Direct Research Desk,
ICICI Securities Limited,
1st Floor, Akruti Trade Centre,
Road No 7, MIDC,
Andheri (East)
Mumbai – 400 093

ICICI Securities | Retail Research 17
ICICI Direct Research
Stock Tales | Dixon Technologies (India)
ANALYST CERTIFICATION
I/We, Sanjay Manyal;, MBA (Finance), Hitesh Taunk MBA(Finance), Research Analysts, authors and the names subscribed to this report, hereby certify that all of the views expressed in this research report accurately reflect our
views about the subject issuer(s) or securities. We also certify that no part of our compensation was, is, or will be directly or indirectly related to the specific recommendation(s) or view(s) in this report. It is also confirmed that above
mentioned Analysts of this report have not received any compensation from the companies mentioned in the report in the preceding twelve months and do not serve as an officer, director or employee of the companies mentioned in
the report.
Terms & conditions and other disclosures:
ICICI Securities Limited (ICICI Securities) is a full-service, integrated investment banking and is, inter alia, engaged in the business of stock brokering and distribution of financial products.
ICICI Securities is Sebi registered stock broker, merchant banker, investment adviser, portfolio manager and Research Analyst. ICICI Securities is registered with Insurance Regulatory Development Authority of India Limited (IRDAI)
as a composite corporate agent and with PFRDA as a Point of Presence. ICICI Securities Limited Research Analyst SEBI Registration Number – INH000000990. ICICI Securities Limited SEBI Registration is INZ000183631 for stock
broker. ICICI Securities is a subsidiary of ICICI Bank which is India’s largest private sector bank and has its various subsidiaries engaged in businesses of housing finance, asset management, life insurance, general insurance, venture
capital fund management, etc. (“associates”), the details in respect of which are available on www.icicibank.com.
ICICI Securities is one of the leading merchant bankers/ underwriters of securities and participate in virtually all securities trading markets in India. We and our associates might have investment banking and other business relationship
with a significant percentage of companies covered by our Investment Research Department. ICICI Securities and its analysts, persons reporting to analysts and their relatives are generally prohibited from maintaining a financial
interest in the securities or derivatives of any companies that the analysts cover.
Recommendation in reports based on technical and derivative analysis centre on studying charts of a stock's price movement, outstanding positions, trading volume etc as opposed to focusing on a company's fundamentals and, as
such, may not match with the recommendation in fundamental reports. Investors may visit icicidirect.com to view the Fundamental and Technical Research Reports.
Our proprietary trading and investment businesses may make investment decisions that are inconsistent with the recommendations expressed herein.
ICICI Securities Limited has two independent equity research groups: Institutional Research and Retail Research. This report has been prepared by the Retail Research. The views and opinions expressed in this document may or may
not match or may be contrary with the views, estimates, rating, and target price of the Institutional Research.
The information and opinions in this report have been prepared by ICICI Securities and are subject to change without any notice. The report and information contained herein is strictly confidential and meant solely for the selected
recipient and may not be altered in any way, transmitted to, copied or distributed, in part or in whole, to any other person or to the media or reproduced in any form, without prior written consent of ICICI Securities. While we would
endeavour to update the information herein on a reasonable basis, ICICI Securities is under no obligation to update or keep the information current. Also, there may be regulatory, compliance or other reasons that may prevent ICICI
Securities from doing so. Non-rated securities indicate that rating on a particular security has been suspended temporarily and such suspension is in compliance with applicable regulations and/or ICICI Securities policies, in
circumstances where ICICI Securities might be acting in an advisory capacity to this company, or in certain other circumstances.
This report is based on information obtained from public sources and sources believed to be reliable, but no independent verification has been made nor is its accuracy or completeness guaranteed. This report and information herein
is solely for informational purpose and shall not be used or considered as an offer document or solicitation of offer to buy or sell or subscribe for securities or other financial instruments. Though disseminated to all the customers
simultaneously, not all customers may receive this report at the same time. ICICI Securities will not treat recipients as customers by virtue of their receiving this report. Nothing in this report constitutes investment, legal, accounting
and tax advice or a representation that any investment or strategy is suitable or appropriate to your specific circumstances. The securities discussed and opinions expressed in this report may not be suitable for all investors, who
must make their own investment decisions, based on their own investment objectives, financial positions and needs of specific recipient. This may not be taken in substitution for the exercise of independent judgment by any recipient.
The recipient should independently evaluate the investment risks. The value and return on investment may vary because of changes in interest rates, foreign exchange rates or any other reason. ICICI Securities accepts no liabilities
whatsoever for any loss or damage of any kind arising out of the use of this report. Past performance is not necessarily a guide to future performance. Investors are advised to see Risk Disclosure Document to understand the risks
associated before investing in the securities markets. Actual results may differ materially from those set forth in projections. Forward-looking statements are not predictions and may be subject to change without notice.
ICICI Securities or its associates might have managed or co-managed public offering of securities for the subject company or might have been mandated by the subject company for any other assignment in the past twelve months.
ICICI Securities or its associates might have received any compensation from the companies mentioned in the report during the period preceding twelve months from the date of this report for services in respect of managing or co-
managing public offerings, corporate finance, investment banking or merchant banking, brokerage services or other advisory service in a merger or specific transaction.
ICICI Securities encourages independence in research report preparation and strives to minimize conflict in preparation of research report. ICICI Securities or its associates or its analysts did not receive any compensation or other
benefits from the companies mentioned in the report or third party in connection with preparation of the research report. Accordingly, neither ICICI Securities nor Research Analysts and their relatives have any material conflict of
interest at the time of publication of this report.
Compensation of our Research Analysts is not based on any specific merchant banking, investment banking or brokerage service transactions.
ICICI Securities or its subsidiaries collectively or Research Analysts or their relatives do not own 1% or more of the equity securities of the Company mentioned in the report as of the last day of the month preceding the publication of
the research report.
Since associates of ICICI Securities and ICICI Securities as a entity are engaged in various financial service businesses, they might have financial interests or beneficial ownership in various companies including the subject
company/companies mentioned in this report.
ICICI Securities may have issued other reports that are inconsistent with and reach different conclusion from the information presented in this report.
Neither the Research Analysts nor ICICI Securities have been engaged in market making activity for the companies mentioned in the report.
We submit that no material disciplinary action has been taken on ICICI Securities by any Regulatory Authority impacting Equity Research Analysis activities.
This report is not directed or intended for distribution to, or use by, any person or entity who is a citizen or resident of or located in any locality, state, country or other jurisdiction, where such distribution, publication, availability or
use would be contrary to law, regulation or which would subject ICICI Securities and affiliates to any registration or licensing requirement within such jurisdiction. The securities described herein may or may not be eligible for sale in
all jurisdictions or to certain category of investors. Persons in whose possession this document may come are required to inform themselves of and to observe such restriction