march 2020 - alchemy capital
TRANSCRIPT

M a r c h 2 0 2 0
1

EQUITY OUTLOOK
2
Markets headed for a tough period The spread of the Corona virus, and its second-order impact on both India and the world, is a new and significant headwind for the market. A sharp slowdown in discretionary consumption could hurt near-term earnings, even for high-quality companies. The resultant valuation compression would leave the market very vulnerable. We remain cautious in our deployment – while we continue to focus on quality growth stocks, we are now trying to scope out near term risk and adjusting our entry accordingly. The direct impact of the corona virus is still to be fully assessed. The relative ease of transmission has raised legitimate worries about the ability of authorities to contain the spread, best intentions notwithstanding. The medical outcomes are, therefore, uncertain but there is a possibility of the virus spreading quickly within India. The economic outcomes could be severe, at least in the short term. The countermeasures to contain the virus are likely to slow down travel, entertainment and discretionary purchases as consumer confidence starts to erode. The exact dimension of this drop in growth is difficult to gauge at this stage; it will depend on whether the response involves extreme measures like temporarily shutting establishments. In any case, we are bracing for a short-term consumption slowdown; the extent and the length of this slowdown are hard to predict. Supply-chain disruptions are likely to exacerbate the problems. There is a mitigant in the sharp fall in crude prices – Brent crude fell 42% since February 20 and are down 50% YTD. Over the medium term, this is positive for India on multiple fronts – lower current account deficit and inflation, better domestic liquidity, and lower RM prices for many consumer companies. It is not an unmixed blessing, however, as this could have collateral damage in the short term. The areas of risk include expatriate remittances from the Gulf countries; export earnings from oil rich countries in the Middle-East, Central Asia and Africa; a possible contagion to other commodities like metals, in which India has substantial domestic manufacturing exposure; and the general growth risks that come from a global recession, of which the oil price correction is an integral part. In the short-term, we will have to be aware of these risks as well. Our view on the economic outlook is now changed. While the Indian economy was showing some signs of bottoming out, the continued escalation in the number of COVID-19 cases outside China is likely to prolong the domestic recovery process by at least a couple of quarters. The drag on domestic growth from supply chain disruptions and the slowdown in global growth is more likely to be felt in 1QFY21 rather than 4Q if the current situation persists.

EQUITY OUTLOOK
3
The recent downgrade of FY19 GDP growth to 6.1% from 6.8% shows that the economy had slowed down much earlier than was previously believed. Moreover, the government clearly lacks the resources to revive the economy quickly. India’s tax revenues are pro-cyclical, hence, a consumption slowdown limits the government’s ability to increase spending to combat the private expenditure deceleration. We do expect some counter-balancing monetary policy measures from the RBI, but that is unlikely to have an immediate impact until the medical threat recedes from the popular psyche. Further, monetary transmission tends to work with long lags – of the 135bps of cumulative rate cut delivered by the RBI last year, only 45bps have been passed on by the banks so far. All the above suggest that there exist significant downside risks to overall earnings of the market. The immediate worry is that of a combination of earnings risks and multiple compression. A sharp consumption slowdown is a clear and present danger to the earnings outlook, even for the high quality companies and market leaders. If this plays out over the next 1-2 quarters, we are faced with a temporary multiple contraction in these companies. This would have a significant impact on the broader market indices, which have been held up by a narrow range of high-quality companies. Therefore, while we remain focused on high-quality names as these are better off in a downturn, we will remain careful on our entry prices for these stocks. The broader market recovery is difficult to predict at this stage. Of course, we have seen a sharp recovery in previous episodes like SARS and H1N1, but that is no assurance that it will play out in the same manner this time. It is too early to scope the medical risks and assert, with any certainty, that this is a temporary slowdown. We are bracing ourselves for a weak market, but hoping that the virus impact is not extreme and the economy recovers quickly. Despite the risks mentioned above, we continue to focus on quality stocks for our portfolio. Players with strong execution capabilities, coupled with fortress balance sheets, will gain share and lead the recovery. This is a recurring theme across multiple segments like financial services, retail and FMCG. The recent market correction thus provides an opportunity to add quality names to our portfolio, albeit with strict price discipline and scoping of near-term risk. Seshadri Sen Head of Research Alchemy Capital Management Pvt. Ltd
Source : Alchemy Research Bloomberg

Q3FY20 Performance of Portfolio Companies
4
The following table summarizes the performance of portfolio companies in Q3FY20 :
Source-Alchemy Research
Stock Sales (Rs Mn) EBITDA (Rs Mn) PAT (Rs Mn)
Q3FY20 Q3FY19 % Chg Q3FY20 Q3FY19 % Chg Q3FY20 Q3FY19 % Chg
Asian Paints 54,203 52,630 3% 11,894 11,044 8% 7,797 6,473 20%
Avenue Supermarts 67,519 54,509 24% 5,931 4,533 31% 3,943 2,571 53%
Axis Bank 102,395 96,044 7% 17,570 16,809 5%
AIA Engineering 6,940 7,002 -1% 2,188 1,652 32% 1,561 1,290 21%
Bajaj Auto 76,397 74,358 3% 13,672 12,125 13% 12,616 11,019 14%
Bajaj Electricals 12,736 21,565 -41% 684 1,378 -50% 155 639 -76%
Bajaj Finserv 145,607 111,416 31% 11,256 8,505 32%
Bajaj Finance 45,369 31,992 42% 16,141 10,598 52%
Bandhan Bank 18,980 15,257 24% 7,310 4,279 71%
Berger Paints India 16,959 16,167 5% 2,963 2,502 18% 1,824 1,332 37%
Container Corporation of India 15,279 16,571 -8% 3,717 4,184 -11% 1,755 2,747 -36%
Delta Corp 2,051 2,052 0% 791 855 -8% 551 512 8%
Dynamatic Technologies 3,078 3,665 -16% 443 439 1% 121 83 46%
Godrej Consumer 27,781 27,240 2% 6,313 6,162 2% 4,496 4,176 8%
Garware Technical Fibres 2,358 2,222 6% 381 368 4% 290 247 17%
HDFC Bank 208,422 174,978 19% 74,165 55,859 33%
Hindustan Unilever 98,080 95,580 3% 24,450 20,460 20% 16,910 14,010 21%
ICICI Bank 131,546 107,581 22% 41,817 16,049 161%
Info Edge India 3,205 2,811 14% 1,059 833 27% 880 743 18%
L&T Technology Services 14,229 13,169 8% 2,863 2,417 18% 2,041 1,856 10%
Mahindra and Mahindra 123,453 130,704 -6% 16,496 15,172 9% 8,464 11,328 -25%
Multi Commodity Exchange 893 769 16% 392 209 87% 553 418 32%
Nestle India 31,493 28,788 9% 6,730 6,608 2% 4,696 3,860 22%
Pidilite Industries 19,266 18,483 4% 4,632 3,368 38% 3,445 2,181 58%
Quess Corp 29,500 21,722 36% 1,794 1,183 52% 749 650 15%
Ramco Cements 12,746 12,074 6% 1,995 2,110 -5% 948 1,011 -6%
Sundaram Fasteners 6,928 10,188 -32% 1,161 1,932 -40% 1,031 1,115 -8%
Syngene International 5,191 4,671 11% 1,433 1,402 2% 918 870 6%
Tata Consultancy Services 398,540 373,380 7% 108,710 100,830 8% 81,180 81,210 0%
Tata Elxsi 4,235 4,070 4% 942 1,033 -9% 754 660 14%
TCNS Clothing 3,290 3,002 10% 679 507 34% 550 371 48%
Thermax 14,101 14,366 -2% 1,132 1,073 5% 850 750 13%
Thomas Cook 17,270 15,556 11% 493 420 17% 65 92 -30%
Titan Company 64,546 58,398 11% 7,584 5,912 28% 4,746 4,132 15%
Trent 8,697 6,565 32% 1,735 726 139% 557 403 38%
United Breweries 14,548 14,512 0% 2,215 2,478 -11% 1,070 1,092 -2%
United Spirits 25,825 24,969 3% 4,240 3,582 18% 2,588 2,126 22%
Varun Beverages 12,203 7,856 55% 1,157 478 142% -593 -715 17%
V-Mart Retail 5,622 4,658 21% 1,168 733 59% 909 417 118%
3M India 7,454 7,916 -6% 979 1,675 -42% 719 1,102 -35%

Investment Objective*: The objective is to generate long-term returns by investing in equities and equity related instruments across market capitalizations, but with a mid-cap bias.
Fund Manager: A Chartered Accountant by profession, Mr. Amit Nadekar has worked across equity research, corporate strategy, taxation and audit over the last one and a half decades. He started his career on the sell side, tracking the US banking & financial sector; later moving on to the corporate side as a part of the Corporate Strategy team at Raymond. He has been a part of the Alchemy investment team since 2005.
Strategy* at a glance: Category: Equity Diversified Fund Style: Multi-cap Growth Type: Open Ended Launch Date: 8th May, 2002 Benchmark: S&P BSE 500 Min investment: Rs. 50 lacs
PMS PRODUCT PERFORMANCE
Alchemy High Growth (AHG)
* The product’s objective and strategy are merely a target and there is no assurance that it would be achieved. * Please read the Disclosure Document/ Client Agreement for complete details
5
Portfolio Action: During the month of Feb, The portfolio exited from Mahindra & Mahindra and added Kotak Mahindra Bank. Exit – Mahindra & Mahindra (M&M) • We had invested in M&M with a view that the company’s auto division would recover its market share through
new product launches while the tractor division would see a revival in volume growth led by decent monsoons, healthy sowing season and improvement in rural incomes.
• While the long term investment thesis has not changed – market share in auto segment has recovered from the lows, and tractor volume growth has improved in recent months – the recent corona virus outbreak has led to challenges to its production schedule as it relies on Chinese imports for some crucial auto components.
• Secondly, the outbreak has also caused a slowdown in demand as footfalls to showrooms and conversion rates have come down and this makes it difficult to ascertain near term growth in business.
• Thirdly and finally, the company owns Ssangyong Motors of South Korea which will be heavily impacted by the
virus outbreak. The company will need financial assistance to turn around and M&M will be required to infuse capital into the company to support the same. This will hurt the company’s financial profile in the form of lower return ratios.
• Hence, in view of the weak prognosis in the near term and deterioration in financial profile, as a risk mitigation, we have decided to exit the stock.

PMS PRODUCT PERFORMANCE
Alchemy High Growth (AHG)
* The product’s objective and strategy are merely a target and there is no assurance that it would be achieved. * Please read the Disclosure Document/ Client Agreement for complete details
6
Portfolio Action: Entry – Kotak Mahindra Bank (KMB) • KMB is one of the highest-quality banks in India with a strong track record of pristine asset quality. While their
approach is ultra-conservative, it has paid off in the past and is the reason why their asset quality remains so strong
• It has a diversified business across general banking as well as capital market verticals. The group has a good platform to cross-sell its products, given its presence in the financial spectrum
• It has built a strong liabilities franchise after the ING acquisition and now has a high CASA ratio of 50%+. This is impressive, even if it has been built with a higher cost. The improvement in the funding base has set the stage for sustained growth over the next few years
• It is a very profitable business with high ROAs (2%) that has been done with a focus on both yields and costs. RoE look optically subdued as the bank is over-capitalized, but again, in a stressed world, that is a strength and not a weakness
• Valuations are not cheap, but the bank commands a premium for asset quality that is likely to sustain. Overall, we view Kotak Mahindra Bank as a good low-risk, steady growth stock.

PMS PRODUCT PERFORMANCE
*Inception Date: 8-May-2002
Alchemy High Growth (AHG)
• Past performance is no assurance for future returns. • Returns presented are net of fees and expenses. • The above performance figures are aggregate of all clients; the investor’s actual portfolio may differ.
7
Returns shown in above graph are absolute returns.
Data as on 29-Feb-2020
Returns shown in above graph are CAGR .

PMS PRODUCT PERFORMANCE
Alchemy High Growth (AHG)
GICS SECTOR ALLOCATION (%) † MARKET CAP ALLOCATION *
RATIO ANALYSIS PERIODIC RETURNS #
Data as on 29-Feb -2020
^ Inception Date: 8-May-2002
* Market Cap as of Dec 31, 2019 from S&P BSE500 is considered which is Large cap->27279 Crs, Mid cap-2948 Crs to 27279 Crs, Small cap-<2948 Crs
Period Alchemy High
Growth Benchmark
S&P BSE 500
6 Months 3.4% 2.8%
1 Year 2.1% 3.0%
2 Years -3.5% -0.1%
3 Years 5.1% 6.3%
5 Years 7.5% 5.0%
7 Years 14.8% 10.7%
10 Years 13.6% 8.4%
Since Inception^ 22.2% 15.0%
Parameter Alchemy High
Growth (Since Inception)
Benchmark (Since
Inception)
Std. Dev. 18.7% 21.9%
Sharpe 0.8 0.4
Beta 0.8 1.0
#Returns less than 1yr: Absolute, greater than 1yr: CAGR #Past performance is no assurance for future returns. Returns presented are net of fees and expenses. #The above performance figures are aggregate of all clients; the investor’s actual portfolio may differ.
8 † Cash & cash equivalent :11% Source : Bloomberg

Investment Objective*: The objective is to generate long term returns by investing in equities and equity related instruments, across market capitalizations, with a mid cap bias.
Fund Manager: Mr. Hiren Ved joined Alchemy in 1999, spearheading the firm’s asset management business. With over two decades of experience in equity markets, he has carved a niche in “Bottom-up” research and stock picking with extensive coverage of companies across various sectors. A certified cost accountant, he has over 25 years experience in the Indian equity markets. He is a Co-Founder and Chief Investment Officer at Alchemy.
Strategy *at a glance: Category: Equity Concentrated Fund Style: Multi-cap Growth Type: Open Ended Launch Date: 19th Dec 2008 Benchmark: S&P BSE 500 Min investment: Rs. 3 Crores
PMS PRODUCT PERFORMANCE
Alchemy High Growth Select Stock (AHGSS)
* The product’s objective and strategy are merely a target and there are no assurance that it would be achieved. * Please read the Disclosure Document/ Client Agreement for complete details of the terms of the strategy.
9
Portfolio Action: During the month of Feb we added Kotak Mahindra Bank (KMB) in to the portfolio. • KMB is one of the highest-quality banks in India with a strong track record of pristine asset quality. While their
approach is ultra-conservative, it has paid off in the past and is the reason why their asset quality remains so strong
• It has a diversified business across general banking as well as capital market verticals. The group has a good platform to cross-sell its products, given its presence in the financial spectrum
• It has built a strong liabilities franchise after the ING acquisition and now has a high CASA ratio of 50%+. This is impressive, even if it has been built with a higher cost. The improvement in the funding base has set the stage for sustained growth over the next few years
• It is a very profitable business with high ROAs (2%) that has been done with a focus on both yields and costs. RoE look optically subdued as the bank is over-capitalized, but again, in a stressed world, that is a strength and not a weakness
• Valuations are not cheap, but the bank commands a premium for asset quality that is likely to sustain. Overall, we view Kotak Mahindra Bank as a good low-risk, steady growth stock.

PMS PRODUCT PERFORMANCE
* Inception Date : 19-Dec-2008
Alchemy High Growth Select Stock (AHGSS)
10
Data as on 29-Feb-2020
Returns shown in above graph are CAGR .
Returns shown in above graph are absolute returns.
• Past performance is no assurance for future returns. • Returns presented are net of fees and expenses. • The above performance figures are aggregate of all clients; the investor’s actual portfolio may differ.

PMS PRODUCT PERFORMANCE
Parameter Alchemy High Growth
Select Stock (Since Inception)
Benchmark (Since
Inception)
Std. Dev. 15.4% 17.7%
Sharpe 0.9 0.4
Beta 0.8 1.0
Alchemy High Growth Select Stock (AHGSS)
GICS SECTOR ALLOCATION (%) †
MARKET CAP ALLOCATION*
RATIO ANALYSIS PERIODIC RETURNS #
Data as on 29-Feb-2020
^ Inception Date : 19-Dec-2008
Period Alchemy High Growth Select
Stock
Benchmark S&P BSE 500
6 Months 6.6% 2.8%
1 Year 7.5% 3.0%
2 Years 3.1% -0.1%
3 Years 10.1% 6.3%
5 Years 10.7% 5.0%
7 Years 19.4% 10.7%
10 Years 18.8% 8.4%
Since Inception^ 20.8% 13.0%
11
* Market Cap as of Dec 31, 2019 from S&P BSE500 is considered which is Large cap->27279 Crs, Mid cap-2948 Crs to 27279 Crs, Small cap-<2948 Crs
#Returns less than 1yr: Absolute, greater than 1yr: CAGR #Past performance is no assurance for future returns. Returns presented are net of fees and expenses. #The above performance figures are aggregate of all clients; the investor’s actual portfolio may differ.
† Cash & cash equivalent :8% Source : Bloomberg
Investment Objective:* The objective is to generate long-term returns by investing in large-cap equities .
Fund Manager: A Chartered Accountant by profession, Mr. Amit Nadekar has worked across equity research, corporate strategy, taxation and audit over the last one and a half decades. He started his career on the sell side, tracking the US banking & financial sector; later moving on to the corporate side as a part of the Corporate Strategy team at Raymond. He has been a part of the Alchemy investment team since 2005.
Strategy* at a glance Category: Equity Diversified Fund Style Large-cap Growth Type: Open Ended Launch Date: 21st Dec, 2006. Benchmark: Nifty 50 Min investment: Rs. 50 lacs
PMS PRODUCT PERFORMANCE
Alchemy Leaders
* The product’s objective and strategy are merely a target and there are no assurance that it would be achieved. * Please read the Disclosure Document/ Client Agreement for complete details of the terms of the strategy.
12
Portfolio Action: There was no major portfolio action in the month of Feb 2020
PMS PRODUCT PERFORMANCE
Alchemy Leaders
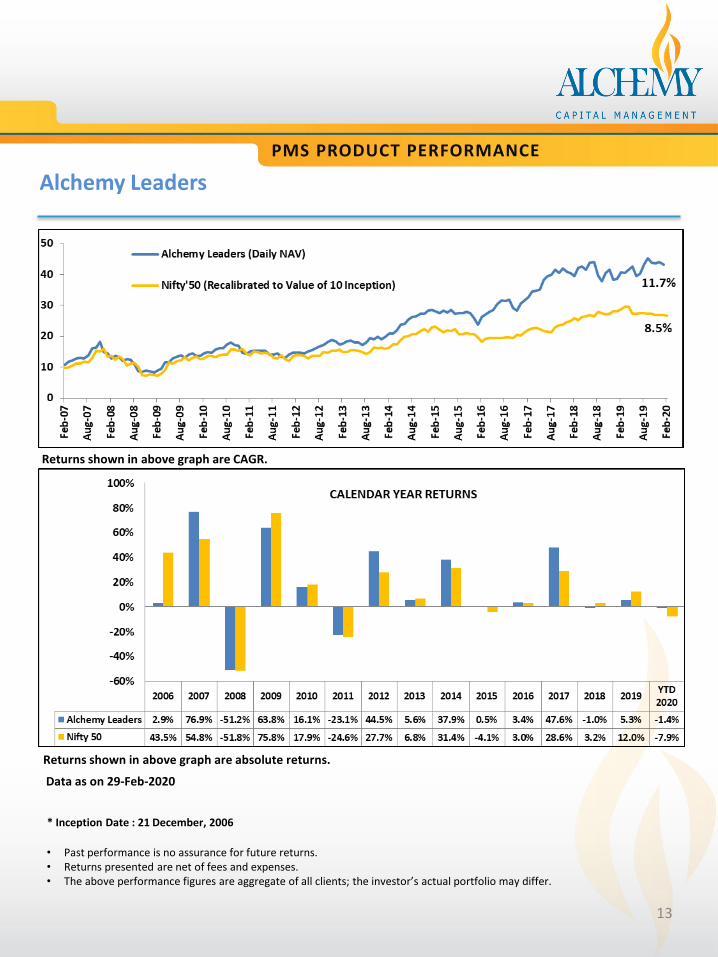
* Inception Date : 21 December, 2006
13
Data as on 29-Feb-2020
Returns shown in above graph are absolute returns.
Returns shown in above graph are CAGR.
• Past performance is no assurance for future returns. • Returns presented are net of fees and expenses. • The above performance figures are aggregate of all clients; the investor’s actual portfolio may differ.
PMS PRODUCT PERFORMANCE
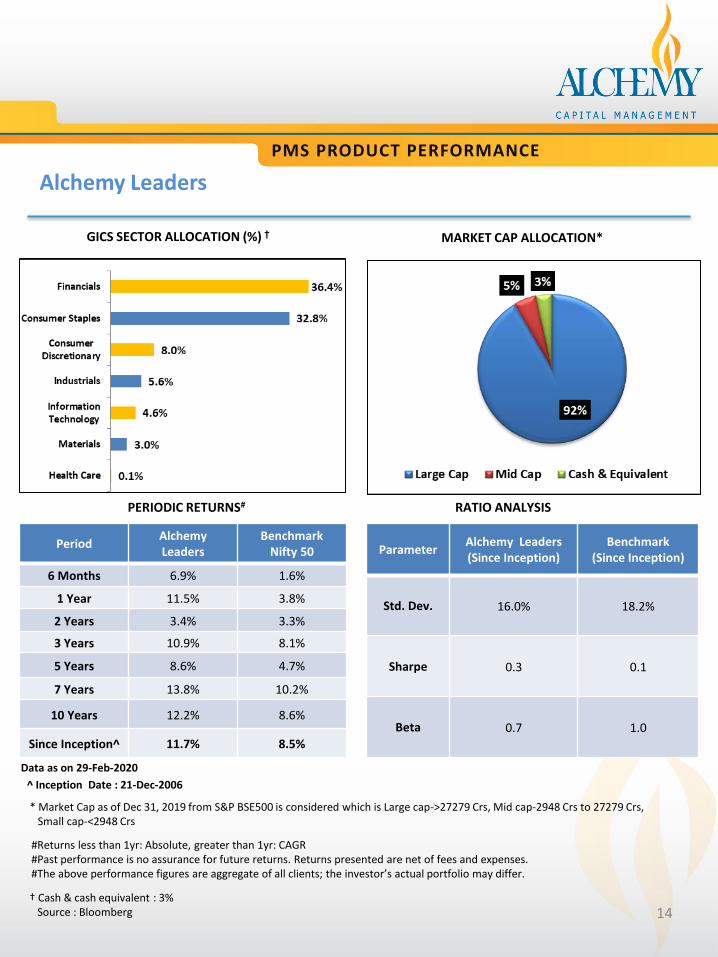
Parameter Alchemy Leaders (Since Inception)
Benchmark (Since Inception)
Std. Dev. 16.0% 18.2%
Sharpe 0.3 0.1
Beta 0.7 1.0
GICS SECTOR ALLOCATION (%) † MARKET CAP ALLOCATION*
RATIO ANALYSIS PERIODIC RETURNS#
Period Alchemy Leaders
Benchmark Nifty 50
6 Months 6.9% 1.6%
1 Year 11.5% 3.8%
2 Years 3.4% 3.3%
3 Years 10.9% 8.1%
5 Years 8.6% 4.7%
7 Years 13.8% 10.2%
10 Years 12.2% 8.6%
Since Inception^ 11.7% 8.5%
Data as on 29-Feb-2020
Alchemy Leaders
14
^ Inception Date : 21-Dec-2006
* Market Cap as of Dec 31, 2019 from S&P BSE500 is considered which is Large cap->27279 Crs, Mid cap-2948 Crs to 27279 Crs, Small cap-<2948 Crs
#Returns less than 1yr: Absolute, greater than 1yr: CAGR #Past performance is no assurance for future returns. Returns presented are net of fees and expenses. #The above performance figures are aggregate of all clients; the investor’s actual portfolio may differ.
† Cash & cash equivalent : 3% Source : Bloomberg

Investment Objective:* The objective is to generate long-term risk adjusted returns.
Fund Manager: With over 19 years of equity market experience, Mr. Vikas Kumar has expansive experience that includes equity analysis, private client fund management and strategy building on a sell-side institutional desk. He specializes in creating data-based quantitative algorithms & mathematically objective implementation strategies. His unique research paper on investment methodology, A Quantitative System for Reflexive Financial Markets, earned him a U.S. copyright. He pursued a BA in Math from Delhi University, qualified for Indian Institute of Technology Joint Entrance Examination (IIT-JEE), was a state-level National Talent Search Examination (NTSE) merit scholar and one of the national CBSE toppers. Prior to Alchemy, he worked with Dalal & Broacha Stock Broking and collaborated at Reliance Capital. He was also nominated as one of the best Quant Analysts in Asia by Institutional Investor magazine in 2009.
Strategy* at a glance Category: Equity Diversified Type: Open Ended Launch Date: 03rd September 2019. Benchmark: S&P BSE 200 Min investment: Rs. 50 lacs
PMS PRODUCT PERFORMANCE
Alchemy Ascent
* The product’s objective and strategy are merely a target and there are no assurance that it would be achieved. * Please read the Disclosure Document/ Client Agreement for complete details of the terms of the strategy.
Portfolio Action : Following actions were taken during the month of Feb 2020 Buys
• Affle India: Affle, with unique business line is not only a growth but a quality stock.
• MAS Financial Services : Quality Company at reasonable valuation.
• HCL Technology : Quality Stock with good Margins.
• Century Textiles and Industries : Business growth stock with quality & value.
Sells
• Colgate Palmolive : Stock breached its daily rank threshold.
• Procter & Gamble Hygiene & Healthcare : Fall in Rank of Procter & Gamble Hygiene in its Universe, below the threshold.
There are broadly four triggers for us to take a sell call : • Fall in Rank of the stock in its Universe, below a threshold • Fall in Fundamental parameters of the stock below a threshold • Draw-Down below a threshold • CAGR non-performer
15

DISCLAIMER
General Risk factors All investment products attract various kinds of risks. Please read the relevant Disclosure Document / Client Agreement carefully before investing. General Disclaimers The information and opinions contained in this report/ presentation have been obtained from sources believed to be reliable, but no representation or warranty, express or implied, is made that such information is accurate or complete. Information and opinions contained in the report/ presentation are disseminated for the information of authorized recipients only, and are not to be relied upon as advisory or authoritative or taken in substitution for the exercise of due diligence and judgement by any recipient. The information and opinions are not, and should not be construed as, an offer or solicitation to buy or sell any securities or make any investments. Nothing contained herein, including past performance, shall constitute any representation or warranty as to future performance. The client is solely responsible for consulting his/her/its own independent advisors as to the legal, tax, accounting and related matters concerning investments and nothing in this document or in any communication shall constitutes such advice. The client is expected to understand the risk factors associated with investment & act on the information solely on his/her/its own risk. As a condition for providing this information, the client agrees that Alchemy Capital Management Pvt. Ltd., its Group or affiliates makes no representation and shall have no liability in any way arising to them or any other entity for any loss or damage, direct or indirect, arising from the use of this information. This document and its contents are proprietary information of Alchemy Capital Management Pvt. Ltd and may not be reproduced or otherwise disseminated in whole or in part without the written consent.
Alchemy Capital Management Pvt. Ltd., B-4, Amerchand Mansion, 16 Madame Cama Road, Mumbai 400 001.
Ph: +91-22-66171700 CIN- U67120MH1999PTC119811, Email ID: [email protected]
16