march 2018 - idfcmf.com · despite positive fii flows in march, fiis on a whole continue to be...
TRANSCRIPT
FACTSHEETMarch 2018
2
Index
Commentary - Equity Outlook 1
Commentary - Debt Outlook 5
IDFC Classic Equity Fund 6
IDFC Sterling Equity Fund 7
IDFC Premier Equity Fund 8
IDFC Focused Equity Fund 9
IDFC Equity Fund 10
IDFC Nifty Fund 11
IDFC Infrastructure Fund 12
IDFC Tax Advantage (ELSS) Fund 13
IDFC Arbitrage Fund 14
IDFC Arbitrage Plus Fund 15
IDFC Sensex Exchange Traded Fund 16
IDFC Nifty Exchange Traded Fund 17
IDFC Dynamic Equity Fund 18
IDFC Balanced Fund 19
IDFC Monthly Income Plan 20
IDFC Asset Allocation Fund of Funds 21
IDFC All Seasons Bond Fund 22
IDFC Cash Fund 23
IDFC Ultra Short Term Fund 24
IDFC Money Manager Fund – Treasury Plan 25
IDFC Money Manager Fund – Investment Plan 26
IDFC Banking & PSU Debt Fund 27
IDFC Super Saver Income Fund – Short Term 28
IDFC Corporate Bond Fund 29
IDFC Credit Opportunities Fund 30
IDFC Super Saver Income Fund – Medium Term 31
IDFC Super Saver Income Fund – Investment Plan 32
IDFC Dynamic Bond Fund 33
IDFC Government Securities Fund – Short Term Plan 34
IDFC Government Securities Fund – Provident Fund Plan 34
IDFC Government Securities Fund – Investment Plan 35
Performance Table 37
SIP Performance 39
Dividend History 41
Fund Manager Details 42
Investment Objective 43
1
WHAT WENT BY
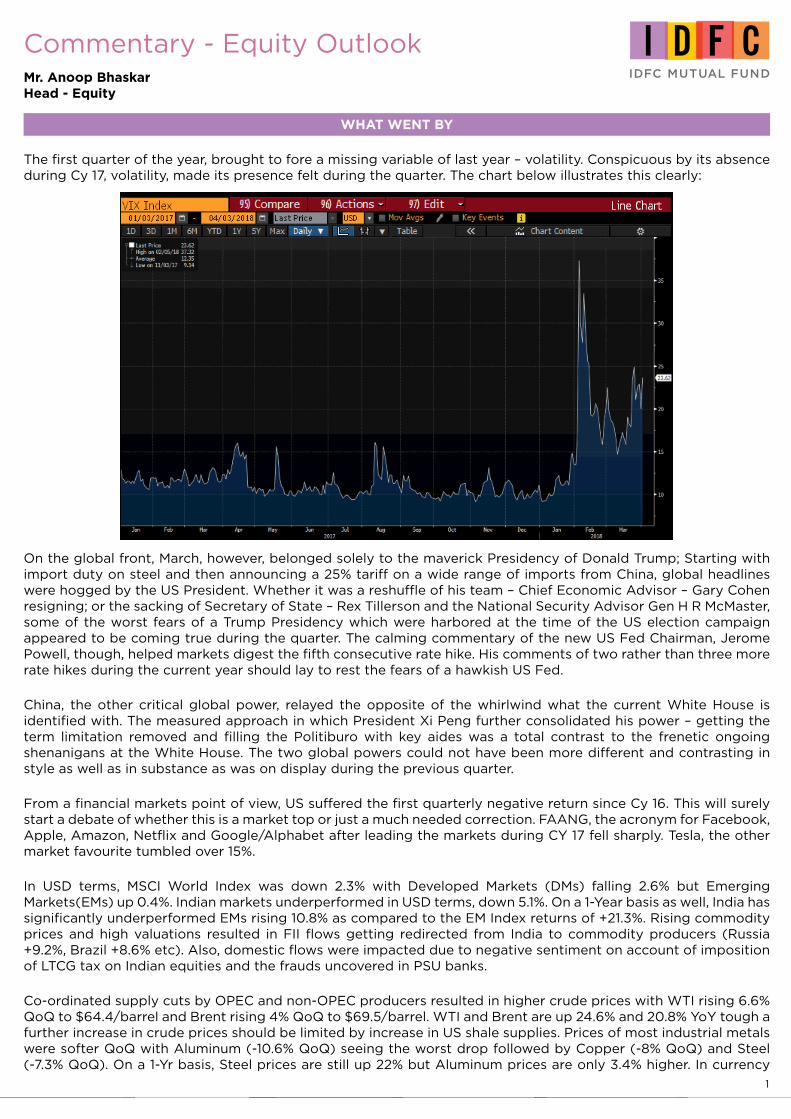
The first quarter of the year, brought to fore a missing variable of last year – volatility. Conspicuous by its absence during Cy 17, volatility, made its presence felt during the quarter. The chart below illustrates this clearly:
On the global front, March, however, belonged solely to the maverick Presidency of Donald Trump; Starting with import duty on steel and then announcing a 25% tariff on a wide range of imports from China, global headlines were hogged by the US President. Whether it was a reshuffle of his team – Chief Economic Advisor – Gary Cohen resigning; or the sacking of Secretary of State – Rex Tillerson and the National Security Advisor Gen H R McMaster, some of the worst fears of a Trump Presidency which were harbored at the time of the US election campaign appeared to be coming true during the quarter. The calming commentary of the new US Fed Chairman, Jerome Powell, though, helped markets digest the fifth consecutive rate hike. His comments of two rather than three more rate hikes during the current year should lay to rest the fears of a hawkish US Fed.
China, the other critical global power, relayed the opposite of the whirlwind what the current White House is identified with. The measured approach in which President Xi Peng further consolidated his power – getting the term limitation removed and filling the Politiburo with key aides was a total contrast to the frenetic ongoing shenanigans at the White House. The two global powers could not have been more different and contrasting in style as well as in substance as was on display during the previous quarter.
From a financial markets point of view, US suffered the first quarterly negative return since Cy 16. This will surely start a debate of whether this is a market top or just a much needed correction. FAANG, the acronym for Facebook, Apple, Amazon, Netflix and Google/Alphabet after leading the markets during CY 17 fell sharply. Tesla, the other market favourite tumbled over 15%.
In USD terms, MSCI World Index was down 2.3% with Developed Markets (DMs) falling 2.6% but Emerging Markets(EMs) up 0.4%. Indian markets underperformed in USD terms, down 5.1%. On a 1-Year basis as well, India has significantly underperformed EMs rising 10.8% as compared to the EM Index returns of +21.3%. Rising commodity prices and high valuations resulted in FII flows getting redirected from India to commodity producers (Russia +9.2%, Brazil +8.6% etc). Also, domestic flows were impacted due to negative sentiment on account of imposition of LTCG tax on Indian equities and the frauds uncovered in PSU banks.
Co-ordinated supply cuts by OPEC and non-OPEC producers resulted in higher crude prices with WTI rising 6.6% QoQ to $64.4/barrel and Brent rising 4% QoQ to $69.5/barrel. WTI and Brent are up 24.6% and 20.8% YoY tough a further increase in crude prices should be limited by increase in US shale supplies. Prices of most industrial metals were softer QoQ with Aluminum (-10.6% QoQ) seeing the worst drop followed by Copper (-8% QoQ) and Steel (-7.3% QoQ). On a 1-Yr basis, Steel prices are still up 22% but Aluminum prices are only 3.4% higher. In currency
Commentary - Equity OutlookMr. Anoop Bhaskar Head - Equity
2
markets, the Pound and Euro appreciated 4.1% and 2.5% respectively against the dollar with the Dollar Index falling 2.2%. The Rupee depreciated 2.0% for the quarter and is flat on a 1-Yr basis.
2018: A year of broad-based monetary tightening: In the US, the Fed appears steadfast in its desire to gradually normalize policy by raising interest rates and reducing its balance sheet size. New chair Jerome Powell represents much continuity with this approach, even though his recent, relatively candid, congressional testimony suggested that he may now expect to vote for 100bps of hikes this year. However, the tightening trend is not uniform among developed economy central banks. The ECB’s latest press conference and speeches of ECB officials at the ECB’s Watchers conference reinforced their cautious attitude to policy tightening and its continued emphasis on ‘confidence, patience and persistence’. Recent ECB communication has focused on the discrepancy between strong real data and subdued inflation, and associated uncertainties around estimates of potential growth.
Return of volatility, higher interest rates: After digesting various anti-consensus events through CY 2017 calmly, global markets were spooked in February on fears of higher than expected increase in interest rates. The 10 Year US yield rose 38 bps ending the quarter at 2.78%. The VIX Index also called “Fear Index”, after retreating through most of CY 17 roared back in February. VIX after hitting a low of 9.0 in CY 17 soared to above 37.45 at the start of Feb and ended March at 19.97. ETN (ETF Notes) for shorting the Vix Index lost roughly 94% of the value on Feb5th, reflecting the complacency regarding volatility during the past year.
Global growth robust, but losing momentum: Data over the last month have supported the idea that global growth may be peaking, and indeed led some analysts to see a near-term global growth downturn. In the US, Q1 forecasts have come down noticeably (to 1.8% from ~3% a month ago for the Atlanta Fed’s forecasts), with domestic factors (retail sales and housing) the main factors. In the Eurozone sentiment readings retraced somewhat, too, while industrial production in January was weak for the second consecutive month. Overall, global growth in Q4-17 and Q1-18 is now noticeably short of the pace in Q2-Q3 17, both in DMs and EMs. However, we think there is no major cause for concern yet. In the US, the downward revision of Q1 is partly offset by some upward revision for Q4 and employment growth remained strong. In the Eurozone, sentiment readings were running ahead of the ~2.5% growth pace previously and in China, the Jan-Feb activity data came in fairly strong, negating the lower PMI readings of previous months. Overall, global growth in Q1 still appears to run at around-trend (~3%QQ) pace, and we currently expect a pickup in Q2 in part because the effects of the US fiscal stimulus begin to materialize.
The domestic front: Unexpected by-election results started the chatter on political outcome going ahead of big ‘E’ next year, which is a departure from the political solidity of the last few years. Ironically, the BJP at last reached a simple majority in the Rajya Sabha. Markets will surely keep an eye on Karnataka elections which have been announced for May 12th with results on May 15th.
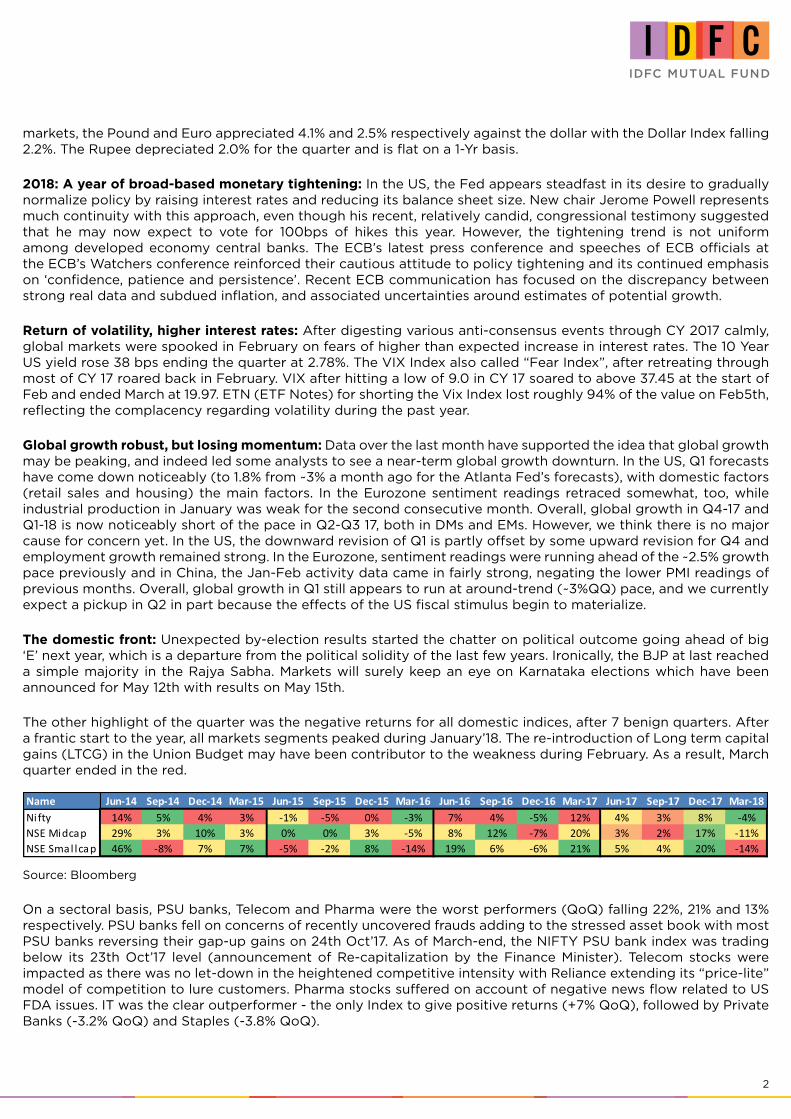
The other highlight of the quarter was the negative returns for all domestic indices, after 7 benign quarters. After a frantic start to the year, all markets segments peaked during January’18. The re-introduction of Long term capital gains (LTCG) in the Union Budget may have been contributor to the weakness during February. As a result, March quarter ended in the red.
Source: Bloomberg
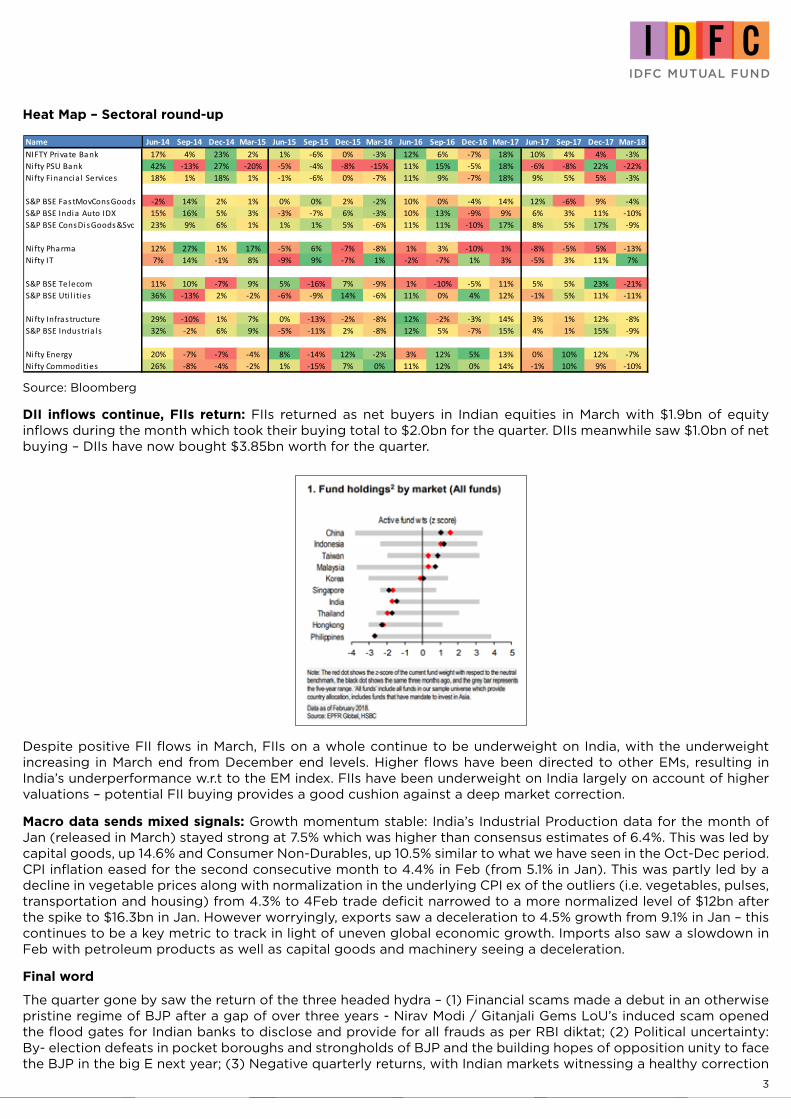
On a sectoral basis, PSU banks, Telecom and Pharma were the worst performers (QoQ) falling 22%, 21% and 13% respectively. PSU banks fell on concerns of recently uncovered frauds adding to the stressed asset book with most PSU banks reversing their gap-up gains on 24th Oct’17. As of March-end, the NIFTY PSU bank index was trading below its 23th Oct’17 level (announcement of Re-capitalization by the Finance Minister). Telecom stocks were impacted as there was no let-down in the heightened competitive intensity with Reliance extending its “price-lite” model of competition to lure customers. Pharma stocks suffered on account of negative news flow related to US FDA issues. IT was the clear outperformer - the only Index to give positive returns (+7% QoQ), followed by Private Banks (-3.2% QoQ) and Staples (-3.8% QoQ).
Name Jun-14 Sep-14 Dec-14 Mar-15 Jun-15 Sep-15 Dec-15 Mar-16 Jun-16 Sep-16 Dec-16 Mar-17 Jun-17 Sep-17 Dec-17 Mar-18Nifty 14% 5% 4% 3% -1% -5% 0% -3% 7% 4% -5% 12% 4% 3% 8% -4%NSE Midcap 29% 3% 10% 3% 0% 0% 3% -5% 8% 12% -7% 20% 3% 2% 17% -11%NSE Smal lcap 46% -8% 7% 7% -5% -2% 8% -14% 19% 6% -6% 21% 5% 4% 20% -14%
3
Heat Map – Sectoral round-up
Source: Bloomberg
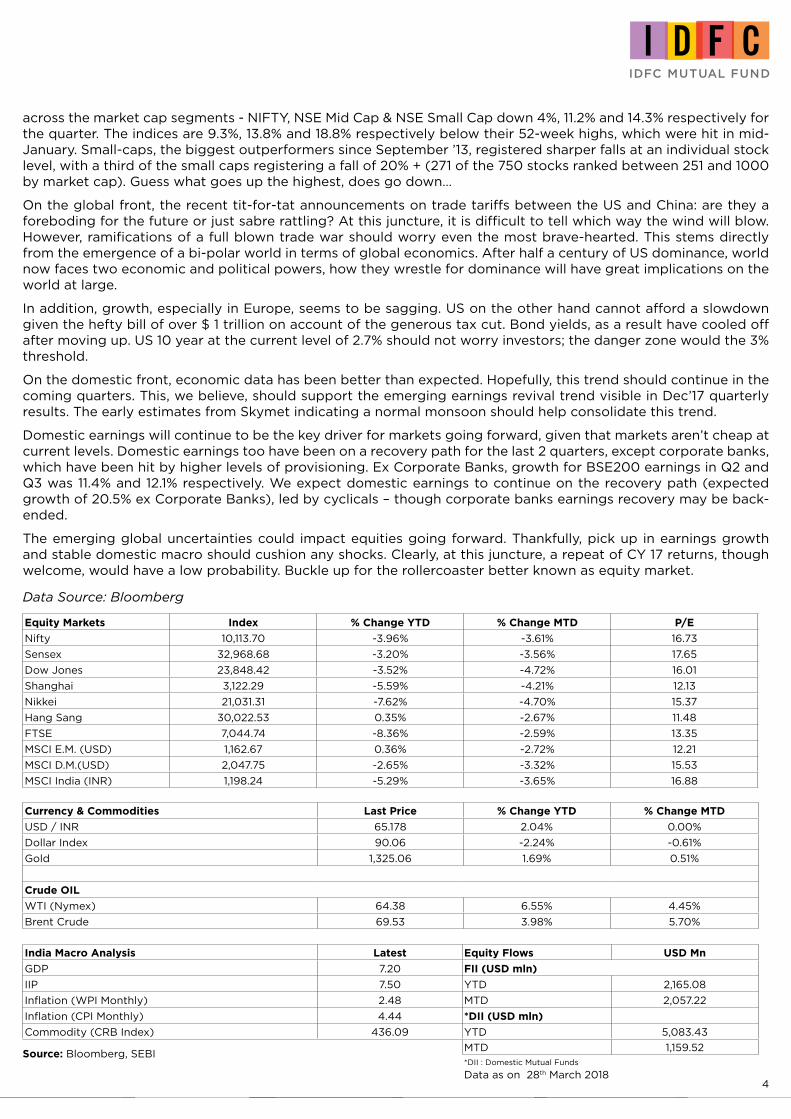
DII inflows continue, FIIs return: FIIs returned as net buyers in Indian equities in March with $1.9bn of equity inflows during the month which took their buying total to $2.0bn for the quarter. DIIs meanwhile saw $1.0bn of net buying – DIIs have now bought $3.85bn worth for the quarter.
Despite positive FII flows in March, FIIs on a whole continue to be underweight on India, with the underweight increasing in March end from December end levels. Higher flows have been directed to other EMs, resulting in India’s underperformance w.r.t to the EM index. FIIs have been underweight on India largely on account of higher valuations – potential FII buying provides a good cushion against a deep market correction.
Macro data sends mixed signals: Growth momentum stable: India’s Industrial Production data for the month of Jan (released in March) stayed strong at 7.5% which was higher than consensus estimates of 6.4%. This was led by capital goods, up 14.6% and Consumer Non-Durables, up 10.5% similar to what we have seen in the Oct-Dec period. CPI inflation eased for the second consecutive month to 4.4% in Feb (from 5.1% in Jan). This was partly led by a decline in vegetable prices along with normalization in the underlying CPI ex of the outliers (i.e. vegetables, pulses, transportation and housing) from 4.3% to 4Feb trade deficit narrowed to a more normalized level of $12bn after the spike to $16.3bn in Jan. However worryingly, exports saw a deceleration to 4.5% growth from 9.1% in Jan – this continues to be a key metric to track in light of uneven global economic growth. Imports also saw a slowdown in Feb with petroleum products as well as capital goods and machinery seeing a deceleration.
Final word
The quarter gone by saw the return of the three headed hydra – (1) Financial scams made a debut in an otherwise pristine regime of BJP after a gap of over three years - Nirav Modi / Gitanjali Gems LoU’s induced scam opened the flood gates for Indian banks to disclose and provide for all frauds as per RBI diktat; (2) Political uncertainty: By- election defeats in pocket boroughs and strongholds of BJP and the building hopes of opposition unity to face the BJP in the big E next year; (3) Negative quarterly returns, with Indian markets witnessing a healthy correction
Name Jun-14 Sep-14 Dec-14 Mar-15 Jun-15 Sep-15 Dec-15 Mar-16 Jun-16 Sep-16 Dec-16 Mar-17 Jun-17 Sep-17 Dec-17 Mar-18NIFTY Private Bank 17% 4% 23% 2% 1% -6% 0% -3% 12% 6% -7% 18% 10% 4% 4% -3%Nifty PSU Bank 42% -13% 27% -20% -5% -4% -8% -15% 11% 15% -5% 18% -6% -8% 22% -22%Nifty Financia l Services 18% 1% 18% 1% -1% -6% 0% -7% 11% 9% -7% 18% 9% 5% 5% -3%
S&P BSE FastMovConsGoods -2% 14% 2% 1% 0% 0% 2% -2% 10% 0% -4% 14% 12% -6% 9% -4%S&P BSE India Auto IDX 15% 16% 5% 3% -3% -7% 6% -3% 10% 13% -9% 9% 6% 3% 11% -10%S&P BSE ConsDisGoods&Svc 23% 9% 6% 1% 1% 1% 5% -6% 11% 11% -10% 17% 8% 5% 17% -9%
Nifty Pharma 12% 27% 1% 17% -5% 6% -7% -8% 1% 3% -10% 1% -8% -5% 5% -13%Nifty IT 7% 14% -1% 8% -9% 9% -7% 1% -2% -7% 1% 3% -5% 3% 11% 7%
S&P BSE Telecom 11% 10% -7% 9% 5% -16% 7% -9% 1% -10% -5% 11% 5% 5% 23% -21%S&P BSE Uti l i ties 36% -13% 2% -2% -6% -9% 14% -6% 11% 0% 4% 12% -1% 5% 11% -11%
Nifty Infrastructure 29% -10% 1% 7% 0% -13% -2% -8% 12% -2% -3% 14% 3% 1% 12% -8%S&P BSE Industria ls 32% -2% 6% 9% -5% -11% 2% -8% 12% 5% -7% 15% 4% 1% 15% -9%
Nifty Energy 20% -7% -7% -4% 8% -14% 12% -2% 3% 12% 5% 13% 0% 10% 12% -7%Nifty Commodities 26% -8% -4% -2% 1% -15% 7% 0% 11% 12% 0% 14% -1% 10% 9% -10%
4
Currency & Commodities Last Price % Change YTD % Change MTD
USD / INR 65.178 2.04% 0.00%
Dollar Index 90.06 -2.24% -0.61%
Gold 1,325.06 1.69% 0.51%
Crude OIL
WTI (Nymex) 64.38 6.55% 4.45%
Brent Crude 69.53 3.98% 5.70%
India Macro Analysis Latest Equity Flows USD Mn
GDP 7.20 FII (USD mln)
IIP 7.50 YTD 2,165.08
Inflation (WPI Monthly) 2.48 MTD 2,057.22
Inflation (CPI Monthly) 4.44 *DII (USD mln)
Commodity (CRB Index) 436.09 YTD 5,083.43
MTD 1,159.52*DII : Domestic Mutual Funds
Data as on 28th March 2018
Equity Markets Index % Change YTD % Change MTD P/E
Nifty 10,113.70 -3.96% -3.61% 16.73
Sensex 32,968.68 -3.20% -3.56% 17.65
Dow Jones 23,848.42 -3.52% -4.72% 16.01
Shanghai 3,122.29 -5.59% -4.21% 12.13
Nikkei 21,031.31 -7.62% -4.70% 15.37
Hang Sang 30,022.53 0.35% -2.67% 11.48
FTSE 7,044.74 -8.36% -2.59% 13.35
MSCI E.M. (USD) 1,162.67 0.36% -2.72% 12.21
MSCI D.M.(USD) 2,047.75 -2.65% -3.32% 15.53
MSCI India (INR) 1,198.24 -5.29% -3.65% 16.88
Source: Bloomberg, SEBI
across the market cap segments - NIFTY, NSE Mid Cap & NSE Small Cap down 4%, 11.2% and 14.3% respectively for the quarter. The indices are 9.3%, 13.8% and 18.8% respectively below their 52-week highs, which were hit in mid-January. Small-caps, the biggest outperformers since September ’13, registered sharper falls at an individual stock level, with a third of the small caps registering a fall of 20% + (271 of the 750 stocks ranked between 251 and 1000 by market cap). Guess what goes up the highest, does go down…
On the global front, the recent tit-for-tat announcements on trade tariffs between the US and China: are they a foreboding for the future or just sabre rattling? At this juncture, it is difficult to tell which way the wind will blow. However, ramifications of a full blown trade war should worry even the most brave-hearted. This stems directly from the emergence of a bi-polar world in terms of global economics. After half a century of US dominance, world now faces two economic and political powers, how they wrestle for dominance will have great implications on the world at large.
In addition, growth, especially in Europe, seems to be sagging. US on the other hand cannot afford a slowdown given the hefty bill of over $ 1 trillion on account of the generous tax cut. Bond yields, as a result have cooled off after moving up. US 10 year at the current level of 2.7% should not worry investors; the danger zone would the 3% threshold.
On the domestic front, economic data has been better than expected. Hopefully, this trend should continue in the coming quarters. This, we believe, should support the emerging earnings revival trend visible in Dec’17 quarterly results. The early estimates from Skymet indicating a normal monsoon should help consolidate this trend.
Domestic earnings will continue to be the key driver for markets going forward, given that markets aren’t cheap at current levels. Domestic earnings too have been on a recovery path for the last 2 quarters, except corporate banks, which have been hit by higher levels of provisioning. Ex Corporate Banks, growth for BSE200 earnings in Q2 and Q3 was 11.4% and 12.1% respectively. We expect domestic earnings to continue on the recovery path (expected growth of 20.5% ex Corporate Banks), led by cyclicals – though corporate banks earnings recovery may be back-ended.
The emerging global uncertainties could impact equities going forward. Thankfully, pick up in earnings growth and stable domestic macro should cushion any shocks. Clearly, at this juncture, a repeat of CY 17 returns, though welcome, would have a low probability. Buckle up for the rollercoaster better known as equity market.
Data Source: Bloomberg
5
WHAT WENT BY
Bonds rallied during the month with the 10-year benchmark bond yield closing 33bps down at 7.40% on the back of lower first half borrowing calendar proposed by the government.
Surprisingly, Government cut its gross borrowing program announced in the FY19 budget by Rs. 50,000crs to for Rs 5,56,000 cr. This was done by reducing the intended buyback by INR 25,000 cr and relying on small savings for an additional INR 25,000 cr. Further, even of the reduced calendar for the full year, the government is choosing to borrow only 52% in the first half; versus the 60 – 65% that should normally be the case. Not only this, and despite refinancing pressures in the near few years, the ‘belly’ supply (10 to 14 years) has been cut to less than 30% of the auction. Instead, the longest end has been slightly increased whereas a new bucket for 1 – 4 years has been created for around 8% of the auction. There is also a commitment made that the government will come out with a separate switching calendar to allow investors to sell back their illiquid securities to the government.
The revised auction calendar has had the immediate effect of significantly bull flattening the yield curve. This is logical since the greatest feared supply risk was in the belly of the curve, which isn’t the case anymore. However, it is a stretch probably to expect this outperformance to continue. The revised borrowing calendar in a sense reflects the new market reality; that there simply isn’t enough appetite left for longer tenor bonds in the general market (one isn’t referring here to the longest end which is the domain of insurers and provident funds largely). Thus it is likely that banks’ also run shorter maturities in their non-held to maturity (HTM) books. Also foreign portfolio investors (FPIs) typically prefer shorter maturities as well.
The bond market took the April’18 RBI policy gladly and used it to build on the momentum already established since the announcement of the H1 borrowing program. Specifically, the bond market took positively the downward revision to RBI’s CPI forecast for the year ahead, as well as its specific focus on the CPI ex-HRA in the written policy document. CPI forecast for H1 FY 19 has been reduced from 5.1 – 5.6% to 4.7 – 5.1% and for H2 from 4.5 – 4.6% to 4.4% in H2, but with risks tilted to the upside. Excluding impact of HRA revisions, CPI is projected at 4.4 – 4.7% in H1 and 4.4% in H2. It is to be noted that these are very close to the target of 4% and if achieved effectively rule out any rate hike. A prolonged pause is anyway our base case view. However, most of the risk factors mentioned are to the upside. Thus the MPC notes the possible impact of MSP revisions that will be known only in the coming months, the risks from possible second round effect of HRA increases, the possibility of near or medium term fiscal slippages from centre and / or states, possible risk from monsoons, risks to inflation from companies expecting higher input and output prices, and crude price volatility. More fundamentally, the MPC also assesses that growth has been recovering and output gap closing as also reflected in a pick-up in credit growth in recent months. The MPC also notes that household inflation expectations have edged up both for 3 months and 1 year horizons.
On the domestic macro front headline CPI declined to 4.44% in February’18 from 5.07% in January’18, mostly owing to lower food inflation. Core inflation however continues to remain sticky. WPI too declined to 2.48% in February’18 compared to 2.84% in the previous.
India’s quarterly current account deficit (CAD) in 3Q18 widened to 2% of GDP from 1.1% of GDP the previous quarter, though the widening was slightly less than expected (Consensus 2.4% of GDP). The increase was largely on the back of the merchandise trade deficit, which sharply increased to 6.6% of GDP ($44.1 bn) in 3Q18 from 5.2% of GDP ($32.8bn) in 2Q18. However, it was partially offset by the “invisibles account” surplus rising from 2.9% of GDP in 2Q18 to 3.1% of GDP in 3Q18.
On the global front, US Federal Reserve increased the benchmark lending rate by 25bps with a projection of 2 more interest rate hikes in 2018 but median dots for 2019, 2020 and the “long run” moved higher although official projections now show a slight overshoot of core PCE inflation (reaching 2.1% in 2019 and 2020). This suggests a willingness to remain “gradual” even if inflation picks up in the near-term. Chair Powell was slightly more dovish & stated that there is “no sense in the data” that prices are about to accelerate. Powell also stated in the Q&A that the natural rate is likely to stay low. On the other hand global trade tensions escalated with the US administration announcing trade tariffs on potential $50 billion on Chinese imports. The list of Chinese products that will be hit by tariffs will be released presumably in the first week of April & is likely to mostly target the “Made in China 2025” list of technology equipment. Chinese also retaliated not only from tariffs on technology equipment imports from the US, but also agricultural imports such as soybeans. While the market concern is that this could lead to a premature demise of the “global synchronized growth”, historically tariffs have been a tactical move to negotiate better trade terms without total withdrawal from trade & moderate tightening of trade and investment rules.
Outlook:
From a steady state perspective, pure front end strategies like ultra-short / short term / medium term funds continue to make imminent sense. AAA / sovereign rates have adjusted the most over the past few months versus lower rated, high yield credit; thereby making AAA / sovereign as well as relatively liquid ‘mid-yield’ credits much more attractive. With general interest in the market being stronger after the new auction calendar, the effect should also rub-off on front end rates. Not just that, seasonality favors the trade as well since typically liquidity conditions get better and incremental credit to deposit ratio falls over April – June; thereby benefiting front end rates. Our active duration bond funds have core long positions in up to 5-7 year rates and we prefer proxies like corporate bonds, State Development Loans (SDLs) and higher carry government bonds in the 10-year segment.
Commentary - Debt OutlookMr. Suyash Choudhary
Head - Fixed Income
6
IDFC Classic Equity FundAn open ended ‘diversified’ equity fund
31st March 2018
FUND FEATURES
INDUSTRY ALLOCATION
Size
Large Cap
Mid Cap
Small Cap
Style Growth Blend Value
About the Fund: IDFC Classic Equity fund is a diversified equity fund with a large cap bias currently. The focus of the fund is to build a portfolio of Quality companies while being cognizant of the relative valuation.
Nature: Equity
Monthly Avg AUM: ` 2,553.04 Crores
Month end AUM: ` 2,619.30 Crores
Inception Date: 9 August 2005
Fund Manager: Mr. Anoop Bhaskar (w.e.f. 30th April 2016)
Other Parameter: Beta 1.02
R Square 0.94
Standard Deviation (Annualized) 14.25%
Sharpe* 0.09
Portfolio Turnover Equity 0.35
Aggregate^ 1.14
Expense Ratio Regular 2.22%
Direct 0.59%
Benchmark: S&P BSE 200
SIP (Minimum Amount): ` 1,000/-
SIP Frequency: Monthly
SIP Dates (Monthly): 1st, 5th, 7th, 10th, 15th, 20th and 25th Investment Objective: Refer Pg No from 43 to 44 Minimum Investment Amount : ` 5,000/- and any amount thereafter
Option Available: Growth, Dividend - (Payout, Reinvestment and Sweep (from Equity Schemes to Debt Schemes only))
Exit Load: 1% if redeemed within 365 days from the date of allotment. (w.e.f. 10th May 2016)
Top 10 Equity Holdings
Banks 16.72%Finance 11.73%Software 7.89%Auto Ancillaries 7.35%Construction Project 5.07%Petroleum Products 4.52%Auto 4.40%Consumer Non Durables 4.06%Power 3.71%Ferrous Metals 3.54%Retailing 3.44%Industrial Products 2.99%Pharmaceuticals 2.94%
Performance TableScheme Name CAGR Returns (%) Current Value of Investment of ` 10,000
1 Year 3 Years 5 YearsSince Inception Aug 09, 2005
1 Year 3 Years 5 YearsSince InceptionAug 09, 2005
IDFC Classic Equity Fund 12.97% 10.65% 15.74% 12.41% 11,297 13,541 20,782 43,862
S&P BSE 200# 12.49% 9.31% 15.77% 13.93% 11,249 13,054 20,804 51,974
Nifty 50## 11.76% 7.38% 13.63% 13.75% 11,176 12,378 18,954 50,954
Performance based on NAV as on 28/3/2018. Past performance may or may not be sustained in future.For other funds managed by the fund manager, please refer page no. 36 - 38 & the respective fund pages The performances given are of regular plan growth option.Regular and Direct Plans have different expense structure. Direct Plan shall have a lower expense ratio excluding distribution expenses, commission expenses etc.*Risk-free rate assumed to be 9.39% (FBIL OVERNIGHT MIBOR as on 28th March 2018). Ratios calculated on the basis of 3 years history of monthly data. ^Portfolio Turnover ratio is calculated as Lower of purchase or sale during the period / Average AUM for the last one year (includes Fixed Income securities and Equity derivatives). #Benchmark Returns. ##Alternate Benchmark Returns.Current Index performance adjusted for the period from since inception to June 28, 2007 with the performance of S&P BSE 200 price return index (Benchmark)With effect from 1st February 2018, we are comparing the performances of the funds with the total return variant of the benchmark instead of the price return variant.
SIP PERFORMANCE
Monthly SIP of ` 10,000 in IDFC Classic Equity Fund - Regular Plan - Growth
1 Year 3 Years 5 Years 7 Years 10 YearsSince
InceptionAug 09, 2005
Total Amount Invested (`) 1,20,000 3,60,000 6,00,000 8,40,000 12,00,000 15,20,000 Total Value as on March 28, 2018 (`) 1,21,655 4,47,481 8,76,539 14,16,894 23,46,561 32,99,802 Fund Returns (%) 2.62 14.75 15.21 14.71 12.89 11.56Total Value of S&P BSE 200# 1,22,417 4,35,549 8,47,462 13,76,968 23,87,509 NAS&P BSE 200 (%)# 3.84 12.86 13.84 13.91 13.22 NATotal Value of Nifty 50## 1,22,328 4,25,727 8,02,644 12,89,007 22,08,248 32,45,064 Nifty 50 (%)## 3.70 11.28 11.63 12.06 11.75 11.32Past performance may or may not be sustained in future.Dividends are assumed to be reinvested and bonus is adjusted. Load is not taken into consideration. To illustrate the advantages of SIP investment, this is how your investment would have grown if you had invested say `10,000 systematically on the first business Day of every month over a period of time. Returns are calculated by using XIRR approach. XIRR helps in calculating return on investment given an initial and final value and a series of cash inflows and outflows with the correct allowance for the time impact of the transactions. Data as on 28th March 2018.
Riskometer
Investors understand that their principal will be at Moderately High risk
This product is suitable for investors who are seeking*:
Create wealth over a long period of time.•
Investment predominantly in equity and •equity related instruments across market capitalisation.
*Investors should consult their financial advisers if in doubt about whether the product is suitable for them.
Cement 2.90%Industrial Capital Goods 2.12%Non - Ferrous Metals 1.85%Gas 1.76%Chemicals 1.48%Hotels, Resorts And Other Recreational Activities 1.45%Fertilisers 0.95%Consumer Durables 0.72%Media & Entertainment 0.65%Oil 0.63%Transportation 0.55%Minerals/Mining 0.50%Textile Products 0.42%
NAV (`)
Regular Plan Growth 43.8556Regular Plan Dividend 15.2535
PORTFOLIO
Name % of NAV
Equity and Equity related Instruments 94.33%Banks 16.72%HDFC Bank 5.98%Kotak Mahindra Bank 2.03%State Bank of India 1.47%ICICI Bank 1.37%RBL Bank 1.35%Axis Bank 1.27%The Federal Bank 1.03%Bank of Baroda 0.77%Union Bank of India 0.65%IndusInd Bank 0.62%Bandhan Bank 0.19%Finance 11.73%HDFC 1.82%M&M Financial Services 1.55%Bharat Financial Inclusion 1.53%Shriram City Union Finance 1.40%ICICI Securities 1.20%Sundaram Finance 1.09%TI Financial Holdings 0.86%Reliance Nippon Life Asset Management 0.84%ICICI Lombard General Insurance Company 0.67%Max Financial Services 0.56%Sundaram Finance Holdings 0.20%Software 7.89%Infosys 3.60%HCL Technologies 1.34%Tata Consultancy Services 1.11%KPIT Technologies 0.87%Mastek 0.63%Tech Mahindra - Equity Futures 0.19%Tech Mahindra 0.14%Auto Ancillaries 7.35%MRF 1.70%Apollo Tyres 1.53%Exide Industries 0.91%Minda Industries 0.90%CEAT 0.85%Balkrishna Industries 0.57%Apollo Tyres - Equity Futures 0.49%Asahi India Glass 0.41%Construction Project 5.07%Larsen & Toubro 2.88%Voltas 0.80%Sadbhav Engineering 0.74%NCC 0.65%Petroleum Products 4.52%Reliance Industries 2.04%Indian Oil Corporation 0.96%Bharat Petroleum Corporation 0.80%Hindustan Petroleum Corporation 0.72%Auto 4.40%Hero MotoCorp 1.38%Mahindra & Mahindra 1.26%Tata Motors 1.08%Bajaj Auto 0.68%Consumer Non Durables 4.06%ITC 2.13%Nestle India 0.86%Colgate Palmolive (India) 0.77%DCM Shriram 0.29%
Name % of NAV
Power 3.71%NTPC 1.08%Nava Bharat Ventures 1.03%Kalpataru Power Transmission 0.99%Torrent Power 0.61%Ferrous Metals 3.54%Jindal Steel & Power 1.80%JSW Steel 0.90%Tata Steel 0.84%Retailing 3.44%Future Retail 1.89%Future Lifestyle Fashions 1.22%Aditya Birla Fashion and Retail 0.33%Industrial Products 2.99%Graphite India 1.41%Mahindra CIE Automotive 0.91%Bharat Forge 0.68%Pharmaceuticals 2.94%Sun Pharmaceutical Industries 1.06%Natco Pharma 0.78%Indoco Remedies 0.60%Cadila Healthcare 0.50%Cement 2.90%Ambuja Cements 1.26%The Ramco Cements 0.83%JK Cement 0.59%Deccan Cements 0.22%Industrial Capital Goods 2.12%Bharat Electronics 0.78%Thermax 0.74%CG Power and Industrial Solutions 0.59%Non - Ferrous Metals 1.85%National Aluminium Company 0.98%Vedanta 0.88%Gas 1.76%Petronet LNG 0.97%GAIL (India) 0.79%Chemicals 1.48%Tata Chemicals 0.87%Deepak Nitrite 0.62%Hotels, Resorts And Other Recreational Activities 1.45%The Indian Hotels Company 1.45%Fertilisers 0.95%Coromandel International 0.95%Consumer Durables 0.72%Crompton Greaves Consumer Electricals 0.43%Sheela Foam 0.29%Media & Entertainment 0.65%Zee Entertainment Enterprises 0.65%Oil 0.63%Oil & Natural Gas Corporation 0.63%Transportation 0.55%Container Corporation of India 0.55%Minerals/Mining 0.50%Coal India 0.30%NMDC 0.20%Textile Products 0.42%Dollar Industries 0.42%Preference Shares 0.01%Media & Entertainment 0.01%Zee Entertainment Enterprises 0.01%Net Cash and Cash Equivalent 5.66%Grand Total 100.00%
7
IDFC Sterling Equity FundAn open ended ‘mid & small cap’ equity fund
31st March 2018
FUND FEATURES
INDUSTRY ALLOCATION
Size
Large Cap
Mid Cap
Small Cap
Style Growth Blend Value
About the Fund: IDFC Sterling Equity Fund is a mid/small cap fund that focuses on active stock selection strategy.
Nature: Equity
Monthly Avg AUM: ` 2,565.69 Crores
Month end AUM: ` 2,640.01 Crores
Inception Date: 7 March 2008
Fund Manager: Mr. Anoop Bhaskar (w.e.f. 30th April 2016) & Mr. Daylynn Pinto (w.e.f. 20th October 2016)
Other Parameter:
Beta 0.95
R Square 0.82
Standard Deviation (Annualized) 16.79%
Sharpe* 0.28
Portfolio Turnover
Equity 0.22 Aggregate^ 0.30
Expense Ratio
Regular 2.55%
Direct 1.20%
Benchmark: Nifty Free Float Midcap 100
SIP (Minimum Amount): ` 1,000/-
SIP Frequency: Monthly
SIP Dates (Monthly): 1st, 5th, 7th, 10th, 15th, 20th and 25th Investment Objective: Refer Pg No from 43 to 44 Minimum Investment Amount : ` 5,000/- and any amount thereafter
Option Available: Growth, Dividend (Payout, Reinvestment and Sweep (from Equity Schemes to Debt Schemes only))
Exit Load: 1.00% if redeemed on or before 365 days from the date of allotment. (w.e.f. 7th September, 2015)
Top 10 Equity Holdings
Auto Ancillaries 12.51%Finance 9.92%Banks 8.96%Retailing 8.22%Construction Project 7.98%Cement 4.77%Industrial Products 4.47%Pharmaceuticals 3.53%Power 3.48%Industrial Capital Goods 3.19%Software 3.12%Transportation 3.07%
Performance Table
Scheme Name CAGR Returns (%) Current Value of Investment of ` 10,000
1 Year 3 Years 5 YearsSince InceptionMar 07, 2008
1 Year 3 Years 5 YearsSince InceptionMar 07, 2008
IDFC Sterling Equity Fund 23.03% 14.10% 22.44% 18.34% 12,303 14,844 27,531 54,429
Nifty Free Float Midcap 100#
10.25% 14.39% 21.96% 12.62% 11,025 14,958 26,995 33,078
Nifty 50## 11.76% 7.38% 13.63% 9.03% 11,176 12,378 18,954 23,878
Performance based on NAV as on 28/3/2018. Past performance may or may not be sustained in future.For other funds managed by the fund manager, please refer page no. 36 - 38 & the respective fund pages The performances given are of regular plan growth option.Regular and Direct Plans have different expense structure. Direct Plan shall have a lower expense ratio excluding distribution expenses, commission expenses etc.*Risk-free rate assumed to be 9.39% (FBIL OVERNIGHT MIBOR as on 28th March 2018). Ratios calculated on the basis of 3 years history of monthly data. ^Portfolio Turnover ratio is calculated as Lower of purchase or sale during the period / Average AUM for the last one year (includes Fixed Income securities and Equity derivatives). #Benchmark Returns. ##Alternate Benchmark Returns.With effect from 1st February 2018, we are comparing the performances of the funds with the total return variant of the benchmark instead of the price return variant.
Riskometer
Investors understand that their principal will be at Moderately High risk
This product is suitable for investors who are seeking*:
Create wealth over a long period of time.•
Investment predominantly in equity and equity •related instruments in the mid cap segment.
*Investors should consult their financial advisers if in doubt about whether the product is suitable for them.
Consumer Durables 2.76%Media & Entertainment 2.73%Hotels, Resorts And Other Recreational Activities 2.59%Ferrous Metals 2.24%Textile Products 2.03%Consumer Non Durables 1.87%Gas 1.73%Chemicals 1.52%Petroleum Products 0.91%Textiles - Cotton 0.70%Minerals/Mining 0.63%Miscellaneous 0.42%
NAV (`)Regular Plan Growth 54.4193Regular Plan Dividend 21.2933
PORTFOLIO
Name % of NAV
Equity and Equity related Instruments 93.34%Auto Ancillaries 12.51%Minda Industries 2.42%MRF 2.20%Apollo Tyres 1.57%Exide Industries 1.49%Asahi India Glass 1.15%WABCO India 0.84%Igarashi Motors India 0.77%Tube Investments of India 0.76%CEAT 0.68%Sterling Tools 0.62%Finance 9.92%Bajaj Finance 2.88%M&M Financial Services 1.39%ICICI Securities 1.19%BSE 1.16%Mas Financial Services 0.94%Magma Fincorp 0.89%Max Financial Services 0.81%ICICI Lombard General Insurance Company 0.66%Banks 8.96%IndusInd Bank 2.65%RBL Bank 1.91%Bank of Baroda 1.27%Union Bank of India 1.18%The Karnataka Bank 0.96%The Federal Bank 0.84%Bandhan Bank 0.15%Retailing 8.22%Future Retail 4.45%V-Mart Retail 1.58%Future Lifestyle Fashions 1.22%Aditya Birla Fashion and Retail 0.97%Construction Project 7.98%KEC International 2.66%NCC 2.06%Voltas 2.06%Engineers India 1.20%Cement 4.77%The Ramco Cements 2.60%JK Cement 1.00%Sagar Cements 0.70%JK Lakshmi Cement 0.47%Industrial Products 4.47%Graphite India 1.17%KEI Industries 0.95%Schaeffler India 0.90%Mahindra CIE Automotive 0.81%Bharat Forge 0.64%Pharmaceuticals 3.53%Dishman Carbogen Amcis 1.08%Aurobindo Pharma 0.95%Hikal 0.70%Natco Pharma 0.57%
Name % of NAV
Indoco Remedies 0.23%Power 3.48%Nava Bharat Ventures 1.30%Kalpataru Power Transmission 1.28%CESC 0.90%Industrial Capital Goods 3.19%CG Power and Industrial Solutions 0.91%Lakshmi Machine Works 0.65%Skipper 0.60%Bharat Electronics 0.59%TD Power Systems 0.43%Software 3.12%Cyient 1.71%KPIT Technologies 0.98%Persistent Systems 0.42%Transportation 3.07%VRL Logistics 2.19%Future Supply Chain Solutions 0.88%Consumer Durables 2.76%Crompton Greaves Consumer Electricals 1.21%Greenply Industries 0.96%Butterfly Gandhimathi Appliances 0.59%Media & Entertainment 2.73%Zee Entertainment Enterprises 0.98%PVR 0.96%Entertainment Network (India) 0.79%Hotels, Resorts And Other Recreational Activities 2.59%The Indian Hotels Company 1.18%EIH 0.74%Wonderla Holidays 0.67%Ferrous Metals 2.24%Jindal Steel & Power 1.51%Maharashtra Seamless 0.73%Textile Products 2.03%K.P.R. Mill 0.72%Raymond 0.71%Dollar Industries 0.59%Consumer Non Durables 1.87%HBL Power Systems 0.97%Procter & Gamble Hygiene and Health Care 0.90%Gas 1.73%Petronet LNG 1.22%Gujarat Gas 0.51%Chemicals 1.52%Deepak Nitrite 1.52%Petroleum Products 0.91%Hindustan Petroleum Corporation 0.91%Textiles - Cotton 0.70%Nitin Spinners 0.70%Minerals/Mining 0.63%NMDC 0.63%Miscellaneous 0.42%Kirloskar Ferrous Industries 0.42%Net Cash and Cash Equivalent 6.66%Grand Total 100.00%
SIP PERFORMANCE
Monthly SIP of ` 10,000 in IDFC Sterling Equity Fund - Regular Plan - Growth
1 Year 3 Years 5 Years 7 Years 10 YearsSince
InceptionMar 07, 2008
Total Amount Invested (`) 1,20,000 3,60,000 6,00,000 8,40,000 12,00,000 12,10,000
Total Value as on March 28, 2018 (`) 1,25,848 4,87,497 10,23,498 17,28,419 34,31,307 34,85,736
Fund Returns (%) 9.36 20.86 21.59 20.31 19.97 19.93
Total Value of Nifty Free Float Midcap 100# 1,20,166 4,54,963 9,84,089 16,30,364 29,31,773 29,64,851
Nifty Free Float Midcap 100 (%)# 0.26 15.92 19.97 18.66 17.05 16.96
Total Value of Nifty 50## 1,22,328 4,25,727 8,02,644 12,89,007 22,07,835 22,31,713
Nifty 50 (%)## 3.70 11.28 11.63 12.06 11.75 11.69Past performance may or may not be sustained in future.Dividends are assumed to be reinvested and bonus is adjusted. Load is not taken into consideration. To illustrate the advantages of SIP investment, this is how your investment would have grown if you had invested say `10,000 systematically on the first business Day of every month over a period of time. Returns are calculated by using XIRR approach. XIRR helps in calculating return on investment given an initial and final value and a series of cash inflows and outflows with the correct allowance for the time impact of the transactions. Data as on 28th March 2018.
8
IDFC Premier Equity FundAn open ended ‘multi cap’ equity fund
31st March 2018
FUND FEATURES
INDUSTRY ALLOCATION
Size
Large Cap
Mid Cap
Small Cap
Style Growth Blend Value
About the Fund: IDFC Premier Equity Fund is a multi-cap Equity Fund. It is a fund that encourages systematic investing. The fund in the past has been opened for lump sum investments for limited time periods.
Nature: Equity
Monthly Avg AUM: ` 5,474.53 Crores
Month end AUM: ` 5,371.86 Crores
Inception Date: 28 September 2005
Fund Manager: Mr. Anoop Bhaskar (w.e.f. 30th April 2016) & Mr. Kartik Mehta (w.e.f. 2nd April 2018)
Other Parameter:
Beta 0.93
R Square 0.83
Standard Deviation (Annualized) 14.17%
Sharpe* -0.18
Portfolio Turnover
Equity 0.18 Aggregate^ 0.21
Expense Ratio
Regular 2.30%
Direct 1.55%
Benchmark: S&P BSE 500
SIP (Minimum Amount): ` 2,000/-
SIP Frequency: Monthly
SIP Dates (Monthly): 1st, 5th, 7th, 10th, 15th, 20th and 25th
Investment Objective: Refer Pg No from 43 to 44 Minimum Investment Amount: ` 10,000/- and any amount thereafter (During the period when the fund is open for lump sum subscription)
Option Available: Growth, Dividend - (Payout, Reinvestment and Sweep (from Equity Schemes to Debt Schemes only))
Exit Load: 1.00% if redeemed before 365 days from the date of allotment. (w.e.f. 1st September, 2009)
Top 10 Equity Holdings
Finance 14.11%Banks 8.63%Consumer Non Durables 7.96%Transportation 6.64%Industrial Products 6.48%Auto 5.69%Pharmaceuticals 5.29%Auto Ancillaries 4.79%Construction Project 4.68%Chemicals 4.20%Commercial Services 3.79%Consumer Durables 3.69%
Performance Table
Scheme Name CAGR Returns (%) Current Value of Investment of ` 10,000
1 Year 3 Years 5 YearsSince Inception Sep 28, 2005
1 Year 3 Years 5 YearsSince InceptionSep 28, 2005
IDFC Premier Equity Fund 10.18% 6.89% 19.84% 19.24% 11,018 12,207 24,725 90,258
S&P BSE 500# 13.21% 9.99% 16.40% 13.12% 11,321 13,298 21,373 46,721
Nifty 50## 11.76% 7.38% 13.63% 12.84% 11,176 12,378 18,954 45,280
Performance based on NAV as on 28/3/2018. Past performance may or may not be sustained in future.For other funds managed by the fund manager, please refer page no. 36 - 38 & the respective fund pages The performances given are of regular plan growth option.Regular and Direct Plans have different expense structure. Direct Plan shall have a lower expense ratio excluding distribution expenses, commission expenses etc.*Risk-free rate assumed to be 9.39% (FBIL OVERNIGHT MIBOR as on 28th March 2018). Ratios calculated on the basis of 3 years history of monthly data. ^Portfolio Turnover ratio is calculated as Lower of purchase or sale during the period / Average AUM for the last one year (includes Fixed Income securities and Equity derivatives). #Benchmark Returns. ##Alternate Benchmark Returns. Current Index performance adjusted for the period from since inception to June 28, 2007 with the performance of S&P BSE 500 price return index (Benchmark)With effect from 1st February 2018, we are comparing the performances of the funds with the total return variant of the benchmark instead of the price return variant.
SIP PERFORMANCE
Monthly SIP of ` 10,000 in IDFC Premier Equity Fund -Regular Plan - Growth
1 Year 3 Years 5 Years 7 Years 10 YearsSince
InceptionSep 28, 2005
Total Amount Invested (`) 1,20,000 3,60,000 6,00,000 8,40,000 12,00,000 15,10,000
Total Value as on March 28, 2018 (`) 1,19,804 4,15,742 8,81,717 15,27,717 30,85,648 52,13,083
Fund Returns (%) -0.31 9.64 15.45 16.83 18.00 18.25
Total Value of S&P BSE 500# 1,22,519 4,40,313 8,63,011 14,00,876 24,27,093 NA
S&P BSE 500 (%)# 4.00 13.62 14.58 14.39 13.52 NA
Total Value of Nifty 50## 1,22,328 4,25,727 8,02,644 12,89,007 22,08,248 31,90,203
Nifty 50 (%)## 3.70 11.28 11.63 12.06 11.75 11.25Past performance may or may not be sustained in future.Dividends are assumed to be reinvested and bonus is adjusted. Load is not taken into consideration. To illustrate the advantages of SIP investment, this is how your investment would have grown if you had invested say `10,000 systematically on the first business Day of every month over a period of time. Returns are calculated by using XIRR approach. XIRR helps in calculating return on investment given an initial and final value and a series of cash inflows and outflows with the correct allowance for the time impact of the transactions. Data as on 28th March 2018.
Riskometer
Investors understand that their principal will be at Moderately High risk
This product is suitable for investors who are seeking*:
Create wealth over a long period of time.•
Investment predominantly in equity and •equity related instruments across market capitalisation.
*Investors should consult their financial advisers if in doubt about whether the product is suitable for them.
Ferrous Metals 3.21%Engineering Services 2.65%Cement 2.43%Retailing 2.41%IT Consulting & Other Services 2.41%Industrial Capital Goods 2.37%Textile Products 2.36%Construction 1.89%Textiles - Cotton 1.82%Media & Entertainment 1.30%Gas 0.81%
NAV (`)
Regular Plan Growth 90.2567Regular Plan Dividend 33.2707
PORTFOLIO
Name % of NAV
Equity and Equity related Instruments 99.60%Finance 14.11%JM Financial 2.97%ICICI Prudential Life Insurance Company 2.07%Bharat Financial Inclusion 1.39%HDFC Standard Life Insurance Company 1.34%Bajaj Finance 1.28%ICICI Securities 1.25%TI Financial Holdings 1.21%Multi Commodity Exchange of India 1.12%Max Financial Services 1.01%SBI Life Insurance Company 0.47%Banks 8.63%Kotak Mahindra Bank 3.34%HDFC Bank 2.89%City Union Bank 1.28%RBL Bank 1.12%Consumer Non Durables 7.96%Asian Paints 2.96%Britannia Industries 1.97%Procter & Gamble Hygiene and Health Care 1.64%Balrampur Chini Mills 0.78%S H Kelkar and Company 0.61%Transportation 6.64%Container Corporation of India 3.85%TCI Express 1.07%Transport Corporation of India 0.91%Blue Dart Express 0.81%Industrial Products 6.48%Schaeffler India 3.17%Greaves Cotton 2.09%Ingersoll Rand (India) 0.65%Kirloskar Pneumatic Company 0.58%Auto 5.69%Maruti Suzuki India 3.22%Ashok Leyland 1.54%Hero MotoCorp 0.93%Pharmaceuticals 5.29%Sun Pharmaceutical Industries 1.70%Suven Life Sciences 1.17%Natco Pharma 0.98%Aurobindo Pharma 0.85%Eris Lifesciences 0.59%Auto Ancillaries 4.79%MRF 1.42%
Name % of NAV
Minda Industries 1.40%Apollo Tyres 1.35%Precision Camshafts 0.62%Construction Project 4.68%Voltas 3.97%Power Mech Projects 0.71%Chemicals 4.20%Tata Chemicals 2.90%Pidilite Industries 1.30%Commercial Services 3.79%3M India 3.79%Consumer Durables 3.69%Bata India 2.12%Greenlam Industries 0.98%Khadim India 0.58%Ferrous Metals 3.21%APL Apollo Tubes 3.21%Engineering Services 2.65%VA Tech Wabag 2.65%Cement 2.43%Ambuja Cements 2.43%Retailing 2.41%Future Retail 1.59%Future Lifestyle Fashions 0.82%IT Consulting & Other Services 2.41%Cognizant Technology Solutions Corp - International Equities 2.41%
Industrial Capital Goods 2.37%Bharat Electronics 0.97%Disa India 0.88%Kennametal India 0.51%Textile Products 2.36%Page Industries 2.36%Construction 1.89%ITD Cementation India 1.10%Poddar Housing and Development 0.79%Textiles - Cotton 1.82%RSWM 0.95%Vardhman Textiles 0.87%Media & Entertainment 1.30%Entertainment Network (India) 1.30%Gas 0.81%Gujarat State Petronet 0.81%Net Cash and Cash Equivalent 0.40%Grand Total 100.00%
9
IDFC Focused Equity Fund (The Fund was earlier known as IDFC Imperial Equity Fund)$$ An open ended equity scheme investing in maximum 30 stocks with multi cap focus31st March 2018
FUND FEATURES
INDUSTRY ALLOCATION
Size
Large Cap
Mid Cap
Small Cap
Style Growth Blend Value
About the Fund: IDFC Focused Equity Fund is a concentrated portfolio of up to 30 stocks with the flexibility to invest across sectors and across market cap.
Nature: Equity
Monthly Avg AUM: ` 1,354.48 Crores
Month end AUM: ` 1,400.66 Crores
Inception Date: 16 March 2006
Fund Manager: Mr. Sumit Agrawal (w.e.f. 20th October 2016)
Other Parameter:
Beta 0.90
R Square 0.79
Standard Deviation (Annualized) 13.72%
Sharpe* 0.13
Portfolio Turnover
Equity 0.75
Aggregate^ 1.63
Expense Ratio
Regular 2.41%
Direct 0.23%
Benchmark: Nifty 50
SIP (Minimum Amount)$: ` 1,000/-
SIP Frequency: Monthly
SIP Dates (Monthly): 1st, 5th, 7th, 10th, 15th, 20th and 25th Investment Objective: Refer Pg No from 43 to 44
Minimum Investment Amount$: ` 5,000/- and any amount thereafter
Option Available: Growth, Dividend - (Payout, Reinvestment and Sweep (from Equity Schemes to Debt Schemes only))
Exit Load: 1.00% if redeemed before 365 days from the date of allotment. (w.e.f. 1st September 2009)$Subscription in IDFC Focused Equity Fund has been restricted to Rs. 2 lakhs per transaction with effect from 4th December 2017
Top 10 Equity Holdings
Banks 17.37%
Finance 12.61%
Auto Ancillaries 7.36%
Industrial Capital Goods 4.88%
Consumer Non Durables 4.45%
Media & Entertainment 4.06%
Petroleum Products 3.84%
Non - Ferrous Metals 3.63%
Gas 3.61%
Performance Table
Scheme Name CAGR Returns (%) Current Value of Investment of ` 10,000
1 Year 3 Years 5 YearsSince InceptionMar 16, 2006
1 Year 3 Years 5 YearsSince InceptionMar 16, 2006
IDFC Focused Equity Fund 27.24% 11.15% 15.53% 11.82% 12,724 13,723 20,587 38,387
Nifty 50# 11.76% 7.38% 13.63% 11.30% 11,176 12,378 18,954 36,305
Performance based on NAV as on 28/3/2018. Past performance may or may not be sustained in future.For other funds managed by the fund manager, please refer page no. 36 - 38 & the respective fund pages The performances given are of regular plan growth option.Regular and Direct Plans have different expense structure. Direct Plan shall have a lower expense ratio excluding distribution expenses, commission expenses etc.*Risk-free rate assumed to be 9.39% (FBIL OVERNIGHT MIBOR as on 28th March 2018). Ratios calculated on the basis of 3 years history of monthly data. ^Portfolio Turnover ratio is calculated as Lower of purchase or sale during the period / Average AUM for the last one year (includes Fixed Income securities and Equity derivatives). #Benchmark Returns. $$ The strategy of the Fund has been changed from large cap to focused fund$Subscription in IDFC Focused Equity Fund has been restricted to Rs. 2 lakhs per transaction with effect from 4th December 2017.With effect from 1st February 2018, we are comparing the performances of the funds with the total return variant of the benchmark instead of the price return variant.
SIP PERFORMANCE
Monthly SIP of ` 10,000 in IDFC Focused Equity Fund - Regular Plan - Growth
1 Year 3 Years 5 Years 7 Years 10 YearsSince
InceptionMar 16, 2006
Total Amount Invested (`) 1,20,000 3,60,000 6,00,000 8,40,000 12,00,000 14,50,000
Total Value as on March 28, 2018 (`) 1,26,606 4,74,588 8,93,966 13,93,469 23,07,144 30,90,210
Fund Returns (%) 10.60 18.93 16.02 14.24 12.57 11.87
Total Value of Nifty 50# 1,22,328 4,25,727 8,02,644 12,89,007 22,08,248 29,26,272
Nifty 50 (%)# 3.70 11.28 11.63 12.06 11.75 11.04
Past performance may or may not be sustained in future.Dividends are assumed to be reinvested and bonus is adjusted. Load is not taken into consideration. To illustrate the advantages of SIP investment, this is how your investment would have grown if you had invested say `10,000 systematically on the first business Day of every month over a period of time. Returns are calculated by using XIRR approach. XIRR helps in calculating return on investment given an initial and final value and a series of cash inflows and outflows with the correct allowance for the time impact of the transactions. Data as on 28th March 2018.
Riskometer
Investors understand that their principal will be at Moderately High risk
This product is suitable for investors who are seeking*:
To create wealth over a long period of time.•
Investment in a concentrated portfolio of equity •and equity related instruments of up to 30 companies.
*Investors should consult their financial advisers if in doubt about whether the product is suitable for them.
Auto 3.59%
Construction 3.57%
Industrial Products 3.56%
Consumer Durables 3.46%
Commercial Services 3.32%
Software 3.31%
Pharmaceuticals 2.82%
Cement 2.17%
Textile Products 1.93%
Power 1.59%
NAV (`)
Regular Plan Growth 38.3808Regular Plan Dividend 12.7927
PORTFOLIO
Name % of NAV
Equity and Equity related Instruments 91.13%
Banks 17.37%IndusInd Bank 4.36%Kotak Mahindra Bank 4.10%
Axis Bank 3.46%
RBL Bank 3.36%
The South Indian Bank 2.10%
Finance 12.61%Bajaj Finance 3.89%BSE 3.86%
Central Depository Services (India) 2.72%
ICICI Securities 2.14%
Auto Ancillaries 7.36%MRF 4.29%
Minda Industries 3.08%
Industrial Capital Goods 4.88%
Bharat Electronics 3.11%
Skipper 1.77%
Consumer Non Durables 4.45%Jubilant Foodworks 4.45%
Media & Entertainment 4.06%Zee Entertainment Enterprises 4.06%
Petroleum Products 3.84%Indian Oil Corporation 3.84%
Non - Ferrous Metals 3.63%Vedanta 3.63%
Name % of NAV
Gas 3.61%Petronet LNG 3.61%
Auto 3.59%
Maruti Suzuki India 3.59%
Construction 3.57%
Kajaria Ceramics 3.57%
Industrial Products 3.56%
Astral Poly Technik 3.56%
Consumer Durables 3.46%
Titan Company 3.46%
Commercial Services 3.32%
Security and Intelligence Services (India) 3.32%
Software 3.31%
Majesco 3.31%
Pharmaceuticals 2.82%
Dishman Carbogen Amcis 2.82%
Cement 2.17%
Sagar Cements 2.17%
Textile Products 1.93%
Dollar Industries 1.93%
Power 1.59%
Nava Bharat Ventures 1.59%
Net Cash and Cash Equivalent 8.87%
Grand Total 100.00%
10
IDFC Equity Fund(The Fund has been repositioned with effect from April 18, 2017)$$ An open ended ‘large cap’ equity fund31st March 2018
FUND FEATURES
INDUSTRY ALLOCATION
Size
Large Cap
Mid Cap
Small Cap
Style Growth Blend Value
About the Fund: IDFC Equity Fund focuses on investing predominantly in Large Cap stocks.
Nature: Equity
Monthly Avg AUM: ` 303.55 Crores
Month end AUM: ` 311.60 Crores
Inception Date: 9 June 2006
Fund Manager: Mr. Sumit Agrawal & Mr. Arpit Kapoor (w.e.f. 1st March 2017)
Other Parameter:
Beta 0.93
R Square 0.96
Standard Deviation (Annualized) 12.93%
Sharpe* -0.26
Portfolio Turnover
Equity 1.89
Aggregate^ 2.25
Expense Ratio
Regular 3.11%
Direct 2.25%
Benchmark: S&P BSE 100 (w.e.f. April 18, 2017)
SIP (Minimum Amount): ` 1,000/-
SIP Frequency: Monthly
SIP Dates (Monthly): 1st, 5th, 7th, 10th, 15th, 20th and 25th
Investment Objective: Refer Pg No from 43 to 44 Minimum Investment Amount : ` 5,000/- and any amount thereafter
Option Available: Growth, Dividend (Payout, Reinvestment and Sweep (from Equity Schemes to Debt Schemes only))
Exit Load: 1.00% if redeemed before 365 days from the date of allotment. (w.e.f. 1st September 2009)
Top 10 Equity Holdings
Banks 19.63%Consumer Non Durables 11.97%Software 10.63%Auto 10.45%Finance 7.13%Gas 4.18%Petroleum Products 3.81%Pharmaceuticals 2.94%Construction Project 2.69%Cement 2.50%
Performance Table
Scheme Name CAGR Returns (%) Current Value of Investment of ` 10,000
1 Year 3 Years 5 YearsSince InceptionJun 09, 2006
1 Year 3 Years 5 YearsSince InceptionJun 09, 2006
IDFC Equity Fund 10.82% 6.05% 12.45% 9.66% 11,082 11,925 17,987 29,722
S&P BSE 100# 11.89% 7.42% 13.66% 12.65% 11,189 12,392 18,976 40,798
Nifty 50## 11.76% 7.38% 13.63% 12.63% 11,176 12,378 18,954 40,751
Performance based on NAV as on 28/3/2018. Past performance may or may not be sustained in future. For other funds managed by the fund manager, please refer page no. 36 - 38 & the respective fund pages The performances given are of regular plan growth option.Regular and Direct Plans have different expense structure. Direct Plan shall have a lower expense ratio excluding distribution expenses, commission expenses etc.*Risk-free rate assumed to be 9.39% (FBIL OVERNIGHT MIBOR as on 28th March 2018). Ratios calculated on the basis of 3 years history of monthly data. ^Portfolio Turnover ratio is calculated as Lower of purchase or sale during the period / Average AUM for the last one year (includes Fixed Income securities and Equity derivatives). #Benchmark Returns. ##Alternate Benchmark Returns. Current Index performance adjusted for the period from since inception to April 18, 2017 with the performance of Nifty 50 TRI (Benchmark)$$For details please refer Notice (https://www.idfcmf.com/uploads/140320171238No-14-Change-in-Investmenty-Strategy-of-IDFC-Equity-Fund.pdf)Current Index performance adjusted for the period from since inception to June 28, 2007 with the performance of S&P BSE 100 price return index (Benchmark)With effect from 1st February 2018, we are comparing the performances of the funds with the total return variant of the benchmark instead of the price return variant.
SIP PERFORMANCE
Monthly SIP of ` 10,000 in IDFC Equity Fund - Regular Plan - Growth
1 Year 3 Years 5 Years 7 Years 10 YearsSince
InceptionJun 09, 2006
Total Amount Invested (`) 1,20,000 3,60,000 6,00,000 8,40,000 12,00,000 14,20,000
Total Value as on March 28, 2018 (`) 1,19,683 4,19,689 7,79,065 12,38,598 20,89,249 26,19,917
Fund Returns (%) -0.50 10.30 10.43 10.94 10.71 9.89
Total Value of S&P BSE 100# 1,22,227 4,25,799 8,03,058 12,89,421 22,10,146 28,26,845
S&P BSE 100 Index (%)# 3.54 11.30 11.66 12.07 11.77 11.08
Total Value of Nifty 50## 1,22,328 4,25,554 8,02,219 12,88,028 22,07,704 28,23,696
Nifty 50 (%)## 3.70 11.26 11.61 12.04 11.75 11.06
Past performance may or may not be sustained in future.Dividends are assumed to be reinvested and bonus is adjusted. Load is not taken into consideration. To illustrate the advantages of SIP investment, this is how your investment would have grown if you had invested say `10,000 systematically on the first business Day of every month over a period of time. Returns are calculated by using XIRR approach. XIRR helps in calculating return on investment given an initial and final value and a series of cash inflows and outflows with the correct allowance for the time impact of the transactions. Data as on 28th March 2018.
Riskometer
Investors understand that their principal will be at Moderately High risk
This product is suitable for investors who are seeking*:
To create wealth over a long period of time.•
Investment predominantly in equity and equity •related instruments in the large cap segment.
*Investors should consult their financial advisers if in doubt about whether the product is suitable for them.
Industrial Capital Goods 2.49%Non - Ferrous Metals 2.35%Consumer Durables 2.21%Ferrous Metals 2.09%Media & Entertainment 1.92%Oil 1.07%Miscellaneous 1.01%Textile Products 1.00%Power 0.95%
NAV (`)Regular Plan Growth 29.7156Regular Plan Dividend 13.9205
PORTFOLIO
Name % of NAV
Equity and Equity related Instruments 91.05%
Banks 19.63%HDFC Bank 7.55%ICICI Bank 3.57%
Kotak Mahindra Bank 2.49%
Bandhan Bank 2.47%
IndusInd Bank 1.78%
Axis Bank 1.77%
Consumer Non Durables 11.97%ITC 3.48%
Britannia Industries 2.23%
Nestle India 2.21%
Hindustan Unilever 2.07%
Dabur India 1.98%
Software 10.63%Infosys 4.65%Tata Consultancy Services 3.11%
Tech Mahindra 1.80%
Majesco 1.07%
Auto 10.45%Mahindra & Mahindra 2.94%Hero MotoCorp 2.59%Maruti Suzuki India 2.53%
Tata Motors 2.40%
Finance 7.13%HDFC 6.09%
Magma Fincorp 1.04%
Gas 4.18%
GAIL (India) 2.22%
Petronet LNG 1.96%
Petroleum Products 3.81%
Reliance Industries 1.95%
Name % of NAV
Indian Oil Corporation 1.86%
Pharmaceuticals 2.94%
Dishman Carbogen Amcis 1.01%
Cadila Healthcare 0.97%
Aurobindo Pharma 0.97%
Construction Project 2.69%Larsen & Toubro 2.69%
Cement 2.50%
Grasim Industries 2.50%
Industrial Capital Goods 2.49%
Bharat Electronics 2.49%
Non - Ferrous Metals 2.35%
Vedanta 2.35%
Consumer Durables 2.21%
Titan Company 1.15%
Khadim India 1.06%
Ferrous Metals 2.09%
Tata Steel 2.09%
Media & Entertainment 1.92%
Zee Entertainment Enterprises 1.92%
Oil 1.07%
Oil & Natural Gas Corporation 1.07%
Miscellaneous 1.01%
Amulya Leasing And Finance 1.01%
Textile Products 1.00%
Dollar Industries 1.00%
Power 0.95%
Nava Bharat Ventures 0.95%
Net Cash and Cash Equivalent 8.95%
Grand Total 100.00%
Size
Large Cap
Mid Cap
Small Cap
Style Growth Blend Value
11
IDFC Nifty FundAn Open Ended Index Linked Equity Scheme
31st March 2018
FUND FEATURES
INDUSTRY ALLOCATION
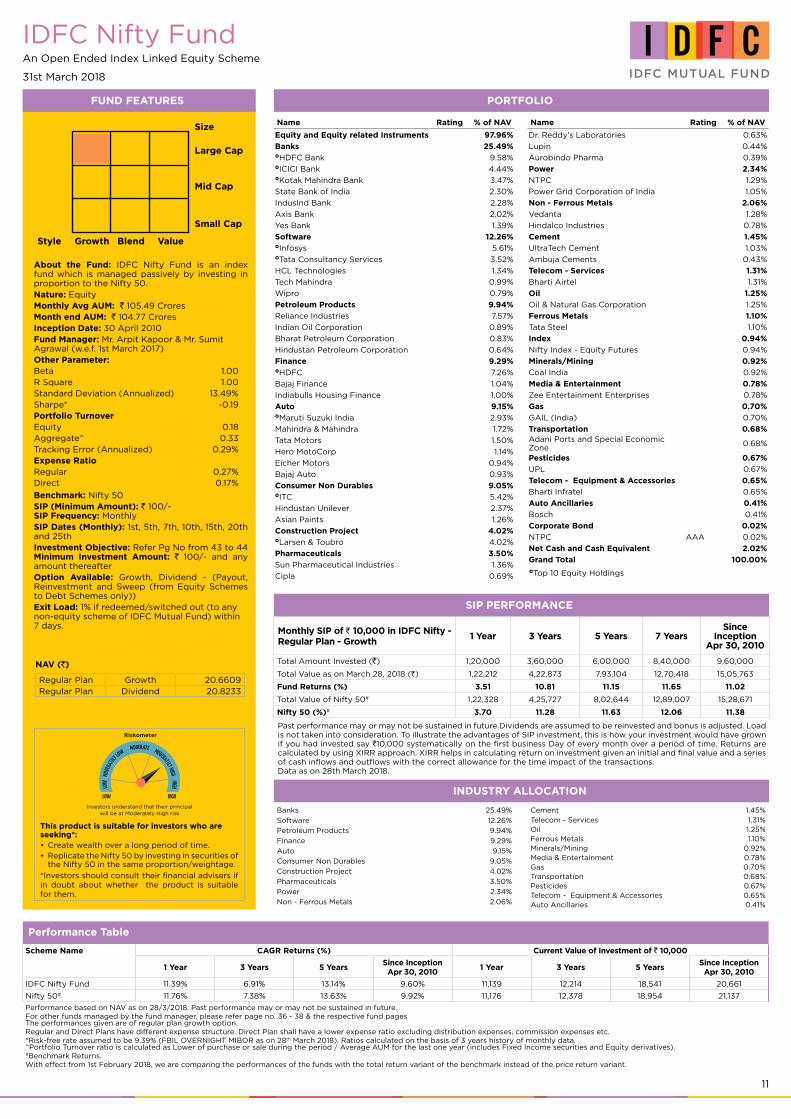
About the Fund: IDFC Nifty Fund is an index fund which is managed passively by investing in proportion to the Nifty 50.Nature: EquityMonthly Avg AUM: ` 105.49 Crores Month end AUM: ` 104.77 Crores Inception Date: 30 April 2010Fund Manager: Mr. Arpit Kapoor & Mr. Sumit Agrawal (w.e.f. 1st March 2017) Other Parameter:Beta 1.00R Square 1.00Standard Deviation (Annualized) 13.49%Sharpe* -0.19Portfolio TurnoverEquity 0.18Aggregate^ 0.33Tracking Error (Annualized) 0.29%Expense Ratio Regular 0.27%Direct 0.17%
Benchmark: Nifty 50 SIP (Minimum Amount): ` 100/- SIP Frequency: Monthly SIP Dates (Monthly): 1st, 5th, 7th, 10th, 15th, 20th and 25th Investment Objective: Refer Pg No from 43 to 44 Minimum Investment Amount: ` 100/- and any amount thereafterOption Available: Growth, Dividend - (Payout, Reinvestment and Sweep (from Equity Schemes to Debt Schemes only))Exit Load: 1% if redeemed/switched out (to any non-equity scheme of IDFC Mutual Fund) within 7 days.
Top 10 Equity Holdings
Banks 25.49%
Software 12.26%
Petroleum Products 9.94%
Finance 9.29%
Auto 9.15%
Consumer Non Durables 9.05%
Construction Project 4.02%
Pharmaceuticals 3.50%
Power 2.34%
Non - Ferrous Metals 2.06%
Performance Table
Scheme Name CAGR Returns (%) Current Value of Investment of ` 10,000
1 Year 3 Years 5 YearsSince InceptionApr 30, 2010
1 Year 3 Years 5 YearsSince InceptionApr 30, 2010
IDFC Nifty Fund 11.39% 6.91% 13.14% 9.60% 11,139 12,214 18,541 20,661
Nifty 50# 11.76% 7.38% 13.63% 9.92% 11,176 12,378 18,954 21,137
Performance based on NAV as on 28/3/2018. Past performance may or may not be sustained in future.For other funds managed by the fund manager, please refer page no. 36 - 38 & the respective fund pages The performances given are of regular plan growth option.Regular and Direct Plans have different expense structure. Direct Plan shall have a lower expense ratio excluding distribution expenses, commission expenses etc.*Risk-free rate assumed to be 9.39% (FBIL OVERNIGHT MIBOR as on 28th March 2018). Ratios calculated on the basis of 3 years history of monthly data. ^Portfolio Turnover ratio is calculated as Lower of purchase or sale during the period / Average AUM for the last one year (includes Fixed Income securities and Equity derivatives). #Benchmark Returns.With effect from 1st February 2018, we are comparing the performances of the funds with the total return variant of the benchmark instead of the price return variant.
SIP PERFORMANCE
Monthly SIP of ` 10,000 in IDFC Nifty - Regular Plan - Growth
1 Year 3 Years 5 Years 7 YearsSince
InceptionApr 30, 2010
Total Amount Invested (`) 1,20,000 3,60,000 6,00,000 8,40,000 9,60,000
Total Value as on March 28, 2018 (`) 1,22,212 4,22,873 7,93,104 12,70,418 15,05,763
Fund Returns (%) 3.51 10.81 11.15 11.65 11.02
Total Value of Nifty 50# 1,22,328 4,25,727 8,02,644 12,89,007 15,28,671
Nifty 50 (%)# 3.70 11.28 11.63 12.06 11.38
Past performance may or may not be sustained in future.Dividends are assumed to be reinvested and bonus is adjusted. Load is not taken into consideration. To illustrate the advantages of SIP investment, this is how your investment would have grown if you had invested say `10,000 systematically on the first business Day of every month over a period of time. Returns are calculated by using XIRR approach. XIRR helps in calculating return on investment given an initial and final value and a series of cash inflows and outflows with the correct allowance for the time impact of the transactions. Data as on 28th March 2018.
Riskometer
Investors understand that their principal will be at Moderately High risk
This product is suitable for investors who are seeking*:
Create wealth over a long period of time.•Replicate the Nifty 50 by investing in securities of •the Nifty 50 in the same proportion/weightage.
*Investors should consult their financial advisers if in doubt about whether the product is suitable for them.
Cement 1.45%Telecom - Services 1.31%Oil 1.25%Ferrous Metals 1.10%Minerals/Mining 0.92%Media & Entertainment 0.78%Gas 0.70%Transportation 0.68%Pesticides 0.67%Telecom - Equipment & Accessories 0.65%Auto Ancillaries 0.41%
NAV (`)
Regular Plan Growth 20.6609Regular Plan Dividend 20.8233
PORTFOLIO
Name Rating % of NAV
Equity and Equity related Instruments 97.96%
Banks 25.49%HDFC Bank 9.58%ICICI Bank 4.44%Kotak Mahindra Bank 3.47%
State Bank of India 2.30%
IndusInd Bank 2.28%
Axis Bank 2.02%
Yes Bank 1.39%
Software 12.26%Infosys 5.61%Tata Consultancy Services 3.52%
HCL Technologies 1.34%
Tech Mahindra 0.99%
Wipro 0.79%
Petroleum Products 9.94%
Reliance Industries 7.57%
Indian Oil Corporation 0.89%
Bharat Petroleum Corporation 0.83%
Hindustan Petroleum Corporation 0.64%
Finance 9.29%HDFC 7.26%
Bajaj Finance 1.04%
Indiabulls Housing Finance 1.00%
Auto 9.15%Maruti Suzuki India 2.93%
Mahindra & Mahindra 1.72%
Tata Motors 1.50%
Hero MotoCorp 1.14%
Eicher Motors 0.94%
Bajaj Auto 0.93%
Consumer Non Durables 9.05%ITC 5.42%
Hindustan Unilever 2.37%
Asian Paints 1.26%
Construction Project 4.02%Larsen & Toubro 4.02%
Pharmaceuticals 3.50%
Sun Pharmaceutical Industries 1.36%
Cipla 0.69%
Name Rating % of NAV
Dr. Reddy's Laboratories 0.63%
Lupin 0.44%
Aurobindo Pharma 0.39%
Power 2.34%
NTPC 1.29%
Power Grid Corporation of India 1.05%
Non - Ferrous Metals 2.06%
Vedanta 1.28%
Hindalco Industries 0.78%
Cement 1.45%
UltraTech Cement 1.03%
Ambuja Cements 0.43%
Telecom - Services 1.31%
Bharti Airtel 1.31%
Oil 1.25%
Oil & Natural Gas Corporation 1.25%
Ferrous Metals 1.10%
Tata Steel 1.10%
Index 0.94%
Nifty Index - Equity Futures 0.94%
Minerals/Mining 0.92%
Coal India 0.92%
Media & Entertainment 0.78%
Zee Entertainment Enterprises 0.78%
Gas 0.70%
GAIL (India) 0.70%
Transportation 0.68%Adani Ports and Special Economic Zone
0.68%
Pesticides 0.67%
UPL 0.67%
Telecom - Equipment & Accessories 0.65%
Bharti Infratel 0.65%
Auto Ancillaries 0.41%
Bosch 0.41%
Corporate Bond 0.02%
NTPC AAA 0.02%
Net Cash and Cash Equivalent 2.02%
Grand Total 100.00%
Size
Large Cap
Mid Cap
Small Cap
Style Growth Blend Value

12
IDFC Infrastructure Fund An open ended equity scheme investing in Infrastructure sector
31st March 2018
FUND FEATURES
INDUSTRY ALLOCATION
About the Fund: A dedicated Infrastructure fund, that invests across the infrastructure value chain with exclusions like Banking, Autos, IT, Pharma and FMCG. It is a diversified portfolio of companies that are participating in and benefitting from the Indian Infrastructure and Infrastructure related activities.
Nature: Equity
Monthly Avg AUM: ` 1,145.25 Crores
Month end AUM: ` 1,162.24 Crores
Inception Date: 8 March 2011
Fund Manager: Mr. Rajendra Kumar Mishra (w.e.f. 27th June 2013)
Other Parameter:
Beta 0.91
R Square 0.79
Standard Deviation (Annualized) 18.10%
Sharpe* 0.27
Portfolio Turnover
Equity 0.17 Aggregate^ 0.17
Expense Ratio
Regular 2.29%
Direct 0.43%
Benchmark: Nifty Infrastructure
SIP (Minimum Amount): ` 1,000/-
SIP Frequency: Monthly
SIP Dates (Monthly): 1st, 5th, 7th, 10th, 15th, 20th and 25th
Investment Objective: Refer Pg No from 43 to 44 Minimum Investment Amount: ` 5,000/- and any amount thereafter
Option Available: Growth, Dividend - (Payout, Reinvestment and Sweep (from Equity Schemes to Debt Schemes only))
Exit Load: 1.00% if redeemed before 365 days from the date of allotment.
Top 10 Equity Holdings
Construction Project 15.32%Construction 12.98%Transportation 11.01%Power 9.33%Industrial Capital Goods 7.68%Telecom - Services 6.54%Cement 5.41%Non - Ferrous Metals 3.83%Gas 3.83%Ferrous Metals 3.07%
Performance Table Regular Plan - GrowthScheme Name CAGR Returns (%) Current Value of Investment of ` 10,000
1 Year 3 Years 5 YearsSince Inception
Mar 08, 20111 Year 3 Years 5 Years
Since InceptionMar 08, 2011
IDFC Infrastructure Fund 20.13% 14.32% 18.55% 8.46% 12,013 14,930 23,425 17,738
Nifty Infrastructure# 8.98% 2.11% 10.02% 3.31% 10,898 10,646 16,124 12,585
Nifty 50## 11.76% 7.38% 13.63% 10.32% 11,176 12,378 18,954 20,004
Performance based on NAV as on 28/3/2018. Past performance may or may not be sustained in future.For other funds managed by the fund manager, please refer page no. 36 - 38 & the respective fund pages The performances given are of regular plan growth option.Regular and Direct Plans have different expense structure. Direct Plan shall have a lower expense ratio excluding distribution expenses, commission expenses etc.*Risk-free rate assumed to be 9.39% (FBIL OVERNIGHT MIBOR as on 28th March 2018). Ratios calculated on the basis of 3 years history of monthly data. ^Portfolio Turnover ratio is calculated as Lower of purchase or sale during the period / Average AUM for the last one year (includes Fixed Income securities and Equity derivatives). #Benchmark Returns. ##Alternate Benchmark Returns.With effect from 1st February 2018, we are comparing the performances of the funds with the total return variant of the benchmark instead of the price return variant.
Riskometer
Investors understand that their principal will be at High risk
This product is suitable for investors who are seeking*:
Create wealth over a long period of time.•Investment predominantly in equity and equity •related instruments of companies that are participating in and benefiting from growth in Indian infrastructure and infrastructural related activities.
*Investors should consult their financial advisers if in doubt about whether the product is suitable for them.
Oil 2.52%
Telecom - Equipment & Accessories 2.28%
Minerals/Mining 2.13%
Consumer Durables 1.73%
Engineering Services 1.27%
Finance 1.08%
Industrial Products 0.96%Hotels, Resorts And Other Recreational Activities
0.92%
NAV (`)
Regular Plan Growth 17.7351Regular Plan Dividend 16.6693
Size
Large Cap
Mid Cap
Small Cap
Style Growth Blend Value
PORTFOLIO
Name % of NAV
Equity and Equity related Instruments 91.89%
Construction Project 15.32%Larsen & Toubro 4.96%Engineers India 3.48%NCC 3.44%
Sadbhav Engineering 2.25%
H.G. Infra Engineering 1.19%
Techno Electric & Engineering Company 0.003%
Construction 12.98%PNC Infratech 3.39%
Dilip Buildcon 2.13%
Ahluwalia Contracts (India) 1.48%
J.Kumar Infraprojects 1.35%
Gayatri Projects 1.29%
ITD Cementation India 1.01%
NBCC (India) 0.82%
PSP Projects 0.75%
GPT Infraprojects 0.75%
Transportation 11.01%
InterGlobe Aviation 1.99%
Navkar Corporation 1.89%
Adani Ports and Special Economic Zone 1.80%
Container Corporation of India 1.71%
Gateway Distriparks 1.52%
Transport Corporation of India 1.13%
Future Supply Chain Solutions 0.98%
Power 9.33%NTPC 4.57%
Power Grid Corporation of India 1.89%
PTC India 1.87%
Torrent Power 0.86%
CESC 0.15%
Industrial Capital Goods 7.68%Cochin Shipyard 2.45%
Bharat Electronics 1.83%
Bharat Heavy Electricals 1.68%
ISGEC Heavy Engineering 1.09%
Praj Industries 0.63%
Name % of NAV
Telecom - Services 6.54%Bharti Airtel 4.97%
Idea Cellular 1.56%
Cement 5.41%JK Cement 2.53%
UltraTech Cement 1.89%
Sagar Cements 0.99%
Non - Ferrous Metals 3.83%Vedanta 2.49%
National Aluminium Company 1.34%
Gas 3.83%
Gujarat State Petronet 1.56%
GAIL (India) 1.41%
Gujarat Gas 0.85%
Ferrous Metals 3.07%
Jindal Steel & Power 1.18%
Jindal Saw 1.12%
Maharashtra Seamless 0.77%
Oil 2.52%Oil & Natural Gas Corporation 2.52%
Telecom - Equipment & Accessories 2.28%
Tejas Networks 2.28%
Minerals/Mining 2.13%
Coal India 2.13%
Consumer Durables 1.73%
Blue Star 1.73%
Engineering Services 1.27%
VA Tech Wabag 1.27%
Finance 1.08%
Indian Energy Exchange 0.92%
PTC India Financial Services 0.16%
Industrial Products 0.96%
Kirloskar Brothers 0.96%Hotels, Resorts And Other Recreational Activities 0.92%
Taj GVK Hotels & Resorts 0.92%
Net Cash and Cash Equivalent 8.11%
Grand Total 100.00%
SIP PERFORMANCE
Monthly SIP of ` 10,000 in IDFC Infrastructure Fund - Regular Plan - Growth
1 Year 3 Years 5 Years 7 YearsSince
InceptionMar 08, 2011
Total Amount Invested (`) 1,20,000 3,60,000 6,00,000 8,40,000 8,50,000
Total Value as on March 28, 2018 (`) 1,23,515 4,89,318 9,80,825 14,55,745 14,73,483
Fund Returns (%) 5.60 21.13 19.83 15.47 15.29
Total Values of Nifty Infrastructure# 1,19,264 4,07,067 7,28,518 10,65,888 10,78,473
Nifty Infrastructure (%)# -1.16 8.20 7.73 6.72 6.63
Total Value of Nifty 50## 1,22,328 4,25,727 8,02,644 12,89,007 13,09,011
Nifty 50 (%)## 3.70 11.28 11.63 12.06 12.01
Past performance may or may not be sustained in future.Dividends are assumed to be reinvested and bonus is adjusted. Load is not taken into consideration. To illustrate the advantages of SIP investment, this is how your investment would have grown if you had invested say `10,000 systematically on the first business Day of every month over a period of time. Returns are calculated by using XIRR approach. XIRR helps in calculating return on investment given an initial and final value and a series of cash inflows and outflows with the correct allowance for the time impact of the transactions. Data as on 28th March 2018.
13
IDFC Tax Advantage (ELSS) FundAn open ended equity linked saving scheme with a statutory lock in of 3 years and tax benefit
31st March 2018
FUND FEATURES
INDUSTRY ALLOCATION
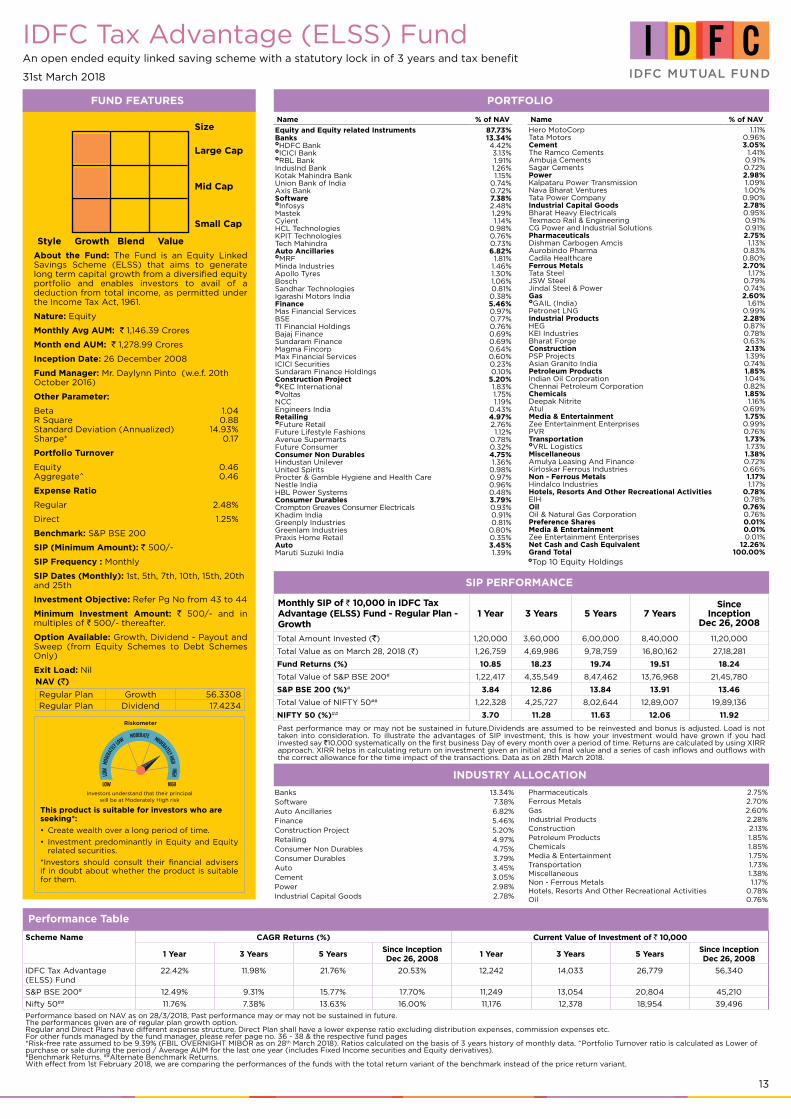
About the Fund: The Fund is an Equity Linked Savings Scheme (ELSS) that aims to generate long term capital growth from a diversified equity portfolio and enables investors to avail of a deduction from total income, as permitted under the Income Tax Act, 1961.
Nature: Equity
Monthly Avg AUM: ` 1,146.39 Crores
Month end AUM: ` 1,278.99 Crores
Inception Date: 26 December 2008
Fund Manager: Mr. Daylynn Pinto (w.e.f. 20th October 2016)
Other Parameter:
Beta 1.04 R Square 0.88 Standard Deviation (Annualized) 14.93% Sharpe* 0.17
Portfolio Turnover
Equity 0.46 Aggregate^ 0.46
Expense Ratio
Regular 2.48%
Direct 1.25%
Benchmark: S&P BSE 200
SIP (Minimum Amount): ` 500/-
SIP Frequency : Monthly
SIP Dates (Monthly): 1st, 5th, 7th, 10th, 15th, 20th and 25th
Investment Objective: Refer Pg No from 43 to 44
Minimum Investment Amount: ` 500/- and in multiples of ` 500/- thereafter.
Option Available: Growth, Dividend - Payout and Sweep (from Equity Schemes to Debt Schemes Only)
Exit Load: Nil
Top 10 Equity Holdings
Banks 13.34%Software 7.38%Auto Ancillaries 6.82%Finance 5.46%Construction Project 5.20%Retailing 4.97%Consumer Non Durables 4.75%Consumer Durables 3.79%Auto 3.45%Cement 3.05%Power 2.98%Industrial Capital Goods 2.78%
Performance Table
Scheme Name CAGR Returns (%) Current Value of Investment of ` 10,000
1 Year 3 Years 5 YearsSince InceptionDec 26, 2008
1 Year 3 Years 5 YearsSince InceptionDec 26, 2008
IDFC Tax Advantage (ELSS) Fund
22.42% 11.98% 21.76% 20.53% 12,242 14,033 26,779 56,340
S&P BSE 200# 12.49% 9.31% 15.77% 17.70% 11,249 13,054 20,804 45,210
Nifty 50## 11.76% 7.38% 13.63% 16.00% 11,176 12,378 18,954 39,496
Performance based on NAV as on 28/3/2018, Past performance may or may not be sustained in future. The performances given are of regular plan growth option. Regular and Direct Plans have different expense structure. Direct Plan shall have a lower expense ratio excluding distribution expenses, commission expenses etc. For other funds managed by the fund manager, please refer page no. 36 - 38 & the respective fund pages *Risk-free rate assumed to be 9.39% (FBIL OVERNIGHT MIBOR as on 28th March 2018). Ratios calculated on the basis of 3 years history of monthly data. ^Portfolio Turnover ratio is calculated as Lower of purchase or sale during the period / Average AUM for the last one year (includes Fixed Income securities and Equity derivatives). #Benchmark Returns. ##Alternate Benchmark Returns. With effect from 1st February 2018, we are comparing the performances of the funds with the total return variant of the benchmark instead of the price return variant.
SIP PERFORMANCE
Monthly SIP of ` 10,000 in IDFC Tax Advantage (ELSS) Fund - Regular Plan - Growth
1 Year 3 Years 5 Years 7 YearsSince
InceptionDec 26, 2008
Total Amount Invested (`) 1,20,000 3,60,000 6,00,000 8,40,000 11,20,000
Total Value as on March 28, 2018 (`) 1,26,759 4,69,986 9,78,759 16,80,162 27,18,281
Fund Returns (%) 10.85 18.23 19.74 19.51 18.24
Total Value of S&P BSE 200# 1,22,417 4,35,549 8,47,462 13,76,968 21,45,780
S&P BSE 200 (%)# 3.84 12.86 13.84 13.91 13.46
Total Value of NIFTY 50## 1,22,328 4,25,727 8,02,644 12,89,007 19,89,136
NIFTY 50 (%)## 3.70 11.28 11.63 12.06 11.92
Past performance may or may not be sustained in future.Dividends are assumed to be reinvested and bonus is adjusted. Load is not taken into consideration. To illustrate the advantages of SIP investment, this is how your investment would have grown if you had invested say `10,000 systematically on the first business Day of every month over a period of time. Returns are calculated by using XIRR approach. XIRR helps in calculating return on investment given an initial and final value and a series of cash inflows and outflows with the correct allowance for the time impact of the transactions. Data as on 28th March 2018.
Pharmaceuticals 2.75%Ferrous Metals 2.70%Gas 2.60%Industrial Products 2.28%Construction 2.13%Petroleum Products 1.85%Chemicals 1.85%Media & Entertainment 1.75%Transportation 1.73%Miscellaneous 1.38%Non - Ferrous Metals 1.17%Hotels, Resorts And Other Recreational Activities 0.78%Oil 0.76%
NAV (`)
Regular Plan Growth 56.3308Regular Plan Dividend 17.4234
Size
Large Cap
Mid Cap
Small Cap
Style Growth Blend Value
Riskometer
Investors understand that their principal will be at Moderately High risk
This product is suitable for investors who are seeking*:
Create wealth over a long period of time.•
Investment predominantly in Equity and Equity •related securities.
*Investors should consult their financial advisers if in doubt about whether the product is suitable for them.
PORTFOLIO
Name % of NAV
Equity and Equity related Instruments 87.73%Banks 13.34%HDFC Bank 4.42%ICICI Bank 3.13%RBL Bank 1.91%IndusInd Bank 1.26%Kotak Mahindra Bank 1.15%Union Bank of India 0.74%Axis Bank 0.72%Software 7.38%Infosys 2.48%Mastek 1.29%Cyient 1.14%HCL Technologies 0.98%KPIT Technologies 0.76%Tech Mahindra 0.73%Auto Ancillaries 6.82%MRF 1.81%Minda Industries 1.46%Apollo Tyres 1.30%Bosch 1.06%Sandhar Technologies 0.81%Igarashi Motors India 0.38%Finance 5.46%Mas Financial Services 0.97%BSE 0.77%TI Financial Holdings 0.76%Bajaj Finance 0.69%Sundaram Finance 0.69%Magma Fincorp 0.64%Max Financial Services 0.60%ICICI Securities 0.23%Sundaram Finance Holdings 0.10%Construction Project 5.20%KEC International 1.83%Voltas 1.75%NCC 1.19%Engineers India 0.43%Retailing 4.97%Future Retail 2.76%Future Lifestyle Fashions 1.12%Avenue Supermarts 0.78%Future Consumer 0.32%Consumer Non Durables 4.75%Hindustan Unilever 1.36%United Spirits 0.98%Procter & Gamble Hygiene and Health Care 0.97%Nestle India 0.96%HBL Power Systems 0.48%Consumer Durables 3.79%Crompton Greaves Consumer Electricals 0.93%Khadim India 0.91%Greenply Industries 0.81%Greenlam Industries 0.80%Praxis Home Retail 0.35%Auto 3.45%Maruti Suzuki India 1.39%
Name % of NAV
Hero MotoCorp 1.11%Tata Motors 0.96%Cement 3.05%The Ramco Cements 1.41%Ambuja Cements 0.91%Sagar Cements 0.72%Power 2.98%Kalpataru Power Transmission 1.09%Nava Bharat Ventures 1.00%Tata Power Company 0.90%Industrial Capital Goods 2.78%Bharat Heavy Electricals 0.95%Texmaco Rail & Engineering 0.91%CG Power and Industrial Solutions 0.91%Pharmaceuticals 2.75%Dishman Carbogen Amcis 1.13%Aurobindo Pharma 0.83%Cadila Healthcare 0.80%Ferrous Metals 2.70%Tata Steel 1.17%JSW Steel 0.79%Jindal Steel & Power 0.74%Gas 2.60%GAIL (India) 1.61%Petronet LNG 0.99%Industrial Products 2.28%HEG 0.87%KEI Industries 0.78%Bharat Forge 0.63%Construction 2.13%PSP Projects 1.39%Asian Granito India 0.74%Petroleum Products 1.85%Indian Oil Corporation 1.04%Chennai Petroleum Corporation 0.82%Chemicals 1.85%Deepak Nitrite 1.16%Atul 0.69%Media & Entertainment 1.75%Zee Entertainment Enterprises 0.99%PVR 0.76%Transportation 1.73%VRL Logistics 1.73%Miscellaneous 1.38%Amulya Leasing And Finance 0.72%Kirloskar Ferrous Industries 0.66%Non - Ferrous Metals 1.17%Hindalco Industries 1.17%Hotels, Resorts And Other Recreational Activities 0.78%EIH 0.78%Oil 0.76%Oil & Natural Gas Corporation 0.76%Preference Shares 0.01%Media & Entertainment 0.01%Zee Entertainment Enterprises 0.01%Net Cash and Cash Equivalent 12.26%Grand Total 100.00%
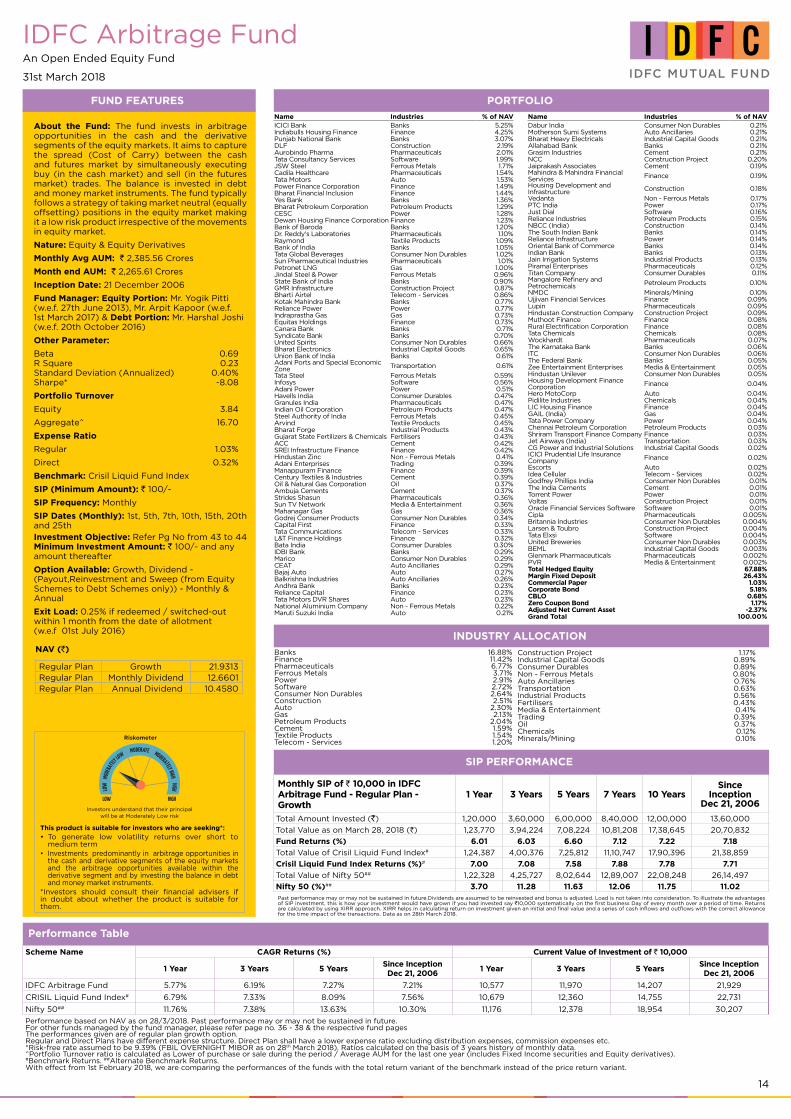
14
IDFC Arbitrage FundAn Open Ended Equity Fund
31st March 2018
FUND FEATURES
About the Fund: The fund invests in arbitrage opportunities in the cash and the derivative segments of the equity markets. It aims to capture the spread (Cost of Carry) between the cash and futures market by simultaneously executing buy (in the cash market) and sell (in the futures market) trades. The balance is invested in debt and money market instruments. The fund typically follows a strategy of taking market neutral (equally offsetting) positions in the equity market making it a low risk product irrespective of the movements in equity market.
Nature: Equity & Equity Derivatives
Monthly Avg AUM: ` 2,385.56 Crores
Month end AUM: ` 2,265.61 Crores
Inception Date: 21 December 2006
Fund Manager: Equity Portion: Mr. Yogik Pitti (w.e.f. 27th June 2013), Mr. Arpit Kapoor (w.e.f. 1st March 2017) & Debt Portion: Mr. Harshal Joshi (w.e.f. 20th October 2016)
Other Parameter:
Beta 0.69 R Square 0.23 Standard Deviation (Annualized) 0.40% Sharpe* -8.08
Portfolio Turnover
Equity 3.84
Aggregate^ 16.70
Expense Ratio
Regular 1.03%
Direct 0.32%
Benchmark: Crisil Liquid Fund Index
SIP (Minimum Amount): ` 100/-
SIP Frequency: Monthly
SIP Dates (Monthly): 1st, 5th, 7th, 10th, 15th, 20th and 25th Investment Objective: Refer Pg No from 43 to 44 Minimum Investment Amount: ` 100/- and any amount thereafter
Option Available: Growth, Dividend - (Payout,Reinvestment and Sweep (from Equity Schemes to Debt Schemes only)) - Monthly & Annual
Exit Load: 0.25% if redeemed / switched-out within 1 month from the date of allotment (w.e.f 01st July 2016)
Performance Table
Scheme Name CAGR Returns (%) Current Value of Investment of ` 10,000
1 Year 3 Years 5 YearsSince InceptionDec 21, 2006
1 Year 3 Years 5 YearsSince InceptionDec 21, 2006
IDFC Arbitrage Fund 5.77% 6.19% 7.27% 7.21% 10,577 11,970 14,207 21,929
CRISIL Liquid Fund Index# 6.79% 7.33% 8.09% 7.56% 10,679 12,360 14,755 22,731
Nifty 50## 11.76% 7.38% 13.63% 10.30% 11,176 12,378 18,954 30,207
Performance based on NAV as on 28/3/2018. Past performance may or may not be sustained in future.For other funds managed by the fund manager, please refer page no. 36 - 38 & the respective fund pages The performances given are of regular plan growth option.Regular and Direct Plans have different expense structure. Direct Plan shall have a lower expense ratio excluding distribution expenses, commission expenses etc.*Risk-free rate assumed to be 9.39% (FBIL OVERNIGHT MIBOR as on 28th March 2018). Ratios calculated on the basis of 3 years history of monthly data. ^Portfolio Turnover ratio is calculated as Lower of purchase or sale during the period / Average AUM for the last one year (includes Fixed Income securities and Equity derivatives). #Benchmark Returns. ##Alternate Benchmark Returns. With effect from 1st February 2018, we are comparing the performances of the funds with the total return variant of the benchmark instead of the price return variant.
SIP PERFORMANCE
Monthly SIP of ` 10,000 in IDFC Arbitrage Fund - Regular Plan - Growth
1 Year 3 Years 5 Years 7 Years 10 YearsSince
InceptionDec 21, 2006
Total Amount Invested (`) 1,20,000 3,60,000 6,00,000 8,40,000 12,00,000 13,60,000
Total Value as on March 28, 2018 (`) 1,23,770 3,94,224 7,08,224 10,81,208 17,38,645 20,70,832
Fund Returns (%) 6.01 6.03 6.60 7.12 7.22 7.18
Total Value of Crisil Liquid Fund Index# 1,24,387 4,00,376 7,25,812 11,10,747 17,90,396 21,38,859
Crisil Liquid Fund Index Returns (%)# 7.00 7.08 7.58 7.88 7.78 7.71
Total Value of Nifty 50## 1,22,328 4,25,727 8,02,644 12,89,007 22,08,248 26,14,497
Nifty 50 (%)## 3.70 11.28 11.63 12.06 11.75 11.02Past performance may or may not be sustained in future.Dividends are assumed to be reinvested and bonus is adjusted. Load is not taken into consideration. To illustrate the advantages of SIP investment, this is how your investment would have grown if you had invested say `10,000 systematically on the first business Day of every month over a period of time. Returns are calculated by using XIRR approach. XIRR helps in calculating return on investment given an initial and final value and a series of cash inflows and outflows with the correct allowance for the time impact of the transactions. Data as on 28th March 2018.
INDUSTRY ALLOCATION
Banks 16.88%Finance 11.42%Pharmaceuticals 6.77%Ferrous Metals 3.71%Power 2.91%Software 2.72%Consumer Non Durables 2.64%Construction 2.51%Auto 2.30%Gas 2.13%Petroleum Products 2.04%Cement 1.59%Textile Products 1.54%Telecom - Services 1.20%
Construction Project 1.17%Industrial Capital Goods 0.89%Consumer Durables 0.89%Non - Ferrous Metals 0.80%Auto Ancillaries 0.76%Transportation 0.63%Industrial Products 0.56%Fertilisers 0.43%Media & Entertainment 0.41%Trading 0.39%Oil 0.37%Chemicals 0.12%Minerals/Mining 0.10%
NAV (`)
Regular Plan Growth 21.9313Regular Plan Monthly Dividend 12.6601Regular Plan Annual Dividend 10.4580
Riskometer
Investors understand that their principal will be at Moderately Low risk
This product is suitable for investors who are seeking*:
To generate low volatility returns over short to •medium termInvestments predominantly in arbitrage opportunities in •the cash and derivative segments of the equity markets and the arbitrage opportunities available within the derivative segment and by investing the balance in debt and money market instruments.
*Investors should consult their financial advisers if in doubt about whether the product is suitable for them.
PORTFOLIO
Name Industries % of NAVICICI Bank Banks 5.25%Indiabulls Housing Finance Finance 4.25%Punjab National Bank Banks 3.07%DLF Construction 2.19%Aurobindo Pharma Pharmaceuticals 2.01%Tata Consultancy Services Software 1.99%JSW Steel Ferrous Metals 1.71%Cadila Healthcare Pharmaceuticals 1.54%Tata Motors Auto 1.53%Power Finance Corporation Finance 1.49%Bharat Financial Inclusion Finance 1.44%Yes Bank Banks 1.36%Bharat Petroleum Corporation Petroleum Products 1.29%CESC Power 1.28%Dewan Housing Finance Corporation Finance 1.23%Bank of Baroda Banks 1.20%Dr. Reddy's Laboratories Pharmaceuticals 1.10%Raymond Textile Products 1.09%Bank of India Banks 1.05%Tata Global Beverages Consumer Non Durables 1.02%Sun Pharmaceutical Industries Pharmaceuticals 1.01%Petronet LNG Gas 1.00%Jindal Steel & Power Ferrous Metals 0.96%State Bank of India Banks 0.90%GMR Infrastructure Construction Project 0.87%Bharti Airtel Telecom - Services 0.86%Kotak Mahindra Bank Banks 0.77%Reliance Power Power 0.77%Indraprastha Gas Gas 0.73%Equitas Holdings Finance 0.73%Canara Bank Banks 0.71%Syndicate Bank Banks 0.70%United Spirits Consumer Non Durables 0.66%Bharat Electronics Industrial Capital Goods 0.65%Union Bank of India Banks 0.61%Adani Ports and Special Economic Zone Transportation 0.61%
Tata Steel Ferrous Metals 0.59%Infosys Software 0.56%Adani Power Power 0.51%Havells India Consumer Durables 0.47%Granules India Pharmaceuticals 0.47%Indian Oil Corporation Petroleum Products 0.47%Steel Authority of India Ferrous Metals 0.45%Arvind Textile Products 0.45%Bharat Forge Industrial Products 0.43%Gujarat State Fertilizers & Chemicals Fertilisers 0.43%ACC Cement 0.42%SREI Infrastructure Finance Finance 0.42%Hindustan Zinc Non - Ferrous Metals 0.41%Adani Enterprises Trading 0.39%Manappuram Finance Finance 0.39%Century Textiles & Industries Cement 0.39%Oil & Natural Gas Corporation Oil 0.37%Ambuja Cements Cement 0.37%Strides Shasun Pharmaceuticals 0.36%Sun TV Network Media & Entertainment 0.36%Mahanagar Gas Gas 0.36%Godrej Consumer Products Consumer Non Durables 0.34%Capital First Finance 0.33%Tata Communications Telecom - Services 0.33%L&T Finance Holdings Finance 0.32%Bata India Consumer Durables 0.30%IDBI Bank Banks 0.29%Marico Consumer Non Durables 0.29%CEAT Auto Ancillaries 0.29%Bajaj Auto Auto 0.27%Balkrishna Industries Auto Ancillaries 0.26%Andhra Bank Banks 0.23%Reliance Capital Finance 0.23%Tata Motors DVR Shares Auto 0.23%National Aluminium Company Non - Ferrous Metals 0.22%Maruti Suzuki India Auto 0.21%
Name Industries % of NAVDabur India Consumer Non Durables 0.21%Motherson Sumi Systems Auto Ancillaries 0.21%Bharat Heavy Electricals Industrial Capital Goods 0.21%Allahabad Bank Banks 0.21%Grasim Industries Cement 0.21%NCC Construction Project 0.20%Jaiprakash Associates Cement 0.19%Mahindra & Mahindra Financial Services Finance 0.19%
Housing Development and Infrastructure Construction 0.18%
Vedanta Non - Ferrous Metals 0.17%PTC India Power 0.17%Just Dial Software 0.16%Reliance Industries Petroleum Products 0.15%NBCC (India) Construction 0.14%The South Indian Bank Banks 0.14%Reliance Infrastructure Power 0.14%Oriental Bank of Commerce Banks 0.14%Indian Bank Banks 0.13%Jain Irrigation Systems Industrial Products 0.13%Piramal Enterprises Pharmaceuticals 0.12%Titan Company Consumer Durables 0.11%Mangalore Refinery and Petrochemicals Petroleum Products 0.10%
NMDC Minerals/Mining 0.10%Ujjivan Financial Services Finance 0.09%Lupin Pharmaceuticals 0.09%Hindustan Construction Company Construction Project 0.09%Muthoot Finance Finance 0.08%Rural Electrification Corporation Finance 0.08%Tata Chemicals Chemicals 0.08%Wockhardt Pharmaceuticals 0.07%The Karnataka Bank Banks 0.06%ITC Consumer Non Durables 0.06%The Federal Bank Banks 0.05%Zee Entertainment Enterprises Media & Entertainment 0.05%Hindustan Unilever Consumer Non Durables 0.05%Housing Development Finance Corporation Finance 0.04%
Hero MotoCorp Auto 0.04%Pidilite Industries Chemicals 0.04%LIC Housing Finance Finance 0.04%GAIL (India) Gas 0.04%Tata Power Company Power 0.04%Chennai Petroleum Corporation Petroleum Products 0.03%Shriram Transport Finance Company Finance 0.03%Jet Airways (India) Transportation 0.03%CG Power and Industrial Solutions Industrial Capital Goods 0.02%ICICI Prudential Life Insurance Company Finance 0.02%
Escorts Auto 0.02%Idea Cellular Telecom - Services 0.02%Godfrey Phillips India Consumer Non Durables 0.01%The India Cements Cement 0.01%Torrent Power Power 0.01%Voltas Construction Project 0.01%Oracle Financial Services Software Software 0.01%Cipla Pharmaceuticals 0.005%Britannia Industries Consumer Non Durables 0.004%Larsen & Toubro Construction Project 0.004%Tata Elxsi Software 0.004%United Breweries Consumer Non Durables 0.003%BEML Industrial Capital Goods 0.003%Glenmark Pharmaceuticals Pharmaceuticals 0.002%PVR Media & Entertainment 0.002%Total Hedged Equity 67.88%Margin Fixed Deposit 26.43%Commercial Paper 1.03%Corporate Bond 5.18%CBLO 0.68%Zero Coupon Bond 1.17%Adjusted Net Current Asset -2.37%Grand Total 100.00%
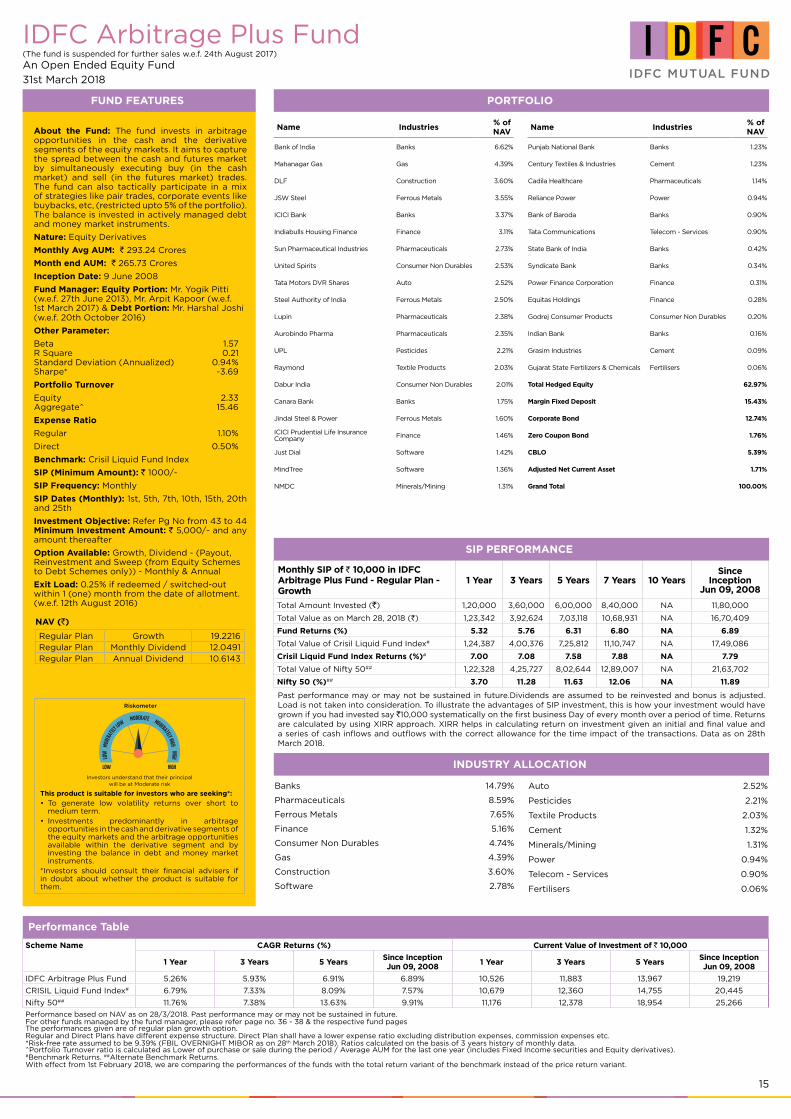
15
IDFC Arbitrage Plus Fund(The fund is suspended for further sales w.e.f. 24th August 2017)
An Open Ended Equity Fund
31st March 2018
FUND FEATURES
INDUSTRY ALLOCATION
About the Fund: The fund invests in arbitrage opportunities in the cash and the derivative segments of the equity markets. It aims to capture the spread between the cash and futures market by simultaneously executing buy (in the cash market) and sell (in the futures market) trades. The fund can also tactically participate in a mix of strategies like pair trades, corporate events like buybacks, etc, (restricted upto 5% of the portfolio). The balance is invested in actively managed debt and money market instruments.
Nature: Equity Derivatives
Monthly Avg AUM: ` 293.24 Crores
Month end AUM: ` 265.73 Crores
Inception Date: 9 June 2008
Fund Manager: Equity Portion: Mr. Yogik Pitti (w.e.f. 27th June 2013), Mr. Arpit Kapoor (w.e.f. 1st March 2017) & Debt Portion: Mr. Harshal Joshi (w.e.f. 20th October 2016)
Other Parameter:
Beta 1.57 R Square 0.21 Standard Deviation (Annualized) 0.94% Sharpe* -3.69
Portfolio Turnover
Equity 2.33 Aggregate^ 15.46
Expense Ratio
Regular 1.10%
Direct 0.50%
Benchmark: Crisil Liquid Fund Index
SIP (Minimum Amount): ` 1000/-
SIP Frequency: Monthly
SIP Dates (Monthly): 1st, 5th, 7th, 10th, 15th, 20th and 25th
Investment Objective: Refer Pg No from 43 to 44 Minimum Investment Amount: ` 5,000/- and any amount thereafter
Option Available: Growth, Dividend - (Payout, Reinvestment and Sweep (from Equity Schemes to Debt Schemes only)) - Monthly & Annual
Exit Load: 0.25% if redeemed / switched-out within 1 (one) month from the date of allotment. (w.e.f. 12th August 2016)
Banks 14.79%
Pharmaceuticals 8.59%
Ferrous Metals 7.65%
Finance 5.16%
Consumer Non Durables 4.74%
Gas 4.39%
Construction 3.60%
Software 2.78%
Performance Table
Scheme Name CAGR Returns (%) Current Value of Investment of ` 10,000
1 Year 3 Years 5 YearsSince InceptionJun 09, 2008
1 Year 3 Years 5 YearsSince InceptionJun 09, 2008
IDFC Arbitrage Plus Fund 5.26% 5.93% 6.91% 6.89% 10,526 11,883 13,967 19,219
CRISIL Liquid Fund Index# 6.79% 7.33% 8.09% 7.57% 10,679 12,360 14,755 20,445
Nifty 50## 11.76% 7.38% 13.63% 9.91% 11,176 12,378 18,954 25,266
Performance based on NAV as on 28/3/2018. Past performance may or may not be sustained in future.For other funds managed by the fund manager, please refer page no. 36 - 38 & the respective fund pages The performances given are of regular plan growth option.Regular and Direct Plans have different expense structure. Direct Plan shall have a lower expense ratio excluding distribution expenses, commission expenses etc.*Risk-free rate assumed to be 9.39% (FBIL OVERNIGHT MIBOR as on 28th March 2018). Ratios calculated on the basis of 3 years history of monthly data. ^Portfolio Turnover ratio is calculated as Lower of purchase or sale during the period / Average AUM for the last one year (includes Fixed Income securities and Equity derivatives). #Benchmark Returns. ##Alternate Benchmark Returns. With effect from 1st February 2018, we are comparing the performances of the funds with the total return variant of the benchmark instead of the price return variant.
SIP PERFORMANCE
Monthly SIP of ` 10,000 in IDFC Arbitrage Plus Fund - Regular Plan - Growth
1 Year 3 Years 5 Years 7 Years 10 YearsSince
InceptionJun 09, 2008
Total Amount Invested (`) 1,20,000 3,60,000 6,00,000 8,40,000 NA 11,80,000
Total Value as on March 28, 2018 (`) 1,23,342 3,92,624 7,03,118 10,68,931 NA 16,70,409
Fund Returns (%) 5.32 5.76 6.31 6.80 NA 6.89
Total Value of Crisil Liquid Fund Index# 1,24,387 4,00,376 7,25,812 11,10,747 NA 17,49,086
Crisil Liquid Fund Index Returns (%)# 7.00 7.08 7.58 7.88 NA 7.79
Total Value of Nifty 50## 1,22,328 4,25,727 8,02,644 12,89,007 NA 21,63,702
Nifty 50 (%)## 3.70 11.28 11.63 12.06 NA 11.89
Past performance may or may not be sustained in future.Dividends are assumed to be reinvested and bonus is adjusted. Load is not taken into consideration. To illustrate the advantages of SIP investment, this is how your investment would have grown if you had invested say `10,000 systematically on the first business Day of every month over a period of time. Returns are calculated by using XIRR approach. XIRR helps in calculating return on investment given an initial and final value and a series of cash inflows and outflows with the correct allowance for the time impact of the transactions. Data as on 28th March 2018.
Auto 2.52%
Pesticides 2.21%
Textile Products 2.03%
Cement 1.32%
Minerals/Mining 1.31%
Power 0.94%
Telecom - Services 0.90%
Fertilisers 0.06%
NAV (`)
Regular Plan Growth 19.2216Regular Plan Monthly Dividend 12.0491Regular Plan Annual Dividend 10.6143
Riskometer
Investors understand that their principal will be at Moderate risk
This product is suitable for investors who are seeking*:
To generate low volatility returns over short to •medium term.Investments predominantly in arbitrage •opportunities in the cash and derivative segments of the equity markets and the arbitrage opportunities available within the derivative segment and by investing the balance in debt and money market instruments.
*Investors should consult their financial advisers if in doubt about whether the product is suitable for them.
PORTFOLIO
Name Industries% of NAV
Bank of India Banks 6.62%
Mahanagar Gas Gas 4.39%
DLF Construction 3.60%
JSW Steel Ferrous Metals 3.55%
ICICI Bank Banks 3.37%
Indiabulls Housing Finance Finance 3.11%
Sun Pharmaceutical Industries Pharmaceuticals 2.73%
United Spirits Consumer Non Durables 2.53%
Tata Motors DVR Shares Auto 2.52%
Steel Authority of India Ferrous Metals 2.50%
Lupin Pharmaceuticals 2.38%
Aurobindo Pharma Pharmaceuticals 2.35%
UPL Pesticides 2.21%
Raymond Textile Products 2.03%
Dabur India Consumer Non Durables 2.01%
Canara Bank Banks 1.75%
Jindal Steel & Power Ferrous Metals 1.60%
ICICI Prudential Life Insurance Company Finance 1.46%
Just Dial Software 1.42%
MindTree Software 1.36%
NMDC Minerals/Mining 1.31%
Name Industries% of NAV
Punjab National Bank Banks 1.23%
Century Textiles & Industries Cement 1.23%
Cadila Healthcare Pharmaceuticals 1.14%
Reliance Power Power 0.94%
Bank of Baroda Banks 0.90%
Tata Communications Telecom - Services 0.90%
State Bank of India Banks 0.42%
Syndicate Bank Banks 0.34%
Power Finance Corporation Finance 0.31%
Equitas Holdings Finance 0.28%
Godrej Consumer Products Consumer Non Durables 0.20%
Indian Bank Banks 0.16%
Grasim Industries Cement 0.09%
Gujarat State Fertilizers & Chemicals Fertilisers 0.06%
Total Hedged Equity 62.97%
Margin Fixed Deposit 15.43%
Corporate Bond 12.74%
Zero Coupon Bond 1.76%
CBLO 5.39%
Adjusted Net Current Asset 1.71%
Grand Total 100.00%
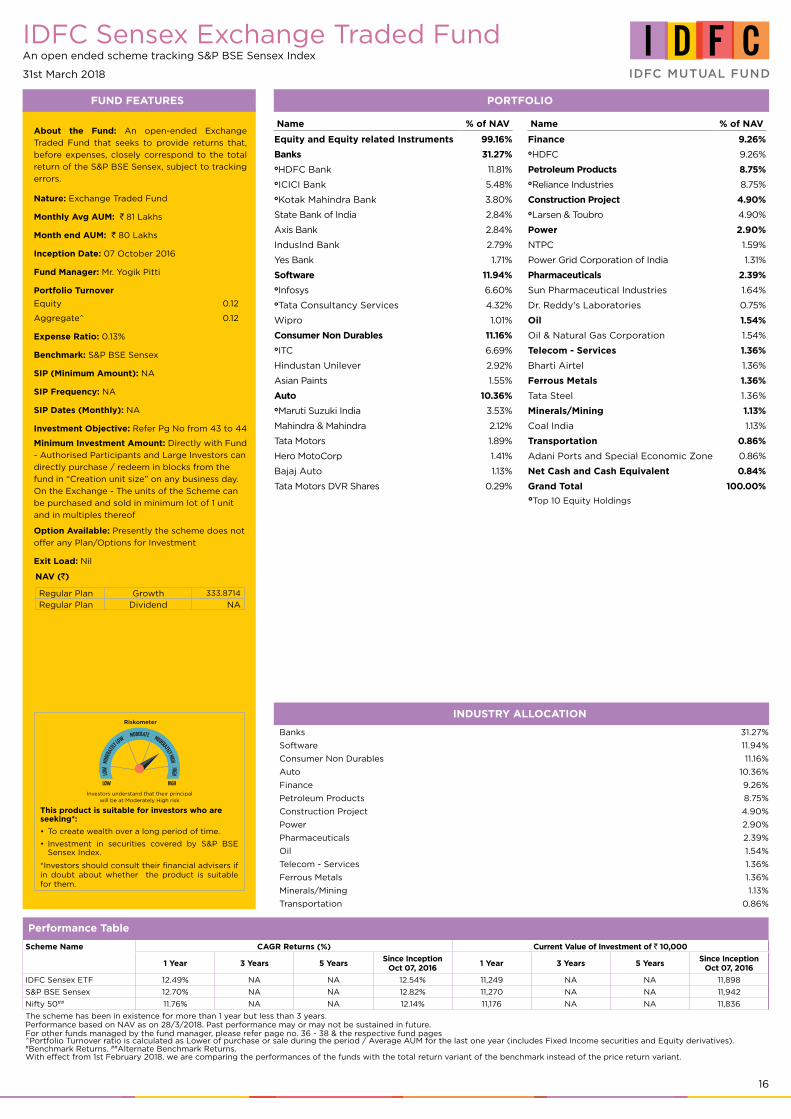
16
Banks 31.27%
Software 11.94%
Consumer Non Durables 11.16%
Auto 10.36%
Finance 9.26%
Petroleum Products 8.75%
Construction Project 4.90%
Power 2.90%
Pharmaceuticals 2.39%
Oil 1.54%
Telecom - Services 1.36%
Ferrous Metals 1.36%
Minerals/Mining 1.13%
Transportation 0.86%
IDFC Sensex Exchange Traded FundAn open ended scheme tracking S&P BSE Sensex Index
31st March 2018
FUND FEATURES
INDUSTRY ALLOCATION
About the Fund: An open-ended Exchange
Traded Fund that seeks to provide returns that,
before expenses, closely correspond to the total
return of the S&P BSE Sensex, subject to tracking
errors.
Nature: Exchange Traded Fund
Monthly Avg AUM: ` 81 Lakhs
Month end AUM: ` 80 Lakhs
Inception Date: 07 October 2016
Fund Manager: Mr. Yogik Pitti
Portfolio Turnover
Equity 0.12
Aggregate^ 0.12
Expense Ratio: 0.13%
Benchmark: S&P BSE Sensex
SIP (Minimum Amount): NA
SIP Frequency: NA
SIP Dates (Monthly): NA
Investment Objective: Refer Pg No from 43 to 44
Minimum Investment Amount: Directly with Fund
- Authorised Participants and Large Investors can
directly purchase / redeem in blocks from the
fund in “Creation unit size” on any business day.
On the Exchange - The units of the Scheme can
be purchased and sold in minimum lot of 1 unit
and in multiples thereof
Option Available: Presently the scheme does not
offer any Plan/Options for Investment
Exit Load: Nil
Performance Table
Scheme Name CAGR Returns (%) Current Value of Investment of ` 10,000
1 Year 3 Years 5 YearsSince Inception
Oct 07, 20161 Year 3 Years 5 Years
Since InceptionOct 07, 2016
IDFC Sensex ETF 12.49% NA NA 12.54% 11,249 NA NA 11,898
S&P BSE Sensex 12.70% NA NA 12.82% 11,270 NA NA 11,942
Nifty 50## 11.76% NA NA 12.14% 11,176 NA NA 11,836
The scheme has been in existence for more than 1 year but less than 3 years.Performance based on NAV as on 28/3/2018. Past performance may or may not be sustained in future.For other funds managed by the fund manager, please refer page no. 36 - 38 & the respective fund pages ^Portfolio Turnover ratio is calculated as Lower of purchase or sale during the period / Average AUM for the last one year (includes Fixed Income securities and Equity derivatives). #Benchmark Returns. ##Alternate Benchmark Returns. With effect from 1st February 2018, we are comparing the performances of the funds with the total return variant of the benchmark instead of the price return variant.
NAV (`)
Regular Plan Growth 333.8714
Regular Plan Dividend NA
PORTFOLIO
Name % of NAV
Equity and Equity related Instruments 99.16%
Banks 31.27%HDFC Bank 11.81%ICICI Bank 5.48%Kotak Mahindra Bank 3.80%
State Bank of India 2.84%
Axis Bank 2.84%
IndusInd Bank 2.79%
Yes Bank 1.71%
Software 11.94%Infosys 6.60%Tata Consultancy Services 4.32%
Wipro 1.01%
Consumer Non Durables 11.16%ITC 6.69%
Hindustan Unilever 2.92%
Asian Paints 1.55%
Auto 10.36%Maruti Suzuki India 3.53%
Mahindra & Mahindra 2.12%
Tata Motors 1.89%
Hero MotoCorp 1.41%
Bajaj Auto 1.13%
Tata Motors DVR Shares 0.29%
Name % of NAV
Finance 9.26%HDFC 9.26%
Petroleum Products 8.75%Reliance Industries 8.75%
Construction Project 4.90%Larsen & Toubro 4.90%
Power 2.90%
NTPC 1.59%
Power Grid Corporation of India 1.31%
Pharmaceuticals 2.39%
Sun Pharmaceutical Industries 1.64%
Dr. Reddy's Laboratories 0.75%
Oil 1.54%
Oil & Natural Gas Corporation 1.54%
Telecom - Services 1.36%
Bharti Airtel 1.36%
Ferrous Metals 1.36%
Tata Steel 1.36%
Minerals/Mining 1.13%
Coal India 1.13%
Transportation 0.86%
Adani Ports and Special Economic Zone 0.86%
Net Cash and Cash Equivalent 0.84%
Grand Total 100.00%
Riskometer
Investors understand that their principal will be at Moderately High risk
This product is suitable for investors who are seeking*:
To create wealth over a long period of time.•
Investment in securities covered by S&P BSE •Sensex Index.
*Investors should consult their financial advisers if in doubt about whether the product is suitable for them.
Top 10 Equity Holdings
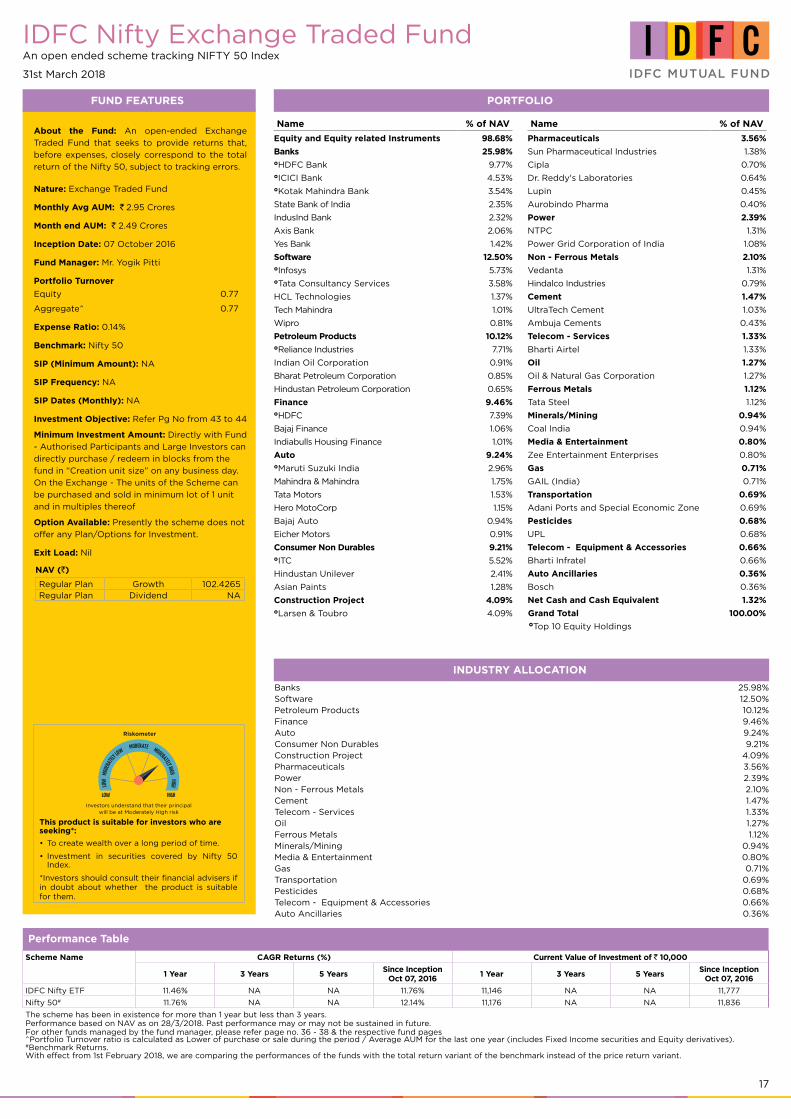
17
IDFC Nifty Exchange Traded FundAn open ended scheme tracking NIFTY 50 Index
31st March 2018
FUND FEATURES
INDUSTRY ALLOCATION
About the Fund: An open-ended Exchange
Traded Fund that seeks to provide returns that,
before expenses, closely correspond to the total
return of the Nifty 50, subject to tracking errors.
Nature: Exchange Traded Fund
Monthly Avg AUM: ` 2.95 Crores
Month end AUM: ` 2.49 Crores
Inception Date: 07 October 2016
Fund Manager: Mr. Yogik Pitti
Portfolio Turnover
Equity 0.77
Aggregate^ 0.77
Expense Ratio: 0.14%
Benchmark: Nifty 50
SIP (Minimum Amount): NA
SIP Frequency: NA
SIP Dates (Monthly): NA
Investment Objective: Refer Pg No from 43 to 44
Minimum Investment Amount: Directly with Fund
- Authorised Participants and Large Investors can
directly purchase / redeem in blocks from the
fund in “Creation unit size” on any business day.
On the Exchange - The units of the Scheme can
be purchased and sold in minimum lot of 1 unit
and in multiples thereof
Option Available: Presently the scheme does not
offer any Plan/Options for Investment.
Exit Load: Nil
Performance Table
Scheme Name CAGR Returns (%) Current Value of Investment of ` 10,000
1 Year 3 Years 5 YearsSince Inception
Oct 07, 20161 Year 3 Years 5 Years
Since InceptionOct 07, 2016
IDFC Nifty ETF 11.46% NA NA 11.76% 11,146 NA NA 11,777
Nifty 50# 11.76% NA NA 12.14% 11,176 NA NA 11,836
The scheme has been in existence for more than 1 year but less than 3 years.Performance based on NAV as on 28/3/2018. Past performance may or may not be sustained in future.For other funds managed by the fund manager, please refer page no. 36 - 38 & the respective fund pages ^Portfolio Turnover ratio is calculated as Lower of purchase or sale during the period / Average AUM for the last one year (includes Fixed Income securities and Equity derivatives). #Benchmark Returns. With effect from 1st February 2018, we are comparing the performances of the funds with the total return variant of the benchmark instead of the price return variant.
NAV (`)
Regular Plan Growth 102.4265Regular Plan Dividend NA
PORTFOLIO
Name % of NAV
Equity and Equity related Instruments 98.68%
Banks 25.98%HDFC Bank 9.77%ICICI Bank 4.53%Kotak Mahindra Bank 3.54%
State Bank of India 2.35%
IndusInd Bank 2.32%
Axis Bank 2.06%
Yes Bank 1.42%
Software 12.50%Infosys 5.73%Tata Consultancy Services 3.58%
HCL Technologies 1.37%
Tech Mahindra 1.01%
Wipro 0.81%
Petroleum Products 10.12%Reliance Industries 7.71%
Indian Oil Corporation 0.91%
Bharat Petroleum Corporation 0.85%
Hindustan Petroleum Corporation 0.65%
Finance 9.46%HDFC 7.39%
Bajaj Finance 1.06%
Indiabulls Housing Finance 1.01%
Auto 9.24%Maruti Suzuki India 2.96%
Mahindra & Mahindra 1.75%
Tata Motors 1.53%
Hero MotoCorp 1.15%
Bajaj Auto 0.94%
Eicher Motors 0.91%
Consumer Non Durables 9.21%ITC 5.52%
Hindustan Unilever 2.41%
Asian Paints 1.28%
Construction Project 4.09%Larsen & Toubro 4.09%
Name % of NAV
Pharmaceuticals 3.56%
Sun Pharmaceutical Industries 1.38%
Cipla 0.70%
Dr. Reddy's Laboratories 0.64%
Lupin 0.45%
Aurobindo Pharma 0.40%
Power 2.39%
NTPC 1.31%
Power Grid Corporation of India 1.08%
Non - Ferrous Metals 2.10%
Vedanta 1.31%
Hindalco Industries 0.79%
Cement 1.47%
UltraTech Cement 1.03%
Ambuja Cements 0.43%
Telecom - Services 1.33%
Bharti Airtel 1.33%
Oil 1.27%
Oil & Natural Gas Corporation 1.27%
Ferrous Metals 1.12%
Tata Steel 1.12%
Minerals/Mining 0.94%
Coal India 0.94%
Media & Entertainment 0.80%
Zee Entertainment Enterprises 0.80%
Gas 0.71%
GAIL (India) 0.71%
Transportation 0.69%
Adani Ports and Special Economic Zone 0.69%
Pesticides 0.68%
UPL 0.68%
Telecom - Equipment & Accessories 0.66%
Bharti Infratel 0.66%
Auto Ancillaries 0.36%
Bosch 0.36%
Net Cash and Cash Equivalent 1.32%
Grand Total 100.00%
Riskometer
Investors understand that their principal will be at Moderately High risk
This product is suitable for investors who are seeking*:
To create wealth over a long period of time.•
Investment in securities covered by • Nifty 50 Index.
*Investors should consult their financial advisers if in doubt about whether the product is suitable for them.
Banks 25.98%Software 12.50%Petroleum Products 10.12%Finance 9.46%Auto 9.24%Consumer Non Durables 9.21%Construction Project 4.09%Pharmaceuticals 3.56%Power 2.39%Non - Ferrous Metals 2.10%Cement 1.47%Telecom - Services 1.33%Oil 1.27%Ferrous Metals 1.12%Minerals/Mining 0.94%Media & Entertainment 0.80%Gas 0.71%Transportation 0.69%Pesticides 0.68%Telecom - Equipment & Accessories 0.66%Auto Ancillaries 0.36%
Top 10 Equity Holdings
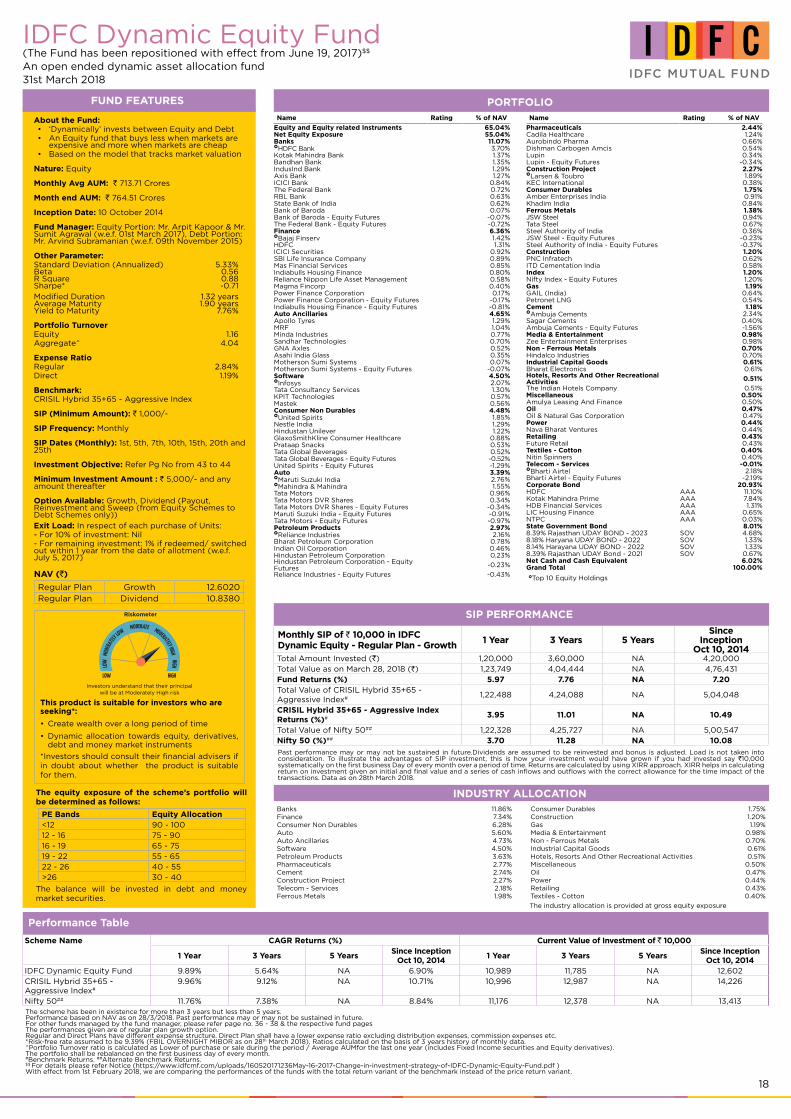
18
IDFC Dynamic Equity Fund(The Fund has been repositioned with effect from June 19, 2017)$$ An open ended dynamic asset allocation fund31st March 2018
FUND FEATURES PORTFOLIO
INDUSTRY ALLOCATION
About the Fund:‘Dynamically’ invests between Equity and Debt •An Equity fund that buys less when markets are •expensive and more when markets are cheapBased on the model that tracks market valuation•
Nature: Equity
Monthly Avg AUM: ` 713.71 Crores
Month end AUM: ` 764.51 Crores
Inception Date: 10 October 2014
Fund Manager: Equity Portion: Mr. Arpit Kapoor & Mr. Sumit Agrawal (w.e.f. 01st March 2017), Debt Portion: Mr. Arvind Subramanian (w.e.f. 09th November 2015)
Other Parameter:Standard Deviation (Annualized) 5.33% Beta 0.56 R Square 0.88 Sharpe* -0.71
Modified Duration 1.32 yearsAverage Maturity 1.90 yearsYield to Maturity 7.76%
Portfolio TurnoverEquity 1.16Aggregate^ 4.04
Expense Ratio Regular 2.84%Direct 1.19%
Benchmark: CRISIL Hybrid 35+65 - Aggressive Index
SIP (Minimum Amount): ` 1,000/-
SIP Frequency: Monthly
SIP Dates (Monthly): 1st, 5th, 7th, 10th, 15th, 20th and 25th
Investment Objective: Refer Pg No from 43 to 44
Minimum Investment Amount : ` 5,000/- and any amount thereafter
Option Available: Growth, Dividend (Payout, Reinvestment and Sweep (from Equity Schemes to Debt Schemes only))
Exit Load: In respect of each purchase of Units:- For 10% of investment: Nil- For remaining investment: 1% if redeemed/ switched out within 1 year from the date of allotment (w.e.f. July 5, 2017)
Top 10 Equity Holdings
Name Rating % of NAV
Equity and Equity related Instruments 65.04%Net Equity Exposure 55.04%Banks 11.07%HDFC Bank 3.70%Kotak Mahindra Bank 1.37%Bandhan Bank 1.35%IndusInd Bank 1.29%Axis Bank 1.27%ICICI Bank 0.84%The Federal Bank 0.72%RBL Bank 0.63%State Bank of India 0.62%Bank of Baroda 0.07%Bank of Baroda - Equity Futures -0.07%The Federal Bank - Equity Futures -0.72%Finance 6.36%Bajaj Finserv 1.42%HDFC 1.31%ICICI Securities 0.92%SBI Life Insurance Company 0.89%Mas Financial Services 0.85%Indiabulls Housing Finance 0.80%Reliance Nippon Life Asset Management 0.58%Magma Fincorp 0.40%Power Finance Corporation 0.17%Power Finance Corporation - Equity Futures -0.17%Indiabulls Housing Finance - Equity Futures -0.81%Auto Ancillaries 4.65%Apollo Tyres 1.29%MRF 1.04%Minda Industries 0.77%Sandhar Technologies 0.70%GNA Axles 0.52%Asahi India Glass 0.35%Motherson Sumi Systems 0.07%Motherson Sumi Systems - Equity Futures -0.07%Software 4.50%Infosys 2.07%Tata Consultancy Services 1.30%KPIT Technologies 0.57%Mastek 0.56%Consumer Non Durables 4.48%United Spirits 1.85%Nestle India 1.29%Hindustan Unilever 1.22%GlaxoSmithKline Consumer Healthcare 0.88%Prataap Snacks 0.53%Tata Global Beverages 0.52%Tata Global Beverages - Equity Futures -0.52%United Spirits - Equity Futures -1.29%Auto 3.39%Maruti Suzuki India 2.76%Mahindra & Mahindra 1.55%Tata Motors 0.96%Tata Motors DVR Shares 0.34%Tata Motors DVR Shares - Equity Futures -0.34%Maruti Suzuki India - Equity Futures -0.91%Tata Motors - Equity Futures -0.97%Petroleum Products 2.97%Reliance Industries 2.16%Bharat Petroleum Corporation 0.78%Indian Oil Corporation 0.46%Hindustan Petroleum Corporation 0.23%Hindustan Petroleum Corporation - Equity Futures -0.23%
Reliance Industries - Equity Futures -0.43%
Banks 11.86%Finance 7.34%Consumer Non Durables 6.28%Auto 5.60%Auto Ancillaries 4.73%Software 4.50%Petroleum Products 3.63%Pharmaceuticals 2.77%Cement 2.74%Construction Project 2.27%Telecom - Services 2.18%Ferrous Metals 1.98%
Performance Table
Scheme Name CAGR Returns (%) Current Value of Investment of ` 10,000
1 Year 3 Years 5 YearsSince Inception
Oct 10, 20141 Year 3 Years 5 Years
Since InceptionOct 10, 2014
IDFC Dynamic Equity Fund 9.89% 5.64% NA 6.90% 10,989 11,785 NA 12,602CRISIL Hybrid 35+65 - Aggressive Index#
9.96% 9.12% NA 10.71% 10,996 12,987 NA 14,226
Nifty 50## 11.76% 7.38% NA 8.84% 11,176 12,378 NA 13,413The scheme has been in existence for more than 3 years but less than 5 years.Performance based on NAV as on 28/3/2018. Past performance may or may not be sustained in future.For other funds managed by the fund manager, please refer page no. 36 - 38 & the respective fund pages The performances given are of regular plan growth option.Regular and Direct Plans have different expense structure. Direct Plan shall have a lower expense ratio excluding distribution expenses, commission expenses etc.*Risk-free rate assumed to be 9.39% (FBIL OVERNIGHT MIBOR as on 28th March 2018). Ratios calculated on the basis of 3 years history of monthly data. ^Portfolio Turnover ratio is calculated as Lower of purchase or sale during the period / Average AUMfor the last one year (includes Fixed Income securities and Equity derivatives). The portfolio shall be rebalanced on the first business day of every month.#Benchmark Returns. ##Alternate Benchmark Returns.$$ For details please refer Notice (https://www.idfcmf.com/uploads/160520171236May-16-2017-Change-in-investment-strategy-of-IDFC-Dynamic-Equity-Fund.pdf )With effect from 1st February 2018, we are comparing the performances of the funds with the total return variant of the benchmark instead of the price return variant.
SIP PERFORMANCE
Monthly SIP of ` 10,000 in IDFC Dynamic Equity - Regular Plan - Growth
1 Year 3 Years 5 YearsSince
InceptionOct 10, 2014
Total Amount Invested (`) 1,20,000 3,60,000 NA 4,20,000 Total Value as on March 28, 2018 (`) 1,23,749 4,04,444 NA 4,76,431 Fund Returns (%) 5.97 7.76 NA 7.20Total Value of CRISIL Hybrid 35+65 - Aggressive Index# 1,22,488 4,24,088 NA 5,04,048
CRISIL Hybrid 35+65 - Aggressive Index Returns (%)# 3.95 11.01 NA 10.49
Total Value of Nifty 50## 1,22,328 4,25,727 NA 5,00,547 Nifty 50 (%)## 3.70 11.28 NA 10.08
Past performance may or may not be sustained in future.Dividends are assumed to be reinvested and bonus is adjusted. Load is not taken into consideration. To illustrate the advantages of SIP investment, this is how your investment would have grown if you had invested say `10,000 systematically on the first business Day of every month over a period of time. Returns are calculated by using XIRR approach. XIRR helps in calculating return on investment given an initial and final value and a series of cash inflows and outflows with the correct allowance for the time impact of the transactions. Data as on 28th March 2018.
Riskometer
Investors understand that their principal will be at Moderately High risk
This product is suitable for investors who are seeking*:
Create wealth over a long period of time•
Dynamic allocation towards equity, derivatives, •debt and money market instruments
*Investors should consult their financial advisers if in doubt about whether the product is suitable for them.
Name Rating % of NAV
Pharmaceuticals 2.44%Cadila Healthcare 1.24%Aurobindo Pharma 0.66%Dishman Carbogen Amcis 0.54%Lupin 0.34%Lupin - Equity Futures -0.34%Construction Project 2.27%Larsen & Toubro 1.89%KEC International 0.38%Consumer Durables 1.75%Amber Enterprises India 0.91%Khadim India 0.84%Ferrous Metals 1.38%JSW Steel 0.94%Tata Steel 0.67%Steel Authority of India 0.36%JSW Steel - Equity Futures -0.23%Steel Authority of India - Equity Futures -0.37%Construction 1.20%PNC Infratech 0.62%ITD Cementation India 0.58%Index 1.20%Nifty Index - Equity Futures 1.20%Gas 1.19%GAIL (India) 0.64%Petronet LNG 0.54%Cement 1.18%Ambuja Cements 2.34%Sagar Cements 0.40%Ambuja Cements - Equity Futures -1.56%Media & Entertainment 0.98%Zee Entertainment Enterprises 0.98%Non - Ferrous Metals 0.70%Hindalco Industries 0.70%Industrial Capital Goods 0.61%Bharat Electronics 0.61%Hotels, Resorts And Other Recreational Activities 0.51%
The Indian Hotels Company 0.51%Miscellaneous 0.50%Amulya Leasing And Finance 0.50%Oil 0.47%Oil & Natural Gas Corporation 0.47%Power 0.44%Nava Bharat Ventures 0.44%Retailing 0.43%Future Retail 0.43%Textiles - Cotton 0.40%Nitin Spinners 0.40%Telecom - Services -0.01%Bharti Airtel 2.18%Bharti Airtel - Equity Futures -2.19%Corporate Bond 20.93%HDFC AAA 11.10%Kotak Mahindra Prime AAA 7.84%HDB Financial Services AAA 1.31%LIC Housing Finance AAA 0.65%NTPC AAA 0.03%State Government Bond 8.01%8.39% Rajasthan UDAY BOND - 2023 SOV 4.68%8.18% Haryana UDAY BOND - 2022 SOV 1.33%8.14% Harayana UDAY BOND - 2022 SOV 1.33%8.39% Rajasthan UDAY Bond - 2021 SOV 0.67%Net Cash and Cash Equivalent 6.02%Grand Total 100.00%
Consumer Durables 1.75%Construction 1.20%Gas 1.19%Media & Entertainment 0.98%Non - Ferrous Metals 0.70%Industrial Capital Goods 0.61%Hotels, Resorts And Other Recreational Activities 0.51%Miscellaneous 0.50%Oil 0.47%Power 0.44%Retailing 0.43%Textiles - Cotton 0.40%
NAV (`)
Regular Plan Growth 12.6020Regular Plan Dividend 10.8380
PE Bands Equity Allocation<12 90 - 100 12 - 16 75 - 9016 - 19 65 - 7519 - 22 55 - 6522 - 26 40 - 55>26 30 - 40
The industry allocation is provided at gross equity exposure
The equity exposure of the scheme’s portfolio will be determined as follows:
The balance will be invested in debt and money market securities.
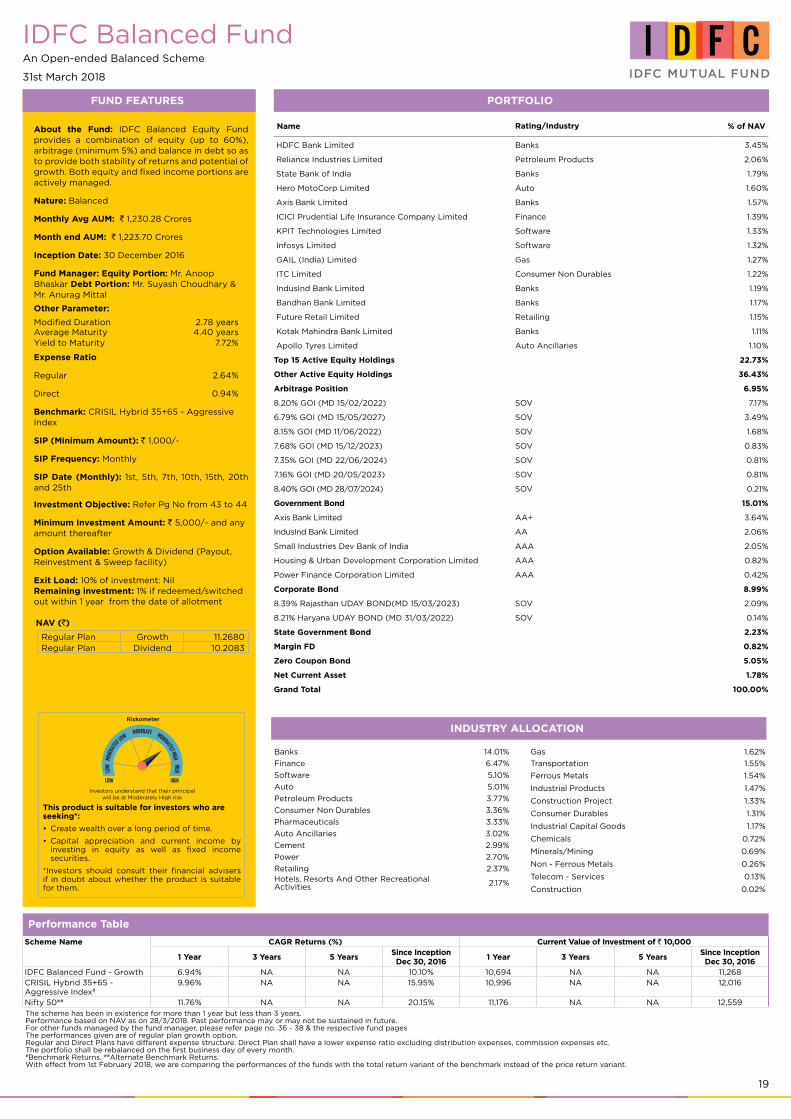
19
IDFC Balanced FundAn Open-ended Balanced Scheme
31st March 2018
FUND FEATURES
INDUSTRY ALLOCATION
About the Fund: IDFC Balanced Equity Fund provides a combination of equity (up to 60%), arbitrage (minimum 5%) and balance in debt so as to provide both stability of returns and potential of growth. Both equity and fixed income portions are actively managed.
Nature: Balanced
Monthly Avg AUM: ` 1,230.28 Crores
Month end AUM: ` 1,223.70 Crores
Inception Date: 30 December 2016
Fund Manager: Equity Portion: Mr. Anoop Bhaskar Debt Portion: Mr. Suyash Choudhary & Mr. Anurag Mittal
Other Parameter:
Modified Duration 2.78 years Average Maturity 4.40 years Yield to Maturity 7.72%
Expense Ratio
Regular 2.64%
Direct 0.94%
Benchmark: CRISIL Hybrid 35+65 - Aggressive Index
SIP (Minimum Amount): ` 1,000/-
SIP Frequency: Monthly
SIP Date (Monthly): 1st, 5th, 7th, 10th, 15th, 20th and 25th
Investment Objective: Refer Pg No from 43 to 44
Minimum Investment Amount: ` 5,000/- and any amount thereafter
Option Available: Growth & Dividend (Payout, Reinvestment & Sweep facility)
Exit Load: 10% of investment: Nil Remaining investment: 1% if redeemed/switched out within 1 year from the date of allotment
NAV (`)
Regular Plan Growth 11.2680Regular Plan Dividend 10.2083
Riskometer
Investors understand that their principal will be at Moderately High risk
This product is suitable for investors who are seeking*:
Create wealth over a long period of time.•
Capital appreciation and current income by •investing in equity as well as fixed income securities.
*Investors should consult their financial advisers if in doubt about whether the product is suitable for them.
PORTFOLIO
Name Rating/Industry % of NAV
HDFC Bank Limited Banks 3.45%
Reliance Industries Limited Petroleum Products 2.06%
State Bank of India Banks 1.79%
Hero MotoCorp Limited Auto 1.60%
Axis Bank Limited Banks 1.57%
ICICI Prudential Life Insurance Company Limited Finance 1.39%
KPIT Technologies Limited Software 1.33%
Infosys Limited Software 1.32%
GAIL (India) Limited Gas 1.27%
ITC Limited Consumer Non Durables 1.22%
IndusInd Bank Limited Banks 1.19%
Bandhan Bank Limited Banks 1.17%
Future Retail Limited Retailing 1.15%
Kotak Mahindra Bank Limited Banks 1.11%
Apollo Tyres Limited Auto Ancillaries 1.10%
Top 15 Active Equity Holdings 22.73%
Other Active Equity Holdings 36.43%
Arbitrage Position 6.95%
8.20% GOI (MD 15/02/2022) SOV 7.17%
6.79% GOI (MD 15/05/2027) SOV 3.49%
8.15% GOI (MD 11/06/2022) SOV 1.68%
7.68% GOI (MD 15/12/2023) SOV 0.83%
7.35% GOI (MD 22/06/2024) SOV 0.81%
7.16% GOI (MD 20/05/2023) SOV 0.81%
8.40% GOI (MD 28/07/2024) SOV 0.21%
Government Bond 15.01%
Axis Bank Limited AA+ 3.64%
IndusInd Bank Limited AA 2.06%
Small Industries Dev Bank of India AAA 2.05%
Housing & Urban Development Corporation Limited AAA 0.82%
Power Finance Corporation Limited AAA 0.42%
Corporate Bond 8.99%
8.39% Rajasthan UDAY BOND(MD 15/03/2023) SOV 2.09%
8.21% Haryana UDAY BOND (MD 31/03/2022) SOV 0.14%
State Government Bond 2.23%
Margin FD 0.82%
Zero Coupon Bond 5.05%
Net Current Asset 1.78%
Grand Total 100.00%
Banks 14.01%
Finance 6.47%
Software 5.10%
Auto 5.01%
Petroleum Products 3.77%
Consumer Non Durables 3.36%
Pharmaceuticals 3.33%
Auto Ancillaries 3.02%
Cement 2.99%
Power 2.70%
Retailing 2.37%Hotels, Resorts And Other Recreational Activities 2.17%
Gas 1.62%
Transportation 1.55%
Ferrous Metals 1.54%
Industrial Products 1.47%
Construction Project 1.33%
Consumer Durables 1.31%
Industrial Capital Goods 1.17%
Chemicals 0.72%
Minerals/Mining 0.69%
Non - Ferrous Metals 0.26%
Telecom - Services 0.13%
Construction 0.02%
Performance Table
Scheme Name CAGR Returns (%) Current Value of Investment of ` 10,000
1 Year 3 Years 5 YearsSince InceptionDec 30, 2016
1 Year 3 Years 5 YearsSince InceptionDec 30, 2016
IDFC Balanced Fund - Growth 6.94% NA NA 10.10% 10,694 NA NA 11,268CRISIL Hybrid 35+65 - Aggressive Index#
9.96% NA NA 15.95% 10,996 NA NA 12,016
Nifty 50## 11.76% NA NA 20.15% 11,176 NA NA 12,559The scheme has been in existence for more than 1 year but less than 3 years.Performance based on NAV as on 28/3/2018. Past performance may or may not be sustained in future.For other funds managed by the fund manager, please refer page no. 36 - 38 & the respective fund pages The performances given are of regular plan growth option.Regular and Direct Plans have different expense structure. Direct Plan shall have a lower expense ratio excluding distribution expenses, commission expenses etc.The portfolio shall be rebalanced on the first business day of every month.#Benchmark Returns. ##Alternate Benchmark Returns.With effect from 1st February 2018, we are comparing the performances of the funds with the total return variant of the benchmark instead of the price return variant.
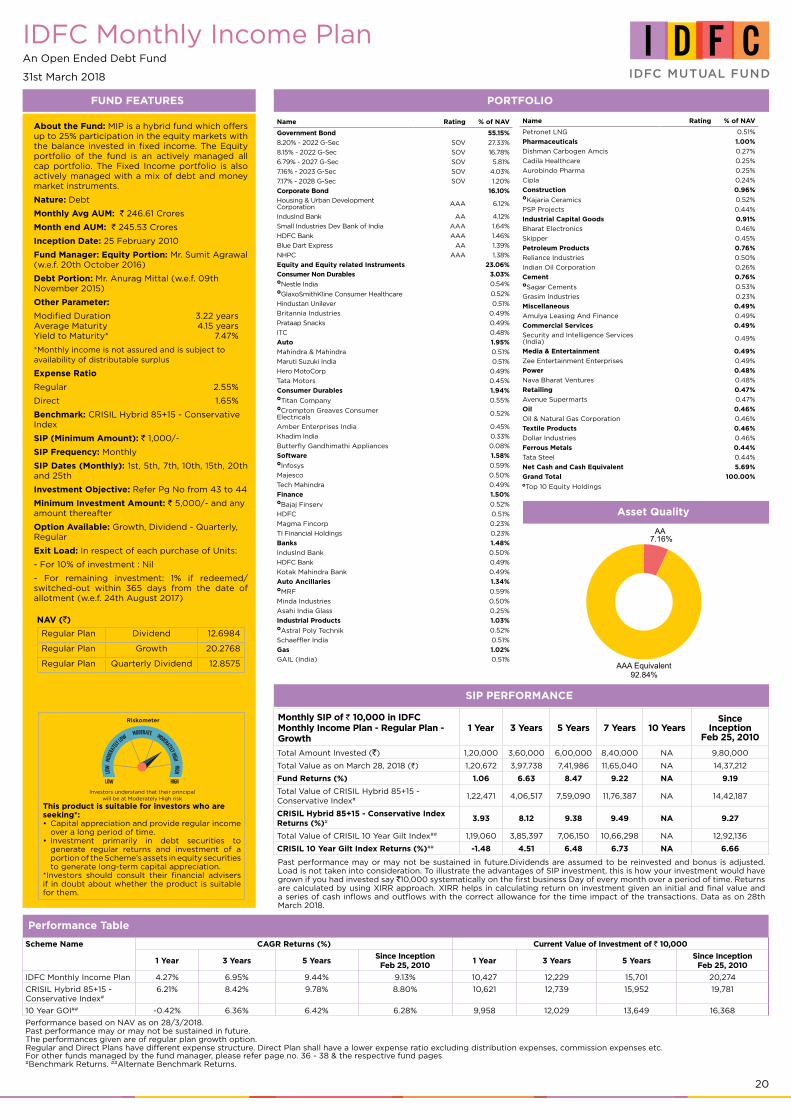
20
IDFC Monthly Income PlanAn Open Ended Debt Fund
31st March 2018
FUND FEATURES
About the Fund: MIP is a hybrid fund which offers up to 25% participation in the equity markets with the balance invested in fixed income. The Equity portfolio of the fund is an actively managed all cap portfolio. The Fixed Income portfolio is also actively managed with a mix of debt and money market instruments.
Nature: Debt
Monthly Avg AUM: ` 246.61 Crores
Month end AUM: ` 245.53 Crores
Inception Date: 25 February 2010
Fund Manager: Equity Portion: Mr. Sumit Agrawal (w.e.f. 20th October 2016)
Debt Portion: Mr. Anurag Mittal (w.e.f. 09th November 2015)
Other Parameter:
Modified Duration 3.22 years Average Maturity 4.15 years Yield to Maturity* 7.47%
*Monthly income is not assured and is subject to availability of distributable surplus
Expense Ratio
Regular 2.55%
Direct 1.65%
Benchmark: CRISIL Hybrid 85+15 - Conservative Index
SIP (Minimum Amount): ` 1,000/-
SIP Frequency: Monthly
SIP Dates (Monthly): 1st, 5th, 7th, 10th, 15th, 20th and 25th
Investment Objective: Refer Pg No from 43 to 44
Minimum Investment Amount: ` 5,000/- and any amount thereafter
Option Available: Growth, Dividend - Quarterly, Regular
Exit Load: In respect of each purchase of Units:
- For 10% of investment : Nil
- For remaining investment: 1% if redeemed/switched-out within 365 days from the date of allotment (w.e.f. 24th August 2017)
Performance Table
Scheme Name CAGR Returns (%) Current Value of Investment of ` 10,000
1 Year 3 Years 5 YearsSince InceptionFeb 25, 2010
1 Year 3 Years 5 YearsSince InceptionFeb 25, 2010
IDFC Monthly Income Plan 4.27% 6.95% 9.44% 9.13% 10,427 12,229 15,701 20,274
CRISIL Hybrid 85+15 - Conservative Index#
6.21% 8.42% 9.78% 8.80% 10,621 12,739 15,952 19,781
10 Year GOI## -0.42% 6.36% 6.42% 6.28% 9,958 12,029 13,649 16,368
Performance based on NAV as on 28/3/2018. Past performance may or may not be sustained in future.The performances given are of regular plan growth option.Regular and Direct Plans have different expense structure. Direct Plan shall have a lower expense ratio excluding distribution expenses, commission expenses etc.For other funds managed by the fund manager, please refer page no. 36 - 38 & the respective fund pages #Benchmark Returns. ##Alternate Benchmark Returns.
SIP PERFORMANCE
Monthly SIP of ` 10,000 in IDFC Monthly Income Plan - Regular Plan - Growth
1 Year 3 Years 5 Years 7 Years 10 YearsSince
InceptionFeb 25, 2010
Total Amount Invested (`) 1,20,000 3,60,000 6,00,000 8,40,000 NA 9,80,000
Total Value as on March 28, 2018 (`) 1,20,672 3,97,738 7,41,986 11,65,040 NA 14,37,212
Fund Returns (%) 1.06 6.63 8.47 9.22 NA 9.19
Total Value of CRISIL Hybrid 85+15 - Conservative Index# 1,22,471 4,06,517 7,59,090 11,76,387 NA 14,42,187
CRISIL Hybrid 85+15 - Conservative Index Returns (%)# 3.93 8.12 9.38 9.49 NA 9.27
Total Value of CRISIL 10 Year Gilt Index## 1,19,060 3,85,397 7,06,150 10,66,298 NA 12,92,136
CRISIL 10 Year Gilt Index Returns (%)## -1.48 4.51 6.48 6.73 NA 6.66
Past performance may or may not be sustained in future.Dividends are assumed to be reinvested and bonus is adjusted. Load is not taken into consideration. To illustrate the advantages of SIP investment, this is how your investment would have grown if you had invested say `10,000 systematically on the first business Day of every month over a period of time. Returns are calculated by using XIRR approach. XIRR helps in calculating return on investment given an initial and final value and a series of cash inflows and outflows with the correct allowance for the time impact of the transactions. Data as on 28th March 2018.
NAV (`)
Regular Plan Dividend 12.6984
Regular Plan Growth 20.2768
Regular Plan Quarterly Dividend 12.8575
Riskometer
Investors understand that their principal will be at Moderately High risk
This product is suitable for investors who are seeking*:
Capital appreciation and provide regular income •over a long period of time.Investment primarily in debt securities to •generate regular returns and investment of a portion of the Scheme’s assets in equity securities to generate long-term capital appreciation.
*Investors should consult their financial advisers if in doubt about whether the product is suitable for them.
PORTFOLIO
Name Rating % of NAV
Government Bond 55.15%
8.20% - 2022 G-Sec SOV 27.33%
8.15% - 2022 G-Sec SOV 16.78%
6.79% - 2027 G-Sec SOV 5.81%
7.16% - 2023 G-Sec SOV 4.03%
7.17% - 2028 G-Sec SOV 1.20%
Corporate Bond 16.10%
Housing & Urban Development Corporation AAA 6.12%
IndusInd Bank AA 4.12%
Small Industries Dev Bank of India AAA 1.64%
HDFC Bank AAA 1.46%
Blue Dart Express AA 1.39%
NHPC AAA 1.38%
Equity and Equity related Instruments 23.06%
Consumer Non Durables 3.03%Nestle India 0.54%GlaxoSmithKline Consumer Healthcare 0.52%
Hindustan Unilever 0.51%
Britannia Industries 0.49%
Prataap Snacks 0.49%
ITC 0.48%
Auto 1.95%
Mahindra & Mahindra 0.51%
Maruti Suzuki India 0.51%
Hero MotoCorp 0.49%
Tata Motors 0.45%
Consumer Durables 1.94%Titan Company 0.55%Crompton Greaves Consumer Electricals
0.52%
Amber Enterprises India 0.45%
Khadim India 0.33%
Butterfly Gandhimathi Appliances 0.08%
Software 1.58%Infosys 0.59%
Majesco 0.50%
Tech Mahindra 0.49%
Finance 1.50%Bajaj Finserv 0.52%
HDFC 0.51%
Magma Fincorp 0.23%
TI Financial Holdings 0.23%
Banks 1.48%
IndusInd Bank 0.50%
HDFC Bank 0.49%
Kotak Mahindra Bank 0.49%
Auto Ancillaries 1.34%MRF 0.59%
Minda Industries 0.50%
Asahi India Glass 0.25%
Industrial Products 1.03%Astral Poly Technik 0.52%
Schaeffler India 0.51%
Gas 1.02%
GAIL (India) 0.51%
Name Rating % of NAV
Petronet LNG 0.51%
Pharmaceuticals 1.00%
Dishman Carbogen Amcis 0.27%
Cadila Healthcare 0.25%
Aurobindo Pharma 0.25%
Cipla 0.24%
Construction 0.96%Kajaria Ceramics 0.52%
PSP Projects 0.44%
Industrial Capital Goods 0.91%
Bharat Electronics 0.46%
Skipper 0.45%
Petroleum Products 0.76%
Reliance Industries 0.50%
Indian Oil Corporation 0.26%
Cement 0.76%Sagar Cements 0.53%
Grasim Industries 0.23%
Miscellaneous 0.49%
Amulya Leasing And Finance 0.49%
Commercial Services 0.49%
Security and Intelligence Services (India) 0.49%
Media & Entertainment 0.49%
Zee Entertainment Enterprises 0.49%
Power 0.48%
Nava Bharat Ventures 0.48%
Retailing 0.47%
Avenue Supermarts 0.47%
Oil 0.46%
Oil & Natural Gas Corporation 0.46%
Textile Products 0.46%
Dollar Industries 0.46%
Ferrous Metals 0.44%
Tata Steel 0.44%
Net Cash and Cash Equivalent 5.69%
Grand Total 100.00%
Asset Quality
AAA Equivalent92.84%
AA7.16%
Top 10 Equity Holdings
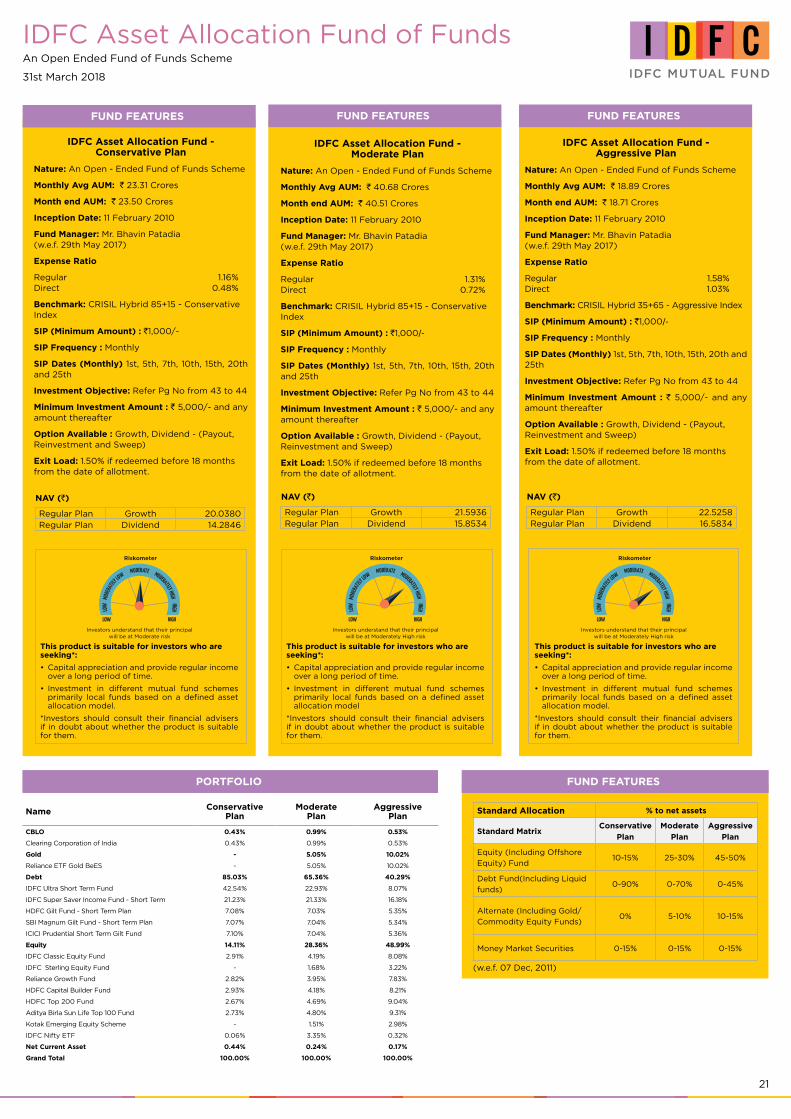
21
IDFC Asset Allocation Fund of FundsAn Open Ended Fund of Funds Scheme
31st March 2018
FUND FEATURES
NAV (`)
Regular Plan Growth 20.0380Regular Plan Dividend 14.2846
IDFC Asset Allocation Fund - Conservative Plan
Nature: An Open - Ended Fund of Funds Scheme
Monthly Avg AUM: ` 23.31 Crores
Month end AUM: ` 23.50 Crores
Inception Date: 11 February 2010
Fund Manager: Mr. Bhavin Patadia (w.e.f. 29th May 2017)
Expense Ratio
Regular 1.16% Direct 0.48%
Benchmark: CRISIL Hybrid 85+15 - Conservative Index
SIP (Minimum Amount) : `1,000/-
SIP Frequency : Monthly
SIP Dates (Monthly) 1st, 5th, 7th, 10th, 15th, 20th and 25th
Investment Objective: Refer Pg No from 43 to 44
Minimum Investment Amount : ` 5,000/- and any amount thereafter
Option Available : Growth, Dividend - (Payout, Reinvestment and Sweep)
Exit Load: 1.50% if redeemed before 18 months from the date of allotment.
FUND FEATURES FUND FEATURES
IDFC Asset Allocation Fund - Moderate Plan
Nature: An Open - Ended Fund of Funds Scheme
Monthly Avg AUM: ` 40.68 Crores
Month end AUM: ` 40.51 Crores
Inception Date: 11 February 2010
Fund Manager: Mr. Bhavin Patadia (w.e.f. 29th May 2017)
Expense Ratio
Regular 1.31% Direct 0.72%
Benchmark: CRISIL Hybrid 85+15 - Conservative Index
SIP (Minimum Amount) : `1,000/-
SIP Frequency : Monthly
SIP Dates (Monthly) 1st, 5th, 7th, 10th, 15th, 20th and 25th
Investment Objective: Refer Pg No from 43 to 44
Minimum Investment Amount : ` 5,000/- and any amount thereafter
Option Available : Growth, Dividend - (Payout, Reinvestment and Sweep)
Exit Load: 1.50% if redeemed before 18 months from the date of allotment.
IDFC Asset Allocation Fund - Aggressive Plan
Nature: An Open - Ended Fund of Funds Scheme
Monthly Avg AUM: ` 18.89 Crores
Month end AUM: ` 18.71 Crores
Inception Date: 11 February 2010
Fund Manager: Mr. Bhavin Patadia (w.e.f. 29th May 2017)
Expense Ratio
Regular 1.58% Direct 1.03%
Benchmark: CRISIL Hybrid 35+65 - Aggressive Index
SIP (Minimum Amount) : `1,000/-
SIP Frequency : Monthly
SIP Dates (Monthly) 1st, 5th, 7th, 10th, 15th, 20th and 25th
Investment Objective: Refer Pg No from 43 to 44
Minimum Investment Amount : ` 5,000/- and any amount thereafter
Option Available : Growth, Dividend - (Payout, Reinvestment and Sweep)
Exit Load: 1.50% if redeemed before 18 months from the date of allotment.
NAV (`)
Regular Plan Growth 21.5936Regular Plan Dividend 15.8534
NAV (`)
Regular Plan Growth 22.5258Regular Plan Dividend 16.5834
Riskometer
Investors understand that their principal will be at Moderately High risk
This product is suitable for investors who are seeking*:
Capital appreciation and provide regular income •over a long period of time.
Investment in different mutual fund schemes •primarily local funds based on a defined asset allocation model.
*Investors should consult their financial advisers if in doubt about whether the product is suitable for them.
Riskometer
Investors understand that their principal will be at Moderate risk
This product is suitable for investors who are seeking*:
Capital appreciation and provide regular income •over a long period of time.
Investment in different mutual fund schemes •primarily local funds based on a defined asset allocation model.
*Investors should consult their financial advisers if in doubt about whether the product is suitable for them.
Riskometer
Investors understand that their principal will be at Moderately High risk
This product is suitable for investors who are seeking*:
Capital appreciation and provide regular income •over a long period of time.
Investment in different mutual fund schemes •primarily local funds based on a defined asset allocation model
*Investors should consult their financial advisers if in doubt about whether the product is suitable for them.
PORTFOLIO
Name ConservativePlan
ModeratePlan
AggressivePlan
CBLO 0.43% 0.99% 0.53%
Clearing Corporation of India 0.43% 0.99% 0.53%
Gold - 5.05% 10.02%
Reliance ETF Gold BeES - 5.05% 10.02%
Debt 85.03% 65.36% 40.29%
IDFC Ultra Short Term Fund 42.54% 22.93% 8.07%
IDFC Super Saver Income Fund - Short Term 21.23% 21.33% 16.18%
HDFC Gilt Fund - Short Term Plan 7.08% 7.03% 5.35%
SBI Magnum Gilt Fund - Short Term Plan 7.07% 7.04% 5.34%
ICICI Prudential Short Term Gilt Fund 7.10% 7.04% 5.36%
Equity 14.11% 28.36% 48.99%
IDFC Classic Equity Fund 2.91% 4.19% 8.08%
IDFC Sterling Equity Fund - 1.68% 3.22%
Reliance Growth Fund 2.82% 3.95% 7.83%
HDFC Capital Builder Fund 2.93% 4.18% 8.21%
HDFC Top 200 Fund 2.67% 4.69% 9.04%
Aditya Birla Sun Life Top 100 Fund 2.73% 4.80% 9.31%
Kotak Emerging Equity Scheme - 1.51% 2.98%
IDFC Nifty ETF 0.06% 3.35% 0.32%
Net Current Asset 0.44% 0.24% 0.17%
Grand Total 100.00% 100.00% 100.00%
PORTFOLIO FUND FEATURES
Standard Allocation % to net assets
Standard MatrixConservative
Plan
Moderate
Plan
Aggressive
Plan
Equity (Including Offshore
Equity) Fund10-15% 25-30% 45-50%
Debt Fund(Including Liquid
funds)0-90% 0-70% 0-45%
Alternate (Including Gold/
Commodity Equity Funds)0% 5-10% 10-15%
Money Market Securities 0-15% 0-15% 0-15%
(w.e.f. 07 Dec, 2011)
FUND FEATURES
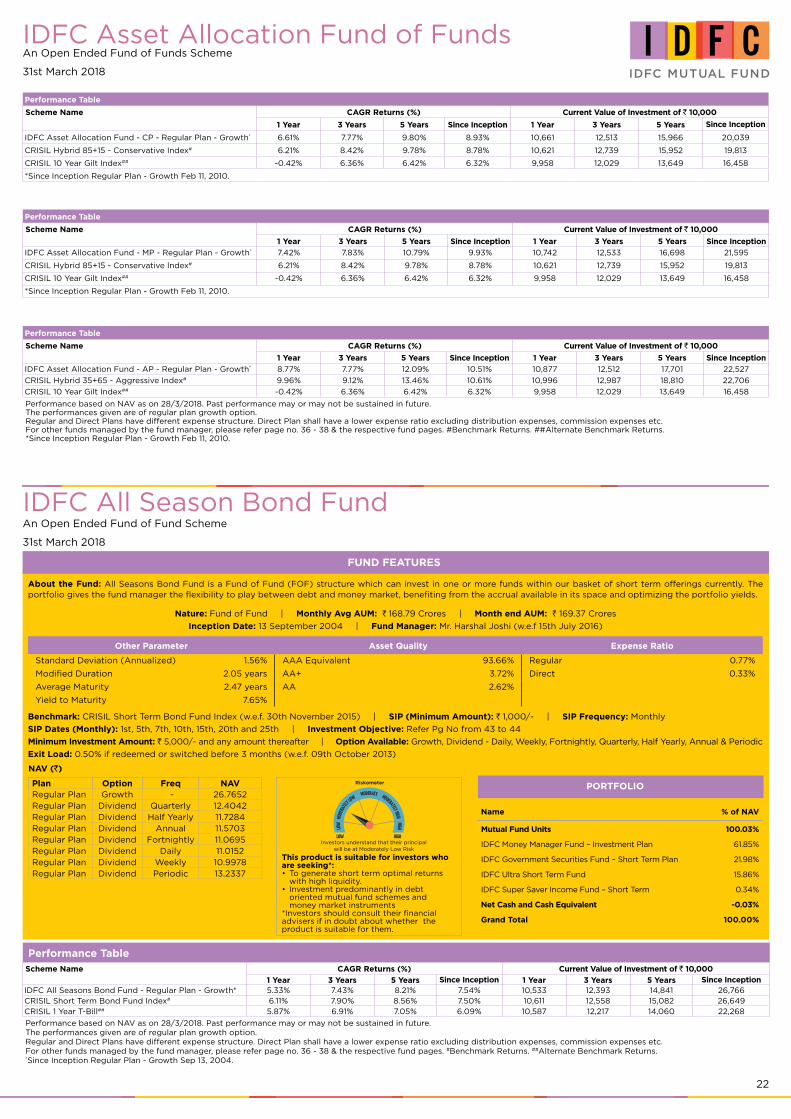
22
Performance Table
Scheme Name CAGR Returns (%) Current Value of Investment of ` 10,000
1 Year 3 Years 5 Years Since Inception 1 Year 3 Years 5 Years Since Inception
IDFC Asset Allocation Fund - CP - Regular Plan - Growth* 6.61% 7.77% 9.80% 8.93% 10,661 12,513 15,966 20,039
CRISIL Hybrid 85+15 - Conservative Index# 6.21% 8.42% 9.78% 8.78% 10,621 12,739 15,952 19,813
CRISIL 10 Year Gilt Index## -0.42% 6.36% 6.42% 6.32% 9,958 12,029 13,649 16,458
*Since Inception Regular Plan - Growth Feb 11, 2010.
Performance Table
Scheme Name CAGR Returns (%) Current Value of Investment of ` 10,000
1 Year 3 Years 5 Years Since Inception 1 Year 3 Years 5 Years Since Inception
IDFC Asset Allocation Fund - MP - Regular Plan - Growth* 7.42% 7.83% 10.79% 9.93% 10,742 12,533 16,698 21,595
CRISIL Hybrid 85+15 - Conservative Index# 6.21% 8.42% 9.78% 8.78% 10,621 12,739 15,952 19,813
CRISIL 10 Year Gilt Index## -0.42% 6.36% 6.42% 6.32% 9,958 12,029 13,649 16,458
*Since Inception Regular Plan - Growth Feb 11, 2010.
Performance Table
Scheme Name CAGR Returns (%) Current Value of Investment of ` 10,000
1 Year 3 Years 5 Years Since Inception 1 Year 3 Years 5 Years Since Inception
IDFC Asset Allocation Fund - AP - Regular Plan - Growth* 8.77% 7.77% 12.09% 10.51% 10,877 12,512 17,701 22,527
CRISIL Hybrid 35+65 - Aggressive Index# 9.96% 9.12% 13.46% 10.61% 10,996 12,987 18,810 22,706
CRISIL 10 Year Gilt Index## -0.42% 6.36% 6.42% 6.32% 9,958 12,029 13,649 16,458
Performance based on NAV as on 28/3/2018. Past performance may or may not be sustained in future.The performances given are of regular plan growth option.Regular and Direct Plans have different expense structure. Direct Plan shall have a lower expense ratio excluding distribution expenses, commission expenses etc.For other funds managed by the fund manager, please refer page no. 36 - 38 & the respective fund pages. #Benchmark Returns. ##Alternate Benchmark Returns.*Since Inception Regular Plan - Growth Feb 11, 2010.
IDFC Asset Allocation Fund of FundsAn Open Ended Fund of Funds Scheme
31st March 2018
IDFC All Season Bond FundAn Open Ended Fund of Fund Scheme
31st March 2018
FUND FEATURES
About the Fund: All Seasons Bond Fund is a Fund of Fund (FOF) structure which can invest in one or more funds within our basket of short term offerings currently. The portfolio gives the fund manager the flexibility to play between debt and money market, benefiting from the accrual available in its space and optimizing the portfolio yields.
Nature: Fund of Fund | Monthly Avg AUM: ` 168.79 Crores | Month end AUM: ` 169.37 Crores
Inception Date: 13 September 2004 | Fund Manager: Mr. Harshal Joshi (w.e.f 15th July 2016)
Other Parameter Asset Quality Expense Ratio
Standard Deviation (Annualized) 1.56% AAA Equivalent 93.66% Regular 0.77%
Modified Duration 2.05 years AA+ 3.72% Direct 0.33%
Average Maturity 2.47 years AA 2.62%
Yield to Maturity 7.65%
Benchmark: CRISIL Short Term Bond Fund Index (w.e.f. 30th November 2015) | SIP (Minimum Amount): ` 1,000/- | SIP Frequency: Monthly
SIP Dates (Monthly): 1st, 5th, 7th, 10th, 15th, 20th and 25th | Investment Objective: Refer Pg No from 43 to 44
Minimum Investment Amount: ` 5,000/- and any amount thereafter | Option Available: Growth, Dividend - Daily, Weekly, Fortnightly, Quarterly, Half Yearly, Annual & Periodic
Exit Load: 0.50% if redeemed or switched before 3 months (w.e.f. 09th October 2013)
NAV (`)
Plan Option Freq NAVRegular Plan Growth - 26.7652Regular Plan Dividend Quarterly 12.4042Regular Plan Dividend Half Yearly 11.7284Regular Plan Dividend Annual 11.5703Regular Plan Dividend Fortnightly 11.0695Regular Plan Dividend Daily 11.0152Regular Plan Dividend Weekly 10.9978Regular Plan Dividend Periodic 13.2337
PORTFOLIO
Name % of NAV
Mutual Fund Units 100.03%
IDFC Money Manager Fund – Investment Plan 61.85%
IDFC Government Securities Fund – Short Term Plan 21.98%
IDFC Ultra Short Term Fund 15.86%
IDFC Super Saver Income Fund – Short Term 0.34%
Net Cash and Cash Equivalent -0.03%
Grand Total 100.00%
Riskometer
Investors understand that their principal will be at Moderately Low Risk
This product is suitable for investors who are seeking*:
To generate short term optimal returns •with high liquidity.Investment predominantly in debt •oriented mutual fund schemes and money market instruments
*Investors should consult their financial advisers if in doubt about whether the product is suitable for them.
Performance TableScheme Name CAGR Returns (%) Current Value of Investment of ` 10,000
1 Year 3 Years 5 Years Since Inception 1 Year 3 Years 5 Years Since InceptionIDFC All Seasons Bond Fund - Regular Plan - Growth* 5.33% 7.43% 8.21% 7.54% 10,533 12,393 14,841 26,766CRISIL Short Term Bond Fund Index# 6.11% 7.90% 8.56% 7.50% 10,611 12,558 15,082 26,649CRISIL 1 Year T-Bill## 5.87% 6.91% 7.05% 6.09% 10,587 12,217 14,060 22,268
Performance based on NAV as on 28/3/2018. Past performance may or may not be sustained in future.The performances given are of regular plan growth option.Regular and Direct Plans have different expense structure. Direct Plan shall have a lower expense ratio excluding distribution expenses, commission expenses etc.For other funds managed by the fund manager, please refer page no. 36 - 38 & the respective fund pages. #Benchmark Returns. ##Alternate Benchmark Returns. *Since Inception Regular Plan - Growth Sep 13, 2004.

23
IDFC Cash FundAn Open Ended Liquid Fund
31st March 2018
FUND FEATURES PORTFOLIO
About the Fund: The Fund aims to invest in high quality debt and money market instruments with high liquidity and seeks to generate accrual income with low volatility.
Nature: Liquid Fund
Monthly Avg AUM: ` 11,337.79 Crores
Month end AUM: ` 8,452.32 Crores
Inception Date: 2 July 2001
Fund Manager: Mr. Harshal Joshi (w.e.f. 15th September 2015) & Mr. Anurag Mittal (w.e.f. 09th November 2015)
Other Parameter:
Standard Deviation (Annualized) 0.18%
Modified Duration 56 days
Average Maturity 56 days
Yield to Maturity 7.04%
Expense Ratio
Regular 0.11%
Direct 0.04%
Benchmark: CRISIL Liquid Fund Index
SIP (Minimum Amount): ` 100/-
SIP Frequency: Monthly
SIP Dates (Monthly): 1st, 5th, 7th, 10th, 15th, 20th and 25th
Investment Objective: Refer Pg No from 43 to 44
Minimum Investment Amount: ` 100/- and any amount thereafter
Option Available: Growth, Dividend - Daily, Weekly, Monthly & Periodic
Exit Load: Nil
NAV (`)
Plan Option Freq NAV
Regular Plan Growth - 2103.4196
Regular Plan Dividend Daily 1001.6481
Regular Plan Dividend Weekly 1001.6501
Regular Plan Dividend Periodic 1387.0582
Regular Plan Dividend Monthly 1001.9714
Name Rating % of NAV
Commercial Paper 85.50%
NABARD A1+ 11.08%
Vedanta A1+ 6.13%
Reliance Industries A1+ 5.88%
Reliance Jio Infocomm A1+ 5.85%
Indiabulls Housing Finance A1+ 5.60%
Tata Power Company A1+ 4.67%
Piramal Enterprises A1+ 4.66%
Tata Motors Finance A1+ 3.52%
TGS Investment & Trade Pvt A1+ 2.94%
ICICI Securities A1+ 2.69%
India Infoline Housing Finance A1+ 2.35%
Tata Motors Finance Solutions A1+ 2.35%
Sheba Properties A1+ 2.34%
India Infoline Finance A1+ 2.34%
CESC A1+ 2.32%
JM Financial Credit Solution A1+ 2.17%
Shriram City Union Finance A1+ 1.87%
IIFL Wealth Finance A1+ 1.76%
Cholamandalam Invt and Fin Co A1+ 1.76%
Dewan Housing Finance Corporation A1+ 1.76%
Hero Fincorp A1+ 1.75%
Kotak Securities A1+ 1.18%
M&M Financial Services A1+ 1.17%
Azim Premji Trust A1+ 1.17%
Tata Housing Development Company A1+ 1.17%
JM Financial Products A1+ 1.15%
Kotak Mahindra Investments A1+ 0.87%
JM Financial Services A1+ 0.70%
Performance TableScheme Name CAGR Returns (%) Current Value of Investment of ` 10,000
1 Year 3 Years 5 YearsSince
Inception1 Year 3 Years 5 Years
SinceInception
IDFC Cash Fund - Regular Plan - Growth*
6.72% 7.37% 8.08% 7.86% 10,672 12,380 14,760 21,034
Crisil Liquid Fund Index# 6.84% 7.33% 8.08% 7.56% 10,684 12,367 14,763 20,466
1 Year T-Bill## 5.92% 6.91% 7.05% 6.46% 10,592 12,223 14,067 18,498
Performance based on NAV as on 31/3/2018. Past performance may or may not be sustained in future.The performances given are of regular plan growth option.Regular and Direct Plans have different expense structure. Direct Plan shall have a lower expense ratio excluding distribution expenses, commission expenses etc.For other funds managed by the fund manager, please refer page no. 36 - 38 & the respective fund pages #Benchmark Returns. ##Alternate Benchmark Returns. Standard Deviation calculated on the basis of 1 year history of monthly data *Since Inception Regular Plan - Growth Jun 04, 2008.
Riskometer
Investors understand that their principal will be at Low Risk
This product is suitable for investors who are seeking*:
To generate short term optimal returns with •high liquidity.Investments in high quality money market and •debt instruments
*Investors should consult their financial advisers if in doubt about whether the product is suitable for them.
Maturity Bucket Asset Quality
AAA Equivalent99.76%
AA+0.24%
Name Rating % of NAV
Network18 Media & Investments A1+ 0.59%
Julius Baer Capital India Pvt A1+ 0.59%
L&T Finance A1+ 0.58%
Small Industries Dev Bank of India A1+ 0.29%
Trapti Trading & Invest Pvt A1+ 0.15%
LIC Housing Finance A1+ 0.06%
National Housing Bank A1+ 0.04%
Certificate of Deposit 16.99%
ICICI Bank A1+ 7.60%
Axis Bank A1+ 5.87%
RBL Bank A1+ 2.35%
IndusInd Bank A1+ 1.17%
Corporate Bond 2.07%
Gruh Finance AAA 0.59%
HDFC AAA 0.59%
Sundaram Finance AAA 0.30%
LIC Housing Finance AAA 0.30%
M&M Financial Services AA+ 0.24%
Indian Railway Finance Corporation AAA 0.06%
Zero Coupon Bond 0.76%
HDB Financial Services AAA 0.76%
Treasury Bill 0.18%
91 Days Tbill - 2018 SOV 0.18%
Net Cash and Cash Equivalent -5.51%
Grand Total 100.00%
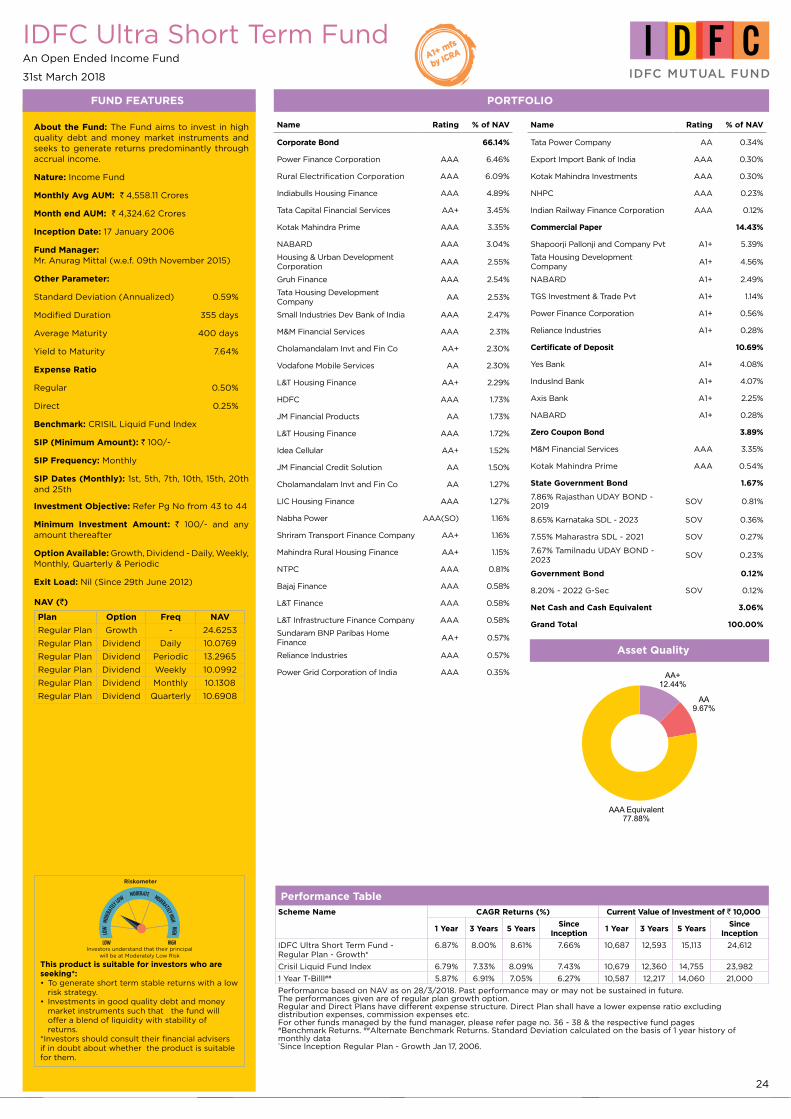
24
IDFC Ultra Short Term FundAn Open Ended Income Fund
31st March 2018
FUND FEATURES PORTFOLIO
About the Fund: The Fund aims to invest in high quality debt and money market instruments and seeks to generate returns predominantly through accrual income.
Nature: Income Fund
Monthly Avg AUM: ` 4,558.11 Crores
Month end AUM: ` 4,324.62 Crores
Inception Date: 17 January 2006
Fund Manager: Mr. Anurag Mittal (w.e.f. 09th November 2015)
Other Parameter:
Standard Deviation (Annualized) 0.59%
Modified Duration 355 days
Average Maturity 400 days
Yield to Maturity 7.64%
Expense Ratio
Regular 0.50%
Direct 0.25%
Benchmark: CRISIL Liquid Fund Index
SIP (Minimum Amount): ` 100/-
SIP Frequency: Monthly
SIP Dates (Monthly): 1st, 5th, 7th, 10th, 15th, 20th and 25th
Investment Objective: Refer Pg No from 43 to 44
Minimum Investment Amount: ` 100/- and any amount thereafter
Option Available: Growth, Dividend - Daily, Weekly, Monthly, Quarterly & Periodic
Exit Load: Nil (Since 29th June 2012)
NAV (`)
Plan Option Freq NAV
Regular Plan Growth - 24.6253
Regular Plan Dividend Daily 10.0769
Regular Plan Dividend Periodic 13.2965
Regular Plan Dividend Weekly 10.0992
Regular Plan Dividend Monthly 10.1308
Regular Plan Dividend Quarterly 10.6908
Name Rating % of NAV
Corporate Bond 66.14%
Power Finance Corporation AAA 6.46%
Rural Electrification Corporation AAA 6.09%
Indiabulls Housing Finance AAA 4.89%
Tata Capital Financial Services AA+ 3.45%
Kotak Mahindra Prime AAA 3.35%
NABARD AAA 3.04%
Housing & Urban Development Corporation
AAA 2.55%
Gruh Finance AAA 2.54%
Tata Housing Development Company
AA 2.53%
Small Industries Dev Bank of India AAA 2.47%
M&M Financial Services AAA 2.31%
Cholamandalam Invt and Fin Co AA+ 2.30%
Vodafone Mobile Services AA 2.30%
L&T Housing Finance AA+ 2.29%
HDFC AAA 1.73%
JM Financial Products AA 1.73%
L&T Housing Finance AAA 1.72%
Idea Cellular AA+ 1.52%
JM Financial Credit Solution AA 1.50%
Cholamandalam Invt and Fin Co AA 1.27%
LIC Housing Finance AAA 1.27%
Nabha Power AAA(SO) 1.16%
Shriram Transport Finance Company AA+ 1.16%
Mahindra Rural Housing Finance AA+ 1.15%
NTPC AAA 0.81%
Bajaj Finance AAA 0.58%
L&T Finance AAA 0.58%
L&T Infrastructure Finance Company AAA 0.58%
Sundaram BNP Paribas Home Finance
AA+ 0.57%
Reliance Industries AAA 0.57%
Power Grid Corporation of India AAA 0.35%
Performance TableScheme Name CAGR Returns (%) Current Value of Investment of ` 10,000
1 Year 3 Years 5 YearsSince
Inception1 Year 3 Years 5 Years
SinceInception
IDFC Ultra Short Term Fund - Regular Plan - Growth*
6.87% 8.00% 8.61% 7.66% 10,687 12,593 15,113 24,612
Crisil Liquid Fund Index 6.79% 7.33% 8.09% 7.43% 10,679 12,360 14,755 23,982
1 Year T-Billl## 5.87% 6.91% 7.05% 6.27% 10,587 12,217 14,060 21,000
Performance based on NAV as on 28/3/2018. Past performance may or may not be sustained in future.The performances given are of regular plan growth option.Regular and Direct Plans have different expense structure. Direct Plan shall have a lower expense ratio excluding distribution expenses, commission expenses etc.For other funds managed by the fund manager, please refer page no. 36 - 38 & the respective fund pages #Benchmark Returns. ##Alternate Benchmark Returns. Standard Deviation calculated on the basis of 1 year history of monthly data *Since Inception Regular Plan - Growth Jan 17, 2006.
Riskometer
Investors understand that their principal will be at Moderately Low Risk
This product is suitable for investors who are seeking*:
To generate short term stable returns with a low •risk strategy.Investments in good quality debt and money •market instruments such that the fund will offer a blend of liquidity with stability of returns.
*Investors should consult their financial advisers if in doubt about whether the product is suitable for them.
Name Rating % of NAV
Tata Power Company AA 0.34%
Export Import Bank of India AAA 0.30%
Kotak Mahindra Investments AAA 0.30%
NHPC AAA 0.23%
Indian Railway Finance Corporation AAA 0.12%
Commercial Paper 14.43%
Shapoorji Pallonji and Company Pvt A1+ 5.39%
Tata Housing Development Company
A1+ 4.56%
NABARD A1+ 2.49%
TGS Investment & Trade Pvt A1+ 1.14%
Power Finance Corporation A1+ 0.56%
Reliance Industries A1+ 0.28%
Certificate of Deposit 10.69%
Yes Bank A1+ 4.08%
IndusInd Bank A1+ 4.07%
Axis Bank A1+ 2.25%
NABARD A1+ 0.28%
Zero Coupon Bond 3.89%
M&M Financial Services AAA 3.35%
Kotak Mahindra Prime AAA 0.54%
State Government Bond 1.67%
7.86% Rajasthan UDAY BOND - 2019
SOV 0.81%
8.65% Karnataka SDL - 2023 SOV 0.36%
7.55% Maharastra SDL - 2021 SOV 0.27%
7.67% Tamilnadu UDAY BOND - 2023
SOV 0.23%
Government Bond 0.12%
8.20% - 2022 G-Sec SOV 0.12%
Net Cash and Cash Equivalent 3.06%
Grand Total 100.00%
Asset Quality
AA+12.44%
AA9.67%
AAA Equivalent77.88%
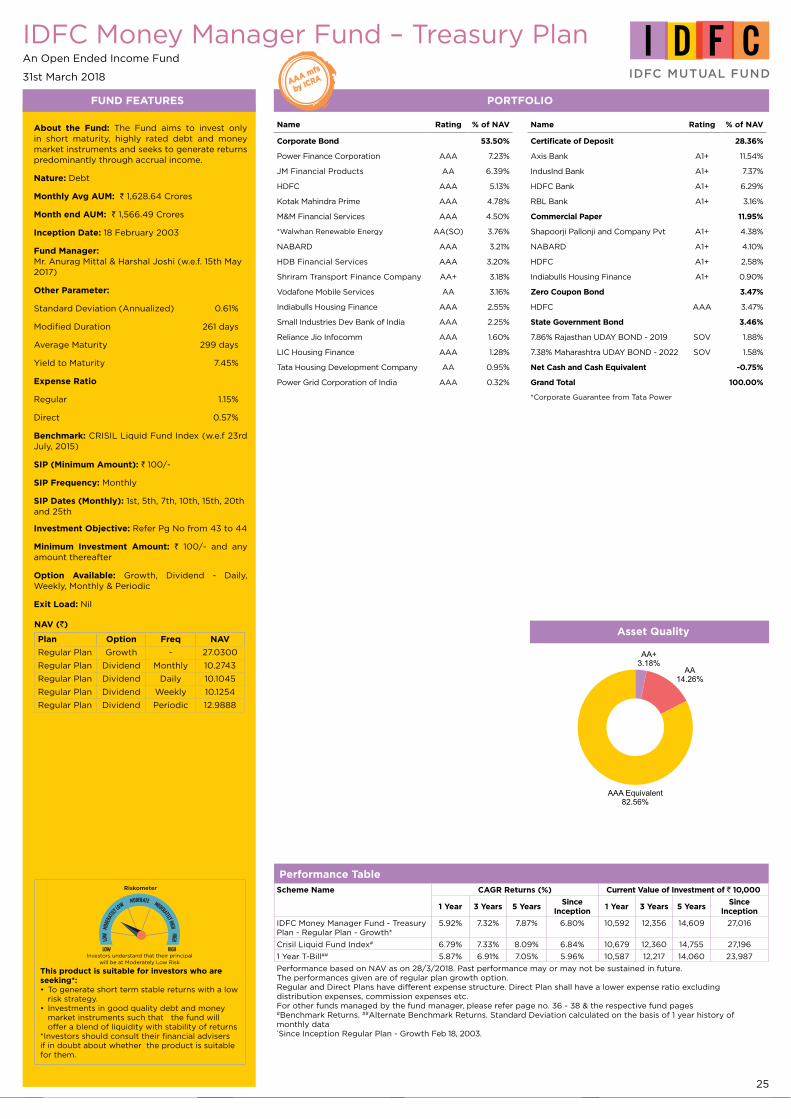
25
IDFC Money Manager Fund – Treasury PlanAn Open Ended Income Fund
31st March 2018
FUND FEATURES PORTFOLIO
About the Fund: The Fund aims to invest only in short maturity, highly rated debt and money market instruments and seeks to generate returns predominantly through accrual income.
Nature: Debt
Monthly Avg AUM: ` 1,628.64 Crores
Month end AUM: ` 1,566.49 Crores
Inception Date: 18 February 2003
Fund Manager: Mr. Anurag Mittal & Harshal Joshi (w.e.f. 15th May 2017)
Other Parameter:
Standard Deviation (Annualized) 0.61%
Modified Duration 261 days
Average Maturity 299 days
Yield to Maturity 7.45%
Expense Ratio
Regular 1.15%
Direct 0.57%
Benchmark: CRISIL Liquid Fund Index (w.e.f 23rd July, 2015)
SIP (Minimum Amount): ` 100/-
SIP Frequency: Monthly
SIP Dates (Monthly): 1st, 5th, 7th, 10th, 15th, 20th and 25th
Investment Objective: Refer Pg No from 43 to 44
Minimum Investment Amount: ` 100/- and any amount thereafter
Option Available: Growth, Dividend - Daily, Weekly, Monthly & Periodic
Exit Load: Nil
NAV (`)
Plan Option Freq NAV
Regular Plan Growth - 27.0300
Regular Plan Dividend Monthly 10.2743
Regular Plan Dividend Daily 10.1045
Regular Plan Dividend Weekly 10.1254
Regular Plan Dividend Periodic 12.9888
Name Rating % of NAV
Corporate Bond 53.50%
Power Finance Corporation AAA 7.23%
JM Financial Products AA 6.39%
HDFC AAA 5.13%
Kotak Mahindra Prime AAA 4.78%
M&M Financial Services AAA 4.50%
*Walwhan Renewable Energy AA(SO) 3.76%
NABARD AAA 3.21%
HDB Financial Services AAA 3.20%
Shriram Transport Finance Company AA+ 3.18%
Vodafone Mobile Services AA 3.16%
Indiabulls Housing Finance AAA 2.55%
Small Industries Dev Bank of India AAA 2.25%
Reliance Jio Infocomm AAA 1.60%
LIC Housing Finance AAA 1.28%
Tata Housing Development Company AA 0.95%
Power Grid Corporation of India AAA 0.32%
Performance TableScheme Name CAGR Returns (%) Current Value of Investment of ` 10,000
1 Year 3 Years 5 YearsSince
Inception1 Year 3 Years 5 Years
SinceInception
IDFC Money Manager Fund - Treasury Plan - Regular Plan - Growth*
5.92% 7.32% 7.87% 6.80% 10,592 12,356 14,609 27,016
Crisil Liquid Fund Index# 6.79% 7.33% 8.09% 6.84% 10,679 12,360 14,755 27,196
1 Year T-Bill## 5.87% 6.91% 7.05% 5.96% 10,587 12,217 14,060 23,987
Performance based on NAV as on 28/3/2018. Past performance may or may not be sustained in future.The performances given are of regular plan growth option.Regular and Direct Plans have different expense structure. Direct Plan shall have a lower expense ratio excluding distribution expenses, commission expenses etc.For other funds managed by the fund manager, please refer page no. 36 - 38 & the respective fund pages #Benchmark Returns. ##Alternate Benchmark Returns. Standard Deviation calculated on the basis of 1 year history of monthly data*Since Inception Regular Plan - Growth Feb 18, 2003.
Riskometer
Investors understand that their principal will be at Moderately Low Risk
This product is suitable for investors who are seeking*:
To generate short term stable returns with a low •risk strategy.Investments in good quality debt and money •market instruments such that the fund will offer a blend of liquidity with stability of returns
*Investors should consult their financial advisers if in doubt about whether the product is suitable for them.
Name Rating % of NAV
Certificate of Deposit 28.36%
Axis Bank A1+ 11.54%
IndusInd Bank A1+ 7.37%
HDFC Bank A1+ 6.29%
RBL Bank A1+ 3.16%
Commercial Paper 11.95%
Shapoorji Pallonji and Company Pvt A1+ 4.38%
NABARD A1+ 4.10%
HDFC A1+ 2.58%
Indiabulls Housing Finance A1+ 0.90%
Zero Coupon Bond 3.47%
HDFC AAA 3.47%
State Government Bond 3.46%
7.86% Rajasthan UDAY BOND - 2019 SOV 1.88%
7.38% Maharashtra UDAY BOND - 2022 SOV 1.58%
Net Cash and Cash Equivalent -0.75%
Grand Total 100.00%
Maturity Bucket Asset Quality
AA+3.18%
AA14.26%
AAA Equivalent82.56%
*Corporate Guarantee from Tata Power
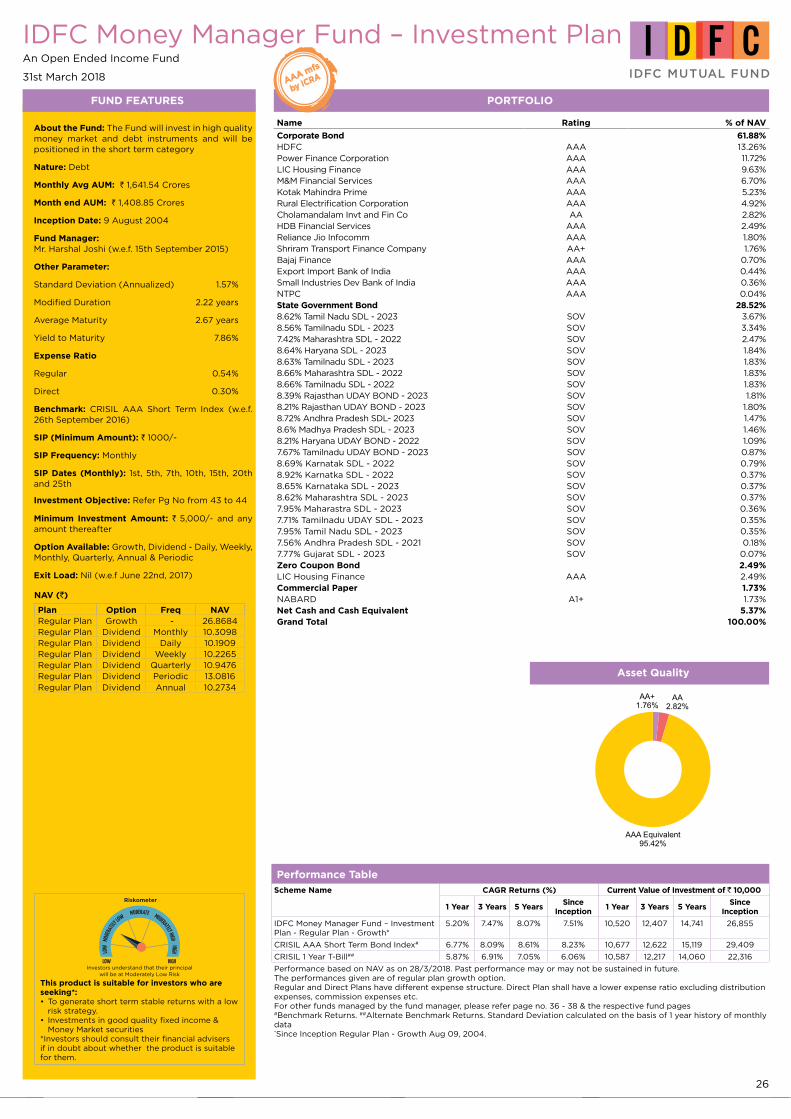
26
IDFC Money Manager Fund – Investment PlanAn Open Ended Income Fund
31st March 2018
FUND FEATURES PORTFOLIO
About the Fund: The Fund will invest in high quality money market and debt instruments and will be positioned in the short term category
Nature: Debt
Monthly Avg AUM: ` 1,641.54 Crores
Month end AUM: ` 1,408.85 Crores
Inception Date: 9 August 2004
Fund Manager: Mr. Harshal Joshi (w.e.f. 15th September 2015)
Other Parameter:
Standard Deviation (Annualized) 1.57%
Modified Duration 2.22 years
Average Maturity 2.67 years
Yield to Maturity 7.86%
Expense Ratio
Regular 0.54%
Direct 0.30%
Benchmark: CRISIL AAA Short Term Index (w.e.f. 26th September 2016)
SIP (Minimum Amount): ` 1000/-
SIP Frequency: Monthly
SIP Dates (Monthly): 1st, 5th, 7th, 10th, 15th, 20th and 25th
Investment Objective: Refer Pg No from 43 to 44
Minimum Investment Amount: ` 5,000/- and any amount thereafter
Option Available: Growth, Dividend - Daily, Weekly, Monthly, Quarterly, Annual & Periodic
Exit Load: Nil (w.e.f June 22nd, 2017)
NAV (`)
Plan Option Freq NAVRegular Plan Growth - 26.8684Regular Plan Dividend Monthly 10.3098Regular Plan Dividend Daily 10.1909Regular Plan Dividend Weekly 10.2265Regular Plan Dividend Quarterly 10.9476Regular Plan Dividend Periodic 13.0816Regular Plan Dividend Annual 10.2734
Name Rating % of NAV
Corporate Bond 61.88%HDFC AAA 13.26%Power Finance Corporation AAA 11.72%LIC Housing Finance AAA 9.63%M&M Financial Services AAA 6.70%Kotak Mahindra Prime AAA 5.23%Rural Electrification Corporation AAA 4.92%Cholamandalam Invt and Fin Co AA 2.82%HDB Financial Services AAA 2.49%Reliance Jio Infocomm AAA 1.80%Shriram Transport Finance Company AA+ 1.76%Bajaj Finance AAA 0.70%Export Import Bank of India AAA 0.44%Small Industries Dev Bank of India AAA 0.36%NTPC AAA 0.04%State Government Bond 28.52%8.62% Tamil Nadu SDL - 2023 SOV 3.67%8.56% Tamilnadu SDL - 2023 SOV 3.34%7.42% Maharashtra SDL - 2022 SOV 2.47%8.64% Haryana SDL - 2023 SOV 1.84%8.63% Tamilnadu SDL - 2023 SOV 1.83%8.66% Maharashtra SDL - 2022 SOV 1.83%8.66% Tamilnadu SDL - 2022 SOV 1.83%8.39% Rajasthan UDAY BOND - 2023 SOV 1.81%8.21% Rajasthan UDAY BOND - 2023 SOV 1.80%8.72% Andhra Pradesh SDL- 2023 SOV 1.47%8.6% Madhya Pradesh SDL - 2023 SOV 1.46%8.21% Haryana UDAY BOND - 2022 SOV 1.09%7.67% Tamilnadu UDAY BOND - 2023 SOV 0.87%8.69% Karnatak SDL - 2022 SOV 0.79%8.92% Karnatka SDL - 2022 SOV 0.37%8.65% Karnataka SDL - 2023 SOV 0.37%8.62% Maharashtra SDL - 2023 SOV 0.37%7.95% Maharastra SDL - 2023 SOV 0.36%7.71% Tamilnadu UDAY SDL - 2023 SOV 0.35%7.95% Tamil Nadu SDL - 2023 SOV 0.35%7.56% Andhra Pradesh SDL - 2021 SOV 0.18%7.77% Gujarat SDL - 2023 SOV 0.07%Zero Coupon Bond 2.49%LIC Housing Finance AAA 2.49%Commercial Paper 1.73%NABARD A1+ 1.73%Net Cash and Cash Equivalent 5.37%Grand Total 100.00%
Performance TableScheme Name CAGR Returns (%) Current Value of Investment of ` 10,000
1 Year 3 Years 5 YearsSince
Inception1 Year 3 Years 5 Years
SinceInception
IDFC Money Manager Fund – Investment Plan - Regular Plan - Growth*
5.20% 7.47% 8.07% 7.51% 10,520 12,407 14,741 26,855
CRISIL AAA Short Term Bond Index# 6.77% 8.09% 8.61% 8.23% 10,677 12,622 15,119 29,409
CRISIL 1 Year T-Bill## 5.87% 6.91% 7.05% 6.06% 10,587 12,217 14,060 22,316
Performance based on NAV as on 28/3/2018. Past performance may or may not be sustained in future. The performances given are of regular plan growth option. Regular and Direct Plans have different expense structure. Direct Plan shall have a lower expense ratio excluding distribution expenses, commission expenses etc. For other funds managed by the fund manager, please refer page no. 36 - 38 & the respective fund pages #Benchmark Returns. ##Alternate Benchmark Returns. Standard Deviation calculated on the basis of 1 year history of monthly data *Since Inception Regular Plan - Growth Aug 09, 2004.
Riskometer
Investors understand that their principal will be at Moderately Low Risk
This product is suitable for investors who are seeking*:
To generate short term stable returns with a low •risk strategy.Investments in good quality fixed income & •Money Market securities
*Investors should consult their financial advisers if in doubt about whether the product is suitable for them.
Asset Quality
AA2.82%
AAA Equivalent95.42%
AA+1.76%

27
IDFC Banking & PSU Debt Fund (The Fund (erstwhile IDFC Banking Debt Fund) has been repositioned with effect from June 12, 2017$$)An Open Ended Income Fund31st March 2018
FUND FEATURES PORTFOLIO
About the Fund: The Fund will predominantly invest in high quality money market and debt instruments of Banks, PSU and PFI.
Nature: Debt
Monthly Avg AUM: ` 900.02 Crores
Month end AUM: ` 883.80 Crores
Inception Date: 7 March 2013
Fund Manager: Mr. Anurag Mittal (w.e.f. 15th May 2017)
Other Parameter:
Standard Deviation (Annualized) 1.39%
Modified Duration 2.00 years
Average Maturity 2.45 years
Yield to Maturity 7.77%
Expense Ratio
Regular 0.52%
Direct 0.26%
Benchmark: Crisil Short Term Bond Fund Index (w.e.f. 12th June 2017)
SIP (Minimum Amount): ` 1000/-
SIP Frequency: Monthly
SIP Dates (Monthly): 1st, 5th, 7th, 10th, 15th, 20th and 25th
Investment Objective: Refer Pg No from 43 to 44
Minimum Investment Amount: ` 5,000/- and any amount thereafter
Option Available: Growth, Dividend - Daily, Fortnightly, Monthly (Reinvestment), Quarterly (Payout), Annual (Payout) & Periodic
Exit Load: Nil (w.e.f. June 12th 2017)
NAV (`)
Plan Option Freq NAVRegular Plan Growth - 14.7534Regular Plan Dividend - 10.7325Regular Plan Dividend Fortnightly 10.2422Regular Plan Dividend Daily 10.1029Regular Plan Dividend Monthly 10.2011Regular Plan Dividend Quarterly 10.5729Regular Plan Dividend Annual -
Name Rating % of NAV
Corporate Bond 83.93%
Indian Railway Finance Corporation AAA 11.86%
Power Finance Corporation AAA 11.31%
Rural Electrification Corporation AAA 10.92%
NABARD AAA 10.78%
Small Industries Dev Bank of India AAA 10.67%
Axis Bank AA+ 10.66%
Power Grid Corporation of India AAA 7.49%
IndusInd Bank AA 4.00%
ICICI Bank AA+ 3.42%
Export Import Bank of India AAA 2.81%
State Government Bond 5.76%
7.55% Maharastra SDL - 2021 SOV 2.84%
8.6% Madhya Pradesh SDL - 2023 SOV 1.75%
8.56% Tamilnadu SDL - 2023 SOV 1.17%
Commercial Paper 5.31%
HDFC A1+ 5.31%
Government Bond 1.75%
8.20% - 2022 G-Sec SOV 1.75%
Net Cash and Cash Equivalent 3.25%
Grand Total 100.00%
Performance TableScheme Name CAGR Returns (%) Current Value of Investment of ` 10,000
1 Year 3 Years 5 YearsSince
Inception1 Year 3 Years 5 Years
SinceInception
IDFC Banking & PSU Debt Fund - Regular Plan - Growth*
5.85% 7.18% 7.92% 7.98% 10,585 12,306 14,639 14,745
Crisil Short Term Bond Fund Index# 5.64% 6.95% 7.85% 7.86% 10,564 12,228 14,597 14,665
1 Year T-Bill## 5.87% 6.91% 7.05% 7.09% 10,587 12,217 14,060 14,143
Current Index performance adjusted for the period from since inception to June 12, 2017 with the performance of Crisil Short Term Bond Fund Index (Benchmark) & 1 Year T-Bill (Alternate Benchmark)Performance based on NAV as on 28/3/2018. Past performance may or may not be sustained in future.The performances given are of regular plan growth option.Regular and Direct Plans have different expense structure. Direct Plan shall have a lower expense ratio excluding distribution expenses, commission expenses etc.For other funds managed by the fund manager, please refer page no. 36 - 38 & the respective fund pages #Benchmark Returns. ##Alternate Benchmark Returns. Current Index performance adjusted for the period from since inception to June 12, 2017 with the performance of CRISIL Liquid Fund Index (Benchmark)Standard Deviation calculated on the basis of 1 year history of monthly data *Since Inception Regular Plan - Growth Mar 07, 2013. $$ For details please refer Notice (https://www.idfcmf.com/uploads/090520171306No-18-Change-in-Scheme-features-of-IDFC-Banking-Debt-Fund.pdf)
Riskometer
Investors understand that their principal will be at Moderately Risk
This product is suitable for investors who are seeking*:
Income over short to medium term• A debt fund that invests predominantly in debt & •money market instruments issued by PSU, Banks & PFI
*Investors should consult their financial advisers if in doubt about whether the product is suitable for them.
Asset Quality
AA+14.08%
AAA Equivalent81.91%
AA4.00%
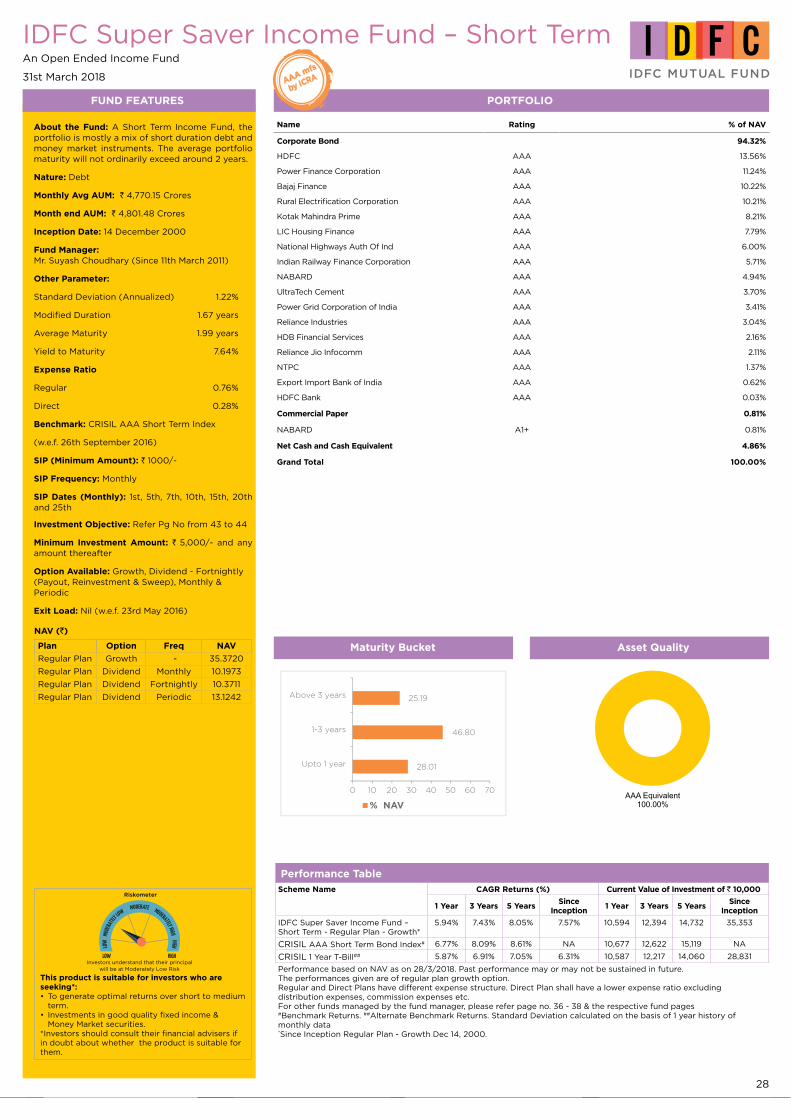
28
IDFC Super Saver Income Fund – Short TermAn Open Ended Income Fund
31st March 2018
FUND FEATURES PORTFOLIO
About the Fund: A Short Term Income Fund, the portfolio is mostly a mix of short duration debt and money market instruments. The average portfolio maturity will not ordinarily exceed around 2 years.
Nature: Debt
Monthly Avg AUM: ` 4,770.15 Crores
Month end AUM: ` 4,801.48 Crores
Inception Date: 14 December 2000
Fund Manager: Mr. Suyash Choudhary (Since 11th March 2011)
Other Parameter:
Standard Deviation (Annualized) 1.22%
Modified Duration 1.67 years
Average Maturity 1.99 years
Yield to Maturity 7.64%
Expense Ratio
Regular 0.76%
Direct 0.28%
Benchmark: CRISIL AAA Short Term Index
(w.e.f. 26th September 2016)
SIP (Minimum Amount): ` 1000/-
SIP Frequency: Monthly
SIP Dates (Monthly): 1st, 5th, 7th, 10th, 15th, 20th and 25th
Investment Objective: Refer Pg No from 43 to 44
Minimum Investment Amount: ` 5,000/- and any amount thereafter
Option Available: Growth, Dividend - Fortnightly (Payout, Reinvestment & Sweep), Monthly & Periodic
Exit Load: Nil (w.e.f. 23rd May 2016)
NAV (`)
Plan Option Freq NAV
Regular Plan Growth - 35.3720
Regular Plan Dividend Monthly 10.1973
Regular Plan Dividend Fortnightly 10.3711
Regular Plan Dividend Periodic 13.1242
Name Rating % of NAV
Corporate Bond 94.32%
HDFC AAA 13.56%
Power Finance Corporation AAA 11.24%
Bajaj Finance AAA 10.22%
Rural Electrification Corporation AAA 10.21%
Kotak Mahindra Prime AAA 8.21%
LIC Housing Finance AAA 7.79%
National Highways Auth Of Ind AAA 6.00%
Indian Railway Finance Corporation AAA 5.71%
NABARD AAA 4.94%
UltraTech Cement AAA 3.70%
Power Grid Corporation of India AAA 3.41%
Reliance Industries AAA 3.04%
HDB Financial Services AAA 2.16%
Reliance Jio Infocomm AAA 2.11%
NTPC AAA 1.37%
Export Import Bank of India AAA 0.62%
HDFC Bank AAA 0.03%
Commercial Paper 0.81%
NABARD A1+ 0.81%
Net Cash and Cash Equivalent 4.86%
Grand Total 100.00%
Performance TableScheme Name CAGR Returns (%) Current Value of Investment of ` 10,000
1 Year 3 Years 5 YearsSince
Inception1 Year 3 Years 5 Years
SinceInception
IDFC Super Saver Income Fund – Short Term - Regular Plan - Growth*
5.94% 7.43% 8.05% 7.57% 10,594 12,394 14,732 35,353
CRISIL AAA Short Term Bond Index# 6.77% 8.09% 8.61% NA 10,677 12,622 15,119 NA
CRISIL 1 Year T-Bill## 5.87% 6.91% 7.05% 6.31% 10,587 12,217 14,060 28,831
Performance based on NAV as on 28/3/2018. Past performance may or may not be sustained in future.The performances given are of regular plan growth option.Regular and Direct Plans have different expense structure. Direct Plan shall have a lower expense ratio excluding distribution expenses, commission expenses etc.For other funds managed by the fund manager, please refer page no. 36 - 38 & the respective fund pages #Benchmark Returns. ##Alternate Benchmark Returns. Standard Deviation calculated on the basis of 1 year history of monthly data *Since Inception Regular Plan - Growth Dec 14, 2000.
Riskometer
Investors understand that their principal will be at Moderately Low Risk
This product is suitable for investors who are seeking*:
To generate optimal returns over short to medium •term.Investments in good quality fixed income & •Money Market securities.
*Investors should consult their financial advisers if in doubt about whether the product is suitable for them.
Maturity Bucket Asset Quality
% NAV
0 10 20 30 40 50 60 70
Upto 1 year
1-3 years
Above 3 years
28.01
46.80
25.19
AAA Equivalent100.00%
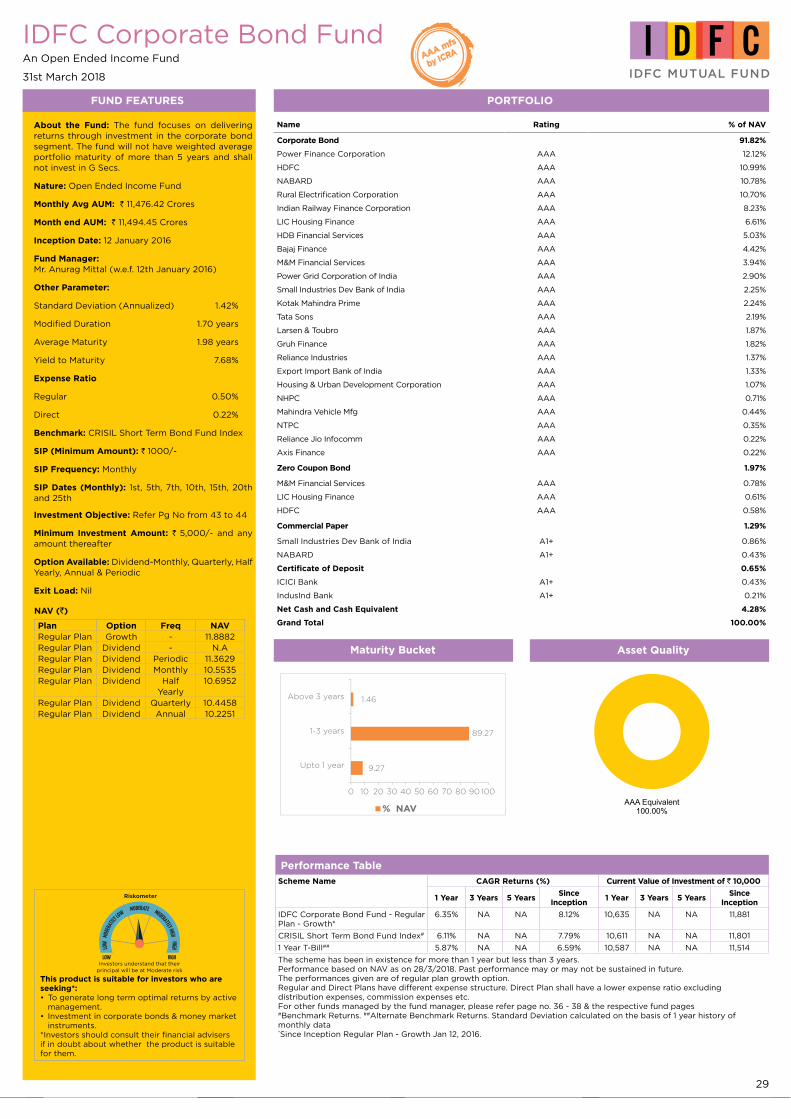
29
IDFC Corporate Bond FundAn Open Ended Income Fund
31st March 2018
FUND FEATURES PORTFOLIO
About the Fund: The fund focuses on delivering returns through investment in the corporate bond segment. The fund will not have weighted average portfolio maturity of more than 5 years and shall not invest in G Secs.
Nature: Open Ended Income Fund
Monthly Avg AUM: ` 11,476.42 Crores
Month end AUM: ` 11,494.45 Crores
Inception Date: 12 January 2016
Fund Manager: Mr. Anurag Mittal (w.e.f. 12th January 2016)
Other Parameter:
Standard Deviation (Annualized) 1.42%
Modified Duration 1.70 years
Average Maturity 1.98 years
Yield to Maturity 7.68%
Expense Ratio
Regular 0.50%
Direct 0.22%
Benchmark: CRISIL Short Term Bond Fund Index
SIP (Minimum Amount): ` 1000/-
SIP Frequency: Monthly
SIP Dates (Monthly): 1st, 5th, 7th, 10th, 15th, 20th and 25th
Investment Objective: Refer Pg No from 43 to 44
Minimum Investment Amount: ` 5,000/- and any amount thereafter
Option Available: Dividend-Monthly, Quarterly, Half Yearly, Annual & Periodic
Exit Load: Nil
NAV (`)
Plan Option Freq NAVRegular Plan Growth - 11.8882Regular Plan Dividend - N.ARegular Plan Dividend Periodic 11.3629Regular Plan Dividend Monthly 10.5535Regular Plan Dividend Half
Yearly10.6952
Regular Plan Dividend Quarterly 10.4458Regular Plan Dividend Annual 10.2251
Name Rating % of NAV
Corporate Bond 91.82%
Power Finance Corporation AAA 12.12%
HDFC AAA 10.99%
NABARD AAA 10.78%
Rural Electrification Corporation AAA 10.70%
Indian Railway Finance Corporation AAA 8.23%
LIC Housing Finance AAA 6.61%
HDB Financial Services AAA 5.03%
Bajaj Finance AAA 4.42%
M&M Financial Services AAA 3.94%
Power Grid Corporation of India AAA 2.90%
Small Industries Dev Bank of India AAA 2.25%
Kotak Mahindra Prime AAA 2.24%
Tata Sons AAA 2.19%
Larsen & Toubro AAA 1.87%
Gruh Finance AAA 1.82%
Reliance Industries AAA 1.37%
Export Import Bank of India AAA 1.33%
Housing & Urban Development Corporation AAA 1.07%
NHPC AAA 0.71%
Mahindra Vehicle Mfg AAA 0.44%
NTPC AAA 0.35%
Reliance Jio Infocomm AAA 0.22%
Axis Finance AAA 0.22%
Zero Coupon Bond 1.97%
M&M Financial Services AAA 0.78%
LIC Housing Finance AAA 0.61%
HDFC AAA 0.58%
Commercial Paper 1.29%
Small Industries Dev Bank of India A1+ 0.86%
NABARD A1+ 0.43%
Certificate of Deposit 0.65%
ICICI Bank A1+ 0.43%
IndusInd Bank A1+ 0.21%
Net Cash and Cash Equivalent 4.28%
Grand Total 100.00%
Performance TableScheme Name CAGR Returns (%) Current Value of Investment of ` 10,000
1 Year 3 Years 5 YearsSince
Inception1 Year 3 Years 5 Years
SinceInception
IDFC Corporate Bond Fund - Regular Plan - Growth*
6.35% NA NA 8.12% 10,635 NA NA 11,881
CRISIL Short Term Bond Fund Index# 6.11% NA NA 7.79% 10,611 NA NA 11,801
1 Year T-Bill## 5.87% NA NA 6.59% 10,587 NA NA 11,514
The scheme has been in existence for more than 1 year but less than 3 years.Performance based on NAV as on 28/3/2018. Past performance may or may not be sustained in future.The performances given are of regular plan growth option.Regular and Direct Plans have different expense structure. Direct Plan shall have a lower expense ratio excluding distribution expenses, commission expenses etc.For other funds managed by the fund manager, please refer page no. 36 - 38 & the respective fund pages #Benchmark Returns. ##Alternate Benchmark Returns. Standard Deviation calculated on the basis of 1 year history of monthly data *Since Inception Regular Plan - Growth Jan 12, 2016.
Riskometer
Investors understand that theirprincipal will be at Moderate risk
This product is suitable for investors who are seeking*:
To generate long term optimal returns by active •management.Investment in corporate bonds & money market •instruments.
*Investors should consult their financial advisers if in doubt about whether the product is suitable for them.
Asset Quality
AAA Equivalent100.00%
Maturity Bucket
% NAV
0 10 20 30 40 50 60 70 80 90 100
Upto 1 year
1-3 years
Above 3 years
9.27
1.46
89.27
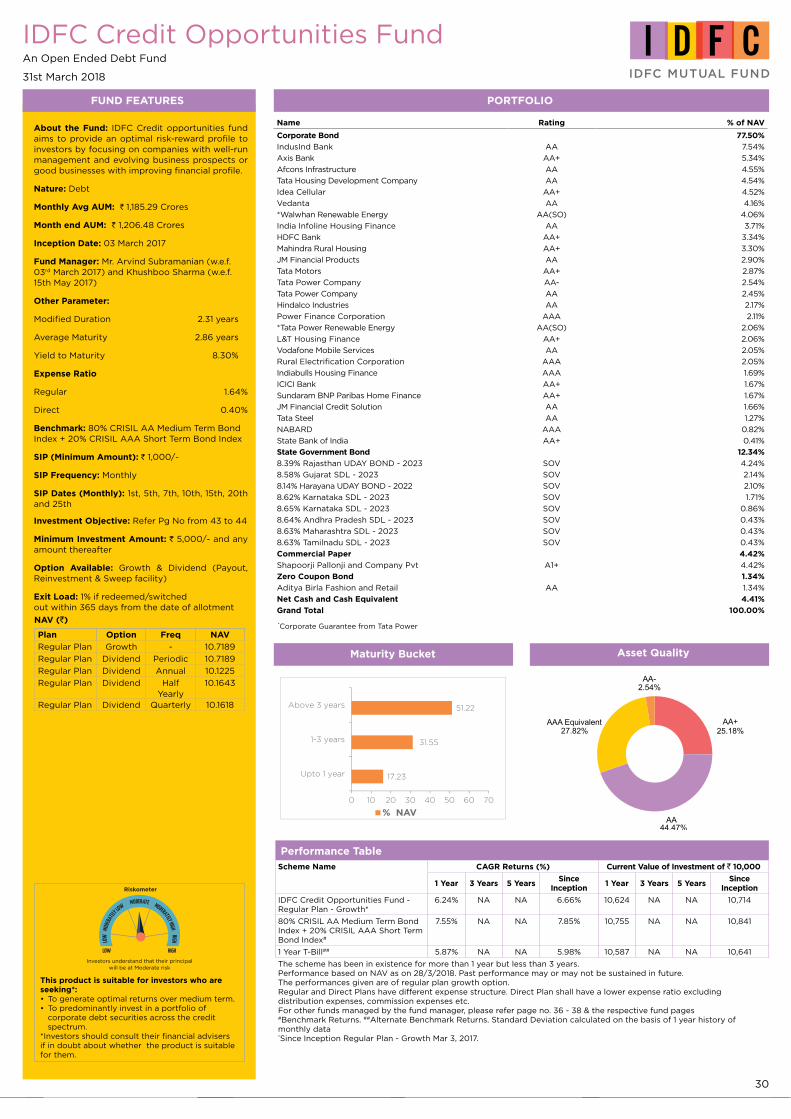
30
IDFC Credit Opportunities FundAn Open Ended Debt Fund
31st March 2018
FUND FEATURES PORTFOLIO
About the Fund: IDFC Credit opportunities fund aims to provide an optimal risk-reward profile to investors by focusing on companies with well-run management and evolving business prospects or good businesses with improving financial profile.
Nature: Debt
Monthly Avg AUM: ` 1,185.29 Crores
Month end AUM: ` 1,206.48 Crores
Inception Date: 03 March 2017
Fund Manager: Mr. Arvind Subramanian (w.e.f. 03rd March 2017) and Khushboo Sharma (w.e.f. 15th May 2017)
Other Parameter:
Modified Duration 2.31 years
Average Maturity 2.86 years
Yield to Maturity 8.30%
Expense Ratio
Regular 1.64%
Direct 0.40%
Benchmark: 80% CRISIL AA Medium Term Bond Index + 20% CRISIL AAA Short Term Bond Index
SIP (Minimum Amount): ` 1,000/-
SIP Frequency: Monthly
SIP Dates (Monthly): 1st, 5th, 7th, 10th, 15th, 20th and 25th
Investment Objective: Refer Pg No from 43 to 44
Minimum Investment Amount: ` 5,000/- and any amount thereafter
Option Available: Growth & Dividend (Payout, Reinvestment & Sweep facility)
Exit Load: 1% if redeemed/switched out within 365 days from the date of allotment
NAV (`)
Plan Option Freq NAV
Regular Plan Growth - 10.7189
Regular Plan Dividend Periodic 10.7189
Regular Plan Dividend Annual 10.1225
Regular Plan Dividend Half Yearly
10.1643
Regular Plan Dividend Quarterly 10.1618
Name Rating % of NAV
Corporate Bond 77.50%
IndusInd Bank AA 7.54%
Axis Bank AA+ 5.34%
Afcons Infrastructure AA 4.55%
Tata Housing Development Company AA 4.54%
Idea Cellular AA+ 4.52%
Vedanta AA 4.16%
*Walwhan Renewable Energy AA(SO) 4.06%
India Infoline Housing Finance AA 3.71%
HDFC Bank AA+ 3.34%
Mahindra Rural Housing AA+ 3.30%
JM Financial Products AA 2.90%
Tata Motors AA+ 2.87%
Tata Power Company AA- 2.54%
Tata Power Company AA 2.45%
Hindalco Industries AA 2.17%
Power Finance Corporation AAA 2.11%
*Tata Power Renewable Energy AA(SO) 2.06%
L&T Housing Finance AA+ 2.06%
Vodafone Mobile Services AA 2.05%
Rural Electrification Corporation AAA 2.05%
Indiabulls Housing Finance AAA 1.69%
ICICI Bank AA+ 1.67%
Sundaram BNP Paribas Home Finance AA+ 1.67%
JM Financial Credit Solution AA 1.66%
Tata Steel AA 1.27%
NABARD AAA 0.82%
State Bank of India AA+ 0.41%
State Government Bond 12.34%
8.39% Rajasthan UDAY BOND - 2023 SOV 4.24%
8.58% Gujarat SDL - 2023 SOV 2.14%
8.14% Harayana UDAY BOND - 2022 SOV 2.10%
8.62% Karnataka SDL - 2023 SOV 1.71%
8.65% Karnataka SDL - 2023 SOV 0.86%
8.64% Andhra Pradesh SDL - 2023 SOV 0.43%
8.63% Maharashtra SDL - 2023 SOV 0.43%
8.63% Tamilnadu SDL - 2023 SOV 0.43%
Commercial Paper 4.42%
Shapoorji Pallonji and Company Pvt A1+ 4.42%
Zero Coupon Bond 1.34%
Aditya Birla Fashion and Retail AA 1.34%
Net Cash and Cash Equivalent 4.41%
Grand Total 100.00%
Riskometer
Investors understand that their principal will be at Moderate risk
This product is suitable for investors who are seeking*:
To generate optimal returns over medium term.•To predominantly invest in a portfolio of •corporate debt securities across the credit spectrum.
*Investors should consult their financial advisers if in doubt about whether the product is suitable for them.
Asset Quality
*Corporate Guarantee from Tata Power
AAA Equivalent
AA
AA-
AA+27.82%
44.47%
2.54%
25.18%
Maturity Bucket
% NAV
0 10 20 30 40 50 60 70
Upto 1 year
1-3 years
Above 3 years
17.23
31.55
51.22
Performance TableScheme Name CAGR Returns (%) Current Value of Investment of ` 10,000
1 Year 3 Years 5 YearsSince
Inception1 Year 3 Years 5 Years
SinceInception
IDFC Credit Opportunities Fund - Regular Plan - Growth*
6.24% NA NA 6.66% 10,624 NA NA 10,714
80% CRISIL AA Medium Term Bond Index + 20% CRISIL AAA Short Term Bond Index#
7.55% NA NA 7.85% 10,755 NA NA 10,841
1 Year T-Bill## 5.87% NA NA 5.98% 10,587 NA NA 10,641
The scheme has been in existence for more than 1 year but less than 3 years.Performance based on NAV as on 28/3/2018. Past performance may or may not be sustained in future.The performances given are of regular plan growth option.Regular and Direct Plans have different expense structure. Direct Plan shall have a lower expense ratio excluding distribution expenses, commission expenses etc.For other funds managed by the fund manager, please refer page no. 36 - 38 & the respective fund pages #Benchmark Returns. ##Alternate Benchmark Returns. Standard Deviation calculated on the basis of 1 year history of monthly data *Since Inception Regular Plan - Growth Mar 3, 2017.
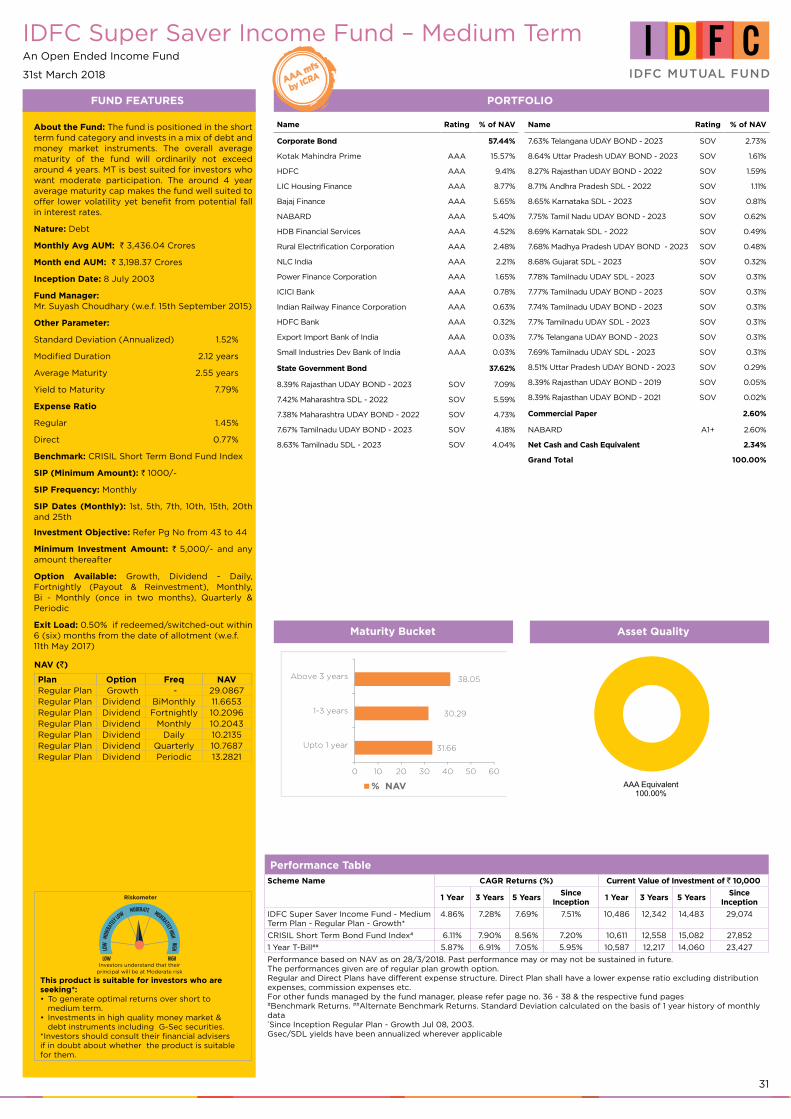
31
IDFC Super Saver Income Fund – Medium TermAn Open Ended Income Fund
31st March 2018
FUND FEATURES PORTFOLIO
About the Fund: The fund is positioned in the short term fund category and invests in a mix of debt and money market instruments. The overall average maturity of the fund will ordinarily not exceed around 4 years. MT is best suited for investors who want moderate participation. The around 4 year average maturity cap makes the fund well suited to offer lower volatility yet benefit from potential fall in interest rates.
Nature: Debt
Monthly Avg AUM: ` 3,436.04 Crores
Month end AUM: ` 3,198.37 Crores
Inception Date: 8 July 2003
Fund Manager: Mr. Suyash Choudhary (w.e.f. 15th September 2015)
Other Parameter:
Standard Deviation (Annualized) 1.52%
Modified Duration 2.12 years
Average Maturity 2.55 years
Yield to Maturity 7.79%
Expense Ratio
Regular 1.45%
Direct 0.77%
Benchmark: CRISIL Short Term Bond Fund Index
SIP (Minimum Amount): ` 1000/-
SIP Frequency: Monthly
SIP Dates (Monthly): 1st, 5th, 7th, 10th, 15th, 20th and 25th
Investment Objective: Refer Pg No from 43 to 44
Minimum Investment Amount: ` 5,000/- and any amount thereafter
Option Available: Growth, Dividend - Daily, Fortnightly (Payout & Reinvestment), Monthly, Bi - Monthly (once in two months), Quarterly & Periodic
Exit Load: 0.50% if redeemed/switched-out within 6 (six) months from the date of allotment (w.e.f. 11th May 2017)
NAV (`)
Plan Option Freq NAVRegular Plan Growth - 29.0867Regular Plan Dividend BiMonthly 11.6653Regular Plan Dividend Fortnightly 10.2096Regular Plan Dividend Monthly 10.2043Regular Plan Dividend Daily 10.2135Regular Plan Dividend Quarterly 10.7687Regular Plan Dividend Periodic 13.2821
Name Rating % of NAV
Corporate Bond 57.44%
Kotak Mahindra Prime AAA 15.57%
HDFC AAA 9.41%
LIC Housing Finance AAA 8.77%
Bajaj Finance AAA 5.65%
NABARD AAA 5.40%
HDB Financial Services AAA 4.52%
Rural Electrification Corporation AAA 2.48%
NLC India AAA 2.21%
Power Finance Corporation AAA 1.65%
ICICI Bank AAA 0.78%
Indian Railway Finance Corporation AAA 0.63%
HDFC Bank AAA 0.32%
Export Import Bank of India AAA 0.03%
Small Industries Dev Bank of India AAA 0.03%
State Government Bond 37.62%
8.39% Rajasthan UDAY BOND - 2023 SOV 7.09%
7.42% Maharashtra SDL - 2022 SOV 5.59%
7.38% Maharashtra UDAY BOND - 2022 SOV 4.73%
7.67% Tamilnadu UDAY BOND - 2023 SOV 4.18%
8.63% Tamilnadu SDL - 2023 SOV 4.04%
Performance TableScheme Name CAGR Returns (%) Current Value of Investment of ` 10,000
1 Year 3 Years 5 YearsSince
Inception1 Year 3 Years 5 Years
SinceInception
IDFC Super Saver Income Fund - Medium Term Plan - Regular Plan - Growth*
4.86% 7.28% 7.69% 7.51% 10,486 12,342 14,483 29,074
CRISIL Short Term Bond Fund Index# 6.11% 7.90% 8.56% 7.20% 10,611 12,558 15,082 27,852
1 Year T-Bill## 5.87% 6.91% 7.05% 5.95% 10,587 12,217 14,060 23,427
Performance based on NAV as on 28/3/2018. Past performance may or may not be sustained in future.The performances given are of regular plan growth option.Regular and Direct Plans have different expense structure. Direct Plan shall have a lower expense ratio excluding distribution expenses, commission expenses etc.For other funds managed by the fund manager, please refer page no. 36 - 38 & the respective fund pages #Benchmark Returns. ##Alternate Benchmark Returns. Standard Deviation calculated on the basis of 1 year history of monthly data *Since Inception Regular Plan - Growth Jul 08, 2003. Gsec/SDL yields have been annualized wherever applicable
Name Rating % of NAV
7.63% Telangana UDAY BOND - 2023 SOV 2.73%
8.64% Uttar Pradesh UDAY BOND - 2023 SOV 1.61%
8.27% Rajasthan UDAY BOND - 2022 SOV 1.59%
8.71% Andhra Pradesh SDL - 2022 SOV 1.11%
8.65% Karnataka SDL - 2023 SOV 0.81%
7.75% Tamil Nadu UDAY BOND - 2023 SOV 0.62%
8.69% Karnatak SDL - 2022 SOV 0.49%
7.68% Madhya Pradesh UDAY BOND - 2023 SOV 0.48%
8.68% Gujarat SDL - 2023 SOV 0.32%
7.78% Tamilnadu UDAY SDL - 2023 SOV 0.31%
7.77% Tamilnadu UDAY BOND - 2023 SOV 0.31%
7.74% Tamilnadu UDAY BOND - 2023 SOV 0.31%
7.7% Tamilnadu UDAY SDL - 2023 SOV 0.31%
7.7% Telangana UDAY BOND - 2023 SOV 0.31%
7.69% Tamilnadu UDAY SDL - 2023 SOV 0.31%
8.51% Uttar Pradesh UDAY BOND - 2023 SOV 0.29%
8.39% Rajasthan UDAY BOND - 2019 SOV 0.05%
8.39% Rajasthan UDAY BOND - 2021 SOV 0.02%
Commercial Paper 2.60%
NABARD A1+ 2.60%
Net Cash and Cash Equivalent 2.34%
Grand Total 100.00%
Riskometer
Investors understand that theirprincipal will be at Moderate risk
This product is suitable for investors who are seeking*:
To generate optimal returns over short to •medium term.Investments in high quality money market & •debt instruments including G-Sec securities.
*Investors should consult their financial advisers if in doubt about whether the product is suitable for them.
Maturity Bucket Asset Quality
AAA Equivalent100.00%
% NAV
0 10 20 30 40 50 60
Upto 1 year
1-3 years
Above 3 years
31.66
30.29
38.05
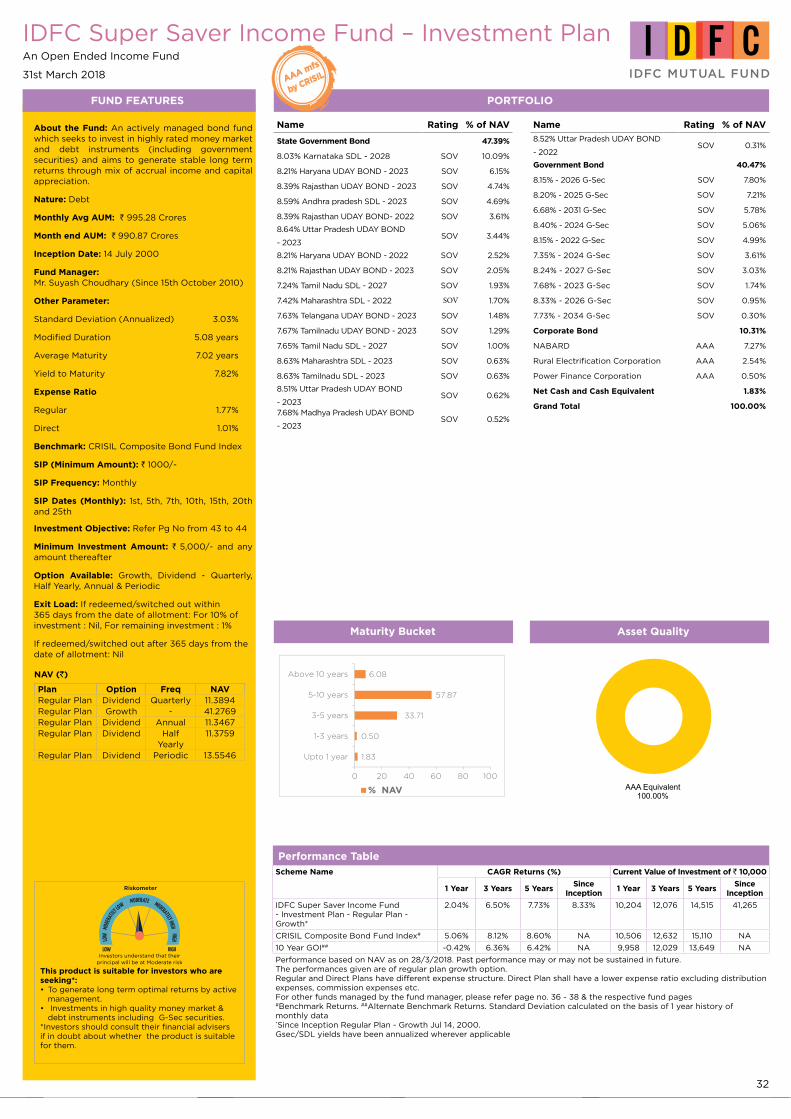
32
IDFC Super Saver Income Fund – Investment PlanAn Open Ended Income Fund
31st March 2018
FUND FEATURES PORTFOLIO
About the Fund: An actively managed bond fund which seeks to invest in highly rated money market and debt instruments (including government securities) and aims to generate stable long term returns through mix of accrual income and capital appreciation.
Nature: Debt
Monthly Avg AUM: ` 995.28 Crores
Month end AUM: ` 990.87 Crores
Inception Date: 14 July 2000
Fund Manager: Mr. Suyash Choudhary (Since 15th October 2010)
Other Parameter:
Standard Deviation (Annualized) 3.03%
Modified Duration 5.08 years
Average Maturity 7.02 years
Yield to Maturity 7.82%
Expense Ratio
Regular 1.77%
Direct 1.01%
Benchmark: CRISIL Composite Bond Fund Index
SIP (Minimum Amount): ` 1000/-
SIP Frequency: Monthly
SIP Dates (Monthly): 1st, 5th, 7th, 10th, 15th, 20th and 25th
Investment Objective: Refer Pg No from 43 to 44
Minimum Investment Amount: ` 5,000/- and any amount thereafter
Option Available: Growth, Dividend - Quarterly, Half Yearly, Annual & Periodic
Exit Load: If redeemed/switched out within 365 days from the date of allotment: For 10% of investment : Nil, For remaining investment : 1%
If redeemed/switched out after 365 days from the date of allotment: Nil
NAV (`)
Plan Option Freq NAVRegular Plan Dividend Quarterly 11.3894Regular Plan Growth - 41.2769Regular Plan Dividend Annual 11.3467Regular Plan Dividend Half
Yearly11.3759
Regular Plan Dividend Periodic 13.5546
Name Rating % of NAV
State Government Bond 47.39%
8.03% Karnataka SDL - 2028 SOV 10.09%
8.21% Haryana UDAY BOND - 2023 SOV 6.15%
8.39% Rajasthan UDAY BOND - 2023 SOV 4.74%
8.59% Andhra pradesh SDL - 2023 SOV 4.69%
8.39% Rajasthan UDAY BOND- 2022 SOV 3.61%
8.64% Uttar Pradesh UDAY BOND
- 2023SOV 3.44%
8.21% Haryana UDAY BOND - 2022 SOV 2.52%
8.21% Rajasthan UDAY BOND - 2023 SOV 2.05%
7.24% Tamil Nadu SDL - 2027 SOV 1.93%
7.42% Maharashtra SDL - 2022 SOV 1.70%
7.63% Telangana UDAY BOND - 2023 SOV 1.48%
7.67% Tamilnadu UDAY BOND - 2023 SOV 1.29%
7.65% Tamil Nadu SDL - 2027 SOV 1.00%
8.63% Maharashtra SDL - 2023 SOV 0.63%
8.63% Tamilnadu SDL - 2023 SOV 0.63%
8.51% Uttar Pradesh UDAY BOND
- 2023SOV 0.62%
7.68% Madhya Pradesh UDAY BOND
- 2023SOV 0.52%
Performance TableScheme Name CAGR Returns (%) Current Value of Investment of ` 10,000
1 Year 3 Years 5 YearsSince
Inception1 Year 3 Years 5 Years
SinceInception
IDFC Super Saver Income Fund - Investment Plan - Regular Plan - Growth*
2.04% 6.50% 7.73% 8.33% 10,204 12,076 14,515 41,265
CRISIL Composite Bond Fund Index# 5.06% 8.12% 8.60% NA 10,506 12,632 15,110 NA
10 Year GOI## -0.42% 6.36% 6.42% NA 9,958 12,029 13,649 NA
Performance based on NAV as on 28/3/2018. Past performance may or may not be sustained in future.The performances given are of regular plan growth option.Regular and Direct Plans have different expense structure. Direct Plan shall have a lower expense ratio excluding distribution expenses, commission expenses etc.For other funds managed by the fund manager, please refer page no. 36 - 38 & the respective fund pages #Benchmark Returns. ##Alternate Benchmark Returns. Standard Deviation calculated on the basis of 1 year history of monthly data *Since Inception Regular Plan - Growth Jul 14, 2000. Gsec/SDL yields have been annualized wherever applicable
Name Rating % of NAV
8.52% Uttar Pradesh UDAY BOND
- 2022SOV 0.31%
Government Bond 40.47%
8.15% - 2026 G-Sec SOV 7.80%
8.20% - 2025 G-Sec SOV 7.21%
6.68% - 2031 G-Sec SOV 5.78%
8.40% - 2024 G-Sec SOV 5.06%
8.15% - 2022 G-Sec SOV 4.99%
7.35% - 2024 G-Sec SOV 3.61%
8.24% - 2027 G-Sec SOV 3.03%
7.68% - 2023 G-Sec SOV 1.74%
8.33% - 2026 G-Sec SOV 0.95%
7.73% - 2034 G-Sec SOV 0.30%
Corporate Bond 10.31%
NABARD AAA 7.27%
Rural Electrification Corporation AAA 2.54%
Power Finance Corporation AAA 0.50%
Net Cash and Cash Equivalent 1.83%
Grand Total 100.00%
Riskometer
Investors understand that theirprincipal will be at Moderate risk
This product is suitable for investors who are seeking*:
To generate long term optimal returns by active •management. Investments in high quality money market & •debt instruments including G-Sec securities.
*Investors should consult their financial advisers if in doubt about whether the product is suitable for them.
Maturity Bucket Asset Quality
AAA Equivalent
100.00%
1.83
0.50
33.71
57.87
6.08
% NAV
0 20 40 60 80 100
Upto 1 year
1-3 years
3-5 years
5-10 years
Above 10 years
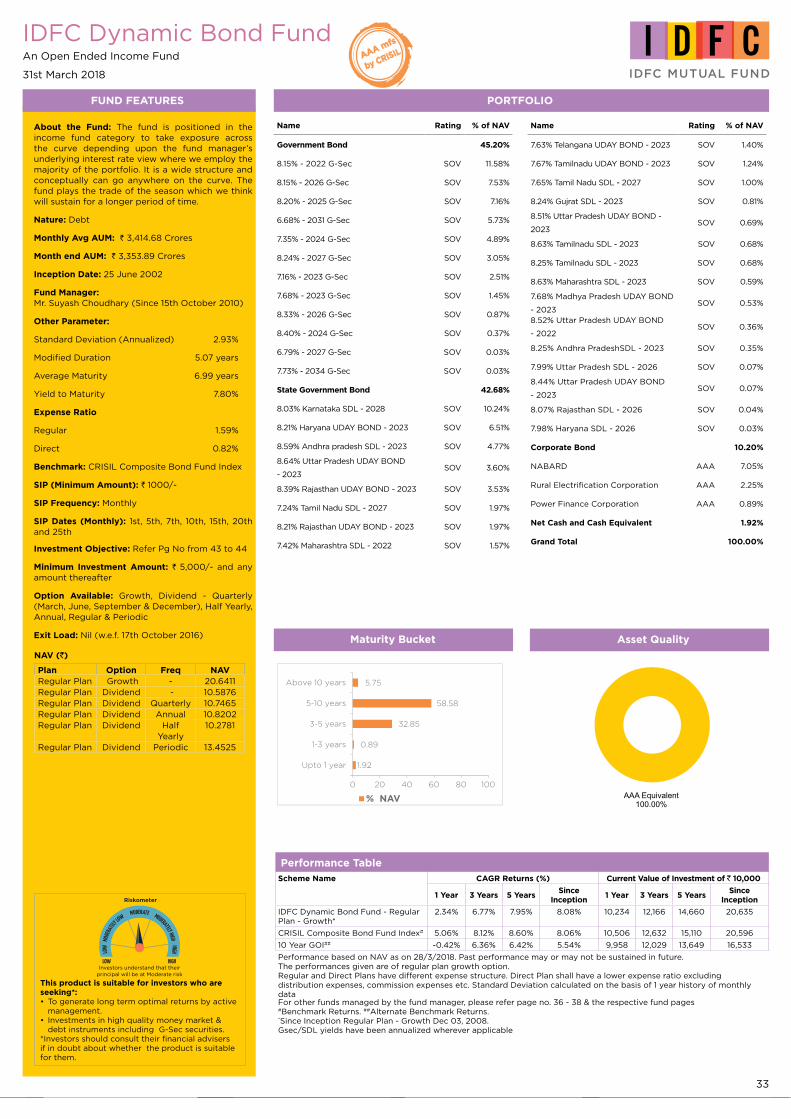
33
IDFC Dynamic Bond FundAn Open Ended Income Fund
31st March 2018
FUND FEATURES PORTFOLIO
About the Fund: The fund is positioned in the income fund category to take exposure across the curve depending upon the fund manager’s underlying interest rate view where we employ the majority of the portfolio. It is a wide structure and conceptually can go anywhere on the curve. The fund plays the trade of the season which we think will sustain for a longer period of time.
Nature: Debt
Monthly Avg AUM: ` 3,414.68 Crores
Month end AUM: ` 3,353.89 Crores
Inception Date: 25 June 2002
Fund Manager: Mr. Suyash Choudhary (Since 15th October 2010)
Other Parameter:
Standard Deviation (Annualized) 2.93%
Modified Duration 5.07 years
Average Maturity 6.99 years
Yield to Maturity 7.80%
Expense Ratio
Regular 1.59%
Direct 0.82%
Benchmark: CRISIL Composite Bond Fund Index
SIP (Minimum Amount): ` 1000/-
SIP Frequency: Monthly
SIP Dates (Monthly): 1st, 5th, 7th, 10th, 15th, 20th and 25th
Investment Objective: Refer Pg No from 43 to 44
Minimum Investment Amount: ` 5,000/- and any amount thereafter
Option Available: Growth, Dividend - Quarterly (March, June, September & December), Half Yearly, Annual, Regular & Periodic
Exit Load: Nil (w.e.f. 17th October 2016)
NAV (`)
Plan Option Freq NAVRegular Plan Growth - 20.6411Regular Plan Dividend - 10.5876Regular Plan Dividend Quarterly 10.7465Regular Plan Dividend Annual 10.8202Regular Plan Dividend Half
Yearly10.2781
Regular Plan Dividend Periodic 13.4525
Name Rating % of NAV
Government Bond 45.20%
8.15% - 2022 G-Sec SOV 11.58%
8.15% - 2026 G-Sec SOV 7.53%
8.20% - 2025 G-Sec SOV 7.16%
6.68% - 2031 G-Sec SOV 5.73%
7.35% - 2024 G-Sec SOV 4.89%
8.24% - 2027 G-Sec SOV 3.05%
7.16% - 2023 G-Sec SOV 2.51%
7.68% - 2023 G-Sec SOV 1.45%
8.33% - 2026 G-Sec SOV 0.87%
8.40% - 2024 G-Sec SOV 0.37%
6.79% - 2027 G-Sec SOV 0.03%
7.73% - 2034 G-Sec SOV 0.03%
State Government Bond 42.68%
8.03% Karnataka SDL - 2028 SOV 10.24%
8.21% Haryana UDAY BOND - 2023 SOV 6.51%
8.59% Andhra pradesh SDL - 2023 SOV 4.77%
8.64% Uttar Pradesh UDAY BOND
- 2023SOV 3.60%
8.39% Rajasthan UDAY BOND - 2023 SOV 3.53%
7.24% Tamil Nadu SDL - 2027 SOV 1.97%
8.21% Rajasthan UDAY BOND - 2023 SOV 1.97%
7.42% Maharashtra SDL - 2022 SOV 1.57%
Performance TableScheme Name CAGR Returns (%) Current Value of Investment of ` 10,000
1 Year 3 Years 5 YearsSince
Inception1 Year 3 Years 5 Years
SinceInception
IDFC Dynamic Bond Fund - Regular Plan - Growth*
2.34% 6.77% 7.95% 8.08% 10,234 12,166 14,660 20,635
CRISIL Composite Bond Fund Index# 5.06% 8.12% 8.60% 8.06% 10,506 12,632 15,110 20,596
10 Year GOI## -0.42% 6.36% 6.42% 5.54% 9,958 12,029 13,649 16,533
Performance based on NAV as on 28/3/2018. Past performance may or may not be sustained in future.The performances given are of regular plan growth option.Regular and Direct Plans have different expense structure. Direct Plan shall have a lower expense ratio excluding distribution expenses, commission expenses etc. Standard Deviation calculated on the basis of 1 year history of monthly dataFor other funds managed by the fund manager, please refer page no. 36 - 38 & the respective fund pages #Benchmark Returns. ##Alternate Benchmark Returns. *Since Inception Regular Plan - Growth Dec 03, 2008. Gsec/SDL yields have been annualized wherever applicable
Name Rating % of NAV
7.63% Telangana UDAY BOND - 2023 SOV 1.40%
7.67% Tamilnadu UDAY BOND - 2023 SOV 1.24%
7.65% Tamil Nadu SDL - 2027 SOV 1.00%
8.24% Gujrat SDL - 2023 SOV 0.81%
8.51% Uttar Pradesh UDAY BOND -
2023SOV 0.69%
8.63% Tamilnadu SDL - 2023 SOV 0.68%
8.25% Tamilnadu SDL - 2023 SOV 0.68%
8.63% Maharashtra SDL - 2023 SOV 0.59%
7.68% Madhya Pradesh UDAY BOND
- 2023SOV 0.53%
8.52% Uttar Pradesh UDAY BOND
- 2022SOV 0.36%
8.25% Andhra PradeshSDL - 2023 SOV 0.35%
7.99% Uttar Pradesh SDL - 2026 SOV 0.07%
8.44% Uttar Pradesh UDAY BOND
- 2023SOV 0.07%
8.07% Rajasthan SDL - 2026 SOV 0.04%
7.98% Haryana SDL - 2026 SOV 0.03%
Corporate Bond 10.20%
NABARD AAA 7.05%
Rural Electrification Corporation AAA 2.25%
Power Finance Corporation AAA 0.89%
Net Cash and Cash Equivalent 1.92%
Grand Total 100.00%
Riskometer
Investors understand that theirprincipal will be at Moderate risk
This product is suitable for investors who are seeking*:
To generate long term optimal returns by active •management.Investments in high quality money market & •debt instruments including G-Sec securities.
*Investors should consult their financial advisers if in doubt about whether the product is suitable for them.
Maturity Bucket Asset Quality
AAA Equivalent100.00%
1.92
0.89
32.85
58.58
5.75
% NAV
0 20 40 60 80 100
Upto 1 year
1-3 years
3-5 years
5-10 years
Above 10 years
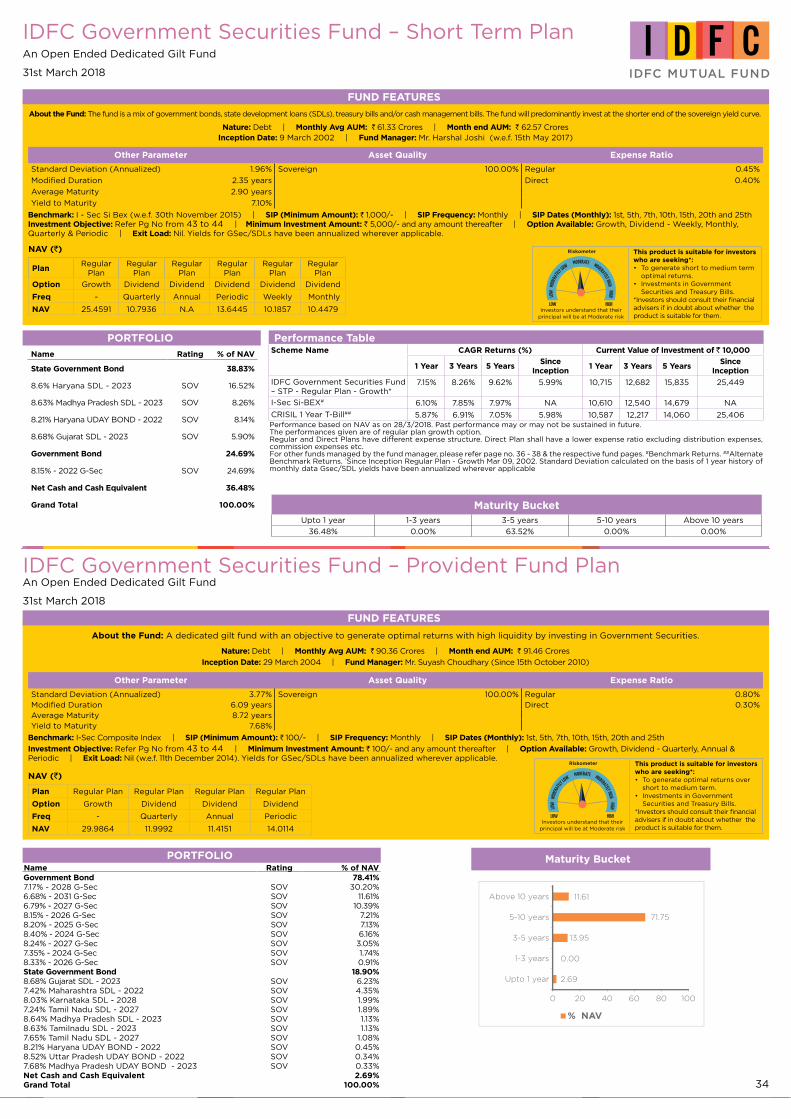
34
PORTFOLIOName Rating % of NAVGovernment Bond 78.41%7.17% - 2028 G-Sec SOV 30.20%6.68% - 2031 G-Sec SOV 11.61%6.79% - 2027 G-Sec SOV 10.39%8.15% - 2026 G-Sec SOV 7.21%8.20% - 2025 G-Sec SOV 7.13%8.40% - 2024 G-Sec SOV 6.16%8.24% - 2027 G-Sec SOV 3.05%7.35% - 2024 G-Sec SOV 1.74%8.33% - 2026 G-Sec SOV 0.91%State Government Bond 18.90%8.68% Gujarat SDL - 2023 SOV 6.23%7.42% Maharashtra SDL - 2022 SOV 4.35%8.03% Karnataka SDL - 2028 SOV 1.99%7.24% Tamil Nadu SDL - 2027 SOV 1.89%8.64% Madhya Pradesh SDL - 2023 SOV 1.13%8.63% Tamilnadu SDL - 2023 SOV 1.13%7.65% Tamil Nadu SDL - 2027 SOV 1.08%8.21% Haryana UDAY BOND - 2022 SOV 0.45%8.52% Uttar Pradesh UDAY BOND - 2022 SOV 0.34%7.68% Madhya Pradesh UDAY BOND - 2023 SOV 0.33%Net Cash and Cash Equivalent 2.69%Grand Total 100.00%
FUND FEATURES
About the Fund: A dedicated gilt fund with an objective to generate optimal returns with high liquidity by investing in Government Securities.
Nature: Debt | Monthly Avg AUM: ` 90.36 Crores | Month end AUM: ` 91.46 Crores
Inception Date: 29 March 2004 | Fund Manager: Mr. Suyash Choudhary (Since 15th October 2010)
Other Parameter Asset Quality Expense Ratio
Standard Deviation (Annualized) 3.77% Sovereign 100.00% Regular 0.80%Modified Duration 6.09 years Direct 0.30%Average Maturity 8.72 yearsYield to Maturity 7.68%
Benchmark: I-Sec Composite Index | SIP (Minimum Amount): ` 100/- | SIP Frequency: Monthly | SIP Dates (Monthly): 1st, 5th, 7th, 10th, 15th, 20th and 25th
Investment Objective: Refer Pg No from 43 to 44 | Minimum Investment Amount: ` 100/- and any amount thereafter | Option Available: Growth, Dividend - Quarterly, Annual & Periodic | Exit Load: Nil (w.e.f. 11th December 2014). Yields for GSec/SDLs have been annualized wherever applicable.
NAV (`)
Plan Regular Plan Regular Plan Regular Plan Regular Plan
Option Growth Dividend Dividend Dividend
Freq - Quarterly Annual Periodic
NAV 29.9864 11.9992 11.4151 14.0114
Riskometer
Investors understand that theirprincipal will be at Moderate risk
This product is suitable for investors who are seeking*:
To generate optimal returns over •short to medium term.Investments in Government •Securities and Treasury Bills.
*Investors should consult their financial advisers if in doubt about whether the product is suitable for them.
Performance TableScheme Name CAGR Returns (%) Current Value of Investment of ` 10,000
1 Year 3 Years 5 YearsSince
Inception1 Year 3 Years 5 Years
Since Inception
IDFC Government Securities Fund – STP - Regular Plan - Growth*
7.15% 8.26% 9.62% 5.99% 10,715 12,682 15,835 25,449
I-Sec Si-BEX# 6.10% 7.85% 7.97% NA 10,610 12,540 14,679 NA
CRISIL 1 Year T-Bill## 5.87% 6.91% 7.05% 5.98% 10,587 12,217 14,060 25,406Performance based on NAV as on 28/3/2018. Past performance may or may not be sustained in future. The performances given are of regular plan growth option.Regular and Direct Plans have different expense structure. Direct Plan shall have a lower expense ratio excluding distribution expenses, commission expenses etc.For other funds managed by the fund manager, please refer page no. 36 - 38 & the respective fund pages. #Benchmark Returns. ##Alternate Benchmark Returns. *Since Inception Regular Plan - Growth Mar 09, 2002. Standard Deviation calculated on the basis of 1 year history of monthly data Gsec/SDL yields have been annualized wherever applicable
`
IDFC Government Securities Fund – Short Term PlanAn Open Ended Dedicated Gilt Fund
31st March 2018
FUND FEATURES
About the Fund: The fund is a mix of government bonds, state development loans (SDLs), treasury bills and/or cash management bills. The fund will predominantly invest at the shorter end of the sovereign yield curve.
Nature: Debt | Monthly Avg AUM: ` 61.33 Crores | Month end AUM: ` 62.57 CroresInception Date: 9 March 2002 | Fund Manager: Mr. Harshal Joshi (w.e.f. 15th May 2017)
Other Parameter Asset Quality Expense Ratio
Standard Deviation (Annualized) 1.96% Sovereign 100.00% Regular 0.45%
Modified Duration 2.35 years Direct 0.40%
Average Maturity 2.90 years
Yield to Maturity 7.10%
Benchmark: I - Sec Si Bex (w.e.f. 30th November 2015) | SIP (Minimum Amount): ` 1,000/- | SIP Frequency: Monthly | SIP Dates (Monthly): 1st, 5th, 7th, 10th, 15th, 20th and 25th Investment Objective: Refer Pg No from 43 to 44 | Minimum Investment Amount: ` 5,000/- and any amount thereafter | Option Available: Growth, Dividend - Weekly, Monthly, Quarterly & Periodic | Exit Load: Nil. Yields for GSec/SDLs have been annualized wherever applicable.
NAV (`)
PlanRegular
Plan Regular
Plan Regular
Plan Regular
Plan Regular
Plan Regular
Plan
Option Growth Dividend Dividend Dividend Dividend Dividend
Freq - Quarterly Annual Periodic Weekly Monthly
NAV 25.4591 10.7936 N.A 13.6445 10.1857 10.4479
PORTFOLIO
Name Rating % of NAV
State Government Bond 38.83%
8.6% Haryana SDL - 2023 SOV 16.52%
8.63% Madhya Pradesh SDL - 2023 SOV 8.26%
8.21% Haryana UDAY BOND - 2022 SOV 8.14%
8.68% Gujarat SDL - 2023 SOV 5.90%
Government Bond 24.69%
8.15% - 2022 G-Sec SOV 24.69%
Net Cash and Cash Equivalent 36.48%
Grand Total 100.00%
Riskometer
Investors understand that theirprincipal will be at Moderate risk
This product is suitable for investors who are seeking*:
To generate short to medium term •optimal returns. Investments in Government •Securities and Treasury Bills.
*Investors should consult their financial advisers if in doubt about whether the product is suitable for them.
IDFC Government Securities Fund – Provident Fund PlanAn Open Ended Dedicated Gilt Fund
31st March 2018
Maturity BucketUpto 1 year 1-3 years 3-5 years 5-10 years Above 10 years
36.48% 0.00% 63.52% 0.00% 0.00%
Maturity Bucket
Above 10 years
% NAV
0 20 40 60 80 100
Upto 1 year
1-3 years
3-5 years
5-10 years
2.69
0.00
13.95
71.75
11.61
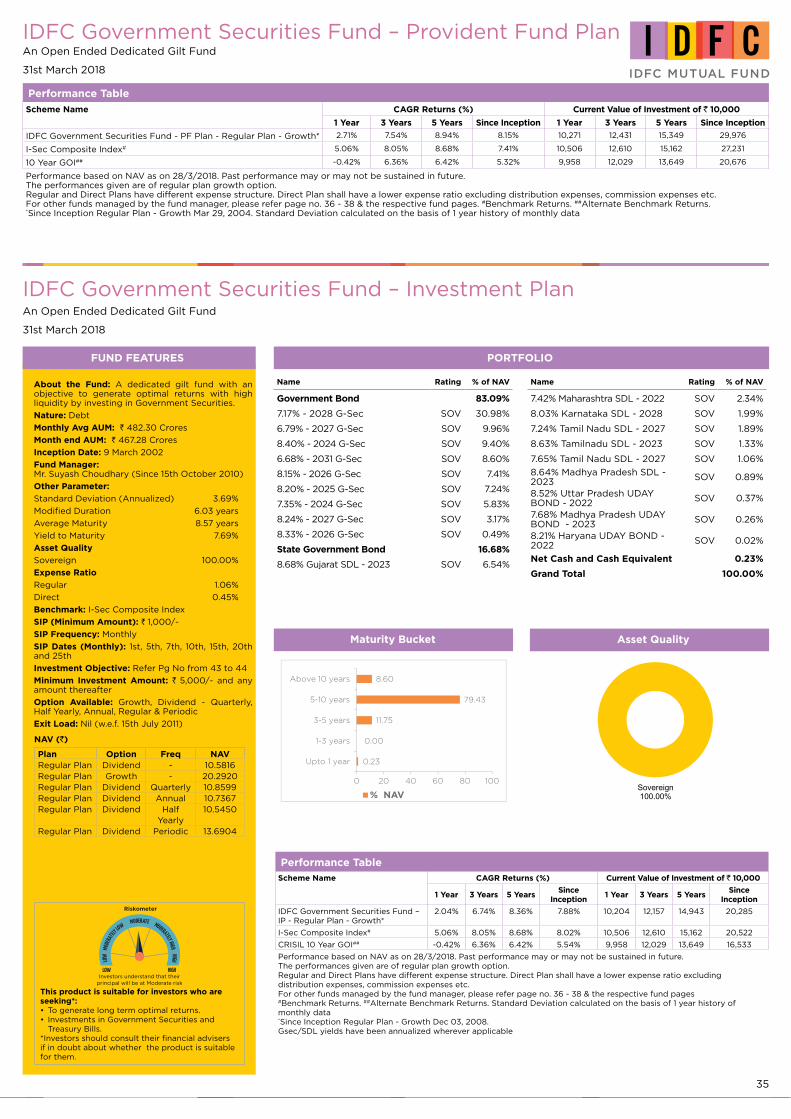
35
IDFC Government Securities Fund – Investment PlanAn Open Ended Dedicated Gilt Fund
31st March 2018
FUND FEATURES PORTFOLIO
About the Fund: A dedicated gilt fund with an objective to generate optimal returns with high liquidity by investing in Government Securities.
Nature: Debt
Monthly Avg AUM: ` 482.30 Crores
Month end AUM: ` 467.28 Crores
Inception Date: 9 March 2002
Fund Manager: Mr. Suyash Choudhary (Since 15th October 2010)
Other Parameter:
Standard Deviation (Annualized) 3.69%
Modified Duration 6.03 years
Average Maturity 8.57 years
Yield to Maturity 7.69%
Asset Quality
Sovereign 100.00%
Expense Ratio
Regular 1.06%
Direct 0.45%
Benchmark: I-Sec Composite Index
SIP (Minimum Amount): ` 1,000/-
SIP Frequency: Monthly
SIP Dates (Monthly): 1st, 5th, 7th, 10th, 15th, 20th and 25th
Investment Objective: Refer Pg No from 43 to 44
Minimum Investment Amount: ` 5,000/- and any amount thereafter
Option Available: Growth, Dividend - Quarterly, Half Yearly, Annual, Regular & Periodic
Exit Load: Nil (w.e.f. 15th July 2011)
NAV (`)
Plan Option Freq NAVRegular Plan Dividend - 10.5816Regular Plan Growth - 20.2920Regular Plan Dividend Quarterly 10.8599Regular Plan Dividend Annual 10.7367Regular Plan Dividend Half
Yearly10.5450
Regular Plan Dividend Periodic 13.6904
Name Rating % of NAV
Government Bond 83.09%
7.17% - 2028 G-Sec SOV 30.98%
6.79% - 2027 G-Sec SOV 9.96%
8.40% - 2024 G-Sec SOV 9.40%
6.68% - 2031 G-Sec SOV 8.60%
8.15% - 2026 G-Sec SOV 7.41%
8.20% - 2025 G-Sec SOV 7.24%
7.35% - 2024 G-Sec SOV 5.83%
8.24% - 2027 G-Sec SOV 3.17%
8.33% - 2026 G-Sec SOV 0.49%
State Government Bond 16.68%
8.68% Gujarat SDL - 2023 SOV 6.54%
Name Rating % of NAV
7.42% Maharashtra SDL - 2022 SOV 2.34%
8.03% Karnataka SDL - 2028 SOV 1.99%
7.24% Tamil Nadu SDL - 2027 SOV 1.89%
8.63% Tamilnadu SDL - 2023 SOV 1.33%
7.65% Tamil Nadu SDL - 2027 SOV 1.06%
8.64% Madhya Pradesh SDL - 2023 SOV 0.89%
8.52% Uttar Pradesh UDAY BOND - 2022 SOV 0.37%
7.68% Madhya Pradesh UDAY BOND - 2023 SOV 0.26%
8.21% Haryana UDAY BOND - 2022 SOV 0.02%
Net Cash and Cash Equivalent 0.23%
Grand Total 100.00%
Riskometer
Investors understand that theirprincipal will be at Moderate risk
This product is suitable for investors who are seeking*:
To generate long term optimal returns. •Investments in Government Securities and •Treasury Bills.
*Investors should consult their financial advisers if in doubt about whether the product is suitable for them.
Performance TableScheme Name CAGR Returns (%) Current Value of Investment of ` 10,000
1 Year 3 Years 5 YearsSince
Inception1 Year 3 Years 5 Years
SinceInception
IDFC Government Securities Fund – IP - Regular Plan - Growth*
2.04% 6.74% 8.36% 7.88% 10,204 12,157 14,943 20,285
I-Sec Composite Index# 5.06% 8.05% 8.68% 8.02% 10,506 12,610 15,162 20,522
CRISIL 10 Year GOI## -0.42% 6.36% 6.42% 5.54% 9,958 12,029 13,649 16,533
Performance based on NAV as on 28/3/2018. Past performance may or may not be sustained in future.The performances given are of regular plan growth option.Regular and Direct Plans have different expense structure. Direct Plan shall have a lower expense ratio excluding distribution expenses, commission expenses etc.For other funds managed by the fund manager, please refer page no. 36 - 38 & the respective fund pages#Benchmark Returns. ##Alternate Benchmark Returns. Standard Deviation calculated on the basis of 1 year history of monthly data *Since Inception Regular Plan - Growth Dec 03, 2008. Gsec/SDL yields have been annualized wherever applicable
IDFC Government Securities Fund – Provident Fund PlanAn Open Ended Dedicated Gilt Fund
31st March 2018
Performance Table
Scheme Name CAGR Returns (%) Current Value of Investment of ` 10,000
1 Year 3 Years 5 Years Since Inception 1 Year 3 Years 5 Years Since Inception
IDFC Government Securities Fund - PF Plan - Regular Plan - Growth* 2.71% 7.54% 8.94% 8.15% 10,271 12,431 15,349 29,976
I-Sec Composite Index# 5.06% 8.05% 8.68% 7.41% 10,506 12,610 15,162 27,231
10 Year GOI## -0.42% 6.36% 6.42% 5.32% 9,958 12,029 13,649 20,676
Performance based on NAV as on 28/3/2018. Past performance may or may not be sustained in future. The performances given are of regular plan growth option. Regular and Direct Plans have different expense structure. Direct Plan shall have a lower expense ratio excluding distribution expenses, commission expenses etc.For other funds managed by the fund manager, please refer page no. 36 - 38 & the respective fund pages. #Benchmark Returns. ##Alternate Benchmark Returns. *Since Inception Regular Plan - Growth Mar 29, 2004. Standard Deviation calculated on the basis of 1 year history of monthly data
Maturity Bucket Asset Quality
Sovereign100.00%% NAV
0 20 40 60 80 100
Upto 1 year
1-3 years
3-5 years
5-10 years
Above 10 years
0.23
0.00
11.75
79.43
8.60
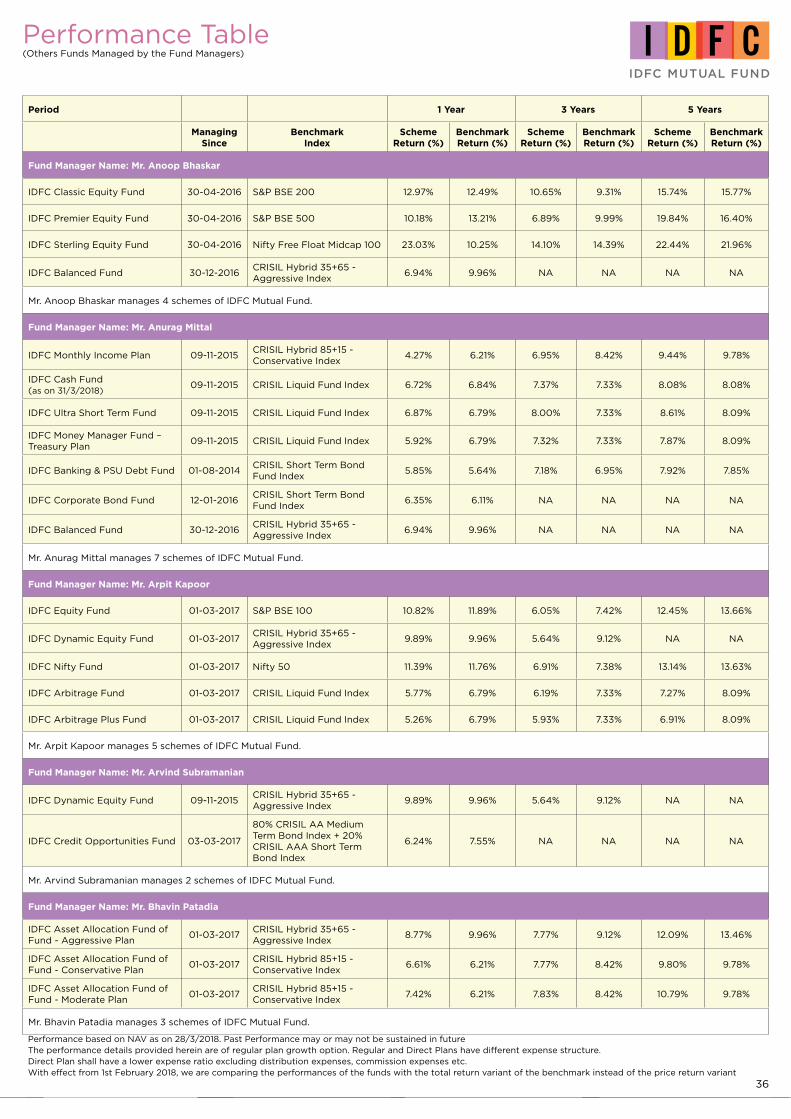
36
Period 1 Year 3 Years 5 Years
ManagingSince
BenchmarkIndex
SchemeReturn (%)
BenchmarkReturn (%)
SchemeReturn (%)
BenchmarkReturn (%)
SchemeReturn (%)
BenchmarkReturn (%)
Fund Manager Name: Mr. Anoop Bhaskar
IDFC Classic Equity Fund 30-04-2016 S&P BSE 200 12.97% 12.49% 10.65% 9.31% 15.74% 15.77%
IDFC Premier Equity Fund 30-04-2016 S&P BSE 500 10.18% 13.21% 6.89% 9.99% 19.84% 16.40%
IDFC Sterling Equity Fund 30-04-2016 Nifty Free Float Midcap 100 23.03% 10.25% 14.10% 14.39% 22.44% 21.96%
IDFC Balanced Fund 30-12-2016CRISIL Hybrid 35+65 - Aggressive Index
6.94% 9.96% NA NA NA NA
Mr. Anoop Bhaskar manages 4 schemes of IDFC Mutual Fund.
Fund Manager Name: Mr. Anurag Mittal
IDFC Monthly Income Plan 09-11-2015CRISIL Hybrid 85+15 - Conservative Index
4.27% 6.21% 6.95% 8.42% 9.44% 9.78%
IDFC Cash Fund (as on 31/3/2018)
09-11-2015 CRISIL Liquid Fund Index 6.72% 6.84% 7.37% 7.33% 8.08% 8.08%
IDFC Ultra Short Term Fund 09-11-2015 CRISIL Liquid Fund Index 6.87% 6.79% 8.00% 7.33% 8.61% 8.09%
IDFC Money Manager Fund – Treasury Plan
09-11-2015 CRISIL Liquid Fund Index 5.92% 6.79% 7.32% 7.33% 7.87% 8.09%
IDFC Banking & PSU Debt Fund 01-08-2014CRISIL Short Term Bond Fund Index
5.85% 5.64% 7.18% 6.95% 7.92% 7.85%
IDFC Corporate Bond Fund 12-01-2016CRISIL Short Term Bond Fund Index
6.35% 6.11% NA NA NA NA
IDFC Balanced Fund 30-12-2016CRISIL Hybrid 35+65 - Aggressive Index
6.94% 9.96% NA NA NA NA
Mr. Anurag Mittal manages 7 schemes of IDFC Mutual Fund.
Fund Manager Name: Mr. Arpit Kapoor
IDFC Equity Fund 01-03-2017 S&P BSE 100 10.82% 11.89% 6.05% 7.42% 12.45% 13.66%
IDFC Dynamic Equity Fund 01-03-2017CRISIL Hybrid 35+65 - Aggressive Index
9.89% 9.96% 5.64% 9.12% NA NA
IDFC Nifty Fund 01-03-2017 Nifty 50 11.39% 11.76% 6.91% 7.38% 13.14% 13.63%
IDFC Arbitrage Fund 01-03-2017 CRISIL Liquid Fund Index 5.77% 6.79% 6.19% 7.33% 7.27% 8.09%
IDFC Arbitrage Plus Fund 01-03-2017 CRISIL Liquid Fund Index 5.26% 6.79% 5.93% 7.33% 6.91% 8.09%
Mr. Arpit Kapoor manages 5 schemes of IDFC Mutual Fund.
Fund Manager Name: Mr. Arvind Subramanian
IDFC Dynamic Equity Fund 09-11-2015CRISIL Hybrid 35+65 - Aggressive Index
9.89% 9.96% 5.64% 9.12% NA NA
IDFC Credit Opportunities Fund 03-03-2017
80% CRISIL AA Medium Term Bond Index + 20% CRISIL AAA Short Term Bond Index
6.24% 7.55% NA NA NA NA
Mr. Arvind Subramanian manages 2 schemes of IDFC Mutual Fund.
Fund Manager Name: Mr. Bhavin Patadia
IDFC Asset Allocation Fund of Fund - Aggressive Plan
01-03-2017CRISIL Hybrid 35+65 - Aggressive Index
8.77% 9.96% 7.77% 9.12% 12.09% 13.46%
IDFC Asset Allocation Fund of Fund - Conservative Plan
01-03-2017CRISIL Hybrid 85+15 - Conservative Index
6.61% 6.21% 7.77% 8.42% 9.80% 9.78%
IDFC Asset Allocation Fund of Fund - Moderate Plan
01-03-2017CRISIL Hybrid 85+15 - Conservative Index
7.42% 6.21% 7.83% 8.42% 10.79% 9.78%
Mr. Bhavin Patadia manages 3 schemes of IDFC Mutual Fund.
Performance Table (Others Funds Managed by the Fund Managers)
Performance based on NAV as on 28/3/2018. Past Performance may or may not be sustained in futureThe performance details provided herein are of regular plan growth option. Regular and Direct Plans have different expense structure. Direct Plan shall have a lower expense ratio excluding distribution expenses, commission expenses etc.With effect from 1st February 2018, we are comparing the performances of the funds with the total return variant of the benchmark instead of the price return variant
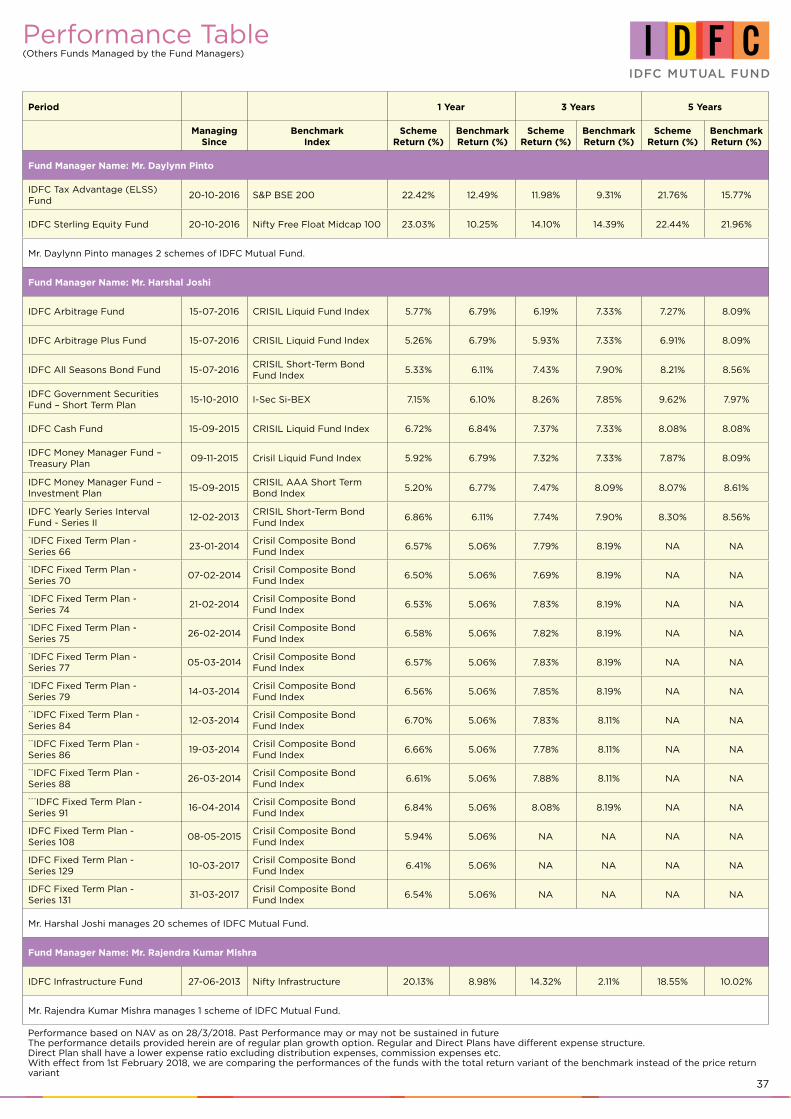
37
Period 1 Year 3 Years 5 Years
ManagingSince
BenchmarkIndex
SchemeReturn (%)
BenchmarkReturn (%)
SchemeReturn (%)
BenchmarkReturn (%)
SchemeReturn (%)
BenchmarkReturn (%)
Fund Manager Name: Mr. Daylynn Pinto
IDFC Tax Advantage (ELSS) Fund
20-10-2016 S&P BSE 200 22.42% 12.49% 11.98% 9.31% 21.76% 15.77%
IDFC Sterling Equity Fund 20-10-2016 Nifty Free Float Midcap 100 23.03% 10.25% 14.10% 14.39% 22.44% 21.96%
Mr. Daylynn Pinto manages 2 schemes of IDFC Mutual Fund.
Fund Manager Name: Mr. Harshal Joshi
IDFC Arbitrage Fund 15-07-2016 CRISIL Liquid Fund Index 5.77% 6.79% 6.19% 7.33% 7.27% 8.09%
IDFC Arbitrage Plus Fund 15-07-2016 CRISIL Liquid Fund Index 5.26% 6.79% 5.93% 7.33% 6.91% 8.09%
IDFC All Seasons Bond Fund 15-07-2016CRISIL Short-Term Bond Fund Index
5.33% 6.11% 7.43% 7.90% 8.21% 8.56%
IDFC Government Securities Fund – Short Term Plan
15-10-2010 I-Sec Si-BEX 7.15% 6.10% 8.26% 7.85% 9.62% 7.97%
IDFC Cash Fund 15-09-2015 CRISIL Liquid Fund Index 6.72% 6.84% 7.37% 7.33% 8.08% 8.08%
IDFC Money Manager Fund – Treasury Plan
09-11-2015 Crisil Liquid Fund Index 5.92% 6.79% 7.32% 7.33% 7.87% 8.09%
IDFC Money Manager Fund – Investment Plan
15-09-2015CRISIL AAA Short Term Bond Index
5.20% 6.77% 7.47% 8.09% 8.07% 8.61%
IDFC Yearly Series Interval Fund - Series II
12-02-2013CRISIL Short-Term Bond Fund Index
6.86% 6.11% 7.74% 7.90% 8.30% 8.56%
^IDFC Fixed Term Plan - Series 66
23-01-2014Crisil Composite Bond Fund Index
6.57% 5.06% 7.79% 8.19% NA NA
^IDFC Fixed Term Plan - Series 70
07-02-2014Crisil Composite Bond Fund Index
6.50% 5.06% 7.69% 8.19% NA NA
^IDFC Fixed Term Plan - Series 74
21-02-2014Crisil Composite Bond Fund Index
6.53% 5.06% 7.83% 8.19% NA NA
^IDFC Fixed Term Plan - Series 75
26-02-2014Crisil Composite Bond Fund Index
6.58% 5.06% 7.82% 8.19% NA NA
^IDFC Fixed Term Plan - Series 77
05-03-2014Crisil Composite Bond Fund Index
6.57% 5.06% 7.83% 8.19% NA NA
^IDFC Fixed Term Plan - Series 79
14-03-2014Crisil Composite Bond Fund Index
6.56% 5.06% 7.85% 8.19% NA NA
^^IDFC Fixed Term Plan - Series 84
12-03-2014Crisil Composite Bond Fund Index
6.70% 5.06% 7.83% 8.11% NA NA
^^IDFC Fixed Term Plan - Series 86
19-03-2014Crisil Composite Bond Fund Index
6.66% 5.06% 7.78% 8.11% NA NA
^^IDFC Fixed Term Plan - Series 88
26-03-2014Crisil Composite Bond Fund Index
6.61% 5.06% 7.88% 8.11% NA NA
^^^IDFC Fixed Term Plan - Series 91
16-04-2014Crisil Composite Bond Fund Index
6.84% 5.06% 8.08% 8.19% NA NA
IDFC Fixed Term Plan - Series 108
08-05-2015Crisil Composite Bond Fund Index
5.94% 5.06% NA NA NA NA
IDFC Fixed Term Plan - Series 129
10-03-2017Crisil Composite Bond Fund Index
6.41% 5.06% NA NA NA NA
IDFC Fixed Term Plan - Series 131
31-03-2017Crisil Composite Bond Fund Index
6.54% 5.06% NA NA NA NA
Mr. Harshal Joshi manages 20 schemes of IDFC Mutual Fund.
Fund Manager Name: Mr. Rajendra Kumar Mishra
IDFC Infrastructure Fund 27-06-2013 Nifty Infrastructure 20.13% 8.98% 14.32% 2.11% 18.55% 10.02%
Mr. Rajendra Kumar Mishra manages 1 scheme of IDFC Mutual Fund.
Performance Table (Others Funds Managed by the Fund Managers)
Performance based on NAV as on 28/3/2018. Past Performance may or may not be sustained in futureThe performance details provided herein are of regular plan growth option. Regular and Direct Plans have different expense structure. Direct Plan shall have a lower expense ratio excluding distribution expenses, commission expenses etc.With effect from 1st February 2018, we are comparing the performances of the funds with the total return variant of the benchmark instead of the price return variant
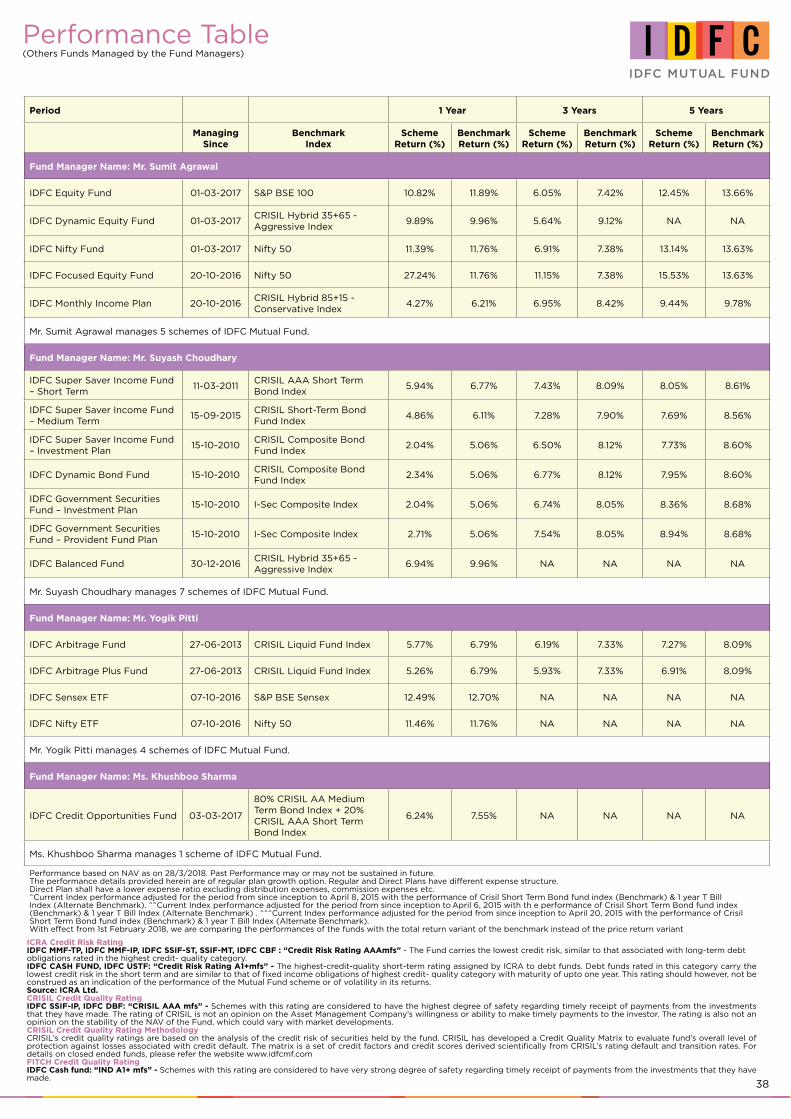
38
Period 1 Year 3 Years 5 Years
ManagingSince
BenchmarkIndex
SchemeReturn (%)
BenchmarkReturn (%)
SchemeReturn (%)
BenchmarkReturn (%)
SchemeReturn (%)
BenchmarkReturn (%)
Fund Manager Name: Mr. Sumit Agrawal
IDFC Equity Fund 01-03-2017 S&P BSE 100 10.82% 11.89% 6.05% 7.42% 12.45% 13.66%
IDFC Dynamic Equity Fund 01-03-2017CRISIL Hybrid 35+65 - Aggressive Index
9.89% 9.96% 5.64% 9.12% NA NA
IDFC Nifty Fund 01-03-2017 Nifty 50 11.39% 11.76% 6.91% 7.38% 13.14% 13.63%
IDFC Focused Equity Fund 20-10-2016 Nifty 50 27.24% 11.76% 11.15% 7.38% 15.53% 13.63%
IDFC Monthly Income Plan 20-10-2016CRISIL Hybrid 85+15 - Conservative Index
4.27% 6.21% 6.95% 8.42% 9.44% 9.78%
Mr. Sumit Agrawal manages 5 schemes of IDFC Mutual Fund.
Fund Manager Name: Mr. Suyash Choudhary
IDFC Super Saver Income Fund – Short Term
11-03-2011CRISIL AAA Short Term Bond Index
5.94% 6.77% 7.43% 8.09% 8.05% 8.61%
IDFC Super Saver Income Fund – Medium Term
15-09-2015CRISIL Short-Term Bond Fund Index
4.86% 6.11% 7.28% 7.90% 7.69% 8.56%
IDFC Super Saver Income Fund – Investment Plan
15-10-2010CRISIL Composite Bond Fund Index
2.04% 5.06% 6.50% 8.12% 7.73% 8.60%
IDFC Dynamic Bond Fund 15-10-2010CRISIL Composite Bond Fund Index
2.34% 5.06% 6.77% 8.12% 7.95% 8.60%
IDFC Government Securities Fund – Investment Plan
15-10-2010 I-Sec Composite Index 2.04% 5.06% 6.74% 8.05% 8.36% 8.68%
IDFC Government Securities Fund – Provident Fund Plan
15-10-2010 I-Sec Composite Index 2.71% 5.06% 7.54% 8.05% 8.94% 8.68%
IDFC Balanced Fund 30-12-2016CRISIL Hybrid 35+65 - Aggressive Index
6.94% 9.96% NA NA NA NA
Mr. Suyash Choudhary manages 7 schemes of IDFC Mutual Fund.
Fund Manager Name: Mr. Yogik Pitti
IDFC Arbitrage Fund 27-06-2013 CRISIL Liquid Fund Index 5.77% 6.79% 6.19% 7.33% 7.27% 8.09%
IDFC Arbitrage Plus Fund 27-06-2013 CRISIL Liquid Fund Index 5.26% 6.79% 5.93% 7.33% 6.91% 8.09%
IDFC Sensex ETF 07-10-2016 S&P BSE Sensex 12.49% 12.70% NA NA NA NA
IDFC Nifty ETF 07-10-2016 Nifty 50 11.46% 11.76% NA NA NA NA
Mr. Yogik Pitti manages 4 schemes of IDFC Mutual Fund.
Fund Manager Name: Ms. Khushboo Sharma
IDFC Credit Opportunities Fund 03-03-2017
80% CRISIL AA Medium Term Bond Index + 20% CRISIL AAA Short Term Bond Index
6.24% 7.55% NA NA NA NA
Ms. Khushboo Sharma manages 1 scheme of IDFC Mutual Fund.
Performance based on NAV as on 28/3/2018. Past Performance may or may not be sustained in future.The performance details provided herein are of regular plan growth option. Regular and Direct Plans have different expense structure. Direct Plan shall have a lower expense ratio excluding distribution expenses, commission expenses etc.^Current Index performance adjusted for the period from since inception to April 8, 2015 with the performance of Crisil Short Term Bond fund index (Benchmark) & 1 year T Bill Index (Alternate Benchmark). ^^Current Index performance adjusted for the period from since inception to April 6, 2015 with th e performance of Crisil Short Term Bond fund index (Benchmark) & 1 year T Bill Index (Alternate Benchmark) . ^^^Current Index performance adjusted for the period from since inception to April 20, 2015 with the performance of Crisil Short Term Bond fund index (Benchmark) & 1 year T Bill Index (Alternate Benchmark).With effect from 1st February 2018, we are comparing the performances of the funds with the total return variant of the benchmark instead of the price return variant
Performance Table (Others Funds Managed by the Fund Managers)
ICRA Credit Risk RatingIDFC MMF-TP, IDFC MMF-IP, IDFC SSIF-ST, SSIF-MT, IDFC CBF : “Credit Risk Rating AAAmfs” - The Fund carries the lowest credit risk, similar to that associated with long-term debt obligations rated in the highest credit- quality category.IDFC CASH FUND, IDFC USTF: “Credit Risk Rating A1+mfs” - The highest-credit-quality short-term rating assigned by ICRA to debt funds. Debt funds rated in this category carry the lowest credit risk in the short term and are similar to that of fixed income obligations of highest credit- quality category with maturity of upto one year. This rating should however, not be construed as an indication of the performance of the Mutual Fund scheme or of volatility in its returns.Source: ICRA Ltd.CRISIL Credit Quality RatingIDFC SSIF-IP, IDFC DBF: “CRISIL AAA mfs” - Schemes with this rating are considered to have the highest degree of safety regarding timely receipt of payments from the investments that they have made. The rating of CRISIL is not an opinion on the Asset Management Company’s willingness or ability to make timely payments to the investor. The rating is also not an opinion on the stability of the NAV of the Fund, which could vary with market developments.CRISIL Credit Quality Rating MethodologyCRISIL’s credit quality ratings are based on the analysis of the credit risk of securities held by the fund. CRISIL has developed a Credit Quality Matrix to evaluate fund’s overall level of protection against losses associated with credit default. The matrix is a set of credit factors and credit scores derived scientifically from CRISIL’s rating default and transition rates. For details on closed ended funds, please refer the website www.idfcmf.comFITCH Credit Quality RatingIDFC Cash fund: “IND A1+ mfs” - Schemes with this rating are considered to have very strong degree of safety regarding timely receipt of payments from the investments that they have made.
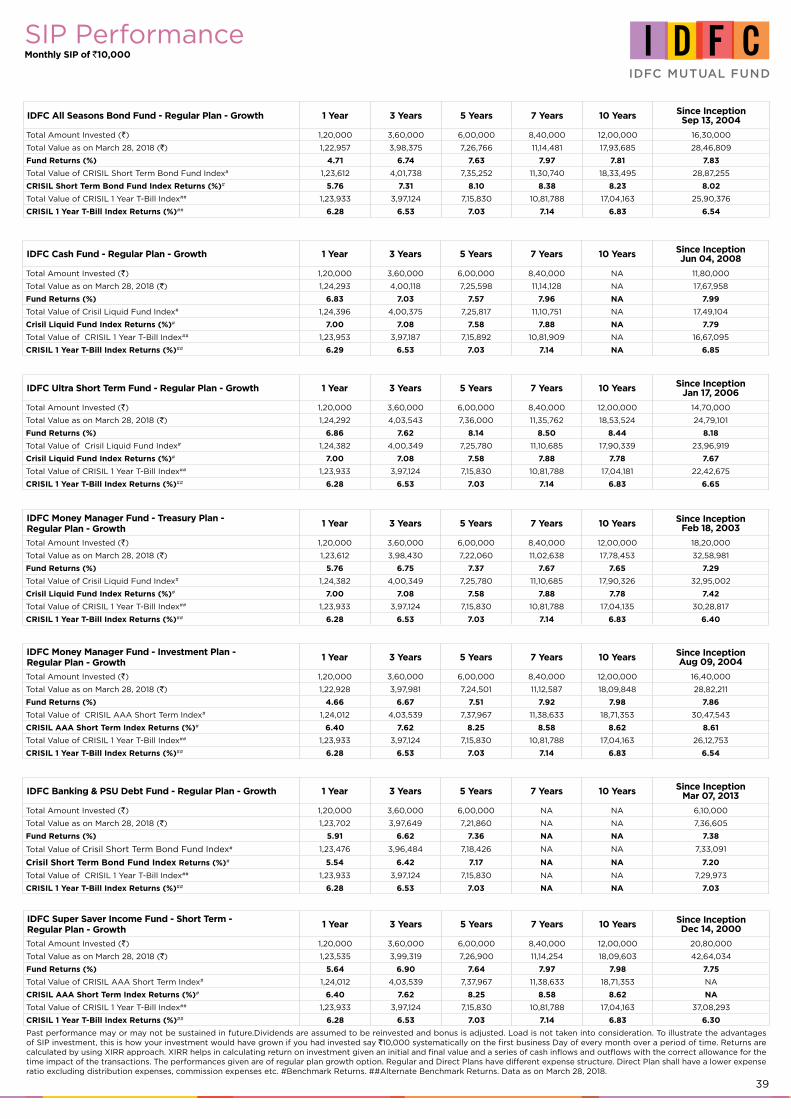
39
IDFC All Seasons Bond Fund - Regular Plan - Growth 1 Year 3 Years 5 Years 7 Years 10 Years Since InceptionSep 13, 2004
Total Amount Invested (`) 1,20,000 3,60,000 6,00,000 8,40,000 12,00,000 16,30,000
Total Value as on March 28, 2018 (`) 1,22,957 3,98,375 7,26,766 11,14,481 17,93,685 28,46,809
Fund Returns (%) 4.71 6.74 7.63 7.97 7.81 7.83
Total Value of CRISIL Short Term Bond Fund Index# 1,23,612 4,01,738 7,35,252 11,30,740 18,33,495 28,87,255
CRISIL Short Term Bond Fund Index Returns (%)# 5.76 7.31 8.10 8.38 8.23 8.02
Total Value of CRISIL 1 Year T-Bill Index## 1,23,933 3,97,124 7,15,830 10,81,788 17,04,163 25,90,376
CRISIL 1 Year T-Bill Index Returns (%)## 6.28 6.53 7.03 7.14 6.83 6.54
SIP PerformanceMonthly SIP of `10,000
IDFC Cash Fund - Regular Plan - Growth 1 Year 3 Years 5 Years 7 Years 10 Years Since InceptionJun 04, 2008
Total Amount Invested (`) 1,20,000 3,60,000 6,00,000 8,40,000 NA 11,80,000
Total Value as on March 28, 2018 (`) 1,24,293 4,00,118 7,25,598 11,14,128 NA 17,67,958
Fund Returns (%) 6.83 7.03 7.57 7.96 NA 7.99
Total Value of Crisil Liquid Fund Index# 1,24,396 4,00,375 7,25,817 11,10,751 NA 17,49,104
Crisil Liquid Fund Index Returns (%)# 7.00 7.08 7.58 7.88 NA 7.79
Total Value of CRISIL 1 Year T-Bill Index## 1,23,953 3,97,187 7,15,892 10,81,909 NA 16,67,095
CRISIL 1 Year T-Bill Index Returns (%)## 6.29 6.53 7.03 7.14 NA 6.85
IDFC Ultra Short Term Fund - Regular Plan - Growth 1 Year 3 Years 5 Years 7 Years 10 Years Since InceptionJan 17, 2006
Total Amount Invested (`) 1,20,000 3,60,000 6,00,000 8,40,000 12,00,000 14,70,000
Total Value as on March 28, 2018 (`) 1,24,292 4,03,543 7,36,000 11,35,762 18,53,524 24,79,101
Fund Returns (%) 6.86 7.62 8.14 8.50 8.44 8.18
Total Value of Crisil Liquid Fund Index# 1,24,382 4,00,349 7,25,780 11,10,685 17,90,339 23,96,919
Crisil Liquid Fund Index Returns (%)# 7.00 7.08 7.58 7.88 7.78 7.67
Total Value of CRISIL 1 Year T-Bill Index## 1,23,933 3,97,124 7,15,830 10,81,788 17,04,181 22,42,675
CRISIL 1 Year T-Bill Index Returns (%)## 6.28 6.53 7.03 7.14 6.83 6.65
IDFC Money Manager Fund - Investment Plan - Regular Plan - Growth
1 Year 3 Years 5 Years 7 Years 10 Years Since InceptionAug 09, 2004
Total Amount Invested (`) 1,20,000 3,60,000 6,00,000 8,40,000 12,00,000 16,40,000
Total Value as on March 28, 2018 (`) 1,22,928 3,97,981 7,24,501 11,12,587 18,09,848 28,82,211
Fund Returns (%) 4.66 6.67 7.51 7.92 7.98 7.86
Total Value of CRISIL AAA Short Term Index# 1,24,012 4,03,539 7,37,967 11,38,633 18,71,353 30,47,543
CRISIL AAA Short Term Index Returns (%)# 6.40 7.62 8.25 8.58 8.62 8.61
Total Value of CRISIL 1 Year T-Bill Index## 1,23,933 3,97,124 7,15,830 10,81,788 17,04,163 26,12,753
CRISIL 1 Year T-Bill Index Returns (%)## 6.28 6.53 7.03 7.14 6.83 6.54
IDFC Money Manager Fund - Treasury Plan - Regular Plan - Growth
1 Year 3 Years 5 Years 7 Years 10 Years Since InceptionFeb 18, 2003
Total Amount Invested (`) 1,20,000 3,60,000 6,00,000 8,40,000 12,00,000 18,20,000
Total Value as on March 28, 2018 (`) 1,23,612 3,98,430 7,22,060 11,02,638 17,78,453 32,58,981
Fund Returns (%) 5.76 6.75 7.37 7.67 7.65 7.29
Total Value of Crisil Liquid Fund Index# 1,24,382 4,00,349 7,25,780 11,10,685 17,90,326 32,95,002
Crisil Liquid Fund Index Returns (%)# 7.00 7.08 7.58 7.88 7.78 7.42
Total Value of CRISIL 1 Year T-Bill Index## 1,23,933 3,97,124 7,15,830 10,81,788 17,04,135 30,28,817
CRISIL 1 Year T-Bill Index Returns (%)## 6.28 6.53 7.03 7.14 6.83 6.40
IDFC Banking & PSU Debt Fund - Regular Plan - Growth 1 Year 3 Years 5 Years 7 Years 10 Years Since InceptionMar 07, 2013
Total Amount Invested (`) 1,20,000 3,60,000 6,00,000 NA NA 6,10,000
Total Value as on March 28, 2018 (`) 1,23,702 3,97,649 7,21,860 NA NA 7,36,605
Fund Returns (%) 5.91 6.62 7.36 NA NA 7.38
Total Value of Crisil Short Term Bond Fund Index# 1,23,476 3,96,484 7,18,426 NA NA 7,33,091
Crisil Short Term Bond Fund Index Returns (%)# 5.54 6.42 7.17 NA NA 7.20
Total Value of CRISIL 1 Year T-Bill Index## 1,23,933 3,97,124 7,15,830 NA NA 7,29,973
CRISIL 1 Year T-Bill Index Returns (%)## 6.28 6.53 7.03 NA NA 7.03
IDFC Super Saver Income Fund - Short Term - Regular Plan - Growth
1 Year 3 Years 5 Years 7 Years 10 Years Since InceptionDec 14, 2000
Total Amount Invested (`) 1,20,000 3,60,000 6,00,000 8,40,000 12,00,000 20,80,000
Total Value as on March 28, 2018 (`) 1,23,535 3,99,319 7,26,900 11,14,254 18,09,603 42,64,034
Fund Returns (%) 5.64 6.90 7.64 7.97 7.98 7.75
Total Value of CRISIL AAA Short Term Index# 1,24,012 4,03,539 7,37,967 11,38,633 18,71,353 NA
CRISIL AAA Short Term Index Returns (%)# 6.40 7.62 8.25 8.58 8.62 NA
Total Value of CRISIL 1 Year T-Bill Index## 1,23,933 3,97,124 7,15,830 10,81,788 17,04,163 37,08,293
CRISIL 1 Year T-Bill Index Returns (%)## 6.28 6.53 7.03 7.14 6.83 6.30
Past performance may or may not be sustained in future.Dividends are assumed to be reinvested and bonus is adjusted. Load is not taken into consideration. To illustrate the advantages of SIP investment, this is how your investment would have grown if you had invested say `10,000 systematically on the first business Day of every month over a period of time. Returns are calculated by using XIRR approach. XIRR helps in calculating return on investment given an initial and final value and a series of cash inflows and outflows with the correct allowance for the time impact of the transactions. The performances given are of regular plan growth option. Regular and Direct Plans have different expense structure. Direct Plan shall have a lower expense ratio excluding distribution expenses, commission expenses etc. #Benchmark Returns. ##Alternate Benchmark Returns. Data as on March 28, 2018.
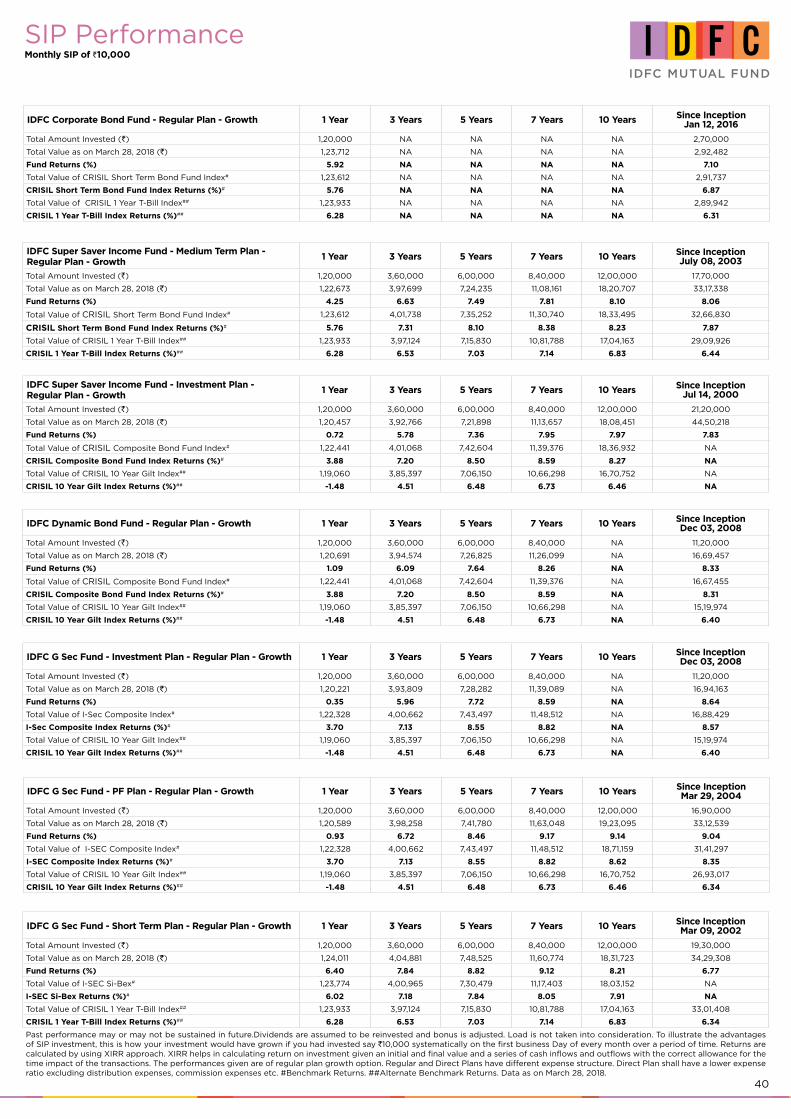
40
IDFC Corporate Bond Fund - Regular Plan - Growth 1 Year 3 Years 5 Years 7 Years 10 Years Since InceptionJan 12, 2016
Total Amount Invested (`) 1,20,000 NA NA NA NA 2,70,000
Total Value as on March 28, 2018 (`) 1,23,712 NA NA NA NA 2,92,482
Fund Returns (%) 5.92 NA NA NA NA 7.10
Total Value of CRISIL Short Term Bond Fund Index# 1,23,612 NA NA NA NA 2,91,737
CRISIL Short Term Bond Fund Index Returns (%)# 5.76 NA NA NA NA 6.87
Total Value of CRISIL 1 Year T-Bill Index## 1,23,933 NA NA NA NA 2,89,942
CRISIL 1 Year T-Bill Index Returns (%)## 6.28 NA NA NA NA 6.31
IDFC Super Saver Income Fund - Medium Term Plan - Regular Plan - Growth
1 Year 3 Years 5 Years 7 Years 10 Years Since InceptionJuly 08, 2003
Total Amount Invested (`) 1,20,000 3,60,000 6,00,000 8,40,000 12,00,000 17,70,000
Total Value as on March 28, 2018 (`) 1,22,673 3,97,699 7,24,235 11,08,161 18,20,707 33,17,338
Fund Returns (%) 4.25 6.63 7.49 7.81 8.10 8.06
Total Value of CRISIL Short Term Bond Fund Index# 1,23,612 4,01,738 7,35,252 11,30,740 18,33,495 32,66,830
CRISIL Short Term Bond Fund Index Returns (%)# 5.76 7.31 8.10 8.38 8.23 7.87
Total Value of CRISIL 1 Year T-Bill Index## 1,23,933 3,97,124 7,15,830 10,81,788 17,04,163 29,09,926
CRISIL 1 Year T-Bill Index Returns (%)## 6.28 6.53 7.03 7.14 6.83 6.44
IDFC Super Saver Income Fund - Investment Plan - Regular Plan - Growth
1 Year 3 Years 5 Years 7 Years 10 Years Since InceptionJul 14, 2000
Total Amount Invested (`) 1,20,000 3,60,000 6,00,000 8,40,000 12,00,000 21,20,000
Total Value as on March 28, 2018 (`) 1,20,457 3,92,766 7,21,898 11,13,657 18,08,451 44,50,218
Fund Returns (%) 0.72 5.78 7.36 7.95 7.97 7.83
Total Value of CRISIL Composite Bond Fund Index# 1,22,441 4,01,068 7,42,604 11,39,376 18,36,932 NA
CRISIL Composite Bond Fund Index Returns (%)# 3.88 7.20 8.50 8.59 8.27 NA
Total Value of CRISIL 10 Year Gilt Index## 1,19,060 3,85,397 7,06,150 10,66,298 16,70,752 NA
CRISIL 10 Year Gilt Index Returns (%)## -1.48 4.51 6.48 6.73 6.46 NA
IDFC Dynamic Bond Fund - Regular Plan - Growth 1 Year 3 Years 5 Years 7 Years 10 Years Since InceptionDec 03, 2008
Total Amount Invested (`) 1,20,000 3,60,000 6,00,000 8,40,000 NA 11,20,000
Total Value as on March 28, 2018 (`) 1,20,691 3,94,574 7,26,825 11,26,099 NA 16,69,457
Fund Returns (%) 1.09 6.09 7.64 8.26 NA 8.33
Total Value of CRISIL Composite Bond Fund Index# 1,22,441 4,01,068 7,42,604 11,39,376 NA 16,67,455
CRISIL Composite Bond Fund Index Returns (%)# 3.88 7.20 8.50 8.59 NA 8.31
Total Value of CRISIL 10 Year Gilt Index## 1,19,060 3,85,397 7,06,150 10,66,298 NA 15,19,974
CRISIL 10 Year Gilt Index Returns (%)## -1.48 4.51 6.48 6.73 NA 6.40
IDFC G Sec Fund - Investment Plan - Regular Plan - Growth 1 Year 3 Years 5 Years 7 Years 10 Years Since InceptionDec 03, 2008
Total Amount Invested (`) 1,20,000 3,60,000 6,00,000 8,40,000 NA 11,20,000
Total Value as on March 28, 2018 (`) 1,20,221 3,93,809 7,28,282 11,39,089 NA 16,94,163
Fund Returns (%) 0.35 5.96 7.72 8.59 NA 8.64
Total Value of I-Sec Composite Index# 1,22,328 4,00,662 7,43,497 11,48,512 NA 16,88,429
I-Sec Composite Index Returns (%)# 3.70 7.13 8.55 8.82 NA 8.57
Total Value of CRISIL 10 Year Gilt Index## 1,19,060 3,85,397 7,06,150 10,66,298 NA 15,19,974
CRISIL 10 Year Gilt Index Returns (%)## -1.48 4.51 6.48 6.73 NA 6.40
SIP PerformanceMonthly SIP of `10,000
IDFC G Sec Fund - PF Plan - Regular Plan - Growth 1 Year 3 Years 5 Years 7 Years 10 Years Since InceptionMar 29, 2004
Total Amount Invested (`) 1,20,000 3,60,000 6,00,000 8,40,000 12,00,000 16,90,000
Total Value as on March 28, 2018 (`) 1,20,589 3,98,258 7,41,780 11,63,048 19,23,095 33,12,539
Fund Returns (%) 0.93 6.72 8.46 9.17 9.14 9.04
Total Value of I-SEC Composite Index# 1,22,328 4,00,662 7,43,497 11,48,512 18,71,159 31,41,297
I-SEC Composite Index Returns (%)# 3.70 7.13 8.55 8.82 8.62 8.35
Total Value of CRISIL 10 Year Gilt Index## 1,19,060 3,85,397 7,06,150 10,66,298 16,70,752 26,93,017
CRISIL 10 Year Gilt Index Returns (%)## -1.48 4.51 6.48 6.73 6.46 6.34
IDFC G Sec Fund - Short Term Plan - Regular Plan - Growth 1 Year 3 Years 5 Years 7 Years 10 Years Since InceptionMar 09, 2002
Total Amount Invested (`) 1,20,000 3,60,000 6,00,000 8,40,000 12,00,000 19,30,000
Total Value as on March 28, 2018 (`) 1,24,011 4,04,881 7,48,525 11,60,774 18,31,723 34,29,308
Fund Returns (%) 6.40 7.84 8.82 9.12 8.21 6.77
Total Value of I-SEC Si-Bex# 1,23,774 4,00,965 7,30,479 11,17,403 18,03,152 NA
I-SEC Si-Bex Returns (%)# 6.02 7.18 7.84 8.05 7.91 NA
Total Value of CRISIL 1 Year T-Bill Index## 1,23,933 3,97,124 7,15,830 10,81,788 17,04,163 33,01,408
CRISIL 1 Year T-Bill Index Returns (%)## 6.28 6.53 7.03 7.14 6.83 6.34
Past performance may or may not be sustained in future.Dividends are assumed to be reinvested and bonus is adjusted. Load is not taken into consideration. To illustrate the advantages of SIP investment, this is how your investment would have grown if you had invested say `10,000 systematically on the first business Day of every month over a period of time. Returns are calculated by using XIRR approach. XIRR helps in calculating return on investment given an initial and final value and a series of cash inflows and outflows with the correct allowance for the time impact of the transactions. The performances given are of regular plan growth option. Regular and Direct Plans have different expense structure. Direct Plan shall have a lower expense ratio excluding distribution expenses, commission expenses etc. #Benchmark Returns. ##Alternate Benchmark Returns. Data as on March 28, 2018.
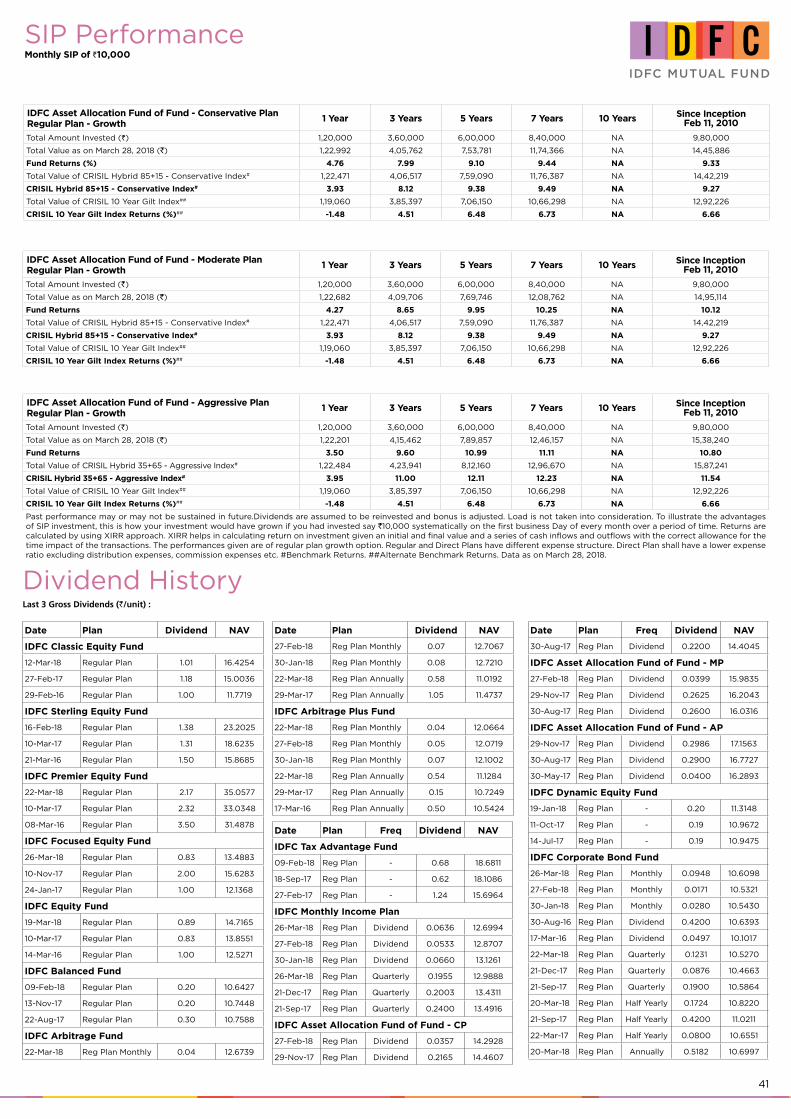
41
SIP PerformanceMonthly SIP of `10,000
IDFC Asset Allocation Fund of Fund - Conservative Plan Regular Plan - Growth
1 Year 3 Years 5 Years 7 Years 10 Years Since InceptionFeb 11, 2010
Total Amount Invested (`) 1,20,000 3,60,000 6,00,000 8,40,000 NA 9,80,000
Total Value as on March 28, 2018 (`) 1,22,992 4,05,762 7,53,781 11,74,366 NA 14,45,886
Fund Returns (%) 4.76 7.99 9.10 9.44 NA 9.33
Total Value of CRISIL Hybrid 85+15 - Conservative Index# 1,22,471 4,06,517 7,59,090 11,76,387 NA 14,42,219
CRISIL Hybrid 85+15 - Conservative Index# 3.93 8.12 9.38 9.49 NA 9.27
Total Value of CRISIL 10 Year Gilt Index## 1,19,060 3,85,397 7,06,150 10,66,298 NA 12,92,226
CRISIL 10 Year Gilt Index Returns (%)## -1.48 4.51 6.48 6.73 NA 6.66
IDFC Asset Allocation Fund of Fund - Moderate Plan Regular Plan - Growth
1 Year 3 Years 5 Years 7 Years 10 Years Since InceptionFeb 11, 2010
Total Amount Invested (`) 1,20,000 3,60,000 6,00,000 8,40,000 NA 9,80,000
Total Value as on March 28, 2018 (`) 1,22,682 4,09,706 7,69,746 12,08,762 NA 14,95,114
Fund Returns 4.27 8.65 9.95 10.25 NA 10.12
Total Value of CRISIL Hybrid 85+15 - Conservative Index# 1,22,471 4,06,517 7,59,090 11,76,387 NA 14,42,219
CRISIL Hybrid 85+15 - Conservative Index# 3.93 8.12 9.38 9.49 NA 9.27
Total Value of CRISIL 10 Year Gilt Index## 1,19,060 3,85,397 7,06,150 10,66,298 NA 12,92,226
CRISIL 10 Year Gilt Index Returns (%)## -1.48 4.51 6.48 6.73 NA 6.66
IDFC Asset Allocation Fund of Fund - Aggressive Plan Regular Plan - Growth
1 Year 3 Years 5 Years 7 Years 10 Years Since InceptionFeb 11, 2010
Total Amount Invested (`) 1,20,000 3,60,000 6,00,000 8,40,000 NA 9,80,000
Total Value as on March 28, 2018 (`) 1,22,201 4,15,462 7,89,857 12,46,157 NA 15,38,240
Fund Returns 3.50 9.60 10.99 11.11 NA 10.80
Total Value of CRISIL Hybrid 35+65 - Aggressive Index# 1,22,484 4,23,941 8,12,160 12,96,670 NA 15,87,241
CRISIL Hybrid 35+65 - Aggressive Index# 3.95 11.00 12.11 12.23 NA 11.54
Total Value of CRISIL 10 Year Gilt Index## 1,19,060 3,85,397 7,06,150 10,66,298 NA 12,92,226
CRISIL 10 Year Gilt Index Returns (%)## -1.48 4.51 6.48 6.73 NA 6.66
Past performance may or may not be sustained in future.Dividends are assumed to be reinvested and bonus is adjusted. Load is not taken into consideration. To illustrate the advantages of SIP investment, this is how your investment would have grown if you had invested say `10,000 systematically on the first business Day of every month over a period of time. Returns are calculated by using XIRR approach. XIRR helps in calculating return on investment given an initial and final value and a series of cash inflows and outflows with the correct allowance for the time impact of the transactions. The performances given are of regular plan growth option. Regular and Direct Plans have different expense structure. Direct Plan shall have a lower expense ratio excluding distribution expenses, commission expenses etc. #Benchmark Returns. ##Alternate Benchmark Returns. Data as on March 28, 2018.
Date Plan Dividend NAV
IDFC Classic Equity Fund
12-Mar-18 Regular Plan 1.01 16.4254
27-Feb-17 Regular Plan 1.18 15.0036
29-Feb-16 Regular Plan 1.00 11.7719
IDFC Sterling Equity Fund
16-Feb-18 Regular Plan 1.38 23.2025
10-Mar-17 Regular Plan 1.31 18.6235
21-Mar-16 Regular Plan 1.50 15.8685
IDFC Premier Equity Fund
22-Mar-18 Regular Plan 2.17 35.0577
10-Mar-17 Regular Plan 2.32 33.0348
08-Mar-16 Regular Plan 3.50 31.4878
IDFC Focused Equity Fund
26-Mar-18 Regular Plan 0.83 13.4883
10-Nov-17 Regular Plan 2.00 15.6283
24-Jan-17 Regular Plan 1.00 12.1368
IDFC Equity Fund
19-Mar-18 Regular Plan 0.89 14.7165
10-Mar-17 Regular Plan 0.83 13.8551
14-Mar-16 Regular Plan 1.00 12.5271
IDFC Balanced Fund
09-Feb-18 Regular Plan 0.20 10.6427
13-Nov-17 Regular Plan 0.20 10.7448
22-Aug-17 Regular Plan 0.30 10.7588
IDFC Arbitrage Fund
22-Mar-18 Reg Plan Monthly 0.04 12.6739
Dividend HistoryLast 3 Gross Dividends (`/unit) :
Date Plan Dividend NAV
27-Feb-18 Reg Plan Monthly 0.07 12.7067
30-Jan-18 Reg Plan Monthly 0.08 12.7210
22-Mar-18 Reg Plan Annually 0.58 11.0192
29-Mar-17 Reg Plan Annually 1.05 11.4737
IDFC Arbitrage Plus Fund
22-Mar-18 Reg Plan Monthly 0.04 12.0664
27-Feb-18 Reg Plan Monthly 0.05 12.0719
30-Jan-18 Reg Plan Monthly 0.07 12.1002
22-Mar-18 Reg Plan Annually 0.54 11.1284
29-Mar-17 Reg Plan Annually 0.15 10.7249
17-Mar-16 Reg Plan Annually 0.50 10.5424
Date Plan Freq Dividend NAV
IDFC Tax Advantage Fund
09-Feb-18 Reg Plan - 0.68 18.6811
18-Sep-17 Reg Plan - 0.62 18.1086
27-Feb-17 Reg Plan - 1.24 15.6964
IDFC Monthly Income Plan
26-Mar-18 Reg Plan Dividend 0.0636 12.6994
27-Feb-18 Reg Plan Dividend 0.0533 12.8707
30-Jan-18 Reg Plan Dividend 0.0660 13.1261
26-Mar-18 Reg Plan Quarterly 0.1955 12.9888
21-Dec-17 Reg Plan Quarterly 0.2003 13.4311
21-Sep-17 Reg Plan Quarterly 0.2400 13.4916
IDFC Asset Allocation Fund of Fund - CP
27-Feb-18 Reg Plan Dividend 0.0357 14.2928
29-Nov-17 Reg Plan Dividend 0.2165 14.4607
Date Plan Freq Dividend NAV
30-Aug-17 Reg Plan Dividend 0.2200 14.4045
IDFC Asset Allocation Fund of Fund - MP
27-Feb-18 Reg Plan Dividend 0.0399 15.9835
29-Nov-17 Reg Plan Dividend 0.2625 16.2043
30-Aug-17 Reg Plan Dividend 0.2600 16.0316
IDFC Asset Allocation Fund of Fund - AP
29-Nov-17 Reg Plan Dividend 0.2986 17.1563
30-Aug-17 Reg Plan Dividend 0.2900 16.7727
30-May-17 Reg Plan Dividend 0.0400 16.2893
IDFC Dynamic Equity Fund
19-Jan-18 Reg Plan - 0.20 11.3148
11-Oct-17 Reg Plan - 0.19 10.9672
14-Jul-17 Reg Plan - 0.19 10.9475
IDFC Corporate Bond Fund
26-Mar-18 Reg Plan Monthly 0.0948 10.6098
27-Feb-18 Reg Plan Monthly 0.0171 10.5321
30-Jan-18 Reg Plan Monthly 0.0280 10.5430
30-Aug-16 Reg Plan Dividend 0.4200 10.6393
17-Mar-16 Reg Plan Dividend 0.0497 10.1017
22-Mar-18 Reg Plan Quarterly 0.1231 10.5270
21-Dec-17 Reg Plan Quarterly 0.0876 10.4663
21-Sep-17 Reg Plan Quarterly 0.1900 10.5864
20-Mar-18 Reg Plan Half Yearly 0.1724 10.8220
21-Sep-17 Reg Plan Half Yearly 0.4200 11.0211
22-Mar-17 Reg Plan Half Yearly 0.0800 10.6551
20-Mar-18 Reg Plan Annually 0.5182 10.6997
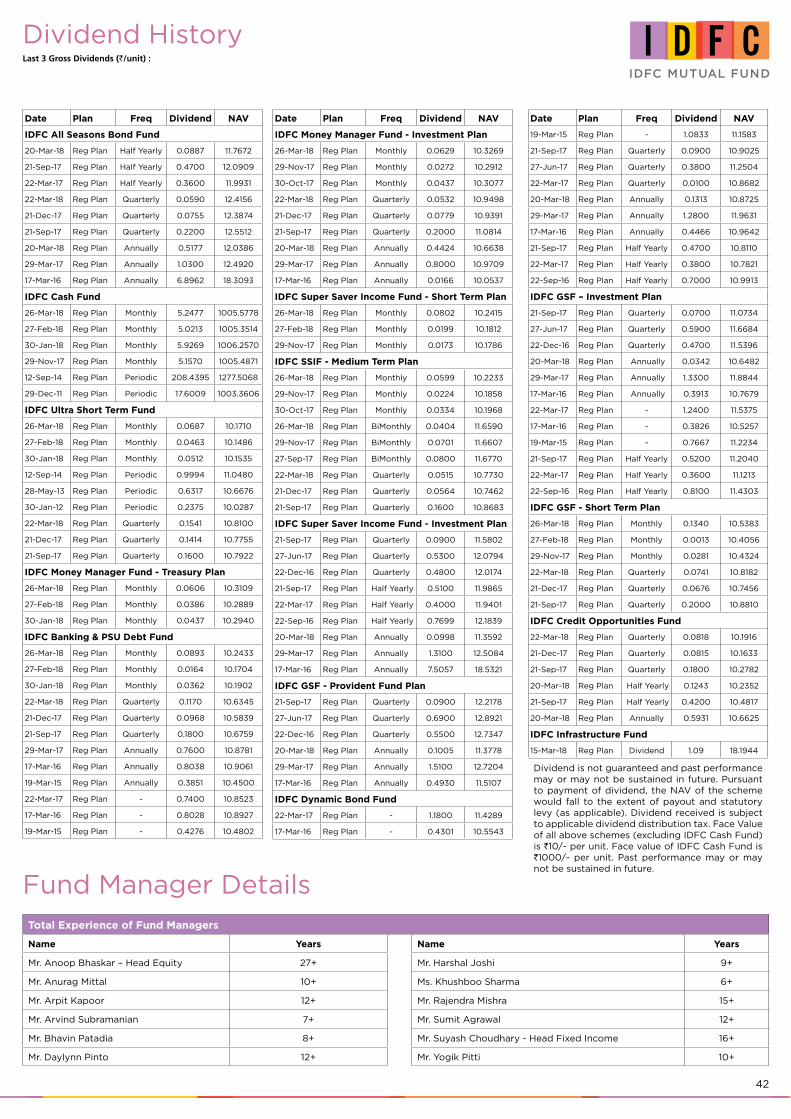
42
Dividend HistoryLast 3 Gross Dividends (`/unit) :
Date Plan Freq Dividend NAV
IDFC Money Manager Fund - Investment Plan
26-Mar-18 Reg Plan Monthly 0.0629 10.3269
29-Nov-17 Reg Plan Monthly 0.0272 10.2912
30-Oct-17 Reg Plan Monthly 0.0437 10.3077
22-Mar-18 Reg Plan Quarterly 0.0532 10.9498
21-Dec-17 Reg Plan Quarterly 0.0779 10.9391
21-Sep-17 Reg Plan Quarterly 0.2000 11.0814
20-Mar-18 Reg Plan Annually 0.4424 10.6638
29-Mar-17 Reg Plan Annually 0.8000 10.9709
17-Mar-16 Reg Plan Annually 0.0166 10.0537
IDFC Super Saver Income Fund - Short Term Plan
26-Mar-18 Reg Plan Monthly 0.0802 10.2415
27-Feb-18 Reg Plan Monthly 0.0199 10.1812
29-Nov-17 Reg Plan Monthly 0.0173 10.1786
IDFC SSIF - Medium Term Plan
26-Mar-18 Reg Plan Monthly 0.0599 10.2233
29-Nov-17 Reg Plan Monthly 0.0224 10.1858
30-Oct-17 Reg Plan Monthly 0.0334 10.1968
26-Mar-18 Reg Plan BiMonthly 0.0404 11.6590
29-Nov-17 Reg Plan BiMonthly 0.0701 11.6607
27-Sep-17 Reg Plan BiMonthly 0.0800 11.6770
22-Mar-18 Reg Plan Quarterly 0.0515 10.7730
21-Dec-17 Reg Plan Quarterly 0.0564 10.7462
21-Sep-17 Reg Plan Quarterly 0.1600 10.8683
IDFC Super Saver Income Fund - Investment Plan
21-Sep-17 Reg Plan Quarterly 0.0900 11.5802
27-Jun-17 Reg Plan Quarterly 0.5300 12.0794
22-Dec-16 Reg Plan Quarterly 0.4800 12.0174
21-Sep-17 Reg Plan Half Yearly 0.5100 11.9865
22-Mar-17 Reg Plan Half Yearly 0.4000 11.9401
22-Sep-16 Reg Plan Half Yearly 0.7699 12.1839
20-Mar-18 Reg Plan Annually 0.0998 11.3592
29-Mar-17 Reg Plan Annually 1.3100 12.5084
17-Mar-16 Reg Plan Annually 7.5057 18.5321
IDFC GSF - Provident Fund Plan
21-Sep-17 Reg Plan Quarterly 0.0900 12.2178
27-Jun-17 Reg Plan Quarterly 0.6900 12.8921
22-Dec-16 Reg Plan Quarterly 0.5500 12.7347
20-Mar-18 Reg Plan Annually 0.1005 11.3778
29-Mar-17 Reg Plan Annually 1.5100 12.7204
17-Mar-16 Reg Plan Annually 0.4930 11.5107
IDFC Dynamic Bond Fund
22-Mar-17 Reg Plan - 1.1800 11.4289
17-Mar-16 Reg Plan - 0.4301 10.5543
Date Plan Freq Dividend NAV
IDFC All Seasons Bond Fund
20-Mar-18 Reg Plan Half Yearly 0.0887 11.7672
21-Sep-17 Reg Plan Half Yearly 0.4700 12.0909
22-Mar-17 Reg Plan Half Yearly 0.3600 11.9931
22-Mar-18 Reg Plan Quarterly 0.0590 12.4156
21-Dec-17 Reg Plan Quarterly 0.0755 12.3874
21-Sep-17 Reg Plan Quarterly 0.2200 12.5512
20-Mar-18 Reg Plan Annually 0.5177 12.0386
29-Mar-17 Reg Plan Annually 1.0300 12.4920
17-Mar-16 Reg Plan Annually 6.8962 18.3093
IDFC Cash Fund
26-Mar-18 Reg Plan Monthly 5.2477 1005.5778
27-Feb-18 Reg Plan Monthly 5.0213 1005.3514
30-Jan-18 Reg Plan Monthly 5.9269 1006.2570
29-Nov-17 Reg Plan Monthly 5.1570 1005.4871
12-Sep-14 Reg Plan Periodic 208.4395 1277.5068
29-Dec-11 Reg Plan Periodic 17.6009 1003.3606
IDFC Ultra Short Term Fund
26-Mar-18 Reg Plan Monthly 0.0687 10.1710
27-Feb-18 Reg Plan Monthly 0.0463 10.1486
30-Jan-18 Reg Plan Monthly 0.0512 10.1535
12-Sep-14 Reg Plan Periodic 0.9994 11.0480
28-May-13 Reg Plan Periodic 0.6317 10.6676
30-Jan-12 Reg Plan Periodic 0.2375 10.0287
22-Mar-18 Reg Plan Quarterly 0.1541 10.8100
21-Dec-17 Reg Plan Quarterly 0.1414 10.7755
21-Sep-17 Reg Plan Quarterly 0.1600 10.7922
IDFC Money Manager Fund - Treasury Plan
26-Mar-18 Reg Plan Monthly 0.0606 10.3109
27-Feb-18 Reg Plan Monthly 0.0386 10.2889
30-Jan-18 Reg Plan Monthly 0.0437 10.2940
IDFC Banking & PSU Debt Fund
26-Mar-18 Reg Plan Monthly 0.0893 10.2433
27-Feb-18 Reg Plan Monthly 0.0164 10.1704
30-Jan-18 Reg Plan Monthly 0.0362 10.1902
22-Mar-18 Reg Plan Quarterly 0.1170 10.6345
21-Dec-17 Reg Plan Quarterly 0.0968 10.5839
21-Sep-17 Reg Plan Quarterly 0.1800 10.6759
29-Mar-17 Reg Plan Annually 0.7600 10.8781
17-Mar-16 Reg Plan Annually 0.8038 10.9061
19-Mar-15 Reg Plan Annually 0.3851 10.4500
22-Mar-17 Reg Plan - 0.7400 10.8523
17-Mar-16 Reg Plan - 0.8028 10.8927
19-Mar-15 Reg Plan - 0.4276 10.4802
Date Plan Freq Dividend NAV
19-Mar-15 Reg Plan - 1.0833 11.1583
21-Sep-17 Reg Plan Quarterly 0.0900 10.9025
27-Jun-17 Reg Plan Quarterly 0.3800 11.2504
22-Mar-17 Reg Plan Quarterly 0.0100 10.8682
20-Mar-18 Reg Plan Annually 0.1313 10.8725
29-Mar-17 Reg Plan Annually 1.2800 11.9631
17-Mar-16 Reg Plan Annually 0.4466 10.9642
21-Sep-17 Reg Plan Half Yearly 0.4700 10.8110
22-Mar-17 Reg Plan Half Yearly 0.3800 10.7821
22-Sep-16 Reg Plan Half Yearly 0.7000 10.9913
IDFC GSF – Investment Plan
21-Sep-17 Reg Plan Quarterly 0.0700 11.0734
27-Jun-17 Reg Plan Quarterly 0.5900 11.6684
22-Dec-16 Reg Plan Quarterly 0.4700 11.5396
20-Mar-18 Reg Plan Annually 0.0342 10.6482
29-Mar-17 Reg Plan Annually 1.3300 11.8844
17-Mar-16 Reg Plan Annually 0.3913 10.7679
22-Mar-17 Reg Plan - 1.2400 11.5375
17-Mar-16 Reg Plan - 0.3826 10.5257
19-Mar-15 Reg Plan - 0.7667 11.2234
21-Sep-17 Reg Plan Half Yearly 0.5200 11.2040
22-Mar-17 Reg Plan Half Yearly 0.3600 11.1213
22-Sep-16 Reg Plan Half Yearly 0.8100 11.4303
IDFC GSF - Short Term Plan
26-Mar-18 Reg Plan Monthly 0.1340 10.5383
27-Feb-18 Reg Plan Monthly 0.0013 10.4056
29-Nov-17 Reg Plan Monthly 0.0281 10.4324
22-Mar-18 Reg Plan Quarterly 0.0741 10.8182
21-Dec-17 Reg Plan Quarterly 0.0676 10.7456
21-Sep-17 Reg Plan Quarterly 0.2000 10.8810
IDFC Credit Opportunities Fund
22-Mar-18 Reg Plan Quarterly 0.0818 10.1916
21-Dec-17 Reg Plan Quarterly 0.0815 10.1633
21-Sep-17 Reg Plan Quarterly 0.1800 10.2782
20-Mar-18 Reg Plan Half Yearly 0.1243 10.2352
21-Sep-17 Reg Plan Half Yearly 0.4200 10.4817
20-Mar-18 Reg Plan Annually 0.5931 10.6625
IDFC Infrastructure Fund
15-Mar-18 Reg Plan Dividend 1.09 18.1944
Dividend is not guaranteed and past performance may or may not be sustained in future. Pursuant to payment of dividend, the NAV of the scheme would fall to the extent of payout and statutory levy (as applicable). Dividend received is subject to applicable dividend distribution tax. Face Value of all above schemes (excluding IDFC Cash Fund) is `10/- per unit. Face value of IDFC Cash Fund is `1000/- per unit. Past performance may or may not be sustained in future.
Total Experience of Fund Managers
Name Years Name Years
Mr. Anoop Bhaskar – Head Equity 27+ Mr. Harshal Joshi 9+
Mr. Anurag Mittal 10+ Ms. Khushboo Sharma 6+
Mr. Arpit Kapoor 12+ Mr. Rajendra Mishra 15+
Mr. Arvind Subramanian 7+ Mr. Sumit Agrawal 12+
Mr. Bhavin Patadia 8+ Mr. Suyash Choudhary - Head Fixed Income 16+
Mr. Daylynn Pinto 12+ Mr. Yogik Pitti 10+
Fund Manager Details
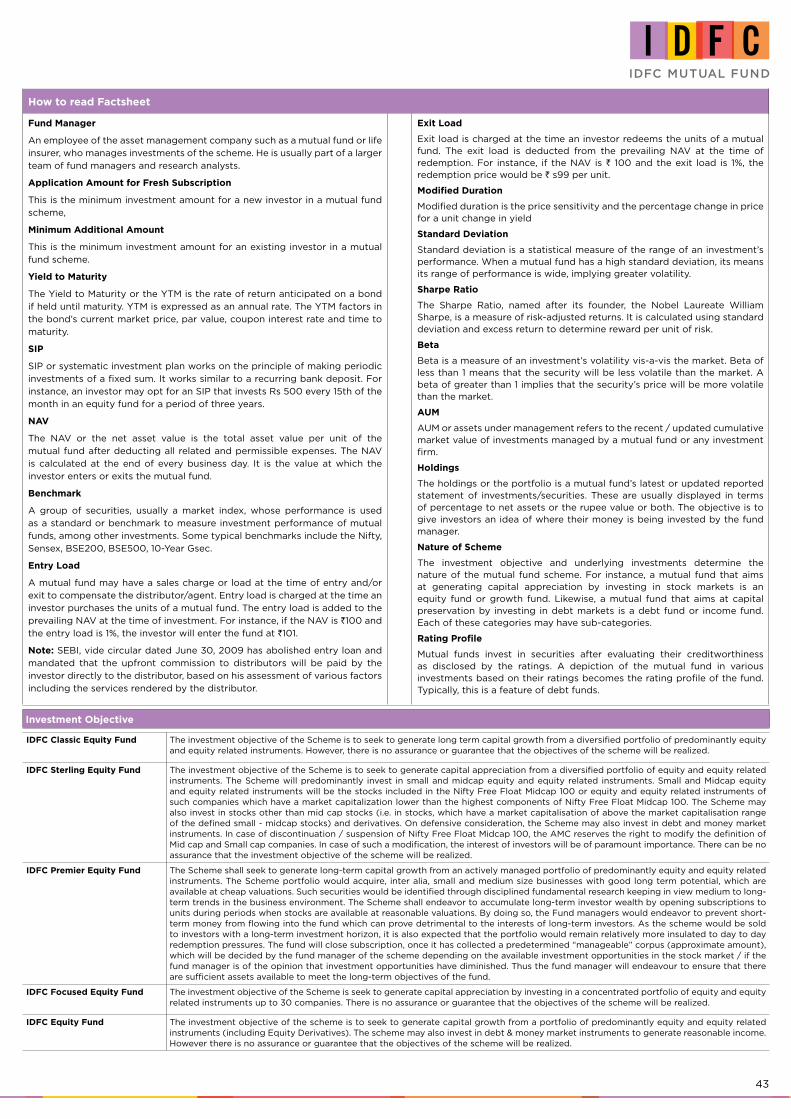
43
How to read Factsheet
Fund Manager
An employee of the asset management company such as a mutual fund or life
insurer, who manages investments of the scheme. He is usually part of a larger
team of fund managers and research analysts.
Application Amount for Fresh Subscription
This is the minimum investment amount for a new investor in a mutual fund
scheme,
Minimum Additional Amount
This is the minimum investment amount for an existing investor in a mutual
fund scheme.
Yield to Maturity
The Yield to Maturity or the YTM is the rate of return anticipated on a bond
if held until maturity. YTM is expressed as an annual rate. The YTM factors in
the bond’s current market price, par value, coupon interest rate and time to
maturity.
SIP
SIP or systematic investment plan works on the principle of making periodic
investments of a fixed sum. It works similar to a recurring bank deposit. For
instance, an investor may opt for an SIP that invests Rs 500 every 15th of the
month in an equity fund for a period of three years.
NAV
The NAV or the net asset value is the total asset value per unit of the
mutual fund after deducting all related and permissible expenses. The NAV
is calculated at the end of every business day. It is the value at which the
investor enters or exits the mutual fund.
Benchmark
A group of securities, usually a market index, whose performance is used
as a standard or benchmark to measure investment performance of mutual
funds, among other investments. Some typical benchmarks include the Nifty,
Sensex, BSE200, BSE500, 10-Year Gsec.
Entry Load
A mutual fund may have a sales charge or load at the time of entry and/or
exit to compensate the distributor/agent. Entry load is charged at the time an
investor purchases the units of a mutual fund. The entry load is added to the
prevailing NAV at the time of investment. For instance, if the NAV is `100 and
the entry load is 1%, the investor will enter the fund at `101.
Note: SEBI, vide circular dated June 30, 2009 has abolished entry loan and
mandated that the upfront commission to distributors will be paid by the
investor directly to the distributor, based on his assessment of various factors
including the services rendered by the distributor.
Exit Load
Exit load is charged at the time an investor redeems the units of a mutual fund. The exit load is deducted from the prevailing NAV at the time of redemption. For instance, if the NAV is ` 100 and the exit load is 1%, the redemption price would be ` s99 per unit.
Modified Duration
Modified duration is the price sensitivity and the percentage change in price for a unit change in yield
Standard Deviation
Standard deviation is a statistical measure of the range of an investment’s performance. When a mutual fund has a high standard deviation, its means its range of performance is wide, implying greater volatility.
Sharpe Ratio
The Sharpe Ratio, named after its founder, the Nobel Laureate William Sharpe, is a measure of risk-adjusted returns. It is calculated using standard deviation and excess return to determine reward per unit of risk.
Beta
Beta is a measure of an investment’s volatility vis-a-vis the market. Beta of less than 1 means that the security will be less volatile than the market. A beta of greater than 1 implies that the security’s price will be more volatile than the market.
AUM
AUM or assets under management refers to the recent / updated cumulative market value of investments managed by a mutual fund or any investment firm.
Holdings
The holdings or the portfolio is a mutual fund’s latest or updated reported statement of investments/securities. These are usually displayed in terms of percentage to net assets or the rupee value or both. The objective is to give investors an idea of where their money is being invested by the fund manager.
Nature of Scheme
The investment objective and underlying investments determine the nature of the mutual fund scheme. For instance, a mutual fund that aims at generating capital appreciation by investing in stock markets is an equity fund or growth fund. Likewise, a mutual fund that aims at capital preservation by investing in debt markets is a debt fund or income fund. Each of these categories may have sub-categories.
Rating Profile
Mutual funds invest in securities after evaluating their creditworthiness as disclosed by the ratings. A depiction of the mutual fund in various investments based on their ratings becomes the rating profile of the fund. Typically, this is a feature of debt funds.
Investment Objective
IDFC Classic Equity Fund The investment objective of the Scheme is to seek to generate long term capital growth from a diversified portfolio of predominantly equity and equity related instruments. However, there is no assurance or guarantee that the objectives of the scheme will be realized.
IDFC Sterling Equity Fund The investment objective of the Scheme is to seek to generate capital appreciation from a diversified portfolio of equity and equity related instruments. The Scheme will predominantly invest in small and midcap equity and equity related instruments. Small and Midcap equity and equity related instruments will be the stocks included in the Nifty Free Float Midcap 100 or equity and equity related instruments of such companies which have a market capitalization lower than the highest components of Nifty Free Float Midcap 100. The Scheme may also invest in stocks other than mid cap stocks (i.e. in stocks, which have a market capitalisation of above the market capitalisation range of the defined small - midcap stocks) and derivatives. On defensive consideration, the Scheme may also invest in debt and money market instruments. In case of discontinuation / suspension of Nifty Free Float Midcap 100, the AMC reserves the right to modify the definition of Mid cap and Small cap companies. In case of such a modification, the interest of investors will be of paramount importance. There can be no assurance that the investment objective of the scheme will be realized.
IDFC Premier Equity Fund The Scheme shall seek to generate long-term capital growth from an actively managed portfolio of predominantly equity and equity related instruments. The Scheme portfolio would acquire, inter alia, small and medium size businesses with good long term potential, which are available at cheap valuations. Such securities would be identified through disciplined fundamental research keeping in view medium to long-term trends in the business environment. The Scheme shall endeavor to accumulate long-term investor wealth by opening subscriptions to units during periods when stocks are available at reasonable valuations. By doing so, the Fund managers would endeavor to prevent short-term money from flowing into the fund which can prove detrimental to the interests of long-term investors. As the scheme would be sold to investors with a long-term investment horizon, it is also expected that the portfolio would remain relatively more insulated to day to day redemption pressures. The fund will close subscription, once it has collected a predetermined “manageable” corpus (approximate amount), which will be decided by the fund manager of the scheme depending on the available investment opportunities in the stock market / if the fund manager is of the opinion that investment opportunities have diminished. Thus the fund manager will endeavour to ensure that there are sufficient assets available to meet the long-term objectives of the fund.
IDFC Focused Equity Fund The investment objective of the Scheme is seek to generate capital appreciation by investing in a concentrated portfolio of equity and equity related instruments up to 30 companies. There is no assurance or guarantee that the objectives of the scheme will be realized.
IDFC Equity Fund The investment objective of the scheme is to seek to generate capital growth from a portfolio of predominantly equity and equity related instruments (including Equity Derivatives). The scheme may also invest in debt & money market instruments to generate reasonable income. However there is no assurance or guarantee that the objectives of the scheme will be realized.
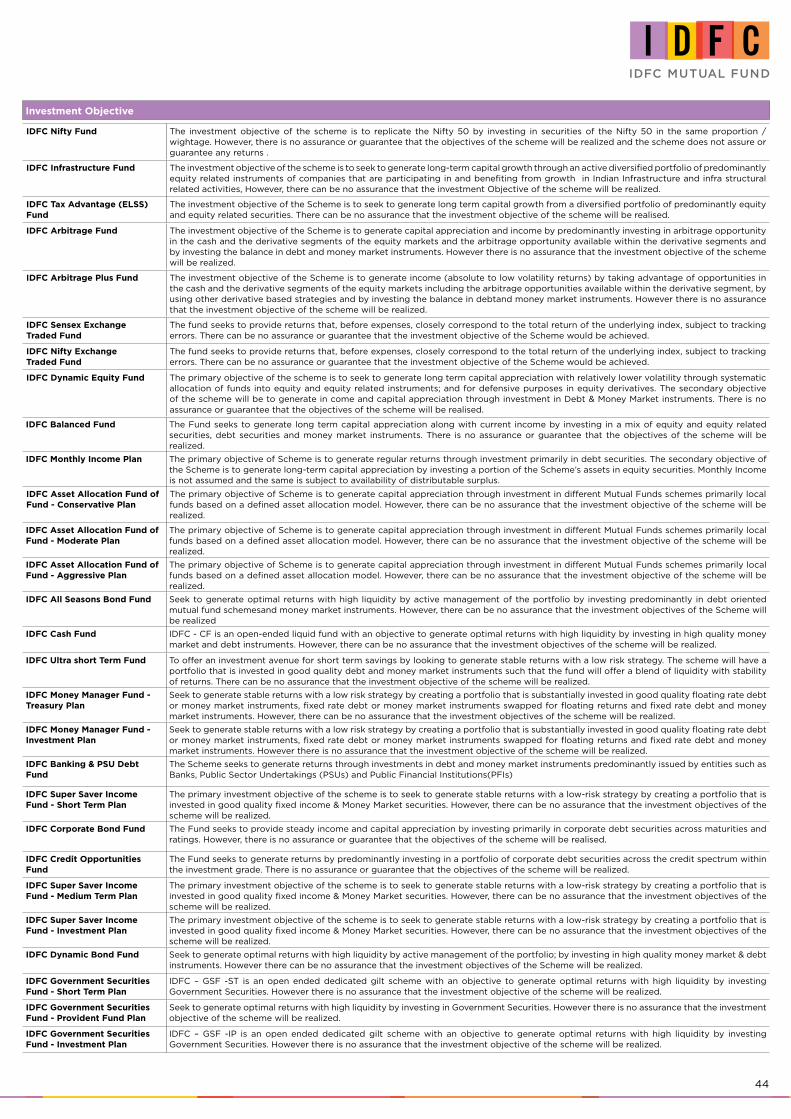
44
Investment Objective
IDFC Nifty Fund The investment objective of the scheme is to replicate the Nifty 50 by investing in securities of the Nifty 50 in the same proportion / wightage. However, there is no assurance or guarantee that the objectives of the scheme will be realized and the scheme does not assure or guarantee any returns .
IDFC Infrastructure Fund The investment objective of the scheme is to seek to generate long-term capital growth through an active diversified portfolio of predominantly equity related instruments of companies that are participating in and benefiting from growth in Indian Infrastructure and infra structural related activities, However, there can be no assurance that the investment Objective of the scheme will be realized.
IDFC Tax Advantage (ELSS) Fund
The investment objective of the Scheme is to seek to generate long term capital growth from a diversified portfolio of predominantly equity and equity related securities. There can be no assurance that the investment objective of the scheme will be realised.
IDFC Arbitrage Fund The investment objective of the Scheme is to generate capital appreciation and income by predominantly investing in arbitrage opportunity in the cash and the derivative segments of the equity markets and the arbitrage opportunity available within the derivative segments and by investing the balance in debt and money market instruments. However there is no assurance that the investment objective of the scheme will be realized.
IDFC Arbitrage Plus Fund The investment objective of the Scheme is to generate income (absolute to low volatility returns) by taking advantage of opportunities in the cash and the derivative segments of the equity markets including the arbitrage opportunities available within the derivative segment, by using other derivative based strategies and by investing the balance in debtand money market instruments. However there is no assurance that the investment objective of the scheme will be realized.
IDFC Sensex Exchange Traded Fund
The fund seeks to provide returns that, before expenses, closely correspond to the total return of the underlying index, subject to tracking errors. There can be no assurance or guarantee that the investment objective of the Scheme would be achieved.
IDFC Nifty Exchange Traded Fund
The fund seeks to provide returns that, before expenses, closely correspond to the total return of the underlying index, subject to tracking errors. There can be no assurance or guarantee that the investment objective of the Scheme would be achieved.
IDFC Dynamic Equity Fund The primary objective of the scheme is to seek to generate long term capital appreciation with relatively lower volatility through systematic allocation of funds into equity and equity related instruments; and for defensive purposes in equity derivatives. The secondary objective of the scheme will be to generate in come and capital appreciation through investment in Debt & Money Market instruments. There is no assurance or guarantee that the objectives of the scheme will be realised.
IDFC Balanced Fund The Fund seeks to generate long term capital appreciation along with current income by investing in a mix of equity and equity related securities, debt securities and money market instruments. There is no assurance or guarantee that the objectives of the scheme will be realized.
IDFC Monthly Income Plan The primary objective of Scheme is to generate regular returns through investment primarily in debt securities. The secondary objective of the Scheme is to generate long-term capital appreciation by investing a portion of the Scheme’s assets in equity securities. Monthly Income is not assumed and the same is subject to availability of distributable surplus.
IDFC Asset Allocation Fund of Fund - Conservative Plan
The primary objective of Scheme is to generate capital appreciation through investment in different Mutual Funds schemes primarily local funds based on a defined asset allocation model. However, there can be no assurance that the investment objective of the scheme will be realized.
IDFC Asset Allocation Fund of Fund - Moderate Plan
The primary objective of Scheme is to generate capital appreciation through investment in different Mutual Funds schemes primarily local funds based on a defined asset allocation model. However, there can be no assurance that the investment objective of the scheme will be realized.
IDFC Asset Allocation Fund of Fund - Aggressive Plan
The primary objective of Scheme is to generate capital appreciation through investment in different Mutual Funds schemes primarily local funds based on a defined asset allocation model. However, there can be no assurance that the investment objective of the scheme will be realized.
IDFC All Seasons Bond Fund Seek to generate optimal returns with high liquidity by active management of the portfolio by investing predominantly in debt oriented mutual fund schemesand money market instruments. However, there can be no assurance that the investment objectives of the Scheme will be realized
IDFC Cash Fund IDFC - CF is an open-ended liquid fund with an objective to generate optimal returns with high liquidity by investing in high quality money market and debt instruments. However, there can be no assurance that the investment objectives of the scheme will be realized.
IDFC Ultra short Term Fund To offer an investment avenue for short term savings by looking to generate stable returns with a low risk strategy. The scheme will have a portfolio that is invested in good quality debt and money market instruments such that the fund will offer a blend of liquidity with stability of returns. There can be no assurance that the investment objective of the scheme will be realized.
IDFC Money Manager Fund - Treasury Plan
Seek to generate stable returns with a low risk strategy by creating a portfolio that is substantially invested in good quality floating rate debt or money market instruments, fixed rate debt or money market instruments swapped for floating returns and fixed rate debt and money market instruments. However, there can be no assurance that the investment objectives of the scheme will be realized.
IDFC Money Manager Fund - Investment Plan
Seek to generate stable returns with a low risk strategy by creating a portfolio that is substantially invested in good quality floating rate debt or money market instruments, fixed rate debt or money market instruments swapped for floating returns and fixed rate debt and money market instruments. However there is no assurance that the investment objective of the scheme will be realized.
IDFC Banking & PSU Debt Fund
The Scheme seeks to generate returns through investments in debt and money market instruments predominantly issued by entities such as Banks, Public Sector Undertakings (PSUs) and Public Financial Institutions(PFIs)
IDFC Super Saver Income Fund - Short Term Plan
The primary investment objective of the scheme is to seek to generate stable returns with a low-risk strategy by creating a portfolio that is invested in good quality fixed income & Money Market securities. However, there can be no assurance that the investment objectives of the scheme will be realized.
IDFC Corporate Bond Fund The Fund seeks to provide steady income and capital appreciation by investing primarily in corporate debt securities across maturities and ratings. However, there is no assurance or guarantee that the objectives of the scheme will be realised.
IDFC Credit Opportunities Fund
The Fund seeks to generate returns by predominantly investing in a portfolio of corporate debt securities across the credit spectrum within the investment grade. There is no assurance or guarantee that the objectives of the scheme will be realized.
IDFC Super Saver Income Fund - Medium Term Plan
The primary investment objective of the scheme is to seek to generate stable returns with a low-risk strategy by creating a portfolio that is invested in good quality fixed income & Money Market securities. However, there can be no assurance that the investment objectives of the scheme will be realized.
IDFC Super Saver Income Fund - Investment Plan
The primary investment objective of the scheme is to seek to generate stable returns with a low-risk strategy by creating a portfolio that is invested in good quality fixed income & Money Market securities. However, there can be no assurance that the investment objectives of the scheme will be realized.
IDFC Dynamic Bond Fund Seek to generate optimal returns with high liquidity by active management of the portfolio; by investing in high quality money market & debt instruments. However there can be no assurance that the investment objectives of the Scheme will be realized.
IDFC Government Securities Fund - Short Term Plan
IDFC – GSF -ST is an open ended dedicated gilt scheme with an objective to generate optimal returns with high liquidity by investing Government Securities. However there is no assurance that the investment objective of the scheme will be realized.
IDFC Government Securities Fund - Provident Fund Plan
Seek to generate optimal returns with high liquidity by investing in Government Securities. However there is no assurance that the investment objective of the scheme will be realized.
IDFC Government Securities Fund - Investment Plan
IDFC – GSF -IP is an open ended dedicated gilt scheme with an objective to generate optimal returns with high liquidity by investing Government Securities. However there is no assurance that the investment objective of the scheme will be realized.
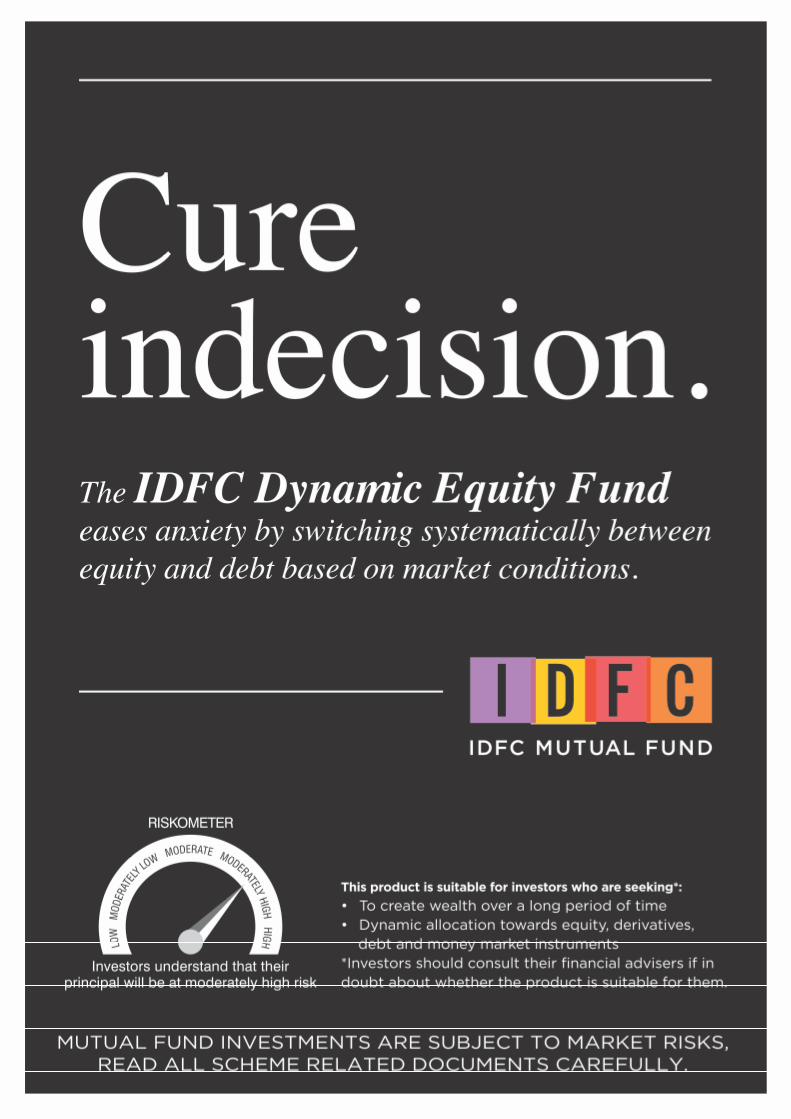
WESTAhmedabad B Wing, 3rd Floor, Chandan House Opp Gruh Finance, Mithakhali Six Roads, Law Garden, Tel.:079-26460923/925
Ahmedabad 380006.Bhopal Plot No. 49, First Floor, Above Tata Capital Limited, M P Nagar, Zone II, Bhopal [M.P.] - 462011.Bhilai 26, Commercial Complex, Nehru Nagar (East), Bhilai, Chhattisgarh, Pin - 490020. Mobile No. 8871144134.Goa F -27 & F -28, 1st Floor, Alfran Plaza, M.G Road, Opp. Don Bosco High School, Panjim - Goa. 403001, Tel.: +91-
0832-6631022.Indore 405, 4th Floor, 21/ 1, D. M. Tower, Race Course Road, Indore - 452 001. Tel.: +91-731-4206927/ 4208048. Fax:
+91-731-4206923.Mumbai ‘One IndiaBulls Centre’ 6th Floor, Jupiter Mills Compound, 841, Senapati Bapat Marg, Elphinstone (W) Mumbai
– 400013. Tel No. 6628 9999Mumbai (Churchgate)
2nd Floor,Ramon House , H.T Parekh Marg, 169,Backbay reclamation, Opp.Aakash wani, Churchgate 400020. Tel.:+912266289999.
Mumbai (Ghatkopar) Mumbai(Thane)
Office No. 308, Zest Business Spaces, M. G. Road, Ghatkopar (East), (Maharashtra) Mumbai- 400077.
Shop No. 1, Konark Towers, Ghantali Devi Road, Thane (West) 400602.
Nagpur Fortune Business Centre, First Floor, 6, VasantVihar, W. H. C. Rd., Shankar Nagar, Nagpur - 440 010. Tel.: +91-712-6451428/ 2525657.
Nasik Shop No - 6, Rajvee Enclave, New Pandit Colony, Off Sharanpur Road, Nasik - 422002. Tel.: 0253-2314611. Mobile: 9823456183.
Pune 1st Floor, Dr. Herekar Park Building, Next to Kamala Nehru Park, Off. Bhandarkar Road, Pune - 411 004. Tel.: +91-20-66020965/ 4.
Raipur T-19,III Floor, Raheja Tower, Near Hotel Celebration, Jail Road, Raipur (C G) - 492001. Tel: 0771-6900699.Rajkot “Star Plaza”, 2nd Floor, Office No. 201, Phulchab Chowk, Rajkot - 360 001. Tel.: +91-281-6620921 / 2475237.Surat U 15/16, Jolly Plaza, Athvagate, Surat - 395 001. Tel.: +91-261-2475060, 2475070.Vadodara 301, 2nd Floor, Earth Complex, Opposite Vaccine Ground, Above Indian Overseas Bank, Old Padra Road,
Vadodara - 380015. Tel No.: 0265 - 2339623/2339624/2339325.NORTHAgra Office No. 307A, 3rd Floor, Block #38/4A, Sumriddhi Business Suites, Sanjay Place, Agra - 282 002. Tel.:+91-
562-4064889Amritsar 6-FUF, 4th Floor Central Mall, Mall Road, Amritsar - 143001. Tel.:+911835030393.Chandigarh SCO 2475 - 76, 1st Floor, Sector 22, Chandigarh - 160 022. Tel.: +91 17 2507 1918 /5071919, Fax: +91-172-5071918.Dehradun G-12 B NCR Plaza, Ground Floor, 24 A, 112/28, Ravindranath Tagore Marg, New Cantt Road, Dehradun-248001.
Mobile: 9897934555, 8171872220Jaipur 301-A, 3rd Floor, Ambition Tower, Agersen Circle, Malan Ka Chaurah, Subash Marg, C-Scheme, Jaipur - 302 001.
Tel. No. : +91-0141- 2360945, 2360947, 2360948Jalandhar 1st floor, Satnam Complex, BMC Chowk, G.T.Road, Jalandhar-144001. Punjab-India. Tel.: 01815018264.Kanpur Office No. 214-215, IInd Floor, KAN Chambers, 14/113, Civil Lines, Kanpur - 208 001. Tel.: +91-512-2331071,
2331119.Lucknow 1st floor, Aryan Business Park, Exchange Cottage, 90.M.G. Marg, Park Road, Lucknow-226001, Mob: 9792999940,
Tel.: 0522-4928100 - 106, 0522-6888012Ludhiana SCO 124, 1st Floor, Feroze Gandhi Market, Ludhiana - 141 001. Tel.: 0161-5022155/ 56/ 57.New Delhi 4th Floor, NarainManzil, 23, Barakhamba Road, New Delhi - 110 001. Tel.: +91-11-47311301/ 02/ 03/ 04/ 05.Varanasi IDFC Asset Management Co. Ltd. 3rd Floor, Premise No. D-64/127, CH, Arihant Complex, Sigra Varanasi - 221010
(U.P). Phone No. 05422226527Gurgaon 117, 1st Floor, Vipul Agora, M. G. Road, Gurgaon - 122 001. Ph: 011-47311336.SOUTHBangalore 6th Floor, East Wing, Raheja Towers, #26 & 27, M. G. Road, Bangalore - 560 001. Tel.: +91-80-43079000/ 01/
02/ 03, Fax - +91-80-43079009.Chennai KRM Tower, 7th floor, No. 1, Harrington Road, Chetpet, Chennai - 600 031. Tel.: +91-44-45644201/ 202.Cochin 39/3993 B2, Gr. Floor, Vantage Point, VRM Rd, Ravipuram, Cochin - 682 016. Tel: +91-484-3012639/ 4029291,
Fax: +91-484-2358639.Coimbatore A Complex , No. 49, Father Randy Street, Azad Road, R. S. Puram, Coimbatore - 641 002. Hyderabad 3rd Floor, SB Towers, Banjara Hills Road No. 1, Nearby Nagarjuna Circle, Hyderabad -500 034Madurai No.278, 1st Floor, Nadar Lane, North Perumal Maistry Street, Madurai - 625 001. Tel.: 0452-6455530.Mangalore Shop No 4, Ground Floor, Raj Towers, Balmatta Road, Mangalore – 575001. Tel. : +91 9845287279.Mysore CH 26, Shop No 1, 2nd Floor, 7th Main, 5th Cross ( Veta Building ) Saraswathipuram, Mysore - 570009.Trivandrum T.C.2/3262(6), 1st Floor, RS Complex, Opposite LIC Building, Pattom P O, Trivandrum - 695 004.
Tel. : 9809053381.EASTBhubaneswar Rajdhani House, 1st Floor, 77 Kharvel Nagar, Janpath, Bhubaneswar - 751001. Phone : 0674 6444252 / 0674
2531048 / 0674 2531148.Guwahati 4E, 4th Floor, Ganapati Enclave, G. S. Road, Ulubari, Opp. Bora Service Station, Guwahati - 781 007. Mobile:
9207410763, 9207410764, 9207410765, 9207410766.Jamshedpur IDFC Mutual Fund, Room No.111, 1st Floor, Yashkamal Complex, Main Road, Bistupur, Jamshedpur-831001, Ph No.
0657-2230112/111/222, Mobile No. : 9431102883.Kolkata Oswal Chambers, 1st Floor, 2 Church Lane, Kolkata - 700 001. Tel.: +91-33-40171000/ 1005.Patna 406, Ashiana Hariniwas, New Dakbanglow Road, Patna - 800 001. Tel.: +91-612-6510353. Ranchi : 306, Shrilok
Complex, 4 H B Road, Ranchi-834001 Phone : 0651-2212592/9931156362.Durgapur (West Bengal)
6/2A, Suhatta, 6th Floor, City Centre, Durgapur - 713216. Phone No.: +91 8537867746.
Mutual Fund investments are subject to market risks, read all scheme related documents carefully.