march 2017 - hdfc mutual fund · 2017-04-19 · 2 march 2017 intouch mutually ... hdfc cash...
TRANSCRIPT

March 2017
2 March 2017 Intouch mutually
CONTENTS
pagE NO.MARKET REVIEW .................................................................................................................................................................................................. 3HDFC GRoWTH FunD ........................................................................................................................................................................................... 4HDFC EquITy FunD .............................................................................................................................................................................................. 5HDFC Top 200 FunD ............................................................................................................................................................................................ 6HDFC CApITAl BuIlDER FunD .............................................................................................................................................................................. 7HDFC CoRE & SATEllITE FunD ............................................................................................................................................................................. 8HDFC pREMIER MulTI-CAp FunD ......................................................................................................................................................................... 9HDFC lARGE CAp FunD ........................................................................................................................................................................................ 10HDFC MID-CAp oppoRTunITIES FunD ................................................................................................................................................................. 11HDFC SMAll CAp FunD........................................................................................................................................................................................ 12HDFC lonG TERM ADVAnTAGE FunD .................................................................................................................................................................. 13HDFC TAxSAVER ................................................................................................................................................................................................... 14HDFC InFRASTRuCTuRE FunD .............................................................................................................................................................................. 15HDFC ARBITRAGE FunD........................................................................................................................................................................................ 16HDFC InDEx FunD - SEnSEx plAn ....................................................................................................................................................................... 17HDFC InDEx FunD - nIFTy plAn .......................................................................................................................................................................... 18HDFC InDEx FunD - SEnSEx pluS plAn .............................................................................................................................................................. 19HDFC BAlAnCED FunD ........................................................................................................................................................................................ 20HDFC pRuDEnCE FunD ........................................................................................................................................................................................ 21HDFC CHIlDREn’S GIFT FunD - InVESTMEnT plAn .............................................................................................................................................. 22HDFC CHIlDREn’S GIFT FunD - SAVInGS plAn ..................................................................................................................................................... 23HDFC RETIREMEnT SAVInGS FunD - EquITy plAn ............................................................................................................................................... 24HDFC RETIREMEnT SAVInGS FunD - HyBRID EquITy plAn .................................................................................................................................. 25HDFC RETIREMEnT SAVInGS FunD - HyBRID DEBT plAn...................................................................................................................................... 26HDFC MF MonTHly InCoME plAn - SHoRT TERM plAn ...................................................................................................................................... 27HDFC MF MonTHly InCoME plAn - lonG TERM plAn ....................................................................................................................................... 28HDFC EquITy SAVInGS FunD ............................................................................................................................................................................... 29HDFC MulTIplE yIElD FunD - plAn 2005 ............................................................................................................................................................ 30HDFC InCoME FunD ............................................................................................................................................................................................ 31HDFC HIGH InTEREST FunD - DynAMIC plAn ...................................................................................................................................................... 32HDFC HIGH InTEREST FunD - SHoRT TERM plAn ................................................................................................................................................. 33HDFC SHoRT TERM plAn ...................................................................................................................................................................................... 34HDFC SHoRT TERM oppoRTunITIES FunD ........................................................................................................................................................... 35HDFC MEDIuM TERM oppoRTunITIES FunD ........................................................................................................................................................ 36HDFC GIlT FunD - SHoRT TERM plAn .................................................................................................................................................................. 37HDFC GIlT FunD - lonG TERM plAn .................................................................................................................................................................... 38HDFC FloATInG RATE InCoME FunD - SHoRT TERM plAn .................................................................................................................................. 39HDFC FloATInG RATE InCoME FunD - lonG TERM plAn .................................................................................................................................... 40HDFC lIquID FunD .............................................................................................................................................................................................. 41HDFC CASH MAnAGEMEnT FunD - SAVInGS plAn .............................................................................................................................................. 42HDFC CASH MAnAGEMEnT FunD - TREASuRy ADVAnTAGE plAn ....................................................................................................................... 43HDFC CoRpoRATE DEBT oppoRTunITIES FunD .................................................................................................................................................... 44HDFC BAnKInG AnD pSu DEBT FunD .................................................................................................................................................................. 45pERFoRMAnCE DETAIlS oF SCHEMES MAnAGED By RESpECTIVE FunD MAnAGERS ........................................................................................... 46SCHEME pERFoRMAnCE SuMMARy - REGulAR plAnS ........................................................................................................................................ 47-60SCHEME pERFoRMAnCE SuMMARy - DIRECT plAnS ............................................................................................................................................ 61-78GloSSARy ............................................................................................................................................................................................................. 79HoW To READ FACTSHEET ................................................................................................................................................................................... 79DIVIDEnD HISToRy ............................................................................................................................................................................................... 80-82DISClAIMER ......................................................................................................................................................................................................... 82
Intouch mutually March 2017 3
Market Review
Source for various data points: RBI Website, Bloomberg, Reuters and HDFC AMC Research.
Equity Market update
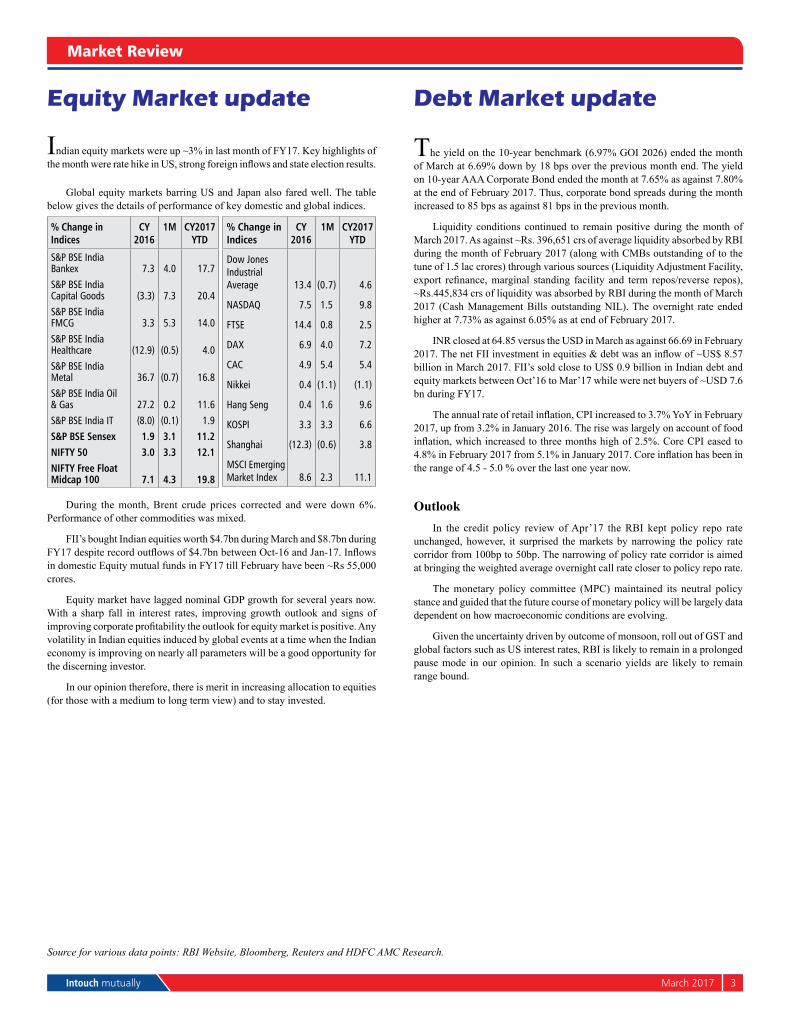
Indian equity markets were up ~3% in last month of FY17. Key highlights of the month were rate hike in US, strong foreign inflows and state election results.
Global equity markets barring US and Japan also fared well. The table below gives the details of performance of key domestic and global indices.
% Change in Indices
CY 2016
1M CY2017 YTD
S&p BSE India Bankex 7.3 4.0 17.7S&p BSE India Capital Goods (3.3) 7.3 20.4S&p BSE India FMCG 3.3 5.3 14.0S&p BSE India Healthcare (12.9) (0.5) 4.0S&p BSE India Metal 36.7 (0.7) 16.8S&p BSE India oil & Gas 27.2 0.2 11.6S&p BSE India IT (8.0) (0.1) 1.9S&p BSE Sensex 1.9 3.1 11.2NIFTY 50 3.0 3.3 12.1NIFTY Free Float Midcap 100 7.1 4.3 19.8
% Change in Indices
CY 2016
1M CY2017 YTD
Dow Jones Industrial Average 13.4 (0.7) 4.6
nASDAq 7.5 1.5 9.8
FTSE 14.4 0.8 2.5
DAx 6.9 4.0 7.2
CAC 4.9 5.4 5.4
nikkei 0.4 (1.1) (1.1)
Hang Seng 0.4 1.6 9.6
KoSpI 3.3 3.3 6.6
Shanghai (12.3) (0.6) 3.8
MSCI Emerging Market Index 8.6 2.3 11.1
During the month, Brent crude prices corrected and were down 6%. Performance of other commodities was mixed.
FII’s bought Indian equities worth $4.7bn during March and $8.7bn during FY17 despite record outflows of $4.7bn between Oct-16 and Jan-17. Inflows in domestic Equity mutual funds in FY17 till February have been ~Rs 55,000 crores.
Equity market have lagged nominal GDP growth for several years now. With a sharp fall in interest rates, improving growth outlook and signs of improving corporate profitability the outlook for equity market is positive. Any volatility in Indian equities induced by global events at a time when the Indian economy is improving on nearly all parameters will be a good opportunity for the discerning investor.
In our opinion therefore, there is merit in increasing allocation to equities (for those with a medium to long term view) and to stay invested.
Debt Market update
The yield on the 10-year benchmark (6.97% GOI 2026) ended the month of March at 6.69% down by 18 bps over the previous month end. The yield on 10-year AAA Corporate Bond ended the month at 7.65% as against 7.80% at the end of February 2017. Thus, corporate bond spreads during the month increased to 85 bps as against 81 bps in the previous month.
Liquidity conditions continued to remain positive during the month of March 2017. As against ~Rs. 396,651 crs of average liquidity absorbed by RBI during the month of February 2017 (along with CMBs outstanding of to the tune of 1.5 lac crores) through various sources (Liquidity Adjustment Facility, export refinance, marginal standing facility and term repos/reverse repos), ~Rs.445,834 crs of liquidity was absorbed by RBI during the month of March 2017 (Cash Management Bills outstanding NIL). The overnight rate ended higher at 7.73% as against 6.05% as at end of February 2017.
INR closed at 64.85 versus the USD in March as against 66.69 in February 2017. The net FII investment in equities & debt was an inflow of ~US$ 8.57 billion in March 2017. FII’s sold close to US$ 0.9 billion in Indian debt and equity markets between Oct’16 to Mar’17 while were net buyers of ~USD 7.6 bn during FY17.
The annual rate of retail inflation, CPI increased to 3.7% YoY in February 2017, up from 3.2% in January 2016. The rise was largely on account of food inflation, which increased to three months high of 2.5%. Core CPI eased to 4.8% in February 2017 from 5.1% in January 2017. Core inflation has been in the range of 4.5 - 5.0 % over the last one year now.
OutlookIn the credit policy review of Apr’17 the RBI kept policy repo rate
unchanged, however, it surprised the markets by narrowing the policy rate corridor from 100bp to 50bp. The narrowing of policy rate corridor is aimed at bringing the weighted average overnight call rate closer to policy repo rate.
The monetary policy committee (MPC) maintained its neutral policy stance and guided that the future course of monetary policy will be largely data dependent on how macroeconomic conditions are evolving.
Given the uncertainty driven by outcome of monsoon, roll out of GST and global factors such as US interest rates, RBI is likely to remain in a prolonged pause mode in our opinion. In such a scenario yields are likely to remain range bound.
4 March 2017 Intouch mutually
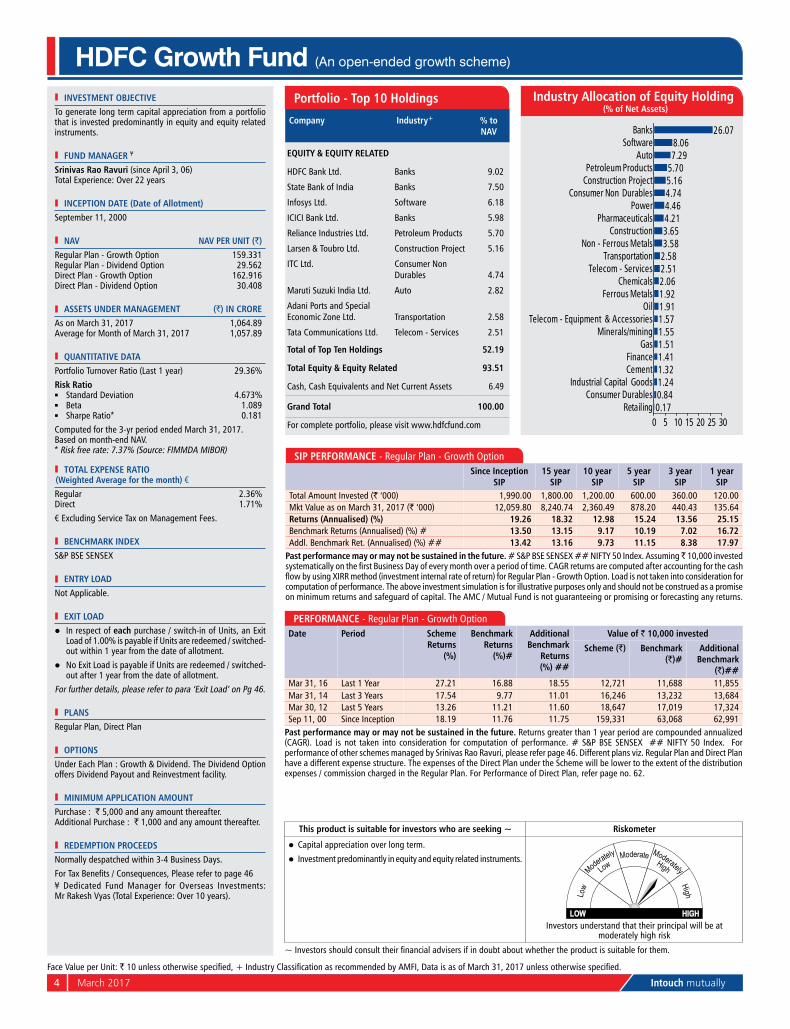
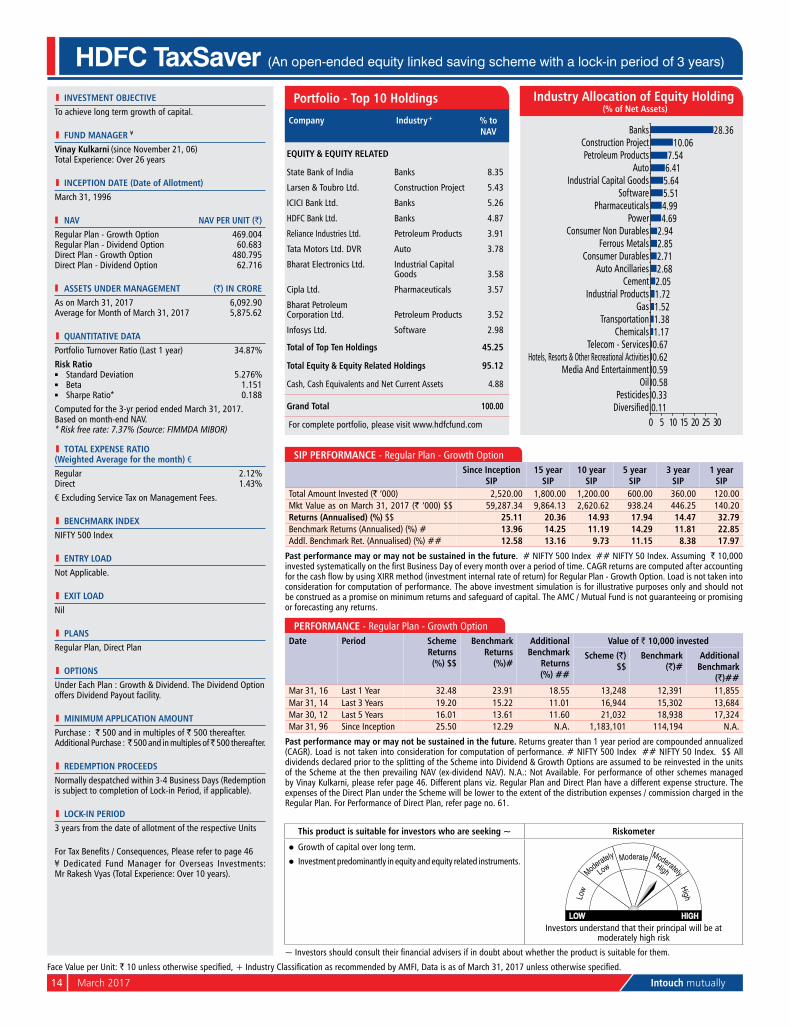
0.170.841.241.321.411.511.551.571.911.922.062.512.583.583.654.214.464.745.165.707.298.06
26.07
0 5 10 15 20 25 30Retailing
Consumer DurablesIndustrial Capital Goods
CementFinance
GasMinerals/mining
Telecom - Equipment & AccessoriesOil
Ferrous MetalsChemicals
Telecom - ServicesTransportation
Non - Ferrous MetalsConstruction
PharmaceuticalsPower
Consumer Non DurablesConstruction ProjectPetroleum Products
AutoSoftware
Banks
INvESTMENT OBjECTIvETo generate long term capital appreciation from a portfolio that is invested predominantly in equity and equity related instruments.
FuND MaNagEr ¥
Srinivas rao ravuri (since April 3, 06) Total Experience: over 22 years
INCEpTION DaTE (Date of allotment)September 11, 2000
Nav Nav pEr uNIT (`)Regular plan - Growth option 159.331Regular plan - Dividend option 29.562Direct plan - Growth option 162.916Direct plan - Dividend option 30.408
aSSETS uNDEr MaNagEMENT (`) IN CrOrEAs on March 31, 2017 1,064.89Average for Month of March 31, 2017 1,057.89
quaNTITaTIvE DaTaportfolio Turnover Ratio (last 1 year) 29.36%
risk ration Standard Deviation 4.673%n Beta 1.089n Sharpe Ratio* 0.181
Computed for the 3-yr period ended March 31, 2017.Based on month-end nAV.* Risk free rate: 7.37% (Source: FIMMDA MIBoR)
TOTal ExpENSE raTIO (Weighted average for the month) €Regular 2.36%Direct 1.71%
€ Excluding Service Tax on Management Fees.
BENCHMarK INDExS&p BSE SEnSEx
ENTrY lOaDnot Applicable.
ExIT lOaDl In respect of each purchase / switch-in of units, an Exit
load of 1.00% is payable if units are redeemed / switched-out within 1 year from the date of allotment.
l no Exit load is payable if units are redeemed / switched-out after 1 year from the date of allotment.
For further details, please refer to para ‘Exit load’ on pg 46.
plaNSRegular plan, Direct plan
OpTIONSunder Each plan : Growth & Dividend. The Dividend option offers Dividend payout and Reinvestment facility.
MINIMuM applICaTION aMOuNTpurchase : ` 5,000 and any amount thereafter.Additional purchase : ` 1,000 and any amount thereafter.
rEDEMpTION prOCEEDSnormally despatched within 3-4 Business Days.
For Tax Benefits / Consequences, Please refer to page 46¥ Dedicated Fund Manager for overseas Investments: Mr Rakesh Vyas (Total Experience: over 10 years).
HDFC Growth Fund (An open-ended growth scheme)
Company Industry+ % to Nav
EquITY & EquITY rElaTED
HDFC Bank ltd. Banks 9.02
State Bank of India Banks 7.50
Infosys ltd. Software 6.18
ICICI Bank ltd. Banks 5.98
Reliance Industries ltd. petroleum products 5.70
larsen & Toubro ltd. Construction project 5.16
ITC ltd. Consumer non Durables 4.74
Maruti Suzuki India ltd. Auto 2.82
Adani ports and Special Economic Zone ltd. Transportation 2.58
Tata Communications ltd. Telecom - Services 2.51
Total of Top Ten Holdings 52.19
Total Equity & Equity related 93.51
Cash, Cash Equivalents and net Current Assets 6.49
grand Total 100.00
For complete portfolio, please visit www.hdfcfund.com
portfolio - Top 10 Holdings
This product is suitable for investors who are seeking ~ riskometer
l Capital appreciation over long term.
l Investment predominantly in equity and equity related instruments.
Investors understand that their principal will be at moderately high risk
~ Investors should consult their financial advisers if in doubt about whether the product is suitable for them.
SIp pErFOrMaNCE - Regular plan - Growth optionSince Inception
SIp15 year
SIp10 year
SIp5 year
SIp3 year
SIp1 year
SIpTotal Amount Invested (` ‘000) 1,990.00 1,800.00 1,200.00 600.00 360.00 120.00Mkt Value as on March 31, 2017 (` ‘000) 12,059.80 8,240.74 2,360.49 878.20 440.43 135.64returns (annualised) (%) 19.26 18.32 12.98 15.24 13.56 25.15Benchmark Returns (Annualised) (%) # 13.50 13.15 9.17 10.19 7.02 16.72Addl. Benchmark Ret. (Annualised) (%) ## 13.42 13.16 9.73 11.15 8.38 17.97
past performance may or may not be sustained in the future. # S&p BSE SEnSEx ## nIFTy 50 Index. Assuming ̀ 10,000 invested systematically on the first Business Day of every month over a period of time. CAGR returns are computed after accounting for the cash flow by using XIRR method (investment internal rate of return) for Regular Plan - Growth Option. Load is not taken into consideration for computation of performance. The above investment simulation is for illustrative purposes only and should not be construed as a promise on minimum returns and safeguard of capital. The AMC / Mutual Fund is not guaranteeing or promising or forecasting any returns.
Industry allocation of Equity Holding (% of Net assets)
Face Value per unit: ` 10 unless otherwise specified, + Industry Classification as recommended by AMFI, Data is as of March 31, 2017 unless otherwise specified.
pErFOrMaNCE - Regular plan - Growth optionDate period Scheme
returns (%)
Benchmark returns
(%)#
additional Benchmark
returns (%) ##
value of ` 10,000 invested
Scheme (`) Benchmark (`)#
additional Benchmark
(`)##Mar 31, 16 last 1 year 27.21 16.88 18.55 12,721 11,688 11,855Mar 31, 14 last 3 years 17.54 9.77 11.01 16,246 13,232 13,684Mar 30, 12 last 5 years 13.26 11.21 11.60 18,647 17,019 17,324Sep 11, 00 Since Inception 18.19 11.76 11.75 159,331 63,068 62,991
past performance may or may not be sustained in the future. Returns greater than 1 year period are compounded annualized (CAGR). load is not taken into consideration for computation of performance. # S&p BSE SEnSEx ## nIFTy 50 Index. For performance of other schemes managed by Srinivas Rao Ravuri, please refer page 46. Different plans viz. Regular plan and Direct plan have a different expense structure. The expenses of the Direct plan under the Scheme will be lower to the extent of the distribution expenses / commission charged in the Regular plan. For performance of Direct plan, refer page no. 62.
Intouch mutually March 2017 5
l INvESTMENT OBjECTIvETo achieve capital appreciation.
l FuND MaNagEr § ¥
prashant jain (since June 19, 03) Total Experience: over 26 years
l INCEpTION DaTE (Date of allotment)January 1, 1995
Nav Nav pEr uNIT (`)Regular plan - Growth option 543.769Regular plan - Dividend option 51.055Direct plan - Growth option 561.617Direct plan - Dividend option 53.201
aSSETS uNDEr MaNagEMENT (`) IN CrOrEAs on March 31, 2017 17,948.94Average for Month of March 31, 2017 17,564.10
l quaNTITaTIvE DaTaportfolio Turnover Ratio (last 1 year) 23.05%
risk ration Standard Deviation 5.354%n Beta 1.185n Sharpe Ratio* 0.169
Computed for the 3-yr period ended March 31, 2017.Based on month-end nAV.* Risk free rate: 7.37% (Source: FIMMDA MIBoR)
l TOTal ExpENSE raTIO (Weighted average for the month) €Regular 2.13%Direct 1.30%
€ Excluding Service Tax on Management Fees.
l BENCHMarK INDExnIFTy 500 Index
l ENTrY lOaDnot Applicable.
l ExIT lOaDl In respect of each purchase / switch-in of units, an Exit load
of 1.00% is payable if units are redeemed / switched-out within 1 year from the date of allotment.
l no Exit load is payable if units are redeemed / switched-out after 1 year from the date of allotment.
For further details, please refer to para ‘Exit load’ on pg 46.
l plaNSRegular plan, Direct plan
l OpTIONSunder Each plan : Growth & Dividend. The Dividend option offers Dividend payout and Reinvestment facility.
l MINIMuM applICaTION aMOuNTpurchase : ` 5,000 and any amount thereafter.Additional purchase : ` 1,000 and any amount thereafter.
l rEDEMpTION prOCEEDSnormally despatched within 3-4 Business Days.
For Tax Benefits / Consequences, Please refer to page 46§ Date of migration from Zurich India Mutual Fund (Close of business hours - June 19, 03
¥ Dedicated Fund Manager for overseas Investments: Mr Rakesh Vyas (Total Experience: over 10 years).
Company Industry+ % to Nav
EquITY & EquITY rElaTED
State Bank of India Banks 10.01
ICICI Bank ltd. Banks 8.70
larsen & Toubro ltd. Construction project 7.62
Infosys ltd. Software 6.71
HDFC Bank ltd. Banks 4.87
Maruti Suzuki India ltd. Auto 4.59
Reliance Industries ltd. petroleum products 4.54
Balkrishna Industries ltd. Auto Ancillaries 2.96
CESC ltd. power 2.83
Bank of Baroda Banks 2.82
Total of Top Ten Holdings 55.65
Total Equity & Equity related Holdings 99.21
Cash margin / Earmarked cash for Futures & options 0.39
Cash, Cash Equivalents and net Current Assets 0.40
grand Total 100.00
For complete portfolio, please visit www.hdfcfund.com
HDFC Equity Fund (An open-ended growth scheme)
portfolio - Top 10 Holdings
This product is suitable for investors who are seeking ~ riskometer
l Capital appreciation over long term.
l Investment predominantly in equity and equity related instruments of medium to large sized companies.
Investors understand that their principal will be at moderately high risk
~ Investors should consult their financial advisers if in doubt about whether the product is suitable for them.
SIp pErFOrMaNCE - Regular plan - Growth optionSince Inception
SIp15 year
SIp10 year
SIp5 year
SIp3 year
SIp1 year
SIpTotal Amount Invested (` ‘000) 2,670.00 1,800.00 1,200.00 600.00 360.00 120.00Mkt Value as on March 31, 2017 (` ‘000) 58,982.96 9,941.56 2,639.40 914.80 436.07 136.71returns (annualised) (%) 23.11 20.44 15.07 16.91 12.87 26.93Benchmark Returns (Annualised) (%) # 13.53 14.25 11.19 14.29 11.81 22.85Addl. Benchmark Ret. (Annualised) (%) ## 12.27 13.16 9.73 11.15 8.38 17.97
past performance may or may not be sustained in the future. # nIFTy 500 Index ## nIFTy 50 Index. Assuming ` 10,000 invested systematically on the first Business Day of every month over a period of time. CAGR returns are computed after accounting for the cash flow by using XIRR method (investment internal rate of return) for Regular Plan - Growth Option. load is not taken into consideration for computation of performance. The above investment simulation is for illustrative purposes only and should not be construed as a promise on minimum returns and safeguard of capital. The AMC / Mutual Fund is not guaranteeing or promising or forecasting any returns.
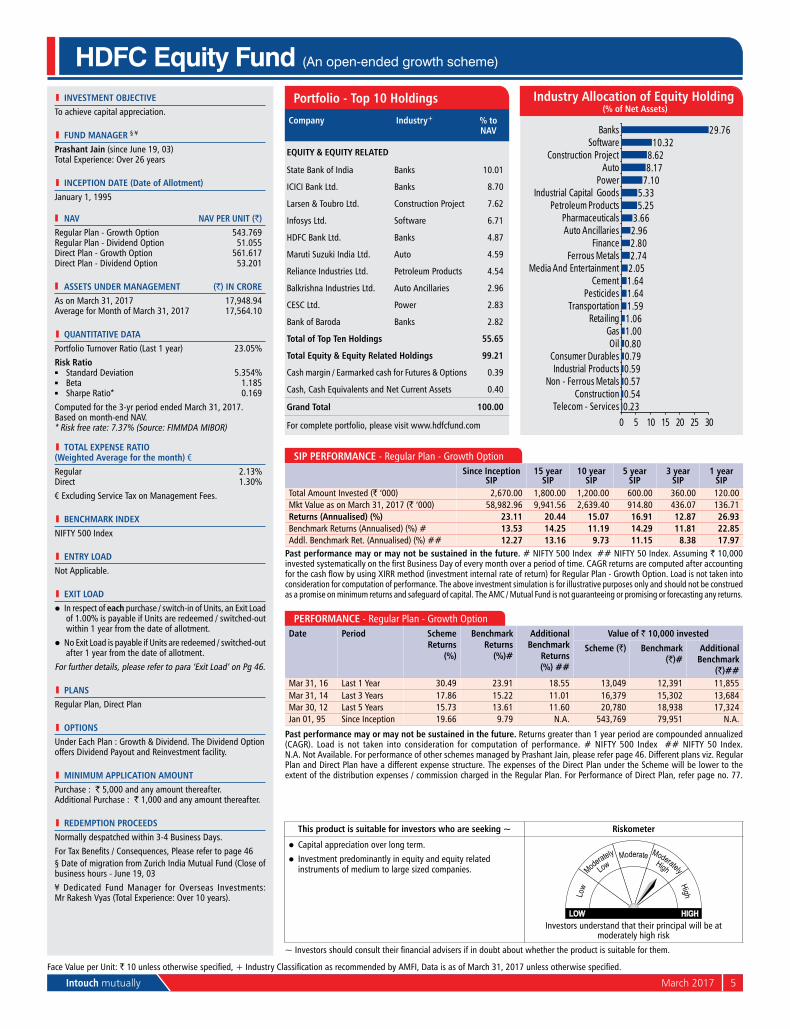
0.230.540.570.590.790.801.001.061.591.641.642.052.742.802.963.66
5.255.33
7.108.178.62
10.3229.76
0 5 10 15 20 25 30Telecom - Services
ConstructionNon - Ferrous Metals
Industrial ProductsConsumer Durables
OilGas
RetailingTransportation
PesticidesCement
Media And EntertainmentFerrous Metals
FinanceAuto AncillariesPharmaceuticals
Petroleum ProductsIndustrial Capital Goods
PowerAuto
Construction ProjectSoftware
Banks
Industry allocation of Equity Holding (% of Net assets)
Face Value per unit: ` 10 unless otherwise specified, + Industry Classification as recommended by AMFI, Data is as of March 31, 2017 unless otherwise specified.
pErFOrMaNCE - Regular plan - Growth optionDate period Scheme
returns (%)
Benchmark returns
(%)#
additional Benchmark
returns (%) ##
value of ` 10,000 invested
Scheme (`) Benchmark (`)#
additional Benchmark
(`)##Mar 31, 16 last 1 year 30.49 23.91 18.55 13,049 12,391 11,855Mar 31, 14 last 3 years 17.86 15.22 11.01 16,379 15,302 13,684Mar 30, 12 last 5 years 15.73 13.61 11.60 20,780 18,938 17,324Jan 01, 95 Since Inception 19.66 9.79 n.A. 543,769 79,951 n.A.
past performance may or may not be sustained in the future. Returns greater than 1 year period are compounded annualized (CAGR). load is not taken into consideration for computation of performance. # nIFTy 500 Index ## nIFTy 50 Index. n.A. not Available. For performance of other schemes managed by prashant Jain, please refer page 46. Different plans viz. Regular plan and Direct plan have a different expense structure. The expenses of the Direct plan under the Scheme will be lower to the extent of the distribution expenses / commission charged in the Regular plan. For performance of Direct plan, refer page no. 77.
6 March 2017 Intouch mutually
l INvESTMENT OBjECTIvETo generate long term capital appreciation from a portfolio of equity and equity linked instruments. The investment portfolio for equity and equity linked instruments will be primarily drawn from the companies in the BSE 200 Index. Further, the Scheme may also invest in listed companies that would qualify to be in the top 200 by market capitalisation on the BSE even though they may not be listed on the BSE. This includes participation in large Ipos where in the market capitalisation of the company based on issue price would make the company a part of the top 200 companies listed on the BSE based on market capitalisation.
l FuND MaNagEr § ¥
prashant jain (since June 19, 03) Total Experience: over 26 years
l INCEpTION DaTE (Date of allotment)october 11, 1996
Nav Nav pEr uNIT (`)Regular plan - Growth option 401.862Regular plan - Dividend option 50.005Direct plan - Growth option 412.763Direct plan - Dividend option 51.712
aSSETS uNDEr MaNagEMENT (`) IN CrOrEAs on March 31, 2017 13,945.03Average for Month of March 31, 2017 13,710.44
l quaNTITaTIvE DaTaportfolio Turnover Ratio (last 1 year) 30.82%risk ration Standard Deviation 5.074%n Beta 1.157n Sharpe Ratio* 0.157Computed for the 3-yr period ended March 31, 2017.Based on month-end nAV.* Risk free rate: 7.37% (Source: FIMMDA MIBoR)
l TOTal ExpENSE raTIO (Weighted average for the month) €Regular 2.12%Direct 1.49%€ Excluding Service Tax on Management Fees.
l BENCHMarK INDExS&p BSE 200
l ENTrY lOaDnot Applicable.
l ExIT lOaDl In respect of each purchase / switch-in of units, an Exit
load of 1.00% is payable if units are redeemed / switched-out within 1 year from the date of allotment.
l no Exit load is payable if units are redeemed / switched-out after 1 year from the date of allotment.
For further details, please refer to para ‘Exit load’ on pg 46.
l plaNSRegular plan, Direct plan
l OpTIONSunder Each plan : Growth & Dividend. The Dividend option offers Dividend payout and Reinvestment facility.
l MINIMuM applICaTION aMOuNTpurchase : ` 5,000 and any amount thereafter.Additional purchase : ` 1,000 and any amount thereafter.
l rEDEMpTION prOCEEDSnormally despatched within 3-4 Business Days.For Tax Benefits / Consequences, Please refer to page 46§ Date of migration from Zurich India Mutual Fund (Close of business hours - June 19, 03¥ Dedicated Fund Manager for overseas Investments: Mr Rakesh Vyas (Total Experience: over 10 years).
HDFC Top 200 Fund (An open-ended growth scheme)
This product is suitable for investors who are seeking ~ riskometer
l Capital appreciation over long term.
l Investment in equity and equity linked instruments including equity derivatives primarily drawn from the companies in the S&p BSE 200 Index.
Investors understand that their principal will be at moderately high risk
~ Investors should consult their financial advisers if in doubt about whether the product is suitable for them.
Company Industry+ % to Nav
EquITY & EquITY rElaTED
HDFC Bank ltd. Banks 7.36
State Bank of India Banks 6.83
larsen & Toubro ltd. Construction project 6.14
ICICI Bank ltd. Banks 6.09
Infosys ltd. Software 4.96
Reliance Industries ltd. petroleum products 4.74
ITC ltd. Consumer non Durables 4.35
Tata Consultancy Services ltd. Software 2.83
Maruti Suzuki India ltd. Auto 2.79
Housing Development Finance Corporation ltd.£ Finance 2.78
Total of Top Ten Holdings 48.87
Total Equity & Equity related Holdings 98.42
Cash margin/ Earmarked cash for Futures & options 0.67
Cash, Cash Equivalents and net Current Assets 0.91
grand Total 100.00
For complete portfolio, please visit www.hdfcfund.com
portfolio - Top 10 Holdings
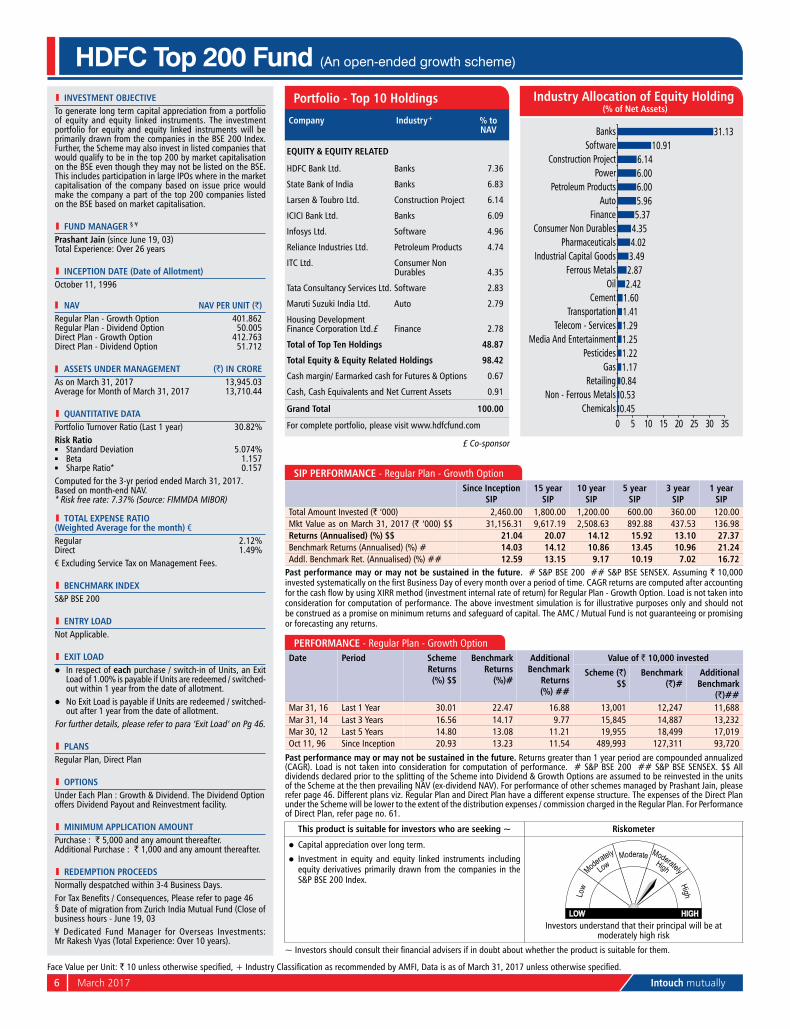
0.450.530.841.171.221.251.291.411.602.422.873.494.024.355.375.966.006.006.14
10.9131.13
0 5 10 15 20 25 30 35Chemicals
Non - Ferrous MetalsRetailing
GasPesticides
Media And EntertainmentTelecom - Services
TransportationCement
OilFerrous Metals
Industrial Capital GoodsPharmaceuticals
Consumer Non DurablesFinance
AutoPetroleum Products
PowerConstruction Project
SoftwareBanks
Industry allocation of Equity Holding (% of Net assets)
SIp pErFOrMaNCE - Regular plan - Growth optionSince Inception
SIp15 year
SIp10 year
SIp5 year
SIp3 year
SIp1 year
SIpTotal Amount Invested (` ‘000) 2,460.00 1,800.00 1,200.00 600.00 360.00 120.00Mkt Value as on March 31, 2017 (` ‘000) $$ 31,156.31 9,617.19 2,508.63 892.88 437.53 136.98returns (annualised) (%) $$ 21.04 20.07 14.12 15.92 13.10 27.37Benchmark Returns (Annualised) (%) # 14.03 14.12 10.86 13.45 10.96 21.24Addl. Benchmark Ret. (Annualised) (%) ## 12.59 13.15 9.17 10.19 7.02 16.72
past performance may or may not be sustained in the future. # S&p BSE 200 ## S&p BSE SEnSEx. Assuming ` 10,000 invested systematically on the first Business Day of every month over a period of time. CAGR returns are computed after accounting for the cash flow by using XIRR method (investment internal rate of return) for Regular Plan - Growth Option. Load is not taken into consideration for computation of performance. The above investment simulation is for illustrative purposes only and should not be construed as a promise on minimum returns and safeguard of capital. The AMC / Mutual Fund is not guaranteeing or promising or forecasting any returns.
pErFOrMaNCE - Regular plan - Growth optionDate period Scheme
returns (%) $$
Benchmark returns
(%)#
additional Benchmark
returns (%) ##
value of ` 10,000 invested
Scheme (`) $$
Benchmark (`)#
additional Benchmark
(`)##Mar 31, 16 last 1 year 30.01 22.47 16.88 13,001 12,247 11,688Mar 31, 14 last 3 years 16.56 14.17 9.77 15,845 14,887 13,232Mar 30, 12 last 5 years 14.80 13.08 11.21 19,955 18,499 17,019oct 11, 96 Since Inception 20.93 13.23 11.54 489,993 127,311 93,720
past performance may or may not be sustained in the future. Returns greater than 1 year period are compounded annualized (CAGR). load is not taken into consideration for computation of performance. # S&p BSE 200 ## S&p BSE SEnSEx. $$ All dividends declared prior to the splitting of the Scheme into Dividend & Growth options are assumed to be reinvested in the units of the Scheme at the then prevailing nAV (ex-dividend nAV). For performance of other schemes managed by prashant Jain, please refer page 46. Different plans viz. Regular plan and Direct plan have a different expense structure. The expenses of the Direct plan under the Scheme will be lower to the extent of the distribution expenses / commission charged in the Regular plan. For performance of Direct plan, refer page no. 61.
Face Value per unit: ` 10 unless otherwise specified, + Industry Classification as recommended by AMFI, Data is as of March 31, 2017 unless otherwise specified.
£ Co-sponsor
Intouch mutually March 2017 7
This is a simple and performing scheme which is eligible for distribution by new cadre of distributors.
l INvESTMENT OBjECTIvETo achieve capital appreciation in the long term.
l FuND MaNagEr ¥
Miten lathia (since Mar 20, 17) Total Experience: over 20 years(The scheme was co-managed by Chirag Setalvad & Miten lathia till March 19, 17)
l INCEpTION DaTE (Date of allotment)February 1, 1994
Nav Nav pEr uNIT (`)Regular plan - Growth option 248.330Regular plan - Dividend option 27.081Direct plan - Growth option 255.904Direct plan - Dividend option 28.186
aSSETS uNDEr MaNagEMENT (`) IN CrOrEAs on March 31, 2017 1,512.12Average for Month of March 31, 2017 1,454.72
l quaNTITaTIvE DaTaportfolio Turnover Ratio (last 1 year) 31.94%risk ration Standard Deviation 4.753%n Beta 1.083n Sharpe Ratio* 0.234Computed for the 3-yr period ended March 31, 2017.Based on month-end nAV.* Risk free rate: 7.37% (Source: FIMMDA MIBoR)
l TOTal ExpENSE raTIO (Weighted average for the month) €Regular 2.46%Direct 1.42%€ Excluding Service Tax on Management Fees.
l BENCHMarK INDExnIFTy 500 Index
l ENTrY lOaDnot Applicable.
l ExIT lOaDl In respect of each purchase / switch-in of units, an Exit
load of 1.00% is payable if units are redeemed / switched-out within 1 year from the date of allotment.
l no Exit load is payable if units are redeemed / switched-out after 1 year from the date of allotment.
For further details, please refer to para ‘Exit load’ on pg 46.
l plaNSRegular plan, Direct plan
l OpTIONSunder Each plan : Growth & Dividend. The Dividend option offers Dividend payout and Reinvestment facility.
l MINIMuM applICaTION aMOuNTpurchase : ` 5,000 and any amount thereafter.Additional purchase : ` 1,000 and any amount thereafter.
l rEDEMpTION prOCEEDSnormally despatched within 3-4 Business Days.For Tax Benefits / Consequences, Please refer to page 46¥ Dedicated Fund Manager for overseas Investments: Mr Rakesh Vyas (Total Experience: over 10 years).
HDFC Capital Builder Fund (An open-ended growth scheme)
This product is suitable for investors who are seeking ~ riskometer
l Capital appreciation over long term.
l Investment predominantly in equity and equity related instruments of strong companies.
Investors understand that their principal will be at moderately high risk
~ Investors should consult their financial advisers if in doubt about whether the product is suitable for them.
SIp pErFOrMaNCE - Regular plan - Growth optionSince Inception
SIp15 year
SIp10 year
SIp5 year
SIp3 year
SIp1 year
SIpTotal Amount Invested (` ‘000) 2,780.00 1,800.00 1,200.00 600.00 360.00 120.00Mkt Value as on March 31, 2017 (` ‘000) 36,835.41 9,807.25 2,845.12 984.80 459.32 138.60returns (annualised) (%) 18.72 20.29 16.46 19.93 16.50 30.10Benchmark Returns (Annualised) (%) # 13.06 14.25 11.19 14.29 11.81 22.85Addl. Benchmark Ret. (Annualised) (%) ## 11.91 13.16 9.73 11.15 8.38 17.97
past performance may or may not be sustained in the future. # nIFTy 500 Index ## nIFTy 50 Index. Assuming ` 10,000 invested systematically on the first Business Day of every month over a period of time. CAGR returns are computed after accounting for the cash flow by using XIRR method (investment internal rate of return). Load is not taken into consideration for computation of performance. The above investment simulation is for illustrative purposes only and should not be construed as a promise on minimum returns and safeguard of capital. The AMC / Mutual Fund is not guaranteeing or promising or forecasting any returns.
Company Industry+ % to Nav
EquITY & EquITY rElaTED
HDFC Bank ltd. Banks 7.50
ICICI Bank ltd. Banks 6.41
Reliance Industries ltd. petroleum products 4.93
State Bank of India Banks 4.07
Tata Motors ltd. Auto 3.39
Infosys ltd. Software 3.38
Adani ports and Special Economic Zone ltd. Transportation 2.79
VIp Industries ltd. Consumer Durables 2.75
Cipla ltd. pharmaceuticals 2.75
Axis Bank ltd. Banks 2.58
Total of Top Ten Holdings 40.55
Total Equity & Equity related Holdings 93.15
Cash margin/ Earmarked cash for Futures & options 0.24
Cash, Cash Equivalents and net Current Assets 6.61
grand Total 100.00
For complete portfolio, please visit www.hdfcfund.com
portfolio - Top 10 Holdings
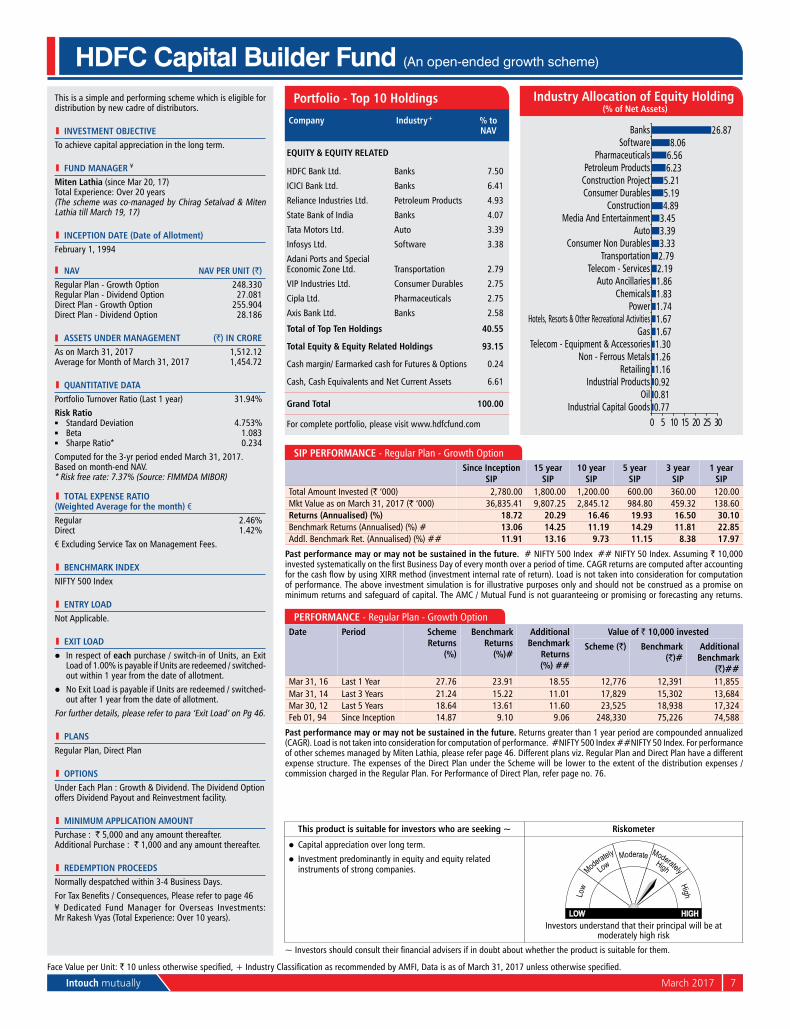
0.770.810.921.161.261.301.671.671.741.831.862.192.793.333.393.454.895.195.216.236.568.06
26.87
0 5 10 15 20 25 30Industrial Capital Goods
OilIndustrial Products
RetailingNon - Ferrous Metals
Telecom - Equipment & AccessoriesGas
Hotels, Resorts & Other Recreational ActivitiesPower
ChemicalsAuto Ancillaries
Telecom - ServicesTransportation
Consumer Non DurablesAuto
Media And EntertainmentConstruction
Consumer DurablesConstruction ProjectPetroleum Products
PharmaceuticalsSoftware
Banks
Industry allocation of Equity Holding (% of Net assets)
pErFOrMaNCE - Regular plan - Growth optionDate period Scheme
returns (%)
Benchmark returns
(%)#
additional Benchmark
returns (%) ##
value of ` 10,000 invested
Scheme (`) Benchmark (`)#
additional Benchmark
(`)##Mar 31, 16 last 1 year 27.76 23.91 18.55 12,776 12,391 11,855Mar 31, 14 last 3 years 21.24 15.22 11.01 17,829 15,302 13,684Mar 30, 12 last 5 years 18.64 13.61 11.60 23,525 18,938 17,324Feb 01, 94 Since Inception 14.87 9.10 9.06 248,330 75,226 74,588
past performance may or may not be sustained in the future. Returns greater than 1 year period are compounded annualized (CAGR). load is not taken into consideration for computation of performance. #nIFTy 500 Index ##nIFTy 50 Index. For performance of other schemes managed by Miten lathia, please refer page 46. Different plans viz. Regular plan and Direct plan have a different expense structure. The expenses of the Direct plan under the Scheme will be lower to the extent of the distribution expenses / commission charged in the Regular plan. For performance of Direct plan, refer page no. 76.
Face Value per unit: ` 10 unless otherwise specified, + Industry Classification as recommended by AMFI, Data is as of March 31, 2017 unless otherwise specified.
8 March 2017 Intouch mutually
l INvESTMENT OBjECTIvETo generate capital appreciation through equity investment in companies whose shares are quoting at prices below their true value.
l FuND MaNagEr ¥
vinay Kulkarni (since november 21, 06) Total Experience: over 26 years
l INCEpTION DaTE (Date of allotment)September 17, 2004
Nav Nav pEr uNIT (`)Regular plan - Growth option 70.780Regular plan - Dividend option 18.940Direct plan - Growth option 73.147Direct plan - Dividend option 19.997
aSSETS uNDEr MaNagEMENT (`) IN CrOrEAs on March 31, 2017 593.52Average for Month of March 31, 2017 575.95
l quaNTITaTIvE DaTaportfolio Turnover Ratio (last 1 year) 24.61%
risk ration Standard Deviation 5.960%n Beta 1.259n Sharpe Ratio* 0.176
Computed for the 3-yr period ended March 31, 2017.Based on month-end nAV.* Risk free rate: 7.37% (Source: FIMMDA MIBoR)
l TOTal ExpENSE raTIO (Weighted average for the month) €Regular 2.53%Direct 1.33%
€ Excluding Service Tax on Management Fees.
l BENCHMarK INDExS&p BSE 200
l ENTrY lOaDnot Applicable.
l ExIT lOaDl In respect of each purchase / switch-in of units, an Exit
load of 1.00% is payable if units are redeemed / switched-out within 1 year from the date of allotment.
l no Exit load is payable if units are redeemed / switched-out after 1 year from the date of allotment.
For further details, please refer to para ‘Exit load’ on pg 46.
l plaNSRegular plan, Direct plan
l OpTIONSunder Each plan : Growth & Dividend. The Dividend option offers Dividend payout and Reinvestment facility.
l MINIMuM applICaTION aMOuNTpurchase : ` 5,000 and any amount thereafter.Additional purchase : ` 1,000 and any amount thereafter.
l rEDEMpTION prOCEEDSnormally despatched within 3-4 Business Days.
For Tax Benefits / Consequences, Please refer to page 46¥ Dedicated Fund Manager for overseas Investments: Mr Rakesh Vyas (Total Experience: over 10 years).
HDFC Core & Satellite Fund (An open-ended growth scheme)
This product is suitable for investors who are seeking ~ riskometer
l Capital appreciation over long term.
l Investment primarily in equity and equity related instruments of companies whose shares are quoting at prices below their true value.
Investors understand that their principal will be at moderately high risk
~ Investors should consult their financial advisers if in doubt about whether the product is suitable for them.
SIp pErFOrMaNCE - Regular plan - Growth optionSince Inception
SIp10 year
SIp5 year
SIp3 year
SIp1 year
SIpTotal Amount Invested (` ‘000) 1,510.00 1,200.00 600.00 360.00 120.00Mkt Value as on March 31, 2017 (` ‘000) 3,732.96 2,388.33 912.01 438.26 135.23returns (annualised) (%) 13.49 13.20 16.78 13.22 24.47Benchmark Returns (Annualised) (%) # 11.49 10.86 13.45 10.96 21.24Addl. Benchmark Ret. (Annualised) (%) ## 10.38 9.17 10.19 7.02 16.72
past performance may or may not be sustained in the future. # S&p BSE 200 ## S&p BSE SEnSEx. Assuming ̀ 10,000 invested systematically on the first Business Day of every month over a period of time. CAGR returns are computed after accounting for the cash flow by using XIRR method (investment internal rate of return) for Regular Plan - Growth Option. Load is not taken into consideration for computation of performance. The above investment simulation is for illustrative purposes only and should not be construed as a promise on minimum returns and safeguard of capital. The AMC / Mutual Fund is not guaranteeing or promising or forecasting any returns.
Company Industry+ % to Nav
EquITY & EquITY rElaTEDlarsen & Toubro ltd. Construction project 6.95Bharat petroleumCorporation ltd. petroleum products 6.21Cipla ltd. pharmaceuticals 6.11Bharat Electronics ltd. Industrial Capital
Goods 5.77ICICI Bank ltd. Banks 5.29Tata Motors ltd. DVR Auto 5.27nHpC ltd. power 5.07State Bank of India Banks 4.95Maruti Suzuki India ltd. Auto 4.56CESC ltd. power 4.25Total of Top Ten Holdings 54.43
Total Equity & Equity related Holdings 91.03
Credit Exposure
Au Financiers (India) ltd. FITCH - A+ 0.69
Total Credit Exposure 0.69
Cash, Cash Equivalents and net Current Assets 8.28
grand Total 100.00
For complete portfolio, please visit www.hdfcfund.com
portfolio - Top 10 Holdings
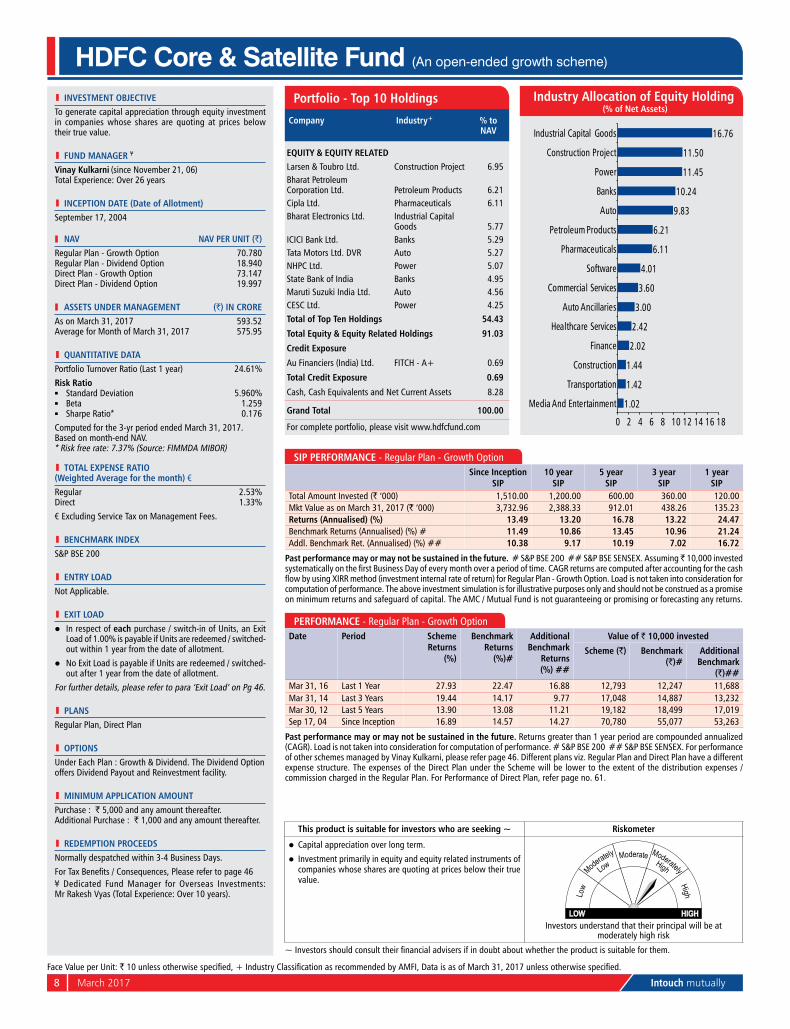
1.02
1.42
1.44
2.02
2.42
3.00
3.60
4.01
6.11
6.21
9.83
10.24
11.45
11.50
16.76
0 2 4 6 8 10 12 14 16 18
Media And Entertainment
Transportation
Construction
Finance
Healthcare Services
Auto Ancillaries
Commercial Services
Software
Pharmaceuticals
Petroleum Products
Auto
Banks
Power
Construction Project
Industrial Capital Goods
Industry allocation of Equity Holding (% of Net assets)
pErFOrMaNCE - Regular plan - Growth optionDate period Scheme
returns (%)
Benchmark returns
(%)#
additional Benchmark
returns (%) ##
value of ` 10,000 invested
Scheme (`) Benchmark (`)#
additional Benchmark
(`)##Mar 31, 16 last 1 year 27.93 22.47 16.88 12,793 12,247 11,688Mar 31, 14 last 3 years 19.44 14.17 9.77 17,048 14,887 13,232Mar 30, 12 last 5 years 13.90 13.08 11.21 19,182 18,499 17,019Sep 17, 04 Since Inception 16.89 14.57 14.27 70,780 55,077 53,263
past performance may or may not be sustained in the future. Returns greater than 1 year period are compounded annualized (CAGR). load is not taken into consideration for computation of performance. # S&p BSE 200 ## S&p BSE SEnSEx. For performance of other schemes managed by Vinay Kulkarni, please refer page 46. Different plans viz. Regular plan and Direct plan have a different expense structure. The expenses of the Direct plan under the Scheme will be lower to the extent of the distribution expenses / commission charged in the Regular plan. For performance of Direct plan, refer page no. 61.
Face Value per unit: ` 10 unless otherwise specified, + Industry Classification as recommended by AMFI, Data is as of March 31, 2017 unless otherwise specified.
Intouch mutually March 2017 9
l INvESTMENT OBjECTIvETo generate capital appreciation in the long term through equity investments by investing in a diversified portfolio of Mid Cap and large Cap ‘blue chip’ companies.
l FuND MaNagEr ¥
vinay Kulkarni (since november 21, 06) Total Experience: over 26 years
l INCEpTION DaTE (Date of allotment)April 6, 2005
Nav Nav pEr uNIT (`)Regular plan - Growth option 49.158Regular plan - Dividend option 13.570Direct plan - Growth option 50.383Direct plan - Dividend option 14.010
aSSETS uNDEr MaNagEMENT (`) IN CrOrEAs on March 31, 2017 302.19Average for Month of March 31, 2017 292.92
l quaNTITaTIvE DaTaportfolio Turnover Ratio (last 1 year) 6.23%risk ration Standard Deviation 5.844%n Beta 1.259n Sharpe Ratio* 0.151Computed for the 3-yr period ended March 31, 2017.Based on month-end nAV.* Risk free rate: 7.37% (Source: FIMMDA MIBoR)
l TOTal ExpENSE raTIO (Weighted average for the month) €Regular 2.64%Direct 2.04%€ Excluding Service Tax on Management Fees.
l BENCHMarK INDExnIFTy 500 Index
l ENTrY lOaDnot Applicable.
l ExIT lOaDl In respect of each purchase / switch-in of units, an Exit
load of 1.00% is payable if units are redeemed / switched-out within 1 year from the date of allotment.
l no Exit load is payable if units are redeemed / switched-out after 1 year from the date of allotment.
For further details, please refer to para ‘Exit load’ on pg 46.
l plaNSRegular plan, Direct plan
l OpTIONSunder Each plan : Growth & Dividend. The Dividend option offers Dividend payout and Reinvestment facility.
l MINIMuM applICaTION aMOuNTpurchase : ` 5,000 and any amount thereafter.Additional purchase : ` 1,000 and any amount thereafter.
l rEDEMpTION prOCEEDSnormally despatched within 3-4 Business Days.
l SEgMENT-WISE BrEaK-up OF EquITY HOlDINg (% OF NET aSSETS)large Cap 35.98%Mid Cap 57.73%
For Tax Benefits / Consequences, Please refer to page 46¥ Dedicated Fund Manager for overseas Investments: Mr Rakesh Vyas (Total Experience: over 10 years).
HDFC Premier Multi-cap Fund (An open-ended growth scheme)
This product is suitable for investors who are seeking ~ riskometer
l Capital appreciation over long term.
l Investment predominantly in equity and equity related instruments of Mid Cap and large Cap ‘blue chip’ companies.
Investors understand that their principal will be at moderately high risk
~ Investors should consult their financial advisers if in doubt about whether the product is suitable for them.
SIp pErFOrMaNCE - Regular plan - Growth optionSince Inception
SIp10 year
SIp5 year
SIp3 year
SIp1 year
SIpTotal Amount Invested (` ‘000) 1,440.00 1,200.00 600.00 360.00 120.00Mkt Value as on March 31, 2017 (` ‘000) 3,100.88 2,261.69 876.72 427.98 136.47returns (annualised) (%) 12.10 12.18 15.17 11.58 26.52Benchmark Returns (Annualised) (%) # 11.20 11.19 14.29 11.81 22.85Addl. Benchmark Ret. (Annualised) (%) ## 10.27 9.73 11.15 8.38 17.97
past performance may or may not be sustained in the future. # nIFTy 500 Index ## nIFTy 50 Index. Assuming ` 10,000 invested systematically on the first Business Day of every month over a period of time. CAGR returns are computed after accounting for the cash flow by using XIRR method (investment internal rate of return) for Regular Plan - Growth Option. Load is not taken into consideration for computation of performance. The above investment simulation is for illustrative purposes only and should not be construed as a promise on minimum returns and safeguard of capital. The AMC / Mutual Fund is not guaranteeing or promising or forecasting any returns.
Company Industry+ % to Nav
EquITY & EquITY rElaTED
State Bank of India Banks 9.51
ICICI Bank ltd. Banks 6.92
Tata Motors ltd. DVR Auto 5.55
Infosys ltd. Software 5.07
Bank of Baroda Banks 5.06
KEC International ltd. Construction project 4.62
punjab national Bank Banks 4.46
Bharat petroleumCorporation ltd. petroleum products 4.32
Tata Steel ltd. Ferrous Metals 4.17
Maruti Suzuki India ltd. Auto 3.98
Total of Top Ten Holdings 53.66
Total Equity & Equity related Holdings 93.72
Cash, Cash Equivalents and net Current Assets 6.28
grand Total 100.00
For complete portfolio, please visit www.hdfcfund.com
portfolio - Top 10 Holdings
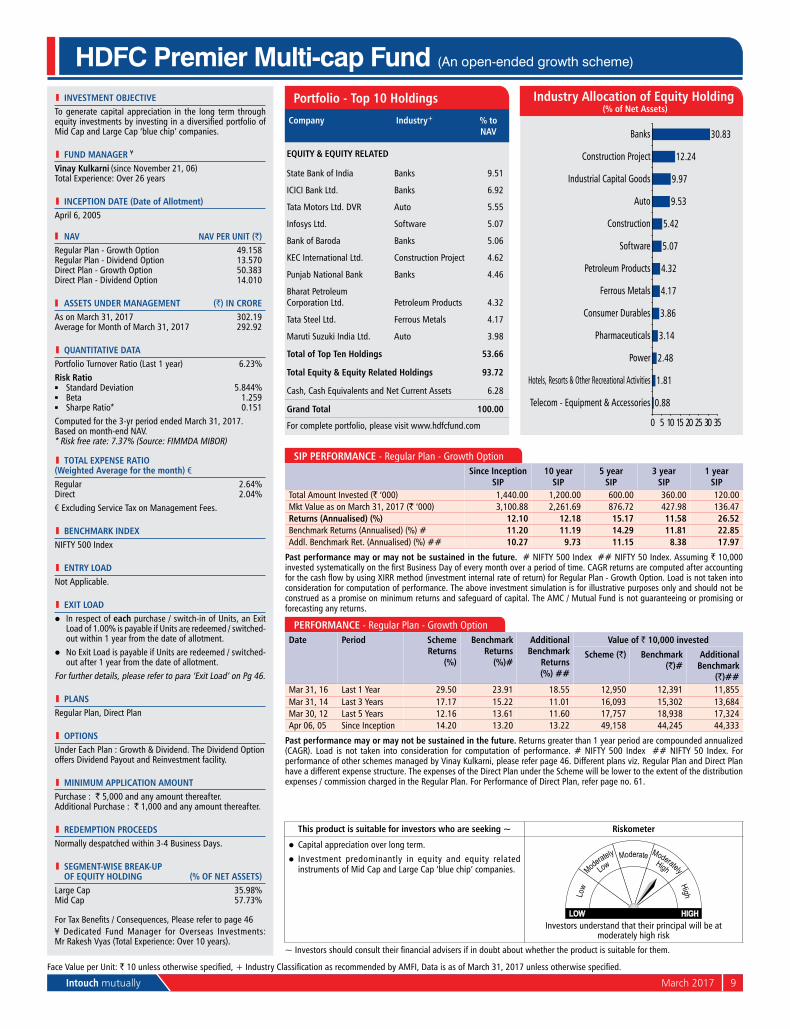
0.88
1.81
2.48
3.14
3.86
4.17
4.32
5.07
5.42
9.53
9.97
12.24
30.83
0 5 10 15 20 25 30 35
Telecom - Equipment & Accessories
Hotels, Resorts & Other Recreational Activities
Power
Pharmaceuticals
Consumer Durables
Ferrous Metals
Petroleum Products
Software
Construction
Auto
Industrial Capital Goods
Construction Project
Banks
Industry allocation of Equity Holding (% of Net assets)
pErFOrMaNCE - Regular plan - Growth optionDate period Scheme
returns (%)
Benchmark returns
(%)#
additional Benchmark
returns (%) ##
value of ` 10,000 invested
Scheme (`) Benchmark (`)#
additional Benchmark
(`)##Mar 31, 16 last 1 year 29.50 23.91 18.55 12,950 12,391 11,855Mar 31, 14 last 3 years 17.17 15.22 11.01 16,093 15,302 13,684Mar 30, 12 last 5 years 12.16 13.61 11.60 17,757 18,938 17,324Apr 06, 05 Since Inception 14.20 13.20 13.22 49,158 44,245 44,333
past performance may or may not be sustained in the future. Returns greater than 1 year period are compounded annualized (CAGR). load is not taken into consideration for computation of performance. # nIFTy 500 Index ## nIFTy 50 Index. For performance of other schemes managed by Vinay Kulkarni, please refer page 46. Different plans viz. Regular plan and Direct plan have a different expense structure. The expenses of the Direct plan under the Scheme will be lower to the extent of the distribution expenses / commission charged in the Regular plan. For performance of Direct plan, refer page no. 61.
Face Value per unit: ` 10 unless otherwise specified, + Industry Classification as recommended by AMFI, Data is as of March 31, 2017 unless otherwise specified.
10 March 2017 Intouch mutually
l INvESTMENT OBjECTIvETo provide long-term capital appreciation by investing predominantly in large cap companies.
l FuND MaNagEr § ¥
vinay Kulkarni (since June 28, 14) Total Experience: over 26 years
l INCEpTION DaTE (Date of allotment)February 18, 1994
Nav Nav pEr uNIT (`)Regular plan - Growth option 97.564Regular plan - Dividend option 20.480Direct plan - Growth option 98.360Direct plan - Dividend option 23.090
aSSETS uNDEr MaNagEMENT (`) IN CrOrEAs on March 31, 2017 1,235.19Average for Month of March 31, 2017 1,240.04
l quaNTITaTIvE DaTaportfolio Turnover Ratio (last 1 year) 14.84%
risk ration Standard Deviation 4.160%n Beta 0.978n Sharpe Ratio* 0.063
Computed for the 3-yr period ended March 31, 2017.Based on month-end nAV.* Risk free rate: 7.37% (Source: FIMMDA MIBoR)
l TOTal ExpENSE raTIO (Weighted average for the month) €Regular 2.20%Direct 2.10%
€ Excluding Service Tax on Management Fees.
l BENCHMarK INDEx
nIFTy 50 Index
l ENTrY lOaDnot Applicable.
l ExIT lOaDl In respect of each purchase / switch-in of units, an Exit
load of 1.00% is payable if units are redeemed / switched-out within 1 year from the date of allotment.
l no Exit load is payable if units are redeemed / switched-out after 1 year from the date of allotment.
For further details, please refer to para ‘Exit load’ on pg 46.
l plaNSRegular plan, Direct plan
l OpTIONSunder Each plan : Growth & Dividend. The Dividend option offers Dividend payout and Reinvestment facility.
l MINIMuM applICaTION aMOuNTpurchase : ` 5,000 and any amount thereafter.Additional purchase : ` 1,000 and any amount thereafter.
l rEDEMpTION prOCEEDSnormally despatched within 3-4 Business Days.
For Tax Benefits / Consequences, Please refer to page 46§ Date of migration from Morgan Stanley Mutual Fund (Close of business hours - June 27, 14¥ Dedicated Fund Manager for overseas Investments: Mr Rakesh Vyas (Total Experience: over 10 years).
HDFC Large Cap Fund (An open-ended equity scheme)
This product is suitable for investors who are seeking ~ riskometer
l Capital appreciation over long term.
l Investment in equity and equity related instruments of large Cap companies.
Investors understand that their principal will be at moderately high risk
~ Investors should consult their financial advisers if in doubt about whether the product is suitable for them.
SIp pErFOrMaNCE - Regular plan - Growth optionSince Inception
SIp5 year
SIp3 year
SIp1 year
SIpTotal Amount Invested (` ‘000) 1,070.00 600.00 360.00 120.00Mkt Value as on March 31, 2017 (` ‘000) $$ 1,701.20 782.86 408.07 131.98returns (annualised) (%) $$ 10.11 10.59 8.32 19.12Benchmark Returns (Annualised) (%) # 10.53 11.15 8.38 17.97Addl. Benchmark Ret. (Annualised) (%) ## 9.95 10.19 7.02 16.72
past performance may or may not be sustained in the future. # nIFTy 50 Index ## S&p BSE SEnSEx. Assuming ̀ 10,000 invested systematically on the first Business Day of every month over a period of time. CAGR returns are computed after accounting for the cash flow by using XIRR method (investment internal rate of return) for Regular Plan - Growth Option. Load is not taken into consideration for computation of performance. The above investment simulation is for illustrative purposes only and should not be construed as a promise on minimum returns and safeguard of capital. The AMC / Mutual Fund is not guaranteeing or promising or forecasting any returns.
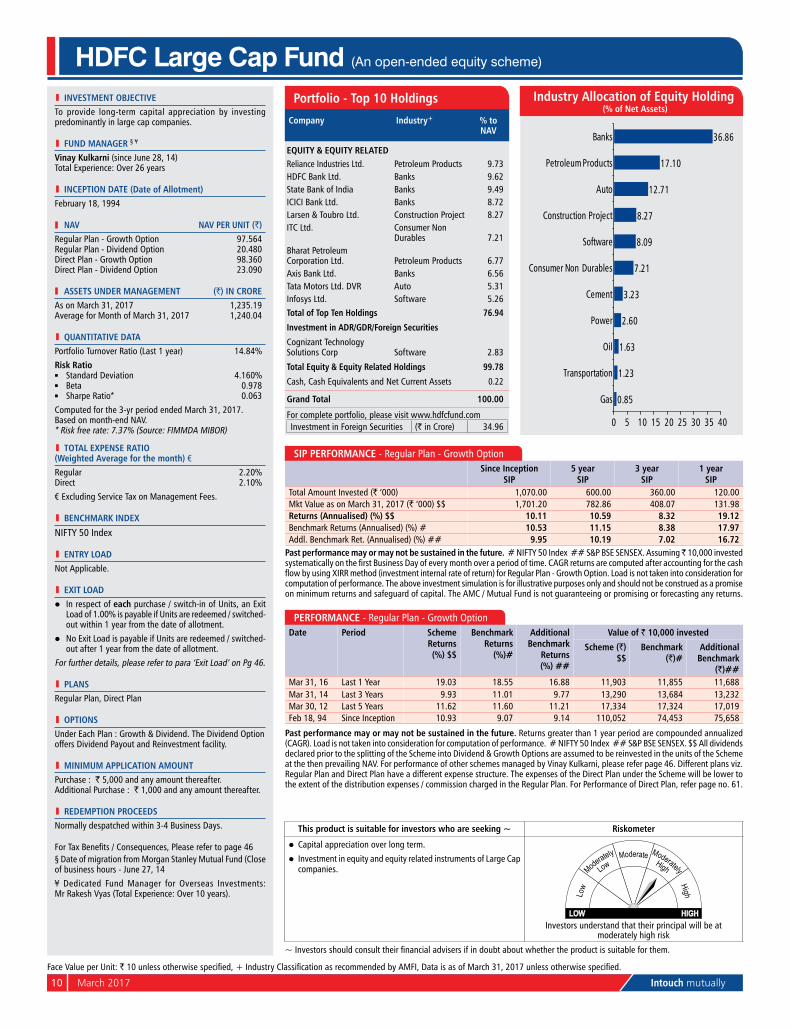
0.85
1.23
1.63
2.60
3.23
7.21
8.09
8.27
12.71
17.10
36.86
0 5 10 15 20 25 30 35 40
Gas
Transportation
Oil
Power
Cement
Consumer Non Durables
Software
Construction Project
Auto
Petroleum Products
Banks
Industry allocation of Equity Holding (% of Net assets)
pErFOrMaNCE - Regular plan - Growth optionDate period Scheme
returns (%) $$
Benchmark returns
(%)#
additional Benchmark
returns (%) ##
value of ` 10,000 invested
Scheme (`) $$
Benchmark (`)#
additional Benchmark
(`)##Mar 31, 16 last 1 year 19.03 18.55 16.88 11,903 11,855 11,688Mar 31, 14 last 3 years 9.93 11.01 9.77 13,290 13,684 13,232Mar 30, 12 last 5 years 11.62 11.60 11.21 17,334 17,324 17,019Feb 18, 94 Since Inception 10.93 9.07 9.14 110,052 74,453 75,658
past performance may or may not be sustained in the future. Returns greater than 1 year period are compounded annualized (CAGR). load is not taken into consideration for computation of performance. # nIFTy 50 Index ## S&p BSE SEnSEx. $$ All dividends declared prior to the splitting of the Scheme into Dividend & Growth options are assumed to be reinvested in the units of the Scheme at the then prevailing nAV. For performance of other schemes managed by Vinay Kulkarni, please refer page 46. Different plans viz. Regular plan and Direct plan have a different expense structure. The expenses of the Direct plan under the Scheme will be lower to the extent of the distribution expenses / commission charged in the Regular plan. For performance of Direct plan, refer page no. 61.
Company Industry+ % to Nav
EquITY & EquITY rElaTEDReliance Industries ltd. petroleum products 9.73HDFC Bank ltd. Banks 9.62State Bank of India Banks 9.49ICICI Bank ltd. Banks 8.72larsen & Toubro ltd. Construction project 8.27ITC ltd. Consumer non
Durables 7.21Bharat petroleum Corporation ltd. petroleum products 6.77Axis Bank ltd. Banks 6.56Tata Motors ltd. DVR Auto 5.31Infosys ltd. Software 5.26Total of Top Ten Holdings 76.94
Investment in aDr/gDr/Foreign Securities
Cognizant Technology Solutions Corp Software 2.83
Total Equity & Equity related Holdings 99.78
Cash, Cash Equivalents and net Current Assets 0.22
grand Total 100.00
For complete portfolio, please visit www.hdfcfund.comInvestment in Foreign Securities (` in Crore) 34.96
portfolio - Top 10 Holdings
Face Value per unit: ` 10 unless otherwise specified, + Industry Classification as recommended by AMFI, Data is as of March 31, 2017 unless otherwise specified.
Intouch mutually March 2017 11
l INvESTMENT OBjECTIvETo generate long-term capital appreciation from a portfolio that is substantially constituted of equity and equity related securities of Small and Mid-Cap companies.
l FuND MaNagEr ¥
Chirag Setalvad (since June 25, 07) Total Experience: over 17 years
l INCEpTION DaTE (Date of allotment)June 25, 2007
Nav Nav pEr uNIT (`)Regular plan - Growth option 49.797Regular plan - Dividend option 30.531Direct plan - Growth option 51.463Direct plan - Dividend option 35.685
aSSETS uNDEr MaNagEMENT (`) IN CrOrEAs on March 31, 2017 15,734.25Average for Month of March 31, 2017 15,057.40
l quaNTITaTIvE DaTaportfolio Turnover Ratio (last 1 year) 25.69%risk ration Standard Deviation 4.730%n Beta 0.907n Sharpe Ratio* 0.365Computed for the 3-yr period ended March 31, 2017.Based on month-end nAV.* Risk free rate: 7.37% (Source: FIMMDA MIBoR)
l TOTal ExpENSE raTIO (Weighted average for the month) €Regular 2.22%Direct 1.24%€ Excluding Service Tax on Management Fees.
l BENCHMarK INDExnIFTy Free Float Midcap 100 Index
l ENTrY lOaDnot Applicable.
l ExIT lOaDl In respect of each purchase / switch-in of units, an Exit
load of 1.00% is payable if units are redeemed / switched-out within 1 year from the date of allotment.
l no Exit load is payable if units are redeemed / switched-out after 1 year from the date of allotment.
For further details, please refer to para ‘Exit load’ on pg 46.
l plaNSRegular plan, Direct plan
l OpTIONSunder Each plan : Growth & Dividend. The Dividend option offers Dividend payout and Reinvestment facility.
l MINIMuM applICaTION aMOuNTpurchase : ` 5,000 and any amount thereafter.Additional purchase : ` 1,000 and any amount thereafter.
l rEDEMpTION prOCEEDSnormally despatched within 3-4 Business Days.
l SEgMENT-WISE BrEaK-up OF EquITY HOlDINg (% OF NET aSSETS)large Cap 0.00%Mid Cap 94.13%
For Tax Benefits / Consequences, Please refer to page 46¥ Dedicated Fund Manager for overseas Investments: Mr Rakesh Vyas (Total Experience: over 10 years).
HDFC Mid-Cap Opportunities Fund (An open-ended equity scheme)
This product is suitable for investors who are seeking ~ riskometer
l Capital appreciation over long term.
l Investment predominantly in equity and equity related instruments of Small and Mid Cap companies.
Investors understand that their principal will be at moderately high risk
~ Investors should consult their financial advisers if in doubt about whether the product is suitable for them.
SIp pErFOrMaNCE - Regular plan - Growth optionSince Inception
SIp5 year
SIp3 year
SIp1 year
SIpTotal Amount Invested (` ‘000) 1,180.00 600.00 360.00 120.00Mkt Value as on March 31, 2017 (` ‘000) 3,851.32 1,178.59 499.07 140.81returns (annualised) (%) 22.81 27.40 22.43 33.82Benchmark Returns (Annualised) (%) # 15.56 21.81 20.37 34.12Addl. Benchmark Ret. (Annualised) (%) ## 9.76 11.15 8.38 17.97
past performance may or may not be sustained in the future. # nIFTy Free Float Midcap 100 Index ## nIFTy 50 Index. Assuming ` 10,000 invested systematically on the first Business Day of every month over a period of time. CAGR returns are computed after accounting for the cash flow by using XIRR method (investment internal rate of return) for Regular Plan - Growth option. load is not taken into consideration for computation of performance. The above investment simulation is for illustrative purposes only and should not be construed as a promise on minimum returns and safeguard of capital. The AMC / Mutual Fund is not guaranteeing or promising or forecasting any returns.
Company Industry+ % to Nav
EquITY & EquITY rElaTED
Tube Investments of India ltd. Auto Ancillaries 2.90
Voltas ltd. Construction project 2.53
yes Bank ltd. Banks 2.39
Indusind Bank ltd. Banks 2.36
Sundram Fasteners ltd. Auto Ancillaries 2.31
Aurobindo pharma ltd. pharmaceuticals 2.28
Torrent pharmaceuticals ltd. pharmaceuticals 2.23
upl ltd. pesticides 2.16
Balkrishna Industries ltd. Auto Ancillaries 2.13
Adani ports and Special Economic Zone ltd. Transportation 2.12
Total of Top Ten Holdings 23.41
Total Equity & Equity related Holdings 94.11
Cash, Cash Equivalents and net Current Assets 5.89
grand Total 100.00
For complete portfolio, please visit www.hdfcfund.com
portfolio - Top 10 Holdings
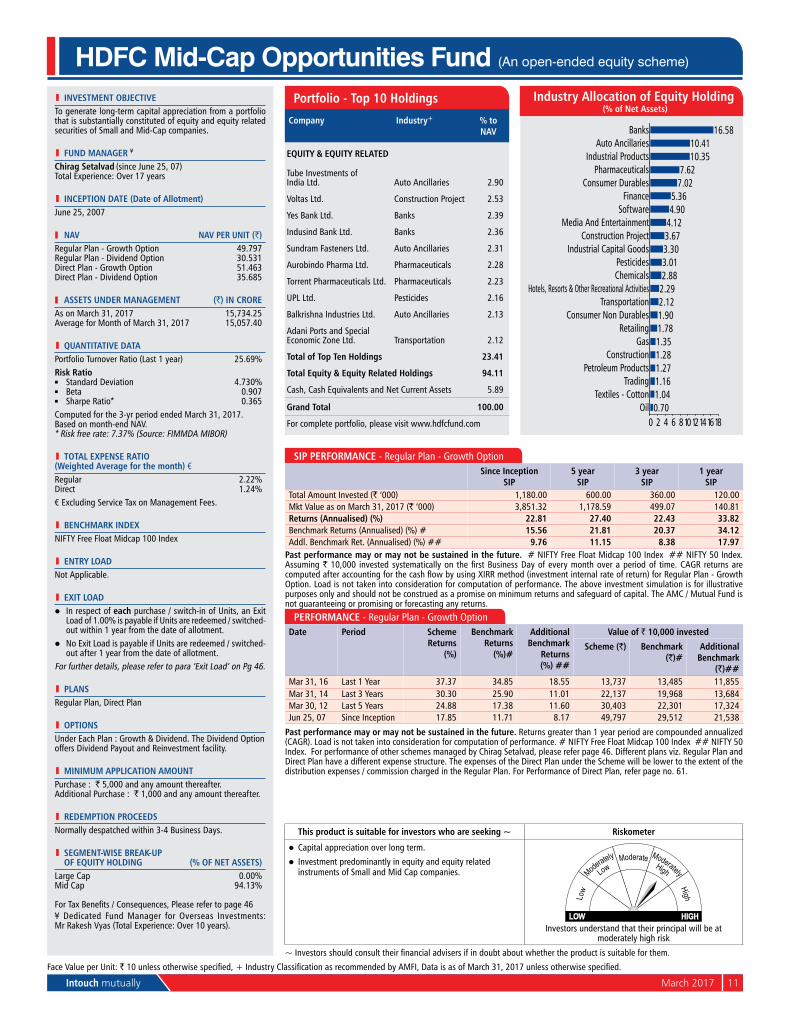
0.701.041.161.271.281.351.781.902.122.292.883.013.303.674.124.905.36
7.027.62
10.3510.41
16.58
0 2 4 6 81012141618Oil
Textiles - CottonTrading
Petroleum ProductsConstruction
GasRetailing
Consumer Non DurablesTransportation
Hotels, Resorts & Other Recreational ActivitiesChemicalsPesticides
Industrial Capital GoodsConstruction Project
Media And EntertainmentSoftware
FinanceConsumer Durables
PharmaceuticalsIndustrial Products
Auto AncillariesBanks
Industry allocation of Equity Holding (% of Net assets)
pErFOrMaNCE - Regular plan - Growth optionDate period Scheme
returns (%)
Benchmark returns
(%)#
additional Benchmark
returns (%) ##
value of ` 10,000 invested
Scheme (`) Benchmark (`)#
additional Benchmark
(`)##Mar 31, 16 last 1 year 37.37 34.85 18.55 13,737 13,485 11,855Mar 31, 14 last 3 years 30.30 25.90 11.01 22,137 19,968 13,684Mar 30, 12 last 5 years 24.88 17.38 11.60 30,403 22,301 17,324Jun 25, 07 Since Inception 17.85 11.71 8.17 49,797 29,512 21,538
past performance may or may not be sustained in the future. Returns greater than 1 year period are compounded annualized (CAGR). load is not taken into consideration for computation of performance. # nIFTy Free Float Midcap 100 Index ## nIFTy 50 Index. For performance of other schemes managed by Chirag Setalvad, please refer page 46. Different plans viz. Regular plan and Direct plan have a different expense structure. The expenses of the Direct plan under the Scheme will be lower to the extent of the distribution expenses / commission charged in the Regular plan. For performance of Direct plan, refer page no. 61.
Face Value per unit: ` 10 unless otherwise specified, + Industry Classification as recommended by AMFI, Data is as of March 31, 2017 unless otherwise specified.
12 March 2017 Intouch mutually
l INvESTMENT OBjECTIvETo provide long-term capital appreciation by investing predominantly in Small-Cap and Mid-Cap companies.
l FuND MaNagEr ¥
Chirag Setalvad (since June 27, 14) Total Experience: over 17 years
l INCEpTION DaTE (Date of allotment)April 3, 2008
Nav Nav pEr uNIT (`)Regular plan - Growth option 33.621Regular plan - Dividend option 21.959Direct plan - Growth option 35.014Direct plan - Dividend option 23.187
aSSETS uNDEr MaNagEMENT (`) IN CrOrEAs on March 31, 2017 991.78Average for Month of March 31, 2017 951.14
l quaNTITaTIvE DaTaportfolio Turnover Ratio (last 1 year) 26.69%risk ration Standard Deviation 4.565%n Beta 0.526n Sharpe Ratio* 0.268Computed for the 3-yr period ended March 31, 2017.Based on month-end nAV.* Risk free rate: 7.37% (Source: FIMMDA MIBoR)
l TOTal ExpENSE raTIO (Weighted average for the month) €Regular 2.52%Direct 1.42%€ Excluding Service Tax on Management Fees.
l BENCHMarK INDExnIFTy Free Float Smallcap 100 Index
l ENTrY lOaDnot Applicable.
l ExIT lOaDl In respect of each purchase / switch-in of units, an Exit
load of 1.00% is payable if units are redeemed / switched-out within 1 year from the date of allotment.
l no Exit load is payable if units are redeemed / switched-out after 1 year from the date of allotment.
For further details, please refer to para ‘Exit load’ on pg 46.
l plaNSRegular plan, Direct plan
l OpTIONSunder Each plan : Growth & Dividend. The Dividend option offers Dividend payout and Reinvestment facility.
l MINIMuM applICaTION aMOuNTpurchase : ` 5,000 and any amount thereafter.Additional purchase : ` 1,000 and any amount thereafter.
l rEDEMpTION prOCEEDSnormally despatched within 3-4 Business Days.
l SEgMENT-WISE BrEaK-up OF EquITY HOlDINg (% OF NET aSSETS)Mid Cap 6.69%Small Cap 89.93%
For Tax Benefits / Consequences, Please refer to page 46¥ Dedicated Fund Manager for overseas Investments:
Mr Rakesh Vyas (Total Experience: over 10 years).
HDFC Small Cap Fund (An open-ended equity scheme)
This product is suitable for investors who are seeking ~ riskometer
l Capital appreciation over long term.
l Investment predominantly in equity and equity related instruments of Small-Cap and Mid-Cap companies.
Investors understand that their principal will be at moderately high risk
~ Investors should consult their financial advisers if in doubt about whether the product is suitable for them.
SIp pErFOrMaNCE - Regular plan - Growth optionSince Inception
SIp5 year
SIp3 year
SIp1 year
SIpTotal Amount Invested (` ‘000) 1,080.00 600.00 360.00 120.00Mkt Value as on March 31, 2017 (` ‘000) 2,507.01 1,017.98 476.50 138.84returns (annualised) (%) 18.00 21.30 19.10 30.50Benchmark Returns (Annualised) (%) # 14.50 20.12 17.99 36.69Addl. Benchmark Ret. (Annualised) (%) ## 10.46 11.15 8.38 17.97
past performance may or may not be sustained in the future. # nIFTy Free Float Smallcap 100 Index ## nIFTy 50 Index. Assuming ` 10,000 invested systematically on the first Business Day of every month over a period of time. CAGR returns are computed after accounting for the cash flow by using XIRR method (investment internal rate of return) for Regular Plan - Growth option. load is not taken into consideration for computation of performance. The above investment simulation is for illustrative purposes only and should not be construed as a promise on minimum returns and safeguard of capital. The AMC / Mutual Fund is not guaranteeing or promising or forecasting any returns.
Company Industry+ % to Nav
EquITY & EquITY rElaTED
Carborundum universal ltd. Industrial products 4.04
Aarti Industries ltd. Chemicals 3.67
Tube Investments of India ltd. Auto Ancillaries 3.55
yes Bank ltd. Banks 3.43
oriental Carbon & Chemicals ltd. Chemicals 3.33
KEC International ltd. Construction project 3.28
Aurobindo pharma ltd. pharmaceuticals 3.25
Balkrishna Industries ltd. Auto Ancillaries 3.24
Apar Industries limited Industrial Capital Goods 3.22
City union Bank ltd. Banks 3.09
Total of Top Ten Holdings 34.10
Total Equity & Equity related Holdings 98.29
Cash, Cash Equivalents and net Current Assets 1.71
grand Total 100.00
For complete portfolio, please visit www.hdfcfund.com
portfolio - Top 10 Holdings
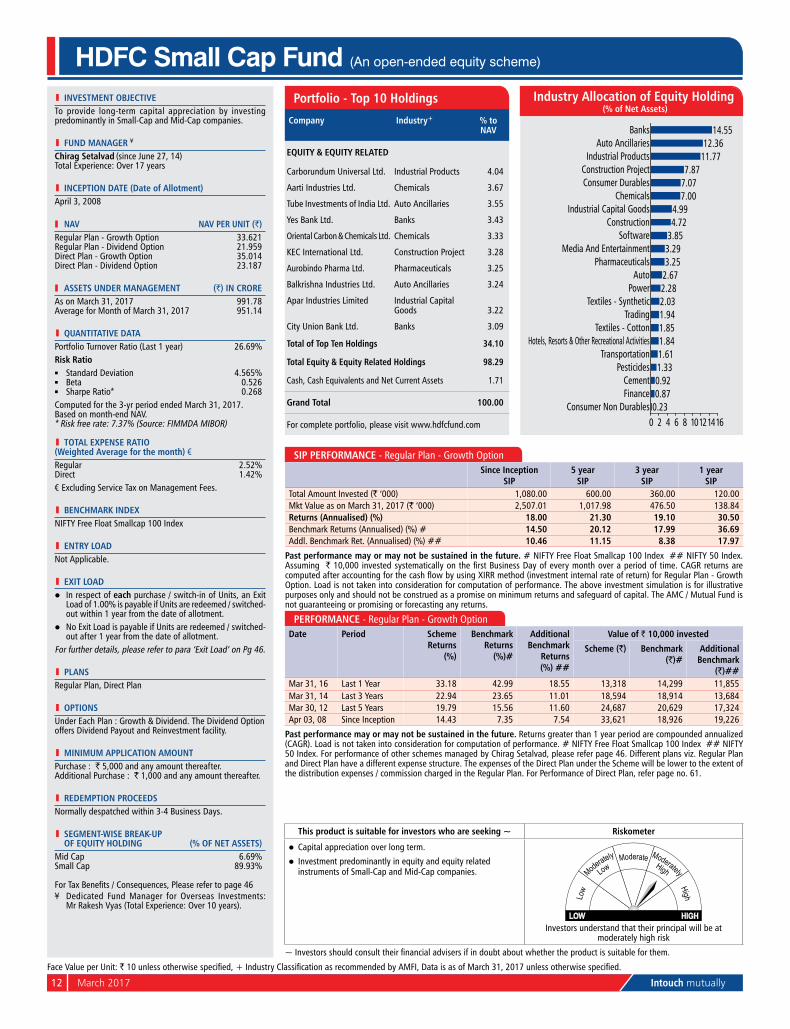
0.230.870.921.331.611.841.851.942.032.282.673.253.293.854.724.99
7.007.077.87
11.7712.36
14.55
0 2 4 6 8 10121416Consumer Non Durables
FinanceCement
PesticidesTransportation
Hotels, Resorts & Other Recreational ActivitiesTextiles - Cotton
TradingTextiles - Synthetic
PowerAuto
PharmaceuticalsMedia And Entertainment
SoftwareConstruction
Industrial Capital GoodsChemicals
Consumer DurablesConstruction Project
Industrial ProductsAuto Ancillaries
Banks
Industry allocation of Equity Holding (% of Net assets)
pErFOrMaNCE - Regular plan - Growth optionDate period Scheme
returns (%)
Benchmark returns
(%)#
additional Benchmark
returns (%) ##
value of ` 10,000 invested
Scheme (`) Benchmark (`)#
additional Benchmark
(`)##Mar 31, 16 last 1 year 33.18 42.99 18.55 13,318 14,299 11,855Mar 31, 14 last 3 years 22.94 23.65 11.01 18,594 18,914 13,684Mar 30, 12 last 5 years 19.79 15.56 11.60 24,687 20,629 17,324Apr 03, 08 Since Inception 14.43 7.35 7.54 33,621 18,926 19,226
past performance may or may not be sustained in the future. Returns greater than 1 year period are compounded annualized (CAGR). load is not taken into consideration for computation of performance. # nIFTy Free Float Smallcap 100 Index ## nIFTy 50 Index. For performance of other schemes managed by Chirag Setalvad, please refer page 46. Different plans viz. Regular plan and Direct plan have a different expense structure. The expenses of the Direct plan under the Scheme will be lower to the extent of the distribution expenses / commission charged in the Regular plan. For performance of Direct plan, refer page no. 61.
Face Value per unit: ` 10 unless otherwise specified, + Industry Classification as recommended by AMFI, Data is as of March 31, 2017 unless otherwise specified.
Intouch mutually March 2017 13
l INvESTMENT OBjECTIvETo generate long term capital appreciation from a portfolio that is invested predominantly in equity and equity related instruments.
l FuND MaNagEr ¥
Chirag Setalvad (since April 2, 07) Total Experience: over 17 years
l INCEpTION DaTE (Date of allotment)January 2, 2001
Nav Nav pEr uNIT (`)Regular plan - Growth option 295.459Regular plan - Dividend option 39.712Direct plan - Growth option 302.604Direct plan - Dividend option 41.674
aSSETS uNDEr MaNagEMENT (`) IN CrOrEAs on March 31, 2017 1,380.47Average for Month of March 31, 2017 1,326.79
l quaNTITaTIvE DaTaportfolio Turnover Ratio (last 1 year) 8.12%
risk ration Standard Deviation 4.183%n Beta 0.976n Sharpe Ratio* 0.213
Computed for the 3-yr period ended March 31, 2017.Based on month-end nAV.* Risk free rate: 7.37% (Source: FIMMDA MIBoR)
l TOTal ExpENSE raTIO (Weighted average for the month) €Regular 2.26%Direct 1.61%
€ Excluding Service Tax on Management Fees.
l BENCHMarK INDExS&p BSE SEnSEx
l ENTrY lOaDnot Applicable.
l ExIT lOaDnil
l plaNSRegular plan, Direct plan
l OpTIONSunder Each plan : Growth & Dividend. The Dividend option offers Dividend payout facility.
l MINIMuM applICaTION aMOuNTpurchase : ` 500 and in multiples of ` 500 thereafter.Additional purchase : ̀ 500 and in multiples of ̀ 500 thereafter.
l rEDEMpTION prOCEEDSnormally despatched within 3-4 Business Days.
l lOCK-IN pErIOD3 years from the date of allotment of the respective units
For Tax Benefits / Consequences, Please refer to page 46¥ Dedicated Fund Manager for overseas Investments: Mr Rakesh Vyas (Total Experience: over 10 years).
HDFC Long Term Advantage Fund (An open-ended equity linked saving scheme with a lock-in period of 3 years)
This product is suitable for investors who are seeking ~ riskometer
l Capital appreciation over long term.
l Investment predominantly in equity and equity related instruments.
Investors understand that their principal will be at moderately high risk
~ Investors should consult their financial advisers if in doubt about whether the product is suitable for them.
SIp pErFOrMaNCE - Regular plan - Growth optionSince Inception
SIp15 year
SIp10 year
SIp5 year
SIp3 year
SIp1 year
SIpTotal Amount Invested (` ‘000) 1,950.00 1,800.00 1,200.00 600.00 360.00 120.00Mkt Value as on March 31, 2017 (` ‘000) 13,673.84 9,069.18 2,677.28 949.88 454.83 137.86returns (annualised) (%) 21.19 19.40 15.33 18.45 15.81 28.85Benchmark Returns (Annualised) (%) # 13.55 13.15 9.17 10.19 7.02 16.72Addl. Benchmark Ret. (Annualised) (%) ## 13.48 13.16 9.73 11.15 8.38 17.97
past performance may or may not be sustained in the future. # S&p BSE SEnSEx ## nIFTy 50 Index. Assuming ̀ 10,000 invested systematically on the first Business Day of every month over a period of time. CAGR returns are computed after accounting for the cash flow by using XIRR method (investment internal rate of return) for Regular Plan - Growth Option. Load is not taken into consideration for computation of performance. The above investment simulation is for illustrative purposes only and should not be construed as a promise on minimum returns and safeguard of capital. The AMC / Mutual Fund is not guaranteeing or promising or forecasting any returns.
Company Industry+ % to Nav
EquITY & EquITY rElaTED
Reliance Industries ltd. petroleum products 6.32
ICICI Bank ltd. Banks 6.02
HDFC Bank ltd. Banks 5.75
Infosys ltd. Software 5.63
State Bank of India Banks 5.53
larsen & Toubro ltd. Construction project 4.62
Housing Development Finance Corporation ltd.£ Finance 4.35
Bharat petroleum Corporation ltd. petroleum products 3.87
Vesuvius India ltd. Industrial products 3.77
Tata Motors ltd. DVR Auto 3.77
Total of Top Ten Holdings 49.63
Total Equity & Equity related Holdings 96.21
Cash, Cash Equivalents and net Current Assets 3.79
grand Total 100.00
For complete portfolio, please visit www.hdfcfund.com
portfolio - Top 10 Holdings
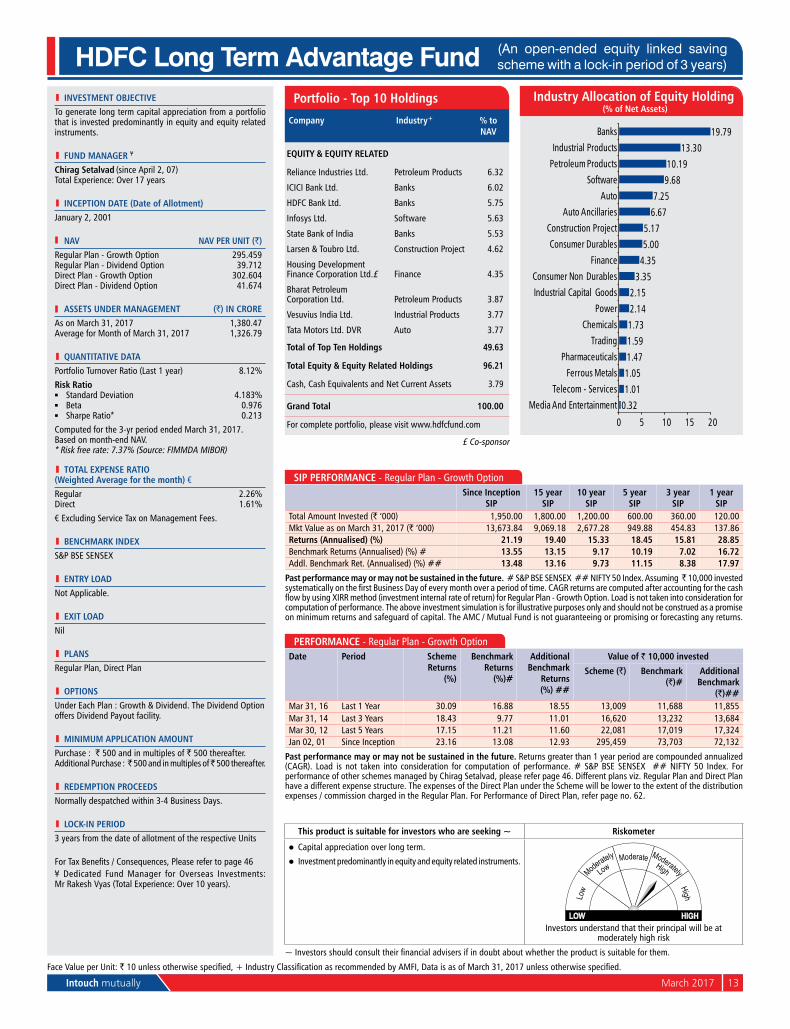
0.321.011.051.471.591.732.142.15
3.354.355.005.17
6.677.25
9.6810.19
13.3019.79
0 5 10 15 20
Media And EntertainmentTelecom - Services
Ferrous MetalsPharmaceuticals
TradingChemicals
PowerIndustrial Capital GoodsConsumer Non Durables
FinanceConsumer Durables
Construction ProjectAuto Ancillaries
AutoSoftware
Petroleum ProductsIndustrial Products
Banks
Industry allocation of Equity Holding (% of Net assets)
pErFOrMaNCE - Regular plan - Growth optionDate period Scheme
returns (%)
Benchmark returns
(%)#
additional Benchmark
returns (%) ##
value of ` 10,000 invested
Scheme (`) Benchmark (`)#
additional Benchmark
(`)##Mar 31, 16 last 1 year 30.09 16.88 18.55 13,009 11,688 11,855Mar 31, 14 last 3 years 18.43 9.77 11.01 16,620 13,232 13,684Mar 30, 12 last 5 years 17.15 11.21 11.60 22,081 17,019 17,324Jan 02, 01 Since Inception 23.16 13.08 12.93 295,459 73,703 72,132
past performance may or may not be sustained in the future. Returns greater than 1 year period are compounded annualized (CAGR). load is not taken into consideration for computation of performance. # S&p BSE SEnSEx ## nIFTy 50 Index. For performance of other schemes managed by Chirag Setalvad, please refer page 46. Different plans viz. Regular plan and Direct plan have a different expense structure. The expenses of the Direct plan under the Scheme will be lower to the extent of the distribution expenses / commission charged in the Regular plan. For performance of Direct plan, refer page no. 62.
Face Value per unit: ` 10 unless otherwise specified, + Industry Classification as recommended by AMFI, Data is as of March 31, 2017 unless otherwise specified.
£ Co-sponsor
14 March 2017 Intouch mutually
l INvESTMENT OBjECTIvETo achieve long term growth of capital.
l FuND MaNagEr ¥
vinay Kulkarni (since november 21, 06) Total Experience: over 26 years
l INCEpTION DaTE (Date of allotment)March 31, 1996
Nav Nav pEr uNIT (`)Regular plan - Growth option 469.004Regular plan - Dividend option 60.683Direct plan - Growth option 480.795Direct plan - Dividend option 62.716
aSSETS uNDEr MaNagEMENT (`) IN CrOrEAs on March 31, 2017 6,092.90Average for Month of March 31, 2017 5,875.62
l quaNTITaTIvE DaTaportfolio Turnover Ratio (last 1 year) 34.87%
risk ration Standard Deviation 5.276%n Beta 1.151n Sharpe Ratio* 0.188
Computed for the 3-yr period ended March 31, 2017.Based on month-end nAV.* Risk free rate: 7.37% (Source: FIMMDA MIBoR)
l TOTal ExpENSE raTIO (Weighted average for the month) €Regular 2.12%Direct 1.43%
€ Excluding Service Tax on Management Fees.
l BENCHMarK INDExnIFTy 500 Index
l ENTrY lOaDnot Applicable.
l ExIT lOaDnil
l plaNSRegular plan, Direct plan
l OpTIONSunder Each plan : Growth & Dividend. The Dividend option offers Dividend payout facility.
l MINIMuM applICaTION aMOuNTpurchase : ` 500 and in multiples of ` 500 thereafter.Additional purchase : ̀ 500 and in multiples of ̀ 500 thereafter.
l rEDEMpTION prOCEEDSnormally despatched within 3-4 Business Days (Redemption is subject to completion of lock-in period, if applicable).
l lOCK-IN pErIOD3 years from the date of allotment of the respective units
For Tax Benefits / Consequences, Please refer to page 46¥ Dedicated Fund Manager for overseas Investments: Mr Rakesh Vyas (Total Experience: over 10 years).
HDFC TaxSaver (An open-ended equity linked saving scheme with a lock-in period of 3 years)
This product is suitable for investors who are seeking ~ riskometer
l Growth of capital over long term.
l Investment predominantly in equity and equity related instruments.
Investors understand that their principal will be at moderately high risk
~ Investors should consult their financial advisers if in doubt about whether the product is suitable for them.
Company Industry+ % to Nav
EquITY & EquITY rElaTED
State Bank of India Banks 8.35
larsen & Toubro ltd. Construction project 5.43
ICICI Bank ltd. Banks 5.26
HDFC Bank ltd. Banks 4.87
Reliance Industries ltd. petroleum products 3.91
Tata Motors ltd. DVR Auto 3.78
Bharat Electronics ltd. Industrial Capital Goods 3.58
Cipla ltd. pharmaceuticals 3.57
Bharat petroleum Corporation ltd. petroleum products 3.52
Infosys ltd. Software 2.98
Total of Top Ten Holdings 45.25
Total Equity & Equity related Holdings 95.12
Cash, Cash Equivalents and net Current Assets 4.88
grand Total 100.00
For complete portfolio, please visit www.hdfcfund.com
portfolio - Top 10 Holdings
0.110.330.580.590.620.671.171.381.521.722.052.682.712.852.944.694.995.515.646.417.54
10.0628.36
0 5 10 15 20 25 30DiversifiedPesticides
OilMedia And Entertainment
Hotels, Resorts & Other Recreational ActivitiesTelecom - Services
ChemicalsTransportation
GasIndustrial Products
CementAuto Ancillaries
Consumer DurablesFerrous Metals
Consumer Non DurablesPower
PharmaceuticalsSoftware
Industrial Capital GoodsAuto
Petroleum ProductsConstruction Project
Banks
Industry allocation of Equity Holding (% of Net assets)
SIp pErFOrMaNCE - Regular plan - Growth optionSince Inception
SIp15 year
SIp10 year
SIp5 year
SIp3 year
SIp1 year
SIpTotal Amount Invested (` ‘000) 2,520.00 1,800.00 1,200.00 600.00 360.00 120.00Mkt Value as on March 31, 2017 (` ‘000) $$ 59,287.34 9,864.13 2,620.62 938.24 446.25 140.20returns (annualised) (%) $$ 25.11 20.36 14.93 17.94 14.47 32.79Benchmark Returns (Annualised) (%) # 13.96 14.25 11.19 14.29 11.81 22.85Addl. Benchmark Ret. (Annualised) (%) ## 12.58 13.16 9.73 11.15 8.38 17.97
past performance may or may not be sustained in the future. # nIFTy 500 Index ## nIFTy 50 Index. Assuming ` 10,000 invested systematically on the first Business Day of every month over a period of time. CAGR returns are computed after accounting for the cash flow by using XIRR method (investment internal rate of return) for Regular Plan - Growth Option. Load is not taken into consideration for computation of performance. The above investment simulation is for illustrative purposes only and should not be construed as a promise on minimum returns and safeguard of capital. The AMC / Mutual Fund is not guaranteeing or promising or forecasting any returns.
pErFOrMaNCE - Regular plan - Growth optionDate period Scheme
returns (%) $$
Benchmark returns
(%)#
additional Benchmark
returns (%) ##
value of ` 10,000 invested
Scheme (`) $$
Benchmark (`)#
additional Benchmark
(`)##Mar 31, 16 last 1 year 32.48 23.91 18.55 13,248 12,391 11,855Mar 31, 14 last 3 years 19.20 15.22 11.01 16,944 15,302 13,684Mar 30, 12 last 5 years 16.01 13.61 11.60 21,032 18,938 17,324Mar 31, 96 Since Inception 25.50 12.29 n.A. 1,183,101 114,194 n.A.
past performance may or may not be sustained in the future. Returns greater than 1 year period are compounded annualized (CAGR). load is not taken into consideration for computation of performance. # nIFTy 500 Index ## nIFTy 50 Index. $$ All dividends declared prior to the splitting of the Scheme into Dividend & Growth options are assumed to be reinvested in the units of the Scheme at the then prevailing nAV (ex-dividend nAV). n.A.: not Available. For performance of other schemes managed by Vinay Kulkarni, please refer page 46. Different plans viz. Regular plan and Direct plan have a different expense structure. The expenses of the Direct plan under the Scheme will be lower to the extent of the distribution expenses / commission charged in the Regular plan. For performance of Direct plan, refer page no. 61.
Face Value per unit: ` 10 unless otherwise specified, + Industry Classification as recommended by AMFI, Data is as of March 31, 2017 unless otherwise specified.
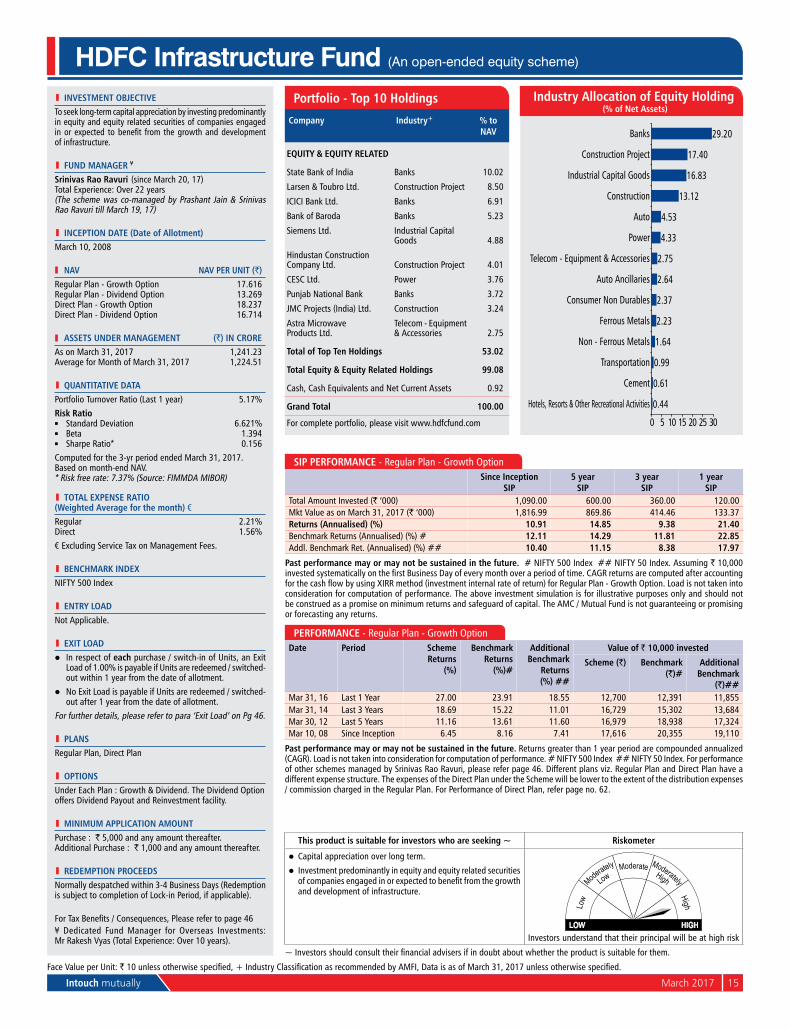
Intouch mutually March 2017 15
l INvESTMENT OBjECTIvETo seek long-term capital appreciation by investing predominantly in equity and equity related securities of companies engaged in or expected to benefit from the growth and development of infrastructure.
l FuND MaNagEr ¥
Srinivas rao ravuri (since March 20, 17) Total Experience: over 22 years(The scheme was co-managed by prashant Jain & Srinivas Rao Ravuri till March 19, 17)
l INCEpTION DaTE (Date of allotment)March 10, 2008
Nav Nav pEr uNIT (`)Regular plan - Growth option 17.616Regular plan - Dividend option 13.269Direct plan - Growth option 18.237Direct plan - Dividend option 16.714
aSSETS uNDEr MaNagEMENT (`) IN CrOrEAs on March 31, 2017 1,241.23Average for Month of March 31, 2017 1,224.51
l quaNTITaTIvE DaTaportfolio Turnover Ratio (last 1 year) 5.17%risk ration Standard Deviation 6.621%n Beta 1.394n Sharpe Ratio* 0.156Computed for the 3-yr period ended March 31, 2017.Based on month-end nAV.* Risk free rate: 7.37% (Source: FIMMDA MIBoR)
l TOTal ExpENSE raTIO (Weighted average for the month) €Regular 2.21%Direct 1.56%€ Excluding Service Tax on Management Fees.
l BENCHMarK INDExnIFTy 500 Index
l ENTrY lOaDnot Applicable.
l ExIT lOaDl In respect of each purchase / switch-in of units, an Exit
load of 1.00% is payable if units are redeemed / switched-out within 1 year from the date of allotment.
l no Exit load is payable if units are redeemed / switched-out after 1 year from the date of allotment.
For further details, please refer to para ‘Exit load’ on pg 46.
l plaNSRegular plan, Direct plan
l OpTIONSunder Each plan : Growth & Dividend. The Dividend option offers Dividend payout and Reinvestment facility.
l MINIMuM applICaTION aMOuNTpurchase : ` 5,000 and any amount thereafter.Additional purchase : ` 1,000 and any amount thereafter.
l rEDEMpTION prOCEEDSnormally despatched within 3-4 Business Days (Redemption is subject to completion of lock-in period, if applicable).
For Tax Benefits / Consequences, Please refer to page 46¥ Dedicated Fund Manager for overseas Investments: Mr Rakesh Vyas (Total Experience: over 10 years).
HDFC Infrastructure Fund (An open-ended equity scheme)
This product is suitable for investors who are seeking ~ riskometer
l Capital appreciation over long term.
l Investment predominantly in equity and equity related securities of companies engaged in or expected to benefit from the growth and development of infrastructure.
Investors understand that their principal will be at high risk
~ Investors should consult their financial advisers if in doubt about whether the product is suitable for them.
SIp pErFOrMaNCE - Regular plan - Growth optionSince Inception
SIp5 year
SIp3 year
SIp1 year
SIpTotal Amount Invested (` ‘000) 1,090.00 600.00 360.00 120.00Mkt Value as on March 31, 2017 (` ‘000) 1,816.99 869.86 414.46 133.37returns (annualised) (%) 10.91 14.85 9.38 21.40Benchmark Returns (Annualised) (%) # 12.11 14.29 11.81 22.85Addl. Benchmark Ret. (Annualised) (%) ## 10.40 11.15 8.38 17.97
past performance may or may not be sustained in the future. # nIFTy 500 Index ## nIFTy 50 Index. Assuming ` 10,000 invested systematically on the first Business Day of every month over a period of time. CAGR returns are computed after accounting for the cash flow by using XIRR method (investment internal rate of return) for Regular Plan - Growth Option. Load is not taken into consideration for computation of performance. The above investment simulation is for illustrative purposes only and should not be construed as a promise on minimum returns and safeguard of capital. The AMC / Mutual Fund is not guaranteeing or promising or forecasting any returns.
Company Industry+ % to Nav
EquITY & EquITY rElaTED
State Bank of India Banks 10.02
larsen & Toubro ltd. Construction project 8.50
ICICI Bank ltd. Banks 6.91
Bank of Baroda Banks 5.23
Siemens ltd. Industrial Capital Goods 4.88
Hindustan Construction Company ltd. Construction project 4.01
CESC ltd. power 3.76
punjab national Bank Banks 3.72
JMC projects (India) ltd. Construction 3.24
Astra Microwaveproducts ltd.
Telecom - Equipment & Accessories 2.75
Total of Top Ten Holdings 53.02
Total Equity & Equity related Holdings 99.08
Cash, Cash Equivalents and net Current Assets 0.92
grand Total 100.00
For complete portfolio, please visit www.hdfcfund.com
portfolio - Top 10 Holdings
0.44
0.61
0.99
1.64
2.23
2.37
2.64
2.75
4.33
4.53
13.12
16.83
17.40
29.20
0 5 10 15 20 25 30
Hotels, Resorts & Other Recreational Activities
Cement
Transportation
Non - Ferrous Metals
Ferrous Metals
Consumer Non Durables
Auto Ancillaries
Telecom - Equipment & Accessories
Power
Auto
Construction
Industrial Capital Goods
Construction Project
Banks
Industry allocation of Equity Holding (% of Net assets)
pErFOrMaNCE - Regular plan - Growth optionDate period Scheme
returns (%)
Benchmark returns
(%)#
additional Benchmark
returns (%) ##
value of ` 10,000 invested
Scheme (`) Benchmark (`)#
additional Benchmark
(`)##Mar 31, 16 last 1 year 27.00 23.91 18.55 12,700 12,391 11,855Mar 31, 14 last 3 years 18.69 15.22 11.01 16,729 15,302 13,684Mar 30, 12 last 5 years 11.16 13.61 11.60 16,979 18,938 17,324Mar 10, 08 Since Inception 6.45 8.16 7.41 17,616 20,355 19,110
past performance may or may not be sustained in the future. Returns greater than 1 year period are compounded annualized (CAGR). load is not taken into consideration for computation of performance. # nIFTy 500 Index ## nIFTy 50 Index. For performance of other schemes managed by Srinivas Rao Ravuri, please refer page 46. Different plans viz. Regular plan and Direct plan have a different expense structure. The expenses of the Direct plan under the Scheme will be lower to the extent of the distribution expenses / commission charged in the Regular plan. For performance of Direct plan, refer page no. 62.
Face Value per unit: ` 10 unless otherwise specified, + Industry Classification as recommended by AMFI, Data is as of March 31, 2017 unless otherwise specified.
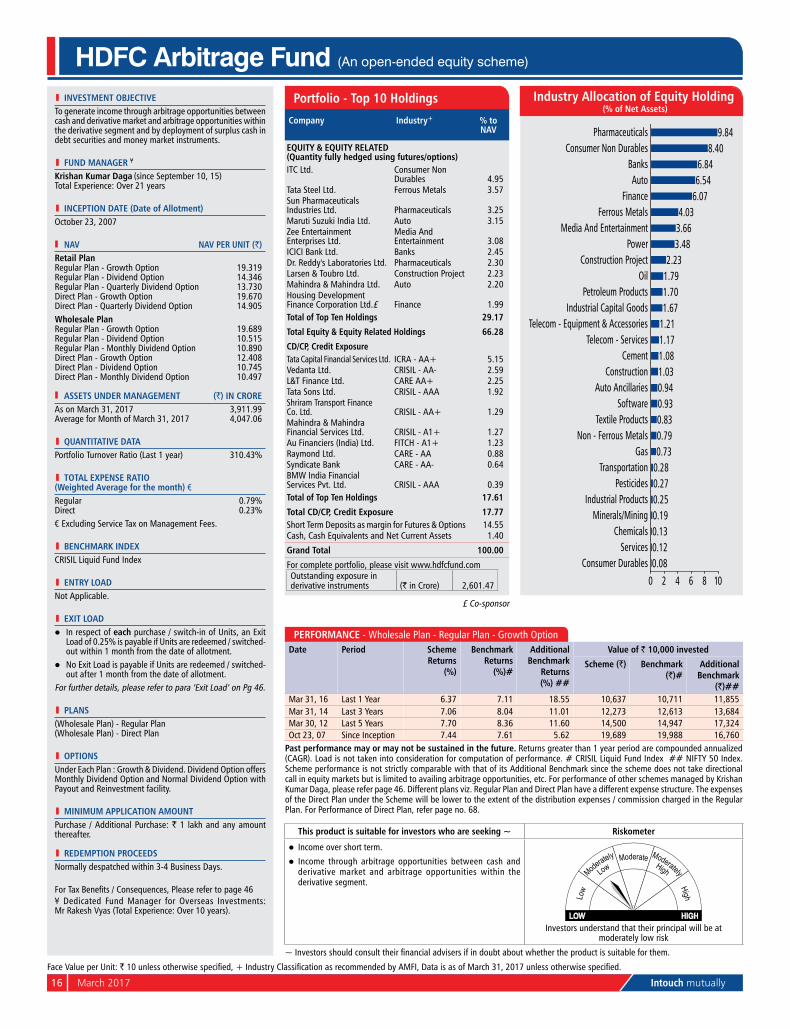
16 March 2017 Intouch mutually
l INvESTMENT OBjECTIvETo generate income through arbitrage opportunities between cash and derivative market and arbitrage opportunities within the derivative segment and by deployment of surplus cash in debt securities and money market instruments.
l FuND MaNagEr ¥
Krishan Kumar Daga (since September 10, 15) Total Experience: over 21 years
l INCEpTION DaTE (Date of allotment)october 23, 2007
Nav Nav pEr uNIT (`)retail planRegular plan - Growth option 19.319Regular plan - Dividend option 14.346Regular plan - quarterly Dividend option 13.730Direct plan - Growth option 19.670Direct plan - quarterly Dividend option 14.905Wholesale planRegular plan - Growth option 19.689Regular plan - Dividend option 10.515Regular plan - Monthly Dividend option 10.890Direct plan - Growth option 12.408Direct plan - Dividend option 10.745Direct plan - Monthly Dividend option 10.497
aSSETS uNDEr MaNagEMENT (`) IN CrOrEAs on March 31, 2017 3,911.99Average for Month of March 31, 2017 4,047.06
l quaNTITaTIvE DaTaportfolio Turnover Ratio (last 1 year) 310.43%
l TOTal ExpENSE raTIO (Weighted average for the month) €Regular 0.79%Direct 0.23%€ Excluding Service Tax on Management Fees.
l BENCHMarK INDExCRISIl liquid Fund Index
l ENTrY lOaDnot Applicable.
l ExIT lOaDl In respect of each purchase / switch-in of units, an Exit
load of 0.25% is payable if units are redeemed / switched-out within 1 month from the date of allotment.
l no Exit load is payable if units are redeemed / switched-out after 1 month from the date of allotment.
For further details, please refer to para ‘Exit load’ on pg 46.
l plaNS(Wholesale plan) - Regular plan(Wholesale plan) - Direct plan
l OpTIONSunder Each plan : Growth & Dividend. Dividend option offers Monthly Dividend option and normal Dividend option with payout and Reinvestment facility.
l MINIMuM applICaTION aMOuNTpurchase / Additional purchase: ` 1 lakh and any amount thereafter.
l rEDEMpTION prOCEEDSnormally despatched within 3-4 Business Days.
For Tax Benefits / Consequences, Please refer to page 46¥ Dedicated Fund Manager for overseas Investments: Mr Rakesh Vyas (Total Experience: over 10 years).
HDFC Arbitrage Fund (An open-ended equity scheme)
This product is suitable for investors who are seeking ~ riskometer
l Income over short term.
l Income through arbitrage opportunities between cash and derivative market and arbitrage opportunities within the derivative segment.
Investors understand that their principal will be at moderately low risk
~ Investors should consult their financial advisers if in doubt about whether the product is suitable for them.
Company Industry+ % to Nav
EquITY & EquITY rElaTED (quantity fully hedged using futures/options)ITC ltd. Consumer non
Durables 4.95Tata Steel ltd. Ferrous Metals 3.57Sun pharmaceuticals Industries ltd. pharmaceuticals 3.25Maruti Suzuki India ltd. Auto 3.15Zee Entertainment Enterprises ltd.
Media And Entertainment 3.08
ICICI Bank ltd. Banks 2.45Dr. Reddy's laboratories ltd. pharmaceuticals 2.30larsen & Toubro ltd. Construction project 2.23Mahindra & Mahindra ltd. Auto 2.20Housing Development Finance Corporation ltd.£ Finance 1.99Total of Top Ten Holdings 29.17
Total Equity & Equity related Holdings 66.28
CD/Cp, Credit ExposureTata Capital Financial Services ltd. ICRA - AA+ 5.15Vedanta ltd. CRISIl - AA- 2.59l&T Finance ltd. CARE AA+ 2.25Tata Sons ltd. CRISIl - AAA 1.92Shriram Transport Finance Co. ltd. CRISIL - AA+ 1.29Mahindra & Mahindra Financial Services ltd. CRISIL - A1+ 1.27Au Financiers (India) ltd. FITCH - A1+ 1.23Raymond ltd. CARE - AA 0.88Syndicate Bank CARE - AA- 0.64BMW India Financial Services pvt. ltd. CRISIl - AAA 0.39Total of Top Ten Holdings 17.61
Total CD/Cp, Credit Exposure 17.77Short Term Deposits as margin for Futures & options 14.55Cash, Cash Equivalents and net Current Assets 1.40
grand Total 100.00
For complete portfolio, please visit www.hdfcfund.comoutstanding exposure in derivative instruments (` in Crore) 2,601.47
portfolio - Top 10 Holdings
0.080.120.130.190.250.270.280.730.790.830.930.941.031.081.171.211.671.701.792.23
3.483.664.03
6.076.546.84
8.409.84
0 2 4 6 8 10
Consumer DurablesServices
ChemicalsMinerals/Mining
Industrial ProductsPesticides
TransportationGas
Non - Ferrous MetalsTextile Products
SoftwareAuto Ancillaries
ConstructionCement
Telecom - ServicesTelecom - Equipment & Accessories
Industrial Capital GoodsPetroleum Products
OilConstruction Project
PowerMedia And Entertainment
Ferrous MetalsFinance
AutoBanks
Consumer Non DurablesPharmaceuticals
Industry allocation of Equity Holding (% of Net assets)
pErFOrMaNCE - Wholesale plan - Regular plan - Growth optionDate period Scheme
returns (%)
Benchmark returns
(%)#
additional Benchmark
returns (%) ##
value of ` 10,000 invested
Scheme (`) Benchmark (`)#
additional Benchmark
(`)##Mar 31, 16 last 1 year 6.37 7.11 18.55 10,637 10,711 11,855Mar 31, 14 last 3 years 7.06 8.04 11.01 12,273 12,613 13,684Mar 30, 12 last 5 years 7.70 8.36 11.60 14,500 14,947 17,324oct 23, 07 Since Inception 7.44 7.61 5.62 19,689 19,988 16,760
past performance may or may not be sustained in the future. Returns greater than 1 year period are compounded annualized (CAGR). load is not taken into consideration for computation of performance. # CRISIl liquid Fund Index ## nIFTy 50 Index. Scheme performance is not strictly comparable with that of its Additional Benchmark since the scheme does not take directional call in equity markets but is limited to availing arbitrage opportunities, etc. For performance of other schemes managed by Krishan Kumar Daga, please refer page 46. Different plans viz. Regular plan and Direct plan have a different expense structure. The expenses of the Direct plan under the Scheme will be lower to the extent of the distribution expenses / commission charged in the Regular plan. For performance of Direct plan, refer page no. 68.
Face Value per unit: ` 10 unless otherwise specified, + Industry Classification as recommended by AMFI, Data is as of March 31, 2017 unless otherwise specified.
£ Co-sponsor
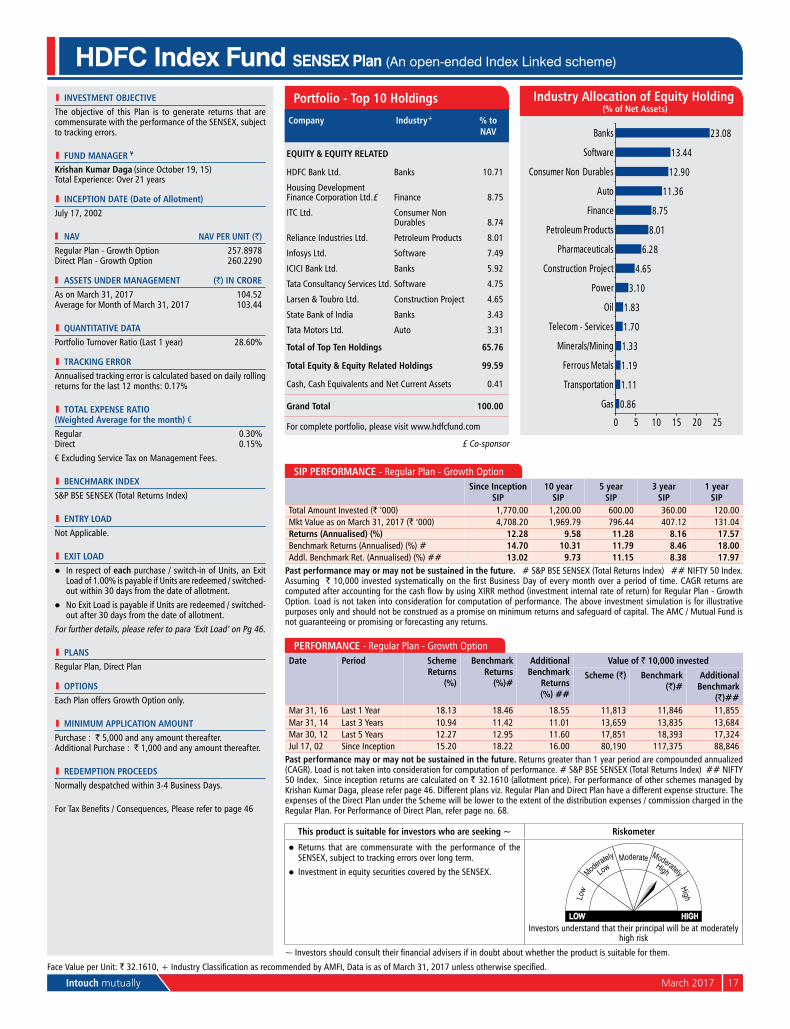
Intouch mutually March 2017 17
l INvESTMENT OBjECTIvEThe objective of this plan is to generate returns that are commensurate with the performance of the SEnSEx, subject to tracking errors.
l FuND MaNagEr ¥
Krishan Kumar Daga (since october 19, 15) Total Experience: over 21 years
l INCEpTION DaTE (Date of allotment)July 17, 2002
Nav Nav pEr uNIT (`)Regular plan - Growth option 257.8978Direct plan - Growth option 260.2290
aSSETS uNDEr MaNagEMENT (`) IN CrOrEAs on March 31, 2017 104.52Average for Month of March 31, 2017 103.44
l quaNTITaTIvE DaTaportfolio Turnover Ratio (last 1 year) 28.60%
l TraCKINg ErrOrAnnualised tracking error is calculated based on daily rolling returns for the last 12 months: 0.17%
l TOTal ExpENSE raTIO (Weighted average for the month) €Regular 0.30%Direct 0.15%
€ Excluding Service Tax on Management Fees.
l BENCHMarK INDExS&p BSE SEnSEx (Total Returns Index)
l ENTrY lOaDnot Applicable.
l ExIT lOaDl In respect of each purchase / switch-in of units, an Exit
load of 1.00% is payable if units are redeemed / switched-out within 30 days from the date of allotment.
l no Exit load is payable if units are redeemed / switched-out after 30 days from the date of allotment.
For further details, please refer to para ‘Exit load’ on pg 46.
l plaNSRegular plan, Direct plan
l OpTIONSEach plan offers Growth option only.
l MINIMuM applICaTION aMOuNTpurchase : ` 5,000 and any amount thereafter.Additional purchase : ` 1,000 and any amount thereafter.
l rEDEMpTION prOCEEDSnormally despatched within 3-4 Business Days.
For Tax Benefits / Consequences, Please refer to page 46
HDFC Index Fund SENSEX Plan (An open-ended Index Linked scheme)
This product is suitable for investors who are seeking ~ riskometer
l Returns that are commensurate with the performance of the SEnSEx, subject to tracking errors over long term.
l Investment in equity securities covered by the SEnSEx.
Investors understand that their principal will be at moderately high risk
~ Investors should consult their financial advisers if in doubt about whether the product is suitable for them.
SIp pErFOrMaNCE - Regular plan - Growth optionSince Inception
SIp10 year
SIp5 year
SIp3 year
SIp1 year
SIpTotal Amount Invested (` ‘000) 1,770.00 1,200.00 600.00 360.00 120.00Mkt Value as on March 31, 2017 (` ‘000) 4,708.20 1,969.79 796.44 407.12 131.04returns (annualised) (%) 12.28 9.58 11.28 8.16 17.57Benchmark Returns (Annualised) (%) # 14.70 10.31 11.79 8.46 18.00Addl. Benchmark Ret. (Annualised) (%) ## 13.02 9.73 11.15 8.38 17.97
past performance may or may not be sustained in the future. # S&p BSE SEnSEx (Total Returns Index) ## nIFTy 50 Index. Assuming ` 10,000 invested systematically on the first Business Day of every month over a period of time. CAGR returns are computed after accounting for the cash flow by using XIRR method (investment internal rate of return) for Regular Plan - Growth option. load is not taken into consideration for computation of performance. The above investment simulation is for illustrative purposes only and should not be construed as a promise on minimum returns and safeguard of capital. The AMC / Mutual Fund is not guaranteeing or promising or forecasting any returns.
Company Industry+ % to Nav
EquITY & EquITY rElaTED
HDFC Bank ltd. Banks 10.71
Housing Development Finance Corporation ltd.£ Finance 8.75
ITC ltd. Consumer non Durables 8.74
Reliance Industries ltd. petroleum products 8.01
Infosys ltd. Software 7.49
ICICI Bank ltd. Banks 5.92
Tata Consultancy Services ltd. Software 4.75
larsen & Toubro ltd. Construction project 4.65
State Bank of India Banks 3.43
Tata Motors ltd. Auto 3.31
Total of Top Ten Holdings 65.76
Total Equity & Equity related Holdings 99.59
Cash, Cash Equivalents and net Current Assets 0.41
grand Total 100.00
For complete portfolio, please visit www.hdfcfund.com
portfolio - Top 10 Holdings
0.86
1.11
1.19
1.33
1.70
1.83
3.10
4.65
6.28
8.01
8.75
11.36
12.90
13.44
23.08
0 5 10 15 20 25
Gas
Transportation
Ferrous Metals
Minerals/Mining
Telecom - Services
Oil
Power
Construction Project
Pharmaceuticals
Petroleum Products
Finance
Auto
Consumer Non Durables
Software
Banks
Industry allocation of Equity Holding (% of Net assets)
pErFOrMaNCE - Regular plan - Growth optionDate period Scheme
returns (%)
Benchmark returns
(%)#
additional Benchmark
returns (%) ##
value of ` 10,000 invested
Scheme (`) Benchmark (`)#
additional Benchmark
(`)##Mar 31, 16 last 1 year 18.13 18.46 18.55 11,813 11,846 11,855Mar 31, 14 last 3 years 10.94 11.42 11.01 13,659 13,835 13,684Mar 30, 12 last 5 years 12.27 12.95 11.60 17,851 18,393 17,324Jul 17, 02 Since Inception 15.20 18.22 16.00 80,190 117,375 88,846
past performance may or may not be sustained in the future. Returns greater than 1 year period are compounded annualized (CAGR). load is not taken into consideration for computation of performance. # S&p BSE SEnSEx (Total Returns Index) ## nIFTy 50 Index. Since inception returns are calculated on ` 32.1610 (allotment price). For performance of other schemes managed by Krishan Kumar Daga, please refer page 46. Different plans viz. Regular plan and Direct plan have a different expense structure. The expenses of the Direct plan under the Scheme will be lower to the extent of the distribution expenses / commission charged in the Regular plan. For performance of Direct plan, refer page no. 68.
Face Value per unit: ` 32.1610, + Industry Classification as recommended by AMFI, Data is as of March 31, 2017 unless otherwise specified.
£ Co-sponsor
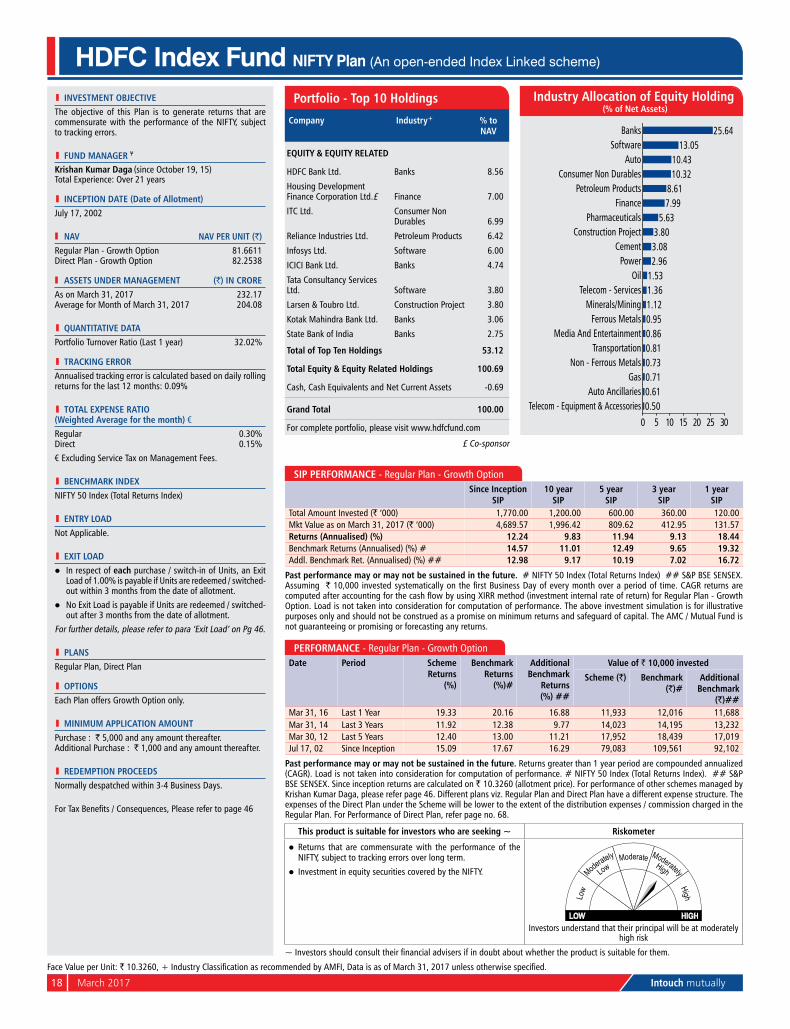
18 March 2017 Intouch mutually
l INvESTMENT OBjECTIvEThe objective of this plan is to generate returns that are commensurate with the performance of the nIFTy, subject to tracking errors.
l FuND MaNagEr ¥
Krishan Kumar Daga (since october 19, 15) Total Experience: over 21 years
l INCEpTION DaTE (Date of allotment)July 17, 2002
Nav Nav pEr uNIT (`)Regular plan - Growth option 81.6611Direct plan - Growth option 82.2538
aSSETS uNDEr MaNagEMENT (`) IN CrOrEAs on March 31, 2017 232.17Average for Month of March 31, 2017 204.08
l quaNTITaTIvE DaTaportfolio Turnover Ratio (last 1 year) 32.02%
l TraCKINg ErrOrAnnualised tracking error is calculated based on daily rolling returns for the last 12 months: 0.09%
l TOTal ExpENSE raTIO (Weighted average for the month) €Regular 0.30%Direct 0.15%
€ Excluding Service Tax on Management Fees.
l BENCHMarK INDExnIFTy 50 Index (Total Returns Index)
l ENTrY lOaDnot Applicable.
l ExIT lOaDl In respect of each purchase / switch-in of units, an Exit
load of 1.00% is payable if units are redeemed / switched-out within 3 months from the date of allotment.
l no Exit load is payable if units are redeemed / switched-out after 3 months from the date of allotment.
For further details, please refer to para ‘Exit load’ on pg 46.
l plaNSRegular plan, Direct plan
l OpTIONSEach plan offers Growth option only.
l MINIMuM applICaTION aMOuNTpurchase : ` 5,000 and any amount thereafter.Additional purchase : ` 1,000 and any amount thereafter.
l rEDEMpTION prOCEEDSnormally despatched within 3-4 Business Days.
For Tax Benefits / Consequences, Please refer to page 46
HDFC Index Fund NIFTY Plan (An open-ended Index Linked scheme)
This product is suitable for investors who are seeking ~ riskometer
l Returns that are commensurate with the performance of the nIFTy, subject to tracking errors over long term.
l Investment in equity securities covered by the nIFTy.
Investors understand that their principal will be at moderately high risk
~ Investors should consult their financial advisers if in doubt about whether the product is suitable for them.
SIp pErFOrMaNCE - Regular plan - Growth optionSince Inception
SIp10 year
SIp5 year
SIp3 year
SIp1 year
SIpTotal Amount Invested (` ‘000) 1,770.00 1,200.00 600.00 360.00 120.00Mkt Value as on March 31, 2017 (` ‘000) 4,689.57 1,996.42 809.62 412.95 131.57returns (annualised) (%) 12.24 9.83 11.94 9.13 18.44Benchmark Returns (Annualised) (%) # 14.57 11.01 12.49 9.65 19.32Addl. Benchmark Ret. (Annualised) (%) ## 12.98 9.17 10.19 7.02 16.72
past performance may or may not be sustained in the future. # nIFTy 50 Index (Total Returns Index) ## S&p BSE SEnSEx. Assuming ` 10,000 invested systematically on the first Business Day of every month over a period of time. CAGR returns are computed after accounting for the cash flow by using XIRR method (investment internal rate of return) for Regular Plan - Growth option. load is not taken into consideration for computation of performance. The above investment simulation is for illustrative purposes only and should not be construed as a promise on minimum returns and safeguard of capital. The AMC / Mutual Fund is not guaranteeing or promising or forecasting any returns.
Company Industry+ % to Nav
EquITY & EquITY rElaTED
HDFC Bank ltd. Banks 8.56
Housing Development Finance Corporation ltd.£ Finance 7.00
ITC ltd. Consumer non Durables 6.99
Reliance Industries ltd. petroleum products 6.42
Infosys ltd. Software 6.00
ICICI Bank ltd. Banks 4.74
Tata Consultancy Services ltd. Software 3.80
larsen & Toubro ltd. Construction project 3.80
Kotak Mahindra Bank ltd. Banks 3.06
State Bank of India Banks 2.75
Total of Top Ten Holdings 53.12
Total Equity & Equity related Holdings 100.69
Cash, Cash Equivalents and net Current Assets -0.69
grand Total 100.00
For complete portfolio, please visit www.hdfcfund.com
portfolio - Top 10 Holdings
0.500.610.710.730.810.860.951.121.361.532.963.083.80
5.637.998.61
10.3210.43
13.0525.64
0 5 10 15 20 25 30
Telecom - Equipment & AccessoriesAuto Ancillaries
GasNon - Ferrous Metals
TransportationMedia And Entertainment
Ferrous MetalsMinerals/Mining
Telecom - ServicesOil
PowerCement
Construction ProjectPharmaceuticals
FinancePetroleum Products
Consumer Non DurablesAuto
SoftwareBanks
Industry allocation of Equity Holding (% of Net assets)
pErFOrMaNCE - Regular plan - Growth optionDate period Scheme
returns (%)
Benchmark returns
(%)#
additional Benchmark
returns (%) ##
value of ` 10,000 invested
Scheme (`) Benchmark (`)#
additional Benchmark
(`)##Mar 31, 16 last 1 year 19.33 20.16 16.88 11,933 12,016 11,688Mar 31, 14 last 3 years 11.92 12.38 9.77 14,023 14,195 13,232Mar 30, 12 last 5 years 12.40 13.00 11.21 17,952 18,439 17,019Jul 17, 02 Since Inception 15.09 17.67 16.29 79,083 109,561 92,102
past performance may or may not be sustained in the future. Returns greater than 1 year period are compounded annualized (CAGR). load is not taken into consideration for computation of performance. # nIFTy 50 Index (Total Returns Index). ## S&p BSE SEnSEx. Since inception returns are calculated on ` 10.3260 (allotment price). For performance of other schemes managed by Krishan Kumar Daga, please refer page 46. Different plans viz. Regular plan and Direct plan have a different expense structure. The expenses of the Direct plan under the Scheme will be lower to the extent of the distribution expenses / commission charged in the Regular plan. For performance of Direct plan, refer page no. 68.
Face Value per unit: ` 10.3260, + Industry Classification as recommended by AMFI, Data is as of March 31, 2017 unless otherwise specified.
£ Co-sponsor
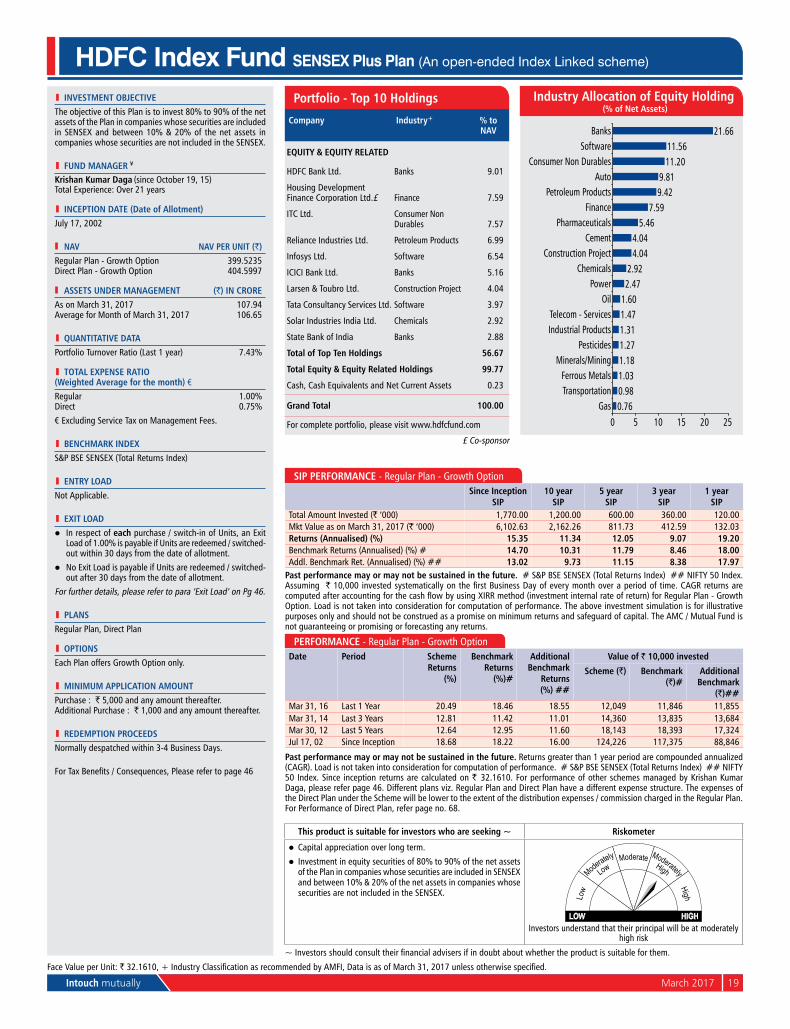
Intouch mutually March 2017 19
l INvESTMENT OBjECTIvEThe objective of this plan is to invest 80% to 90% of the net assets of the plan in companies whose securities are included in SEnSEx and between 10% & 20% of the net assets in companies whose securities are not included in the SEnSEx.
l FuND MaNagEr ¥
Krishan Kumar Daga (since october 19, 15) Total Experience: over 21 years
l INCEpTION DaTE (Date of allotment)July 17, 2002
Nav Nav pEr uNIT (`)Regular plan - Growth option 399.5235Direct plan - Growth option 404.5997
aSSETS uNDEr MaNagEMENT (`) IN CrOrEAs on March 31, 2017 107.94Average for Month of March 31, 2017 106.65
l quaNTITaTIvE DaTaportfolio Turnover Ratio (last 1 year) 7.43%
l TOTal ExpENSE raTIO (Weighted average for the month) €Regular 1.00%Direct 0.75%
€ Excluding Service Tax on Management Fees.
l BENCHMarK INDExS&p BSE SEnSEx (Total Returns Index)
l ENTrY lOaDnot Applicable.
l ExIT lOaDl In respect of each purchase / switch-in of units, an Exit
load of 1.00% is payable if units are redeemed / switched-out within 30 days from the date of allotment.
l no Exit load is payable if units are redeemed / switched-out after 30 days from the date of allotment.
For further details, please refer to para ‘Exit load’ on pg 46.
l plaNSRegular plan, Direct plan
l OpTIONSEach plan offers Growth option only.
l MINIMuM applICaTION aMOuNTpurchase : ` 5,000 and any amount thereafter.Additional purchase : ` 1,000 and any amount thereafter.
l rEDEMpTION prOCEEDSnormally despatched within 3-4 Business Days.
For Tax Benefits / Consequences, Please refer to page 46
HDFC Index Fund SENSEX Plus Plan (An open-ended Index Linked scheme)
This product is suitable for investors who are seeking ~ riskometer
l Capital appreciation over long term.
l Investment in equity securities of 80% to 90% of the net assets of the plan in companies whose securities are included in SEnSEx and between 10% & 20% of the net assets in companies whose securities are not included in the SEnSEx.
Investors understand that their principal will be at moderately high risk
~ Investors should consult their financial advisers if in doubt about whether the product is suitable for them.
pErFOrMaNCE - Regular plan - Growth optionDate period Scheme
returns (%)
Benchmark returns
(%)#
additional Benchmark
returns (%) ##
value of ` 10,000 invested
Scheme (`) Benchmark (`)#
additional Benchmark
(`)##Mar 31, 16 last 1 year 20.49 18.46 18.55 12,049 11,846 11,855Mar 31, 14 last 3 years 12.81 11.42 11.01 14,360 13,835 13,684Mar 30, 12 last 5 years 12.64 12.95 11.60 18,143 18,393 17,324Jul 17, 02 Since Inception 18.68 18.22 16.00 124,226 117,375 88,846
past performance may or may not be sustained in the future. Returns greater than 1 year period are compounded annualized (CAGR). load is not taken into consideration for computation of performance. # S&p BSE SEnSEx (Total Returns Index) ## nIFTy 50 Index. Since inception returns are calculated on ` 32.1610. For performance of other schemes managed by Krishan Kumar Daga, please refer page 46. Different plans viz. Regular plan and Direct plan have a different expense structure. The expenses of the Direct plan under the Scheme will be lower to the extent of the distribution expenses / commission charged in the Regular plan. For performance of Direct plan, refer page no. 68.
SIp pErFOrMaNCE - Regular plan - Growth optionSince Inception
SIp10 year
SIp5 year
SIp3 year
SIp1 year
SIpTotal Amount Invested (` ‘000) 1,770.00 1,200.00 600.00 360.00 120.00Mkt Value as on March 31, 2017 (` ‘000) 6,102.63 2,162.26 811.73 412.59 132.03returns (annualised) (%) 15.35 11.34 12.05 9.07 19.20Benchmark Returns (Annualised) (%) # 14.70 10.31 11.79 8.46 18.00Addl. Benchmark Ret. (Annualised) (%) ## 13.02 9.73 11.15 8.38 17.97
past performance may or may not be sustained in the future. # S&p BSE SEnSEx (Total Returns Index) ## nIFTy 50 Index. Assuming ` 10,000 invested systematically on the first Business Day of every month over a period of time. CAGR returns are computed after accounting for the cash flow by using XIRR method (investment internal rate of return) for Regular Plan - Growth option. load is not taken into consideration for computation of performance. The above investment simulation is for illustrative purposes only and should not be construed as a promise on minimum returns and safeguard of capital. The AMC / Mutual Fund is not guaranteeing or promising or forecasting any returns.
Company Industry+ % to Nav
EquITY & EquITY rElaTED
HDFC Bank ltd. Banks 9.01
Housing Development Finance Corporation ltd.£ Finance 7.59
ITC ltd. Consumer non Durables 7.57
Reliance Industries ltd. petroleum products 6.99
Infosys ltd. Software 6.54
ICICI Bank ltd. Banks 5.16
larsen & Toubro ltd. Construction project 4.04
Tata Consultancy Services ltd. Software 3.97
Solar Industries India ltd. Chemicals 2.92
State Bank of India Banks 2.88
Total of Top Ten Holdings 56.67
Total Equity & Equity related Holdings 99.77
Cash, Cash Equivalents and net Current Assets 0.23
grand Total 100.00
For complete portfolio, please visit www.hdfcfund.com
portfolio - Top 10 Holdings
0.760.981.031.181.271.311.471.602.472.92
4.044.04
5.467.59
9.429.81
11.2011.56
21.66
0 5 10 15 20 25
GasTransportationFerrous Metals
Minerals/MiningPesticides
Industrial ProductsTelecom - Services
OilPower
ChemicalsConstruction Project
CementPharmaceuticals
FinancePetroleum Products
AutoConsumer Non Durables
SoftwareBanks
Industry allocation of Equity Holding (% of Net assets)
Face Value per unit: ` 32.1610, + Industry Classification as recommended by AMFI, Data is as of March 31, 2017 unless otherwise specified.
£ Co-sponsor
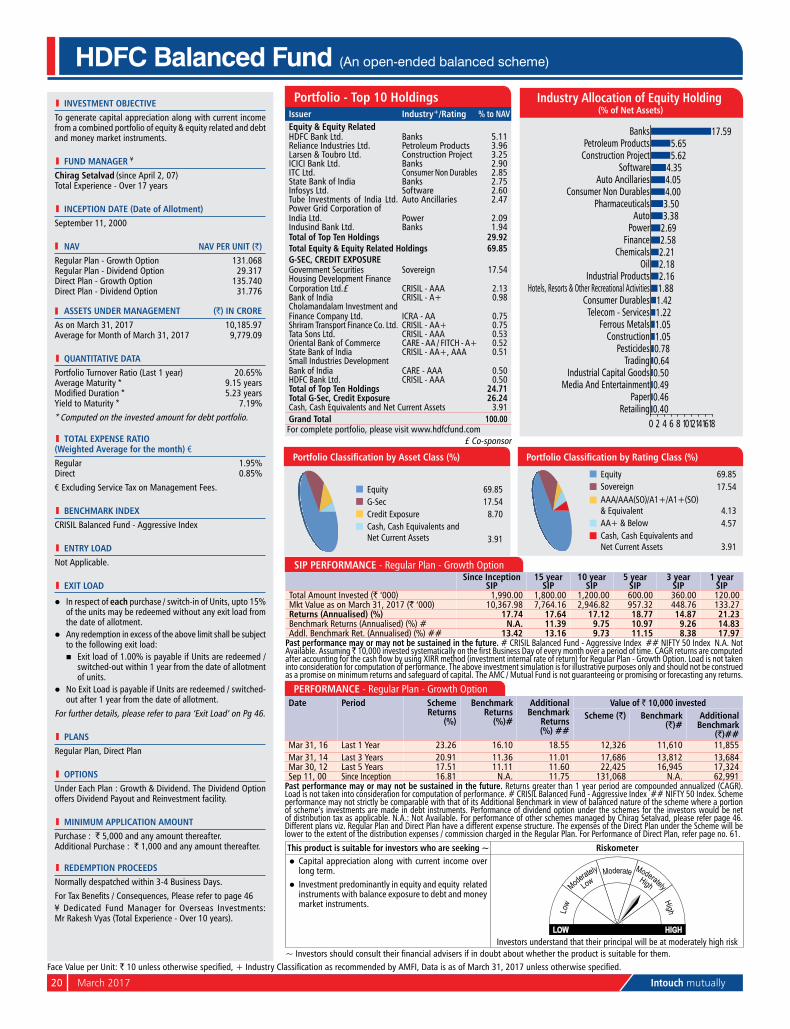
20 March 2017 Intouch mutually
HDFC Balanced Fund (An open-ended balanced scheme)
portfolio - Top 10 HoldingsIssuer Industry+/rating % to NavEquity & Equity relatedHDFC Bank ltd. Banks 5.11Reliance Industries ltd. petroleum products 3.96larsen & Toubro ltd. Construction project 3.25ICICI Bank ltd. Banks 2.90ITC ltd. Consumer non Durables 2.85State Bank of India Banks 2.75Infosys ltd. Software 2.60Tube Investments of India ltd. Auto Ancillaries 2.47power Grid Corporation of India ltd. power 2.09Indusind Bank ltd. Banks 1.94Total of Top Ten Holdings 29.92Total Equity & Equity related Holdings 69.85g-SEC, CrEDIT ExpOSurEGovernment Securities Sovereign 17.54Housing Development Finance Corporation ltd.£ CRISIl - AAA 2.13Bank of India CRISIL - A+ 0.98Cholamandalam Investment and Finance Company ltd. ICRA - AA 0.75Shriram Transport Finance Co. ltd. CRISIL - AA+ 0.75Tata Sons ltd. CRISIl - AAA 0.53oriental Bank of Commerce CARE - AA / FITCH - A+ 0.52State Bank of India CRISIL - AA+, AAA 0.51Small Industries Development Bank of India CARE - AAA 0.50HDFC Bank ltd. CRISIl - AAA 0.50Total of Top Ten Holdings 24.71Total g-Sec, Credit Exposure 26.24Cash, Cash Equivalents and net Current Assets 3.91grand Total 100.00For complete portfolio, please visit www.hdfcfund.com
This product is suitable for investors who are seeking ~ riskometerl Capital appreciation along with current income over
long term.l Investment predominantly in equity and equity related
instruments with balance exposure to debt and money market instruments.
Investors understand that their principal will be at moderately high risk~ Investors should consult their financial advisers if in doubt about whether the product is suitable for them.
Industry allocation of Equity Holding (% of Net assets)
0.400.460.490.500.640.781.051.051.221.421.882.162.182.212.582.693.383.504.004.054.355.625.65
17.59
0 2 4 6 8 1012141618Retailing
PaperMedia And Entertainment
Industrial Capital GoodsTrading
PesticidesConstruction
Ferrous MetalsTelecom - Services
Consumer DurablesHotels, Resorts & Other Recreational Activities
Industrial ProductsOil
ChemicalsFinance
PowerAuto
PharmaceuticalsConsumer Non Durables
Auto AncillariesSoftware
Construction ProjectPetroleum Products
Banks
Equity 69.85G-Sec 17.54Credit Exposure 8.70Cash, Cash Equivalents and net Current Assets 3.91
Equity 69.85Sovereign 17.54AAA/AAA(SO)/A1+/A1+(SO) & Equivalent 4.13AA+ & Below 4.57Cash, Cash Equivalents and net Current Assets 3.91
Portfolio Classification by Asset Class (%) Portfolio Classification by Rating Class (%)
SIp pErFOrMaNCE - Regular plan - Growth optionSince Inception
SIp15 year
SIp10 year
SIp5 year
SIp3 year
SIp1 year
SIpTotal Amount Invested (` ‘000) 1,990.00 1,800.00 1,200.00 600.00 360.00 120.00Mkt Value as on March 31, 2017 (` ‘000) 10,367.98 7,764.16 2,946.82 957.32 448.76 133.27returns (annualised) (%) 17.74 17.64 17.12 18.77 14.87 21.23Benchmark Returns (Annualised) (%) # N.a. 11.39 9.75 10.97 9.26 14.83Addl. Benchmark Ret. (Annualised) (%) ## 13.42 13.16 9.73 11.15 8.38 17.97
past performance may or may not be sustained in the future. # CRISIl Balanced Fund - Aggressive Index ## nIFTy 50 Index n.A. not Available. Assuming ̀ 10,000 invested systematically on the first Business Day of every month over a period of time. CAGR returns are computed after accounting for the cash flow by using XIRR method (investment internal rate of return) for Regular Plan - Growth Option. Load is not taken into consideration for computation of performance. The above investment simulation is for illustrative purposes only and should not be construed as a promise on minimum returns and safeguard of capital. The AMC / Mutual Fund is not guaranteeing or promising or forecasting any returns.
l INvESTMENT OBjECTIvETo generate capital appreciation along with current income from a combined portfolio of equity & equity related and debt and money market instruments.
l FuND MaNagEr ¥
Chirag Setalvad (since April 2, 07) Total Experience - over 17 years
l INCEpTION DaTE (Date of allotment)September 11, 2000
Nav Nav pEr uNIT (`)Regular plan - Growth option 131.068Regular plan - Dividend option 29.317Direct plan - Growth option 135.740Direct plan - Dividend option 31.776
aSSETS uNDEr MaNagEMENT (`) IN CrOrEAs on March 31, 2017 10,185.97Average for Month of March 31, 2017 9,779.09
l quaNTITaTIvE DaTaportfolio Turnover Ratio (last 1 year) 20.65%Average Maturity * 9.15 yearsModified Duration * 5.23 yearsyield to Maturity * 7.19%* Computed on the invested amount for debt portfolio.
l TOTal ExpENSE raTIO (Weighted average for the month) €Regular 1.95%Direct 0.85%
€ Excluding Service Tax on Management Fees.
l BENCHMarK INDExCRISIl Balanced Fund - Aggressive Index
l ENTrY lOaDnot Applicable.
l ExIT lOaD
l In respect of each purchase / switch-in of units, upto 15% of the units may be redeemed without any exit load from the date of allotment.
l Any redemption in excess of the above limit shall be subject to the following exit load:
n Exit load of 1.00% is payable if units are redeemed / switched-out within 1 year from the date of allotment of units.
l no Exit load is payable if units are redeemed / switched-out after 1 year from the date of allotment.
For further details, please refer to para ‘Exit load’ on pg 46.
l plaNSRegular plan, Direct plan
l OpTIONSunder Each plan : Growth & Dividend. The Dividend option offers Dividend payout and Reinvestment facility.
l MINIMuM applICaTION aMOuNTpurchase : ` 5,000 and any amount thereafter.Additional purchase : ` 1,000 and any amount thereafter.
l rEDEMpTION prOCEEDSnormally despatched within 3-4 Business Days.
For Tax Benefits / Consequences, Please refer to page 46¥ Dedicated Fund Manager for overseas Investments: Mr Rakesh Vyas (Total Experience - over 10 years).
pErFOrMaNCE - Regular plan - Growth optionDate period Scheme
returns (%)
Benchmark returns
(%)#
additional Benchmark
returns (%) ##
value of ` 10,000 investedScheme (`) Benchmark
(`)#additional
Benchmark (`)##
Mar 31, 16 last 1 year 23.26 16.10 18.55 12,326 11,610 11,855Mar 31, 14 last 3 years 20.91 11.36 11.01 17,686 13,812 13,684Mar 30, 12 last 5 years 17.51 11.11 11.60 22,425 16,945 17,324Sep 11, 00 Since Inception 16.81 n.A. 11.75 131,068 n.A. 62,991
past performance may or may not be sustained in the future. Returns greater than 1 year period are compounded annualized (CAGR). load is not taken into consideration for computation of performance. # CRISIl Balanced Fund - Aggressive Index ## nIFTy 50 Index. Scheme performance may not strictly be comparable with that of its Additional Benchmark in view of balanced nature of the scheme where a portion of scheme’s investments are made in debt instruments. performance of dividend option under the schemes for the investors would be net of distribution tax as applicable. n.A.: not Available. For performance of other schemes managed by Chirag Setalvad, please refer page 46. Different plans viz. Regular plan and Direct plan have a different expense structure. The expenses of the Direct plan under the Scheme will be lower to the extent of the distribution expenses / commission charged in the Regular plan. For performance of Direct plan, refer page no. 61.
Face Value per unit: ` 10 unless otherwise specified, + Industry Classification as recommended by AMFI, Data is as of March 31, 2017 unless otherwise specified.
£ Co-sponsor
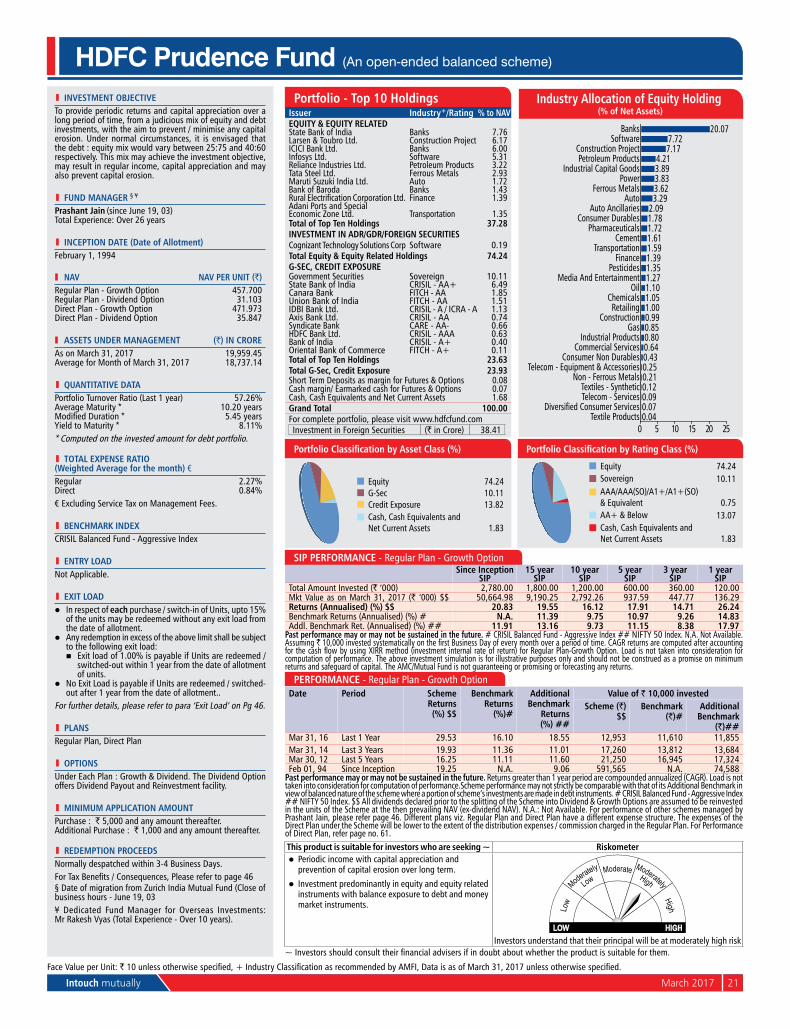
Intouch mutually March 2017 21
l INvESTMENT OBjECTIvETo provide periodic returns and capital appreciation over a long period of time, from a judicious mix of equity and debt investments, with the aim to prevent / minimise any capital erosion. under normal circumstances, it is envisaged that the debt : equity mix would vary between 25:75 and 40:60 respectively. This mix may achieve the investment objective, may result in regular income, capital appreciation and may also prevent capital erosion.
l FuND MaNagEr § ¥
prashant jain (since June 19, 03) Total Experience: over 26 years
l INCEpTION DaTE (Date of allotment)February 1, 1994
Nav Nav pEr uNIT (`)Regular plan - Growth option 457.700Regular plan - Dividend option 31.103Direct plan - Growth option 471.973Direct plan - Dividend option 35.847
aSSETS uNDEr MaNagEMENT (`) IN CrOrEAs on March 31, 2017 19,959.45Average for Month of March 31, 2017 18,737.14
l quaNTITaTIvE DaTaportfolio Turnover Ratio (last 1 year) 57.26%Average Maturity * 10.20 yearsModified Duration * 5.45 yearsyield to Maturity * 8.11%* Computed on the invested amount for debt portfolio.
l TOTal ExpENSE raTIO (Weighted average for the month) €Regular 2.27%Direct 0.84%€ Excluding Service Tax on Management Fees.
l BENCHMarK INDExCRISIl Balanced Fund - Aggressive Index
l ENTrY lOaDnot Applicable.
l ExIT lOaDl In respect of each purchase / switch-in of units, upto 15%
of the units may be redeemed without any exit load from the date of allotment.
l Any redemption in excess of the above limit shall be subject to the following exit load:
n Exit load of 1.00% is payable if units are redeemed / switched-out within 1 year from the date of allotment of units.
l no Exit load is payable if units are redeemed / switched-out after 1 year from the date of allotment..
For further details, please refer to para ‘Exit load’ on pg 46.
l plaNSRegular plan, Direct plan
l OpTIONSunder Each plan : Growth & Dividend. The Dividend option offers Dividend payout and Reinvestment facility.
l MINIMuM applICaTION aMOuNTpurchase : ` 5,000 and any amount thereafter.Additional purchase : ` 1,000 and any amount thereafter.
l rEDEMpTION prOCEEDSnormally despatched within 3-4 Business Days.For Tax Benefits / Consequences, Please refer to page 46§ Date of migration from Zurich India Mutual Fund (Close of business hours - June 19, 03¥ Dedicated Fund Manager for overseas Investments: Mr Rakesh Vyas (Total Experience - over 10 years).
HDFC Prudence Fund (An open-ended balanced scheme)
This product is suitable for investors who are seeking ~ riskometerl periodic income with capital appreciation and
prevention of capital erosion over long term.
l Investment predominantly in equity and equity related instruments with balance exposure to debt and money market instruments.
Investors understand that their principal will be at moderately high risk~ Investors should consult their financial advisers if in doubt about whether the product is suitable for them.
SIp pErFOrMaNCE - Regular plan - Growth optionSince Inception
SIp15 year
SIp10 year
SIp5 year
SIp3 year
SIp1 year
SIpTotal Amount Invested (` ‘000) 2,780.00 1,800.00 1,200.00 600.00 360.00 120.00Mkt Value as on March 31, 2017 (` ‘000) $$ 50,664.98 9,190.25 2,792.26 937.59 447.77 136.29returns (annualised) (%) $$ 20.83 19.55 16.12 17.91 14.71 26.24Benchmark Returns (Annualised) (%) # N.a. 11.39 9.75 10.97 9.26 14.83Addl. Benchmark Ret. (Annualised) (%) ## 11.91 13.16 9.73 11.15 8.38 17.97
past performance may or may not be sustained in the future. # CRISIl Balanced Fund - Aggressive Index ## nIFTy 50 Index. n.A. not Available. Assuming ` 10,000 invested systematically on the first Business Day of every month over a period of time. CAGR returns are computed after accounting for the cash flow by using XIRR method (investment internal rate of return) for Regular Plan-Growth Option. Load is not taken into consideration for computation of performance. The above investment simulation is for illustrative purposes only and should not be construed as a promise on minimum returns and safeguard of capital. The AMC/Mutual Fund is not guaranteeing or promising or forecasting any returns.
portfolio - Top 10 HoldingsIssuer Industry+/rating % to NavEquITY & EquITY rElaTEDState Bank of India Banks 7.76larsen & Toubro ltd. Construction project 6.17ICICI Bank ltd. Banks 6.00Infosys ltd. Software 5.31Reliance Industries ltd. petroleum products 3.22Tata Steel ltd. Ferrous Metals 2.93Maruti Suzuki India ltd. Auto 1.72Bank of Baroda Banks 1.43Rural Electrification Corporation Ltd. Finance 1.39Adani ports and SpecialEconomic Zone ltd. Transportation 1.35Total of Top Ten Holdings 37.28INvESTMENT IN aDr/gDr/FOrEIgN SECurITIESCognizant Technology Solutions Corp Software 0.19Total Equity & Equity related Holdings 74.24g-SEC, CrEDIT ExpOSurEGovernment Securities Sovereign 10.11State Bank of India CRISIL - AA+ 6.49Canara Bank FITCH - AA 1.85union Bank of India FITCH - AA 1.51IDBI Bank ltd. CRISIl - A / ICRA - A 1.13Axis Bank ltd. CRISIl - AA 0.74Syndicate Bank CARE - AA- 0.66HDFC Bank ltd. CRISIl - AAA 0.63Bank of India CRISIL - A+ 0.40oriental Bank of Commerce FITCH - A+ 0.11Total of Top Ten Holdings 23.63Total g-Sec, Credit Exposure 23.93Short Term Deposits as margin for Futures & options 0.08Cash margin/ Earmarked cash for Futures & options 0.07Cash, Cash Equivalents and net Current Assets 1.68grand Total 100.00For complete portfolio, please visit www.hdfcfund.comInvestment in Foreign Securities (` in Crore) 38.41
Equity 74.24G-Sec 10.11Credit Exposure 13.82Cash, Cash Equivalents and net Current Assets 1.83
Portfolio Classification by Asset Class (%)
Industry allocation of Equity Holding (% of Net assets)
0.040.070.090.120.210.250.430.640.800.850.991.001.051.101.271.351.391.591.611.721.782.093.293.623.833.894.21
7.177.72
20.07
0 5 10 15 20 25Textile Products
Diversified Consumer ServicesTelecom - ServicesTextiles - Synthetic
Non - Ferrous MetalsTelecom - Equipment & Accessories
Consumer Non DurablesCommercial Services
Industrial ProductsGas
ConstructionRetailing
ChemicalsOil
Media And EntertainmentPesticides
FinanceTransportation
CementPharmaceuticals
Consumer DurablesAuto Ancillaries
AutoFerrous Metals
PowerIndustrial Capital Goods
Petroleum ProductsConstruction Project
SoftwareBanks
Face Value per unit: ` 10 unless otherwise specified, + Industry Classification as recommended by AMFI, Data is as of March 31, 2017 unless otherwise specified.
Equity 74.24Sovereign 10.11AAA/AAA(SO)/A1+/A1+(SO) & Equivalent 0.75AA+ & Below 13.07Cash, Cash Equivalents and net Current Assets 1.83
Portfolio Classification by Rating Class (%)
pErFOrMaNCE - Regular plan - Growth optionDate period Scheme
returns (%) $$
Benchmark returns
(%)#
additional Benchmark
returns (%) ##
value of ` 10,000 investedScheme (`)
$$Benchmark
(`)#additional
Benchmark (`)##
Mar 31, 16 last 1 year 29.53 16.10 18.55 12,953 11,610 11,855Mar 31, 14 last 3 years 19.93 11.36 11.01 17,260 13,812 13,684Mar 30, 12 last 5 years 16.25 11.11 11.60 21,250 16,945 17,324Feb 01, 94 Since Inception 19.25 n.A. 9.06 591,565 n.A. 74,588
past performance may or may not be sustained in the future. Returns greater than 1 year period are compounded annualized (CAGR). load is not taken into consideration for computation of performance.Scheme performance may not strictly be comparable with that of its Additional Benchmark in view of balanced nature of the scheme where a portion of scheme’s investments are made in debt instruments. # CRISIl Balanced Fund - Aggressive Index ## nIFTy 50 Index. $$ All dividends declared prior to the splitting of the Scheme into Dividend & Growth options are assumed to be reinvested in the units of the Scheme at the then prevailing nAV (ex-dividend nAV). n.A.: not Available. For performance of other schemes managed by prashant Jain, please refer page 46. Different plans viz. Regular plan and Direct plan have a different expense structure. The expenses of the Direct plan under the Scheme will be lower to the extent of the distribution expenses / commission charged in the Regular plan. For performance of Direct plan, refer page no. 61.
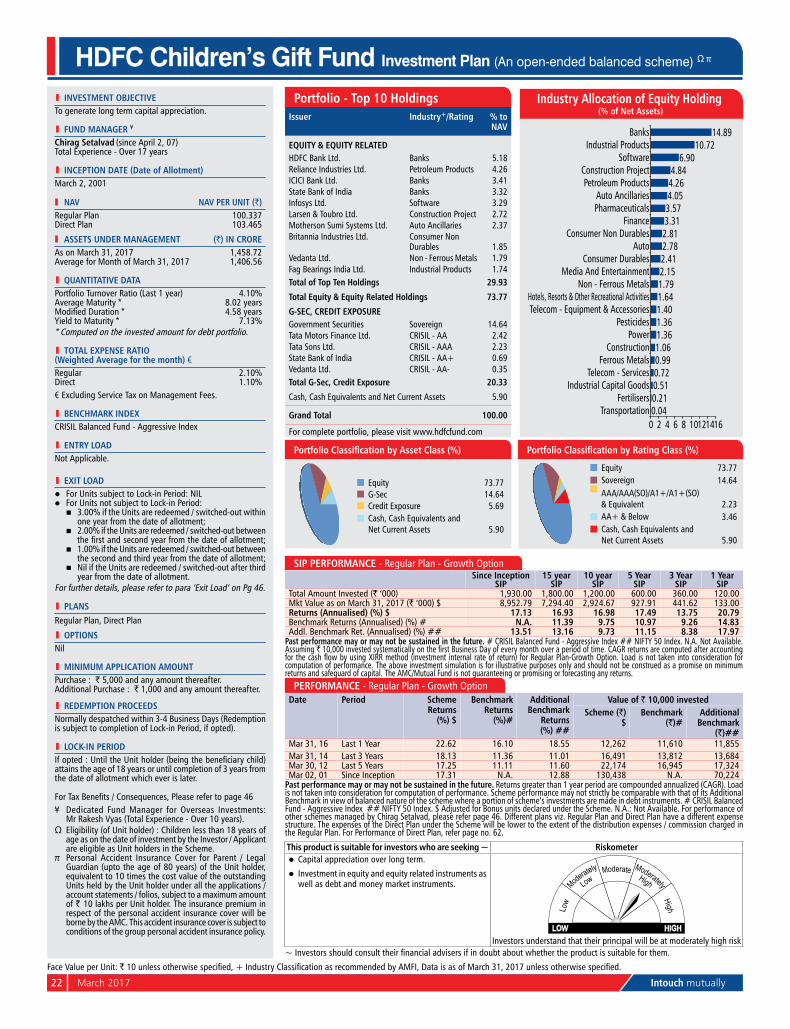
22 March 2017 Intouch mutually
l INvESTMENT OBjECTIvETo generate long term capital appreciation.
l FuND MaNagEr ¥
Chirag Setalvad (since April 2, 07) Total Experience - over 17 years
l INCEpTION DaTE (Date of allotment)March 2, 2001
Nav Nav pEr uNIT (`)Regular plan 100.337Direct plan 103.465
aSSETS uNDEr MaNagEMENT (`) IN CrOrEAs on March 31, 2017 1,458.72Average for Month of March 31, 2017 1,406.56
l quaNTITaTIvE DaTaportfolio Turnover Ratio (last 1 year) 4.10%Average Maturity * 8.02 yearsModified Duration * 4.58 yearsyield to Maturity * 7.13%* Computed on the invested amount for debt portfolio.
l TOTal ExpENSE raTIO (Weighted average for the month) €Regular 2.10%Direct 1.10%€ Excluding Service Tax on Management Fees.
l BENCHMarK INDExCRISIl Balanced Fund - Aggressive Index
l ENTrY lOaDnot Applicable.
l ExIT lOaDl For units subject to lock-in period: nIll For units not subject to lock-in period: n 3.00% if the units are redeemed / switched-out within
one year from the date of allotment; n 2.00% if the units are redeemed / switched-out between
the first and second year from the date of allotment; n 1.00% if the units are redeemed / switched-out between
the second and third year from the date of allotment; n nil if the units are redeemed / switched-out after third
year from the date of allotment.For further details, please refer to para ‘Exit load’ on pg 46.
l plaNSRegular plan, Direct plan
l OpTIONSnil
l MINIMuM applICaTION aMOuNTpurchase : ` 5,000 and any amount thereafter.Additional purchase : ` 1,000 and any amount thereafter.
l rEDEMpTION prOCEEDSnormally despatched within 3-4 Business Days (Redemption is subject to completion of lock-in period, if opted).
l lOCK-IN pErIODIf opted : Until the Unit holder (being the beneficiary child) attains the age of 18 years or until completion of 3 years from the date of allotment which ever is later.
For Tax Benefits / Consequences, Please refer to page 46¥ Dedicated Fund Manager for overseas Investments:
Mr Rakesh Vyas (Total Experience - over 10 years).Ω Eligibility (of Unit holder) : Children less than 18 years of
age as on the date of investment by the Investor / Applicant are eligible as unit holders in the Scheme.
π Personal Accident Insurance Cover for Parent / Legal Guardian (upto the age of 80 years) of the unit holder, equivalent to 10 times the cost value of the outstanding units held by the unit holder under all the applications / account statements / folios, subject to a maximum amount of ` 10 lakhs per unit holder. The insurance premium in respect of the personal accident insurance cover will be borne by the AMC. This accident insurance cover is subject to conditions of the group personal accident insurance policy.
HDFC Children’s Gift Fund Investment Plan (An open-ended balanced scheme) Ω π
This product is suitable for investors who are seeking ~ riskometerl Capital appreciation over long term.
l Investment in equity and equity related instruments as well as debt and money market instruments.
Investors understand that their principal will be at moderately high risk~ Investors should consult their financial advisers if in doubt about whether the product is suitable for them.
SIp pErFOrMaNCE - Regular plan - Growth optionSince Inception
SIp15 year
SIp10 year
SIp5 Year
SIp3 Year
SIp1 Year
SIpTotal Amount Invested (` ‘000) 1,930.00 1,800.00 1,200.00 600.00 360.00 120.00Mkt Value as on March 31, 2017 (` ‘000) $ 8,952.79 7,294.40 2,924.67 927.91 441.62 133.00returns (annualised) (%) $ 17.13 16.93 16.98 17.49 13.75 20.79Benchmark Returns (Annualised) (%) # N.a. 11.39 9.75 10.97 9.26 14.83Addl. Benchmark Ret. (Annualised) (%) ## 13.51 13.16 9.73 11.15 8.38 17.97
past performance may or may not be sustained in the future. # CRISIl Balanced Fund - Aggressive Index ## nIFTy 50 Index. n.A. not Available. Assuming ` 10,000 invested systematically on the first Business Day of every month over a period of time. CAGR returns are computed after accounting for the cash flow by using XIRR method (investment internal rate of return) for Regular Plan-Growth Option. Load is not taken into consideration for computation of performance. The above investment simulation is for illustrative purposes only and should not be construed as a promise on minimum returns and safeguard of capital. The AMC/Mutual Fund is not guaranteeing or promising or forecasting any returns.
pErFOrMaNCE - Regular plan - Growth optionDate period Scheme
returns (%) $
Benchmark returns
(%)#
additional Benchmark
returns (%) ##
value of ` 10,000 investedScheme (`)
$Benchmark
(`)#additional
Benchmark (`)##
Mar 31, 16 last 1 year 22.62 16.10 18.55 12,262 11,610 11,855Mar 31, 14 last 3 years 18.13 11.36 11.01 16,491 13,812 13,684Mar 30, 12 last 5 years 17.25 11.11 11.60 22,174 16,945 17,324Mar 02, 01 Since Inception 17.31 n.A. 12.88 130,438 n.A. 70,224
past performance may or may not be sustained in the future. Returns greater than 1 year period are compounded annualized (CAGR). load is not taken into consideration for computation of performance. Scheme performance may not strictly be comparable with that of its Additional Benchmark in view of balanced nature of the scheme where a portion of scheme’s investments are made in debt instruments. # CRISIl Balanced Fund - Aggressive Index ## nIFTy 50 Index. $ Adjusted for Bonus units declared under the Scheme. n.A.: not Available. For performance of other schemes managed by Chirag Setalvad, please refer page 46. Different plans viz. Regular plan and Direct plan have a different expense structure. The expenses of the Direct plan under the Scheme will be lower to the extent of the distribution expenses / commission charged in the Regular plan. For performance of Direct plan, refer page no. 62.
portfolio - Top 10 HoldingsIssuer Industry+/rating % to
Nav
EquITY & EquITY rElaTEDHDFC Bank ltd. Banks 5.18Reliance Industries ltd. petroleum products 4.26ICICI Bank ltd. Banks 3.41State Bank of India Banks 3.32Infosys ltd. Software 3.29larsen & Toubro ltd. Construction project 2.72Motherson Sumi Systems ltd. Auto Ancillaries 2.37Britannia Industries ltd. Consumer non
Durables 1.85Vedanta ltd. non - Ferrous Metals 1.79Fag Bearings India ltd. Industrial products 1.74Total of Top Ten Holdings 29.93
Total Equity & Equity related Holdings 73.77
g-SEC, CrEDIT ExpOSurEGovernment Securities Sovereign 14.64Tata Motors Finance ltd. CRISIl - AA 2.42Tata Sons ltd. CRISIl - AAA 2.23State Bank of India CRISIL - AA+ 0.69Vedanta ltd. CRISIl - AA- 0.35Total g-Sec, Credit Exposure 20.33
Cash, Cash Equivalents and net Current Assets 5.90
grand Total 100.00
For complete portfolio, please visit www.hdfcfund.com
Industry allocation of Equity Holding (% of Net assets)
0.040.210.510.720.991.061.361.361.401.641.792.152.412.782.813.313.574.054.264.84
6.9010.72
14.89
0 2 4 6 8 10121416Transportation
FertilisersIndustrial Capital Goods
Telecom - ServicesFerrous Metals
ConstructionPower
PesticidesTelecom - Equipment & AccessoriesHotels, Resorts & Other Recreational Activities
Non - Ferrous MetalsMedia And Entertainment
Consumer DurablesAuto
Consumer Non DurablesFinance
PharmaceuticalsAuto Ancillaries
Petroleum ProductsConstruction Project
SoftwareIndustrial Products
Banks
Equity 73.77G-Sec 14.64Credit Exposure 5.69Cash, Cash Equivalents and net Current Assets 5.90
Portfolio Classification by Asset Class (%)
Equity 73.77Sovereign 14.64AAA/AAA(SO)/A1+/A1+(SO) & Equivalent 2.23AA+ & Below 3.46Cash, Cash Equivalents and net Current Assets 5.90
Portfolio Classification by Rating Class (%)
Face Value per unit: ` 10 unless otherwise specified, + Industry Classification as recommended by AMFI, Data is as of March 31, 2017 unless otherwise specified.
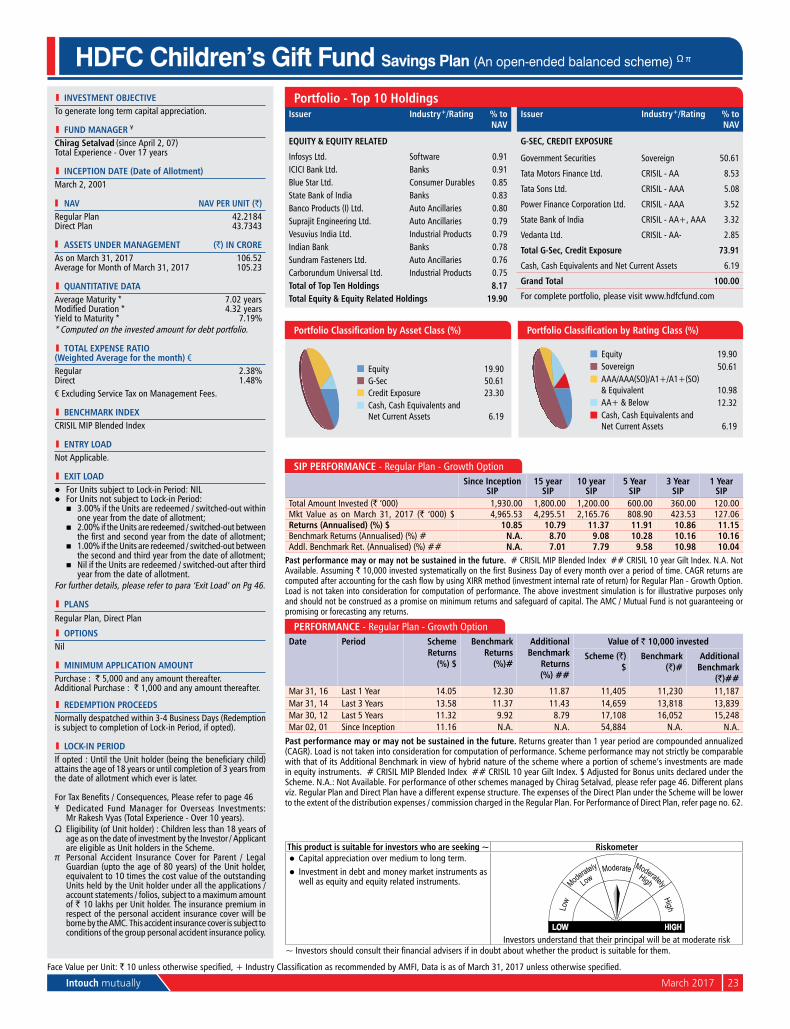
Intouch mutually March 2017 23
HDFC Children’s Gift Fund Savings Plan (An open-ended balanced scheme) Ω π
l INvESTMENT OBjECTIvETo generate long term capital appreciation.
l FuND MaNagEr ¥
Chirag Setalvad (since April 2, 07) Total Experience - over 17 years
l INCEpTION DaTE (Date of allotment)March 2, 2001
Nav Nav pEr uNIT (`)Regular plan 42.2184Direct plan 43.7343
aSSETS uNDEr MaNagEMENT (`) IN CrOrEAs on March 31, 2017 106.52Average for Month of March 31, 2017 105.23
l quaNTITaTIvE DaTaAverage Maturity * 7.02 yearsModified Duration * 4.32 yearsyield to Maturity * 7.19%* Computed on the invested amount for debt portfolio.
l TOTal ExpENSE raTIO (Weighted average for the month) €Regular 2.38%Direct 1.48%€ Excluding Service Tax on Management Fees.
l BENCHMarK INDExCRISIl MIp Blended Index
l ENTrY lOaDnot Applicable.
l ExIT lOaDl For units subject to lock-in period: nIll For units not subject to lock-in period: n 3.00% if the units are redeemed / switched-out within
one year from the date of allotment; n 2.00% if the units are redeemed / switched-out between
the first and second year from the date of allotment; n 1.00% if the units are redeemed / switched-out between
the second and third year from the date of allotment; n nil if the units are redeemed / switched-out after third
year from the date of allotment.For further details, please refer to para ‘Exit load’ on pg 46.
l plaNSRegular plan, Direct plan
l OpTIONSnil
l MINIMuM applICaTION aMOuNTpurchase : ` 5,000 and any amount thereafter.Additional purchase : ` 1,000 and any amount thereafter.
l rEDEMpTION prOCEEDSnormally despatched within 3-4 Business Days (Redemption is subject to completion of lock-in period, if opted).
l lOCK-IN pErIODIf opted : Until the Unit holder (being the beneficiary child) attains the age of 18 years or until completion of 3 years from the date of allotment which ever is later.
For Tax Benefits / Consequences, Please refer to page 46¥ Dedicated Fund Manager for overseas Investments:
Mr Rakesh Vyas (Total Experience - over 10 years).Ω Eligibility (of Unit holder) : Children less than 18 years of
age as on the date of investment by the Investor / Applicant are eligible as unit holders in the Scheme.
π Personal Accident Insurance Cover for Parent / Legal Guardian (upto the age of 80 years) of the unit holder, equivalent to 10 times the cost value of the outstanding units held by the unit holder under all the applications / account statements / folios, subject to a maximum amount of ` 10 lakhs per unit holder. The insurance premium in respect of the personal accident insurance cover will be borne by the AMC. This accident insurance cover is subject to conditions of the group personal accident insurance policy.
SIp pErFOrMaNCE - Regular plan - Growth optionSince Inception
SIp15 year
SIp10 year
SIp5 Year
SIp3 Year
SIp1 Year
SIpTotal Amount Invested (` ‘000) 1,930.00 1,800.00 1,200.00 600.00 360.00 120.00Mkt Value as on March 31, 2017 (` ‘000) $ 4,965.53 4,295.51 2,165.76 808.90 423.53 127.06returns (annualised) (%) $ 10.85 10.79 11.37 11.91 10.86 11.15Benchmark Returns (Annualised) (%) # N.a. 8.70 9.08 10.28 10.16 10.16Addl. Benchmark Ret. (Annualised) (%) ## N.a. 7.01 7.79 9.58 10.98 10.04
past performance may or may not be sustained in the future. # CRISIl MIp Blended Index ## CRISIl 10 year Gilt Index. n.A. not Available. Assuming ` 10,000 invested systematically on the first Business Day of every month over a period of time. CAGR returns are computed after accounting for the cash flow by using XIRR method (investment internal rate of return) for Regular Plan - Growth Option. load is not taken into consideration for computation of performance. The above investment simulation is for illustrative purposes only and should not be construed as a promise on minimum returns and safeguard of capital. The AMC / Mutual Fund is not guaranteeing or promising or forecasting any returns.
pErFOrMaNCE - Regular plan - Growth optionDate period Scheme
returns (%) $
Benchmark returns
(%)#
additional Benchmark
returns (%) ##
value of ` 10,000 invested
Scheme (`) $
Benchmark (`)#
additional Benchmark
(`)##Mar 31, 16 last 1 year 14.05 12.30 11.87 11,405 11,230 11,187Mar 31, 14 last 3 years 13.58 11.37 11.43 14,659 13,818 13,839Mar 30, 12 last 5 years 11.32 9.92 8.79 17,108 16,052 15,248Mar 02, 01 Since Inception 11.16 n.A. n.A. 54,884 n.A. n.A.
past performance may or may not be sustained in the future. Returns greater than 1 year period are compounded annualized (CAGR). load is not taken into consideration for computation of performance. Scheme performance may not strictly be comparable with that of its Additional Benchmark in view of hybrid nature of the scheme where a portion of scheme’s investments are made in equity instruments. # CRISIl MIp Blended Index ## CRISIl 10 year Gilt Index. $ Adjusted for Bonus units declared under the Scheme. n.A.: not Available. For performance of other schemes managed by Chirag Setalvad, please refer page 46. Different plans viz. Regular plan and Direct plan have a different expense structure. The expenses of the Direct plan under the Scheme will be lower to the extent of the distribution expenses / commission charged in the Regular plan. For performance of Direct plan, refer page no. 62.
portfolio - Top 10 HoldingsIssuer Industry+/rating % to
Nav
EquITY & EquITY rElaTED
Infosys ltd. Software 0.91ICICI Bank ltd. Banks 0.91Blue Star ltd. Consumer Durables 0.85State Bank of India Banks 0.83Banco products (I) ltd. Auto Ancillaries 0.80Suprajit Engineering ltd. Auto Ancillaries 0.79Vesuvius India ltd. Industrial products 0.79Indian Bank Banks 0.78Sundram Fasteners ltd. Auto Ancillaries 0.76Carborundum universal ltd. Industrial products 0.75Total of Top Ten Holdings 8.17Total Equity & Equity related Holdings 19.90
Issuer Industry+/rating % to Nav
g-SEC, CrEDIT ExpOSurE
Government Securities Sovereign 50.61
Tata Motors Finance ltd. CRISIl - AA 8.53
Tata Sons ltd. CRISIl - AAA 5.08
power Finance Corporation ltd. CRISIl - AAA 3.52
State Bank of India CRISIL - AA+, AAA 3.32
Vedanta ltd. CRISIl - AA- 2.85
Total g-Sec, Credit Exposure 73.91
Cash, Cash Equivalents and net Current Assets 6.19
grand Total 100.00
For complete portfolio, please visit www.hdfcfund.com
Equity 19.90G-Sec 50.61Credit Exposure 23.30Cash, Cash Equivalents and net Current Assets 6.19
Portfolio Classification by Asset Class (%)
Equity 19.90Sovereign 50.61AAA/AAA(SO)/A1+/A1+(SO) & Equivalent 10.98AA+ & Below 12.32Cash, Cash Equivalents and net Current Assets 6.19
Portfolio Classification by Rating Class (%)
Face Value per unit: ` 10 unless otherwise specified, + Industry Classification as recommended by AMFI, Data is as of March 31, 2017 unless otherwise specified.
This product is suitable for investors who are seeking ~ riskometerl Capital appreciation over medium to long term.l Investment in debt and money market instruments as
well as equity and equity related instruments.
Investors understand that their principal will be at moderate risk~ Investors should consult their financial advisers if in doubt about whether the product is suitable for them.
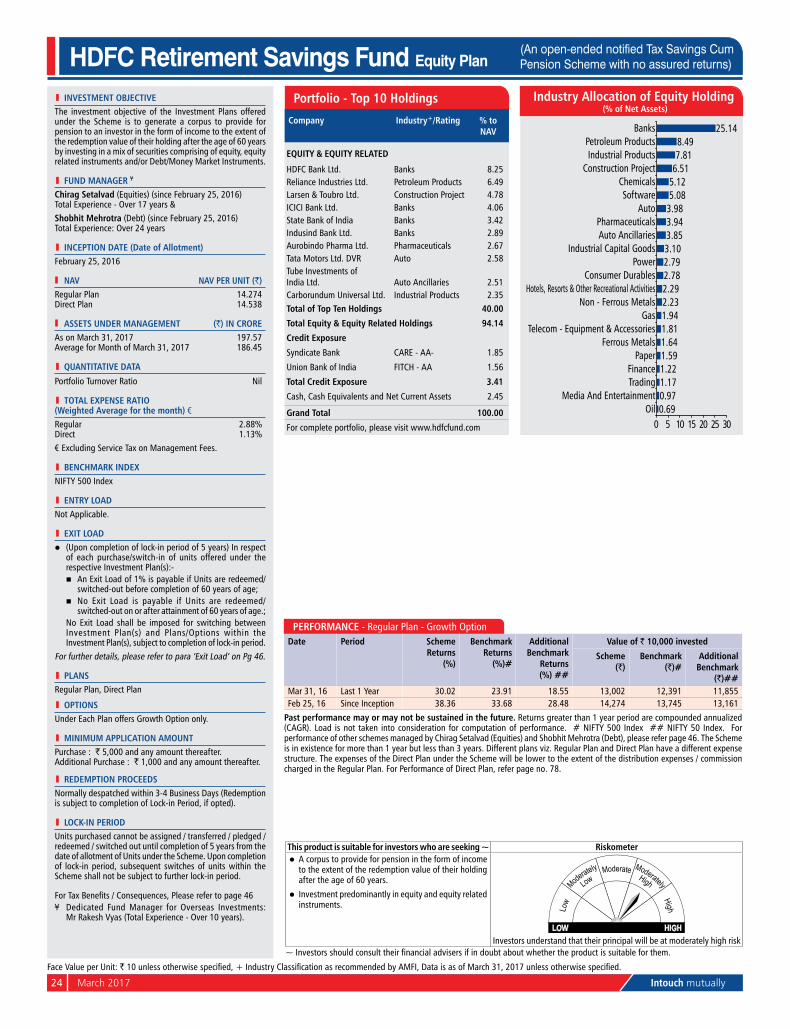
24 March 2017 Intouch mutually
l INvESTMENT OBjECTIvEThe investment objective of the Investment plans offered under the Scheme is to generate a corpus to provide for pension to an investor in the form of income to the extent of the redemption value of their holding after the age of 60 years by investing in a mix of securities comprising of equity, equity related instruments and/or Debt/Money Market Instruments.
l FuND MaNagEr ¥
Chirag Setalvad (Equities) (since February 25, 2016) Total Experience - over 17 years &Shobhit Mehrotra (Debt) (since February 25, 2016) Total Experience: over 24 years
l INCEpTION DaTE (Date of allotment)February 25, 2016
Nav Nav pEr uNIT (`)Regular plan 14.274Direct plan 14.538
aSSETS uNDEr MaNagEMENT (`) IN CrOrEAs on March 31, 2017 197.57Average for Month of March 31, 2017 186.45
l quaNTITaTIvE DaTa
portfolio Turnover Ratio nil
l TOTal ExpENSE raTIO (Weighted average for the month) €Regular 2.88%Direct 1.13%€ Excluding Service Tax on Management Fees.
l BENCHMarK INDExnIFTy 500 Index
l ENTrY lOaDnot Applicable.
l ExIT lOaDl (upon completion of lock-in period of 5 years) In respect
of each purchase/switch-in of units offered under the respective Investment plan(s):-
n An Exit load of 1% is payable if units are redeemed/switched-out before completion of 60 years of age;
n no Exit load is payable if units are redeemed/switched-out on or after attainment of 60 years of age.;
no Exit load shall be imposed for switching between Investment plan(s) and plans/options within the Investment plan(s), subject to completion of lock-in period.
For further details, please refer to para ‘Exit load’ on pg 46.
l plaNSRegular plan, Direct plan
l OpTIONSunder Each plan offers Growth option only.
l MINIMuM applICaTION aMOuNTpurchase : ` 5,000 and any amount thereafter.Additional purchase : ` 1,000 and any amount thereafter.
l rEDEMpTION prOCEEDSnormally despatched within 3-4 Business Days (Redemption is subject to completion of lock-in period, if opted).
l lOCK-IN pErIODunits purchased cannot be assigned / transferred / pledged / redeemed / switched out until completion of 5 years from the date of allotment of units under the Scheme. upon completion of lock-in period, subsequent switches of units within the Scheme shall not be subject to further lock-in period.
For Tax Benefits / Consequences, Please refer to page 46¥ Dedicated Fund Manager for overseas Investments:
Mr Rakesh Vyas (Total Experience - over 10 years).
Face Value per unit: ` 10 unless otherwise specified, + Industry Classification as recommended by AMFI, Data is as of March 31, 2017 unless otherwise specified.
This product is suitable for investors who are seeking ~ riskometerl A corpus to provide for pension in the form of income
to the extent of the redemption value of their holding after the age of 60 years.
l Investment predominantly in equity and equity related instruments.
Investors understand that their principal will be at moderately high risk~ Investors should consult their financial advisers if in doubt about whether the product is suitable for them.
HDFC Retirement Savings Fund Equity Plan(An open-ended notified Tax Savings Cum Pension Scheme with no assured returns)
Company Industry+/rating % to Nav
EquITY & EquITY rElaTED
HDFC Bank ltd. Banks 8.25Reliance Industries ltd. petroleum products 6.49larsen & Toubro ltd. Construction project 4.78ICICI Bank ltd. Banks 4.06State Bank of India Banks 3.42Indusind Bank ltd. Banks 2.89Aurobindo pharma ltd. pharmaceuticals 2.67Tata Motors ltd. DVR Auto 2.58Tube Investments ofIndia ltd. Auto Ancillaries 2.51Carborundum universal ltd. Industrial products 2.35Total of Top Ten Holdings 40.00
Total Equity & Equity related Holdings 94.14
Credit Exposure
Syndicate Bank CARE - AA- 1.85
union Bank of India FITCH - AA 1.56
Total Credit Exposure 3.41
Cash, Cash Equivalents and net Current Assets 2.45
grand Total 100.00
For complete portfolio, please visit www.hdfcfund.com
portfolio - Top 10 Holdings
0.690.971.171.221.591.641.811.942.232.292.782.793.103.853.943.985.085.126.517.818.49
25.14
0 5 10 15 20 25 30Oil
Media And EntertainmentTradingFinance
PaperFerrous Metals
Telecom - Equipment & AccessoriesGas
Non - Ferrous MetalsHotels, Resorts & Other Recreational Activities
Consumer DurablesPower
Industrial Capital GoodsAuto AncillariesPharmaceuticals
AutoSoftware
ChemicalsConstruction Project
Industrial ProductsPetroleum Products
Banks
Industry allocation of Equity Holding (% of Net assets)
pErFOrMaNCE - Regular plan - Growth optionDate period Scheme
returns (%)
Benchmark returns
(%)#
additional Benchmark
returns (%) ##
value of ` 10,000 invested
Scheme (`)
Benchmark (`)#
additional Benchmark
(`)##Mar 31, 16 last 1 year 30.02 23.91 18.55 13,002 12,391 11,855Feb 25, 16 Since Inception 38.36 33.68 28.48 14,274 13,745 13,161
past performance may or may not be sustained in the future. Returns greater than 1 year period are compounded annualized (CAGR). load is not taken into consideration for computation of performance. # nIFTy 500 Index ## nIFTy 50 Index. For performance of other schemes managed by Chirag Setalvad (Equities) and Shobhit Mehrotra (Debt), please refer page 46. The Scheme is in existence for more than 1 year but less than 3 years. Different plans viz. Regular plan and Direct plan have a different expense structure. The expenses of the Direct plan under the Scheme will be lower to the extent of the distribution expenses / commission charged in the Regular plan. For performance of Direct plan, refer page no. 78.
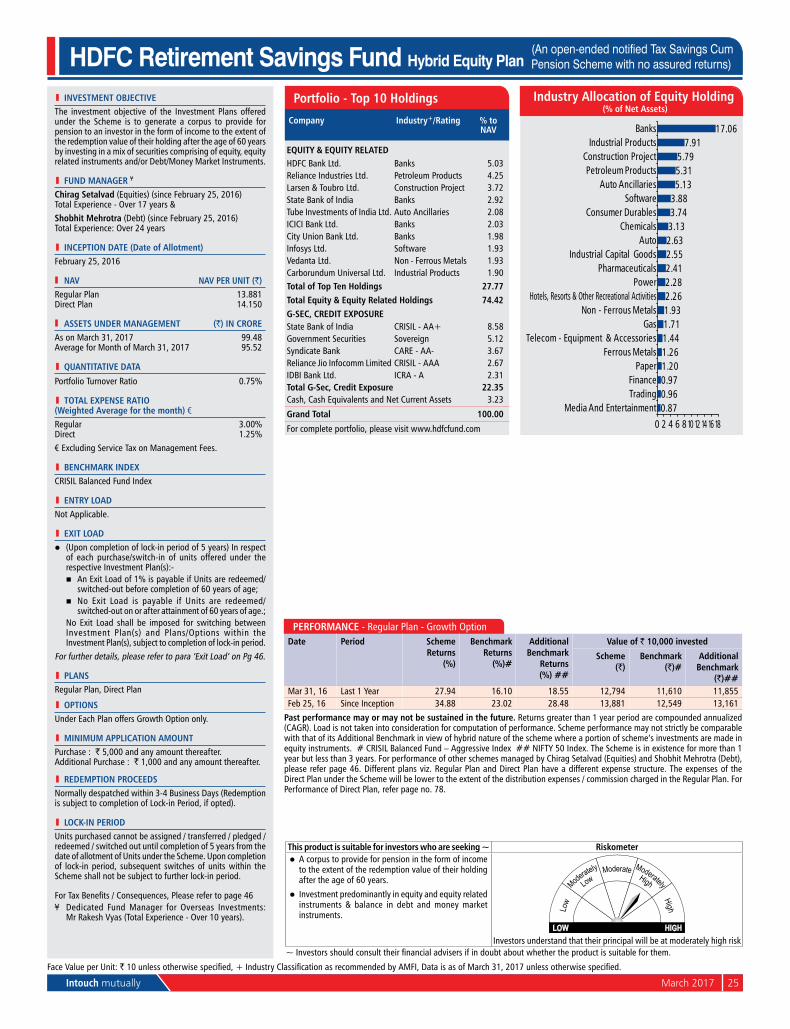
Intouch mutually March 2017 25
l INvESTMENT OBjECTIvEThe investment objective of the Investment plans offered under the Scheme is to generate a corpus to provide for pension to an investor in the form of income to the extent of the redemption value of their holding after the age of 60 years by investing in a mix of securities comprising of equity, equity related instruments and/or Debt/Money Market Instruments.
l FuND MaNagEr ¥
Chirag Setalvad (Equities) (since February 25, 2016) Total Experience - over 17 years &Shobhit Mehrotra (Debt) (since February 25, 2016) Total Experience: over 24 years
l INCEpTION DaTE (Date of allotment)February 25, 2016
Nav Nav pEr uNIT (`)Regular plan 13.881Direct plan 14.150
aSSETS uNDEr MaNagEMENT (`) IN CrOrEAs on March 31, 2017 99.48Average for Month of March 31, 2017 95.52
l quaNTITaTIvE DaTa
portfolio Turnover Ratio 0.75%
l TOTal ExpENSE raTIO (Weighted average for the month) €Regular 3.00%Direct 1.25%€ Excluding Service Tax on Management Fees.
l BENCHMarK INDExCRISIl Balanced Fund Index
l ENTrY lOaDnot Applicable.
l ExIT lOaDl (upon completion of lock-in period of 5 years) In respect
of each purchase/switch-in of units offered under the respective Investment plan(s):-
n An Exit load of 1% is payable if units are redeemed/switched-out before completion of 60 years of age;
n no Exit load is payable if units are redeemed/switched-out on or after attainment of 60 years of age.;
no Exit load shall be imposed for switching between Investment plan(s) and plans/options within the Investment plan(s), subject to completion of lock-in period.
For further details, please refer to para ‘Exit load’ on pg 46.
l plaNSRegular plan, Direct plan
l OpTIONSunder Each plan offers Growth option only.
l MINIMuM applICaTION aMOuNTpurchase : ` 5,000 and any amount thereafter.Additional purchase : ` 1,000 and any amount thereafter.
l rEDEMpTION prOCEEDSnormally despatched within 3-4 Business Days (Redemption is subject to completion of lock-in period, if opted).
l lOCK-IN pErIODunits purchased cannot be assigned / transferred / pledged / redeemed / switched out until completion of 5 years from the date of allotment of units under the Scheme. upon completion of lock-in period, subsequent switches of units within the Scheme shall not be subject to further lock-in period.
For Tax Benefits / Consequences, Please refer to page 46¥ Dedicated Fund Manager for overseas Investments:
Mr Rakesh Vyas (Total Experience - over 10 years).
Face Value per unit: ` 10 unless otherwise specified, + Industry Classification as recommended by AMFI, Data is as of March 31, 2017 unless otherwise specified.
This product is suitable for investors who are seeking ~ riskometerl A corpus to provide for pension in the form of income
to the extent of the redemption value of their holding after the age of 60 years.
l Investment predominantly in equity and equity related instruments & balance in debt and money market instruments.
Investors understand that their principal will be at moderately high risk~ Investors should consult their financial advisers if in doubt about whether the product is suitable for them.
HDFC Retirement Savings Fund Hybrid Equity Plan(An open-ended notified Tax Savings Cum Pension Scheme with no assured returns)
Company Industry+/rating % to Nav
EquITY & EquITY rElaTEDHDFC Bank ltd. Banks 5.03Reliance Industries ltd. petroleum products 4.25larsen & Toubro ltd. Construction project 3.72State Bank of India Banks 2.92Tube Investments of India ltd. Auto Ancillaries 2.08ICICI Bank ltd. Banks 2.03City union Bank ltd. Banks 1.98Infosys ltd. Software 1.93Vedanta ltd. non - Ferrous Metals 1.93Carborundum universal ltd. Industrial products 1.90Total of Top Ten Holdings 27.77Total Equity & Equity related Holdings 74.42g-SEC, CrEDIT ExpOSurEState Bank of India CRISIL - AA+ 8.58Government Securities Sovereign 5.12Syndicate Bank CARE - AA- 3.67Reliance Jio Infocomm limited CRISIl - AAA 2.67IDBI Bank ltd. ICRA - A 2.31Total g-Sec, Credit Exposure 22.35Cash, Cash Equivalents and net Current Assets 3.23
grand Total 100.00
For complete portfolio, please visit www.hdfcfund.com
portfolio - Top 10 Holdings
0.870.960.971.201.261.441.711.932.262.282.412.552.633.133.743.885.135.315.79
7.9117.06
0 2 4 6 8 10 12 14 16 18
Media And EntertainmentTradingFinance
PaperFerrous Metals
Telecom - Equipment & AccessoriesGas
Non - Ferrous MetalsHotels, Resorts & Other Recreational Activities
PowerPharmaceuticals
Industrial Capital GoodsAuto
ChemicalsConsumer Durables
SoftwareAuto Ancillaries
Petroleum ProductsConstruction Project
Industrial ProductsBanks
Industry allocation of Equity Holding (% of Net assets)
pErFOrMaNCE - Regular plan - Growth optionDate period Scheme
returns (%)
Benchmark returns
(%)#
additional Benchmark
returns (%) ##
value of ` 10,000 invested
Scheme (`)
Benchmark (`)#
additional Benchmark
(`)##Mar 31, 16 last 1 year 27.94 16.10 18.55 12,794 11,610 11,855Feb 25, 16 Since Inception 34.88 23.02 28.48 13,881 12,549 13,161
past performance may or may not be sustained in the future. Returns greater than 1 year period are compounded annualized (CAGR). load is not taken into consideration for computation of performance. Scheme performance may not strictly be comparable with that of its Additional Benchmark in view of hybrid nature of the scheme where a portion of scheme’s investments are made in equity instruments. # CRISIl Balanced Fund – Aggressive Index ## nIFTy 50 Index. The Scheme is in existence for more than 1 year but less than 3 years. For performance of other schemes managed by Chirag Setalvad (Equities) and Shobhit Mehrotra (Debt), please refer page 46. Different plans viz. Regular plan and Direct plan have a different expense structure. The expenses of the Direct plan under the Scheme will be lower to the extent of the distribution expenses / commission charged in the Regular plan. For performance of Direct plan, refer page no. 78.
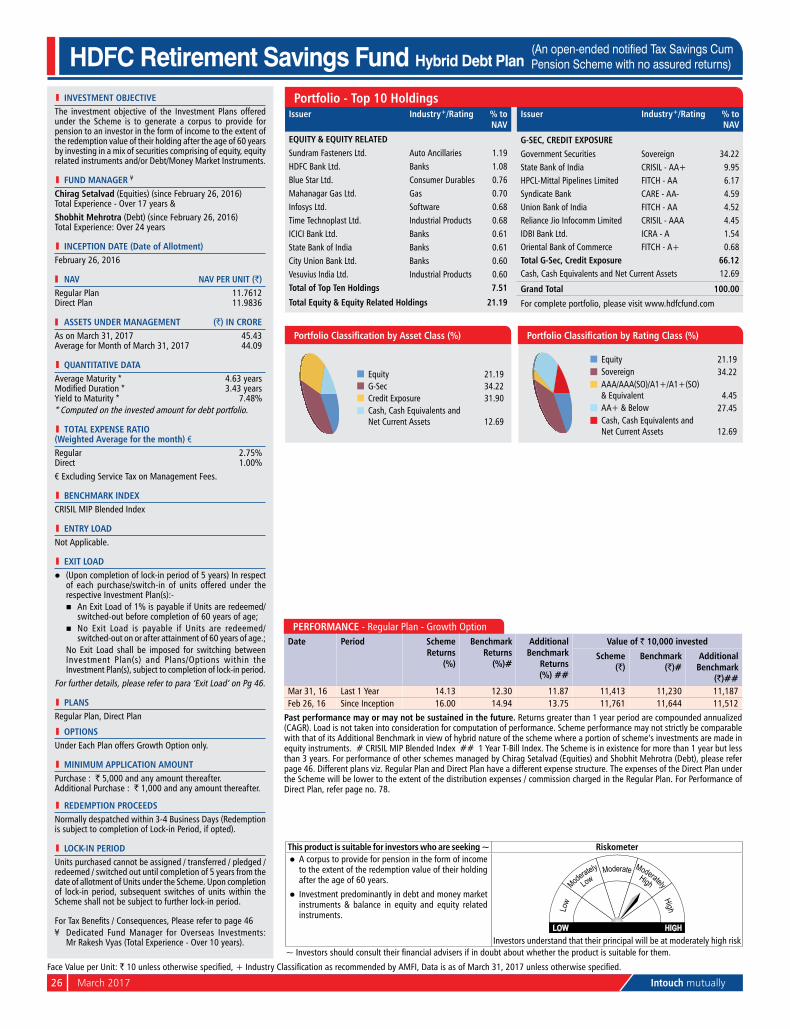
26 March 2017 Intouch mutually
l INvESTMENT OBjECTIvEThe investment objective of the Investment plans offered under the Scheme is to generate a corpus to provide for pension to an investor in the form of income to the extent of the redemption value of their holding after the age of 60 years by investing in a mix of securities comprising of equity, equity related instruments and/or Debt/Money Market Instruments.
l FuND MaNagEr ¥
Chirag Setalvad (Equities) (since February 26, 2016) Total Experience - over 17 years &Shobhit Mehrotra (Debt) (since February 26, 2016) Total Experience: over 24 years
l INCEpTION DaTE (Date of allotment)February 26, 2016
Nav Nav pEr uNIT (`)Regular plan 11.7612Direct plan 11.9836
aSSETS uNDEr MaNagEMENT (`) IN CrOrEAs on March 31, 2017 45.43Average for Month of March 31, 2017 44.09
l quaNTITaTIvE DaTaAverage Maturity * 4.63 yearsModified Duration * 3.43 yearsyield to Maturity * 7.48%* Computed on the invested amount for debt portfolio.
l TOTal ExpENSE raTIO (Weighted average for the month) €Regular 2.75%Direct 1.00%€ Excluding Service Tax on Management Fees.
l BENCHMarK INDExCRISIl MIp Blended Index
l ENTrY lOaDnot Applicable.
l ExIT lOaDl (upon completion of lock-in period of 5 years) In respect
of each purchase/switch-in of units offered under the respective Investment plan(s):-
n An Exit load of 1% is payable if units are redeemed/switched-out before completion of 60 years of age;
n no Exit load is payable if units are redeemed/switched-out on or after attainment of 60 years of age.;
no Exit load shall be imposed for switching between Investment plan(s) and plans/options within the Investment plan(s), subject to completion of lock-in period.
For further details, please refer to para ‘Exit load’ on pg 46.
l plaNSRegular plan, Direct plan
l OpTIONSunder Each plan offers Growth option only.
l MINIMuM applICaTION aMOuNTpurchase : ` 5,000 and any amount thereafter.Additional purchase : ` 1,000 and any amount thereafter.
l rEDEMpTION prOCEEDSnormally despatched within 3-4 Business Days (Redemption is subject to completion of lock-in period, if opted).
l lOCK-IN pErIODunits purchased cannot be assigned / transferred / pledged / redeemed / switched out until completion of 5 years from the date of allotment of units under the Scheme. upon completion of lock-in period, subsequent switches of units within the Scheme shall not be subject to further lock-in period.
For Tax Benefits / Consequences, Please refer to page 46¥ Dedicated Fund Manager for overseas Investments:
Mr Rakesh Vyas (Total Experience - over 10 years).
portfolio - Top 10 HoldingsIssuer Industry+/rating % to
Nav
EquITY & EquITY rElaTEDSundram Fasteners ltd. Auto Ancillaries 1.19HDFC Bank ltd. Banks 1.08Blue Star ltd. Consumer Durables 0.76Mahanagar Gas ltd. Gas 0.70Infosys ltd. Software 0.68Time Technoplast ltd. Industrial products 0.68ICICI Bank ltd. Banks 0.61State Bank of India Banks 0.61City union Bank ltd. Banks 0.60Vesuvius India ltd. Industrial products 0.60Total of Top Ten Holdings 7.51
Total Equity & Equity related Holdings 21.19
Issuer Industry+/rating % to Nav
g-SEC, CrEDIT ExpOSurEGovernment Securities Sovereign 34.22State Bank of India CRISIL - AA+ 9.95HpCl-Mittal pipelines limited FITCH - AA 6.17Syndicate Bank CARE - AA- 4.59union Bank of India FITCH - AA 4.52Reliance Jio Infocomm limited CRISIl - AAA 4.45IDBI Bank ltd. ICRA - A 1.54oriental Bank of Commerce FITCH - A+ 0.68Total g-Sec, Credit Exposure 66.12Cash, Cash Equivalents and net Current Assets 12.69
grand Total 100.00
For complete portfolio, please visit www.hdfcfund.com
Equity 21.19G-Sec 34.22Credit Exposure 31.90Cash, Cash Equivalents and net Current Assets 12.69
Portfolio Classification by Asset Class (%)
Equity 21.19Sovereign 34.22AAA/AAA(SO)/A1+/A1+(SO) & Equivalent 4.45AA+ & Below 27.45Cash, Cash Equivalents and net Current Assets 12.69
Portfolio Classification by Rating Class (%)
Face Value per unit: ` 10 unless otherwise specified, + Industry Classification as recommended by AMFI, Data is as of March 31, 2017 unless otherwise specified.
This product is suitable for investors who are seeking ~ riskometerl A corpus to provide for pension in the form of income
to the extent of the redemption value of their holding after the age of 60 years.
l Investment predominantly in debt and money market instruments & balance in equity and equity related instruments.
Investors understand that their principal will be at moderately high risk~ Investors should consult their financial advisers if in doubt about whether the product is suitable for them.
HDFC Retirement Savings Fund Hybrid Debt Plan(An open-ended notified Tax Savings Cum Pension Scheme with no assured returns)
pErFOrMaNCE - Regular plan - Growth optionDate period Scheme
returns (%)
Benchmark returns
(%)#
additional Benchmark
returns (%) ##
value of ` 10,000 invested
Scheme (`)
Benchmark (`)#
additional Benchmark
(`)##Mar 31, 16 last 1 year 14.13 12.30 11.87 11,413 11,230 11,187Feb 26, 16 Since Inception 16.00 14.94 13.75 11,761 11,644 11,512
past performance may or may not be sustained in the future. Returns greater than 1 year period are compounded annualized (CAGR). load is not taken into consideration for computation of performance. Scheme performance may not strictly be comparable with that of its Additional Benchmark in view of hybrid nature of the scheme where a portion of scheme’s investments are made in equity instruments. # CRISIl MIp Blended Index ## 1 year T-Bill Index. The Scheme is in existence for more than 1 year but less than 3 years. For performance of other schemes managed by Chirag Setalvad (Equities) and Shobhit Mehrotra (Debt), please refer page 46. Different plans viz. Regular plan and Direct plan have a different expense structure. The expenses of the Direct plan under the Scheme will be lower to the extent of the distribution expenses / commission charged in the Regular plan. For performance of Direct plan, refer page no. 78.
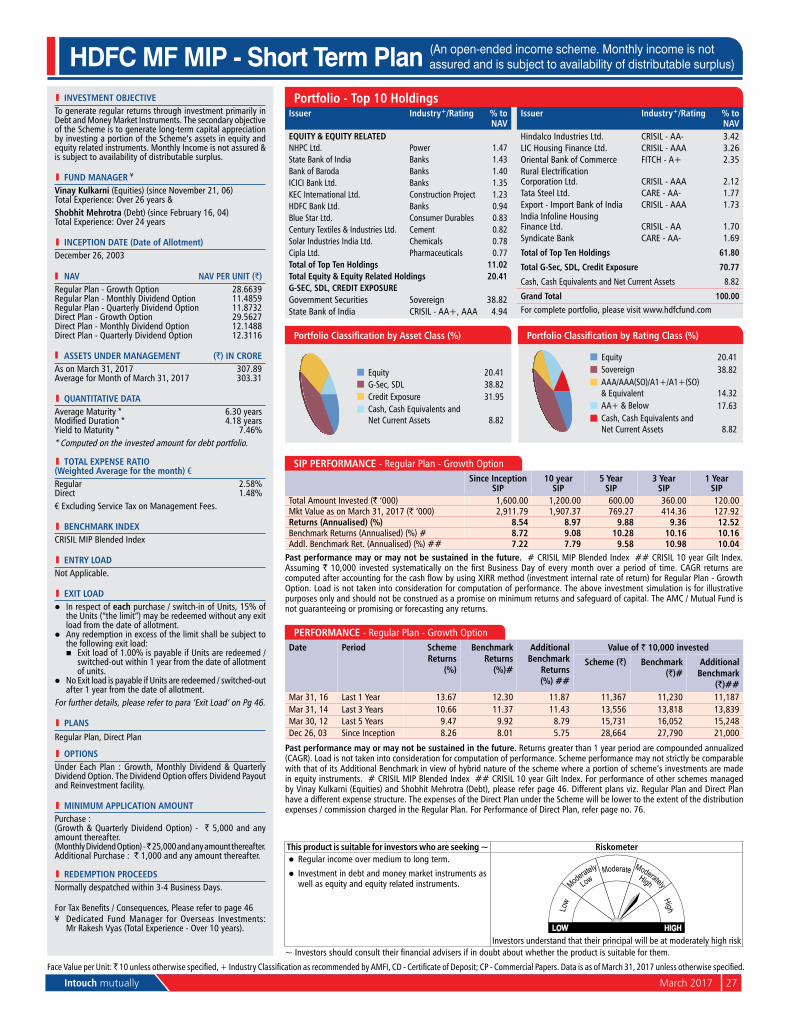
Intouch mutually March 2017 27
l INvESTMENT OBjECTIvETo generate regular returns through investment primarily in Debt and Money Market Instruments. The secondary objective of the Scheme is to generate long-term capital appreciation by investing a portion of the Scheme’s assets in equity and equity related instruments. Monthly Income is not assured & is subject to availability of distributable surplus.
l FuND MaNagEr ¥
vinay Kulkarni (Equities) (since november 21, 06) Total Experience: over 26 years &Shobhit Mehrotra (Debt) (since February 16, 04) Total Experience: over 24 years
l INCEpTION DaTE (Date of allotment)December 26, 2003
Nav Nav pEr uNIT (`)Regular plan - Growth option 28.6639Regular plan - Monthly Dividend option 11.4859Regular plan - quarterly Dividend option 11.8732Direct plan - Growth option 29.5627Direct plan - Monthly Dividend option 12.1488Direct plan - quarterly Dividend option 12.3116
aSSETS uNDEr MaNagEMENT (`) IN CrOrEAs on March 31, 2017 307.89Average for Month of March 31, 2017 303.31
l quaNTITaTIvE DaTaAverage Maturity * 6.30 yearsModified Duration * 4.18 yearsyield to Maturity * 7.46%* Computed on the invested amount for debt portfolio.
l TOTal ExpENSE raTIO (Weighted average for the month) €Regular 2.58%Direct 1.48%€ Excluding Service Tax on Management Fees.
l BENCHMarK INDExCRISIl MIp Blended Index
l ENTrY lOaDnot Applicable.
l ExIT lOaDl In respect of each purchase / switch-in of units, 15% of
the units (“the limit”) may be redeemed without any exit load from the date of allotment.
l Any redemption in excess of the limit shall be subject to the following exit load:
n Exit load of 1.00% is payable if units are redeemed / switched-out within 1 year from the date of allotment of units.
l no Exit load is payable if units are redeemed / switched-out after 1 year from the date of allotment.
For further details, please refer to para ‘Exit load’ on pg 46.
l plaNSRegular plan, Direct plan
l OpTIONSunder Each plan : Growth, Monthly Dividend & quarterly Dividend option. The Dividend option offers Dividend payout and Reinvestment facility.
l MINIMuM applICaTION aMOuNTpurchase :(Growth & quarterly Dividend option) - ` 5,000 and any amount thereafter.(Monthly Dividend option) - ̀ 25,000 and any amount thereafter.Additional purchase : ` 1,000 and any amount thereafter.
l rEDEMpTION prOCEEDSnormally despatched within 3-4 Business Days.
For Tax Benefits / Consequences, Please refer to page 46¥ Dedicated Fund Manager for overseas Investments:
Mr Rakesh Vyas (Total Experience - over 10 years).
This product is suitable for investors who are seeking ~ riskometerl Regular income over medium to long term.
l Investment in debt and money market instruments as well as equity and equity related instruments.
Investors understand that their principal will be at moderately high risk~ Investors should consult their financial advisers if in doubt about whether the product is suitable for them.
SIp pErFOrMaNCE - Regular plan - Growth optionSince Inception
SIp10 year
SIp5 Year
SIp3 Year
SIp1 Year
SIpTotal Amount Invested (` ‘000) 1,600.00 1,200.00 600.00 360.00 120.00Mkt Value as on March 31, 2017 (` ‘000) 2,911.79 1,907.37 769.27 414.36 127.92returns (annualised) (%) 8.54 8.97 9.88 9.36 12.52Benchmark Returns (Annualised) (%) # 8.72 9.08 10.28 10.16 10.16Addl. Benchmark Ret. (Annualised) (%) ## 7.22 7.79 9.58 10.98 10.04
past performance may or may not be sustained in the future. # CRISIl MIp Blended Index ## CRISIl 10 year Gilt Index. Assuming ` 10,000 invested systematically on the first Business Day of every month over a period of time. CAGR returns are computed after accounting for the cash flow by using XIRR method (investment internal rate of return) for Regular Plan - Growth option. load is not taken into consideration for computation of performance. The above investment simulation is for illustrative purposes only and should not be construed as a promise on minimum returns and safeguard of capital. The AMC / Mutual Fund is not guaranteeing or promising or forecasting any returns.
portfolio - Top 10 Holdings
HDFC MF MIP - Short Term Plan (An open-ended income scheme. Monthly income is not assured and is subject to availability of distributable surplus)
pErFOrMaNCE - Regular plan - Growth optionDate period Scheme
returns (%)
Benchmark returns
(%)#
additional Benchmark
returns (%) ##
value of ` 10,000 invested
Scheme (`) Benchmark (`)#
additional Benchmark
(`)##Mar 31, 16 last 1 year 13.67 12.30 11.87 11,367 11,230 11,187Mar 31, 14 last 3 years 10.66 11.37 11.43 13,556 13,818 13,839Mar 30, 12 last 5 years 9.47 9.92 8.79 15,731 16,052 15,248Dec 26, 03 Since Inception 8.26 8.01 5.75 28,664 27,790 21,000
past performance may or may not be sustained in the future. Returns greater than 1 year period are compounded annualized (CAGR). load is not taken into consideration for computation of performance. Scheme performance may not strictly be comparable with that of its Additional Benchmark in view of hybrid nature of the scheme where a portion of scheme’s investments are made in equity instruments. # CRISIl MIp Blended Index ## CRISIl 10 year Gilt Index. For performance of other schemes managed by Vinay Kulkarni (Equities) and Shobhit Mehrotra (Debt), please refer page 46. Different plans viz. Regular plan and Direct plan have a different expense structure. The expenses of the Direct plan under the Scheme will be lower to the extent of the distribution expenses / commission charged in the Regular plan. For performance of Direct plan, refer page no. 76.
Equity 20.41G-Sec, SDl 38.82Credit Exposure 31.95Cash, Cash Equivalents and net Current Assets 8.82
Portfolio Classification by Asset Class (%)
Equity 20.41Sovereign 38.82AAA/AAA(SO)/A1+/A1+(SO) & Equivalent 14.32AA+ & Below 17.63Cash, Cash Equivalents and net Current Assets 8.82
Portfolio Classification by Rating Class (%)
Face Value per unit: ̀ 10 unless otherwise specified, + Industry Classification as recommended by AMFI, CD - Certificate of Deposit; CP - Commercial Papers. Data is as of March 31, 2017 unless otherwise specified.
Issuer Industry+/rating % to Nav
EquITY & EquITY rElaTEDnHpC ltd. power 1.47State Bank of India Banks 1.43Bank of Baroda Banks 1.40ICICI Bank ltd. Banks 1.35KEC International ltd. Construction project 1.23HDFC Bank ltd. Banks 0.94Blue Star ltd. Consumer Durables 0.83Century Textiles & Industries ltd. Cement 0.82Solar Industries India ltd. Chemicals 0.78Cipla ltd. pharmaceuticals 0.77Total of Top Ten Holdings 11.02Total Equity & Equity related Holdings 20.41g-SEC, SDl, CrEDIT ExpOSurEGovernment Securities Sovereign 38.82State Bank of India CRISIL - AA+, AAA 4.94
Issuer Industry+/rating % to Nav
Hindalco Industries ltd. CRISIl - AA- 3.42lIC Housing Finance ltd. CRISIl - AAA 3.26oriental Bank of Commerce FITCH - A+ 2.35Rural ElectrificationCorporation ltd. CRISIl - AAA 2.12Tata Steel ltd. CARE - AA- 1.77Export - Import Bank of India CRISIl - AAA 1.73India Infoline Housing Finance ltd. CRISIl - AA 1.70Syndicate Bank CARE - AA- 1.69
Total of Top Ten Holdings 61.80
Total g-Sec, SDl, Credit Exposure 70.77
Cash, Cash Equivalents and net Current Assets 8.82
grand Total 100.00For complete portfolio, please visit www.hdfcfund.com
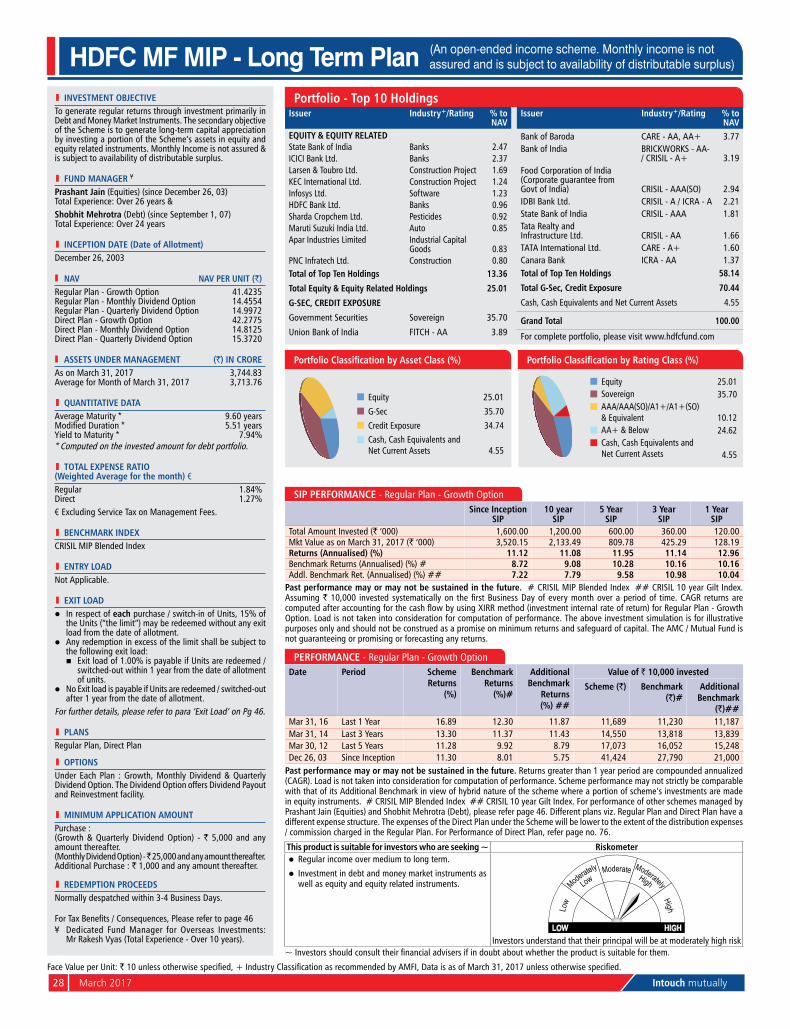
28 March 2017 Intouch mutually
l INvESTMENT OBjECTIvETo generate regular returns through investment primarily in Debt and Money Market Instruments. The secondary objective of the Scheme is to generate long-term capital appreciation by investing a portion of the Scheme’s assets in equity and equity related instruments. Monthly Income is not assured & is subject to availability of distributable surplus.
l FuND MaNagEr ¥
prashant jain (Equities) (since December 26, 03) Total Experience: over 26 years &Shobhit Mehrotra (Debt) (since September 1, 07) Total Experience: over 24 years
l INCEpTION DaTE (Date of allotment)December 26, 2003
Nav Nav pEr uNIT (`)Regular plan - Growth option 41.4235Regular plan - Monthly Dividend option 14.4554Regular plan - quarterly Dividend option 14.9972Direct plan - Growth option 42.2775Direct plan - Monthly Dividend option 14.8125Direct plan - quarterly Dividend option 15.3720
aSSETS uNDEr MaNagEMENT (`) IN CrOrEAs on March 31, 2017 3,744.83Average for Month of March 31, 2017 3,713.76
l quaNTITaTIvE DaTaAverage Maturity * 9.60 yearsModified Duration * 5.51 yearsyield to Maturity * 7.94%* Computed on the invested amount for debt portfolio.
l TOTal ExpENSE raTIO (Weighted average for the month) €Regular 1.84%Direct 1.27%€ Excluding Service Tax on Management Fees.
l BENCHMarK INDExCRISIl MIp Blended Index
l ENTrY lOaDnot Applicable.
l ExIT lOaDl In respect of each purchase / switch-in of units, 15% of
the units (“the limit”) may be redeemed without any exit load from the date of allotment.
l Any redemption in excess of the limit shall be subject to the following exit load:
n Exit load of 1.00% is payable if units are redeemed / switched-out within 1 year from the date of allotment of units.
l no Exit load is payable if units are redeemed / switched-out after 1 year from the date of allotment.
For further details, please refer to para ‘Exit load’ on pg 46.
l plaNSRegular plan, Direct plan
l OpTIONSunder Each plan : Growth, Monthly Dividend & quarterly Dividend option. The Dividend option offers Dividend payout and Reinvestment facility.
l MINIMuM applICaTION aMOuNTpurchase :(Growth & quarterly Dividend option) - ` 5,000 and any amount thereafter.(Monthly Dividend option) - ̀ 25,000 and any amount thereafter.Additional purchase : ` 1,000 and any amount thereafter.
l rEDEMpTION prOCEEDSnormally despatched within 3-4 Business Days.
For Tax Benefits / Consequences, Please refer to page 46¥ Dedicated Fund Manager for overseas Investments:
Mr Rakesh Vyas (Total Experience - over 10 years).
This product is suitable for investors who are seeking ~ riskometerl Regular income over medium to long term.
l Investment in debt and money market instruments as well as equity and equity related instruments.
Investors understand that their principal will be at moderately high risk~ Investors should consult their financial advisers if in doubt about whether the product is suitable for them.
SIp pErFOrMaNCE - Regular plan - Growth optionSince Inception
SIp10 year
SIp5 Year
SIp3 Year
SIp1 Year
SIpTotal Amount Invested (` ‘000) 1,600.00 1,200.00 600.00 360.00 120.00Mkt Value as on March 31, 2017 (` ‘000) 3,520.15 2,133.49 809.78 425.29 128.19returns (annualised) (%) 11.12 11.08 11.95 11.14 12.96Benchmark Returns (Annualised) (%) # 8.72 9.08 10.28 10.16 10.16Addl. Benchmark Ret. (Annualised) (%) ## 7.22 7.79 9.58 10.98 10.04
past performance may or may not be sustained in the future. # CRISIl MIp Blended Index ## CRISIl 10 year Gilt Index. Assuming ` 10,000 invested systematically on the first Business Day of every month over a period of time. CAGR returns are computed after accounting for the cash flow by using XIRR method (investment internal rate of return) for Regular Plan - Growth option. load is not taken into consideration for computation of performance. The above investment simulation is for illustrative purposes only and should not be construed as a promise on minimum returns and safeguard of capital. The AMC / Mutual Fund is not guaranteeing or promising or forecasting any returns.
portfolio - Top 10 Holdings
HDFC MF MIP - Long Term Plan (An open-ended income scheme. Monthly income is not assured and is subject to availability of distributable surplus)
pErFOrMaNCE - Regular plan - Growth optionDate period Scheme
returns (%)
Benchmark returns
(%)#
additional Benchmark
returns (%) ##
value of ` 10,000 invested
Scheme (`) Benchmark (`)#
additional Benchmark
(`)##Mar 31, 16 last 1 year 16.89 12.30 11.87 11,689 11,230 11,187Mar 31, 14 last 3 years 13.30 11.37 11.43 14,550 13,818 13,839Mar 30, 12 last 5 years 11.28 9.92 8.79 17,073 16,052 15,248Dec 26, 03 Since Inception 11.30 8.01 5.75 41,424 27,790 21,000
past performance may or may not be sustained in the future. Returns greater than 1 year period are compounded annualized (CAGR). load is not taken into consideration for computation of performance. Scheme performance may not strictly be comparable with that of its Additional Benchmark in view of hybrid nature of the scheme where a portion of scheme’s investments are made in equity instruments. # CRISIl MIp Blended Index ## CRISIl 10 year Gilt Index. For performance of other schemes managed by prashant Jain (Equities) and Shobhit Mehrotra (Debt), please refer page 46. Different plans viz. Regular plan and Direct plan have a different expense structure. The expenses of the Direct plan under the Scheme will be lower to the extent of the distribution expenses / commission charged in the Regular plan. For performance of Direct plan, refer page no. 76.
Equity 25.01Sovereign 35.70AAA/AAA(SO)/A1+/A1+(SO) & Equivalent 10.12AA+ & Below 24.62Cash, Cash Equivalents and net Current Assets 4.55
Portfolio Classification by Rating Class (%)
Face Value per unit: ` 10 unless otherwise specified, + Industry Classification as recommended by AMFI, Data is as of March 31, 2017 unless otherwise specified.
Equity 25.01
G-Sec 35.70
Credit Exposure 34.74Cash, Cash Equivalents and net Current Assets 4.55
Portfolio Classification by Asset Class (%)
Issuer Industry+/rating % to Nav
EquITY & EquITY rElaTEDState Bank of India Banks 2.47ICICI Bank ltd. Banks 2.37larsen & Toubro ltd. Construction project 1.69KEC International ltd. Construction project 1.24Infosys ltd. Software 1.23HDFC Bank ltd. Banks 0.96Sharda Cropchem ltd. pesticides 0.92Maruti Suzuki India ltd. Auto 0.85Apar Industries limited Industrial Capital
Goods 0.83pnC Infratech ltd. Construction 0.80Total of Top Ten Holdings 13.36
Total Equity & Equity related Holdings 25.01
g-SEC, CrEDIT ExpOSurE
Government Securities Sovereign 35.70
union Bank of India FITCH - AA 3.89
Issuer Industry+/rating % to Nav
Bank of Baroda CARE - AA, AA+ 3.77Bank of India BRICKWoRKS - AA-
/ CRISIL - A+ 3.19Food Corporation of India (Corporate guarantee fromGovt of India) CRISIl - AAA(So) 2.94IDBI Bank ltd. CRISIl - A / ICRA - A 2.21State Bank of India CRISIl - AAA 1.81Tata Realty andInfrastructure ltd. CRISIl - AA 1.66TATA International ltd. CARE - A+ 1.60Canara Bank ICRA - AA 1.37Total of Top Ten Holdings 58.14
Total g-Sec, Credit Exposure 70.44
Cash, Cash Equivalents and net Current Assets 4.55
grand Total 100.00
For complete portfolio, please visit www.hdfcfund.com
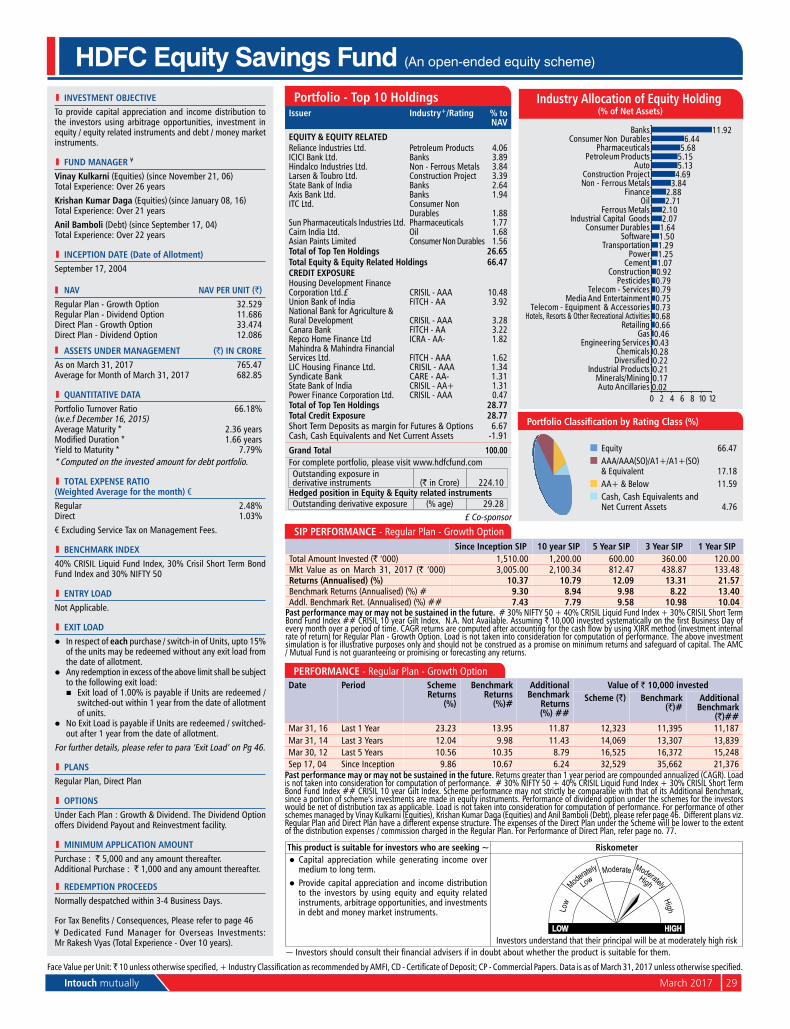
Intouch mutually March 2017 29
l INvESTMENT OBjECTIvETo provide capital appreciation and income distribution to the investors using arbitrage opportunities, investment in equity / equity related instruments and debt / money market instruments.
l FuND MaNagEr ¥
vinay Kulkarni (Equities) (since november 21, 06) Total Experience: over 26 years Krishan Kumar Daga (Equities) (since January 08, 16) Total Experience: over 21 yearsanil Bamboli (Debt) (since September 17, 04) Total Experience: over 22 years
l INCEpTION DaTE (Date of allotment)September 17, 2004
Nav Nav pEr uNIT (`)Regular plan - Growth option 32.529Regular plan - Dividend option 11.686Direct plan - Growth option 33.474Direct plan - Dividend option 12.086
aSSETS uNDEr MaNagEMENT (`) IN CrOrEAs on March 31, 2017 765.47Average for Month of March 31, 2017 682.85
l quaNTITaTIvE DaTaportfolio Turnover Ratio 66.18% (w.e.f December 16, 2015)Average Maturity * 2.36 yearsModified Duration * 1.66 yearsyield to Maturity * 7.79%* Computed on the invested amount for debt portfolio.
l TOTal ExpENSE raTIO (Weighted average for the month) €Regular 2.48%Direct 1.03%
€ Excluding Service Tax on Management Fees.
l BENCHMarK INDEx40% CRISIl liquid Fund Index, 30% Crisil Short Term Bond Fund Index and 30% nIFTy 50
l ENTrY lOaDnot Applicable.
l ExIT lOaDl In respect of each purchase / switch-in of units, upto 15%
of the units may be redeemed without any exit load from the date of allotment.
l Any redemption in excess of the above limit shall be subject to the following exit load:
n Exit load of 1.00% is payable if units are redeemed / switched-out within 1 year from the date of allotment of units.
l no Exit load is payable if units are redeemed / switched-out after 1 year from the date of allotment.
For further details, please refer to para ‘Exit load’ on pg 46.
l plaNSRegular plan, Direct plan
l OpTIONSunder Each plan : Growth & Dividend. The Dividend option offers Dividend payout and Reinvestment facility.
l MINIMuM applICaTION aMOuNTpurchase : ` 5,000 and any amount thereafter.Additional purchase : ` 1,000 and any amount thereafter.
l rEDEMpTION prOCEEDSnormally despatched within 3-4 Business Days.
For Tax Benefits / Consequences, Please refer to page 46¥ Dedicated Fund Manager for overseas Investments: Mr Rakesh Vyas (Total Experience - over 10 years).
Face Value per unit: ̀ 10 unless otherwise specified, + Industry Classification as recommended by AMFI, CD - Certificate of Deposit; CP - Commercial Papers. Data is as of March 31, 2017 unless otherwise specified.
HDFC Equity Savings Fund (An open-ended equity scheme)
portfolio - Top 10 HoldingsIssuer Industry+/rating % to
Nav
EquITY & EquITY rElaTEDReliance Industries ltd. petroleum products 4.06ICICI Bank ltd. Banks 3.89Hindalco Industries ltd. non - Ferrous Metals 3.84larsen & Toubro ltd. Construction project 3.39State Bank of India Banks 2.64Axis Bank ltd. Banks 1.94ITC ltd. Consumer non
Durables 1.88Sun pharmaceuticals Industries ltd. pharmaceuticals 1.77Cairn India ltd. oil 1.68Asian paints limited Consumer non Durables 1.56Total of Top Ten Holdings 26.65Total Equity & Equity related Holdings 66.47CrEDIT ExpOSurE Housing Development Finance Corporation ltd.£ CRISIl - AAA 10.48union Bank of India FITCH - AA 3.92national Bank for Agriculture & Rural Development CRISIl - AAA 3.28Canara Bank FITCH - AA 3.22Repco Home Finance ltd ICRA - AA- 1.82Mahindra & Mahindra Financial Services ltd. FITCH - AAA 1.62lIC Housing Finance ltd. CRISIl - AAA 1.34Syndicate Bank CARE - AA- 1.31State Bank of India CRISIL - AA+ 1.31power Finance Corporation ltd. CRISIl - AAA 0.47Total of Top Ten Holdings 28.77Total Credit Exposure 28.77Short Term Deposits as margin for Futures & options 6.67Cash, Cash Equivalents and net Current Assets -1.91
grand Total 100.00For complete portfolio, please visit www.hdfcfund.comoutstanding exposure in derivative instruments (` in Crore) 224.10
Hedged position in Equity & Equity related instrumentsoutstanding derivative exposure (% age) 29.28
£ Co-sponsor
This product is suitable for investors who are seeking ~ riskometerl Capital appreciation while generating income over
medium to long term.l provide capital appreciation and income distribution
to the investors by using equity and equity related instruments, arbitrage opportunities, and investments in debt and money market instruments.
Investors understand that their principal will be at moderately high risk~ Investors should consult their financial advisers if in doubt about whether the product is suitable for them.
SIp pErFOrMaNCE - Regular plan - Growth optionSince Inception SIp 10 year SIp 5 Year SIp 3 Year SIp 1 Year SIp
Total Amount Invested (` ‘000) 1,510.00 1,200.00 600.00 360.00 120.00Mkt Value as on March 31, 2017 (` ‘000) 3,005.00 2,100.34 812.47 438.87 133.48returns (annualised) (%) 10.37 10.79 12.09 13.31 21.57Benchmark Returns (Annualised) (%) # 9.30 8.94 9.98 8.22 13.40Addl. Benchmark Ret. (Annualised) (%) ## 7.43 7.79 9.58 10.98 10.04
past performance may or may not be sustained in the future. # 30% NIFTY 50 + 40% CRISIL Liquid Fund Index + 30% CRISIL Short Term Bond Fund Index ## CRISIl 10 year Gilt Index. n.A. not Available. Assuming ` 10,000 invested systematically on the first Business Day of every month over a period of time. CAGR returns are computed after accounting for the cash flow by using XIRR method (investment internal rate of return) for Regular plan - Growth option. load is not taken into consideration for computation of performance. The above investment simulation is for illustrative purposes only and should not be construed as a promise on minimum returns and safeguard of capital. The AMC / Mutual Fund is not guaranteeing or promising or forecasting any returns.
pErFOrMaNCE - Regular plan - Growth optionDate period Scheme
returns (%)
Benchmark returns
(%)#
additional Benchmark
returns (%) ##
value of ` 10,000 investedScheme (`) Benchmark
(`)#additional
Benchmark (`)##
Mar 31, 16 last 1 year 23.23 13.95 11.87 12,323 11,395 11,187Mar 31, 14 last 3 years 12.04 9.98 11.43 14,069 13,307 13,839Mar 30, 12 last 5 years 10.56 10.35 8.79 16,525 16,372 15,248Sep 17, 04 Since Inception 9.86 10.67 6.24 32,529 35,662 21,376
past performance may or may not be sustained in the future. Returns greater than 1 year period are compounded annualized (CAGR). load is not taken into consideration for computation of performance. # 30% NIFTY 50 + 40% CRISIL Liquid Fund Index + 30% CRISIL Short Term Bond Fund Index ## CRISIl 10 year Gilt Index. Scheme performance may not strictly be comparable with that of its Additional Benchmark, since a portion of scheme’s investments are made in equity instruments. performance of dividend option under the schemes for the investors would be net of distribution tax as applicable. load is not taken into consideration for computation of performance. For performance of other schemes managed by Vinay Kulkarni (Equities), Krishan Kumar Daga (Equities) and Anil Bamboli (Debt), please refer page 46. Different plans viz. Regular plan and Direct plan have a different expense structure. The expenses of the Direct plan under the Scheme will be lower to the extent of the distribution expenses / commission charged in the Regular plan. For performance of Direct plan, refer page no. 77.
Industry allocation of Equity Holding (% of Net assets)
0.020.170.210.220.280.430.460.660.680.730.750.790.790.921.071.251.291.501.642.072.102.712.88
3.844.695.135.155.686.44
11.92
0 2 4 6 8 10 12Auto AncillariesMinerals/Mining
Industrial ProductsDiversifiedChemicals
Engineering ServicesGas
RetailingHotels, Resorts & Other Recreational Activities
Telecom - Equipment & AccessoriesMedia And Entertainment
Telecom - ServicesPesticides
ConstructionCement
PowerTransportation
SoftwareConsumer Durables
Industrial Capital GoodsFerrous Metals
OilFinance
Non - Ferrous MetalsConstruction Project
AutoPetroleum Products
PharmaceuticalsConsumer Non Durables
Banks
Equity 66.47AAA/AAA(SO)/A1+/A1+(SO) & Equivalent 17.18AA+ & Below 11.59Cash, Cash Equivalents and net Current Assets 4.76
Portfolio Classification by Rating Class (%)
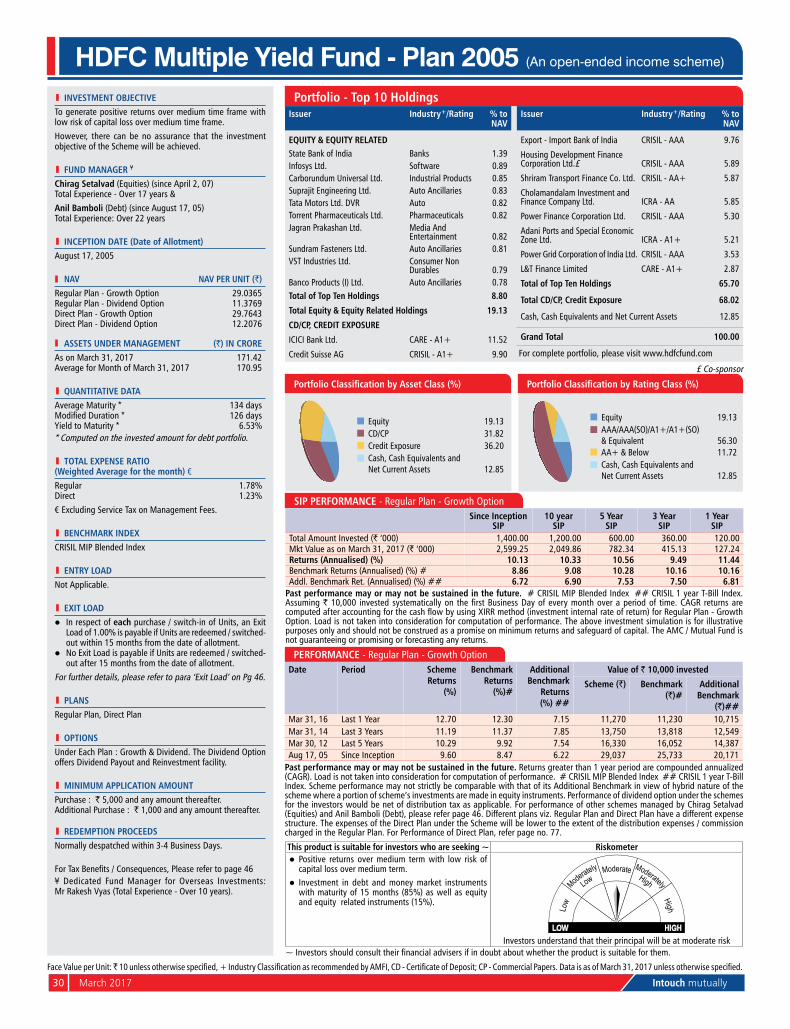
30 March 2017 Intouch mutually
HDFC Multiple Yield Fund - Plan 2005 (An open-ended income scheme)
This product is suitable for investors who are seeking ~ riskometerl positive returns over medium term with low risk of
capital loss over medium term.l Investment in debt and money market instruments
with maturity of 15 months (85%) as well as equity and equity related instruments (15%).
Investors understand that their principal will be at moderate risk~ Investors should consult their financial advisers if in doubt about whether the product is suitable for them.
SIp pErFOrMaNCE - Regular plan - Growth optionSince Inception
SIp10 year
SIp5 Year
SIp3 Year
SIp1 Year
SIpTotal Amount Invested (` ‘000) 1,400.00 1,200.00 600.00 360.00 120.00Mkt Value as on March 31, 2017 (` ‘000) 2,599.25 2,049.86 782.34 415.13 127.24returns (annualised) (%) 10.13 10.33 10.56 9.49 11.44Benchmark Returns (Annualised) (%) # 8.86 9.08 10.28 10.16 10.16Addl. Benchmark Ret. (Annualised) (%) ## 6.72 6.90 7.53 7.50 6.81
past performance may or may not be sustained in the future. # CRISIl MIp Blended Index ## CRISIl 1 year T-Bill Index. Assuming ` 10,000 invested systematically on the first Business Day of every month over a period of time. CAGR returns are computed after accounting for the cash flow by using XIRR method (investment internal rate of return) for Regular Plan - Growth option. load is not taken into consideration for computation of performance. The above investment simulation is for illustrative purposes only and should not be construed as a promise on minimum returns and safeguard of capital. The AMC / Mutual Fund is not guaranteeing or promising or forecasting any returns.
l INvESTMENT OBjECTIvETo generate positive returns over medium time frame with low risk of capital loss over medium time frame.However, there can be no assurance that the investment objective of the Scheme will be achieved.
l FuND MaNagEr ¥
Chirag Setalvad (Equities) (since April 2, 07) Total Experience - over 17 years &anil Bamboli (Debt) (since August 17, 05) Total Experience: over 22 years
l INCEpTION DaTE (Date of allotment)August 17, 2005
Nav Nav pEr uNIT (`)Regular plan - Growth option 29.0365Regular plan - Dividend option 11.3769Direct plan - Growth option 29.7643Direct plan - Dividend option 12.2076
aSSETS uNDEr MaNagEMENT (`) IN CrOrEAs on March 31, 2017 171.42Average for Month of March 31, 2017 170.95
l quaNTITaTIvE DaTaAverage Maturity * 134 daysModified Duration * 126 daysyield to Maturity * 6.53%* Computed on the invested amount for debt portfolio.
l TOTal ExpENSE raTIO (Weighted average for the month) €Regular 1.78%Direct 1.23%
€ Excluding Service Tax on Management Fees.
l BENCHMarK INDExCRISIl MIp Blended Index
l ENTrY lOaDnot Applicable.
l ExIT lOaDl In respect of each purchase / switch-in of units, an Exit
load of 1.00% is payable if units are redeemed / switched-out within 15 months from the date of allotment.
l no Exit load is payable if units are redeemed / switched-out after 15 months from the date of allotment.
For further details, please refer to para ‘Exit load’ on pg 46.
l plaNSRegular plan, Direct plan
l OpTIONSunder Each plan : Growth & Dividend. The Dividend option offers Dividend payout and Reinvestment facility.
l MINIMuM applICaTION aMOuNTpurchase : ` 5,000 and any amount thereafter.Additional purchase : ` 1,000 and any amount thereafter.
l rEDEMpTION prOCEEDSnormally despatched within 3-4 Business Days.
For Tax Benefits / Consequences, Please refer to page 46¥ Dedicated Fund Manager for overseas Investments: Mr Rakesh Vyas (Total Experience - over 10 years).
pErFOrMaNCE - Regular plan - Growth optionDate period Scheme
returns (%)
Benchmark returns
(%)#
additional Benchmark
returns (%) ##
value of ` 10,000 invested
Scheme (`) Benchmark (`)#
additional Benchmark
(`)##Mar 31, 16 last 1 year 12.70 12.30 7.15 11,270 11,230 10,715Mar 31, 14 last 3 years 11.19 11.37 7.85 13,750 13,818 12,549Mar 30, 12 last 5 years 10.29 9.92 7.54 16,330 16,052 14,387Aug 17, 05 Since Inception 9.60 8.47 6.22 29,037 25,733 20,171
past performance may or may not be sustained in the future. Returns greater than 1 year period are compounded annualized (CAGR). load is not taken into consideration for computation of performance. # CRISIl MIp Blended Index ## CRISIl 1 year T-Bill Index. Scheme performance may not strictly be comparable with that of its Additional Benchmark in view of hybrid nature of the scheme where a portion of scheme’s investments are made in equity instruments. performance of dividend option under the schemes for the investors would be net of distribution tax as applicable. For performance of other schemes managed by Chirag Setalvad (Equities) and Anil Bamboli (Debt), please refer page 46. Different plans viz. Regular plan and Direct plan have a different expense structure. The expenses of the Direct plan under the Scheme will be lower to the extent of the distribution expenses / commission charged in the Regular plan. For performance of Direct plan, refer page no. 77.
Equity 19.13CD/Cp 31.82Credit Exposure 36.20Cash, Cash Equivalents and net Current Assets 12.85
Portfolio Classification by Asset Class (%)
Equity 19.13AAA/AAA(SO)/A1+/A1+(SO) & Equivalent 56.30AA+ & Below 11.72Cash, Cash Equivalents and net Current Assets 12.85
Portfolio Classification by Rating Class (%)
portfolio - Top 10 HoldingsIssuer Industry+/rating % to
Nav
EquITY & EquITY rElaTEDState Bank of India Banks 1.39Infosys ltd. Software 0.89Carborundum universal ltd. Industrial products 0.85Suprajit Engineering ltd. Auto Ancillaries 0.83Tata Motors ltd. DVR Auto 0.82Torrent pharmaceuticals ltd. pharmaceuticals 0.82Jagran prakashan ltd. Media And
Entertainment 0.82Sundram Fasteners ltd. Auto Ancillaries 0.81VST Industries ltd. Consumer non
Durables 0.79Banco products (I) ltd. Auto Ancillaries 0.78Total of Top Ten Holdings 8.80
Total Equity & Equity related Holdings 19.13
CD/Cp, CrEDIT ExpOSurE
ICICI Bank ltd. CARE - A1+ 11.52
Credit Suisse AG CRISIL - A1+ 9.90
Issuer Industry+/rating % to Nav
Export - Import Bank of India CRISIl - AAA 9.76
Housing Development Finance Corporation ltd.£ CRISIl - AAA 5.89
Shriram Transport Finance Co. ltd. CRISIL - AA+ 5.87
Cholamandalam Investment and Finance Company ltd. ICRA - AA 5.85
power Finance Corporation ltd. CRISIl - AAA 5.30
Adani ports and Special Economic Zone ltd. ICRA - A1+ 5.21
power Grid Corporation of India ltd. CRISIl - AAA 3.53
l&T Finance limited CARE - A1+ 2.87
Total of Top Ten Holdings 65.70
Total CD/Cp, Credit Exposure 68.02
Cash, Cash Equivalents and net Current Assets 12.85
grand Total 100.00
For complete portfolio, please visit www.hdfcfund.com
£ Co-sponsor
Face Value per unit: ̀ 10 unless otherwise specified, + Industry Classification as recommended by AMFI, CD - Certificate of Deposit; CP - Commercial Papers. Data is as of March 31, 2017 unless otherwise specified.
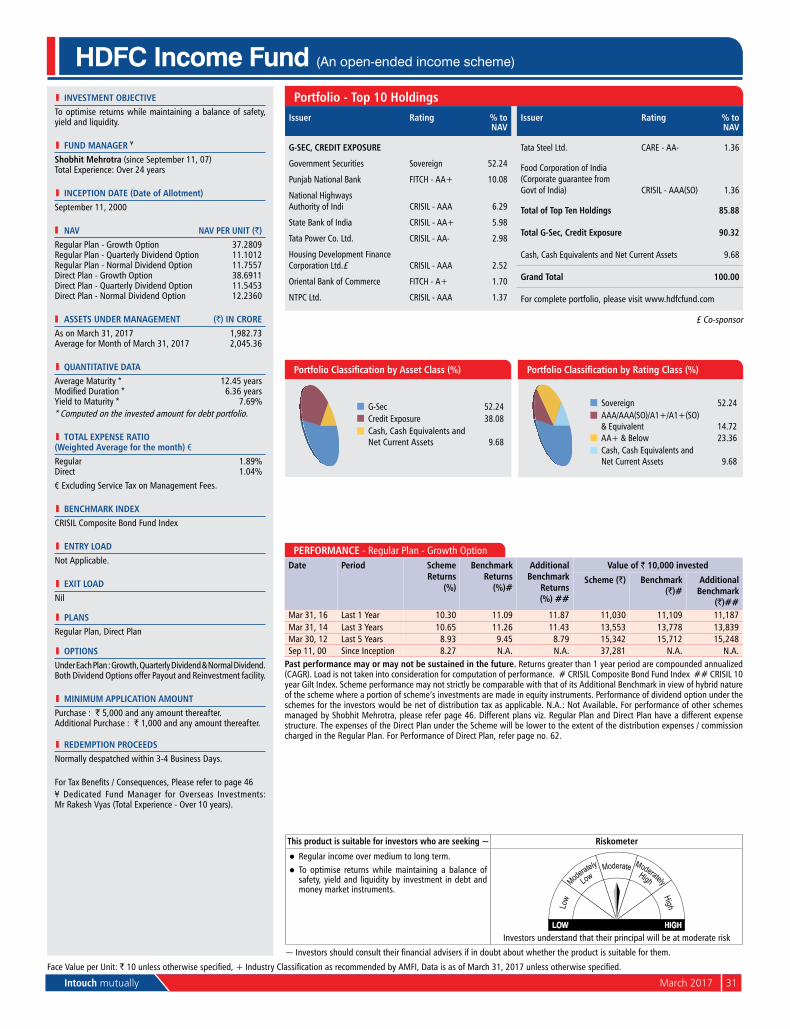
Intouch mutually March 2017 31
HDFC Income Fund (An open-ended income scheme)
portfolio - Top 10 HoldingsIssuer rating % to
Nav
g-SEC, CrEDIT ExpOSurE
Government Securities Sovereign 52.24
punjab national Bank FITCH - AA+ 10.08
national HighwaysAuthority of Indi CRISIl - AAA 6.29
State Bank of India CRISIL - AA+ 5.98
Tata power Co. ltd. CRISIl - AA- 2.98
Housing Development Finance Corporation ltd.£ CRISIl - AAA 2.52
oriental Bank of Commerce FITCH - A+ 1.70
nTpC ltd. CRISIl - AAA 1.37
Issuer rating % to Nav
Tata Steel ltd. CARE - AA- 1.36
Food Corporation of India (Corporate guarantee fromGovt of India) CRISIl - AAA(So) 1.36
Total of Top Ten Holdings 85.88
Total g-Sec, Credit Exposure 90.32
Cash, Cash Equivalents and net Current Assets 9.68
grand Total 100.00
For complete portfolio, please visit www.hdfcfund.com
This product is suitable for investors who are seeking ~ riskometer
l Regular income over medium to long term.l To optimise returns while maintaining a balance of
safety, yield and liquidity by investment in debt and money market instruments.
Investors understand that their principal will be at moderate risk
~ Investors should consult their financial advisers if in doubt about whether the product is suitable for them.
l INvESTMENT OBjECTIvETo optimise returns while maintaining a balance of safety, yield and liquidity.
l FuND MaNagEr ¥
Shobhit Mehrotra (since September 11, 07) Total Experience: over 24 years
l INCEpTION DaTE (Date of allotment)September 11, 2000
Nav Nav pEr uNIT (`)Regular plan - Growth option 37.2809Regular plan - quarterly Dividend option 11.1012Regular plan - normal Dividend option 11.7557Direct plan - Growth option 38.6911Direct plan - quarterly Dividend option 11.5453Direct plan - normal Dividend option 12.2360
aSSETS uNDEr MaNagEMENT (`) IN CrOrEAs on March 31, 2017 1,982.73Average for Month of March 31, 2017 2,045.36
l quaNTITaTIvE DaTaAverage Maturity * 12.45 yearsModified Duration * 6.36 yearsyield to Maturity * 7.69%* Computed on the invested amount for debt portfolio.
l TOTal ExpENSE raTIO (Weighted average for the month) €Regular 1.89%Direct 1.04%
€ Excluding Service Tax on Management Fees.
l BENCHMarK INDExCRISIl Composite Bond Fund Index
l ENTrY lOaDnot Applicable.
l ExIT lOaDnil
l plaNSRegular plan, Direct plan
l OpTIONSunder Each plan : Growth, quarterly Dividend & normal Dividend. Both Dividend options offer payout and Reinvestment facility.
l MINIMuM applICaTION aMOuNTpurchase : ` 5,000 and any amount thereafter.Additional purchase : ` 1,000 and any amount thereafter.
l rEDEMpTION prOCEEDSnormally despatched within 3-4 Business Days.
For Tax Benefits / Consequences, Please refer to page 46¥ Dedicated Fund Manager for overseas Investments: Mr Rakesh Vyas (Total Experience - over 10 years).
pErFOrMaNCE - Regular plan - Growth optionDate period Scheme
returns (%)
Benchmark returns
(%)#
additional Benchmark
returns (%) ##
value of ` 10,000 invested
Scheme (`) Benchmark (`)#
additional Benchmark
(`)##Mar 31, 16 last 1 year 10.30 11.09 11.87 11,030 11,109 11,187Mar 31, 14 last 3 years 10.65 11.26 11.43 13,553 13,778 13,839Mar 30, 12 last 5 years 8.93 9.45 8.79 15,342 15,712 15,248Sep 11, 00 Since Inception 8.27 n.A. n.A. 37,281 n.A. n.A.
past performance may or may not be sustained in the future. Returns greater than 1 year period are compounded annualized (CAGR). load is not taken into consideration for computation of performance. # CRISIl Composite Bond Fund Index ## CRISIl 10 year Gilt Index. Scheme performance may not strictly be comparable with that of its Additional Benchmark in view of hybrid nature of the scheme where a portion of scheme’s investments are made in equity instruments. performance of dividend option under the schemes for the investors would be net of distribution tax as applicable. n.A.: not Available. For performance of other schemes managed by Shobhit Mehrotra, please refer page 46. Different plans viz. Regular plan and Direct plan have a different expense structure. The expenses of the Direct plan under the Scheme will be lower to the extent of the distribution expenses / commission charged in the Regular plan. For performance of Direct plan, refer page no. 62.
G-Sec 52.24Credit Exposure 38.08Cash, Cash Equivalents and net Current Assets 9.68
Portfolio Classification by Asset Class (%)
Sovereign 52.24AAA/AAA(SO)/A1+/A1+(SO) & Equivalent 14.72AA+ & Below 23.36Cash, Cash Equivalents and net Current Assets 9.68
Portfolio Classification by Rating Class (%)
Face Value per unit: ` 10 unless otherwise specified, + Industry Classification as recommended by AMFI, Data is as of March 31, 2017 unless otherwise specified.
£ Co-sponsor
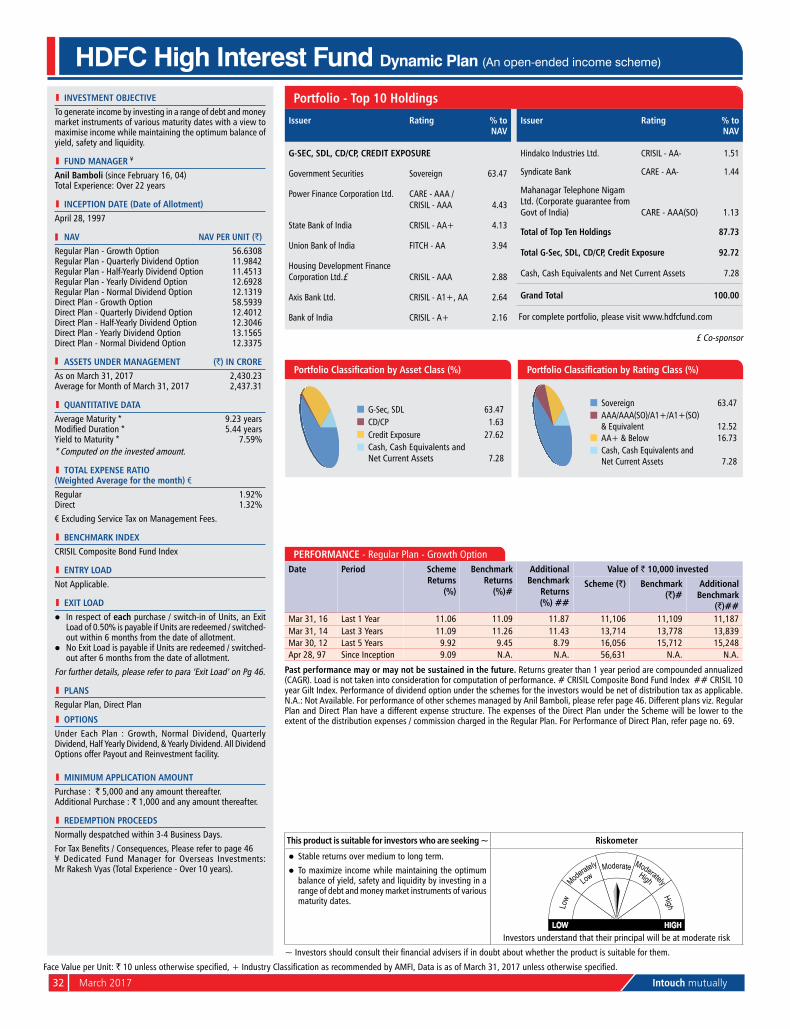
32 March 2017 Intouch mutually
l INvESTMENT OBjECTIvETo generate income by investing in a range of debt and money market instruments of various maturity dates with a view to maximise income while maintaining the optimum balance of yield, safety and liquidity.
l FuND MaNagEr ¥
anil Bamboli (since February 16, 04) Total Experience: over 22 years
l INCEpTION DaTE (Date of allotment)April 28, 1997
Nav Nav pEr uNIT (`)Regular plan - Growth option 56.6308Regular plan - quarterly Dividend option 11.9842Regular plan - Half-yearly Dividend option 11.4513Regular plan - yearly Dividend option 12.6928Regular plan - normal Dividend option 12.1319Direct plan - Growth option 58.5939Direct plan - quarterly Dividend option 12.4012Direct plan - Half-yearly Dividend option 12.3046Direct plan - yearly Dividend option 13.1565Direct plan - normal Dividend option 12.3375
aSSETS uNDEr MaNagEMENT (`) IN CrOrEAs on March 31, 2017 2,430.23Average for Month of March 31, 2017 2,437.31
l quaNTITaTIvE DaTaAverage Maturity * 9.23 yearsModified Duration * 5.44 yearsyield to Maturity * 7.59%* Computed on the invested amount.
l TOTal ExpENSE raTIO (Weighted average for the month) €Regular 1.92%Direct 1.32%
€ Excluding Service Tax on Management Fees.
l BENCHMarK INDExCRISIl Composite Bond Fund Index
l ENTrY lOaDnot Applicable.
l ExIT lOaDl In respect of each purchase / switch-in of units, an Exit
load of 0.50% is payable if units are redeemed / switched-out within 6 months from the date of allotment.
l no Exit load is payable if units are redeemed / switched-out after 6 months from the date of allotment.
For further details, please refer to para ‘Exit load’ on pg 46.
l plaNSRegular plan, Direct plan
l OpTIONSunder Each plan : Growth, normal Dividend, quarterly Dividend, Half yearly Dividend, & yearly Dividend. All Dividend options offer payout and Reinvestment facility.
l MINIMuM applICaTION aMOuNTpurchase : ` 5,000 and any amount thereafter. Additional purchase : ` 1,000 and any amount thereafter.
l rEDEMpTION prOCEEDSnormally despatched within 3-4 Business Days.For Tax Benefits / Consequences, Please refer to page 46¥ Dedicated Fund Manager for overseas Investments: Mr Rakesh Vyas (Total Experience - over 10 years).
HDFC High Interest Fund Dynamic Plan (An open-ended income scheme)
portfolio - Top 10 Holdings
Issuer rating % to Nav
g-SEC, SDl, CD/Cp, CrEDIT ExpOSurE
Government Securities Sovereign 63.47
power Finance Corporation ltd. CARE - AAA /CRISIl - AAA 4.43
State Bank of India CRISIL - AA+ 4.13
union Bank of India FITCH - AA 3.94
Housing Development Finance Corporation ltd.£ CRISIl - AAA 2.88
Axis Bank ltd. CRISIL - A1+, AA 2.64
Bank of India CRISIL - A+ 2.16
Issuer rating % to Nav
Hindalco Industries ltd. CRISIl - AA- 1.51
Syndicate Bank CARE - AA- 1.44
Mahanagar Telephone nigam ltd. (Corporate guarantee from Govt of India) CARE - AAA(So) 1.13
Total of Top Ten Holdings 87.73
Total g-Sec, SDl, CD/Cp, Credit Exposure 92.72
Cash, Cash Equivalents and net Current Assets 7.28
grand Total 100.00
For complete portfolio, please visit www.hdfcfund.com
This product is suitable for investors who are seeking ~ riskometer
l Stable returns over medium to long term.l To maximize income while maintaining the optimum
balance of yield, safety and liquidity by investing in a range of debt and money market instruments of various maturity dates.
Investors understand that their principal will be at moderate risk
~ Investors should consult their financial advisers if in doubt about whether the product is suitable for them.
G-Sec, SDl 63.47CD/Cp 1.63Credit Exposure 27.62Cash, Cash Equivalents and net Current Assets 7.28
Portfolio Classification by Asset Class (%)
Sovereign 63.47AAA/AAA(SO)/A1+/A1+(SO) & Equivalent 12.52AA+ & Below 16.73Cash, Cash Equivalents and net Current Assets 7.28
Portfolio Classification by Rating Class (%)
Face Value per unit: ` 10 unless otherwise specified, + Industry Classification as recommended by AMFI, Data is as of March 31, 2017 unless otherwise specified.
pErFOrMaNCE - Regular plan - Growth optionDate period Scheme
returns (%)
Benchmark returns
(%)#
additional Benchmark
returns (%) ##
value of ` 10,000 invested
Scheme (`) Benchmark (`)#
additional Benchmark
(`)##Mar 31, 16 last 1 year 11.06 11.09 11.87 11,106 11,109 11,187Mar 31, 14 last 3 years 11.09 11.26 11.43 13,714 13,778 13,839Mar 30, 12 last 5 years 9.92 9.45 8.79 16,056 15,712 15,248Apr 28, 97 Since Inception 9.09 n.A. n.A. 56,631 n.A. n.A.
past performance may or may not be sustained in the future. Returns greater than 1 year period are compounded annualized (CAGR). load is not taken into consideration for computation of performance. # CRISIl Composite Bond Fund Index ## CRISIl 10 year Gilt Index. performance of dividend option under the schemes for the investors would be net of distribution tax as applicable. n.A.: not Available. For performance of other schemes managed by Anil Bamboli, please refer page 46. Different plans viz. Regular plan and Direct plan have a different expense structure. The expenses of the Direct plan under the Scheme will be lower to the extent of the distribution expenses / commission charged in the Regular plan. For performance of Direct plan, refer page no. 69.
£ Co-sponsor
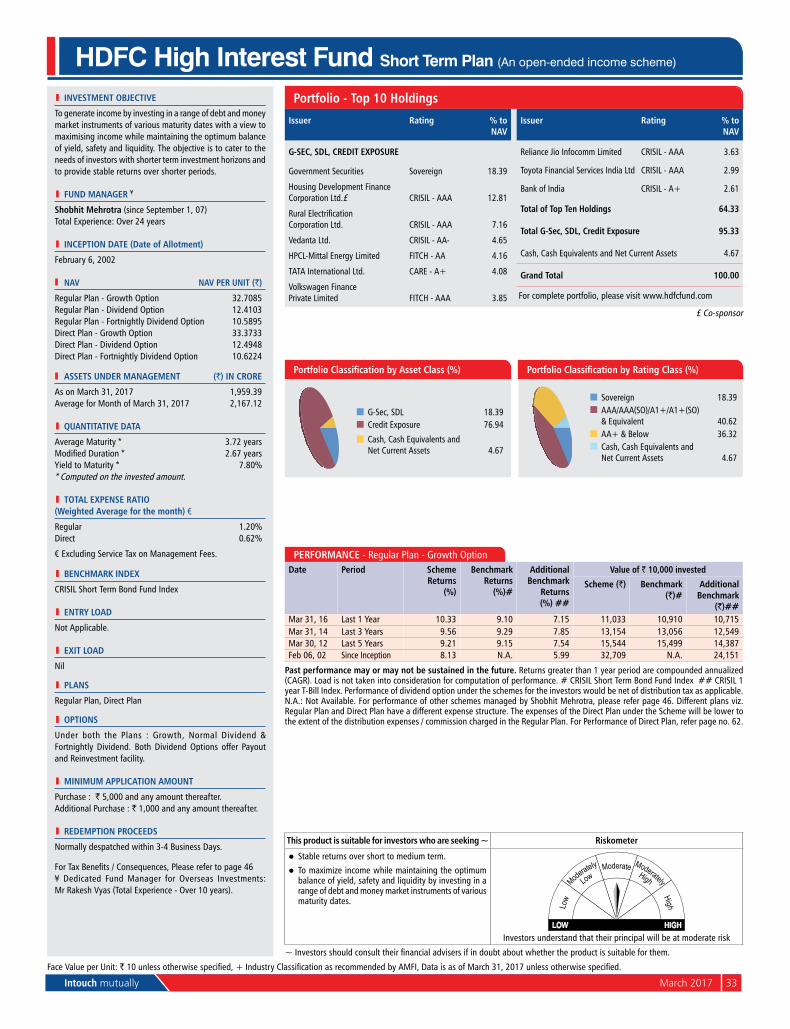
Intouch mutually March 2017 33
HDFC High Interest Fund Short Term Plan (An open-ended income scheme)
This product is suitable for investors who are seeking ~ riskometer
l Stable returns over short to medium term.l To maximize income while maintaining the optimum
balance of yield, safety and liquidity by investing in a range of debt and money market instruments of various maturity dates.
Investors understand that their principal will be at moderate risk
~ Investors should consult their financial advisers if in doubt about whether the product is suitable for them.
portfolio - Top 10 Holdings
Issuer rating % to Nav
g-SEC, SDl, CrEDIT ExpOSurE
Government Securities Sovereign 18.39
Housing Development Finance Corporation ltd.£ CRISIl - AAA 12.81
Rural ElectrificationCorporation ltd. CRISIl - AAA 7.16
Vedanta ltd. CRISIl - AA- 4.65
HpCl-Mittal Energy limited FITCH - AA 4.16
TATA International ltd. CARE - A+ 4.08
Volkswagen Financeprivate limited FITCH - AAA 3.85
Issuer rating % to Nav
Reliance Jio Infocomm limited CRISIl - AAA 3.63
Toyota Financial Services India ltd CRISIl - AAA 2.99
Bank of India CRISIL - A+ 2.61
Total of Top Ten Holdings 64.33
Total g-Sec, SDl, Credit Exposure 95.33
Cash, Cash Equivalents and net Current Assets 4.67
grand Total 100.00
For complete portfolio, please visit www.hdfcfund.com
pErFOrMaNCE - Regular plan - Growth optionDate period Scheme
returns (%)
Benchmark returns
(%)#
additional Benchmark
returns (%) ##
value of ` 10,000 invested
Scheme (`) Benchmark (`)#
additional Benchmark
(`)##Mar 31, 16 last 1 year 10.33 9.10 7.15 11,033 10,910 10,715Mar 31, 14 last 3 years 9.56 9.29 7.85 13,154 13,056 12,549Mar 30, 12 last 5 years 9.21 9.15 7.54 15,544 15,499 14,387Feb 06, 02 Since Inception 8.13 n.A. 5.99 32,709 n.A. 24,151
past performance may or may not be sustained in the future. Returns greater than 1 year period are compounded annualized (CAGR). load is not taken into consideration for computation of performance. # CRISIl Short Term Bond Fund Index ## CRISIl 1 year T-Bill Index. performance of dividend option under the schemes for the investors would be net of distribution tax as applicable. n.A.: not Available. For performance of other schemes managed by Shobhit Mehrotra, please refer page 46. Different plans viz. Regular plan and Direct plan have a different expense structure. The expenses of the Direct plan under the Scheme will be lower to the extent of the distribution expenses / commission charged in the Regular plan. For performance of Direct plan, refer page no. 62.
Sovereign 18.39AAA/AAA(SO)/A1+/A1+(SO) & Equivalent 40.62AA+ & Below 36.32Cash, Cash Equivalents and net Current Assets 4.67
Portfolio Classification by Rating Class (%)
G-Sec, SDl 18.39Credit Exposure 76.94
Cash, Cash Equivalents and net Current Assets 4.67
Portfolio Classification by Asset Class (%)
l INvESTMENT OBjECTIvE
To generate income by investing in a range of debt and money market instruments of various maturity dates with a view to maximising income while maintaining the optimum balance of yield, safety and liquidity. The objective is to cater to the needs of investors with shorter term investment horizons and to provide stable returns over shorter periods.
l FuND MaNagEr ¥
Shobhit Mehrotra (since September 1, 07)
Total Experience: over 24 years
l INCEpTION DaTE (Date of allotment)
February 6, 2002
Nav Nav pEr uNIT (`)
Regular plan - Growth option 32.7085Regular plan - Dividend option 12.4103Regular plan - Fortnightly Dividend option 10.5895Direct plan - Growth option 33.3733Direct plan - Dividend option 12.4948Direct plan - Fortnightly Dividend option 10.6224
aSSETS uNDEr MaNagEMENT (`) IN CrOrE
As on March 31, 2017 1,959.39Average for Month of March 31, 2017 2,167.12
l quaNTITaTIvE DaTa
Average Maturity * 3.72 yearsModified Duration * 2.67 yearsyield to Maturity * 7.80%* Computed on the invested amount.
l TOTal ExpENSE raTIO (Weighted average for the month) €
Regular 1.20%Direct 0.62%
€ Excluding Service Tax on Management Fees.
l BENCHMarK INDEx
CRISIl Short Term Bond Fund Index
l ENTrY lOaD
not Applicable.
l ExIT lOaD
nil
l plaNS
Regular plan, Direct plan
l OpTIONS
under both the plans : Growth, normal Dividend & Fortnightly Dividend. Both Dividend options offer payout and Reinvestment facility.
l MINIMuM applICaTION aMOuNT
purchase : ` 5,000 and any amount thereafter. Additional purchase : ` 1,000 and any amount thereafter.
l rEDEMpTION prOCEEDS
normally despatched within 3-4 Business Days.
For Tax Benefits / Consequences, Please refer to page 46¥ Dedicated Fund Manager for overseas Investments: Mr Rakesh Vyas (Total Experience - over 10 years).
Face Value per unit: ` 10 unless otherwise specified, + Industry Classification as recommended by AMFI, Data is as of March 31, 2017 unless otherwise specified.
£ Co-sponsor
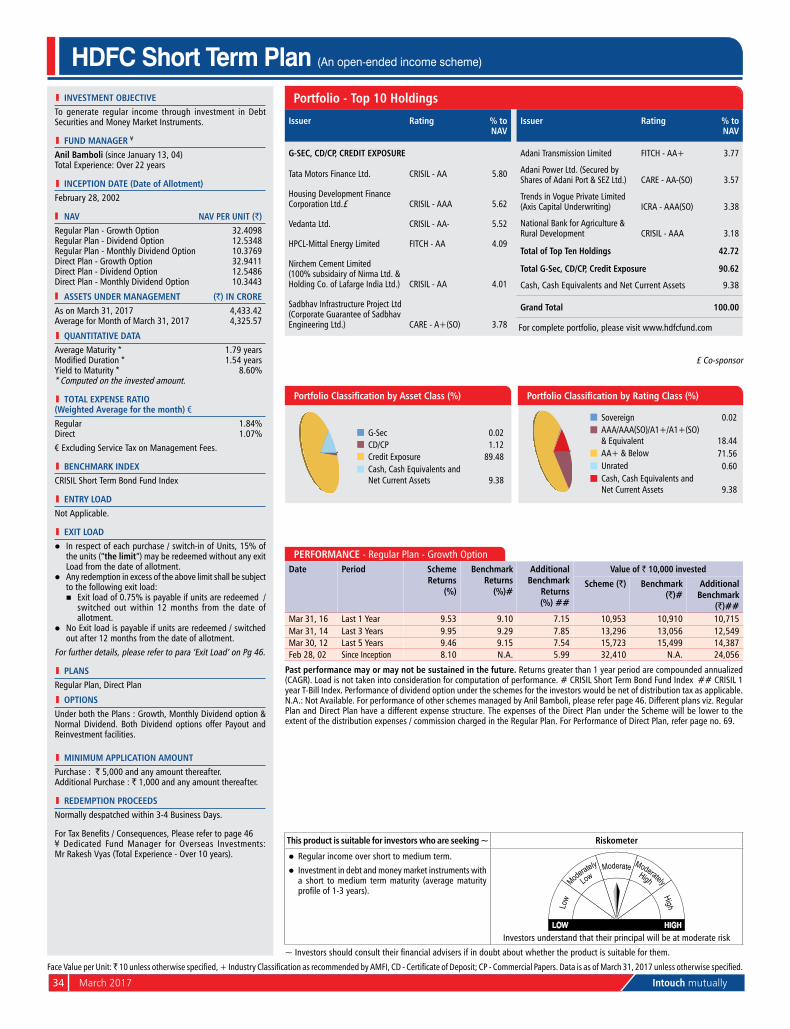
34 March 2017 Intouch mutually
HDFC Short Term Plan (An open-ended income scheme)
Issuer rating % to Nav
g-SEC, CD/Cp, CrEDIT ExpOSurE
Tata Motors Finance ltd. CRISIl - AA 5.80
Housing Development Finance Corporation ltd.£ CRISIl - AAA 5.62
Vedanta ltd. CRISIl - AA- 5.52
HpCl-Mittal Energy limited FITCH - AA 4.09
nirchem Cement limited(100% subsidairy of nirma ltd. & Holding Co. of lafarge India ltd.) CRISIl - AA 4.01
Sadbhav Infrastructure project ltd (Corporate Guarantee of Sadbhav Engineering ltd.) CARE - A+(SO) 3.78
Issuer rating % to Nav
Adani Transmission limited FITCH - AA+ 3.77
Adani power ltd. (Secured by Shares of Adani port & SEZ ltd.) CARE - AA-(So) 3.57
Trends in Vogue private limited (Axis Capital underwriting) ICRA - AAA(So) 3.38
national Bank for Agriculture & Rural Development CRISIl - AAA 3.18
Total of Top Ten Holdings 42.72
Total g-Sec, CD/Cp, Credit Exposure 90.62
Cash, Cash Equivalents and net Current Assets 9.38
grand Total 100.00
For complete portfolio, please visit www.hdfcfund.com
This product is suitable for investors who are seeking ~ riskometer
l Regular income over short to medium term.l Investment in debt and money market instruments with
a short to medium term maturity (average maturity profile of 1-3 years).
Investors understand that their principal will be at moderate risk
~ Investors should consult their financial advisers if in doubt about whether the product is suitable for them.
pErFOrMaNCE - Regular plan - Growth optionDate period Scheme
returns (%)
Benchmark returns
(%)#
additional Benchmark
returns (%) ##
value of ` 10,000 invested
Scheme (`) Benchmark (`)#
additional Benchmark
(`)##Mar 31, 16 last 1 year 9.53 9.10 7.15 10,953 10,910 10,715Mar 31, 14 last 3 years 9.95 9.29 7.85 13,296 13,056 12,549Mar 30, 12 last 5 years 9.46 9.15 7.54 15,723 15,499 14,387Feb 28, 02 Since Inception 8.10 n.A. 5.99 32,410 n.A. 24,056
past performance may or may not be sustained in the future. Returns greater than 1 year period are compounded annualized (CAGR). load is not taken into consideration for computation of performance. # CRISIl Short Term Bond Fund Index ## CRISIl 1 year T-Bill Index. performance of dividend option under the schemes for the investors would be net of distribution tax as applicable. n.A.: not Available. For performance of other schemes managed by Anil Bamboli, please refer page 46. Different plans viz. Regular plan and Direct plan have a different expense structure. The expenses of the Direct plan under the Scheme will be lower to the extent of the distribution expenses / commission charged in the Regular plan. For performance of Direct plan, refer page no. 69.
G-Sec 0.02CD/Cp 1.12Credit Exposure 89.48Cash, Cash Equivalents and net Current Assets 9.38
Portfolio Classification by Asset Class (%)
Sovereign 0.02AAA/AAA(SO)/A1+/A1+(SO) & Equivalent 18.44AA+ & Below 71.56unrated 0.60Cash, Cash Equivalents and net Current Assets 9.38
Portfolio Classification by Rating Class (%)
l INvESTMENT OBjECTIvETo generate regular income through investment in Debt Securities and Money Market Instruments.
l FuND MaNagEr ¥
anil Bamboli (since January 13, 04) Total Experience: over 22 years
l INCEpTION DaTE (Date of allotment)February 28, 2002
Nav Nav pEr uNIT (`)Regular plan - Growth option 32.4098Regular plan - Dividend option 12.5348Regular plan - Monthly Dividend option 10.3769Direct plan - Growth option 32.9411Direct plan - Dividend option 12.5486Direct plan - Monthly Dividend option 10.3443
aSSETS uNDEr MaNagEMENT (`) IN CrOrEAs on March 31, 2017 4,433.42Average for Month of March 31, 2017 4,325.57
l quaNTITaTIvE DaTaAverage Maturity * 1.79 yearsModified Duration * 1.54 yearsyield to Maturity * 8.60%* Computed on the invested amount.
l TOTal ExpENSE raTIO (Weighted average for the month) €Regular 1.84%Direct 1.07%
€ Excluding Service Tax on Management Fees.
l BENCHMarK INDExCRISIl Short Term Bond Fund Index
l ENTrY lOaDnot Applicable.
l ExIT lOaDl In respect of each purchase / switch-in of units, 15% of
the units (“the limit”) may be redeemed without any exit load from the date of allotment.
l Any redemption in excess of the above limit shall be subject to the following exit load:
n Exit load of 0.75% is payable if units are redeemed / switched out within 12 months from the date of allotment.
l no Exit load is payable if units are redeemed / switched out after 12 months from the date of allotment.
For further details, please refer to para ‘Exit load’ on pg 46.
l plaNSRegular plan, Direct plan
l OpTIONSunder both the plans : Growth, Monthly Dividend option & normal Dividend. Both Dividend options offer payout and Reinvestment facilities.
l MINIMuM applICaTION aMOuNTpurchase : ` 5,000 and any amount thereafter. Additional purchase : ` 1,000 and any amount thereafter.
l rEDEMpTION prOCEEDSnormally despatched within 3-4 Business Days.
For Tax Benefits / Consequences, Please refer to page 46¥ Dedicated Fund Manager for overseas Investments: Mr Rakesh Vyas (Total Experience - over 10 years).
portfolio - Top 10 Holdings
Face Value per unit: ̀ 10 unless otherwise specified, + Industry Classification as recommended by AMFI, CD - Certificate of Deposit; CP - Commercial Papers. Data is as of March 31, 2017 unless otherwise specified.
£ Co-sponsor
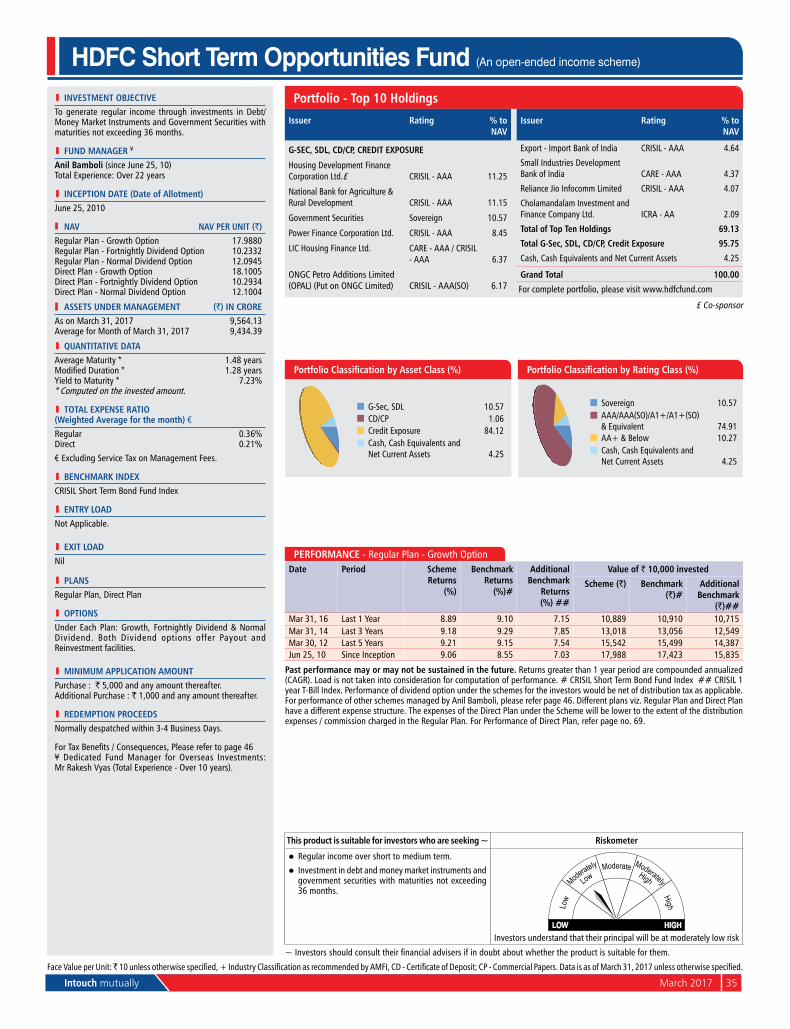
Intouch mutually March 2017 35
HDFC Short Term Opportunities Fund (An open-ended income scheme)
portfolio - Top 10 Holdings
This product is suitable for investors who are seeking ~ riskometer
l Regular income over short to medium term.l Investment in debt and money market instruments and
government securities with maturities not exceeding 36 months.
Investors understand that their principal will be at moderately low risk
~ Investors should consult their financial advisers if in doubt about whether the product is suitable for them.
pErFOrMaNCE - Regular plan - Growth optionDate period Scheme
returns (%)
Benchmark returns
(%)#
additional Benchmark
returns (%) ##
value of ` 10,000 invested
Scheme (`) Benchmark (`)#
additional Benchmark
(`)##Mar 31, 16 last 1 year 8.89 9.10 7.15 10,889 10,910 10,715Mar 31, 14 last 3 years 9.18 9.29 7.85 13,018 13,056 12,549Mar 30, 12 last 5 years 9.21 9.15 7.54 15,542 15,499 14,387Jun 25, 10 Since Inception 9.06 8.55 7.03 17,988 17,423 15,835
past performance may or may not be sustained in the future. Returns greater than 1 year period are compounded annualized (CAGR). load is not taken into consideration for computation of performance. # CRISIl Short Term Bond Fund Index ## CRISIl 1 year T-Bill Index. performance of dividend option under the schemes for the investors would be net of distribution tax as applicable. For performance of other schemes managed by Anil Bamboli, please refer page 46. Different plans viz. Regular plan and Direct plan have a different expense structure. The expenses of the Direct plan under the Scheme will be lower to the extent of the distribution expenses / commission charged in the Regular plan. For performance of Direct plan, refer page no. 69.
Issuer rating % to Nav
g-SEC, SDl, CD/Cp, CrEDIT ExpOSurE
Housing Development Finance Corporation ltd.£ CRISIl - AAA 11.25
national Bank for Agriculture & Rural Development CRISIl - AAA 11.15
Government Securities Sovereign 10.57
power Finance Corporation ltd. CRISIl - AAA 8.45
lIC Housing Finance ltd. CARE - AAA / CRISIl - AAA 6.37
onGC petro Additions limited (opAl) (put on onGC limited) CRISIl - AAA(So) 6.17
Issuer rating % to Nav
Export - Import Bank of India CRISIl - AAA 4.64
Small Industries Development Bank of India CARE - AAA 4.37
Reliance Jio Infocomm limited CRISIl - AAA 4.07
Cholamandalam Investment and Finance Company ltd. ICRA - AA 2.09
Total of Top Ten Holdings 69.13
Total g-Sec, SDl, CD/Cp, Credit Exposure 95.75
Cash, Cash Equivalents and net Current Assets 4.25
grand Total 100.00
For complete portfolio, please visit www.hdfcfund.com
£ Co-sponsor
G-Sec, SDl 10.57CD/Cp 1.06Credit Exposure 84.12Cash, Cash Equivalents and net Current Assets 4.25
Portfolio Classification by Asset Class (%)
Sovereign 10.57AAA/AAA(SO)/A1+/A1+(SO) & Equivalent 74.91AA+ & Below 10.27Cash, Cash Equivalents and net Current Assets 4.25
Portfolio Classification by Rating Class (%)
Face Value per unit: ̀ 10 unless otherwise specified, + Industry Classification as recommended by AMFI, CD - Certificate of Deposit; CP - Commercial Papers. Data is as of March 31, 2017 unless otherwise specified.
l INvESTMENT OBjECTIvETo generate regular income through investments in Debt/ Money Market Instruments and Government Securities with maturities not exceeding 36 months.
l FuND MaNagEr ¥
anil Bamboli (since June 25, 10) Total Experience: over 22 years
l INCEpTION DaTE (Date of allotment)June 25, 2010
Nav Nav pEr uNIT (`)Regular plan - Growth option 17.9880Regular plan - Fortnightly Dividend option 10.2332Regular plan - normal Dividend option 12.0945Direct plan - Growth option 18.1005Direct plan - Fortnightly Dividend option 10.2934Direct plan - normal Dividend option 12.1004
aSSETS uNDEr MaNagEMENT (`) IN CrOrEAs on March 31, 2017 9,564.13Average for Month of March 31, 2017 9,434.39
l quaNTITaTIvE DaTaAverage Maturity * 1.48 yearsModified Duration * 1.28 yearsyield to Maturity * 7.23%* Computed on the invested amount.
l TOTal ExpENSE raTIO (Weighted average for the month) €Regular 0.36%Direct 0.21%
€ Excluding Service Tax on Management Fees.
l BENCHMarK INDExCRISIl Short Term Bond Fund Index
l ENTrY lOaDnot Applicable.
l ExIT lOaDnil
l plaNSRegular plan, Direct plan
l OpTIONSunder Each plan: Growth, Fortnightly Dividend & normal Dividend. Both Dividend options offer payout and Reinvestment facilities.
l MINIMuM applICaTION aMOuNTpurchase : ` 5,000 and any amount thereafter. Additional purchase : ` 1,000 and any amount thereafter.
l rEDEMpTION prOCEEDSnormally despatched within 3-4 Business Days.
For Tax Benefits / Consequences, Please refer to page 46¥ Dedicated Fund Manager for overseas Investments: Mr Rakesh Vyas (Total Experience - over 10 years).
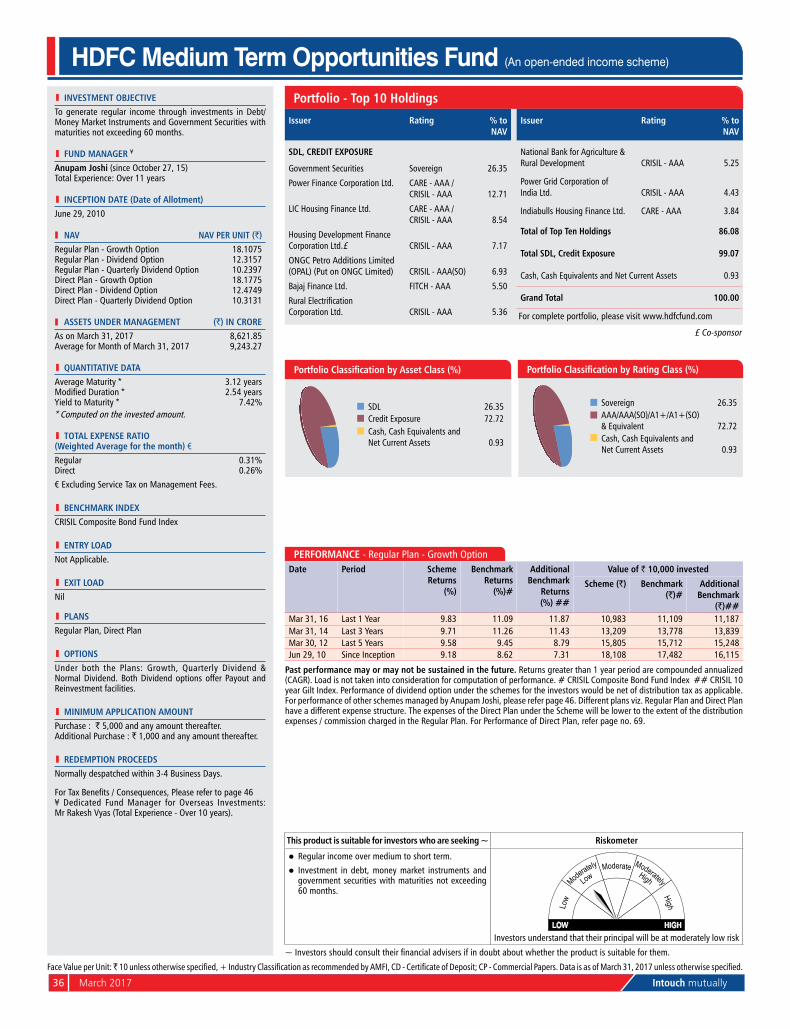
36 March 2017 Intouch mutually
l INvESTMENT OBjECTIvETo generate regular income through investments in Debt/ Money Market Instruments and Government Securities with maturities not exceeding 60 months.
l FuND MaNagEr ¥
anupam joshi (since october 27, 15) Total Experience: over 11 years
l INCEpTION DaTE (Date of allotment)June 29, 2010
Nav Nav pEr uNIT (`)Regular plan - Growth option 18.1075Regular plan - Dividend option 12.3157Regular plan - quarterly Dividend option 10.2397Direct plan - Growth option 18.1775Direct plan - Dividend option 12.4749Direct plan - quarterly Dividend option 10.3131
aSSETS uNDEr MaNagEMENT (`) IN CrOrEAs on March 31, 2017 8,621.85Average for Month of March 31, 2017 9,243.27
l quaNTITaTIvE DaTaAverage Maturity * 3.12 yearsModified Duration * 2.54 yearsyield to Maturity * 7.42%* Computed on the invested amount.
l TOTal ExpENSE raTIO (Weighted average for the month) €Regular 0.31%Direct 0.26%
€ Excluding Service Tax on Management Fees.
l BENCHMarK INDExCRISIl Composite Bond Fund Index
l ENTrY lOaDnot Applicable.
l ExIT lOaDnil
l plaNSRegular plan, Direct plan
l OpTIONSunder both the plans: Growth, quarterly Dividend & normal Dividend. Both Dividend options offer payout and Reinvestment facilities.
l MINIMuM applICaTION aMOuNTpurchase : ` 5,000 and any amount thereafter. Additional purchase : ` 1,000 and any amount thereafter.
l rEDEMpTION prOCEEDSnormally despatched within 3-4 Business Days.
For Tax Benefits / Consequences, Please refer to page 46¥ Dedicated Fund Manager for overseas Investments: Mr Rakesh Vyas (Total Experience - over 10 years).
HDFC Medium Term Opportunities Fund (An open-ended income scheme)
portfolio - Top 10 Holdings
This product is suitable for investors who are seeking ~ riskometer
l Regular income over medium to short term.l Investment in debt, money market instruments and
government securities with maturities not exceeding 60 months.
Investors understand that their principal will be at moderately low risk
~ Investors should consult their financial advisers if in doubt about whether the product is suitable for them.
pErFOrMaNCE - Regular plan - Growth optionDate period Scheme
returns (%)
Benchmark returns
(%)#
additional Benchmark
returns (%) ##
value of ` 10,000 invested
Scheme (`) Benchmark (`)#
additional Benchmark
(`)##Mar 31, 16 last 1 year 9.83 11.09 11.87 10,983 11,109 11,187Mar 31, 14 last 3 years 9.71 11.26 11.43 13,209 13,778 13,839Mar 30, 12 last 5 years 9.58 9.45 8.79 15,805 15,712 15,248Jun 29, 10 Since Inception 9.18 8.62 7.31 18,108 17,482 16,115
past performance may or may not be sustained in the future. Returns greater than 1 year period are compounded annualized (CAGR). load is not taken into consideration for computation of performance. # CRISIl Composite Bond Fund Index ## CRISIl 10 year Gilt Index. performance of dividend option under the schemes for the investors would be net of distribution tax as applicable. For performance of other schemes managed by Anupam Joshi, please refer page 46. Different plans viz. Regular plan and Direct plan have a different expense structure. The expenses of the Direct plan under the Scheme will be lower to the extent of the distribution expenses / commission charged in the Regular plan. For performance of Direct plan, refer page no. 69.
Issuer rating % to Nav
SDl, CrEDIT ExpOSurE
Government Securities Sovereign 26.35
power Finance Corporation ltd. CARE - AAA /CRISIl - AAA 12.71
lIC Housing Finance ltd. CARE - AAA /CRISIl - AAA 8.54
Housing Development Finance Corporation ltd.£ CRISIl - AAA 7.17
onGC petro Additions limited (opAl) (put on onGC limited) CRISIl - AAA(So) 6.93
Bajaj Finance ltd. FITCH - AAA 5.50
Rural ElectrificationCorporation ltd. CRISIl - AAA 5.36
Issuer rating % to Nav
national Bank for Agriculture & Rural Development CRISIl - AAA 5.25
power Grid Corporation ofIndia ltd. CRISIl - AAA 4.43
Indiabulls Housing Finance ltd. CARE - AAA 3.84
Total of Top Ten Holdings 86.08
Total SDl, Credit Exposure 99.07
Cash, Cash Equivalents and net Current Assets 0.93
grand Total 100.00
For complete portfolio, please visit www.hdfcfund.com
£ Co-sponsor
SDl 26.35Credit Exposure 72.72Cash, Cash Equivalents and net Current Assets 0.93
Portfolio Classification by Asset Class (%)
Face Value per unit: ̀ 10 unless otherwise specified, + Industry Classification as recommended by AMFI, CD - Certificate of Deposit; CP - Commercial Papers. Data is as of March 31, 2017 unless otherwise specified.
Sovereign 26.35AAA/AAA(SO)/A1+/A1+(SO) & Equivalent 72.72Cash, Cash Equivalents and net Current Assets 0.93
Portfolio Classification by Rating Class (%)
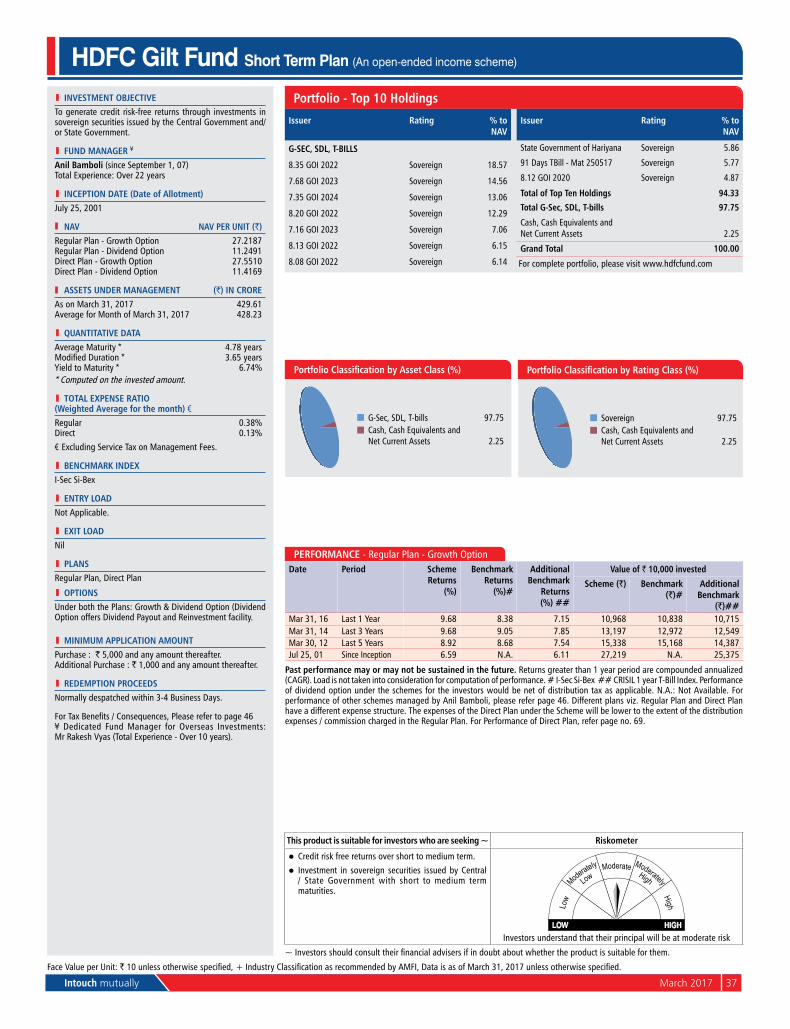
Intouch mutually March 2017 37
l INvESTMENT OBjECTIvETo generate credit risk-free returns through investments in sovereign securities issued by the Central Government and/or State Government.
l FuND MaNagEr ¥
anil Bamboli (since September 1, 07) Total Experience: over 22 years
l INCEpTION DaTE (Date of allotment)July 25, 2001
Nav Nav pEr uNIT (`)Regular plan - Growth option 27.2187Regular plan - Dividend option 11.2491Direct plan - Growth option 27.5510Direct plan - Dividend option 11.4169
aSSETS uNDEr MaNagEMENT (`) IN CrOrEAs on March 31, 2017 429.61Average for Month of March 31, 2017 428.23
l quaNTITaTIvE DaTaAverage Maturity * 4.78 yearsModified Duration * 3.65 yearsyield to Maturity * 6.74%* Computed on the invested amount.
l TOTal ExpENSE raTIO (Weighted average for the month) €Regular 0.38%Direct 0.13%
€ Excluding Service Tax on Management Fees.
l BENCHMarK INDExI-Sec Si-Bex
l ENTrY lOaDnot Applicable.
l ExIT lOaDnil
l plaNSRegular plan, Direct plan
l OpTIONSunder both the plans: Growth & Dividend option (Dividend option offers Dividend payout and Reinvestment facility.
l MINIMuM applICaTION aMOuNTpurchase : ` 5,000 and any amount thereafter. Additional purchase : ` 1,000 and any amount thereafter.
l rEDEMpTION prOCEEDSnormally despatched within 3-4 Business Days.
For Tax Benefits / Consequences, Please refer to page 46¥ Dedicated Fund Manager for overseas Investments: Mr Rakesh Vyas (Total Experience - over 10 years).
HDFC Gilt Fund Short Term Plan (An open-ended income scheme)
portfolio - Top 10 Holdings
Issuer rating % to Nav
g-SEC, SDl, T-BIllS
8.35 GoI 2022 Sovereign 18.57
7.68 GoI 2023 Sovereign 14.56
7.35 GoI 2024 Sovereign 13.06
8.20 GoI 2022 Sovereign 12.29
7.16 GoI 2023 Sovereign 7.06
8.13 GoI 2022 Sovereign 6.15
8.08 GoI 2022 Sovereign 6.14
Issuer rating % to Nav
State Government of Hariyana Sovereign 5.86
91 Days TBill - Mat 250517 Sovereign 5.77
8.12 GoI 2020 Sovereign 4.87
Total of Top Ten Holdings 94.33
Total g-Sec, SDl, T-bills 97.75
Cash, Cash Equivalents andnet Current Assets 2.25
grand Total 100.00
For complete portfolio, please visit www.hdfcfund.com
This product is suitable for investors who are seeking ~ riskometer
l Credit risk free returns over short to medium term.l Investment in sovereign securities issued by Central
/ State Government with short to medium term maturities.
Investors understand that their principal will be at moderate risk
~ Investors should consult their financial advisers if in doubt about whether the product is suitable for them.
pErFOrMaNCE - Regular plan - Growth optionDate period Scheme
returns (%)
Benchmark returns
(%)#
additional Benchmark
returns (%) ##
value of ` 10,000 invested
Scheme (`) Benchmark (`)#
additional Benchmark
(`)##Mar 31, 16 last 1 year 9.68 8.38 7.15 10,968 10,838 10,715Mar 31, 14 last 3 years 9.68 9.05 7.85 13,197 12,972 12,549Mar 30, 12 last 5 years 8.92 8.68 7.54 15,338 15,168 14,387Jul 25, 01 Since Inception 6.59 n.A. 6.11 27,219 n.A. 25,375
past performance may or may not be sustained in the future. Returns greater than 1 year period are compounded annualized (CAGR). load is not taken into consideration for computation of performance. # I-Sec Si-Bex ## CRISIl 1 year T-Bill Index. performance of dividend option under the schemes for the investors would be net of distribution tax as applicable. n.A.: not Available. For performance of other schemes managed by Anil Bamboli, please refer page 46. Different plans viz. Regular plan and Direct plan have a different expense structure. The expenses of the Direct plan under the Scheme will be lower to the extent of the distribution expenses / commission charged in the Regular plan. For performance of Direct plan, refer page no. 69.
G-Sec, SDl, T-bills 97.75Cash, Cash Equivalents and net Current Assets 2.25
Portfolio Classification by Asset Class (%)
Sovereign 97.75Cash, Cash Equivalents and net Current Assets 2.25
Portfolio Classification by Rating Class (%)
Face Value per unit: ` 10 unless otherwise specified, + Industry Classification as recommended by AMFI, Data is as of March 31, 2017 unless otherwise specified.
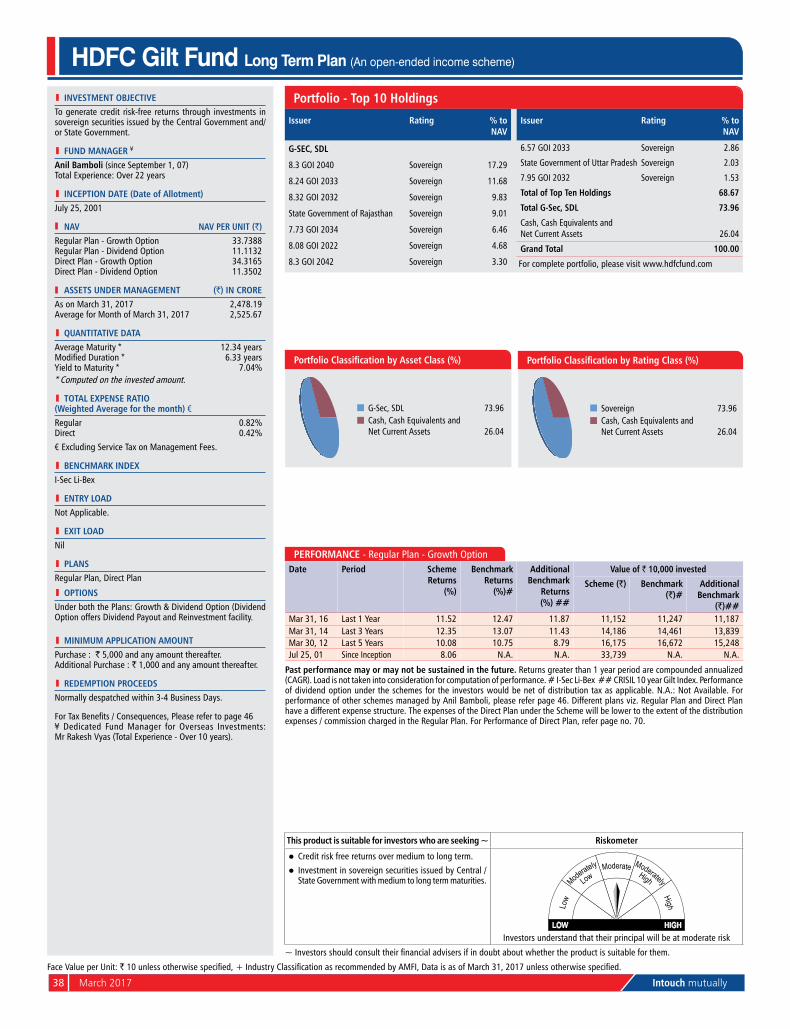
38 March 2017 Intouch mutually
l INvESTMENT OBjECTIvETo generate credit risk-free returns through investments in sovereign securities issued by the Central Government and/or State Government.
l FuND MaNagEr ¥
anil Bamboli (since September 1, 07) Total Experience: over 22 years
l INCEpTION DaTE (Date of allotment)July 25, 2001
Nav Nav pEr uNIT (`)Regular plan - Growth option 33.7388Regular plan - Dividend option 11.1132Direct plan - Growth option 34.3165Direct plan - Dividend option 11.3502
aSSETS uNDEr MaNagEMENT (`) IN CrOrEAs on March 31, 2017 2,478.19Average for Month of March 31, 2017 2,525.67
l quaNTITaTIvE DaTaAverage Maturity * 12.34 yearsModified Duration * 6.33 yearsyield to Maturity * 7.04%* Computed on the invested amount.
l TOTal ExpENSE raTIO (Weighted average for the month) €Regular 0.82%Direct 0.42%
€ Excluding Service Tax on Management Fees.
l BENCHMarK INDExI-Sec li-Bex
l ENTrY lOaDnot Applicable.
l ExIT lOaDnil
l plaNSRegular plan, Direct plan
l OpTIONSunder both the plans: Growth & Dividend option (Dividend option offers Dividend payout and Reinvestment facility.
l MINIMuM applICaTION aMOuNTpurchase : ` 5,000 and any amount thereafter. Additional purchase : ` 1,000 and any amount thereafter.
l rEDEMpTION prOCEEDSnormally despatched within 3-4 Business Days.
For Tax Benefits / Consequences, Please refer to page 46¥ Dedicated Fund Manager for overseas Investments: Mr Rakesh Vyas (Total Experience - over 10 years).
HDFC Gilt Fund Long Term Plan (An open-ended income scheme)
portfolio - Top 10 Holdings
Issuer rating % to Nav
g-SEC, SDl
8.3 GoI 2040 Sovereign 17.29
8.24 GoI 2033 Sovereign 11.68
8.32 GoI 2032 Sovereign 9.83
State Government of Rajasthan Sovereign 9.01
7.73 GoI 2034 Sovereign 6.46
8.08 GoI 2022 Sovereign 4.68
8.3 GoI 2042 Sovereign 3.30
Issuer rating % to Nav
6.57 GoI 2033 Sovereign 2.86
State Government of uttar pradesh Sovereign 2.03
7.95 GoI 2032 Sovereign 1.53
Total of Top Ten Holdings 68.67
Total g-Sec, SDl 73.96
Cash, Cash Equivalents and net Current Assets 26.04
grand Total 100.00
For complete portfolio, please visit www.hdfcfund.com
This product is suitable for investors who are seeking ~ riskometer
l Credit risk free returns over medium to long term.l Investment in sovereign securities issued by Central /
State Government with medium to long term maturities.
Investors understand that their principal will be at moderate risk
~ Investors should consult their financial advisers if in doubt about whether the product is suitable for them.
pErFOrMaNCE - Regular plan - Growth optionDate period Scheme
returns (%)
Benchmark returns
(%)#
additional Benchmark
returns (%) ##
value of ` 10,000 invested
Scheme (`) Benchmark (`)#
additional Benchmark
(`)##Mar 31, 16 last 1 year 11.52 12.47 11.87 11,152 11,247 11,187Mar 31, 14 last 3 years 12.35 13.07 11.43 14,186 14,461 13,839Mar 30, 12 last 5 years 10.08 10.75 8.79 16,175 16,672 15,248Jul 25, 01 Since Inception 8.06 n.A. n.A. 33,739 n.A. n.A.
past performance may or may not be sustained in the future. Returns greater than 1 year period are compounded annualized (CAGR). load is not taken into consideration for computation of performance. # I-Sec li-Bex ## CRISIl 10 year Gilt Index. performance of dividend option under the schemes for the investors would be net of distribution tax as applicable. n.A.: not Available. For performance of other schemes managed by Anil Bamboli, please refer page 46. Different plans viz. Regular plan and Direct plan have a different expense structure. The expenses of the Direct plan under the Scheme will be lower to the extent of the distribution expenses / commission charged in the Regular plan. For performance of Direct plan, refer page no. 70.
G-Sec, SDl 73.96Cash, Cash Equivalents and net Current Assets 26.04
Portfolio Classification by Asset Class (%)
Sovereign 73.96Cash, Cash Equivalents and net Current Assets 26.04
Portfolio Classification by Rating Class (%)
Face Value per unit: ` 10 unless otherwise specified, + Industry Classification as recommended by AMFI, Data is as of March 31, 2017 unless otherwise specified.
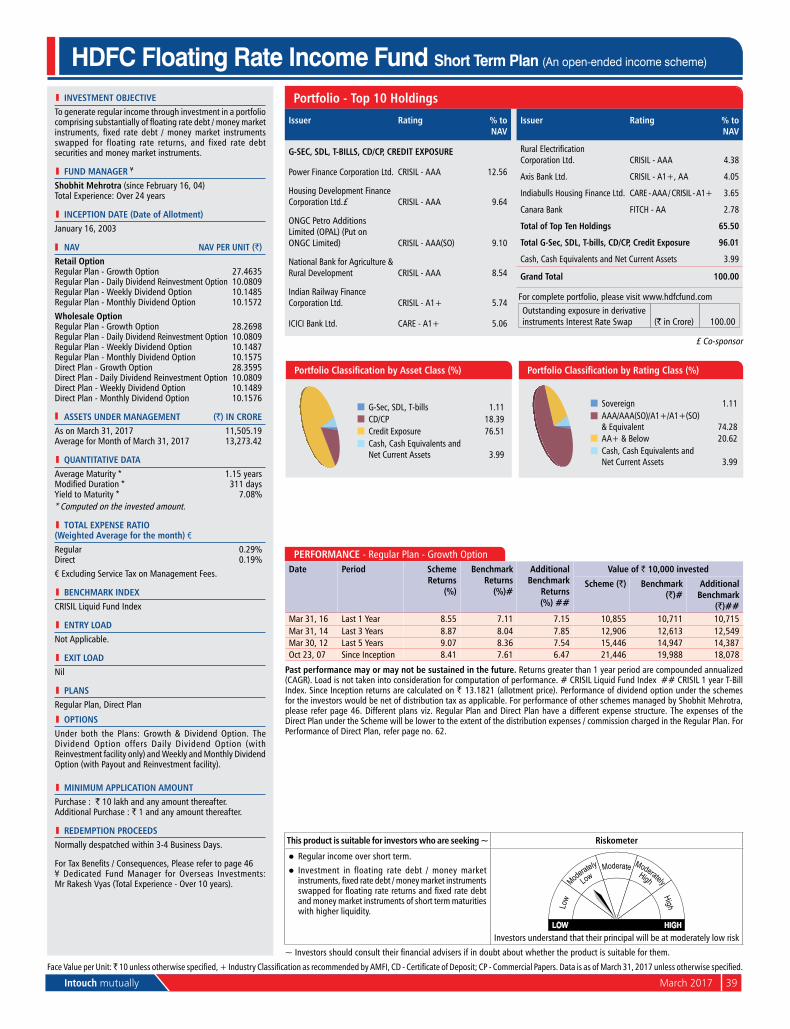
Intouch mutually March 2017 39
l INvESTMENT OBjECTIvETo generate regular income through investment in a portfolio comprising substantially of floating rate debt / money market instruments, fixed rate debt / money market instruments swapped for floating rate returns, and fixed rate debt securities and money market instruments.
l FuND MaNagEr ¥
Shobhit Mehrotra (since February 16, 04) Total Experience: over 24 years
l INCEpTION DaTE (Date of allotment)January 16, 2003
Nav Nav pEr uNIT (`)retail OptionRegular plan - Growth option 27.4635Regular plan - Daily Dividend Reinvestment option 10.0809Regular plan - Weekly Dividend option 10.1485Regular plan - Monthly Dividend option 10.1572Wholesale OptionRegular plan - Growth option 28.2698Regular plan - Daily Dividend Reinvestment option 10.0809Regular plan - Weekly Dividend option 10.1487Regular plan - Monthly Dividend option 10.1575Direct plan - Growth option 28.3595Direct plan - Daily Dividend Reinvestment option 10.0809Direct plan - Weekly Dividend option 10.1489Direct plan - Monthly Dividend option 10.1576
aSSETS uNDEr MaNagEMENT (`) IN CrOrEAs on March 31, 2017 11,505.19Average for Month of March 31, 2017 13,273.42
l quaNTITaTIvE DaTaAverage Maturity * 1.15 yearsModified Duration * 311 daysyield to Maturity * 7.08%* Computed on the invested amount.
l TOTal ExpENSE raTIO (Weighted average for the month) €Regular 0.29%Direct 0.19%
€ Excluding Service Tax on Management Fees.
l BENCHMarK INDExCRISIl liquid Fund Index
l ENTrY lOaDnot Applicable.
l ExIT lOaDnil
l plaNSRegular plan, Direct plan
l OpTIONSunder both the plans: Growth & Dividend option. The Dividend option offers Daily Dividend option (with Reinvestment facility only) and Weekly and Monthly Dividend option (with payout and Reinvestment facility).
l MINIMuM applICaTION aMOuNTpurchase : ` 10 lakh and any amount thereafter. Additional purchase : ` 1 and any amount thereafter.
l rEDEMpTION prOCEEDSnormally despatched within 3-4 Business Days.
For Tax Benefits / Consequences, Please refer to page 46¥ Dedicated Fund Manager for overseas Investments: Mr Rakesh Vyas (Total Experience - over 10 years).
HDFC Floating Rate Income Fund Short Term Plan (An open-ended income scheme)
portfolio - Top 10 Holdings
This product is suitable for investors who are seeking ~ riskometer
l Regular income over short term.l Investment in floating rate debt / money market
instruments, fixed rate debt / money market instruments swapped for floating rate returns and fixed rate debt and money market instruments of short term maturities with higher liquidity.
Investors understand that their principal will be at moderately low risk
~ Investors should consult their financial advisers if in doubt about whether the product is suitable for them.
Issuer rating % to Nav
g-SEC, SDl, T-BIllS, CD/Cp, CrEDIT ExpOSurE
power Finance Corporation ltd. CRISIl - AAA 12.56
Housing Development Finance Corporation ltd.£ CRISIl - AAA 9.64
onGC petro Additions limited (opAl) (put ononGC limited) CRISIl - AAA(So) 9.10
national Bank for Agriculture & Rural Development CRISIl - AAA 8.54
Indian Railway Finance Corporation ltd. CRISIL - A1+ 5.74
ICICI Bank ltd. CARE - A1+ 5.06
Issuer rating % to Nav
Rural Electrification Corporation ltd. CRISIl - AAA 4.38
Axis Bank ltd. CRISIL - A1+, AA 4.05
Indiabulls Housing Finance ltd. CARE - AAA / CRISIL - A1+ 3.65
Canara Bank FITCH - AA 2.78
Total of Top Ten Holdings 65.50
Total g-Sec, SDl, T-bills, CD/Cp, Credit Exposure 96.01
Cash, Cash Equivalents and net Current Assets 3.99
grand Total 100.00
For complete portfolio, please visit www.hdfcfund.comoutstanding exposure in derivative instruments Interest Rate Swap (` in Crore) 100.00
£ Co-sponsor
Face Value per unit: ̀ 10 unless otherwise specified, + Industry Classification as recommended by AMFI, CD - Certificate of Deposit; CP - Commercial Papers. Data is as of March 31, 2017 unless otherwise specified.
pErFOrMaNCE - Regular plan - Growth optionDate period Scheme
returns (%)
Benchmark returns
(%)#
additional Benchmark
returns (%) ##
value of ` 10,000 invested
Scheme (`) Benchmark (`)#
additional Benchmark
(`)##Mar 31, 16 last 1 year 8.55 7.11 7.15 10,855 10,711 10,715Mar 31, 14 last 3 years 8.87 8.04 7.85 12,906 12,613 12,549Mar 30, 12 last 5 years 9.07 8.36 7.54 15,446 14,947 14,387oct 23, 07 Since Inception 8.41 7.61 6.47 21,446 19,988 18,078
past performance may or may not be sustained in the future. Returns greater than 1 year period are compounded annualized (CAGR). load is not taken into consideration for computation of performance. # CRISIl liquid Fund Index ## CRISIl 1 year T-Bill Index. Since Inception returns are calculated on ` 13.1821 (allotment price). performance of dividend option under the schemes for the investors would be net of distribution tax as applicable. For performance of other schemes managed by Shobhit Mehrotra, please refer page 46. Different plans viz. Regular plan and Direct plan have a different expense structure. The expenses of the Direct plan under the Scheme will be lower to the extent of the distribution expenses / commission charged in the Regular plan. For performance of Direct plan, refer page no. 62.
G-Sec, SDl, T-bills 1.11CD/Cp 18.39Credit Exposure 76.51Cash, Cash Equivalents and net Current Assets 3.99
Portfolio Classification by Asset Class (%)
Sovereign 1.11AAA/AAA(SO)/A1+/A1+(SO) & Equivalent 74.28AA+ & Below 20.62Cash, Cash Equivalents and net Current Assets 3.99
Portfolio Classification by Rating Class (%)
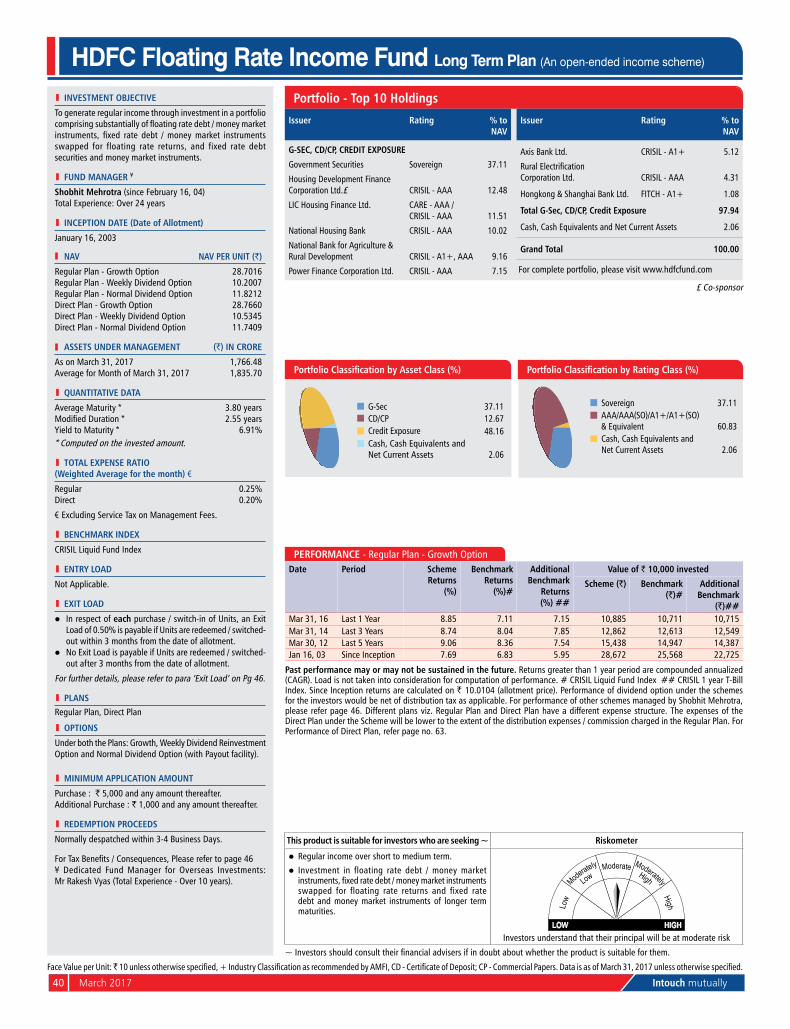
40 March 2017 Intouch mutually
l INvESTMENT OBjECTIvE
To generate regular income through investment in a portfolio comprising substantially of floating rate debt / money market instruments, fixed rate debt / money market instruments swapped for floating rate returns, and fixed rate debt securities and money market instruments.
l FuND MaNagEr ¥
Shobhit Mehrotra (since February 16, 04)
Total Experience: over 24 years
l INCEpTION DaTE (Date of allotment)
January 16, 2003
Nav Nav pEr uNIT (`)
Regular plan - Growth option 28.7016Regular plan - Weekly Dividend option 10.2007Regular plan - normal Dividend option 11.8212Direct plan - Growth option 28.7660Direct plan - Weekly Dividend option 10.5345Direct plan - normal Dividend option 11.7409
aSSETS uNDEr MaNagEMENT (`) IN CrOrE
As on March 31, 2017 1,766.48Average for Month of March 31, 2017 1,835.70
l quaNTITaTIvE DaTa
Average Maturity * 3.80 yearsModified Duration * 2.55 yearsyield to Maturity * 6.91%* Computed on the invested amount.
l TOTal ExpENSE raTIO (Weighted average for the month) €
Regular 0.25%Direct 0.20%
€ Excluding Service Tax on Management Fees.
l BENCHMarK INDEx
CRISIl liquid Fund Index
l ENTrY lOaD
not Applicable.
l ExIT lOaD
l In respect of each purchase / switch-in of units, an Exit load of 0.50% is payable if units are redeemed / switched-out within 3 months from the date of allotment.
l no Exit load is payable if units are redeemed / switched-out after 3 months from the date of allotment.
For further details, please refer to para ‘Exit load’ on pg 46.
l plaNSRegular plan, Direct plan
l OpTIONS
under both the plans: Growth, Weekly Dividend Reinvestment option and normal Dividend option (with payout facility).
l MINIMuM applICaTION aMOuNT
purchase : ` 5,000 and any amount thereafter. Additional purchase : ` 1,000 and any amount thereafter.
l rEDEMpTION prOCEEDS
normally despatched within 3-4 Business Days.
For Tax Benefits / Consequences, Please refer to page 46¥ Dedicated Fund Manager for overseas Investments: Mr Rakesh Vyas (Total Experience - over 10 years).
HDFC Floating Rate Income Fund Long Term Plan (An open-ended income scheme)
portfolio - Top 10 Holdings
This product is suitable for investors who are seeking ~ riskometer
l Regular income over short to medium term.l Investment in floating rate debt / money market
instruments, fixed rate debt / money market instruments swapped for floating rate returns and fixed rate debt and money market instruments of longer term maturities.
Investors understand that their principal will be at moderate risk
~ Investors should consult their financial advisers if in doubt about whether the product is suitable for them.
G-Sec 37.11CD/Cp 12.67Credit Exposure 48.16Cash, Cash Equivalents and net Current Assets 2.06
Portfolio Classification by Asset Class (%)
Sovereign 37.11AAA/AAA(SO)/A1+/A1+(SO) & Equivalent 60.83Cash, Cash Equivalents and net Current Assets 2.06
Portfolio Classification by Rating Class (%)
Face Value per unit: ̀ 10 unless otherwise specified, + Industry Classification as recommended by AMFI, CD - Certificate of Deposit; CP - Commercial Papers. Data is as of March 31, 2017 unless otherwise specified.
pErFOrMaNCE - Regular plan - Growth optionDate period Scheme
returns (%)
Benchmark returns
(%)#
additional Benchmark
returns (%) ##
value of ` 10,000 invested
Scheme (`) Benchmark (`)#
additional Benchmark
(`)##Mar 31, 16 last 1 year 8.85 7.11 7.15 10,885 10,711 10,715Mar 31, 14 last 3 years 8.74 8.04 7.85 12,862 12,613 12,549Mar 30, 12 last 5 years 9.06 8.36 7.54 15,438 14,947 14,387Jan 16, 03 Since Inception 7.69 6.83 5.95 28,672 25,568 22,725
past performance may or may not be sustained in the future. Returns greater than 1 year period are compounded annualized (CAGR). load is not taken into consideration for computation of performance. # CRISIl liquid Fund Index ## CRISIl 1 year T-Bill Index. Since Inception returns are calculated on ` 10.0104 (allotment price). performance of dividend option under the schemes for the investors would be net of distribution tax as applicable. For performance of other schemes managed by Shobhit Mehrotra, please refer page 46. Different plans viz. Regular plan and Direct plan have a different expense structure. The expenses of the Direct plan under the Scheme will be lower to the extent of the distribution expenses / commission charged in the Regular plan. For performance of Direct plan, refer page no. 63.
£ Co-sponsor
Issuer rating % to Nav
g-SEC, CD/Cp, CrEDIT ExpOSurE
Government Securities Sovereign 37.11
Housing Development Finance Corporation ltd.£ CRISIl - AAA 12.48
lIC Housing Finance ltd. CARE - AAA /CRISIl - AAA 11.51
national Housing Bank CRISIl - AAA 10.02
national Bank for Agriculture & Rural Development CRISIL - A1+, AAA 9.16
power Finance Corporation ltd. CRISIl - AAA 7.15
Issuer rating % to Nav
Axis Bank ltd. CRISIL - A1+ 5.12
Rural ElectrificationCorporation ltd. CRISIl - AAA 4.31
Hongkong & Shanghai Bank ltd. FITCH - A1+ 1.08
Total g-Sec, CD/Cp, Credit Exposure 97.94
Cash, Cash Equivalents and net Current Assets 2.06
grand Total 100.00
For complete portfolio, please visit www.hdfcfund.com
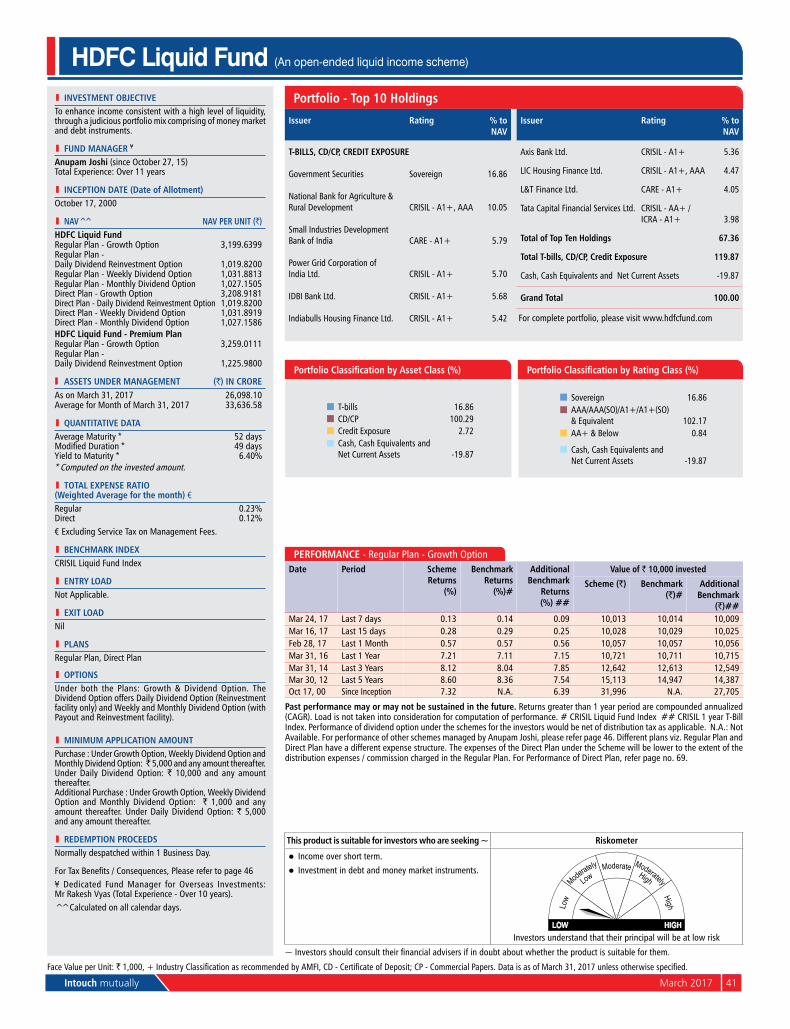
Intouch mutually March 2017 41
l INvESTMENT OBjECTIvETo enhance income consistent with a high level of liquidity, through a judicious portfolio mix comprising of money market and debt instruments.
l FuND MaNagEr ¥
anupam joshi (since october 27, 15) Total Experience: over 11 years
l INCEpTION DaTE (Date of allotment)october 17, 2000
l Nav^̂ Nav pEr uNIT (`)HDFC liquid FundRegular plan - Growth option 3,199.6399Regular plan - Daily Dividend Reinvestment option 1,019.8200Regular plan - Weekly Dividend option 1,031.8813Regular plan - Monthly Dividend option 1,027.1505Direct plan - Growth option 3,208.9181Direct plan - Daily Dividend Reinvestment option 1,019.8200Direct plan - Weekly Dividend option 1,031.8919Direct plan - Monthly Dividend option 1,027.1586HDFC liquid Fund - premium planRegular plan - Growth option 3,259.0111Regular plan - Daily Dividend Reinvestment option 1,225.9800
aSSETS uNDEr MaNagEMENT (`) IN CrOrEAs on March 31, 2017 26,098.10Average for Month of March 31, 2017 33,636.58
l quaNTITaTIvE DaTaAverage Maturity * 52 daysModified Duration * 49 daysyield to Maturity * 6.40%* Computed on the invested amount.
l TOTal ExpENSE raTIO (Weighted average for the month) €Regular 0.23%Direct 0.12%€ Excluding Service Tax on Management Fees.
l BENCHMarK INDExCRISIl liquid Fund Index
l ENTrY lOaDnot Applicable.
l ExIT lOaDnil
l plaNSRegular plan, Direct plan
l OpTIONSunder both the plans: Growth & Dividend option. The Dividend option offers Daily Dividend option (Reinvestment facility only) and Weekly and Monthly Dividend option (with payout and Reinvestment facility).
l MINIMuM applICaTION aMOuNTpurchase : under Growth option, Weekly Dividend option and Monthly Dividend option: ̀ 5,000 and any amount thereafter. under Daily Dividend option: ` 10,000 and any amount thereafter.Additional purchase : under Growth option, Weekly Dividend option and Monthly Dividend option: ` 1,000 and any amount thereafter. under Daily Dividend option: ` 5,000 and any amount thereafter.
l rEDEMpTION prOCEEDSnormally despatched within 1 Business Day.
For Tax Benefits / Consequences, Please refer to page 46¥ Dedicated Fund Manager for overseas Investments: Mr Rakesh Vyas (Total Experience - over 10 years).^̂ Calculated on all calendar days.
HDFC Liquid Fund (An open-ended liquid income scheme)
portfolio - Top 10 Holdings
Issuer rating % to Nav
T-BIllS, CD/Cp, CrEDIT ExpOSurE
Government Securities Sovereign 16.86
national Bank for Agriculture & Rural Development CRISIL - A1+, AAA 10.05
Small Industries Development Bank of India CARE - A1+ 5.79
power Grid Corporation ofIndia ltd. CRISIL - A1+ 5.70
IDBI Bank ltd. CRISIL - A1+ 5.68
Indiabulls Housing Finance ltd. CRISIL - A1+ 5.42
Issuer rating % to Nav
Axis Bank ltd. CRISIL - A1+ 5.36
lIC Housing Finance ltd. CRISIL - A1+, AAA 4.47
l&T Finance ltd. CARE - A1+ 4.05
Tata Capital Financial Services ltd. CRISIL - AA+ /ICRA - A1+ 3.98
Total of Top Ten Holdings 67.36
Total T-bills, CD/Cp, Credit Exposure 119.87
Cash, Cash Equivalents and net Current Assets -19.87
grand Total 100.00
For complete portfolio, please visit www.hdfcfund.com
This product is suitable for investors who are seeking ~ riskometer
l Income over short term.l Investment in debt and money market instruments.
Investors understand that their principal will be at low risk
~ Investors should consult their financial advisers if in doubt about whether the product is suitable for them.
Face Value per unit: ` 1,000, + Industry Classification as recommended by AMFI, CD - Certificate of Deposit; CP - Commercial Papers. Data is as of March 31, 2017 unless otherwise specified.
pErFOrMaNCE - Regular plan - Growth optionDate period Scheme
returns (%)
Benchmark returns
(%)#
additional Benchmark
returns (%) ##
value of ` 10,000 invested
Scheme (`) Benchmark (`)#
additional Benchmark
(`)##Mar 24, 17 last 7 days 0.13 0.14 0.09 10,013 10,014 10,009Mar 16, 17 last 15 days 0.28 0.29 0.25 10,028 10,029 10,025Feb 28, 17 last 1 Month 0.57 0.57 0.56 10,057 10,057 10,056Mar 31, 16 last 1 year 7.21 7.11 7.15 10,721 10,711 10,715Mar 31, 14 last 3 years 8.12 8.04 7.85 12,642 12,613 12,549Mar 30, 12 last 5 years 8.60 8.36 7.54 15,113 14,947 14,387oct 17, 00 Since Inception 7.32 n.A. 6.39 31,996 n.A. 27,705
past performance may or may not be sustained in the future. Returns greater than 1 year period are compounded annualized (CAGR). load is not taken into consideration for computation of performance. # CRISIl liquid Fund Index ## CRISIl 1 year T-Bill Index. performance of dividend option under the schemes for the investors would be net of distribution tax as applicable. n.A.: not Available. For performance of other schemes managed by Anupam Joshi, please refer page 46. Different plans viz. Regular plan and Direct plan have a different expense structure. The expenses of the Direct plan under the Scheme will be lower to the extent of the distribution expenses / commission charged in the Regular plan. For performance of Direct plan, refer page no. 69.
T-bills 16.86CD/Cp 100.29Credit Exposure 2.72Cash, Cash Equivalents and net Current Assets -19.87
Portfolio Classification by Asset Class (%)
Sovereign 16.86AAA/AAA(SO)/A1+/A1+(SO) & Equivalent 102.17AA+ & Below 0.84
Cash, Cash Equivalents and net Current Assets -19.87
Portfolio Classification by Rating Class (%)
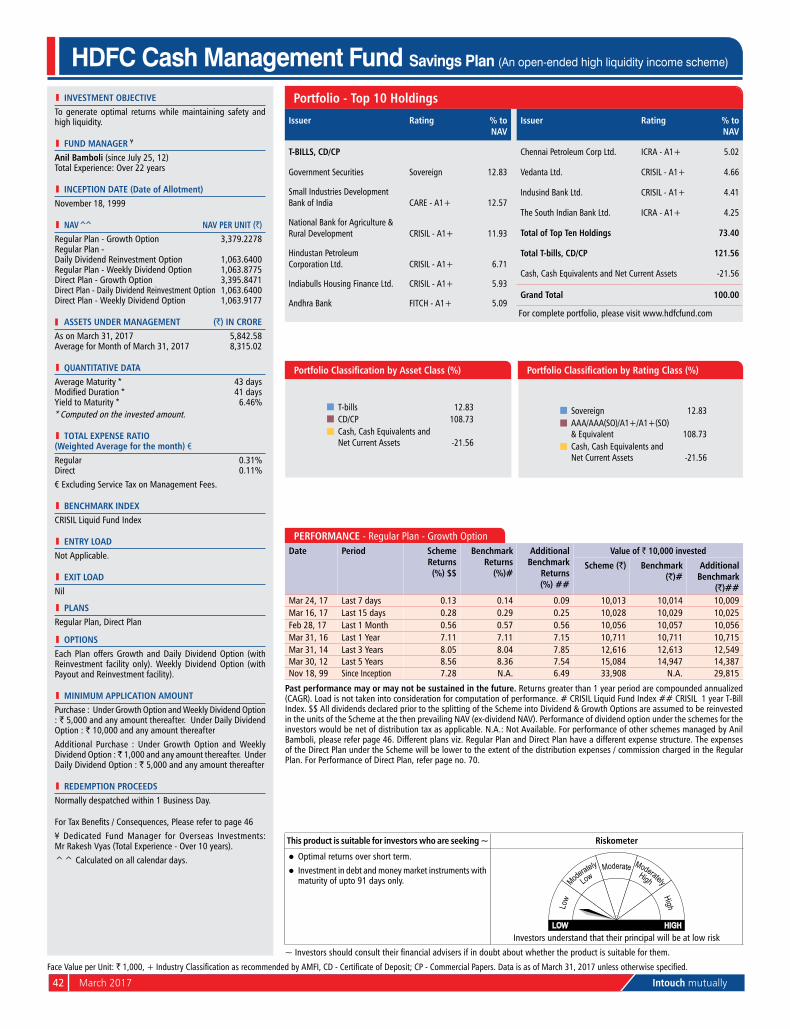
42 March 2017 Intouch mutually
l INvESTMENT OBjECTIvETo generate optimal returns while maintaining safety and high liquidity.
l FuND MaNagEr ¥
anil Bamboli (since July 25, 12) Total Experience: over 22 years
l INCEpTION DaTE (Date of allotment)november 18, 1999
l Nav^̂ Nav pEr uNIT (`)Regular plan - Growth option 3,379.2278Regular plan - Daily Dividend Reinvestment option 1,063.6400Regular plan - Weekly Dividend option 1,063.8775Direct plan - Growth option 3,395.8471Direct plan - Daily Dividend Reinvestment option 1,063.6400Direct plan - Weekly Dividend option 1,063.9177
aSSETS uNDEr MaNagEMENT (`) IN CrOrEAs on March 31, 2017 5,842.58Average for Month of March 31, 2017 8,315.02
l quaNTITaTIvE DaTaAverage Maturity * 43 daysModified Duration * 41 daysyield to Maturity * 6.46%* Computed on the invested amount.
l TOTal ExpENSE raTIO (Weighted average for the month) €Regular 0.31%Direct 0.11%
€ Excluding Service Tax on Management Fees.
l BENCHMarK INDExCRISIl liquid Fund Index
l ENTrY lOaDnot Applicable.
l ExIT lOaDnil
l plaNSRegular plan, Direct plan
l OpTIONSEach plan offers Growth and Daily Dividend option (with Reinvestment facility only). Weekly Dividend option (with payout and Reinvestment facility).
l MINIMuM applICaTION aMOuNTpurchase : under Growth option and Weekly Dividend option : ` 5,000 and any amount thereafter. under Daily Dividend option : ` 10,000 and any amount thereafterAdditional purchase : under Growth option and Weekly Dividend option : ̀ 1,000 and any amount thereafter. under Daily Dividend option : ` 5,000 and any amount thereafter
l rEDEMpTION prOCEEDSnormally despatched within 1 Business Day.
For Tax Benefits / Consequences, Please refer to page 46¥ Dedicated Fund Manager for overseas Investments: Mr Rakesh Vyas (Total Experience - over 10 years).
^^ Calculated on all calendar days.
HDFC Cash Management Fund Savings Plan (An open-ended high liquidity income scheme)
portfolio - Top 10 Holdings
Issuer rating % to Nav
T-BIllS, CD/Cp
Government Securities Sovereign 12.83
Small Industries Development Bank of India CARE - A1+ 12.57
national Bank for Agriculture & Rural Development CRISIL - A1+ 11.93
Hindustan petroleumCorporation ltd. CRISIL - A1+ 6.71
Indiabulls Housing Finance ltd. CRISIL - A1+ 5.93
Andhra Bank FITCH - A1+ 5.09
Issuer rating % to Nav
Chennai petroleum Corp ltd. ICRA - A1+ 5.02
Vedanta ltd. CRISIL - A1+ 4.66
Indusind Bank ltd. CRISIL - A1+ 4.41
The South Indian Bank ltd. ICRA - A1+ 4.25
Total of Top Ten Holdings 73.40
Total T-bills, CD/Cp 121.56
Cash, Cash Equivalents and net Current Assets -21.56
grand Total 100.00
For complete portfolio, please visit www.hdfcfund.com
This product is suitable for investors who are seeking ~ riskometer
l optimal returns over short term.l Investment in debt and money market instruments with
maturity of upto 91 days only.
Investors understand that their principal will be at low risk
~ Investors should consult their financial advisers if in doubt about whether the product is suitable for them.
pErFOrMaNCE - Regular plan - Growth optionDate period Scheme
returns (%) $$
Benchmark returns
(%)#
additional Benchmark
returns (%) ##
value of ` 10,000 invested
Scheme (`) Benchmark (`)#
additional Benchmark
(`)##Mar 24, 17 last 7 days 0.13 0.14 0.09 10,013 10,014 10,009Mar 16, 17 last 15 days 0.28 0.29 0.25 10,028 10,029 10,025Feb 28, 17 last 1 Month 0.56 0.57 0.56 10,056 10,057 10,056Mar 31, 16 last 1 year 7.11 7.11 7.15 10,711 10,711 10,715Mar 31, 14 last 3 years 8.05 8.04 7.85 12,616 12,613 12,549Mar 30, 12 last 5 years 8.56 8.36 7.54 15,084 14,947 14,387nov 18, 99 Since Inception 7.28 n.A. 6.49 33,908 n.A. 29,815
past performance may or may not be sustained in the future. Returns greater than 1 year period are compounded annualized (CAGR). load is not taken into consideration for computation of performance. # CRISIl liquid Fund Index ## CRISIl 1 year T-Bill Index. $$ All dividends declared prior to the splitting of the Scheme into Dividend & Growth options are assumed to be reinvested in the units of the Scheme at the then prevailing nAV (ex-dividend nAV). performance of dividend option under the schemes for the investors would be net of distribution tax as applicable. n.A.: not Available. For performance of other schemes managed by Anil Bamboli, please refer page 46. Different plans viz. Regular plan and Direct plan have a different expense structure. The expenses of the Direct plan under the Scheme will be lower to the extent of the distribution expenses / commission charged in the Regular plan. For performance of Direct plan, refer page no. 70.
Face Value per unit: ` 1,000, + Industry Classification as recommended by AMFI, CD - Certificate of Deposit; CP - Commercial Papers. Data is as of March 31, 2017 unless otherwise specified.
T-bills 12.83CD/Cp 108.73Cash, Cash Equivalents and net Current Assets -21.56
Portfolio Classification by Asset Class (%)
Sovereign 12.83AAA/AAA(SO)/A1+/A1+(SO) & Equivalent 108.73Cash, Cash Equivalents and net Current Assets -21.56
Portfolio Classification by Rating Class (%)
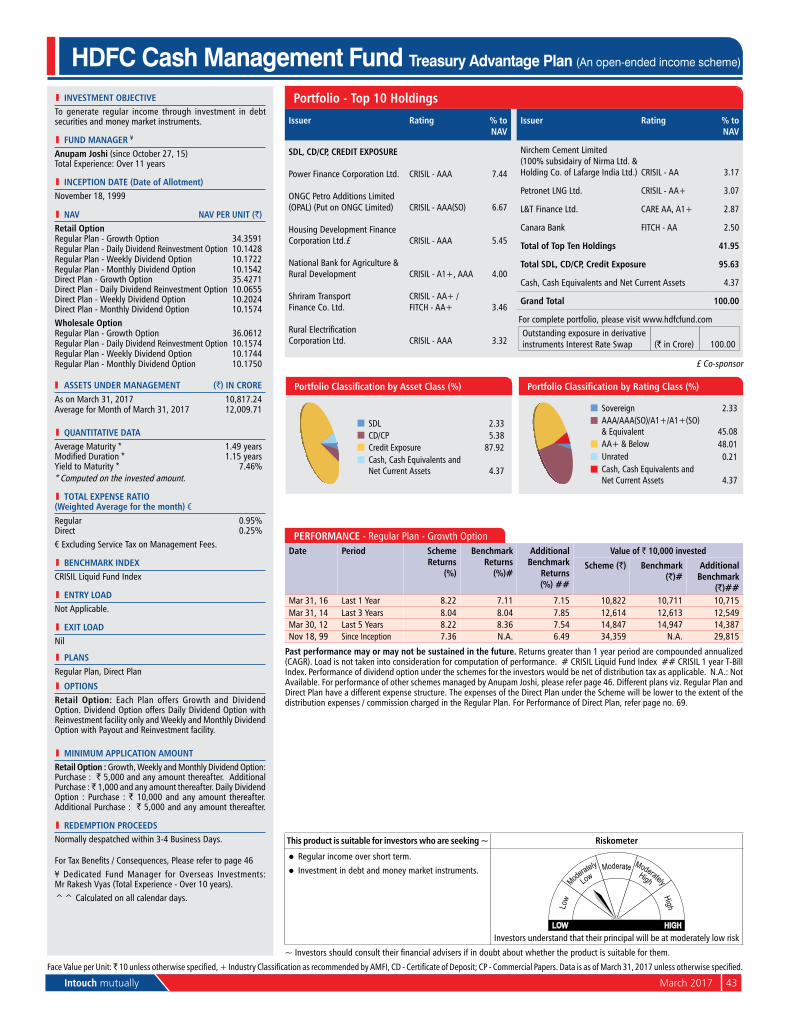
Intouch mutually March 2017 43
l INvESTMENT OBjECTIvETo generate regular income through investment in debt securities and money market instruments.
l FuND MaNagEr ¥
anupam joshi (since october 27, 15) Total Experience: over 11 years
l INCEpTION DaTE (Date of allotment)november 18, 1999
l Nav Nav pEr uNIT (`)retail OptionRegular plan - Growth option 34.3591Regular plan - Daily Dividend Reinvestment option 10.1428Regular plan - Weekly Dividend option 10.1722Regular plan - Monthly Dividend option 10.1542Direct plan - Growth option 35.4271Direct plan - Daily Dividend Reinvestment option 10.0655Direct plan - Weekly Dividend option 10.2024Direct plan - Monthly Dividend option 10.1574Wholesale OptionRegular plan - Growth option 36.0612Regular plan - Daily Dividend Reinvestment option 10.1574Regular plan - Weekly Dividend option 10.1744Regular plan - Monthly Dividend option 10.1750
aSSETS uNDEr MaNagEMENT (`) IN CrOrEAs on March 31, 2017 10,817.24Average for Month of March 31, 2017 12,009.71
l quaNTITaTIvE DaTaAverage Maturity * 1.49 yearsModified Duration * 1.15 yearsyield to Maturity * 7.46%* Computed on the invested amount.
l TOTal ExpENSE raTIO (Weighted average for the month) €Regular 0.95%Direct 0.25%€ Excluding Service Tax on Management Fees.
l BENCHMarK INDExCRISIl liquid Fund Index
l ENTrY lOaDnot Applicable.
l ExIT lOaDnil
l plaNSRegular plan, Direct plan
l OpTIONSretail Option: Each plan offers Growth and Dividend option. Dividend option offers Daily Dividend option with Reinvestment facility only and Weekly and Monthly Dividend option with payout and Reinvestment facility.
l MINIMuM applICaTION aMOuNTretail Option : Growth, Weekly and Monthly Dividend option: purchase : ` 5,000 and any amount thereafter. Additional purchase : ̀ 1,000 and any amount thereafter. Daily Dividend option : purchase : ` 10,000 and any amount thereafter. Additional purchase : ` 5,000 and any amount thereafter.
l rEDEMpTION prOCEEDSnormally despatched within 3-4 Business Days.
For Tax Benefits / Consequences, Please refer to page 46¥ Dedicated Fund Manager for overseas Investments: Mr Rakesh Vyas (Total Experience - over 10 years).^^ Calculated on all calendar days.
HDFC Cash Management Fund Treasury Advantage Plan (An open-ended income scheme)
portfolio - Top 10 Holdings
This product is suitable for investors who are seeking ~ riskometer
l Regular income over short term.l Investment in debt and money market instruments.
Investors understand that their principal will be at moderately low risk
~ Investors should consult their financial advisers if in doubt about whether the product is suitable for them.
pErFOrMaNCE - Regular plan - Growth optionDate period Scheme
returns (%)
Benchmark returns
(%)#
additional Benchmark
returns (%) ##
value of ` 10,000 invested
Scheme (`) Benchmark (`)#
additional Benchmark
(`)##Mar 31, 16 last 1 year 8.22 7.11 7.15 10,822 10,711 10,715Mar 31, 14 last 3 years 8.04 8.04 7.85 12,614 12,613 12,549Mar 30, 12 last 5 years 8.22 8.36 7.54 14,847 14,947 14,387nov 18, 99 Since Inception 7.36 n.A. 6.49 34,359 n.A. 29,815
past performance may or may not be sustained in the future. Returns greater than 1 year period are compounded annualized (CAGR). load is not taken into consideration for computation of performance. # CRISIl liquid Fund Index ## CRISIl 1 year T-Bill Index. performance of dividend option under the schemes for the investors would be net of distribution tax as applicable. n.A.: not Available. For performance of other schemes managed by Anupam Joshi, please refer page 46. Different plans viz. Regular plan and Direct plan have a different expense structure. The expenses of the Direct plan under the Scheme will be lower to the extent of the distribution expenses / commission charged in the Regular plan. For performance of Direct plan, refer page no. 69.
Issuer rating % to Nav
SDl, CD/Cp, CrEDIT ExpOSurE
power Finance Corporation ltd. CRISIl - AAA 7.44
onGC petro Additions limited (opAl) (put on onGC limited) CRISIl - AAA(So) 6.67
Housing Development Finance Corporation ltd.£ CRISIl - AAA 5.45
national Bank for Agriculture & Rural Development CRISIL - A1+, AAA 4.00
Shriram TransportFinance Co. ltd.
CRISIL - AA+ / FITCH - AA+ 3.46
Rural ElectrificationCorporation ltd. CRISIl - AAA 3.32
Issuer rating % to Nav
nirchem Cement limited(100% subsidairy of nirma ltd. & Holding Co. of lafarge India ltd.) CRISIl - AA 3.17
petronet lnG ltd. CRISIL - AA+ 3.07
l&T Finance ltd. CARE AA, A1+ 2.87
Canara Bank FITCH - AA 2.50
Total of Top Ten Holdings 41.95
Total SDl, CD/Cp, Credit Exposure 95.63
Cash, Cash Equivalents and net Current Assets 4.37
grand Total 100.00
For complete portfolio, please visit www.hdfcfund.comoutstanding exposure in derivative instruments Interest Rate Swap (` in Crore) 100.00
Face Value per unit: ̀ 10 unless otherwise specified, + Industry Classification as recommended by AMFI, CD - Certificate of Deposit; CP - Commercial Papers. Data is as of March 31, 2017 unless otherwise specified.
SDl 2.33CD/Cp 5.38Credit Exposure 87.92Cash, Cash Equivalents and net Current Assets 4.37
Portfolio Classification by Asset Class (%)
Sovereign 2.33AAA/AAA(SO)/A1+/A1+(SO) & Equivalent 45.08AA+ & Below 48.01unrated 0.21Cash, Cash Equivalents and net Current Assets 4.37
Portfolio Classification by Rating Class (%)
£ Co-sponsor
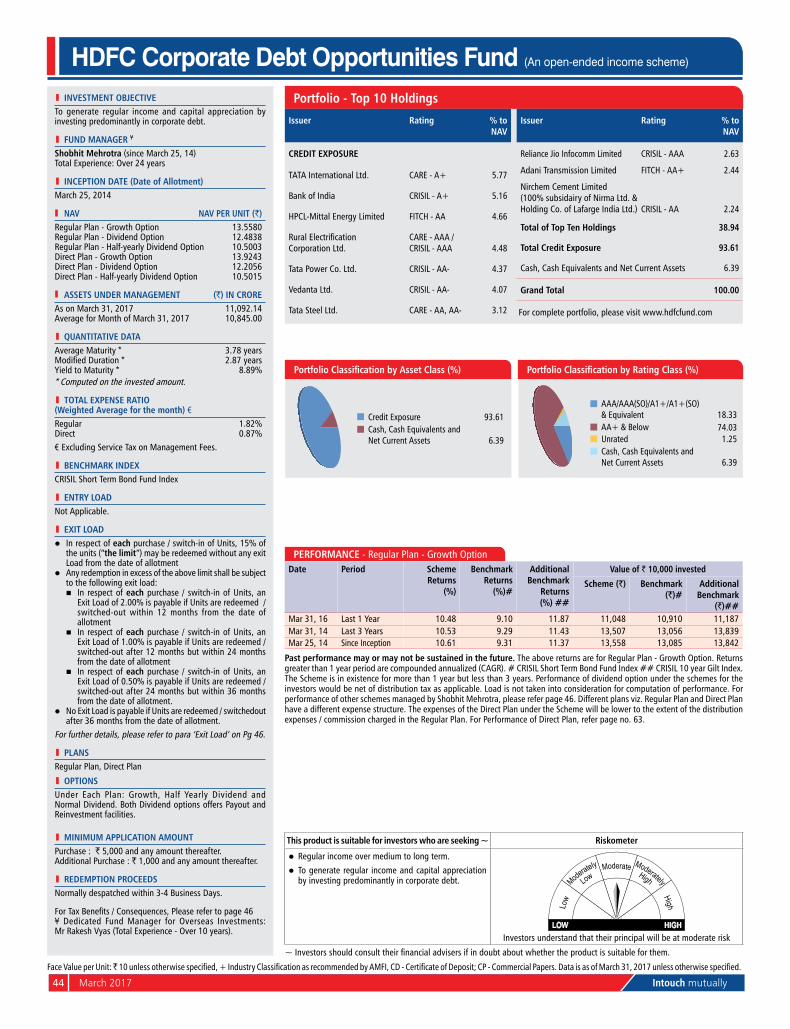
44 March 2017 Intouch mutually
l INvESTMENT OBjECTIvETo generate regular income and capital appreciation by investing predominantly in corporate debt.
l FuND MaNagEr ¥
Shobhit Mehrotra (since March 25, 14) Total Experience: over 24 years
l INCEpTION DaTE (Date of allotment)March 25, 2014
Nav Nav pEr uNIT (`)Regular plan - Growth option 13.5580Regular plan - Dividend option 12.4838Regular plan - Half-yearly Dividend option 10.5003Direct plan - Growth option 13.9243Direct plan - Dividend option 12.2056Direct plan - Half-yearly Dividend option 10.5015
aSSETS uNDEr MaNagEMENT (`) IN CrOrEAs on March 31, 2017 11,092.14Average for Month of March 31, 2017 10,845.00
l quaNTITaTIvE DaTaAverage Maturity * 3.78 yearsModified Duration * 2.87 yearsyield to Maturity * 8.89%* Computed on the invested amount.
l TOTal ExpENSE raTIO (Weighted average for the month) €Regular 1.82%Direct 0.87%€ Excluding Service Tax on Management Fees.
l BENCHMarK INDExCRISIl Short Term Bond Fund Index
l ENTrY lOaDnot Applicable.
l ExIT lOaDl In respect of each purchase / switch-in of units, 15% of
the units (“the limit”) may be redeemed without any exit load from the date of allotment
l Any redemption in excess of the above limit shall be subject to the following exit load:
n In respect of each purchase / switch-in of units, an Exit load of 2.00% is payable if units are redeemed / switched-out within 12 months from the date of allotment
n In respect of each purchase / switch-in of units, an Exit load of 1.00% is payable if units are redeemed / switched-out after 12 months but within 24 months from the date of allotment
n In respect of each purchase / switch-in of units, an Exit load of 0.50% is payable if units are redeemed / switched-out after 24 months but within 36 months from the date of allotment.
l no Exit load is payable if units are redeemed / switchedout after 36 months from the date of allotment.
For further details, please refer to para ‘Exit load’ on pg 46.
l plaNSRegular plan, Direct plan
l OpTIONSunder Each plan: Growth, Half yearly Dividend and normal Dividend. Both Dividend options offers payout and Reinvestment facilities.
l MINIMuM applICaTION aMOuNTpurchase : ` 5,000 and any amount thereafter. Additional purchase : ` 1,000 and any amount thereafter.
l rEDEMpTION prOCEEDSnormally despatched within 3-4 Business Days.
For Tax Benefits / Consequences, Please refer to page 46¥ Dedicated Fund Manager for overseas Investments: Mr Rakesh Vyas (Total Experience - over 10 years).
HDFC Corporate Debt Opportunities Fund (An open-ended income scheme)
portfolio - Top 10 Holdings
Issuer rating % to Nav
CrEDIT ExpOSurE
TATA International ltd. CARE - A+ 5.77
Bank of India CRISIL - A+ 5.16
HpCl-Mittal Energy limited FITCH - AA 4.66
Rural ElectrificationCorporation ltd.
CARE - AAA /CRISIl - AAA 4.48
Tata power Co. ltd. CRISIl - AA- 4.37
Vedanta ltd. CRISIl - AA- 4.07
Tata Steel ltd. CARE - AA, AA- 3.12
Issuer rating % to Nav
Reliance Jio Infocomm limited CRISIl - AAA 2.63
Adani Transmission limited FITCH - AA+ 2.44
nirchem Cement limited(100% subsidairy of nirma ltd. & Holding Co. of lafarge India ltd.) CRISIl - AA 2.24
Total of Top Ten Holdings 38.94
Total Credit Exposure 93.61
Cash, Cash Equivalents and net Current Assets 6.39
grand Total 100.00
For complete portfolio, please visit www.hdfcfund.com
This product is suitable for investors who are seeking ~ riskometer
l Regular income over medium to long term.l To generate regular income and capital appreciation
by investing predominantly in corporate debt.
Investors understand that their principal will be at moderate risk
~ Investors should consult their financial advisers if in doubt about whether the product is suitable for them.
HDFC Corporate Debt Opportunities Fund
Credit Exposure 93.61Cash, Cash Equivalents and net Current Assets 6.39
Portfolio Classification by Asset Class (%)
AAA/AAA(SO)/A1+/A1+(SO) & Equivalent 18.33AA+ & Below 74.03unrated 1.25Cash, Cash Equivalents and net Current Assets 6.39
Portfolio Classification by Rating Class (%)
Face Value per unit: ̀ 10 unless otherwise specified, + Industry Classification as recommended by AMFI, CD - Certificate of Deposit; CP - Commercial Papers. Data is as of March 31, 2017 unless otherwise specified.
pErFOrMaNCE - Regular plan - Growth optionDate period Scheme
returns (%)
Benchmark returns
(%)#
additional Benchmark
returns (%) ##
value of ` 10,000 invested
Scheme (`) Benchmark (`)#
additional Benchmark
(`)##Mar 31, 16 last 1 year 10.48 9.10 11.87 11,048 10,910 11,187Mar 31, 14 last 3 years 10.53 9.29 11.43 13,507 13,056 13,839Mar 25, 14 Since Inception 10.61 9.31 11.37 13,558 13,085 13,842
past performance may or may not be sustained in the future. The above returns are for Regular plan - Growth option. Returns greater than 1 year period are compounded annualized (CAGR). # CRISIl Short Term Bond Fund Index ## CRISIl 10 year Gilt Index. The Scheme is in existence for more than 1 year but less than 3 years. performance of dividend option under the schemes for the investors would be net of distribution tax as applicable. load is not taken into consideration for computation of performance. For performance of other schemes managed by Shobhit Mehrotra, please refer page 46. Different plans viz. Regular plan and Direct plan have a different expense structure. The expenses of the Direct plan under the Scheme will be lower to the extent of the distribution expenses / commission charged in the Regular plan. For performance of Direct plan, refer page no. 63.
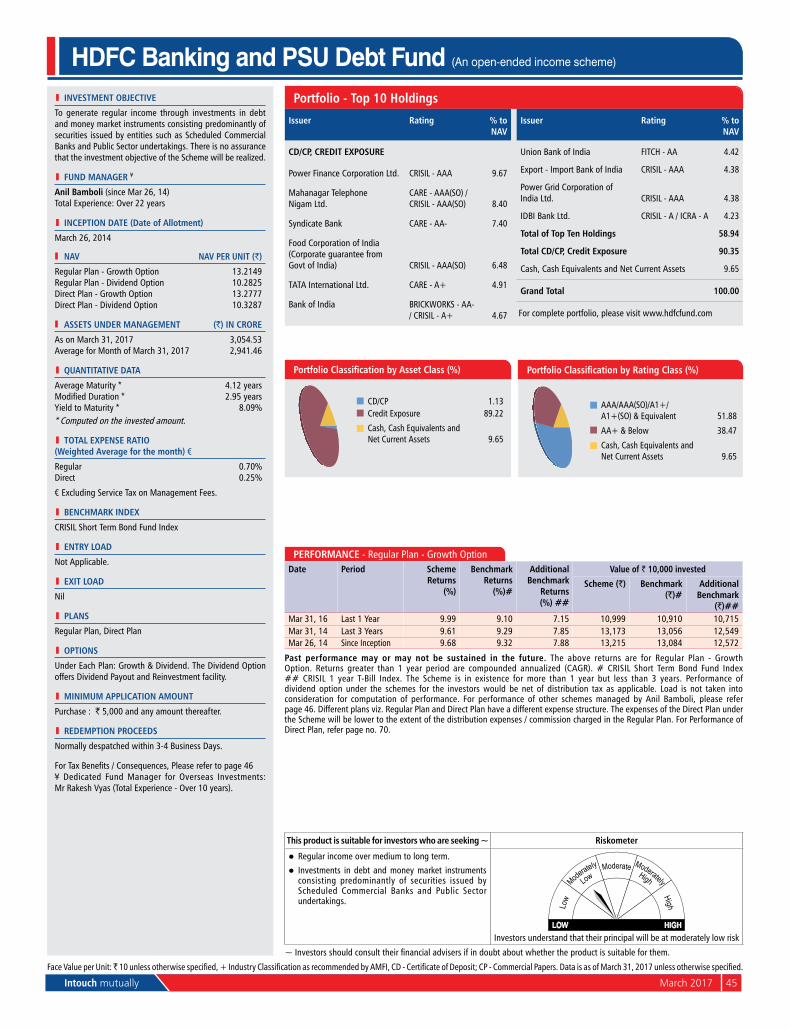
Intouch mutually March 2017 45
l INvESTMENT OBjECTIvE
To generate regular income through investments in debt and money market instruments consisting predominantly of securities issued by entities such as Scheduled Commercial Banks and public Sector undertakings. There is no assurance that the investment objective of the Scheme will be realized.
l FuND MaNagEr ¥
anil Bamboli (since Mar 26, 14)
Total Experience: over 22 years
l INCEpTION DaTE (Date of allotment)
March 26, 2014
Nav Nav pEr uNIT (`)
Regular plan - Growth option 13.2149Regular plan - Dividend option 10.2825Direct plan - Growth option 13.2777Direct plan - Dividend option 10.3287
aSSETS uNDEr MaNagEMENT (`) IN CrOrE
As on March 31, 2017 3,054.53Average for Month of March 31, 2017 2,941.46
l quaNTITaTIvE DaTa
Average Maturity * 4.12 yearsModified Duration * 2.95 yearsyield to Maturity * 8.09%* Computed on the invested amount.
l TOTal ExpENSE raTIO (Weighted average for the month) €
Regular 0.70%Direct 0.25%
€ Excluding Service Tax on Management Fees.
l BENCHMarK INDEx
CRISIl Short Term Bond Fund Index
l ENTrY lOaD
not Applicable.
l ExIT lOaD
nil
l plaNS
Regular plan, Direct plan
l OpTIONS
under Each plan: Growth & Dividend. The Dividend option offers Dividend payout and Reinvestment facility.
l MINIMuM applICaTION aMOuNT
purchase : ` 5,000 and any amount thereafter.
l rEDEMpTION prOCEEDS
normally despatched within 3-4 Business Days.
For Tax Benefits / Consequences, Please refer to page 46¥ Dedicated Fund Manager for overseas Investments: Mr Rakesh Vyas (Total Experience - over 10 years).
HDFC Banking and PSU Debt Fund (An open-ended income scheme)
portfolio - Top 10 Holdings
This product is suitable for investors who are seeking ~ riskometer
l Regular income over medium to long term.l Investments in debt and money market instruments
consisting predominantly of securities issued by Scheduled Commercial Banks and public Sector undertakings.
Investors understand that their principal will be at moderately low risk
~ Investors should consult their financial advisers if in doubt about whether the product is suitable for them.
Issuer rating % to Nav
CD/Cp, CrEDIT ExpOSurE
power Finance Corporation ltd. CRISIl - AAA 9.67
Mahanagar Telephonenigam ltd.
CARE - AAA(So) / CRISIl - AAA(So) 8.40
Syndicate Bank CARE - AA- 7.40
Food Corporation of India (Corporate guarantee fromGovt of India) CRISIl - AAA(So) 6.48
TATA International ltd. CARE - A+ 4.91
Bank of India BRICKWoRKS - AA- / CRISIL - A+ 4.67
Issuer rating % to Nav
union Bank of India FITCH - AA 4.42
Export - Import Bank of India CRISIl - AAA 4.38
power Grid Corporation of India ltd. CRISIl - AAA 4.38
IDBI Bank ltd. CRISIl - A / ICRA - A 4.23
Total of Top Ten Holdings 58.94
Total CD/Cp, Credit Exposure 90.35
Cash, Cash Equivalents and net Current Assets 9.65
grand Total 100.00
For complete portfolio, please visit www.hdfcfund.com
Face Value per unit: ̀ 10 unless otherwise specified, + Industry Classification as recommended by AMFI, CD - Certificate of Deposit; CP - Commercial Papers. Data is as of March 31, 2017 unless otherwise specified.
CD/Cp 1.13Credit Exposure 89.22
Cash, Cash Equivalents and net Current Assets 9.65
Portfolio Classification by Asset Class (%)
AAA/AAA(SO)/A1+/A1+(SO) & Equivalent 51.88
AA+ & Below 38.47
Cash, Cash Equivalents and net Current Assets 9.65
Portfolio Classification by Rating Class (%)
pErFOrMaNCE - Regular plan - Growth optionDate period Scheme
returns (%)
Benchmark returns
(%)#
additional Benchmark
returns (%) ##
value of ` 10,000 invested
Scheme (`) Benchmark (`)#
additional Benchmark
(`)##Mar 31, 16 last 1 year 9.99 9.10 7.15 10,999 10,910 10,715Mar 31, 14 last 3 years 9.61 9.29 7.85 13,173 13,056 12,549Mar 26, 14 Since Inception 9.68 9.32 7.88 13,215 13,084 12,572
past performance may or may not be sustained in the future. The above returns are for Regular plan - Growth option. Returns greater than 1 year period are compounded annualized (CAGR). # CRISIl Short Term Bond Fund Index ## CRISIl 1 year T-Bill Index. The Scheme is in existence for more than 1 year but less than 3 years. performance of dividend option under the schemes for the investors would be net of distribution tax as applicable. load is not taken into consideration for computation of performance. For performance of other schemes managed by Anil Bamboli, please refer page 46. Different plans viz. Regular plan and Direct plan have a different expense structure. The expenses of the Direct plan under the Scheme will be lower to the extent of the distribution expenses / commission charged in the Regular plan. For performance of Direct plan, refer page no. 70.
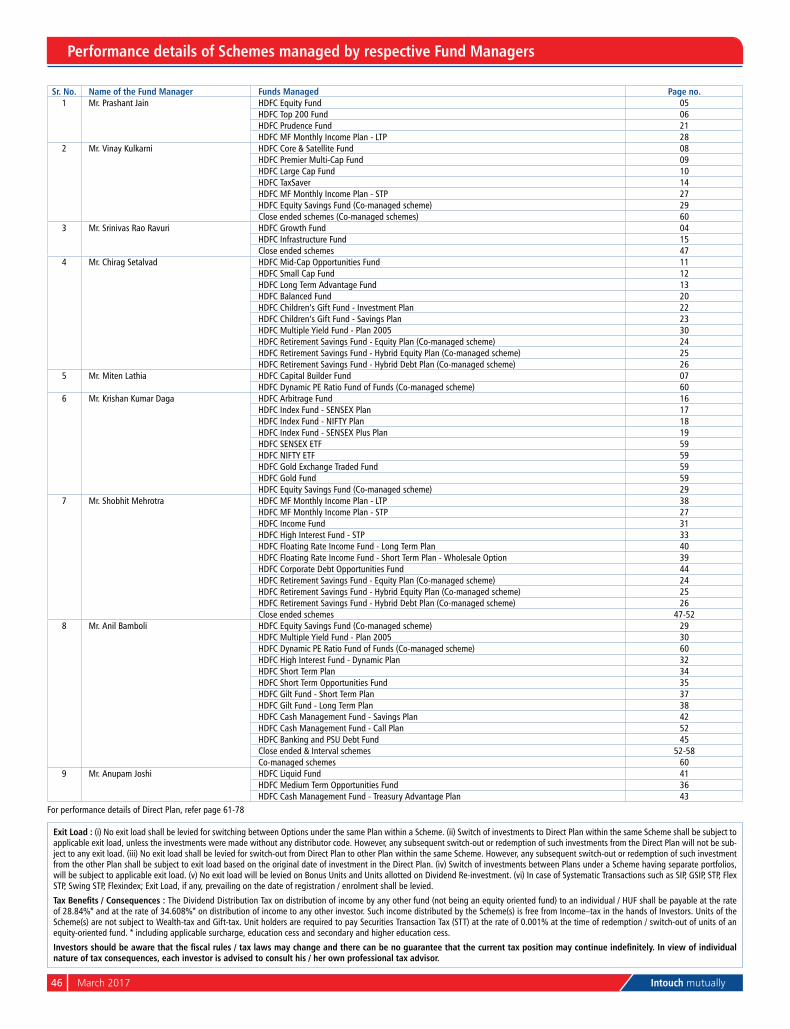
46 March 2017 Intouch mutually
Performance details of Schemes managed by respective Fund Managers
Sr. No. Name of the Fund Manager Funds Managed Page no.1 Mr. Prashant Jain HDFC Equity Fund 05
HDFC Top 200 Fund 06HDFC Prudence Fund 21HDFC MF Monthly Income Plan - LTP 28
2 Mr. Vinay Kulkarni HDFC Core & Satellite Fund 08HDFC Premier Multi-Cap Fund 09HDFC Large Cap Fund 10HDFC TaxSaver 14HDFC MF Monthly Income Plan - STP 27HDFC Equity Savings Fund (Co-managed scheme) 29Close ended schemes (Co-managed schemes) 60
3 Mr. Srinivas Rao Ravuri HDFC Growth Fund 04HDFC Infrastructure Fund 15Close ended schemes 47
4 Mr. Chirag Setalvad HDFC Mid-Cap Opportunities Fund 11HDFC Small Cap Fund 12HDFC Long Term Advantage Fund 13HDFC Balanced Fund 20HDFC Children’s Gift Fund - Investment Plan 22HDFC Children’s Gift Fund - Savings Plan 23HDFC Multiple Yield Fund - Plan 2005 30HDFC Retirement Savings Fund - Equity Plan (Co-managed scheme) 24HDFC Retirement Savings Fund - Hybrid Equity Plan (Co-managed scheme) 25HDFC Retirement Savings Fund - Hybrid Debt Plan (Co-managed scheme) 26
5 Mr. Miten Lathia HDFC Capital Builder Fund 07HDFC Dynamic PE Ratio Fund of Funds (Co-managed scheme) 60
6 Mr. Krishan Kumar Daga HDFC Arbitrage Fund 16HDFC Index Fund - SEnSEx Plan 17HDFC Index Fund - nIFTY Plan 18HDFC Index Fund - SEnSEx Plus Plan 19HDFC SEnSEx ETF 59HDFC nIFTY ETF 59HDFC Gold Exchange Traded Fund 59HDFC Gold Fund 59HDFC Equity Savings Fund (Co-managed scheme) 29
7 Mr. Shobhit Mehrotra HDFC MF Monthly Income Plan - LTP 38HDFC MF Monthly Income Plan - STP 27HDFC Income Fund 31HDFC High Interest Fund - STP 33HDFC Floating Rate Income Fund - Long Term Plan 40HDFC Floating Rate Income Fund - Short Term Plan - Wholesale Option 39HDFC Corporate Debt Opportunities Fund 44HDFC Retirement Savings Fund - Equity Plan (Co-managed scheme) 24HDFC Retirement Savings Fund - Hybrid Equity Plan (Co-managed scheme) 25HDFC Retirement Savings Fund - Hybrid Debt Plan (Co-managed scheme) 26Close ended schemes 47-52
8 Mr. Anil Bamboli HDFC Equity Savings Fund (Co-managed scheme) 29HDFC Multiple Yield Fund - Plan 2005 30HDFC Dynamic PE Ratio Fund of Funds (Co-managed scheme) 60HDFC High Interest Fund - Dynamic Plan 32HDFC Short Term Plan 34HDFC Short Term Opportunities Fund 35HDFC Gilt Fund - Short Term Plan 37HDFC Gilt Fund - Long Term Plan 38HDFC Cash Management Fund - Savings Plan 42HDFC Cash Management Fund - Call Plan 52HDFC Banking and PSU Debt Fund 45Close ended & Interval schemes 52-58Co-managed schemes 60
9 Mr. Anupam Joshi HDFC Liquid Fund 41HDFC Medium Term Opportunities Fund 36HDFC Cash Management Fund - Treasury Advantage Plan 43
For performance details of Direct Plan, refer page 61-78
Exit Load : (i) no exit load shall be levied for switching between Options under the same Plan within a Scheme. (ii) Switch of investments to Direct Plan within the same Scheme shall be subject to applicable exit load, unless the investments were made without any distributor code. However, any subsequent switch-out or redemption of such investments from the Direct Plan will not be sub-ject to any exit load. (iii) no exit load shall be levied for switch-out from Direct Plan to other Plan within the same Scheme. However, any subsequent switch-out or redemption of such investment from the other Plan shall be subject to exit load based on the original date of investment in the Direct Plan. (iv) Switch of investments between Plans under a Scheme having separate portfolios, will be subject to applicable exit load. (v) no exit load will be levied on Bonus Units and Units allotted on Dividend Re-investment. (vi) In case of Systematic Transactions such as SIP, GSIP, STP, Flex STP, Swing STP, Flexindex; Exit Load, if any, prevailing on the date of registration / enrolment shall be levied.
Tax Benefits / Consequences : The Dividend Distribution Tax on distribution of income by any other fund (not being an equity oriented fund) to an individual / HUF shall be payable at the rate of 28.84%* and at the rate of 34.608%* on distribution of income to any other investor. Such income distributed by the Scheme(s) is free from Income–tax in the hands of Investors. Units of the Scheme(s) are not subject to Wealth-tax and Gift-tax. Unit holders are required to pay Securities Transaction Tax (STT) at the rate of 0.001% at the time of redemption / switch-out of units of an equity-oriented fund. * including applicable surcharge, education cess and secondary and higher education cess.
Investors should be aware that the fiscal rules / tax laws may change and there can be no guarantee that the current tax position may continue indefinitely. In view of individual nature of tax consequences, each investor is advised to consult his / her own professional tax advisor.
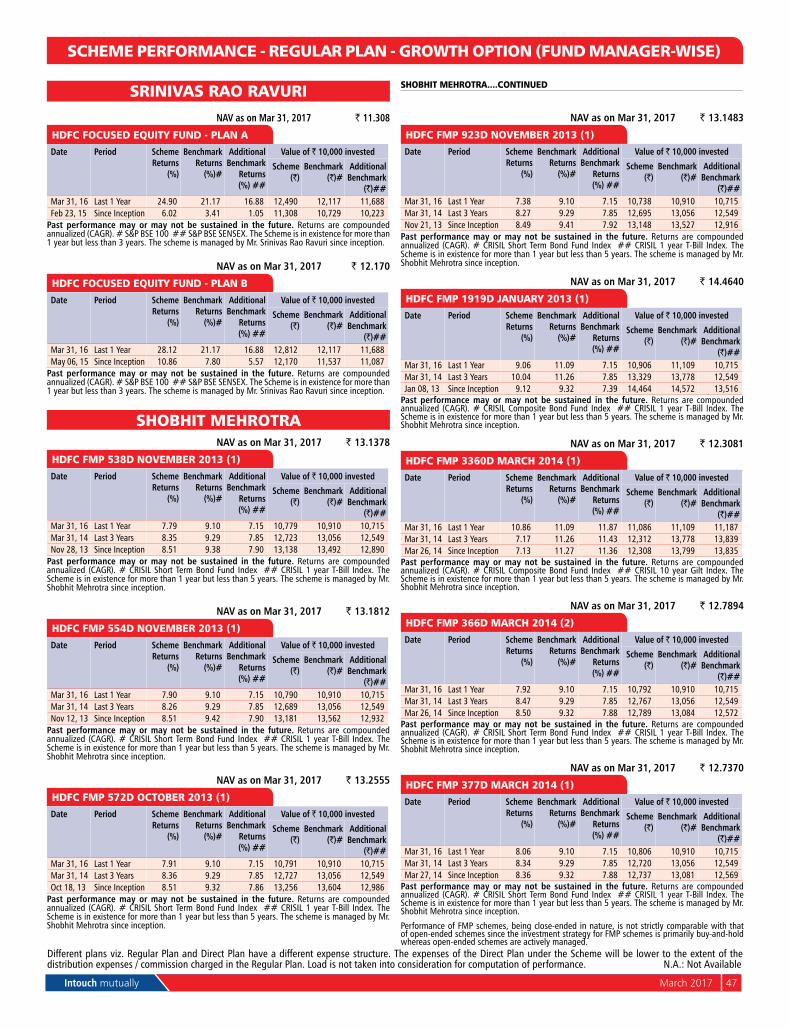
Intouch mutually March 2017 47
SCHEME PERFORMANCE - REGULAR PLAN - GROWTH OPTION (FUND MANAGER-WISE)
Different plans viz. Regular Plan and Direct Plan have a different expense structure. The expenses of the Direct Plan under the Scheme will be lower to the extent of the distribution expenses / commission charged in the Regular Plan. Load is not taken into consideration for computation of performance. n.A.: not Available
SRINIVAS RAO RAVURI
NAV as on Mar 31, 2017 ` 11.308
HDFC FOCUSED EQUITY FUND - PLAN A Date Period Scheme
Returns (%)
Benchmark Returns
(%)#
Additional Benchmark
Returns (%) ##
Value of ` 10,000 invested
Scheme (`)
Benchmark (`)#
Additional Benchmark
(`)##Mar 31, 16 Last 1 Year 24.90 21.17 16.88 12,490 12,117 11,688Feb 23, 15 Since Inception 6.02 3.41 1.05 11,308 10,729 10,223
Past performance may or may not be sustained in the future. Returns are compounded annualized (CAGR). # S&P BSE 100 ## S&P BSE SEnSEx. The Scheme is in existence for more than 1 year but less than 3 years. The scheme is managed by Mr. Srinivas Rao Ravuri since inception.
NAV as on Mar 31, 2017 ` 12.170
HDFC FOCUSED EQUITY FUND - PLAN B Date Period Scheme
Returns (%)
Benchmark Returns
(%)#
Additional Benchmark
Returns (%) ##
Value of ` 10,000 invested
Scheme (`)
Benchmark (`)#
Additional Benchmark
(`)##Mar 31, 16 Last 1 Year 28.12 21.17 16.88 12,812 12,117 11,688May 06, 15 Since Inception 10.86 7.80 5.57 12,170 11,537 11,087
Past performance may or may not be sustained in the future. Returns are compounded annualized (CAGR). # S&P BSE 100 ## S&P BSE SEnSEx. The Scheme is in existence for more than 1 year but less than 3 years. The scheme is managed by Mr. Srinivas Rao Ravuri since inception.
SHOBHIT MEHROTRA NAV as on Mar 31, 2017 ` 13.1378
HDFC FMP 538D NOVEMBER 2013 (1) Date Period Scheme
Returns (%)
Benchmark Returns
(%)#
Additional Benchmark
Returns (%) ##
Value of ` 10,000 invested
Scheme (`)
Benchmark (`)#
Additional Benchmark
(`)##Mar 31, 16 Last 1 Year 7.79 9.10 7.15 10,779 10,910 10,715Mar 31, 14 Last 3 Years 8.35 9.29 7.85 12,723 13,056 12,549nov 28, 13 Since Inception 8.51 9.38 7.90 13,138 13,492 12,890
Past performance may or may not be sustained in the future. Returns are compounded annualized (CAGR). # CRISIL Short Term Bond Fund Index ## CRISIL 1 year T-Bill Index. The Scheme is in existence for more than 1 year but less than 5 years. The scheme is managed by Mr. Shobhit Mehrotra since inception.
NAV as on Mar 31, 2017 ` 13.1812
HDFC FMP 554D NOVEMBER 2013 (1) Date Period Scheme
Returns (%)
Benchmark Returns
(%)#
Additional Benchmark
Returns (%) ##
Value of ` 10,000 invested
Scheme (`)
Benchmark (`)#
Additional Benchmark
(`)##Mar 31, 16 Last 1 Year 7.90 9.10 7.15 10,790 10,910 10,715Mar 31, 14 Last 3 Years 8.26 9.29 7.85 12,689 13,056 12,549nov 12, 13 Since Inception 8.51 9.42 7.90 13,181 13,562 12,932
Past performance may or may not be sustained in the future. Returns are compounded annualized (CAGR). # CRISIL Short Term Bond Fund Index ## CRISIL 1 year T-Bill Index. The Scheme is in existence for more than 1 year but less than 5 years. The scheme is managed by Mr. Shobhit Mehrotra since inception.
NAV as on Mar 31, 2017 ` 13.2555
HDFC FMP 572D OCTOBER 2013 (1) Date Period Scheme
Returns (%)
Benchmark Returns
(%)#
Additional Benchmark
Returns (%) ##
Value of ` 10,000 invested
Scheme (`)
Benchmark (`)#
Additional Benchmark
(`)##Mar 31, 16 Last 1 Year 7.91 9.10 7.15 10,791 10,910 10,715Mar 31, 14 Last 3 Years 8.36 9.29 7.85 12,727 13,056 12,549Oct 18, 13 Since Inception 8.51 9.32 7.86 13,256 13,604 12,986
Past performance may or may not be sustained in the future. Returns are compounded annualized (CAGR). # CRISIL Short Term Bond Fund Index ## CRISIL 1 year T-Bill Index. The Scheme is in existence for more than 1 year but less than 5 years. The scheme is managed by Mr. Shobhit Mehrotra since inception.
NAV as on Mar 31, 2017 ` 13.1483
HDFC FMP 923D NOVEMBER 2013 (1) Date Period Scheme
Returns (%)
Benchmark Returns
(%)#
Additional Benchmark
Returns (%) ##
Value of ` 10,000 invested
Scheme (`)
Benchmark (`)#
Additional Benchmark
(`)##Mar 31, 16 Last 1 Year 7.38 9.10 7.15 10,738 10,910 10,715Mar 31, 14 Last 3 Years 8.27 9.29 7.85 12,695 13,056 12,549nov 21, 13 Since Inception 8.49 9.41 7.92 13,148 13,527 12,916
Past performance may or may not be sustained in the future. Returns are compounded annualized (CAGR). # CRISIL Short Term Bond Fund Index ## CRISIL 1 year T-Bill Index. The Scheme is in existence for more than 1 year but less than 5 years. The scheme is managed by Mr. Shobhit Mehrotra since inception.
NAV as on Mar 31, 2017 ` 14.4640
HDFC FMP 1919D JANUARY 2013 (1) Date Period Scheme
Returns (%)
Benchmark Returns
(%)#
Additional Benchmark
Returns (%) ##
Value of ` 10,000 invested
Scheme (`)
Benchmark (`)#
Additional Benchmark
(`)##Mar 31, 16 Last 1 Year 9.06 11.09 7.15 10,906 11,109 10,715Mar 31, 14 Last 3 Years 10.04 11.26 7.85 13,329 13,778 12,549Jan 08, 13 Since Inception 9.12 9.32 7.39 14,464 14,572 13,516
Past performance may or may not be sustained in the future. Returns are compounded annualized (CAGR). # CRISIL Composite Bond Fund Index ## CRISIL 1 year T-Bill Index. The Scheme is in existence for more than 1 year but less than 5 years. The scheme is managed by Mr. Shobhit Mehrotra since inception.
NAV as on Mar 31, 2017 ` 12.3081
HDFC FMP 3360D MARCH 2014 (1) Date Period Scheme
Returns (%)
Benchmark Returns
(%)#
Additional Benchmark
Returns (%) ##
Value of ` 10,000 invested
Scheme (`)
Benchmark (`)#
Additional Benchmark
(`)##Mar 31, 16 Last 1 Year 10.86 11.09 11.87 11,086 11,109 11,187Mar 31, 14 Last 3 Years 7.17 11.26 11.43 12,312 13,778 13,839Mar 26, 14 Since Inception 7.13 11.27 11.36 12,308 13,799 13,835
Past performance may or may not be sustained in the future. Returns are compounded annualized (CAGR). # CRISIL Composite Bond Fund Index ## CRISIL 10 year Gilt Index. The Scheme is in existence for more than 1 year but less than 5 years. The scheme is managed by Mr. Shobhit Mehrotra since inception.
NAV as on Mar 31, 2017 ` 12.7894
HDFC FMP 366D MARCH 2014 (2) Date Period Scheme
Returns (%)
Benchmark Returns
(%)#
Additional Benchmark
Returns (%) ##
Value of ` 10,000 invested
Scheme (`)
Benchmark (`)#
Additional Benchmark
(`)##Mar 31, 16 Last 1 Year 7.92 9.10 7.15 10,792 10,910 10,715Mar 31, 14 Last 3 Years 8.47 9.29 7.85 12,767 13,056 12,549Mar 26, 14 Since Inception 8.50 9.32 7.88 12,789 13,084 12,572
Past performance may or may not be sustained in the future. Returns are compounded annualized (CAGR). # CRISIL Short Term Bond Fund Index ## CRISIL 1 year T-Bill Index. The Scheme is in existence for more than 1 year but less than 5 years. The scheme is managed by Mr. Shobhit Mehrotra since inception.
NAV as on Mar 31, 2017 ` 12.7370
HDFC FMP 377D MARCH 2014 (1) Date Period Scheme
Returns (%)
Benchmark Returns
(%)#
Additional Benchmark
Returns (%) ##
Value of ` 10,000 invested
Scheme (`)
Benchmark (`)#
Additional Benchmark
(`)##Mar 31, 16 Last 1 Year 8.06 9.10 7.15 10,806 10,910 10,715Mar 31, 14 Last 3 Years 8.34 9.29 7.85 12,720 13,056 12,549Mar 27, 14 Since Inception 8.36 9.32 7.88 12,737 13,081 12,569
Past performance may or may not be sustained in the future. Returns are compounded annualized (CAGR). # CRISIL Short Term Bond Fund Index ## CRISIL 1 year T-Bill Index. The Scheme is in existence for more than 1 year but less than 5 years. The scheme is managed by Mr. Shobhit Mehrotra since inception.
Performance of FMP schemes, being close-ended in nature, is not strictly comparable with that of open-ended schemes since the investment strategy for FMP schemes is primarily buy-and-hold whereas open-ended schemes are actively managed.
SHOBHIT MEHROTRA....CONTINUED
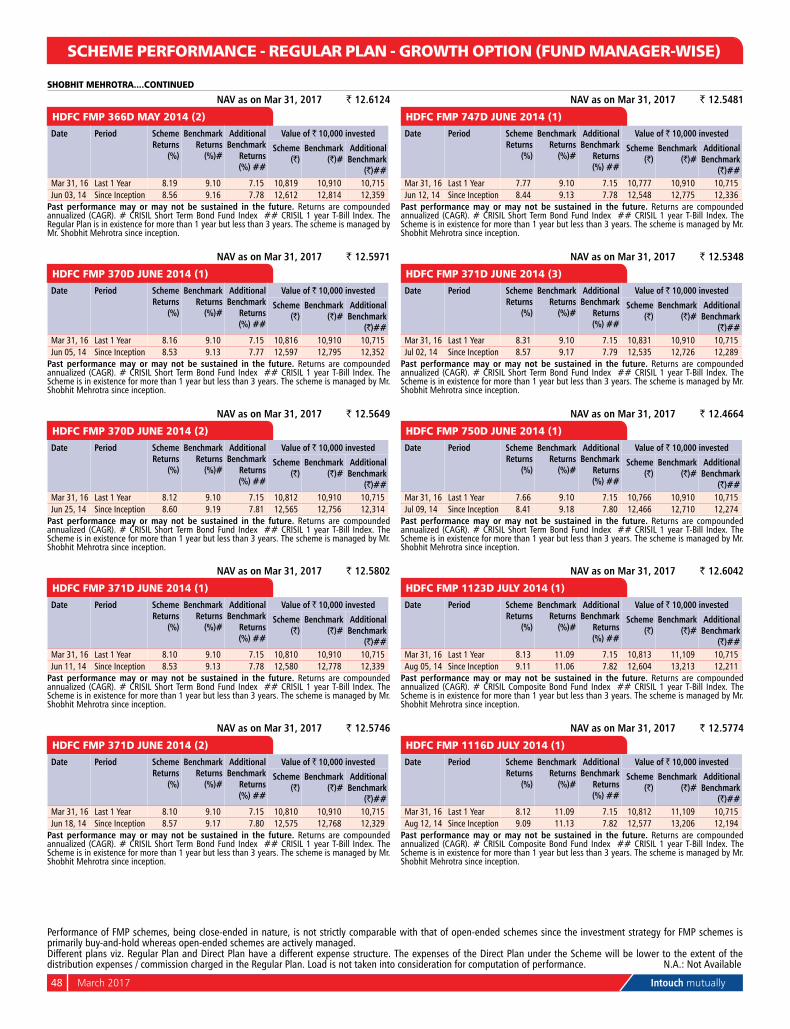
48 March 2017 Intouch mutually
SCHEME PERFORMANCE - REGULAR PLAN - GROWTH OPTION (FUND MANAGER-WISE)
NAV as on Mar 31, 2017 ` 12.6124
HDFC FMP 366D MAY 2014 (2) Date Period Scheme
Returns (%)
Benchmark Returns
(%)#
Additional Benchmark
Returns (%) ##
Value of ` 10,000 invested
Scheme (`)
Benchmark (`)#
Additional Benchmark
(`)##Mar 31, 16 Last 1 Year 8.19 9.10 7.15 10,819 10,910 10,715Jun 03, 14 Since Inception 8.56 9.16 7.78 12,612 12,814 12,359
Past performance may or may not be sustained in the future. Returns are compounded annualized (CAGR). # CRISIL Short Term Bond Fund Index ## CRISIL 1 year T-Bill Index. The Regular Plan is in existence for more than 1 year but less than 3 years. The scheme is managed by Mr. Shobhit Mehrotra since inception.
NAV as on Mar 31, 2017 ` 12.5971
HDFC FMP 370D JUNE 2014 (1) Date Period Scheme
Returns (%)
Benchmark Returns
(%)#
Additional Benchmark
Returns (%) ##
Value of ` 10,000 invested
Scheme (`)
Benchmark (`)#
Additional Benchmark
(`)##Mar 31, 16 Last 1 Year 8.16 9.10 7.15 10,816 10,910 10,715Jun 05, 14 Since Inception 8.53 9.13 7.77 12,597 12,795 12,352
Past performance may or may not be sustained in the future. Returns are compounded annualized (CAGR). # CRISIL Short Term Bond Fund Index ## CRISIL 1 year T-Bill Index. The Scheme is in existence for more than 1 year but less than 3 years. The scheme is managed by Mr. Shobhit Mehrotra since inception.
NAV as on Mar 31, 2017 ` 12.5649
HDFC FMP 370D JUNE 2014 (2) Date Period Scheme
Returns (%)
Benchmark Returns
(%)#
Additional Benchmark
Returns (%) ##
Value of ` 10,000 invested
Scheme (`)
Benchmark (`)#
Additional Benchmark
(`)##Mar 31, 16 Last 1 Year 8.12 9.10 7.15 10,812 10,910 10,715Jun 25, 14 Since Inception 8.60 9.19 7.81 12,565 12,756 12,314
Past performance may or may not be sustained in the future. Returns are compounded annualized (CAGR). # CRISIL Short Term Bond Fund Index ## CRISIL 1 year T-Bill Index. The Scheme is in existence for more than 1 year but less than 3 years. The scheme is managed by Mr. Shobhit Mehrotra since inception.
NAV as on Mar 31, 2017 ` 12.5802
HDFC FMP 371D JUNE 2014 (1) Date Period Scheme
Returns (%)
Benchmark Returns
(%)#
Additional Benchmark
Returns (%) ##
Value of ` 10,000 invested
Scheme (`)
Benchmark (`)#
Additional Benchmark
(`)##Mar 31, 16 Last 1 Year 8.10 9.10 7.15 10,810 10,910 10,715Jun 11, 14 Since Inception 8.53 9.13 7.78 12,580 12,778 12,339
Past performance may or may not be sustained in the future. Returns are compounded annualized (CAGR). # CRISIL Short Term Bond Fund Index ## CRISIL 1 year T-Bill Index. The Scheme is in existence for more than 1 year but less than 3 years. The scheme is managed by Mr. Shobhit Mehrotra since inception.
NAV as on Mar 31, 2017 ` 12.5746
HDFC FMP 371D JUNE 2014 (2) Date Period Scheme
Returns (%)
Benchmark Returns
(%)#
Additional Benchmark
Returns (%) ##
Value of ` 10,000 invested
Scheme (`)
Benchmark (`)#
Additional Benchmark
(`)##Mar 31, 16 Last 1 Year 8.10 9.10 7.15 10,810 10,910 10,715Jun 18, 14 Since Inception 8.57 9.17 7.80 12,575 12,768 12,329
Past performance may or may not be sustained in the future. Returns are compounded annualized (CAGR). # CRISIL Short Term Bond Fund Index ## CRISIL 1 year T-Bill Index. The Scheme is in existence for more than 1 year but less than 3 years. The scheme is managed by Mr. Shobhit Mehrotra since inception.
NAV as on Mar 31, 2017 ` 12.5481
HDFC FMP 747D JUNE 2014 (1) Date Period Scheme
Returns (%)
Benchmark Returns
(%)#
Additional Benchmark
Returns (%) ##
Value of ` 10,000 invested
Scheme (`)
Benchmark (`)#
Additional Benchmark
(`)##Mar 31, 16 Last 1 Year 7.77 9.10 7.15 10,777 10,910 10,715Jun 12, 14 Since Inception 8.44 9.13 7.78 12,548 12,775 12,336
Past performance may or may not be sustained in the future. Returns are compounded annualized (CAGR). # CRISIL Short Term Bond Fund Index ## CRISIL 1 year T-Bill Index. The Scheme is in existence for more than 1 year but less than 3 years. The scheme is managed by Mr. Shobhit Mehrotra since inception.
NAV as on Mar 31, 2017 ` 12.5348
HDFC FMP 371D JUNE 2014 (3) Date Period Scheme
Returns (%)
Benchmark Returns
(%)#
Additional Benchmark
Returns (%) ##
Value of ` 10,000 invested
Scheme (`)
Benchmark (`)#
Additional Benchmark
(`)##Mar 31, 16 Last 1 Year 8.31 9.10 7.15 10,831 10,910 10,715Jul 02, 14 Since Inception 8.57 9.17 7.79 12,535 12,726 12,289
Past performance may or may not be sustained in the future. Returns are compounded annualized (CAGR). # CRISIL Short Term Bond Fund Index ## CRISIL 1 year T-Bill Index. The Scheme is in existence for more than 1 year but less than 3 years. The scheme is managed by Mr. Shobhit Mehrotra since inception.
NAV as on Mar 31, 2017 ` 12.4664
HDFC FMP 750D JUNE 2014 (1) Date Period Scheme
Returns (%)
Benchmark Returns
(%)#
Additional Benchmark
Returns (%) ##
Value of ` 10,000 invested
Scheme (`)
Benchmark (`)#
Additional Benchmark
(`)##Mar 31, 16 Last 1 Year 7.66 9.10 7.15 10,766 10,910 10,715Jul 09, 14 Since Inception 8.41 9.18 7.80 12,466 12,710 12,274
Past performance may or may not be sustained in the future. Returns are compounded annualized (CAGR). # CRISIL Short Term Bond Fund Index ## CRISIL 1 year T-Bill Index. The Scheme is in existence for more than 1 year but less than 3 years. The scheme is managed by Mr. Shobhit Mehrotra since inception.
NAV as on Mar 31, 2017 ` 12.6042
HDFC FMP 1123D JULY 2014 (1) Date Period Scheme
Returns (%)
Benchmark Returns
(%)#
Additional Benchmark
Returns (%) ##
Value of ` 10,000 invested
Scheme (`)
Benchmark (`)#
Additional Benchmark
(`)##Mar 31, 16 Last 1 Year 8.13 11.09 7.15 10,813 11,109 10,715Aug 05, 14 Since Inception 9.11 11.06 7.82 12,604 13,213 12,211
Past performance may or may not be sustained in the future. Returns are compounded annualized (CAGR). # CRISIL Composite Bond Fund Index ## CRISIL 1 year T-Bill Index. The Scheme is in existence for more than 1 year but less than 3 years. The scheme is managed by Mr. Shobhit Mehrotra since inception.
NAV as on Mar 31, 2017 ` 12.5774
HDFC FMP 1116D JULY 2014 (1) Date Period Scheme
Returns (%)
Benchmark Returns
(%)#
Additional Benchmark
Returns (%) ##
Value of ` 10,000 invested
Scheme (`)
Benchmark (`)#
Additional Benchmark
(`)##Mar 31, 16 Last 1 Year 8.12 11.09 7.15 10,812 11,109 10,715Aug 12, 14 Since Inception 9.09 11.13 7.82 12,577 13,206 12,194
Past performance may or may not be sustained in the future. Returns are compounded annualized (CAGR). # CRISIL Composite Bond Fund Index ## CRISIL 1 year T-Bill Index. The Scheme is in existence for more than 1 year but less than 3 years. The scheme is managed by Mr. Shobhit Mehrotra since inception.
SHOBHIT MEHROTRA....CONTINUED
Different plans viz. Regular Plan and Direct Plan have a different expense structure. The expenses of the Direct Plan under the Scheme will be lower to the extent of the distribution expenses / commission charged in the Regular Plan. Load is not taken into consideration for computation of performance. n.A.: not Available
Performance of FMP schemes, being close-ended in nature, is not strictly comparable with that of open-ended schemes since the investment strategy for FMP schemes is primarily buy-and-hold whereas open-ended schemes are actively managed.
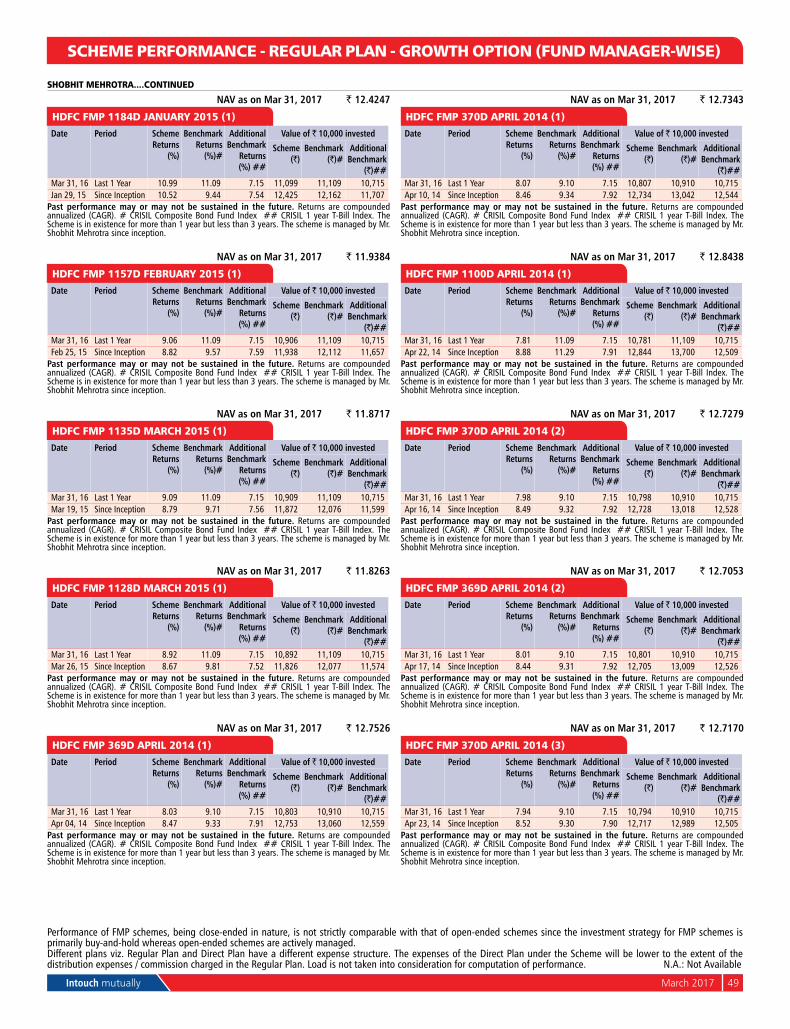
Intouch mutually March 2017 49
SCHEME PERFORMANCE - REGULAR PLAN - GROWTH OPTION (FUND MANAGER-WISE)
NAV as on Mar 31, 2017 ` 12.4247
HDFC FMP 1184D JANUARY 2015 (1) Date Period Scheme
Returns (%)
Benchmark Returns
(%)#
Additional Benchmark
Returns (%) ##
Value of ` 10,000 invested
Scheme (`)
Benchmark (`)#
Additional Benchmark
(`)##Mar 31, 16 Last 1 Year 10.99 11.09 7.15 11,099 11,109 10,715Jan 29, 15 Since Inception 10.52 9.44 7.54 12,425 12,162 11,707
Past performance may or may not be sustained in the future. Returns are compounded annualized (CAGR). # CRISIL Composite Bond Fund Index ## CRISIL 1 year T-Bill Index. The Scheme is in existence for more than 1 year but less than 3 years. The scheme is managed by Mr. Shobhit Mehrotra since inception.
NAV as on Mar 31, 2017 ` 11.9384
HDFC FMP 1157D FEBRUARY 2015 (1) Date Period Scheme
Returns (%)
Benchmark Returns
(%)#
Additional Benchmark
Returns (%) ##
Value of ` 10,000 invested
Scheme (`)
Benchmark (`)#
Additional Benchmark
(`)##Mar 31, 16 Last 1 Year 9.06 11.09 7.15 10,906 11,109 10,715Feb 25, 15 Since Inception 8.82 9.57 7.59 11,938 12,112 11,657
Past performance may or may not be sustained in the future. Returns are compounded annualized (CAGR). # CRISIL Composite Bond Fund Index ## CRISIL 1 year T-Bill Index. The Scheme is in existence for more than 1 year but less than 3 years. The scheme is managed by Mr. Shobhit Mehrotra since inception.
NAV as on Mar 31, 2017 ` 11.8717
HDFC FMP 1135D MARCH 2015 (1) Date Period Scheme
Returns (%)
Benchmark Returns
(%)#
Additional Benchmark
Returns (%) ##
Value of ` 10,000 invested
Scheme (`)
Benchmark (`)#
Additional Benchmark
(`)##Mar 31, 16 Last 1 Year 9.09 11.09 7.15 10,909 11,109 10,715Mar 19, 15 Since Inception 8.79 9.71 7.56 11,872 12,076 11,599
Past performance may or may not be sustained in the future. Returns are compounded annualized (CAGR). # CRISIL Composite Bond Fund Index ## CRISIL 1 year T-Bill Index. The Scheme is in existence for more than 1 year but less than 3 years. The scheme is managed by Mr. Shobhit Mehrotra since inception.
NAV as on Mar 31, 2017 ` 11.8263
HDFC FMP 1128D MARCH 2015 (1) Date Period Scheme
Returns (%)
Benchmark Returns
(%)#
Additional Benchmark
Returns (%) ##
Value of ` 10,000 invested
Scheme (`)
Benchmark (`)#
Additional Benchmark
(`)##Mar 31, 16 Last 1 Year 8.92 11.09 7.15 10,892 11,109 10,715Mar 26, 15 Since Inception 8.67 9.81 7.52 11,826 12,077 11,574
Past performance may or may not be sustained in the future. Returns are compounded annualized (CAGR). # CRISIL Composite Bond Fund Index ## CRISIL 1 year T-Bill Index. The Scheme is in existence for more than 1 year but less than 3 years. The scheme is managed by Mr. Shobhit Mehrotra since inception.
NAV as on Mar 31, 2017 ` 12.7526
HDFC FMP 369D APRIL 2014 (1) Date Period Scheme
Returns (%)
Benchmark Returns
(%)#
Additional Benchmark
Returns (%) ##
Value of ` 10,000 invested
Scheme (`)
Benchmark (`)#
Additional Benchmark
(`)##Mar 31, 16 Last 1 Year 8.03 9.10 7.15 10,803 10,910 10,715Apr 04, 14 Since Inception 8.47 9.33 7.91 12,753 13,060 12,559
Past performance may or may not be sustained in the future. Returns are compounded annualized (CAGR). # CRISIL Composite Bond Fund Index ## CRISIL 1 year T-Bill Index. The Scheme is in existence for more than 1 year but less than 3 years. The scheme is managed by Mr. Shobhit Mehrotra since inception.
NAV as on Mar 31, 2017 ` 12.7343
HDFC FMP 370D APRIL 2014 (1) Date Period Scheme
Returns (%)
Benchmark Returns
(%)#
Additional Benchmark
Returns (%) ##
Value of ` 10,000 invested
Scheme (`)
Benchmark (`)#
Additional Benchmark
(`)##Mar 31, 16 Last 1 Year 8.07 9.10 7.15 10,807 10,910 10,715Apr 10, 14 Since Inception 8.46 9.34 7.92 12,734 13,042 12,544
Past performance may or may not be sustained in the future. Returns are compounded annualized (CAGR). # CRISIL Composite Bond Fund Index ## CRISIL 1 year T-Bill Index. The Scheme is in existence for more than 1 year but less than 3 years. The scheme is managed by Mr. Shobhit Mehrotra since inception.
NAV as on Mar 31, 2017 ` 12.8438
HDFC FMP 1100D APRIL 2014 (1) Date Period Scheme
Returns (%)
Benchmark Returns
(%)#
Additional Benchmark
Returns (%) ##
Value of ` 10,000 invested
Scheme (`)
Benchmark (`)#
Additional Benchmark
(`)##Mar 31, 16 Last 1 Year 7.81 11.09 7.15 10,781 11,109 10,715Apr 22, 14 Since Inception 8.88 11.29 7.91 12,844 13,700 12,509
Past performance may or may not be sustained in the future. Returns are compounded annualized (CAGR). # CRISIL Composite Bond Fund Index ## CRISIL 1 year T-Bill Index. The Scheme is in existence for more than 1 year but less than 3 years. The scheme is managed by Mr. Shobhit Mehrotra since inception.
NAV as on Mar 31, 2017 ` 12.7279
HDFC FMP 370D APRIL 2014 (2) Date Period Scheme
Returns (%)
Benchmark Returns
(%)#
Additional Benchmark
Returns (%) ##
Value of ` 10,000 invested
Scheme (`)
Benchmark (`)#
Additional Benchmark
(`)##Mar 31, 16 Last 1 Year 7.98 9.10 7.15 10,798 10,910 10,715Apr 16, 14 Since Inception 8.49 9.32 7.92 12,728 13,018 12,528
Past performance may or may not be sustained in the future. Returns are compounded annualized (CAGR). # CRISIL Composite Bond Fund Index ## CRISIL 1 year T-Bill Index. The Scheme is in existence for more than 1 year but less than 3 years. The scheme is managed by Mr. Shobhit Mehrotra since inception.
NAV as on Mar 31, 2017 ` 12.7053
HDFC FMP 369D APRIL 2014 (2) Date Period Scheme
Returns (%)
Benchmark Returns
(%)#
Additional Benchmark
Returns (%) ##
Value of ` 10,000 invested
Scheme (`)
Benchmark (`)#
Additional Benchmark
(`)##Mar 31, 16 Last 1 Year 8.01 9.10 7.15 10,801 10,910 10,715Apr 17, 14 Since Inception 8.44 9.31 7.92 12,705 13,009 12,526
Past performance may or may not be sustained in the future. Returns are compounded annualized (CAGR). # CRISIL Composite Bond Fund Index ## CRISIL 1 year T-Bill Index. The Scheme is in existence for more than 1 year but less than 3 years. The scheme is managed by Mr. Shobhit Mehrotra since inception.
NAV as on Mar 31, 2017 ` 12.7170
HDFC FMP 370D APRIL 2014 (3) Date Period Scheme
Returns (%)
Benchmark Returns
(%)#
Additional Benchmark
Returns (%) ##
Value of ` 10,000 invested
Scheme (`)
Benchmark (`)#
Additional Benchmark
(`)##Mar 31, 16 Last 1 Year 7.94 9.10 7.15 10,794 10,910 10,715Apr 23, 14 Since Inception 8.52 9.30 7.90 12,717 12,989 12,505
Past performance may or may not be sustained in the future. Returns are compounded annualized (CAGR). # CRISIL Composite Bond Fund Index ## CRISIL 1 year T-Bill Index. The Scheme is in existence for more than 1 year but less than 3 years. The scheme is managed by Mr. Shobhit Mehrotra since inception.
SHOBHIT MEHROTRA....CONTINUED
Different plans viz. Regular Plan and Direct Plan have a different expense structure. The expenses of the Direct Plan under the Scheme will be lower to the extent of the distribution expenses / commission charged in the Regular Plan. Load is not taken into consideration for computation of performance. n.A.: not Available
Performance of FMP schemes, being close-ended in nature, is not strictly comparable with that of open-ended schemes since the investment strategy for FMP schemes is primarily buy-and-hold whereas open-ended schemes are actively managed.
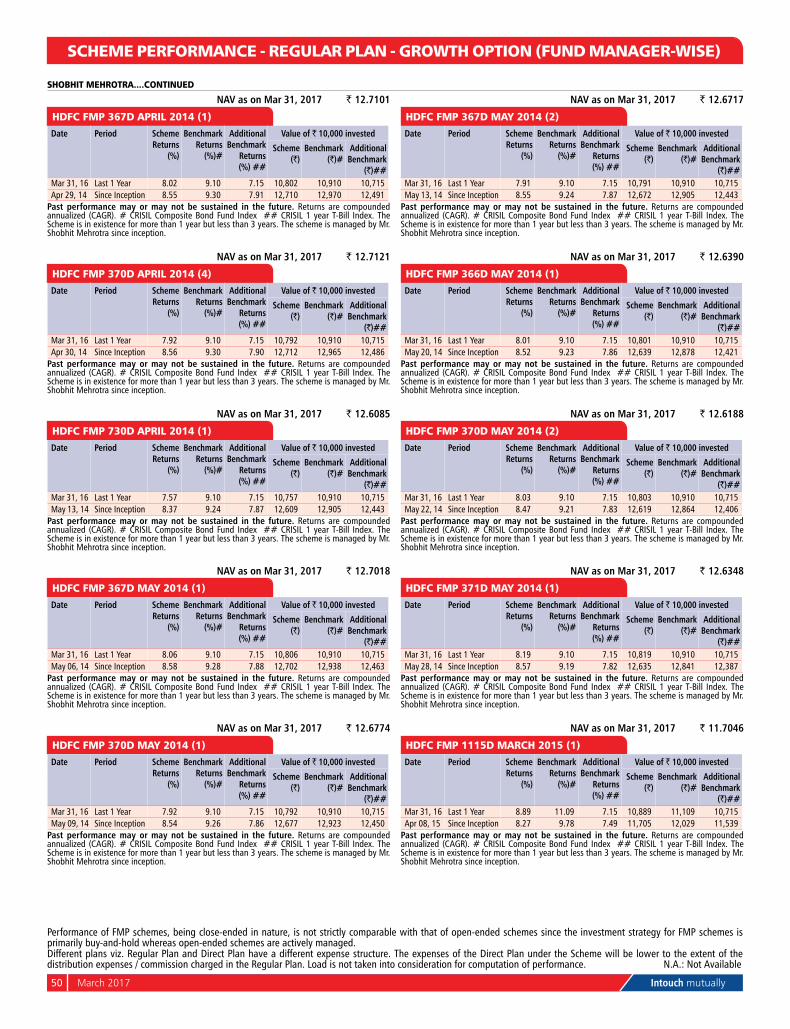
50 March 2017 Intouch mutually
SCHEME PERFORMANCE - REGULAR PLAN - GROWTH OPTION (FUND MANAGER-WISE)
NAV as on Mar 31, 2017 ` 12.7101
HDFC FMP 367D APRIL 2014 (1) Date Period Scheme
Returns (%)
Benchmark Returns
(%)#
Additional Benchmark
Returns (%) ##
Value of ` 10,000 invested
Scheme (`)
Benchmark (`)#
Additional Benchmark
(`)##Mar 31, 16 Last 1 Year 8.02 9.10 7.15 10,802 10,910 10,715Apr 29, 14 Since Inception 8.55 9.30 7.91 12,710 12,970 12,491
Past performance may or may not be sustained in the future. Returns are compounded annualized (CAGR). # CRISIL Composite Bond Fund Index ## CRISIL 1 year T-Bill Index. The Scheme is in existence for more than 1 year but less than 3 years. The scheme is managed by Mr. Shobhit Mehrotra since inception.
NAV as on Mar 31, 2017 ` 12.7121
HDFC FMP 370D APRIL 2014 (4) Date Period Scheme
Returns (%)
Benchmark Returns
(%)#
Additional Benchmark
Returns (%) ##
Value of ` 10,000 invested
Scheme (`)
Benchmark (`)#
Additional Benchmark
(`)##Mar 31, 16 Last 1 Year 7.92 9.10 7.15 10,792 10,910 10,715Apr 30, 14 Since Inception 8.56 9.30 7.90 12,712 12,965 12,486
Past performance may or may not be sustained in the future. Returns are compounded annualized (CAGR). # CRISIL Composite Bond Fund Index ## CRISIL 1 year T-Bill Index. The Scheme is in existence for more than 1 year but less than 3 years. The scheme is managed by Mr. Shobhit Mehrotra since inception.
NAV as on Mar 31, 2017 ` 12.6085
HDFC FMP 730D APRIL 2014 (1) Date Period Scheme
Returns (%)
Benchmark Returns
(%)#
Additional Benchmark
Returns (%) ##
Value of ` 10,000 invested
Scheme (`)
Benchmark (`)#
Additional Benchmark
(`)##Mar 31, 16 Last 1 Year 7.57 9.10 7.15 10,757 10,910 10,715May 13, 14 Since Inception 8.37 9.24 7.87 12,609 12,905 12,443
Past performance may or may not be sustained in the future. Returns are compounded annualized (CAGR). # CRISIL Composite Bond Fund Index ## CRISIL 1 year T-Bill Index. The Scheme is in existence for more than 1 year but less than 3 years. The scheme is managed by Mr. Shobhit Mehrotra since inception.
NAV as on Mar 31, 2017 ` 12.7018
HDFC FMP 367D MAY 2014 (1) Date Period Scheme
Returns (%)
Benchmark Returns
(%)#
Additional Benchmark
Returns (%) ##
Value of ` 10,000 invested
Scheme (`)
Benchmark (`)#
Additional Benchmark
(`)##Mar 31, 16 Last 1 Year 8.06 9.10 7.15 10,806 10,910 10,715May 06, 14 Since Inception 8.58 9.28 7.88 12,702 12,938 12,463
Past performance may or may not be sustained in the future. Returns are compounded annualized (CAGR). # CRISIL Composite Bond Fund Index ## CRISIL 1 year T-Bill Index. The Scheme is in existence for more than 1 year but less than 3 years. The scheme is managed by Mr. Shobhit Mehrotra since inception.
NAV as on Mar 31, 2017 ` 12.6774
HDFC FMP 370D MAY 2014 (1) Date Period Scheme
Returns (%)
Benchmark Returns
(%)#
Additional Benchmark
Returns (%) ##
Value of ` 10,000 invested
Scheme (`)
Benchmark (`)#
Additional Benchmark
(`)##Mar 31, 16 Last 1 Year 7.92 9.10 7.15 10,792 10,910 10,715May 09, 14 Since Inception 8.54 9.26 7.86 12,677 12,923 12,450
Past performance may or may not be sustained in the future. Returns are compounded annualized (CAGR). # CRISIL Composite Bond Fund Index ## CRISIL 1 year T-Bill Index. The Scheme is in existence for more than 1 year but less than 3 years. The scheme is managed by Mr. Shobhit Mehrotra since inception.
NAV as on Mar 31, 2017 ` 12.6717
HDFC FMP 367D MAY 2014 (2) Date Period Scheme
Returns (%)
Benchmark Returns
(%)#
Additional Benchmark
Returns (%) ##
Value of ` 10,000 invested
Scheme (`)
Benchmark (`)#
Additional Benchmark
(`)##Mar 31, 16 Last 1 Year 7.91 9.10 7.15 10,791 10,910 10,715May 13, 14 Since Inception 8.55 9.24 7.87 12,672 12,905 12,443
Past performance may or may not be sustained in the future. Returns are compounded annualized (CAGR). # CRISIL Composite Bond Fund Index ## CRISIL 1 year T-Bill Index. The Scheme is in existence for more than 1 year but less than 3 years. The scheme is managed by Mr. Shobhit Mehrotra since inception.
NAV as on Mar 31, 2017 ` 12.6390
HDFC FMP 366D MAY 2014 (1) Date Period Scheme
Returns (%)
Benchmark Returns
(%)#
Additional Benchmark
Returns (%) ##
Value of ` 10,000 invested
Scheme (`)
Benchmark (`)#
Additional Benchmark
(`)##Mar 31, 16 Last 1 Year 8.01 9.10 7.15 10,801 10,910 10,715May 20, 14 Since Inception 8.52 9.23 7.86 12,639 12,878 12,421
Past performance may or may not be sustained in the future. Returns are compounded annualized (CAGR). # CRISIL Composite Bond Fund Index ## CRISIL 1 year T-Bill Index. The Scheme is in existence for more than 1 year but less than 3 years. The scheme is managed by Mr. Shobhit Mehrotra since inception.
NAV as on Mar 31, 2017 ` 12.6188
HDFC FMP 370D MAY 2014 (2) Date Period Scheme
Returns (%)
Benchmark Returns
(%)#
Additional Benchmark
Returns (%) ##
Value of ` 10,000 invested
Scheme (`)
Benchmark (`)#
Additional Benchmark
(`)##Mar 31, 16 Last 1 Year 8.03 9.10 7.15 10,803 10,910 10,715May 22, 14 Since Inception 8.47 9.21 7.83 12,619 12,864 12,406
Past performance may or may not be sustained in the future. Returns are compounded annualized (CAGR). # CRISIL Composite Bond Fund Index ## CRISIL 1 year T-Bill Index. The Scheme is in existence for more than 1 year but less than 3 years. The scheme is managed by Mr. Shobhit Mehrotra since inception.
NAV as on Mar 31, 2017 ` 12.6348
HDFC FMP 371D MAY 2014 (1) Date Period Scheme
Returns (%)
Benchmark Returns
(%)#
Additional Benchmark
Returns (%) ##
Value of ` 10,000 invested
Scheme (`)
Benchmark (`)#
Additional Benchmark
(`)##Mar 31, 16 Last 1 Year 8.19 9.10 7.15 10,819 10,910 10,715May 28, 14 Since Inception 8.57 9.19 7.82 12,635 12,841 12,387
Past performance may or may not be sustained in the future. Returns are compounded annualized (CAGR). # CRISIL Composite Bond Fund Index ## CRISIL 1 year T-Bill Index. The Scheme is in existence for more than 1 year but less than 3 years. The scheme is managed by Mr. Shobhit Mehrotra since inception.
NAV as on Mar 31, 2017 ` 11.7046
HDFC FMP 1115D MARCH 2015 (1) Date Period Scheme
Returns (%)
Benchmark Returns
(%)#
Additional Benchmark
Returns (%) ##
Value of ` 10,000 invested
Scheme (`)
Benchmark (`)#
Additional Benchmark
(`)##Mar 31, 16 Last 1 Year 8.89 11.09 7.15 10,889 11,109 10,715Apr 08, 15 Since Inception 8.27 9.78 7.49 11,705 12,029 11,539
Past performance may or may not be sustained in the future. Returns are compounded annualized (CAGR). # CRISIL Composite Bond Fund Index ## CRISIL 1 year T-Bill Index. The Scheme is in existence for more than 1 year but less than 3 years. The scheme is managed by Mr. Shobhit Mehrotra since inception.
SHOBHIT MEHROTRA....CONTINUED
Different plans viz. Regular Plan and Direct Plan have a different expense structure. The expenses of the Direct Plan under the Scheme will be lower to the extent of the distribution expenses / commission charged in the Regular Plan. Load is not taken into consideration for computation of performance. n.A.: not Available
Performance of FMP schemes, being close-ended in nature, is not strictly comparable with that of open-ended schemes since the investment strategy for FMP schemes is primarily buy-and-hold whereas open-ended schemes are actively managed.
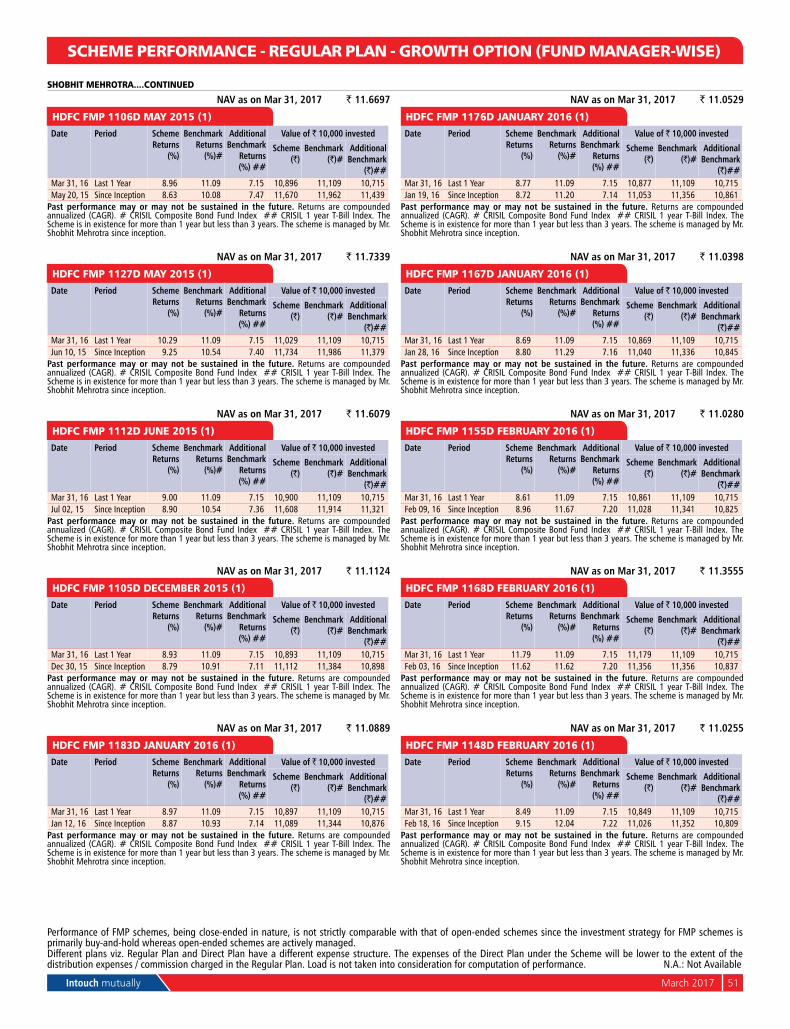
Intouch mutually March 2017 51
SCHEME PERFORMANCE - REGULAR PLAN - GROWTH OPTION (FUND MANAGER-WISE)
NAV as on Mar 31, 2017 ` 11.6697
HDFC FMP 1106D MAY 2015 (1) Date Period Scheme
Returns (%)
Benchmark Returns
(%)#
Additional Benchmark
Returns (%) ##
Value of ` 10,000 invested
Scheme (`)
Benchmark (`)#
Additional Benchmark
(`)##Mar 31, 16 Last 1 Year 8.96 11.09 7.15 10,896 11,109 10,715May 20, 15 Since Inception 8.63 10.08 7.47 11,670 11,962 11,439
Past performance may or may not be sustained in the future. Returns are compounded annualized (CAGR). # CRISIL Composite Bond Fund Index ## CRISIL 1 year T-Bill Index. The Scheme is in existence for more than 1 year but less than 3 years. The scheme is managed by Mr. Shobhit Mehrotra since inception.
NAV as on Mar 31, 2017 ` 11.7339
HDFC FMP 1127D MAY 2015 (1) Date Period Scheme
Returns (%)
Benchmark Returns
(%)#
Additional Benchmark
Returns (%) ##
Value of ` 10,000 invested
Scheme (`)
Benchmark (`)#
Additional Benchmark
(`)##Mar 31, 16 Last 1 Year 10.29 11.09 7.15 11,029 11,109 10,715Jun 10, 15 Since Inception 9.25 10.54 7.40 11,734 11,986 11,379
Past performance may or may not be sustained in the future. Returns are compounded annualized (CAGR). # CRISIL Composite Bond Fund Index ## CRISIL 1 year T-Bill Index. The Scheme is in existence for more than 1 year but less than 3 years. The scheme is managed by Mr. Shobhit Mehrotra since inception.
NAV as on Mar 31, 2017 ` 11.6079
HDFC FMP 1112D JUNE 2015 (1) Date Period Scheme
Returns (%)
Benchmark Returns
(%)#
Additional Benchmark
Returns (%) ##
Value of ` 10,000 invested
Scheme (`)
Benchmark (`)#
Additional Benchmark
(`)##Mar 31, 16 Last 1 Year 9.00 11.09 7.15 10,900 11,109 10,715Jul 02, 15 Since Inception 8.90 10.54 7.36 11,608 11,914 11,321
Past performance may or may not be sustained in the future. Returns are compounded annualized (CAGR). # CRISIL Composite Bond Fund Index ## CRISIL 1 year T-Bill Index. The Scheme is in existence for more than 1 year but less than 3 years. The scheme is managed by Mr. Shobhit Mehrotra since inception.
NAV as on Mar 31, 2017 ` 11.1124
HDFC FMP 1105D DECEMBER 2015 (1) Date Period Scheme
Returns (%)
Benchmark Returns
(%)#
Additional Benchmark
Returns (%) ##
Value of ` 10,000 invested
Scheme (`)
Benchmark (`)#
Additional Benchmark
(`)##Mar 31, 16 Last 1 Year 8.93 11.09 7.15 10,893 11,109 10,715Dec 30, 15 Since Inception 8.79 10.91 7.11 11,112 11,384 10,898
Past performance may or may not be sustained in the future. Returns are compounded annualized (CAGR). # CRISIL Composite Bond Fund Index ## CRISIL 1 year T-Bill Index. The Scheme is in existence for more than 1 year but less than 3 years. The scheme is managed by Mr. Shobhit Mehrotra since inception.
NAV as on Mar 31, 2017 ` 11.0889
HDFC FMP 1183D JANUARY 2016 (1) Date Period Scheme
Returns (%)
Benchmark Returns
(%)#
Additional Benchmark
Returns (%) ##
Value of ` 10,000 invested
Scheme (`)
Benchmark (`)#
Additional Benchmark
(`)##Mar 31, 16 Last 1 Year 8.97 11.09 7.15 10,897 11,109 10,715Jan 12, 16 Since Inception 8.87 10.93 7.14 11,089 11,344 10,876
Past performance may or may not be sustained in the future. Returns are compounded annualized (CAGR). # CRISIL Composite Bond Fund Index ## CRISIL 1 year T-Bill Index. The Scheme is in existence for more than 1 year but less than 3 years. The scheme is managed by Mr. Shobhit Mehrotra since inception.
NAV as on Mar 31, 2017 ` 11.0529
HDFC FMP 1176D JANUARY 2016 (1) Date Period Scheme
Returns (%)
Benchmark Returns
(%)#
Additional Benchmark
Returns (%) ##
Value of ` 10,000 invested
Scheme (`)
Benchmark (`)#
Additional Benchmark
(`)##Mar 31, 16 Last 1 Year 8.77 11.09 7.15 10,877 11,109 10,715Jan 19, 16 Since Inception 8.72 11.20 7.14 11,053 11,356 10,861
Past performance may or may not be sustained in the future. Returns are compounded annualized (CAGR). # CRISIL Composite Bond Fund Index ## CRISIL 1 year T-Bill Index. The Scheme is in existence for more than 1 year but less than 3 years. The scheme is managed by Mr. Shobhit Mehrotra since inception.
NAV as on Mar 31, 2017 ` 11.0398
HDFC FMP 1167D JANUARY 2016 (1) Date Period Scheme
Returns (%)
Benchmark Returns
(%)#
Additional Benchmark
Returns (%) ##
Value of ` 10,000 invested
Scheme (`)
Benchmark (`)#
Additional Benchmark
(`)##Mar 31, 16 Last 1 Year 8.69 11.09 7.15 10,869 11,109 10,715Jan 28, 16 Since Inception 8.80 11.29 7.16 11,040 11,336 10,845
Past performance may or may not be sustained in the future. Returns are compounded annualized (CAGR). # CRISIL Composite Bond Fund Index ## CRISIL 1 year T-Bill Index. The Scheme is in existence for more than 1 year but less than 3 years. The scheme is managed by Mr. Shobhit Mehrotra since inception.
NAV as on Mar 31, 2017 ` 11.0280
HDFC FMP 1155D FEBRUARY 2016 (1) Date Period Scheme
Returns (%)
Benchmark Returns
(%)#
Additional Benchmark
Returns (%) ##
Value of ` 10,000 invested
Scheme (`)
Benchmark (`)#
Additional Benchmark
(`)##Mar 31, 16 Last 1 Year 8.61 11.09 7.15 10,861 11,109 10,715Feb 09, 16 Since Inception 8.96 11.67 7.20 11,028 11,341 10,825
Past performance may or may not be sustained in the future. Returns are compounded annualized (CAGR). # CRISIL Composite Bond Fund Index ## CRISIL 1 year T-Bill Index. The Scheme is in existence for more than 1 year but less than 3 years. The scheme is managed by Mr. Shobhit Mehrotra since inception.
NAV as on Mar 31, 2017 ` 11.3555
HDFC FMP 1168D FEBRUARY 2016 (1) Date Period Scheme
Returns (%)
Benchmark Returns
(%)#
Additional Benchmark
Returns (%) ##
Value of ` 10,000 invested
Scheme (`)
Benchmark (`)#
Additional Benchmark
(`)##Mar 31, 16 Last 1 Year 11.79 11.09 7.15 11,179 11,109 10,715Feb 03, 16 Since Inception 11.62 11.62 7.20 11,356 11,356 10,837
Past performance may or may not be sustained in the future. Returns are compounded annualized (CAGR). # CRISIL Composite Bond Fund Index ## CRISIL 1 year T-Bill Index. The Scheme is in existence for more than 1 year but less than 3 years. The scheme is managed by Mr. Shobhit Mehrotra since inception.
NAV as on Mar 31, 2017 ` 11.0255
HDFC FMP 1148D FEBRUARY 2016 (1) Date Period Scheme
Returns (%)
Benchmark Returns
(%)#
Additional Benchmark
Returns (%) ##
Value of ` 10,000 invested
Scheme (`)
Benchmark (`)#
Additional Benchmark
(`)##Mar 31, 16 Last 1 Year 8.49 11.09 7.15 10,849 11,109 10,715Feb 18, 16 Since Inception 9.15 12.04 7.22 11,026 11,352 10,809
Past performance may or may not be sustained in the future. Returns are compounded annualized (CAGR). # CRISIL Composite Bond Fund Index ## CRISIL 1 year T-Bill Index. The Scheme is in existence for more than 1 year but less than 3 years. The scheme is managed by Mr. Shobhit Mehrotra since inception.
SHOBHIT MEHROTRA....CONTINUED
Different plans viz. Regular Plan and Direct Plan have a different expense structure. The expenses of the Direct Plan under the Scheme will be lower to the extent of the distribution expenses / commission charged in the Regular Plan. Load is not taken into consideration for computation of performance. n.A.: not Available
Performance of FMP schemes, being close-ended in nature, is not strictly comparable with that of open-ended schemes since the investment strategy for FMP schemes is primarily buy-and-hold whereas open-ended schemes are actively managed.
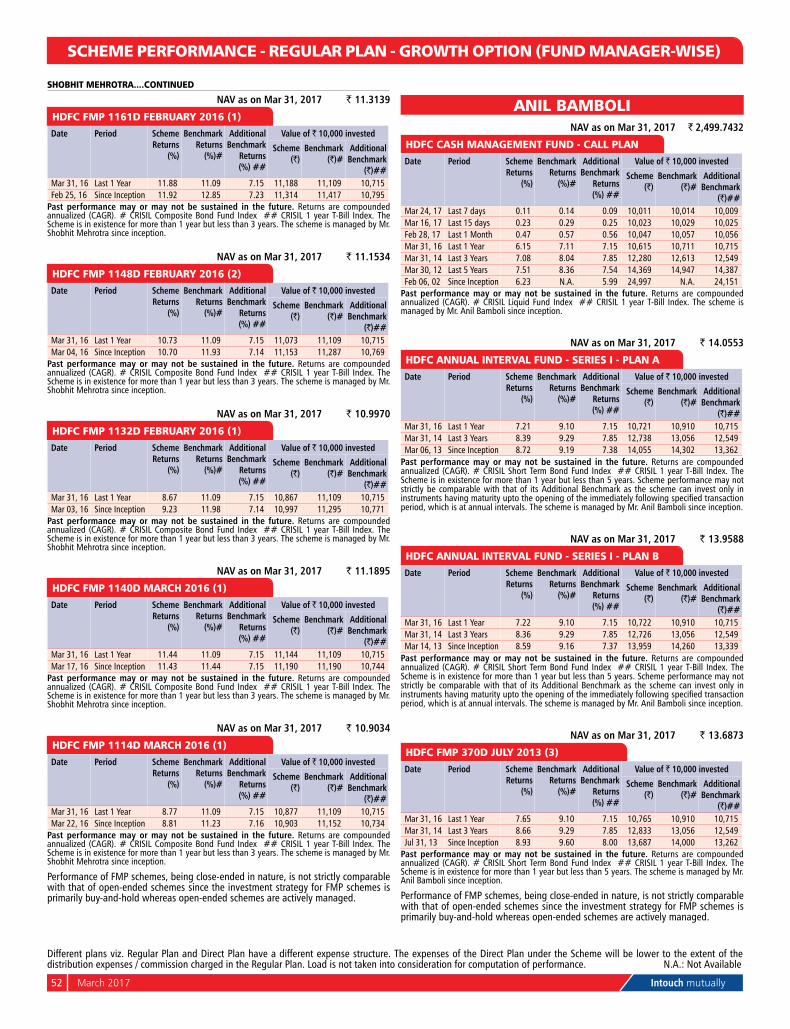
52 March 2017 Intouch mutually
SCHEME PERFORMANCE - REGULAR PLAN - GROWTH OPTION (FUND MANAGER-WISE)
NAV as on Mar 31, 2017 ` 11.3139
HDFC FMP 1161D FEBRUARY 2016 (1) Date Period Scheme
Returns (%)
Benchmark Returns
(%)#
Additional Benchmark
Returns (%) ##
Value of ` 10,000 invested
Scheme (`)
Benchmark (`)#
Additional Benchmark
(`)##Mar 31, 16 Last 1 Year 11.88 11.09 7.15 11,188 11,109 10,715Feb 25, 16 Since Inception 11.92 12.85 7.23 11,314 11,417 10,795
Past performance may or may not be sustained in the future. Returns are compounded annualized (CAGR). # CRISIL Composite Bond Fund Index ## CRISIL 1 year T-Bill Index. The Scheme is in existence for more than 1 year but less than 3 years. The scheme is managed by Mr. Shobhit Mehrotra since inception.
NAV as on Mar 31, 2017 ` 11.1534
HDFC FMP 1148D FEBRUARY 2016 (2) Date Period Scheme
Returns (%)
Benchmark Returns
(%)#
Additional Benchmark
Returns (%) ##
Value of ` 10,000 invested
Scheme (`)
Benchmark (`)#
Additional Benchmark
(`)##Mar 31, 16 Last 1 Year 10.73 11.09 7.15 11,073 11,109 10,715Mar 04, 16 Since Inception 10.70 11.93 7.14 11,153 11,287 10,769
Past performance may or may not be sustained in the future. Returns are compounded annualized (CAGR). # CRISIL Composite Bond Fund Index ## CRISIL 1 year T-Bill Index. The Scheme is in existence for more than 1 year but less than 3 years. The scheme is managed by Mr. Shobhit Mehrotra since inception.
NAV as on Mar 31, 2017 ` 10.9970
HDFC FMP 1132D FEBRUARY 2016 (1) Date Period Scheme
Returns (%)
Benchmark Returns
(%)#
Additional Benchmark
Returns (%) ##
Value of ` 10,000 invested
Scheme (`)
Benchmark (`)#
Additional Benchmark
(`)##Mar 31, 16 Last 1 Year 8.67 11.09 7.15 10,867 11,109 10,715Mar 03, 16 Since Inception 9.23 11.98 7.14 10,997 11,295 10,771
Past performance may or may not be sustained in the future. Returns are compounded annualized (CAGR). # CRISIL Composite Bond Fund Index ## CRISIL 1 year T-Bill Index. The Scheme is in existence for more than 1 year but less than 3 years. The scheme is managed by Mr. Shobhit Mehrotra since inception.
NAV as on Mar 31, 2017 ` 11.1895
HDFC FMP 1140D MARCH 2016 (1) Date Period Scheme
Returns (%)
Benchmark Returns
(%)#
Additional Benchmark
Returns (%) ##
Value of ` 10,000 invested
Scheme (`)
Benchmark (`)#
Additional Benchmark
(`)##Mar 31, 16 Last 1 Year 11.44 11.09 7.15 11,144 11,109 10,715Mar 17, 16 Since Inception 11.43 11.44 7.15 11,190 11,190 10,744
Past performance may or may not be sustained in the future. Returns are compounded annualized (CAGR). # CRISIL Composite Bond Fund Index ## CRISIL 1 year T-Bill Index. The Scheme is in existence for more than 1 year but less than 3 years. The scheme is managed by Mr. Shobhit Mehrotra since inception.
NAV as on Mar 31, 2017 ` 10.9034
HDFC FMP 1114D MARCH 2016 (1) Date Period Scheme
Returns (%)
Benchmark Returns
(%)#
Additional Benchmark
Returns (%) ##
Value of ` 10,000 invested
Scheme (`)
Benchmark (`)#
Additional Benchmark
(`)##Mar 31, 16 Last 1 Year 8.77 11.09 7.15 10,877 11,109 10,715Mar 22, 16 Since Inception 8.81 11.23 7.16 10,903 11,152 10,734
Past performance may or may not be sustained in the future. Returns are compounded annualized (CAGR). # CRISIL Composite Bond Fund Index ## CRISIL 1 year T-Bill Index. The Scheme is in existence for more than 1 year but less than 3 years. The scheme is managed by Mr. Shobhit Mehrotra since inception.
Performance of FMP schemes, being close-ended in nature, is not strictly comparable with that of open-ended schemes since the investment strategy for FMP schemes is primarily buy-and-hold whereas open-ended schemes are actively managed.
ANIL BAMBOLI NAV as on Mar 31, 2017 ` 2,499.7432
HDFC CASH MANAGEMENT FUND - CALL PLAN Date Period Scheme
Returns (%)
Benchmark Returns
(%)#
Additional Benchmark
Returns (%) ##
Value of ` 10,000 invested
Scheme (`)
Benchmark (`)#
Additional Benchmark
(`)##Mar 24, 17 Last 7 days 0.11 0.14 0.09 10,011 10,014 10,009Mar 16, 17 Last 15 days 0.23 0.29 0.25 10,023 10,029 10,025Feb 28, 17 Last 1 Month 0.47 0.57 0.56 10,047 10,057 10,056Mar 31, 16 Last 1 Year 6.15 7.11 7.15 10,615 10,711 10,715Mar 31, 14 Last 3 Years 7.08 8.04 7.85 12,280 12,613 12,549Mar 30, 12 Last 5 Years 7.51 8.36 7.54 14,369 14,947 14,387Feb 06, 02 Since Inception 6.23 n.A. 5.99 24,997 n.A. 24,151
Past performance may or may not be sustained in the future. Returns are compounded annualized (CAGR). # CRISIL Liquid Fund Index ## CRISIL 1 year T-Bill Index. The scheme is managed by Mr. Anil Bamboli since inception.
NAV as on Mar 31, 2017 ` 14.0553
HDFC ANNUAL INTERVAL FUND - SERIES I - PLAN A Date Period Scheme
Returns (%)
Benchmark Returns
(%)#
Additional Benchmark
Returns (%) ##
Value of ` 10,000 invested
Scheme (`)
Benchmark (`)#
Additional Benchmark
(`)##Mar 31, 16 Last 1 Year 7.21 9.10 7.15 10,721 10,910 10,715Mar 31, 14 Last 3 Years 8.39 9.29 7.85 12,738 13,056 12,549Mar 06, 13 Since Inception 8.72 9.19 7.38 14,055 14,302 13,362
Past performance may or may not be sustained in the future. Returns are compounded annualized (CAGR). # CRISIL Short Term Bond Fund Index ## CRISIL 1 year T-Bill Index. The Scheme is in existence for more than 1 year but less than 5 years. Scheme performance may not strictly be comparable with that of its Additional Benchmark as the scheme can invest only in instruments having maturity upto the opening of the immediately following specified transaction period, which is at annual intervals. The scheme is managed by Mr. Anil Bamboli since inception.
NAV as on Mar 31, 2017 ` 13.9588
HDFC ANNUAL INTERVAL FUND - SERIES I - PLAN B Date Period Scheme
Returns (%)
Benchmark Returns
(%)#
Additional Benchmark
Returns (%) ##
Value of ` 10,000 invested
Scheme (`)
Benchmark (`)#
Additional Benchmark
(`)##Mar 31, 16 Last 1 Year 7.22 9.10 7.15 10,722 10,910 10,715Mar 31, 14 Last 3 Years 8.36 9.29 7.85 12,726 13,056 12,549Mar 14, 13 Since Inception 8.59 9.16 7.37 13,959 14,260 13,339
Past performance may or may not be sustained in the future. Returns are compounded annualized (CAGR). # CRISIL Short Term Bond Fund Index ## CRISIL 1 year T-Bill Index. The Scheme is in existence for more than 1 year but less than 5 years. Scheme performance may not strictly be comparable with that of its Additional Benchmark as the scheme can invest only in instruments having maturity upto the opening of the immediately following specified transaction period, which is at annual intervals. The scheme is managed by Mr. Anil Bamboli since inception.
NAV as on Mar 31, 2017 ` 13.6873
HDFC FMP 370D JULY 2013 (3) Date Period Scheme
Returns (%)
Benchmark Returns
(%)#
Additional Benchmark
Returns (%) ##
Value of ` 10,000 invested
Scheme (`)
Benchmark (`)#
Additional Benchmark
(`)##Mar 31, 16 Last 1 Year 7.65 9.10 7.15 10,765 10,910 10,715Mar 31, 14 Last 3 Years 8.66 9.29 7.85 12,833 13,056 12,549Jul 31, 13 Since Inception 8.93 9.60 8.00 13,687 14,000 13,262
Past performance may or may not be sustained in the future. Returns are compounded annualized (CAGR). # CRISIL Short Term Bond Fund Index ## CRISIL 1 year T-Bill Index. The Scheme is in existence for more than 1 year but less than 5 years. The scheme is managed by Mr. Anil Bamboli since inception.
Performance of FMP schemes, being close-ended in nature, is not strictly comparable with that of open-ended schemes since the investment strategy for FMP schemes is primarily buy-and-hold whereas open-ended schemes are actively managed.
SHOBHIT MEHROTRA....CONTINUED
Different plans viz. Regular Plan and Direct Plan have a different expense structure. The expenses of the Direct Plan under the Scheme will be lower to the extent of the distribution expenses / commission charged in the Regular Plan. Load is not taken into consideration for computation of performance. n.A.: not Available
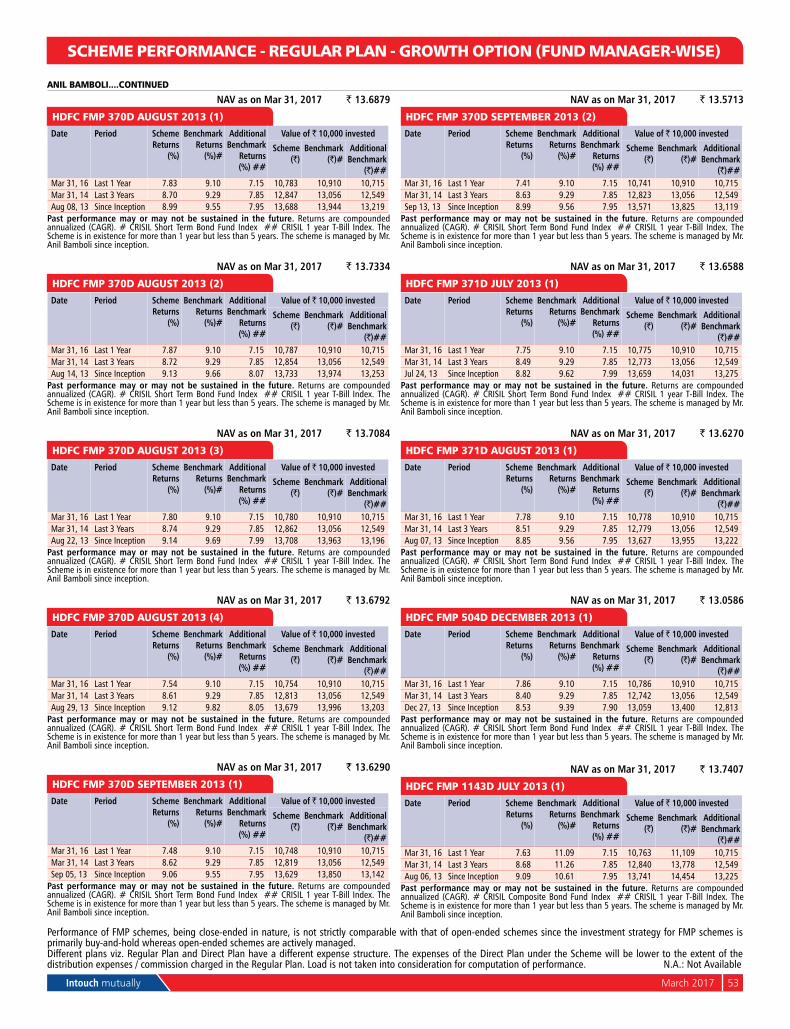
Intouch mutually March 2017 53
SCHEME PERFORMANCE - REGULAR PLAN - GROWTH OPTION (FUND MANAGER-WISE)SCHEME PERFORMANCE - REGULAR PLAN - GROWTH OPTION (FUND MANAGER-WISE)
Different plans viz. Regular Plan and Direct Plan have a different expense structure. The expenses of the Direct Plan under the Scheme will be lower to the extent of the distribution expenses / commission charged in the Regular Plan. Load is not taken into consideration for computation of performance. n.A.: not Available
Performance of FMP schemes, being close-ended in nature, is not strictly comparable with that of open-ended schemes since the investment strategy for FMP schemes is primarily buy-and-hold whereas open-ended schemes are actively managed.
NAV as on Mar 31, 2017 ` 13.6879
HDFC FMP 370D AUGUST 2013 (1) Date Period Scheme
Returns (%)
Benchmark Returns
(%)#
Additional Benchmark
Returns (%) ##
Value of ` 10,000 invested
Scheme (`)
Benchmark (`)#
Additional Benchmark
(`)##Mar 31, 16 Last 1 Year 7.83 9.10 7.15 10,783 10,910 10,715Mar 31, 14 Last 3 Years 8.70 9.29 7.85 12,847 13,056 12,549Aug 08, 13 Since Inception 8.99 9.55 7.95 13,688 13,944 13,219
Past performance may or may not be sustained in the future. Returns are compounded annualized (CAGR). # CRISIL Short Term Bond Fund Index ## CRISIL 1 year T-Bill Index. The Scheme is in existence for more than 1 year but less than 5 years. The scheme is managed by Mr. Anil Bamboli since inception.
NAV as on Mar 31, 2017 ` 13.7334
HDFC FMP 370D AUGUST 2013 (2) Date Period Scheme
Returns (%)
Benchmark Returns
(%)#
Additional Benchmark
Returns (%) ##
Value of ` 10,000 invested
Scheme (`)
Benchmark (`)#
Additional Benchmark
(`)##Mar 31, 16 Last 1 Year 7.87 9.10 7.15 10,787 10,910 10,715Mar 31, 14 Last 3 Years 8.72 9.29 7.85 12,854 13,056 12,549Aug 14, 13 Since Inception 9.13 9.66 8.07 13,733 13,974 13,253
Past performance may or may not be sustained in the future. Returns are compounded annualized (CAGR). # CRISIL Short Term Bond Fund Index ## CRISIL 1 year T-Bill Index. The Scheme is in existence for more than 1 year but less than 5 years. The scheme is managed by Mr. Anil Bamboli since inception.
NAV as on Mar 31, 2017 ` 13.7084
HDFC FMP 370D AUGUST 2013 (3) Date Period Scheme
Returns (%)
Benchmark Returns
(%)#
Additional Benchmark
Returns (%) ##
Value of ` 10,000 invested
Scheme (`)
Benchmark (`)#
Additional Benchmark
(`)##Mar 31, 16 Last 1 Year 7.80 9.10 7.15 10,780 10,910 10,715Mar 31, 14 Last 3 Years 8.74 9.29 7.85 12,862 13,056 12,549Aug 22, 13 Since Inception 9.14 9.69 7.99 13,708 13,963 13,196
Past performance may or may not be sustained in the future. Returns are compounded annualized (CAGR). # CRISIL Short Term Bond Fund Index ## CRISIL 1 year T-Bill Index. The Scheme is in existence for more than 1 year but less than 5 years. The scheme is managed by Mr. Anil Bamboli since inception.
NAV as on Mar 31, 2017 ` 13.6792
HDFC FMP 370D AUGUST 2013 (4) Date Period Scheme
Returns (%)
Benchmark Returns
(%)#
Additional Benchmark
Returns (%) ##
Value of ` 10,000 invested
Scheme (`)
Benchmark (`)#
Additional Benchmark
(`)##Mar 31, 16 Last 1 Year 7.54 9.10 7.15 10,754 10,910 10,715Mar 31, 14 Last 3 Years 8.61 9.29 7.85 12,813 13,056 12,549Aug 29, 13 Since Inception 9.12 9.82 8.05 13,679 13,996 13,203
Past performance may or may not be sustained in the future. Returns are compounded annualized (CAGR). # CRISIL Short Term Bond Fund Index ## CRISIL 1 year T-Bill Index. The Scheme is in existence for more than 1 year but less than 5 years. The scheme is managed by Mr. Anil Bamboli since inception.
NAV as on Mar 31, 2017 ` 13.6290
HDFC FMP 370D SEPTEMBER 2013 (1) Date Period Scheme
Returns (%)
Benchmark Returns
(%)#
Additional Benchmark
Returns (%) ##
Value of ` 10,000 invested
Scheme (`)
Benchmark (`)#
Additional Benchmark
(`)##Mar 31, 16 Last 1 Year 7.48 9.10 7.15 10,748 10,910 10,715Mar 31, 14 Last 3 Years 8.62 9.29 7.85 12,819 13,056 12,549Sep 05, 13 Since Inception 9.06 9.55 7.95 13,629 13,850 13,142
Past performance may or may not be sustained in the future. Returns are compounded annualized (CAGR). # CRISIL Short Term Bond Fund Index ## CRISIL 1 year T-Bill Index. The Scheme is in existence for more than 1 year but less than 5 years. The scheme is managed by Mr. Anil Bamboli since inception.
NAV as on Mar 31, 2017 ` 13.5713
HDFC FMP 370D SEPTEMBER 2013 (2) Date Period Scheme
Returns (%)
Benchmark Returns
(%)#
Additional Benchmark
Returns (%) ##
Value of ` 10,000 invested
Scheme (`)
Benchmark (`)#
Additional Benchmark
(`)##Mar 31, 16 Last 1 Year 7.41 9.10 7.15 10,741 10,910 10,715Mar 31, 14 Last 3 Years 8.63 9.29 7.85 12,823 13,056 12,549Sep 13, 13 Since Inception 8.99 9.56 7.95 13,571 13,825 13,119
Past performance may or may not be sustained in the future. Returns are compounded annualized (CAGR). # CRISIL Short Term Bond Fund Index ## CRISIL 1 year T-Bill Index. The Scheme is in existence for more than 1 year but less than 5 years. The scheme is managed by Mr. Anil Bamboli since inception.
NAV as on Mar 31, 2017 ` 13.6588
HDFC FMP 371D JULY 2013 (1) Date Period Scheme
Returns (%)
Benchmark Returns
(%)#
Additional Benchmark
Returns (%) ##
Value of ` 10,000 invested
Scheme (`)
Benchmark (`)#
Additional Benchmark
(`)##Mar 31, 16 Last 1 Year 7.75 9.10 7.15 10,775 10,910 10,715Mar 31, 14 Last 3 Years 8.49 9.29 7.85 12,773 13,056 12,549Jul 24, 13 Since Inception 8.82 9.62 7.99 13,659 14,031 13,275
Past performance may or may not be sustained in the future. Returns are compounded annualized (CAGR). # CRISIL Short Term Bond Fund Index ## CRISIL 1 year T-Bill Index. The Scheme is in existence for more than 1 year but less than 5 years. The scheme is managed by Mr. Anil Bamboli since inception.
NAV as on Mar 31, 2017 ` 13.6270
HDFC FMP 371D AUGUST 2013 (1) Date Period Scheme
Returns (%)
Benchmark Returns
(%)#
Additional Benchmark
Returns (%) ##
Value of ` 10,000 invested
Scheme (`)
Benchmark (`)#
Additional Benchmark
(`)##Mar 31, 16 Last 1 Year 7.78 9.10 7.15 10,778 10,910 10,715Mar 31, 14 Last 3 Years 8.51 9.29 7.85 12,779 13,056 12,549Aug 07, 13 Since Inception 8.85 9.56 7.95 13,627 13,955 13,222
Past performance may or may not be sustained in the future. Returns are compounded annualized (CAGR). # CRISIL Short Term Bond Fund Index ## CRISIL 1 year T-Bill Index. The Scheme is in existence for more than 1 year but less than 5 years. The scheme is managed by Mr. Anil Bamboli since inception.
NAV as on Mar 31, 2017 ` 13.0586
HDFC FMP 504D DECEMBER 2013 (1) Date Period Scheme
Returns (%)
Benchmark Returns
(%)#
Additional Benchmark
Returns (%) ##
Value of ` 10,000 invested
Scheme (`)
Benchmark (`)#
Additional Benchmark
(`)##Mar 31, 16 Last 1 Year 7.86 9.10 7.15 10,786 10,910 10,715Mar 31, 14 Last 3 Years 8.40 9.29 7.85 12,742 13,056 12,549Dec 27, 13 Since Inception 8.53 9.39 7.90 13,059 13,400 12,813
Past performance may or may not be sustained in the future. Returns are compounded annualized (CAGR). # CRISIL Short Term Bond Fund Index ## CRISIL 1 year T-Bill Index. The Scheme is in existence for more than 1 year but less than 5 years. The scheme is managed by Mr. Anil Bamboli since inception.
NAV as on Mar 31, 2017 ` 13.7407
HDFC FMP 1143D JULY 2013 (1) Date Period Scheme
Returns (%)
Benchmark Returns
(%)#
Additional Benchmark
Returns (%) ##
Value of ` 10,000 invested
Scheme (`)
Benchmark (`)#
Additional Benchmark
(`)##Mar 31, 16 Last 1 Year 7.63 11.09 7.15 10,763 11,109 10,715Mar 31, 14 Last 3 Years 8.68 11.26 7.85 12,840 13,778 12,549Aug 06, 13 Since Inception 9.09 10.61 7.95 13,741 14,454 13,225
Past performance may or may not be sustained in the future. Returns are compounded annualized (CAGR). # CRISIL Composite Bond Fund Index ## CRISIL 1 year T-Bill Index. The Scheme is in existence for more than 1 year but less than 5 years. The scheme is managed by Mr. Anil Bamboli since inception.
ANIL BAMBOLI....CONTINUED
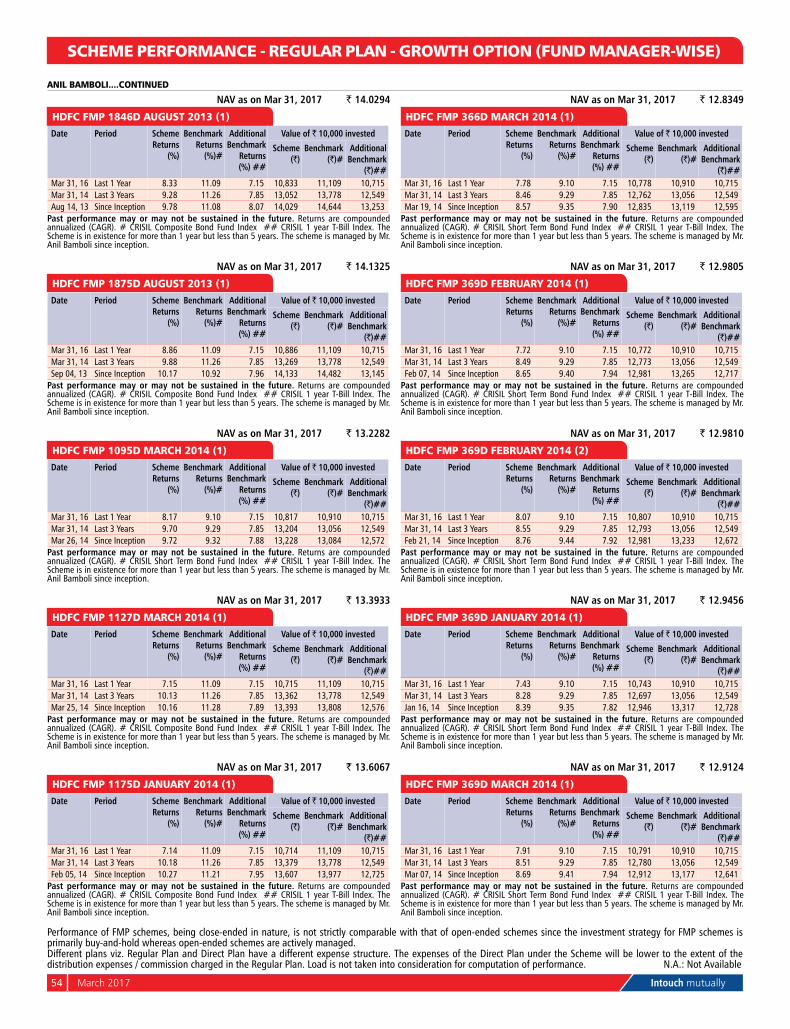
54 March 2017 Intouch mutually
SCHEME PERFORMANCE - REGULAR PLAN - GROWTH OPTION (FUND MANAGER-WISE)
Different plans viz. Regular Plan and Direct Plan have a different expense structure. The expenses of the Direct Plan under the Scheme will be lower to the extent of the distribution expenses / commission charged in the Regular Plan. Load is not taken into consideration for computation of performance. n.A.: not Available
Performance of FMP schemes, being close-ended in nature, is not strictly comparable with that of open-ended schemes since the investment strategy for FMP schemes is primarily buy-and-hold whereas open-ended schemes are actively managed.
NAV as on Mar 31, 2017 ` 14.0294
HDFC FMP 1846D AUGUST 2013 (1) Date Period Scheme
Returns (%)
Benchmark Returns
(%)#
Additional Benchmark
Returns (%) ##
Value of ` 10,000 invested
Scheme (`)
Benchmark (`)#
Additional Benchmark
(`)##Mar 31, 16 Last 1 Year 8.33 11.09 7.15 10,833 11,109 10,715Mar 31, 14 Last 3 Years 9.28 11.26 7.85 13,052 13,778 12,549Aug 14, 13 Since Inception 9.78 11.08 8.07 14,029 14,644 13,253
Past performance may or may not be sustained in the future. Returns are compounded annualized (CAGR). # CRISIL Composite Bond Fund Index ## CRISIL 1 year T-Bill Index. The Scheme is in existence for more than 1 year but less than 5 years. The scheme is managed by Mr. Anil Bamboli since inception.
NAV as on Mar 31, 2017 ` 14.1325
HDFC FMP 1875D AUGUST 2013 (1) Date Period Scheme
Returns (%)
Benchmark Returns
(%)#
Additional Benchmark
Returns (%) ##
Value of ` 10,000 invested
Scheme (`)
Benchmark (`)#
Additional Benchmark
(`)##Mar 31, 16 Last 1 Year 8.86 11.09 7.15 10,886 11,109 10,715Mar 31, 14 Last 3 Years 9.88 11.26 7.85 13,269 13,778 12,549Sep 04, 13 Since Inception 10.17 10.92 7.96 14,133 14,482 13,145
Past performance may or may not be sustained in the future. Returns are compounded annualized (CAGR). # CRISIL Composite Bond Fund Index ## CRISIL 1 year T-Bill Index. The Scheme is in existence for more than 1 year but less than 5 years. The scheme is managed by Mr. Anil Bamboli since inception.
NAV as on Mar 31, 2017 ` 13.2282
HDFC FMP 1095D MARCH 2014 (1) Date Period Scheme
Returns (%)
Benchmark Returns
(%)#
Additional Benchmark
Returns (%) ##
Value of ` 10,000 invested
Scheme (`)
Benchmark (`)#
Additional Benchmark
(`)##Mar 31, 16 Last 1 Year 8.17 9.10 7.15 10,817 10,910 10,715Mar 31, 14 Last 3 Years 9.70 9.29 7.85 13,204 13,056 12,549Mar 26, 14 Since Inception 9.72 9.32 7.88 13,228 13,084 12,572
Past performance may or may not be sustained in the future. Returns are compounded annualized (CAGR). # CRISIL Short Term Bond Fund Index ## CRISIL 1 year T-Bill Index. The Scheme is in existence for more than 1 year but less than 5 years. The scheme is managed by Mr. Anil Bamboli since inception.
NAV as on Mar 31, 2017 ` 13.3933
HDFC FMP 1127D MARCH 2014 (1) Date Period Scheme
Returns (%)
Benchmark Returns
(%)#
Additional Benchmark
Returns (%) ##
Value of ` 10,000 invested
Scheme (`)
Benchmark (`)#
Additional Benchmark
(`)##Mar 31, 16 Last 1 Year 7.15 11.09 7.15 10,715 11,109 10,715Mar 31, 14 Last 3 Years 10.13 11.26 7.85 13,362 13,778 12,549Mar 25, 14 Since Inception 10.16 11.28 7.89 13,393 13,808 12,576
Past performance may or may not be sustained in the future. Returns are compounded annualized (CAGR). # CRISIL Composite Bond Fund Index ## CRISIL 1 year T-Bill Index. The Scheme is in existence for more than 1 year but less than 5 years. The scheme is managed by Mr. Anil Bamboli since inception.
NAV as on Mar 31, 2017 ` 13.6067
HDFC FMP 1175D JANUARY 2014 (1) Date Period Scheme
Returns (%)
Benchmark Returns
(%)#
Additional Benchmark
Returns (%) ##
Value of ` 10,000 invested
Scheme (`)
Benchmark (`)#
Additional Benchmark
(`)##Mar 31, 16 Last 1 Year 7.14 11.09 7.15 10,714 11,109 10,715Mar 31, 14 Last 3 Years 10.18 11.26 7.85 13,379 13,778 12,549Feb 05, 14 Since Inception 10.27 11.21 7.95 13,607 13,977 12,725
Past performance may or may not be sustained in the future. Returns are compounded annualized (CAGR). # CRISIL Composite Bond Fund Index ## CRISIL 1 year T-Bill Index. The Scheme is in existence for more than 1 year but less than 5 years. The scheme is managed by Mr. Anil Bamboli since inception.
NAV as on Mar 31, 2017 ` 12.8349
HDFC FMP 366D MARCH 2014 (1) Date Period Scheme
Returns (%)
Benchmark Returns
(%)#
Additional Benchmark
Returns (%) ##
Value of ` 10,000 invested
Scheme (`)
Benchmark (`)#
Additional Benchmark
(`)##Mar 31, 16 Last 1 Year 7.78 9.10 7.15 10,778 10,910 10,715Mar 31, 14 Last 3 Years 8.46 9.29 7.85 12,762 13,056 12,549Mar 19, 14 Since Inception 8.57 9.35 7.90 12,835 13,119 12,595
Past performance may or may not be sustained in the future. Returns are compounded annualized (CAGR). # CRISIL Short Term Bond Fund Index ## CRISIL 1 year T-Bill Index. The Scheme is in existence for more than 1 year but less than 5 years. The scheme is managed by Mr. Anil Bamboli since inception.
NAV as on Mar 31, 2017 ` 12.9805
HDFC FMP 369D FEBRUARY 2014 (1) Date Period Scheme
Returns (%)
Benchmark Returns
(%)#
Additional Benchmark
Returns (%) ##
Value of ` 10,000 invested
Scheme (`)
Benchmark (`)#
Additional Benchmark
(`)##Mar 31, 16 Last 1 Year 7.72 9.10 7.15 10,772 10,910 10,715Mar 31, 14 Last 3 Years 8.49 9.29 7.85 12,773 13,056 12,549Feb 07, 14 Since Inception 8.65 9.40 7.94 12,981 13,265 12,717
Past performance may or may not be sustained in the future. Returns are compounded annualized (CAGR). # CRISIL Short Term Bond Fund Index ## CRISIL 1 year T-Bill Index. The Scheme is in existence for more than 1 year but less than 5 years. The scheme is managed by Mr. Anil Bamboli since inception.
NAV as on Mar 31, 2017 ` 12.9810
HDFC FMP 369D FEBRUARY 2014 (2) Date Period Scheme
Returns (%)
Benchmark Returns
(%)#
Additional Benchmark
Returns (%) ##
Value of ` 10,000 invested
Scheme (`)
Benchmark (`)#
Additional Benchmark
(`)##Mar 31, 16 Last 1 Year 8.07 9.10 7.15 10,807 10,910 10,715Mar 31, 14 Last 3 Years 8.55 9.29 7.85 12,793 13,056 12,549Feb 21, 14 Since Inception 8.76 9.44 7.92 12,981 13,233 12,672
Past performance may or may not be sustained in the future. Returns are compounded annualized (CAGR). # CRISIL Short Term Bond Fund Index ## CRISIL 1 year T-Bill Index. The Scheme is in existence for more than 1 year but less than 5 years. The scheme is managed by Mr. Anil Bamboli since inception.
NAV as on Mar 31, 2017 ` 12.9456
HDFC FMP 369D JANUARY 2014 (1) Date Period Scheme
Returns (%)
Benchmark Returns
(%)#
Additional Benchmark
Returns (%) ##
Value of ` 10,000 invested
Scheme (`)
Benchmark (`)#
Additional Benchmark
(`)##Mar 31, 16 Last 1 Year 7.43 9.10 7.15 10,743 10,910 10,715Mar 31, 14 Last 3 Years 8.28 9.29 7.85 12,697 13,056 12,549Jan 16, 14 Since Inception 8.39 9.35 7.82 12,946 13,317 12,728
Past performance may or may not be sustained in the future. Returns are compounded annualized (CAGR). # CRISIL Short Term Bond Fund Index ## CRISIL 1 year T-Bill Index. The Scheme is in existence for more than 1 year but less than 5 years. The scheme is managed by Mr. Anil Bamboli since inception.
NAV as on Mar 31, 2017 ` 12.9124
HDFC FMP 369D MARCH 2014 (1) Date Period Scheme
Returns (%)
Benchmark Returns
(%)#
Additional Benchmark
Returns (%) ##
Value of ` 10,000 invested
Scheme (`)
Benchmark (`)#
Additional Benchmark
(`)##Mar 31, 16 Last 1 Year 7.91 9.10 7.15 10,791 10,910 10,715Mar 31, 14 Last 3 Years 8.51 9.29 7.85 12,780 13,056 12,549Mar 07, 14 Since Inception 8.69 9.41 7.94 12,912 13,177 12,641
Past performance may or may not be sustained in the future. Returns are compounded annualized (CAGR). # CRISIL Short Term Bond Fund Index ## CRISIL 1 year T-Bill Index. The Scheme is in existence for more than 1 year but less than 5 years. The scheme is managed by Mr. Anil Bamboli since inception.
ANIL BAMBOLI....CONTINUED
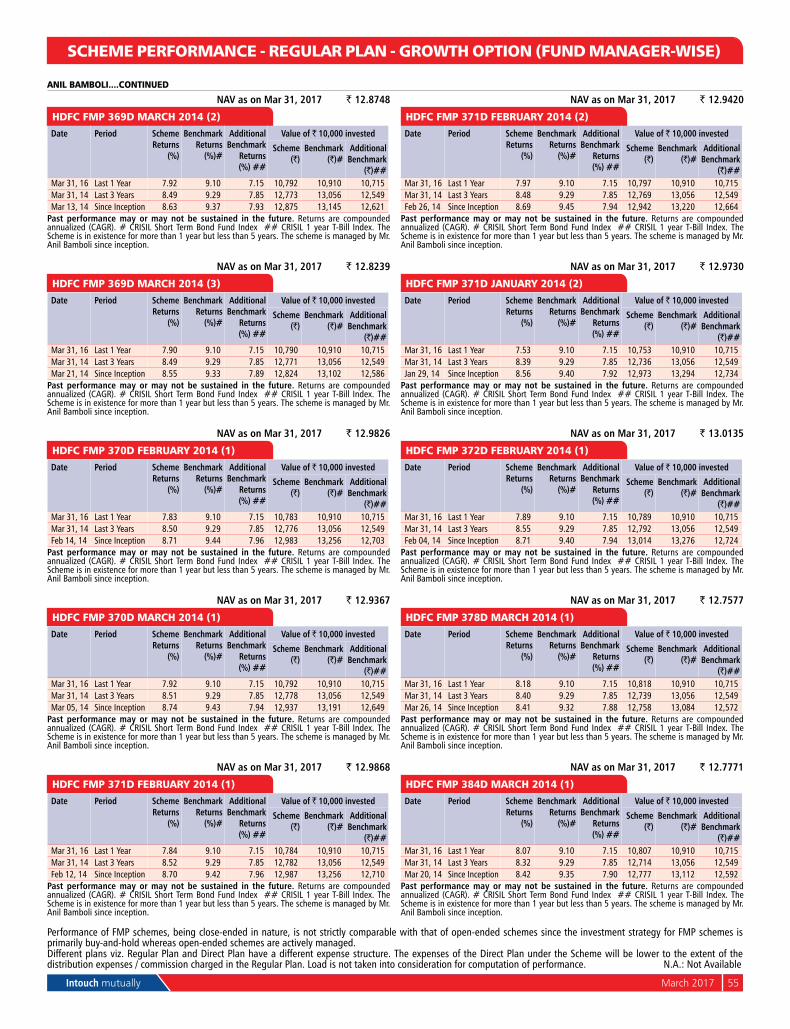
Intouch mutually March 2017 55
SCHEME PERFORMANCE - REGULAR PLAN - GROWTH OPTION (FUND MANAGER-WISE)
Different plans viz. Regular Plan and Direct Plan have a different expense structure. The expenses of the Direct Plan under the Scheme will be lower to the extent of the distribution expenses / commission charged in the Regular Plan. Load is not taken into consideration for computation of performance. n.A.: not Available
Performance of FMP schemes, being close-ended in nature, is not strictly comparable with that of open-ended schemes since the investment strategy for FMP schemes is primarily buy-and-hold whereas open-ended schemes are actively managed.
NAV as on Mar 31, 2017 ` 12.8748
HDFC FMP 369D MARCH 2014 (2) Date Period Scheme
Returns (%)
Benchmark Returns
(%)#
Additional Benchmark
Returns (%) ##
Value of ` 10,000 invested
Scheme (`)
Benchmark (`)#
Additional Benchmark
(`)##Mar 31, 16 Last 1 Year 7.92 9.10 7.15 10,792 10,910 10,715Mar 31, 14 Last 3 Years 8.49 9.29 7.85 12,773 13,056 12,549Mar 13, 14 Since Inception 8.63 9.37 7.93 12,875 13,145 12,621
Past performance may or may not be sustained in the future. Returns are compounded annualized (CAGR). # CRISIL Short Term Bond Fund Index ## CRISIL 1 year T-Bill Index. The Scheme is in existence for more than 1 year but less than 5 years. The scheme is managed by Mr. Anil Bamboli since inception.
NAV as on Mar 31, 2017 ` 12.8239
HDFC FMP 369D MARCH 2014 (3) Date Period Scheme
Returns (%)
Benchmark Returns
(%)#
Additional Benchmark
Returns (%) ##
Value of ` 10,000 invested
Scheme (`)
Benchmark (`)#
Additional Benchmark
(`)##Mar 31, 16 Last 1 Year 7.90 9.10 7.15 10,790 10,910 10,715Mar 31, 14 Last 3 Years 8.49 9.29 7.85 12,771 13,056 12,549Mar 21, 14 Since Inception 8.55 9.33 7.89 12,824 13,102 12,586
Past performance may or may not be sustained in the future. Returns are compounded annualized (CAGR). # CRISIL Short Term Bond Fund Index ## CRISIL 1 year T-Bill Index. The Scheme is in existence for more than 1 year but less than 5 years. The scheme is managed by Mr. Anil Bamboli since inception.
NAV as on Mar 31, 2017 ` 12.9826
HDFC FMP 370D FEBRUARY 2014 (1) Date Period Scheme
Returns (%)
Benchmark Returns
(%)#
Additional Benchmark
Returns (%) ##
Value of ` 10,000 invested
Scheme (`)
Benchmark (`)#
Additional Benchmark
(`)##Mar 31, 16 Last 1 Year 7.83 9.10 7.15 10,783 10,910 10,715Mar 31, 14 Last 3 Years 8.50 9.29 7.85 12,776 13,056 12,549Feb 14, 14 Since Inception 8.71 9.44 7.96 12,983 13,256 12,703
Past performance may or may not be sustained in the future. Returns are compounded annualized (CAGR). # CRISIL Short Term Bond Fund Index ## CRISIL 1 year T-Bill Index. The Scheme is in existence for more than 1 year but less than 5 years. The scheme is managed by Mr. Anil Bamboli since inception.
NAV as on Mar 31, 2017 ` 12.9367
HDFC FMP 370D MARCH 2014 (1) Date Period Scheme
Returns (%)
Benchmark Returns
(%)#
Additional Benchmark
Returns (%) ##
Value of ` 10,000 invested
Scheme (`)
Benchmark (`)#
Additional Benchmark
(`)##Mar 31, 16 Last 1 Year 7.92 9.10 7.15 10,792 10,910 10,715Mar 31, 14 Last 3 Years 8.51 9.29 7.85 12,778 13,056 12,549Mar 05, 14 Since Inception 8.74 9.43 7.94 12,937 13,191 12,649
Past performance may or may not be sustained in the future. Returns are compounded annualized (CAGR). # CRISIL Short Term Bond Fund Index ## CRISIL 1 year T-Bill Index. The Scheme is in existence for more than 1 year but less than 5 years. The scheme is managed by Mr. Anil Bamboli since inception.
NAV as on Mar 31, 2017 ` 12.9868
HDFC FMP 371D FEBRUARY 2014 (1) Date Period Scheme
Returns (%)
Benchmark Returns
(%)#
Additional Benchmark
Returns (%) ##
Value of ` 10,000 invested
Scheme (`)
Benchmark (`)#
Additional Benchmark
(`)##Mar 31, 16 Last 1 Year 7.84 9.10 7.15 10,784 10,910 10,715Mar 31, 14 Last 3 Years 8.52 9.29 7.85 12,782 13,056 12,549Feb 12, 14 Since Inception 8.70 9.42 7.96 12,987 13,256 12,710
Past performance may or may not be sustained in the future. Returns are compounded annualized (CAGR). # CRISIL Short Term Bond Fund Index ## CRISIL 1 year T-Bill Index. The Scheme is in existence for more than 1 year but less than 5 years. The scheme is managed by Mr. Anil Bamboli since inception.
NAV as on Mar 31, 2017 ` 12.9420
HDFC FMP 371D FEBRUARY 2014 (2) Date Period Scheme
Returns (%)
Benchmark Returns
(%)#
Additional Benchmark
Returns (%) ##
Value of ` 10,000 invested
Scheme (`)
Benchmark (`)#
Additional Benchmark
(`)##Mar 31, 16 Last 1 Year 7.97 9.10 7.15 10,797 10,910 10,715Mar 31, 14 Last 3 Years 8.48 9.29 7.85 12,769 13,056 12,549Feb 26, 14 Since Inception 8.69 9.45 7.94 12,942 13,220 12,664
Past performance may or may not be sustained in the future. Returns are compounded annualized (CAGR). # CRISIL Short Term Bond Fund Index ## CRISIL 1 year T-Bill Index. The Scheme is in existence for more than 1 year but less than 5 years. The scheme is managed by Mr. Anil Bamboli since inception.
NAV as on Mar 31, 2017 ` 12.9730
HDFC FMP 371D JANUARY 2014 (2) Date Period Scheme
Returns (%)
Benchmark Returns
(%)#
Additional Benchmark
Returns (%) ##
Value of ` 10,000 invested
Scheme (`)
Benchmark (`)#
Additional Benchmark
(`)##Mar 31, 16 Last 1 Year 7.53 9.10 7.15 10,753 10,910 10,715Mar 31, 14 Last 3 Years 8.39 9.29 7.85 12,736 13,056 12,549Jan 29, 14 Since Inception 8.56 9.40 7.92 12,973 13,294 12,734
Past performance may or may not be sustained in the future. Returns are compounded annualized (CAGR). # CRISIL Short Term Bond Fund Index ## CRISIL 1 year T-Bill Index. The Scheme is in existence for more than 1 year but less than 5 years. The scheme is managed by Mr. Anil Bamboli since inception.
NAV as on Mar 31, 2017 ` 13.0135
HDFC FMP 372D FEBRUARY 2014 (1) Date Period Scheme
Returns (%)
Benchmark Returns
(%)#
Additional Benchmark
Returns (%) ##
Value of ` 10,000 invested
Scheme (`)
Benchmark (`)#
Additional Benchmark
(`)##Mar 31, 16 Last 1 Year 7.89 9.10 7.15 10,789 10,910 10,715Mar 31, 14 Last 3 Years 8.55 9.29 7.85 12,792 13,056 12,549Feb 04, 14 Since Inception 8.71 9.40 7.94 13,014 13,276 12,724
Past performance may or may not be sustained in the future. Returns are compounded annualized (CAGR). # CRISIL Short Term Bond Fund Index ## CRISIL 1 year T-Bill Index. The Scheme is in existence for more than 1 year but less than 5 years. The scheme is managed by Mr. Anil Bamboli since inception.
NAV as on Mar 31, 2017 ` 12.7577
HDFC FMP 378D MARCH 2014 (1) Date Period Scheme
Returns (%)
Benchmark Returns
(%)#
Additional Benchmark
Returns (%) ##
Value of ` 10,000 invested
Scheme (`)
Benchmark (`)#
Additional Benchmark
(`)##Mar 31, 16 Last 1 Year 8.18 9.10 7.15 10,818 10,910 10,715Mar 31, 14 Last 3 Years 8.40 9.29 7.85 12,739 13,056 12,549Mar 26, 14 Since Inception 8.41 9.32 7.88 12,758 13,084 12,572
Past performance may or may not be sustained in the future. Returns are compounded annualized (CAGR). # CRISIL Short Term Bond Fund Index ## CRISIL 1 year T-Bill Index. The Scheme is in existence for more than 1 year but less than 5 years. The scheme is managed by Mr. Anil Bamboli since inception.
NAV as on Mar 31, 2017 ` 12.7771
HDFC FMP 384D MARCH 2014 (1) Date Period Scheme
Returns (%)
Benchmark Returns
(%)#
Additional Benchmark
Returns (%) ##
Value of ` 10,000 invested
Scheme (`)
Benchmark (`)#
Additional Benchmark
(`)##Mar 31, 16 Last 1 Year 8.07 9.10 7.15 10,807 10,910 10,715Mar 31, 14 Last 3 Years 8.32 9.29 7.85 12,714 13,056 12,549Mar 20, 14 Since Inception 8.42 9.35 7.90 12,777 13,112 12,592
Past performance may or may not be sustained in the future. Returns are compounded annualized (CAGR). # CRISIL Short Term Bond Fund Index ## CRISIL 1 year T-Bill Index. The Scheme is in existence for more than 1 year but less than 5 years. The scheme is managed by Mr. Anil Bamboli since inception.
ANIL BAMBOLI....CONTINUED
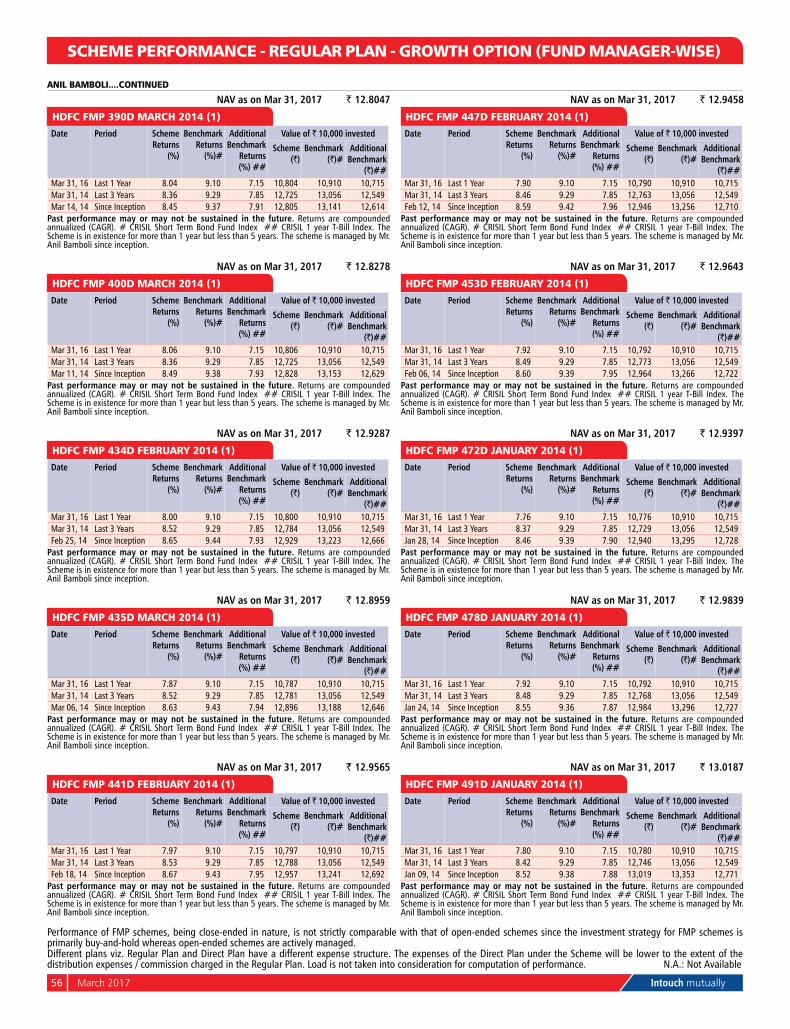
56 March 2017 Intouch mutually
SCHEME PERFORMANCE - REGULAR PLAN - GROWTH OPTION (FUND MANAGER-WISE)
Different plans viz. Regular Plan and Direct Plan have a different expense structure. The expenses of the Direct Plan under the Scheme will be lower to the extent of the distribution expenses / commission charged in the Regular Plan. Load is not taken into consideration for computation of performance. n.A.: not Available
Performance of FMP schemes, being close-ended in nature, is not strictly comparable with that of open-ended schemes since the investment strategy for FMP schemes is primarily buy-and-hold whereas open-ended schemes are actively managed.
NAV as on Mar 31, 2017 ` 12.8047
HDFC FMP 390D MARCH 2014 (1) Date Period Scheme
Returns (%)
Benchmark Returns
(%)#
Additional Benchmark
Returns (%) ##
Value of ` 10,000 invested
Scheme (`)
Benchmark (`)#
Additional Benchmark
(`)##Mar 31, 16 Last 1 Year 8.04 9.10 7.15 10,804 10,910 10,715Mar 31, 14 Last 3 Years 8.36 9.29 7.85 12,725 13,056 12,549Mar 14, 14 Since Inception 8.45 9.37 7.91 12,805 13,141 12,614
Past performance may or may not be sustained in the future. Returns are compounded annualized (CAGR). # CRISIL Short Term Bond Fund Index ## CRISIL 1 year T-Bill Index. The Scheme is in existence for more than 1 year but less than 5 years. The scheme is managed by Mr. Anil Bamboli since inception.
NAV as on Mar 31, 2017 ` 12.8278
HDFC FMP 400D MARCH 2014 (1) Date Period Scheme
Returns (%)
Benchmark Returns
(%)#
Additional Benchmark
Returns (%) ##
Value of ` 10,000 invested
Scheme (`)
Benchmark (`)#
Additional Benchmark
(`)##Mar 31, 16 Last 1 Year 8.06 9.10 7.15 10,806 10,910 10,715Mar 31, 14 Last 3 Years 8.36 9.29 7.85 12,725 13,056 12,549Mar 11, 14 Since Inception 8.49 9.38 7.93 12,828 13,153 12,629
Past performance may or may not be sustained in the future. Returns are compounded annualized (CAGR). # CRISIL Short Term Bond Fund Index ## CRISIL 1 year T-Bill Index. The Scheme is in existence for more than 1 year but less than 5 years. The scheme is managed by Mr. Anil Bamboli since inception.
NAV as on Mar 31, 2017 ` 12.9287
HDFC FMP 434D FEBRUARY 2014 (1) Date Period Scheme
Returns (%)
Benchmark Returns
(%)#
Additional Benchmark
Returns (%) ##
Value of ` 10,000 invested
Scheme (`)
Benchmark (`)#
Additional Benchmark
(`)##Mar 31, 16 Last 1 Year 8.00 9.10 7.15 10,800 10,910 10,715Mar 31, 14 Last 3 Years 8.52 9.29 7.85 12,784 13,056 12,549Feb 25, 14 Since Inception 8.65 9.44 7.93 12,929 13,223 12,666
Past performance may or may not be sustained in the future. Returns are compounded annualized (CAGR). # CRISIL Short Term Bond Fund Index ## CRISIL 1 year T-Bill Index. The Scheme is in existence for more than 1 year but less than 5 years. The scheme is managed by Mr. Anil Bamboli since inception.
NAV as on Mar 31, 2017 ` 12.8959
HDFC FMP 435D MARCH 2014 (1) Date Period Scheme
Returns (%)
Benchmark Returns
(%)#
Additional Benchmark
Returns (%) ##
Value of ` 10,000 invested
Scheme (`)
Benchmark (`)#
Additional Benchmark
(`)##Mar 31, 16 Last 1 Year 7.87 9.10 7.15 10,787 10,910 10,715Mar 31, 14 Last 3 Years 8.52 9.29 7.85 12,781 13,056 12,549Mar 06, 14 Since Inception 8.63 9.43 7.94 12,896 13,188 12,646
Past performance may or may not be sustained in the future. Returns are compounded annualized (CAGR). # CRISIL Short Term Bond Fund Index ## CRISIL 1 year T-Bill Index. The Scheme is in existence for more than 1 year but less than 5 years. The scheme is managed by Mr. Anil Bamboli since inception.
NAV as on Mar 31, 2017 ` 12.9565
HDFC FMP 441D FEBRUARY 2014 (1) Date Period Scheme
Returns (%)
Benchmark Returns
(%)#
Additional Benchmark
Returns (%) ##
Value of ` 10,000 invested
Scheme (`)
Benchmark (`)#
Additional Benchmark
(`)##Mar 31, 16 Last 1 Year 7.97 9.10 7.15 10,797 10,910 10,715Mar 31, 14 Last 3 Years 8.53 9.29 7.85 12,788 13,056 12,549Feb 18, 14 Since Inception 8.67 9.43 7.95 12,957 13,241 12,692
Past performance may or may not be sustained in the future. Returns are compounded annualized (CAGR). # CRISIL Short Term Bond Fund Index ## CRISIL 1 year T-Bill Index. The Scheme is in existence for more than 1 year but less than 5 years. The scheme is managed by Mr. Anil Bamboli since inception.
NAV as on Mar 31, 2017 ` 12.9458
HDFC FMP 447D FEBRUARY 2014 (1) Date Period Scheme
Returns (%)
Benchmark Returns
(%)#
Additional Benchmark
Returns (%) ##
Value of ` 10,000 invested
Scheme (`)
Benchmark (`)#
Additional Benchmark
(`)##Mar 31, 16 Last 1 Year 7.90 9.10 7.15 10,790 10,910 10,715Mar 31, 14 Last 3 Years 8.46 9.29 7.85 12,763 13,056 12,549Feb 12, 14 Since Inception 8.59 9.42 7.96 12,946 13,256 12,710
Past performance may or may not be sustained in the future. Returns are compounded annualized (CAGR). # CRISIL Short Term Bond Fund Index ## CRISIL 1 year T-Bill Index. The Scheme is in existence for more than 1 year but less than 5 years. The scheme is managed by Mr. Anil Bamboli since inception.
NAV as on Mar 31, 2017 ` 12.9643
HDFC FMP 453D FEBRUARY 2014 (1) Date Period Scheme
Returns (%)
Benchmark Returns
(%)#
Additional Benchmark
Returns (%) ##
Value of ` 10,000 invested
Scheme (`)
Benchmark (`)#
Additional Benchmark
(`)##Mar 31, 16 Last 1 Year 7.92 9.10 7.15 10,792 10,910 10,715Mar 31, 14 Last 3 Years 8.49 9.29 7.85 12,773 13,056 12,549Feb 06, 14 Since Inception 8.60 9.39 7.95 12,964 13,266 12,722
Past performance may or may not be sustained in the future. Returns are compounded annualized (CAGR). # CRISIL Short Term Bond Fund Index ## CRISIL 1 year T-Bill Index. The Scheme is in existence for more than 1 year but less than 5 years. The scheme is managed by Mr. Anil Bamboli since inception.
NAV as on Mar 31, 2017 ` 12.9397
HDFC FMP 472D JANUARY 2014 (1) Date Period Scheme
Returns (%)
Benchmark Returns
(%)#
Additional Benchmark
Returns (%) ##
Value of ` 10,000 invested
Scheme (`)
Benchmark (`)#
Additional Benchmark
(`)##Mar 31, 16 Last 1 Year 7.76 9.10 7.15 10,776 10,910 10,715Mar 31, 14 Last 3 Years 8.37 9.29 7.85 12,729 13,056 12,549Jan 28, 14 Since Inception 8.46 9.39 7.90 12,940 13,295 12,728
Past performance may or may not be sustained in the future. Returns are compounded annualized (CAGR). # CRISIL Short Term Bond Fund Index ## CRISIL 1 year T-Bill Index. The Scheme is in existence for more than 1 year but less than 5 years. The scheme is managed by Mr. Anil Bamboli since inception.
NAV as on Mar 31, 2017 ` 12.9839
HDFC FMP 478D JANUARY 2014 (1) Date Period Scheme
Returns (%)
Benchmark Returns
(%)#
Additional Benchmark
Returns (%) ##
Value of ` 10,000 invested
Scheme (`)
Benchmark (`)#
Additional Benchmark
(`)##Mar 31, 16 Last 1 Year 7.92 9.10 7.15 10,792 10,910 10,715Mar 31, 14 Last 3 Years 8.48 9.29 7.85 12,768 13,056 12,549Jan 24, 14 Since Inception 8.55 9.36 7.87 12,984 13,296 12,727
Past performance may or may not be sustained in the future. Returns are compounded annualized (CAGR). # CRISIL Short Term Bond Fund Index ## CRISIL 1 year T-Bill Index. The Scheme is in existence for more than 1 year but less than 5 years. The scheme is managed by Mr. Anil Bamboli since inception.
NAV as on Mar 31, 2017 ` 13.0187
HDFC FMP 491D JANUARY 2014 (1) Date Period Scheme
Returns (%)
Benchmark Returns
(%)#
Additional Benchmark
Returns (%) ##
Value of ` 10,000 invested
Scheme (`)
Benchmark (`)#
Additional Benchmark
(`)##Mar 31, 16 Last 1 Year 7.80 9.10 7.15 10,780 10,910 10,715Mar 31, 14 Last 3 Years 8.42 9.29 7.85 12,746 13,056 12,549Jan 09, 14 Since Inception 8.52 9.38 7.88 13,019 13,353 12,771
Past performance may or may not be sustained in the future. Returns are compounded annualized (CAGR). # CRISIL Short Term Bond Fund Index ## CRISIL 1 year T-Bill Index. The Scheme is in existence for more than 1 year but less than 5 years. The scheme is managed by Mr. Anil Bamboli since inception.
ANIL BAMBOLI....CONTINUED
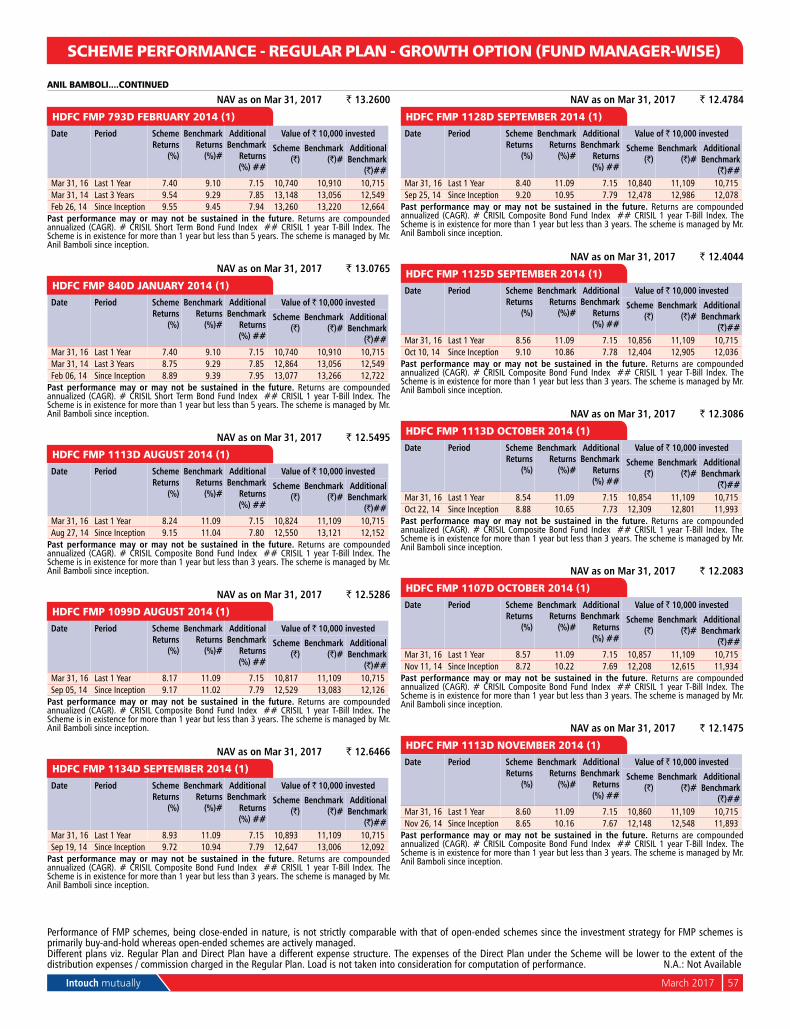
Intouch mutually March 2017 57
SCHEME PERFORMANCE - REGULAR PLAN - GROWTH OPTION (FUND MANAGER-WISE)
Different plans viz. Regular Plan and Direct Plan have a different expense structure. The expenses of the Direct Plan under the Scheme will be lower to the extent of the distribution expenses / commission charged in the Regular Plan. Load is not taken into consideration for computation of performance. n.A.: not Available
Performance of FMP schemes, being close-ended in nature, is not strictly comparable with that of open-ended schemes since the investment strategy for FMP schemes is primarily buy-and-hold whereas open-ended schemes are actively managed.
NAV as on Mar 31, 2017 ` 13.2600
HDFC FMP 793D FEBRUARY 2014 (1) Date Period Scheme
Returns (%)
Benchmark Returns
(%)#
Additional Benchmark
Returns (%) ##
Value of ` 10,000 invested
Scheme (`)
Benchmark (`)#
Additional Benchmark
(`)##Mar 31, 16 Last 1 Year 7.40 9.10 7.15 10,740 10,910 10,715Mar 31, 14 Last 3 Years 9.54 9.29 7.85 13,148 13,056 12,549Feb 26, 14 Since Inception 9.55 9.45 7.94 13,260 13,220 12,664
Past performance may or may not be sustained in the future. Returns are compounded annualized (CAGR). # CRISIL Short Term Bond Fund Index ## CRISIL 1 year T-Bill Index. The Scheme is in existence for more than 1 year but less than 5 years. The scheme is managed by Mr. Anil Bamboli since inception.
NAV as on Mar 31, 2017 ` 13.0765
HDFC FMP 840D JANUARY 2014 (1) Date Period Scheme
Returns (%)
Benchmark Returns
(%)#
Additional Benchmark
Returns (%) ##
Value of ` 10,000 invested
Scheme (`)
Benchmark (`)#
Additional Benchmark
(`)##Mar 31, 16 Last 1 Year 7.40 9.10 7.15 10,740 10,910 10,715Mar 31, 14 Last 3 Years 8.75 9.29 7.85 12,864 13,056 12,549Feb 06, 14 Since Inception 8.89 9.39 7.95 13,077 13,266 12,722
Past performance may or may not be sustained in the future. Returns are compounded annualized (CAGR). # CRISIL Short Term Bond Fund Index ## CRISIL 1 year T-Bill Index. The Scheme is in existence for more than 1 year but less than 5 years. The scheme is managed by Mr. Anil Bamboli since inception.
NAV as on Mar 31, 2017 ` 12.5495
HDFC FMP 1113D AUGUST 2014 (1) Date Period Scheme
Returns (%)
Benchmark Returns
(%)#
Additional Benchmark
Returns (%) ##
Value of ` 10,000 invested
Scheme (`)
Benchmark (`)#
Additional Benchmark
(`)##Mar 31, 16 Last 1 Year 8.24 11.09 7.15 10,824 11,109 10,715Aug 27, 14 Since Inception 9.15 11.04 7.80 12,550 13,121 12,152
Past performance may or may not be sustained in the future. Returns are compounded annualized (CAGR). # CRISIL Composite Bond Fund Index ## CRISIL 1 year T-Bill Index. The Scheme is in existence for more than 1 year but less than 3 years. The scheme is managed by Mr. Anil Bamboli since inception.
NAV as on Mar 31, 2017 ` 12.5286
HDFC FMP 1099D AUGUST 2014 (1) Date Period Scheme
Returns (%)
Benchmark Returns
(%)#
Additional Benchmark
Returns (%) ##
Value of ` 10,000 invested
Scheme (`)
Benchmark (`)#
Additional Benchmark
(`)##Mar 31, 16 Last 1 Year 8.17 11.09 7.15 10,817 11,109 10,715Sep 05, 14 Since Inception 9.17 11.02 7.79 12,529 13,083 12,126
Past performance may or may not be sustained in the future. Returns are compounded annualized (CAGR). # CRISIL Composite Bond Fund Index ## CRISIL 1 year T-Bill Index. The Scheme is in existence for more than 1 year but less than 3 years. The scheme is managed by Mr. Anil Bamboli since inception.
NAV as on Mar 31, 2017 ` 12.6466
HDFC FMP 1134D SEPTEMBER 2014 (1) Date Period Scheme
Returns (%)
Benchmark Returns
(%)#
Additional Benchmark
Returns (%) ##
Value of ` 10,000 invested
Scheme (`)
Benchmark (`)#
Additional Benchmark
(`)##Mar 31, 16 Last 1 Year 8.93 11.09 7.15 10,893 11,109 10,715Sep 19, 14 Since Inception 9.72 10.94 7.79 12,647 13,006 12,092
Past performance may or may not be sustained in the future. Returns are compounded annualized (CAGR). # CRISIL Composite Bond Fund Index ## CRISIL 1 year T-Bill Index. The Scheme is in existence for more than 1 year but less than 3 years. The scheme is managed by Mr. Anil Bamboli since inception.
NAV as on Mar 31, 2017 ` 12.4784
HDFC FMP 1128D SEPTEMBER 2014 (1) Date Period Scheme
Returns (%)
Benchmark Returns
(%)#
Additional Benchmark
Returns (%) ##
Value of ` 10,000 invested
Scheme (`)
Benchmark (`)#
Additional Benchmark
(`)##Mar 31, 16 Last 1 Year 8.40 11.09 7.15 10,840 11,109 10,715Sep 25, 14 Since Inception 9.20 10.95 7.79 12,478 12,986 12,078
Past performance may or may not be sustained in the future. Returns are compounded annualized (CAGR). # CRISIL Composite Bond Fund Index ## CRISIL 1 year T-Bill Index. The Scheme is in existence for more than 1 year but less than 3 years. The scheme is managed by Mr. Anil Bamboli since inception.
NAV as on Mar 31, 2017 ` 12.4044
HDFC FMP 1125D SEPTEMBER 2014 (1) Date Period Scheme
Returns (%)
Benchmark Returns
(%)#
Additional Benchmark
Returns (%) ##
Value of ` 10,000 invested
Scheme (`)
Benchmark (`)#
Additional Benchmark
(`)##Mar 31, 16 Last 1 Year 8.56 11.09 7.15 10,856 11,109 10,715Oct 10, 14 Since Inception 9.10 10.86 7.78 12,404 12,905 12,036
Past performance may or may not be sustained in the future. Returns are compounded annualized (CAGR). # CRISIL Composite Bond Fund Index ## CRISIL 1 year T-Bill Index. The Scheme is in existence for more than 1 year but less than 3 years. The scheme is managed by Mr. Anil Bamboli since inception.
NAV as on Mar 31, 2017 ` 12.3086
HDFC FMP 1113D OCTOBER 2014 (1) Date Period Scheme
Returns (%)
Benchmark Returns
(%)#
Additional Benchmark
Returns (%) ##
Value of ` 10,000 invested
Scheme (`)
Benchmark (`)#
Additional Benchmark
(`)##Mar 31, 16 Last 1 Year 8.54 11.09 7.15 10,854 11,109 10,715Oct 22, 14 Since Inception 8.88 10.65 7.73 12,309 12,801 11,993
Past performance may or may not be sustained in the future. Returns are compounded annualized (CAGR). # CRISIL Composite Bond Fund Index ## CRISIL 1 year T-Bill Index. The Scheme is in existence for more than 1 year but less than 3 years. The scheme is managed by Mr. Anil Bamboli since inception.
NAV as on Mar 31, 2017 ` 12.2083
HDFC FMP 1107D OCTOBER 2014 (1) Date Period Scheme
Returns (%)
Benchmark Returns
(%)#
Additional Benchmark
Returns (%) ##
Value of ` 10,000 invested
Scheme (`)
Benchmark (`)#
Additional Benchmark
(`)##Mar 31, 16 Last 1 Year 8.57 11.09 7.15 10,857 11,109 10,715nov 11, 14 Since Inception 8.72 10.22 7.69 12,208 12,615 11,934
Past performance may or may not be sustained in the future. Returns are compounded annualized (CAGR). # CRISIL Composite Bond Fund Index ## CRISIL 1 year T-Bill Index. The Scheme is in existence for more than 1 year but less than 3 years. The scheme is managed by Mr. Anil Bamboli since inception.
NAV as on Mar 31, 2017 ` 12.1475
HDFC FMP 1113D NOVEMBER 2014 (1) Date Period Scheme
Returns (%)
Benchmark Returns
(%)#
Additional Benchmark
Returns (%) ##
Value of ` 10,000 invested
Scheme (`)
Benchmark (`)#
Additional Benchmark
(`)##Mar 31, 16 Last 1 Year 8.60 11.09 7.15 10,860 11,109 10,715nov 26, 14 Since Inception 8.65 10.16 7.67 12,148 12,548 11,893
Past performance may or may not be sustained in the future. Returns are compounded annualized (CAGR). # CRISIL Composite Bond Fund Index ## CRISIL 1 year T-Bill Index. The Scheme is in existence for more than 1 year but less than 3 years. The scheme is managed by Mr. Anil Bamboli since inception.
ANIL BAMBOLI....CONTINUED
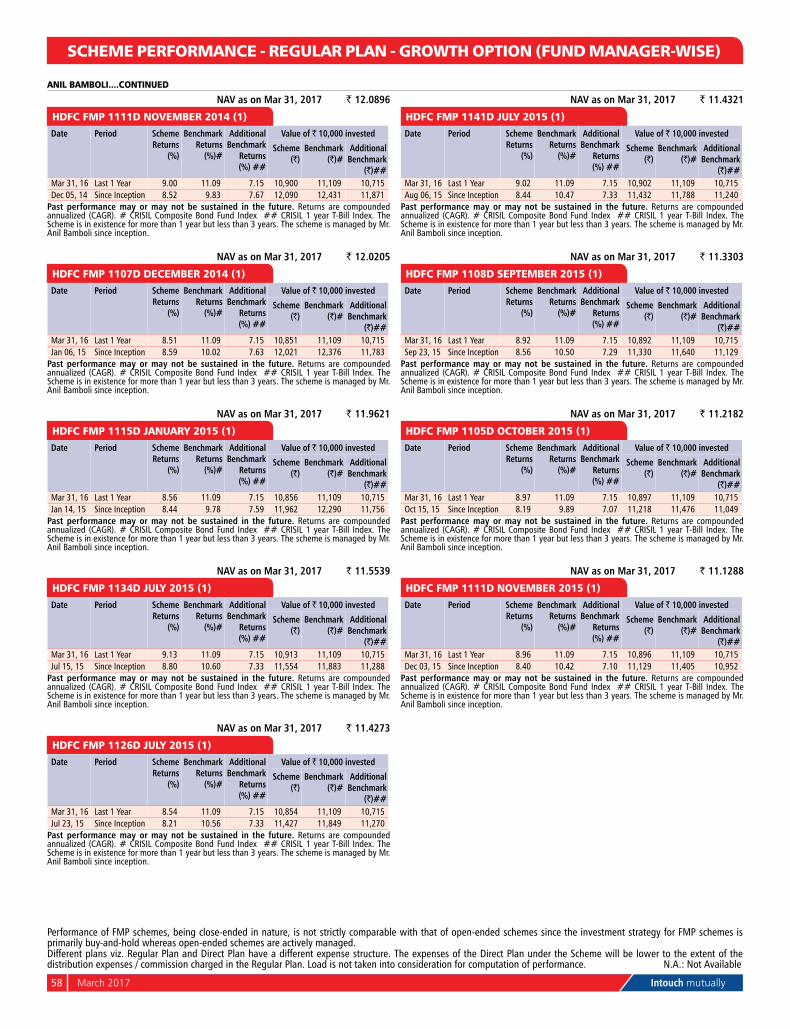
58 March 2017 Intouch mutually
SCHEME PERFORMANCE - REGULAR PLAN - GROWTH OPTION (FUND MANAGER-WISE)
Different plans viz. Regular Plan and Direct Plan have a different expense structure. The expenses of the Direct Plan under the Scheme will be lower to the extent of the distribution expenses / commission charged in the Regular Plan. Load is not taken into consideration for computation of performance. n.A.: not Available
Performance of FMP schemes, being close-ended in nature, is not strictly comparable with that of open-ended schemes since the investment strategy for FMP schemes is primarily buy-and-hold whereas open-ended schemes are actively managed.
NAV as on Mar 31, 2017 ` 12.0896
HDFC FMP 1111D NOVEMBER 2014 (1) Date Period Scheme
Returns (%)
Benchmark Returns
(%)#
Additional Benchmark
Returns (%) ##
Value of ` 10,000 invested
Scheme (`)
Benchmark (`)#
Additional Benchmark
(`)##Mar 31, 16 Last 1 Year 9.00 11.09 7.15 10,900 11,109 10,715Dec 05, 14 Since Inception 8.52 9.83 7.67 12,090 12,431 11,871
Past performance may or may not be sustained in the future. Returns are compounded annualized (CAGR). # CRISIL Composite Bond Fund Index ## CRISIL 1 year T-Bill Index. The Scheme is in existence for more than 1 year but less than 3 years. The scheme is managed by Mr. Anil Bamboli since inception.
NAV as on Mar 31, 2017 ` 12.0205
HDFC FMP 1107D DECEMBER 2014 (1) Date Period Scheme
Returns (%)
Benchmark Returns
(%)#
Additional Benchmark
Returns (%) ##
Value of ` 10,000 invested
Scheme (`)
Benchmark (`)#
Additional Benchmark
(`)##Mar 31, 16 Last 1 Year 8.51 11.09 7.15 10,851 11,109 10,715Jan 06, 15 Since Inception 8.59 10.02 7.63 12,021 12,376 11,783
Past performance may or may not be sustained in the future. Returns are compounded annualized (CAGR). # CRISIL Composite Bond Fund Index ## CRISIL 1 year T-Bill Index. The Scheme is in existence for more than 1 year but less than 3 years. The scheme is managed by Mr. Anil Bamboli since inception.
NAV as on Mar 31, 2017 ` 11.9621
HDFC FMP 1115D JANUARY 2015 (1) Date Period Scheme
Returns (%)
Benchmark Returns
(%)#
Additional Benchmark
Returns (%) ##
Value of ` 10,000 invested
Scheme (`)
Benchmark (`)#
Additional Benchmark
(`)##Mar 31, 16 Last 1 Year 8.56 11.09 7.15 10,856 11,109 10,715Jan 14, 15 Since Inception 8.44 9.78 7.59 11,962 12,290 11,756
Past performance may or may not be sustained in the future. Returns are compounded annualized (CAGR). # CRISIL Composite Bond Fund Index ## CRISIL 1 year T-Bill Index. The Scheme is in existence for more than 1 year but less than 3 years. The scheme is managed by Mr. Anil Bamboli since inception.
NAV as on Mar 31, 2017 ` 11.5539
HDFC FMP 1134D JULY 2015 (1) Date Period Scheme
Returns (%)
Benchmark Returns
(%)#
Additional Benchmark
Returns (%) ##
Value of ` 10,000 invested
Scheme (`)
Benchmark (`)#
Additional Benchmark
(`)##Mar 31, 16 Last 1 Year 9.13 11.09 7.15 10,913 11,109 10,715Jul 15, 15 Since Inception 8.80 10.60 7.33 11,554 11,883 11,288
Past performance may or may not be sustained in the future. Returns are compounded annualized (CAGR). # CRISIL Composite Bond Fund Index ## CRISIL 1 year T-Bill Index. The Scheme is in existence for more than 1 year but less than 3 years. The scheme is managed by Mr. Anil Bamboli since inception.
NAV as on Mar 31, 2017 ` 11.4273
HDFC FMP 1126D JULY 2015 (1) Date Period Scheme
Returns (%)
Benchmark Returns
(%)#
Additional Benchmark
Returns (%) ##
Value of ` 10,000 invested
Scheme (`)
Benchmark (`)#
Additional Benchmark
(`)##Mar 31, 16 Last 1 Year 8.54 11.09 7.15 10,854 11,109 10,715Jul 23, 15 Since Inception 8.21 10.56 7.33 11,427 11,849 11,270
Past performance may or may not be sustained in the future. Returns are compounded annualized (CAGR). # CRISIL Composite Bond Fund Index ## CRISIL 1 year T-Bill Index. The Scheme is in existence for more than 1 year but less than 3 years. The scheme is managed by Mr. Anil Bamboli since inception.
NAV as on Mar 31, 2017 ` 11.4321
HDFC FMP 1141D JULY 2015 (1) Date Period Scheme
Returns (%)
Benchmark Returns
(%)#
Additional Benchmark
Returns (%) ##
Value of ` 10,000 invested
Scheme (`)
Benchmark (`)#
Additional Benchmark
(`)##Mar 31, 16 Last 1 Year 9.02 11.09 7.15 10,902 11,109 10,715Aug 06, 15 Since Inception 8.44 10.47 7.33 11,432 11,788 11,240
Past performance may or may not be sustained in the future. Returns are compounded annualized (CAGR). # CRISIL Composite Bond Fund Index ## CRISIL 1 year T-Bill Index. The Scheme is in existence for more than 1 year but less than 3 years. The scheme is managed by Mr. Anil Bamboli since inception.
NAV as on Mar 31, 2017 ` 11.3303
HDFC FMP 1108D SEPTEMBER 2015 (1) Date Period Scheme
Returns (%)
Benchmark Returns
(%)#
Additional Benchmark
Returns (%) ##
Value of ` 10,000 invested
Scheme (`)
Benchmark (`)#
Additional Benchmark
(`)##Mar 31, 16 Last 1 Year 8.92 11.09 7.15 10,892 11,109 10,715Sep 23, 15 Since Inception 8.56 10.50 7.29 11,330 11,640 11,129
Past performance may or may not be sustained in the future. Returns are compounded annualized (CAGR). # CRISIL Composite Bond Fund Index ## CRISIL 1 year T-Bill Index. The Scheme is in existence for more than 1 year but less than 3 years. The scheme is managed by Mr. Anil Bamboli since inception.
NAV as on Mar 31, 2017 ` 11.2182
HDFC FMP 1105D OCTOBER 2015 (1) Date Period Scheme
Returns (%)
Benchmark Returns
(%)#
Additional Benchmark
Returns (%) ##
Value of ` 10,000 invested
Scheme (`)
Benchmark (`)#
Additional Benchmark
(`)##Mar 31, 16 Last 1 Year 8.97 11.09 7.15 10,897 11,109 10,715Oct 15, 15 Since Inception 8.19 9.89 7.07 11,218 11,476 11,049
Past performance may or may not be sustained in the future. Returns are compounded annualized (CAGR). # CRISIL Composite Bond Fund Index ## CRISIL 1 year T-Bill Index. The Scheme is in existence for more than 1 year but less than 3 years. The scheme is managed by Mr. Anil Bamboli since inception.
NAV as on Mar 31, 2017 ` 11.1288
HDFC FMP 1111D NOVEMBER 2015 (1) Date Period Scheme
Returns (%)
Benchmark Returns
(%)#
Additional Benchmark
Returns (%) ##
Value of ` 10,000 invested
Scheme (`)
Benchmark (`)#
Additional Benchmark
(`)##Mar 31, 16 Last 1 Year 8.96 11.09 7.15 10,896 11,109 10,715Dec 03, 15 Since Inception 8.40 10.42 7.10 11,129 11,405 10,952
Past performance may or may not be sustained in the future. Returns are compounded annualized (CAGR). # CRISIL Composite Bond Fund Index ## CRISIL 1 year T-Bill Index. The Scheme is in existence for more than 1 year but less than 3 years. The scheme is managed by Mr. Anil Bamboli since inception.
ANIL BAMBOLI....CONTINUED
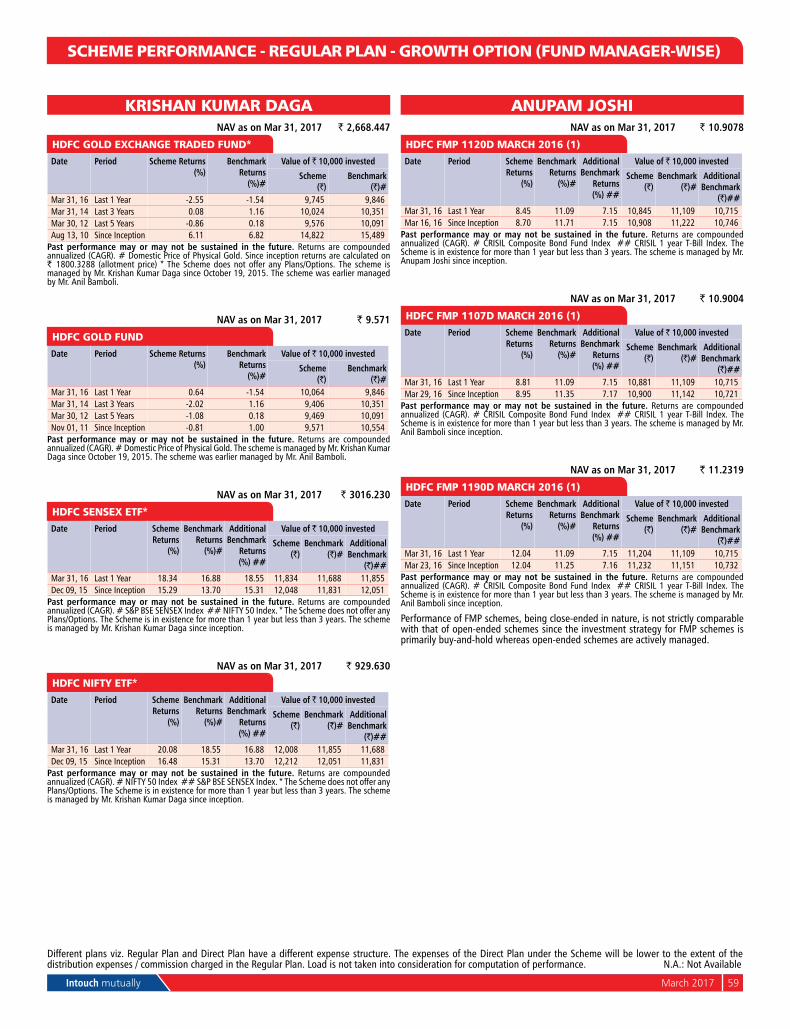
Intouch mutually March 2017 59
SCHEME PERFORMANCE - REGULAR PLAN - GROWTH OPTION (FUND MANAGER-WISE)
Different plans viz. Regular Plan and Direct Plan have a different expense structure. The expenses of the Direct Plan under the Scheme will be lower to the extent of the distribution expenses / commission charged in the Regular Plan. Load is not taken into consideration for computation of performance. n.A.: not Available
KRISHAN KUMAR DAGA NAV as on Mar 31, 2017 ` 2,668.447
HDFC GOLD EXCHANGE TRADED FUND* Date Period Scheme Returns
(%)Benchmark
Returns (%)#
Value of ` 10,000 invested
Scheme (`)
Benchmark (`)#
Mar 31, 16 Last 1 Year -2.55 -1.54 9,745 9,846Mar 31, 14 Last 3 Years 0.08 1.16 10,024 10,351Mar 30, 12 Last 5 Years -0.86 0.18 9,576 10,091Aug 13, 10 Since Inception 6.11 6.82 14,822 15,489
Past performance may or may not be sustained in the future. Returns are compounded annualized (CAGR). # Domestic Price of Physical Gold. Since inception returns are calculated on ` 1800.3288 (allotment price) * The Scheme does not offer any Plans/Options. The scheme is managed by Mr. Krishan Kumar Daga since October 19, 2015. The scheme was earlier managed by Mr. Anil Bamboli.
NAV as on Mar 31, 2017 ` 9.571
HDFC GOLD FUND Date Period Scheme Returns
(%)Benchmark
Returns (%)#
Value of ` 10,000 invested
Scheme (`)
Benchmark (`)#
Mar 31, 16 Last 1 Year 0.64 -1.54 10,064 9,846Mar 31, 14 Last 3 Years -2.02 1.16 9,406 10,351Mar 30, 12 Last 5 Years -1.08 0.18 9,469 10,091nov 01, 11 Since Inception -0.81 1.00 9,571 10,554
Past performance may or may not be sustained in the future. Returns are compounded annualized (CAGR). # Domestic Price of Physical Gold. The scheme is managed by Mr. Krishan Kumar Daga since October 19, 2015. The scheme was earlier managed by Mr. Anil Bamboli.
NAV as on Mar 31, 2017 ` 3016.230
HDFC SENSEX ETF* Date Period Scheme
Returns (%)
Benchmark Returns
(%)#
Additional Benchmark
Returns (%) ##
Value of ` 10,000 invested
Scheme (`)
Benchmark (`)#
Additional Benchmark
(`)##Mar 31, 16 Last 1 Year 18.34 16.88 18.55 11,834 11,688 11,855Dec 09, 15 Since Inception 15.29 13.70 15.31 12,048 11,831 12,051
Past performance may or may not be sustained in the future. Returns are compounded annualized (CAGR). # S&P BSE SEnSEx Index ## nIFTY 50 Index. * The Scheme does not offer any Plans/Options. The Scheme is in existence for more than 1 year but less than 3 years. The scheme is managed by Mr. Krishan Kumar Daga since inception.
NAV as on Mar 31, 2017 ` 929.630
HDFC NIFTY ETF* Date Period Scheme
Returns (%)
Benchmark Returns
(%)#
Additional Benchmark
Returns (%) ##
Value of ` 10,000 invested
Scheme (`)
Benchmark (`)#
Additional Benchmark
(`)##Mar 31, 16 Last 1 Year 20.08 18.55 16.88 12,008 11,855 11,688Dec 09, 15 Since Inception 16.48 15.31 13.70 12,212 12,051 11,831
Past performance may or may not be sustained in the future. Returns are compounded annualized (CAGR). # nIFTY 50 Index ## S&P BSE SEnSEx Index. * The Scheme does not offer any Plans/Options. The Scheme is in existence for more than 1 year but less than 3 years. The scheme is managed by Mr. Krishan Kumar Daga since inception.
ANUPAM JOSHI NAV as on Mar 31, 2017 ` 10.9078
HDFC FMP 1120D MARCH 2016 (1) Date Period Scheme
Returns (%)
Benchmark Returns
(%)#
Additional Benchmark
Returns (%) ##
Value of ` 10,000 invested
Scheme (`)
Benchmark (`)#
Additional Benchmark
(`)##Mar 31, 16 Last 1 Year 8.45 11.09 7.15 10,845 11,109 10,715Mar 16, 16 Since Inception 8.70 11.71 7.15 10,908 11,222 10,746
Past performance may or may not be sustained in the future. Returns are compounded annualized (CAGR). # CRISIL Composite Bond Fund Index ## CRISIL 1 year T-Bill Index. The Scheme is in existence for more than 1 year but less than 3 years. The scheme is managed by Mr. Anupam Joshi since inception.
NAV as on Mar 31, 2017 ` 10.9004
HDFC FMP 1107D MARCH 2016 (1) Date Period Scheme
Returns (%)
Benchmark Returns
(%)#
Additional Benchmark
Returns (%) ##
Value of ` 10,000 invested
Scheme (`)
Benchmark (`)#
Additional Benchmark
(`)##Mar 31, 16 Last 1 Year 8.81 11.09 7.15 10,881 11,109 10,715Mar 29, 16 Since Inception 8.95 11.35 7.17 10,900 11,142 10,721
Past performance may or may not be sustained in the future. Returns are compounded annualized (CAGR). # CRISIL Composite Bond Fund Index ## CRISIL 1 year T-Bill Index. The Scheme is in existence for more than 1 year but less than 3 years. The scheme is managed by Mr. Anil Bamboli since inception.
NAV as on Mar 31, 2017 ` 11.2319
HDFC FMP 1190D MARCH 2016 (1) Date Period Scheme
Returns (%)
Benchmark Returns
(%)#
Additional Benchmark
Returns (%) ##
Value of ` 10,000 invested
Scheme (`)
Benchmark (`)#
Additional Benchmark
(`)##Mar 31, 16 Last 1 Year 12.04 11.09 7.15 11,204 11,109 10,715Mar 23, 16 Since Inception 12.04 11.25 7.16 11,232 11,151 10,732
Past performance may or may not be sustained in the future. Returns are compounded annualized (CAGR). # CRISIL Composite Bond Fund Index ## CRISIL 1 year T-Bill Index. The Scheme is in existence for more than 1 year but less than 3 years. The scheme is managed by Mr. Anil Bamboli since inception.
Performance of FMP schemes, being close-ended in nature, is not strictly comparable with that of open-ended schemes since the investment strategy for FMP schemes is primarily buy-and-hold whereas open-ended schemes are actively managed.
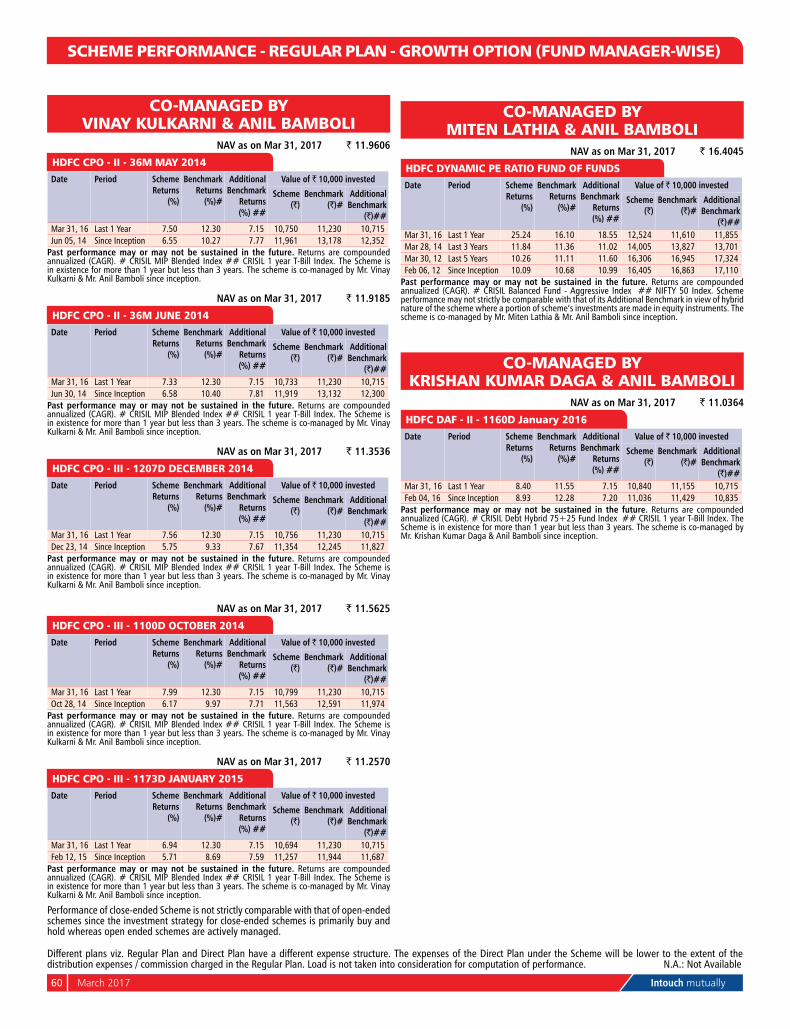
60 March 2017 Intouch mutually
SCHEME PERFORMANCE - REGULAR PLAN - GROWTH OPTION (FUND MANAGER-WISE)
Different plans viz. Regular Plan and Direct Plan have a different expense structure. The expenses of the Direct Plan under the Scheme will be lower to the extent of the distribution expenses / commission charged in the Regular Plan. Load is not taken into consideration for computation of performance. n.A.: not Available
CO-MANAGED BY VINAY KULKARNI & ANIL BAMBOLI
NAV as on Mar 31, 2017 ` 11.9606
HDFC CPO - II - 36M MAY 2014 Date Period Scheme
Returns (%)
Benchmark Returns
(%)#
Additional Benchmark
Returns (%) ##
Value of ` 10,000 invested
Scheme (`)
Benchmark (`)#
Additional Benchmark
(`)##Mar 31, 16 Last 1 Year 7.50 12.30 7.15 10,750 11,230 10,715Jun 05, 14 Since Inception 6.55 10.27 7.77 11,961 13,178 12,352
Past performance may or may not be sustained in the future. Returns are compounded annualized (CAGR). # CRISIL MIP Blended Index ## CRISIL 1 year T-Bill Index. The Scheme is in existence for more than 1 year but less than 3 years. The scheme is co-managed by Mr. Vinay Kulkarni & Mr. Anil Bamboli since inception.
NAV as on Mar 31, 2017 ` 11.9185
HDFC CPO - II - 36M JUNE 2014 Date Period Scheme
Returns (%)
Benchmark Returns
(%)#
Additional Benchmark
Returns (%) ##
Value of ` 10,000 invested
Scheme (`)
Benchmark (`)#
Additional Benchmark
(`)##Mar 31, 16 Last 1 Year 7.33 12.30 7.15 10,733 11,230 10,715Jun 30, 14 Since Inception 6.58 10.40 7.81 11,919 13,132 12,300
Past performance may or may not be sustained in the future. Returns are compounded annualized (CAGR). # CRISIL MIP Blended Index ## CRISIL 1 year T-Bill Index. The Scheme is in existence for more than 1 year but less than 3 years. The scheme is co-managed by Mr. Vinay Kulkarni & Mr. Anil Bamboli since inception.
NAV as on Mar 31, 2017 ` 11.3536
HDFC CPO - III - 1207D DECEMBER 2014 Date Period Scheme
Returns (%)
Benchmark Returns
(%)#
Additional Benchmark
Returns (%) ##
Value of ` 10,000 invested
Scheme (`)
Benchmark (`)#
Additional Benchmark
(`)##Mar 31, 16 Last 1 Year 7.56 12.30 7.15 10,756 11,230 10,715Dec 23, 14 Since Inception 5.75 9.33 7.67 11,354 12,245 11,827
Past performance may or may not be sustained in the future. Returns are compounded annualized (CAGR). # CRISIL MIP Blended Index ## CRISIL 1 year T-Bill Index. The Scheme is in existence for more than 1 year but less than 3 years. The scheme is co-managed by Mr. Vinay Kulkarni & Mr. Anil Bamboli since inception.
NAV as on Mar 31, 2017 ` 11.5625
HDFC CPO - III - 1100D OCTOBER 2014 Date Period Scheme
Returns (%)
Benchmark Returns
(%)#
Additional Benchmark
Returns (%) ##
Value of ` 10,000 invested
Scheme (`)
Benchmark (`)#
Additional Benchmark
(`)##Mar 31, 16 Last 1 Year 7.99 12.30 7.15 10,799 11,230 10,715Oct 28, 14 Since Inception 6.17 9.97 7.71 11,563 12,591 11,974
Past performance may or may not be sustained in the future. Returns are compounded annualized (CAGR). # CRISIL MIP Blended Index ## CRISIL 1 year T-Bill Index. The Scheme is in existence for more than 1 year but less than 3 years. The scheme is co-managed by Mr. Vinay Kulkarni & Mr. Anil Bamboli since inception.
NAV as on Mar 31, 2017 ` 11.2570
HDFC CPO - III - 1173D JANUARY 2015 Date Period Scheme
Returns (%)
Benchmark Returns
(%)#
Additional Benchmark
Returns (%) ##
Value of ` 10,000 invested
Scheme (`)
Benchmark (`)#
Additional Benchmark
(`)##Mar 31, 16 Last 1 Year 6.94 12.30 7.15 10,694 11,230 10,715Feb 12, 15 Since Inception 5.71 8.69 7.59 11,257 11,944 11,687
Past performance may or may not be sustained in the future. Returns are compounded annualized (CAGR). # CRISIL MIP Blended Index ## CRISIL 1 year T-Bill Index. The Scheme is in existence for more than 1 year but less than 3 years. The scheme is co-managed by Mr. Vinay Kulkarni & Mr. Anil Bamboli since inception.
Performance of close-ended Scheme is not strictly comparable with that of open-ended schemes since the investment strategy for close-ended schemes is primarily buy and hold whereas open ended schemes are actively managed.
CO-MANAGED BY MITEN LATHIA & ANIL BAMBOLI
NAV as on Mar 31, 2017 ` 16.4045
HDFC DYNAMIC PE RATIO FUND OF FUNDS Date Period Scheme
Returns (%)
Benchmark Returns
(%)#
Additional Benchmark
Returns (%) ##
Value of ` 10,000 invested
Scheme (`)
Benchmark (`)#
Additional Benchmark
(`)##Mar 31, 16 Last 1 Year 25.24 16.10 18.55 12,524 11,610 11,855Mar 28, 14 Last 3 Years 11.84 11.36 11.02 14,005 13,827 13,701Mar 30, 12 Last 5 Years 10.26 11.11 11.60 16,306 16,945 17,324Feb 06, 12 Since Inception 10.09 10.68 10.99 16,405 16,863 17,110
Past performance may or may not be sustained in the future. Returns are compounded annualized (CAGR). # CRISIL Balanced Fund - Aggressive Index ## nIFTY 50 Index. Scheme performance may not strictly be comparable with that of its Additional Benchmark in view of hybrid nature of the scheme where a portion of scheme’s investments are made in equity instruments. The scheme is co-managed by Mr. Miten Lathia & Mr. Anil Bamboli since inception.
CO-MANAGED BYKRISHAN KUMAR DAGA & ANIL BAMBOLI
NAV as on Mar 31, 2017 ` 11.0364
HDFC DAF - II - 1160D January 2016 Date Period Scheme
Returns (%)
Benchmark Returns
(%)#
Additional Benchmark
Returns (%) ##
Value of ` 10,000 invested
Scheme (`)
Benchmark (`)#
Additional Benchmark
(`)##Mar 31, 16 Last 1 Year 8.40 11.55 7.15 10,840 11,155 10,715Feb 04, 16 Since Inception 8.93 12.28 7.20 11,036 11,429 10,835
Past performance may or may not be sustained in the future. Returns are compounded annualized (CAGR). # CRISIL Debt Hybrid 75+25 Fund Index ## CRISIL 1 year T-Bill Index. The Scheme is in existence for more than 1 year but less than 3 years. The scheme is co-managed by Mr. Krishan Kumar Daga & Anil Bamboli since inception.
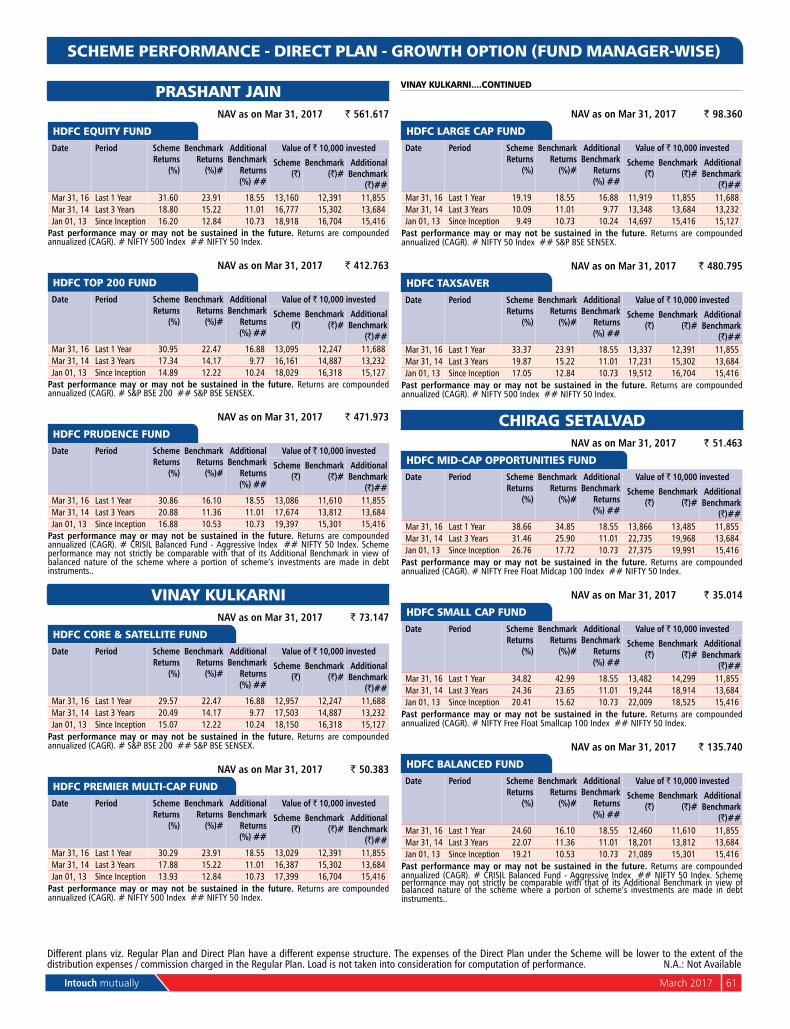
Intouch mutually March 2017 61
Different plans viz. Regular Plan and Direct Plan have a different expense structure. The expenses of the Direct Plan under the Scheme will be lower to the extent of the distribution expenses / commission charged in the Regular Plan. Load is not taken into consideration for computation of performance. n.A.: not Available
SCHEME PERFORMANCE - DIRECT PLAN - GROWTH OPTION (FUND MANAGER-WISE)
PRASHANT JAIN NAV as on Mar 31, 2017 ` 561.617
HDFC EQUITY FUND Date Period Scheme
Returns (%)
Benchmark Returns
(%)#
Additional Benchmark
Returns (%) ##
Value of ` 10,000 invested
Scheme (`)
Benchmark (`)#
Additional Benchmark
(`)##Mar 31, 16 Last 1 Year 31.60 23.91 18.55 13,160 12,391 11,855Mar 31, 14 Last 3 Years 18.80 15.22 11.01 16,777 15,302 13,684Jan 01, 13 Since Inception 16.20 12.84 10.73 18,918 16,704 15,416
Past performance may or may not be sustained in the future. Returns are compounded annualized (CAGR). # nIFTY 500 Index ## nIFTY 50 Index.
NAV as on Mar 31, 2017 ` 412.763
HDFC TOP 200 FUND Date Period Scheme
Returns (%)
Benchmark Returns
(%)#
Additional Benchmark
Returns (%) ##
Value of ` 10,000 invested
Scheme (`)
Benchmark (`)#
Additional Benchmark
(`)##Mar 31, 16 Last 1 Year 30.95 22.47 16.88 13,095 12,247 11,688Mar 31, 14 Last 3 Years 17.34 14.17 9.77 16,161 14,887 13,232Jan 01, 13 Since Inception 14.89 12.22 10.24 18,029 16,318 15,127
Past performance may or may not be sustained in the future. Returns are compounded annualized (CAGR). # S&P BSE 200 ## S&P BSE SEnSEx.
NAV as on Mar 31, 2017 ` 471.973
HDFC PRUDENCE FUND Date Period Scheme
Returns (%)
Benchmark Returns
(%)#
Additional Benchmark
Returns (%) ##
Value of ` 10,000 invested
Scheme (`)
Benchmark (`)#
Additional Benchmark
(`)##Mar 31, 16 Last 1 Year 30.86 16.10 18.55 13,086 11,610 11,855Mar 31, 14 Last 3 Years 20.88 11.36 11.01 17,674 13,812 13,684Jan 01, 13 Since Inception 16.88 10.53 10.73 19,397 15,301 15,416
Past performance may or may not be sustained in the future. Returns are compounded annualized (CAGR). # CRISIL Balanced Fund - Aggressive Index ## nIFTY 50 Index. Scheme performance may not strictly be comparable with that of its Additional Benchmark in view of balanced nature of the scheme where a portion of scheme’s investments are made in debt instruments..
VINAY KULKARNI NAV as on Mar 31, 2017 ` 73.147
HDFC CORE & SATELLITE FUND Date Period Scheme
Returns (%)
Benchmark Returns
(%)#
Additional Benchmark
Returns (%) ##
Value of ` 10,000 invested
Scheme (`)
Benchmark (`)#
Additional Benchmark
(`)##Mar 31, 16 Last 1 Year 29.57 22.47 16.88 12,957 12,247 11,688Mar 31, 14 Last 3 Years 20.49 14.17 9.77 17,503 14,887 13,232Jan 01, 13 Since Inception 15.07 12.22 10.24 18,150 16,318 15,127
Past performance may or may not be sustained in the future. Returns are compounded annualized (CAGR). # S&P BSE 200 ## S&P BSE SEnSEx.
NAV as on Mar 31, 2017 ` 50.383
HDFC PREMIER MULTI-CAP FUND Date Period Scheme
Returns (%)
Benchmark Returns
(%)#
Additional Benchmark
Returns (%) ##
Value of ` 10,000 invested
Scheme (`)
Benchmark (`)#
Additional Benchmark
(`)##Mar 31, 16 Last 1 Year 30.29 23.91 18.55 13,029 12,391 11,855Mar 31, 14 Last 3 Years 17.88 15.22 11.01 16,387 15,302 13,684Jan 01, 13 Since Inception 13.93 12.84 10.73 17,399 16,704 15,416
Past performance may or may not be sustained in the future. Returns are compounded annualized (CAGR). # nIFTY 500 Index ## nIFTY 50 Index.
NAV as on Mar 31, 2017 ` 98.360
HDFC LARGE CAP FUND Date Period Scheme
Returns (%)
Benchmark Returns
(%)#
Additional Benchmark
Returns (%) ##
Value of ` 10,000 invested
Scheme (`)
Benchmark (`)#
Additional Benchmark
(`)##Mar 31, 16 Last 1 Year 19.19 18.55 16.88 11,919 11,855 11,688Mar 31, 14 Last 3 Years 10.09 11.01 9.77 13,348 13,684 13,232Jan 01, 13 Since Inception 9.49 10.73 10.24 14,697 15,416 15,127
Past performance may or may not be sustained in the future. Returns are compounded annualized (CAGR). # nIFTY 50 Index ## S&P BSE SEnSEx.
NAV as on Mar 31, 2017 ` 480.795
HDFC TAXSAVER Date Period Scheme
Returns (%)
Benchmark Returns
(%)#
Additional Benchmark
Returns (%) ##
Value of ` 10,000 invested
Scheme (`)
Benchmark (`)#
Additional Benchmark
(`)##Mar 31, 16 Last 1 Year 33.37 23.91 18.55 13,337 12,391 11,855Mar 31, 14 Last 3 Years 19.87 15.22 11.01 17,231 15,302 13,684Jan 01, 13 Since Inception 17.05 12.84 10.73 19,512 16,704 15,416
Past performance may or may not be sustained in the future. Returns are compounded annualized (CAGR). # nIFTY 500 Index ## nIFTY 50 Index.
CHIRAG SETALVAD NAV as on Mar 31, 2017 ` 51.463
HDFC MID-CAP OPPORTUNITIES FUND Date Period Scheme
Returns (%)
Benchmark Returns
(%)#
Additional Benchmark
Returns (%) ##
Value of ` 10,000 invested
Scheme (`)
Benchmark (`)#
Additional Benchmark
(`)##Mar 31, 16 Last 1 Year 38.66 34.85 18.55 13,866 13,485 11,855Mar 31, 14 Last 3 Years 31.46 25.90 11.01 22,735 19,968 13,684Jan 01, 13 Since Inception 26.76 17.72 10.73 27,375 19,991 15,416
Past performance may or may not be sustained in the future. Returns are compounded annualized (CAGR). # nIFTY Free Float Midcap 100 Index ## nIFTY 50 Index.
NAV as on Mar 31, 2017 ` 35.014
HDFC SMALL CAP FUND Date Period Scheme
Returns (%)
Benchmark Returns
(%)#
Additional Benchmark
Returns (%) ##
Value of ` 10,000 invested
Scheme (`)
Benchmark (`)#
Additional Benchmark
(`)##Mar 31, 16 Last 1 Year 34.82 42.99 18.55 13,482 14,299 11,855Mar 31, 14 Last 3 Years 24.36 23.65 11.01 19,244 18,914 13,684Jan 01, 13 Since Inception 20.41 15.62 10.73 22,009 18,525 15,416
Past performance may or may not be sustained in the future. Returns are compounded annualized (CAGR). # nIFTY Free Float Smallcap 100 Index ## nIFTY 50 Index.
NAV as on Mar 31, 2017 ` 135.740
HDFC BALANCED FUND Date Period Scheme
Returns (%)
Benchmark Returns
(%)#
Additional Benchmark
Returns (%) ##
Value of ` 10,000 invested
Scheme (`)
Benchmark (`)#
Additional Benchmark
(`)##Mar 31, 16 Last 1 Year 24.60 16.10 18.55 12,460 11,610 11,855Mar 31, 14 Last 3 Years 22.07 11.36 11.01 18,201 13,812 13,684Jan 01, 13 Since Inception 19.21 10.53 10.73 21,089 15,301 15,416
Past performance may or may not be sustained in the future. Returns are compounded annualized (CAGR). # CRISIL Balanced Fund - Aggressive Index ## nIFTY 50 Index. Scheme performance may not strictly be comparable with that of its Additional Benchmark in view of balanced nature of the scheme where a portion of scheme’s investments are made in debt instruments..
VINAY KULKARNI....CONTINUED
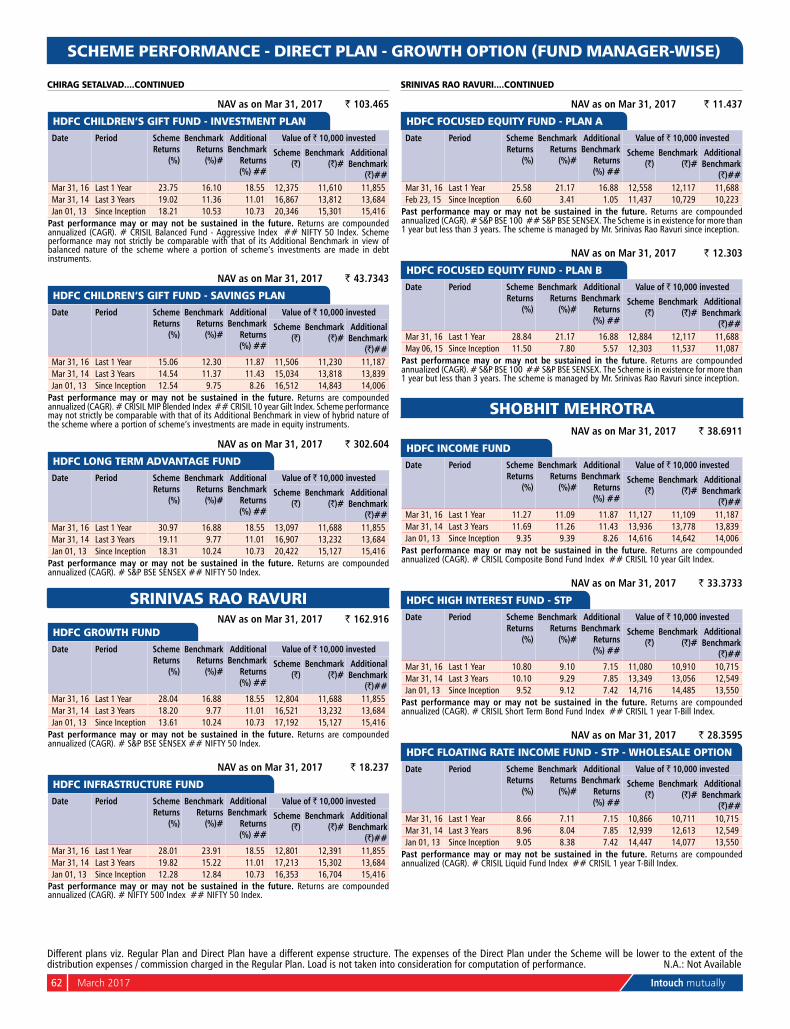
62 March 2017 Intouch mutually
SCHEME PERFORMANCE - DIRECT PLAN - GROWTH OPTION (FUND MANAGER-WISE)
NAV as on Mar 31, 2017 ` 103.465
HDFC CHILDREN’S GIFT FUND - INVESTMENT PLAN Date Period Scheme
Returns (%)
Benchmark Returns
(%)#
Additional Benchmark
Returns (%) ##
Value of ` 10,000 invested
Scheme (`)
Benchmark (`)#
Additional Benchmark
(`)##Mar 31, 16 Last 1 Year 23.75 16.10 18.55 12,375 11,610 11,855Mar 31, 14 Last 3 Years 19.02 11.36 11.01 16,867 13,812 13,684Jan 01, 13 Since Inception 18.21 10.53 10.73 20,346 15,301 15,416
Past performance may or may not be sustained in the future. Returns are compounded annualized (CAGR). # CRISIL Balanced Fund - Aggressive Index ## nIFTY 50 Index. Scheme performance may not strictly be comparable with that of its Additional Benchmark in view of balanced nature of the scheme where a portion of scheme’s investments are made in debt instruments.
NAV as on Mar 31, 2017 ` 43.7343
HDFC CHILDREN’S GIFT FUND - SAVINGS PLAN Date Period Scheme
Returns (%)
Benchmark Returns
(%)#
Additional Benchmark
Returns (%) ##
Value of ` 10,000 invested
Scheme (`)
Benchmark (`)#
Additional Benchmark
(`)##Mar 31, 16 Last 1 Year 15.06 12.30 11.87 11,506 11,230 11,187Mar 31, 14 Last 3 Years 14.54 11.37 11.43 15,034 13,818 13,839Jan 01, 13 Since Inception 12.54 9.75 8.26 16,512 14,843 14,006
Past performance may or may not be sustained in the future. Returns are compounded annualized (CAGR). # CRISIL MIP Blended Index ## CRISIL 10 year Gilt Index. Scheme performance may not strictly be comparable with that of its Additional Benchmark in view of hybrid nature of the scheme where a portion of scheme’s investments are made in equity instruments.
NAV as on Mar 31, 2017 ` 302.604
HDFC LONG TERM ADVANTAGE FUND Date Period Scheme
Returns (%)
Benchmark Returns
(%)#
Additional Benchmark
Returns (%) ##
Value of ` 10,000 invested
Scheme (`)
Benchmark (`)#
Additional Benchmark
(`)##Mar 31, 16 Last 1 Year 30.97 16.88 18.55 13,097 11,688 11,855Mar 31, 14 Last 3 Years 19.11 9.77 11.01 16,907 13,232 13,684Jan 01, 13 Since Inception 18.31 10.24 10.73 20,422 15,127 15,416
Past performance may or may not be sustained in the future. Returns are compounded annualized (CAGR). # S&P BSE SEnSEx ## nIFTY 50 Index.
SRINIVAS RAO RAVURI NAV as on Mar 31, 2017 ` 162.916HDFC GROWTH FUND Date Period Scheme
Returns (%)
Benchmark Returns
(%)#
Additional Benchmark
Returns (%) ##
Value of ` 10,000 invested
Scheme (`)
Benchmark (`)#
Additional Benchmark
(`)##Mar 31, 16 Last 1 Year 28.04 16.88 18.55 12,804 11,688 11,855Mar 31, 14 Last 3 Years 18.20 9.77 11.01 16,521 13,232 13,684Jan 01, 13 Since Inception 13.61 10.24 10.73 17,192 15,127 15,416
Past performance may or may not be sustained in the future. Returns are compounded annualized (CAGR). # S&P BSE SEnSEx ## nIFTY 50 Index.
NAV as on Mar 31, 2017 ` 18.237
HDFC INFRASTRUCTURE FUND Date Period Scheme
Returns (%)
Benchmark Returns
(%)#
Additional Benchmark
Returns (%) ##
Value of ` 10,000 invested
Scheme (`)
Benchmark (`)#
Additional Benchmark
(`)##Mar 31, 16 Last 1 Year 28.01 23.91 18.55 12,801 12,391 11,855Mar 31, 14 Last 3 Years 19.82 15.22 11.01 17,213 15,302 13,684Jan 01, 13 Since Inception 12.28 12.84 10.73 16,353 16,704 15,416
Past performance may or may not be sustained in the future. Returns are compounded annualized (CAGR). # nIFTY 500 Index ## nIFTY 50 Index.
NAV as on Mar 31, 2017 ` 11.437
HDFC FOCUSED EQUITY FUND - PLAN A Date Period Scheme
Returns (%)
Benchmark Returns
(%)#
Additional Benchmark
Returns (%) ##
Value of ` 10,000 invested
Scheme (`)
Benchmark (`)#
Additional Benchmark
(`)##Mar 31, 16 Last 1 Year 25.58 21.17 16.88 12,558 12,117 11,688Feb 23, 15 Since Inception 6.60 3.41 1.05 11,437 10,729 10,223
Past performance may or may not be sustained in the future. Returns are compounded annualized (CAGR). # S&P BSE 100 ## S&P BSE SEnSEx. The Scheme is in existence for more than 1 year but less than 3 years. The scheme is managed by Mr. Srinivas Rao Ravuri since inception.
NAV as on Mar 31, 2017 ` 12.303
HDFC FOCUSED EQUITY FUND - PLAN B Date Period Scheme
Returns (%)
Benchmark Returns
(%)#
Additional Benchmark
Returns (%) ##
Value of ` 10,000 invested
Scheme (`)
Benchmark (`)#
Additional Benchmark
(`)##Mar 31, 16 Last 1 Year 28.84 21.17 16.88 12,884 12,117 11,688May 06, 15 Since Inception 11.50 7.80 5.57 12,303 11,537 11,087
Past performance may or may not be sustained in the future. Returns are compounded annualized (CAGR). # S&P BSE 100 ## S&P BSE SEnSEx. The Scheme is in existence for more than 1 year but less than 3 years. The scheme is managed by Mr. Srinivas Rao Ravuri since inception.
SHOBHIT MEHROTRA NAV as on Mar 31, 2017 ` 38.6911
HDFC INCOME FUND Date Period Scheme
Returns (%)
Benchmark Returns
(%)#
Additional Benchmark
Returns (%) ##
Value of ` 10,000 invested
Scheme (`)
Benchmark (`)#
Additional Benchmark
(`)##Mar 31, 16 Last 1 Year 11.27 11.09 11.87 11,127 11,109 11,187Mar 31, 14 Last 3 Years 11.69 11.26 11.43 13,936 13,778 13,839Jan 01, 13 Since Inception 9.35 9.39 8.26 14,616 14,642 14,006
Past performance may or may not be sustained in the future. Returns are compounded annualized (CAGR). # CRISIL Composite Bond Fund Index ## CRISIL 10 year Gilt Index.
NAV as on Mar 31, 2017 ` 33.3733
HDFC HIGH INTEREST FUND - STP Date Period Scheme
Returns (%)
Benchmark Returns
(%)#
Additional Benchmark
Returns (%) ##
Value of ` 10,000 invested
Scheme (`)
Benchmark (`)#
Additional Benchmark
(`)##Mar 31, 16 Last 1 Year 10.80 9.10 7.15 11,080 10,910 10,715Mar 31, 14 Last 3 Years 10.10 9.29 7.85 13,349 13,056 12,549Jan 01, 13 Since Inception 9.52 9.12 7.42 14,716 14,485 13,550
Past performance may or may not be sustained in the future. Returns are compounded annualized (CAGR). # CRISIL Short Term Bond Fund Index ## CRISIL 1 year T-Bill Index.
NAV as on Mar 31, 2017 ` 28.3595
HDFC FLOATING RATE INCOME FUND - STP - WHOLESALE OPTION Date Period Scheme
Returns (%)
Benchmark Returns
(%)#
Additional Benchmark
Returns (%) ##
Value of ` 10,000 invested
Scheme (`)
Benchmark (`)#
Additional Benchmark
(`)##Mar 31, 16 Last 1 Year 8.66 7.11 7.15 10,866 10,711 10,715Mar 31, 14 Last 3 Years 8.96 8.04 7.85 12,939 12,613 12,549Jan 01, 13 Since Inception 9.05 8.38 7.42 14,447 14,077 13,550
Past performance may or may not be sustained in the future. Returns are compounded annualized (CAGR). # CRISIL Liquid Fund Index ## CRISIL 1 year T-Bill Index.
CHIRAG SETALVAD....CONTINUED SRINIVAS RAO RAVURI....CONTINUED
Different plans viz. Regular Plan and Direct Plan have a different expense structure. The expenses of the Direct Plan under the Scheme will be lower to the extent of the distribution expenses / commission charged in the Regular Plan. Load is not taken into consideration for computation of performance. n.A.: not Available
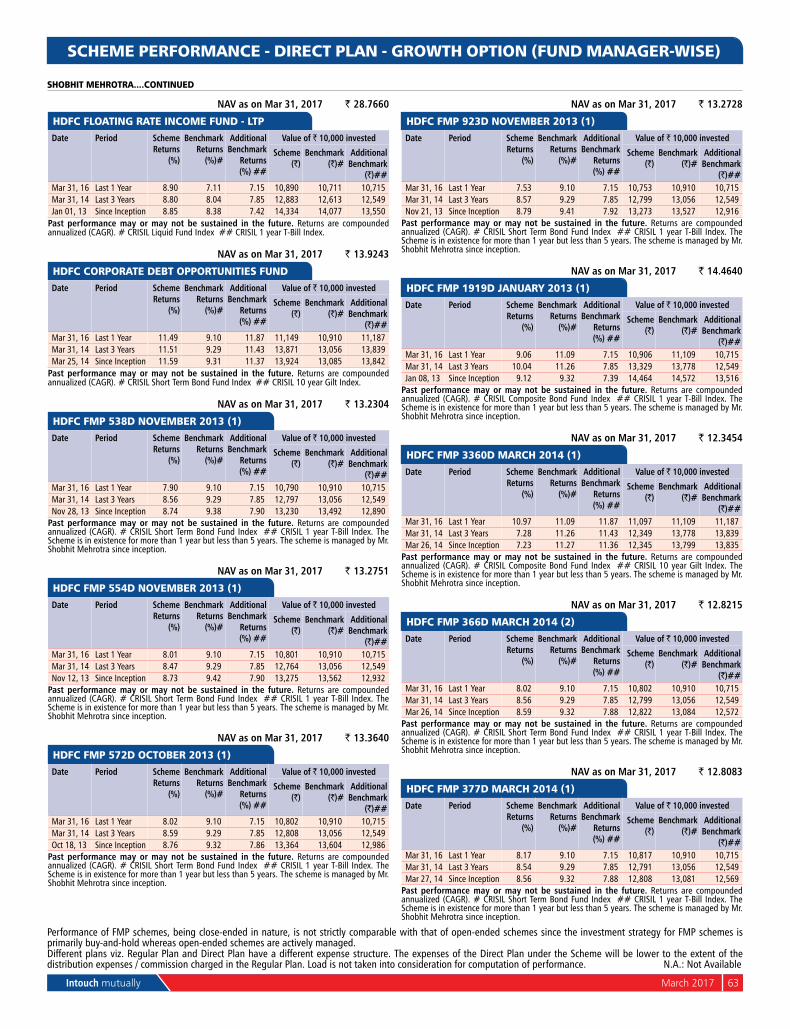
Intouch mutually March 2017 63
SCHEME PERFORMANCE - DIRECT PLAN - GROWTH OPTION (FUND MANAGER-WISE)
NAV as on Mar 31, 2017 ` 28.7660
HDFC FLOATING RATE INCOME FUND - LTP Date Period Scheme
Returns (%)
Benchmark Returns
(%)#
Additional Benchmark
Returns (%) ##
Value of ` 10,000 invested
Scheme (`)
Benchmark (`)#
Additional Benchmark
(`)##Mar 31, 16 Last 1 Year 8.90 7.11 7.15 10,890 10,711 10,715Mar 31, 14 Last 3 Years 8.80 8.04 7.85 12,883 12,613 12,549Jan 01, 13 Since Inception 8.85 8.38 7.42 14,334 14,077 13,550
Past performance may or may not be sustained in the future. Returns are compounded annualized (CAGR). # CRISIL Liquid Fund Index ## CRISIL 1 year T-Bill Index.
NAV as on Mar 31, 2017 ` 13.9243
HDFC CORPORATE DEBT OPPORTUNITIES FUND Date Period Scheme
Returns (%)
Benchmark Returns
(%)#
Additional Benchmark
Returns (%) ##
Value of ` 10,000 invested
Scheme (`)
Benchmark (`)#
Additional Benchmark
(`)##Mar 31, 16 Last 1 Year 11.49 9.10 11.87 11,149 10,910 11,187Mar 31, 14 Last 3 Years 11.51 9.29 11.43 13,871 13,056 13,839Mar 25, 14 Since Inception 11.59 9.31 11.37 13,924 13,085 13,842
Past performance may or may not be sustained in the future. Returns are compounded annualized (CAGR). # CRISIL Short Term Bond Fund Index ## CRISIL 10 year Gilt Index.
NAV as on Mar 31, 2017 ` 13.2304
HDFC FMP 538D NOVEMBER 2013 (1) Date Period Scheme
Returns (%)
Benchmark Returns
(%)#
Additional Benchmark
Returns (%) ##
Value of ` 10,000 invested
Scheme (`)
Benchmark (`)#
Additional Benchmark
(`)##Mar 31, 16 Last 1 Year 7.90 9.10 7.15 10,790 10,910 10,715Mar 31, 14 Last 3 Years 8.56 9.29 7.85 12,797 13,056 12,549nov 28, 13 Since Inception 8.74 9.38 7.90 13,230 13,492 12,890
Past performance may or may not be sustained in the future. Returns are compounded annualized (CAGR). # CRISIL Short Term Bond Fund Index ## CRISIL 1 year T-Bill Index. The Scheme is in existence for more than 1 year but less than 5 years. The scheme is managed by Mr. Shobhit Mehrotra since inception.
NAV as on Mar 31, 2017 ` 13.2751
HDFC FMP 554D NOVEMBER 2013 (1) Date Period Scheme
Returns (%)
Benchmark Returns
(%)#
Additional Benchmark
Returns (%) ##
Value of ` 10,000 invested
Scheme (`)
Benchmark (`)#
Additional Benchmark
(`)##Mar 31, 16 Last 1 Year 8.01 9.10 7.15 10,801 10,910 10,715Mar 31, 14 Last 3 Years 8.47 9.29 7.85 12,764 13,056 12,549nov 12, 13 Since Inception 8.73 9.42 7.90 13,275 13,562 12,932
Past performance may or may not be sustained in the future. Returns are compounded annualized (CAGR). # CRISIL Short Term Bond Fund Index ## CRISIL 1 year T-Bill Index. The Scheme is in existence for more than 1 year but less than 5 years. The scheme is managed by Mr. Shobhit Mehrotra since inception.
NAV as on Mar 31, 2017 ` 13.3640
HDFC FMP 572D OCTOBER 2013 (1) Date Period Scheme
Returns (%)
Benchmark Returns
(%)#
Additional Benchmark
Returns (%) ##
Value of ` 10,000 invested
Scheme (`)
Benchmark (`)#
Additional Benchmark
(`)##Mar 31, 16 Last 1 Year 8.02 9.10 7.15 10,802 10,910 10,715Mar 31, 14 Last 3 Years 8.59 9.29 7.85 12,808 13,056 12,549Oct 18, 13 Since Inception 8.76 9.32 7.86 13,364 13,604 12,986
Past performance may or may not be sustained in the future. Returns are compounded annualized (CAGR). # CRISIL Short Term Bond Fund Index ## CRISIL 1 year T-Bill Index. The Scheme is in existence for more than 1 year but less than 5 years. The scheme is managed by Mr. Shobhit Mehrotra since inception.
NAV as on Mar 31, 2017 ` 13.2728
HDFC FMP 923D NOVEMBER 2013 (1) Date Period Scheme
Returns (%)
Benchmark Returns
(%)#
Additional Benchmark
Returns (%) ##
Value of ` 10,000 invested
Scheme (`)
Benchmark (`)#
Additional Benchmark
(`)##Mar 31, 16 Last 1 Year 7.53 9.10 7.15 10,753 10,910 10,715Mar 31, 14 Last 3 Years 8.57 9.29 7.85 12,799 13,056 12,549nov 21, 13 Since Inception 8.79 9.41 7.92 13,273 13,527 12,916
Past performance may or may not be sustained in the future. Returns are compounded annualized (CAGR). # CRISIL Short Term Bond Fund Index ## CRISIL 1 year T-Bill Index. The Scheme is in existence for more than 1 year but less than 5 years. The scheme is managed by Mr. Shobhit Mehrotra since inception.
NAV as on Mar 31, 2017 ` 14.4640
HDFC FMP 1919D JANUARY 2013 (1) Date Period Scheme
Returns (%)
Benchmark Returns
(%)#
Additional Benchmark
Returns (%) ##
Value of ` 10,000 invested
Scheme (`)
Benchmark (`)#
Additional Benchmark
(`)##Mar 31, 16 Last 1 Year 9.06 11.09 7.15 10,906 11,109 10,715Mar 31, 14 Last 3 Years 10.04 11.26 7.85 13,329 13,778 12,549Jan 08, 13 Since Inception 9.12 9.32 7.39 14,464 14,572 13,516
Past performance may or may not be sustained in the future. Returns are compounded annualized (CAGR). # CRISIL Composite Bond Fund Index ## CRISIL 1 year T-Bill Index. The Scheme is in existence for more than 1 year but less than 5 years. The scheme is managed by Mr. Shobhit Mehrotra since inception.
NAV as on Mar 31, 2017 ` 12.3454
HDFC FMP 3360D MARCH 2014 (1) Date Period Scheme
Returns (%)
Benchmark Returns
(%)#
Additional Benchmark
Returns (%) ##
Value of ` 10,000 invested
Scheme (`)
Benchmark (`)#
Additional Benchmark
(`)##Mar 31, 16 Last 1 Year 10.97 11.09 11.87 11,097 11,109 11,187Mar 31, 14 Last 3 Years 7.28 11.26 11.43 12,349 13,778 13,839Mar 26, 14 Since Inception 7.23 11.27 11.36 12,345 13,799 13,835
Past performance may or may not be sustained in the future. Returns are compounded annualized (CAGR). # CRISIL Composite Bond Fund Index ## CRISIL 10 year Gilt Index. The Scheme is in existence for more than 1 year but less than 5 years. The scheme is managed by Mr. Shobhit Mehrotra since inception.
NAV as on Mar 31, 2017 ` 12.8215
HDFC FMP 366D MARCH 2014 (2) Date Period Scheme
Returns (%)
Benchmark Returns
(%)#
Additional Benchmark
Returns (%) ##
Value of ` 10,000 invested
Scheme (`)
Benchmark (`)#
Additional Benchmark
(`)##Mar 31, 16 Last 1 Year 8.02 9.10 7.15 10,802 10,910 10,715Mar 31, 14 Last 3 Years 8.56 9.29 7.85 12,799 13,056 12,549Mar 26, 14 Since Inception 8.59 9.32 7.88 12,822 13,084 12,572
Past performance may or may not be sustained in the future. Returns are compounded annualized (CAGR). # CRISIL Short Term Bond Fund Index ## CRISIL 1 year T-Bill Index. The Scheme is in existence for more than 1 year but less than 5 years. The scheme is managed by Mr. Shobhit Mehrotra since inception.
NAV as on Mar 31, 2017 ` 12.8083
HDFC FMP 377D MARCH 2014 (1) Date Period Scheme
Returns (%)
Benchmark Returns
(%)#
Additional Benchmark
Returns (%) ##
Value of ` 10,000 invested
Scheme (`)
Benchmark (`)#
Additional Benchmark
(`)##Mar 31, 16 Last 1 Year 8.17 9.10 7.15 10,817 10,910 10,715Mar 31, 14 Last 3 Years 8.54 9.29 7.85 12,791 13,056 12,549Mar 27, 14 Since Inception 8.56 9.32 7.88 12,808 13,081 12,569
Past performance may or may not be sustained in the future. Returns are compounded annualized (CAGR). # CRISIL Short Term Bond Fund Index ## CRISIL 1 year T-Bill Index. The Scheme is in existence for more than 1 year but less than 5 years. The scheme is managed by Mr. Shobhit Mehrotra since inception.
SHOBHIT MEHROTRA....CONTINUED
Different plans viz. Regular Plan and Direct Plan have a different expense structure. The expenses of the Direct Plan under the Scheme will be lower to the extent of the distribution expenses / commission charged in the Regular Plan. Load is not taken into consideration for computation of performance. n.A.: not Available
Performance of FMP schemes, being close-ended in nature, is not strictly comparable with that of open-ended schemes since the investment strategy for FMP schemes is primarily buy-and-hold whereas open-ended schemes are actively managed.
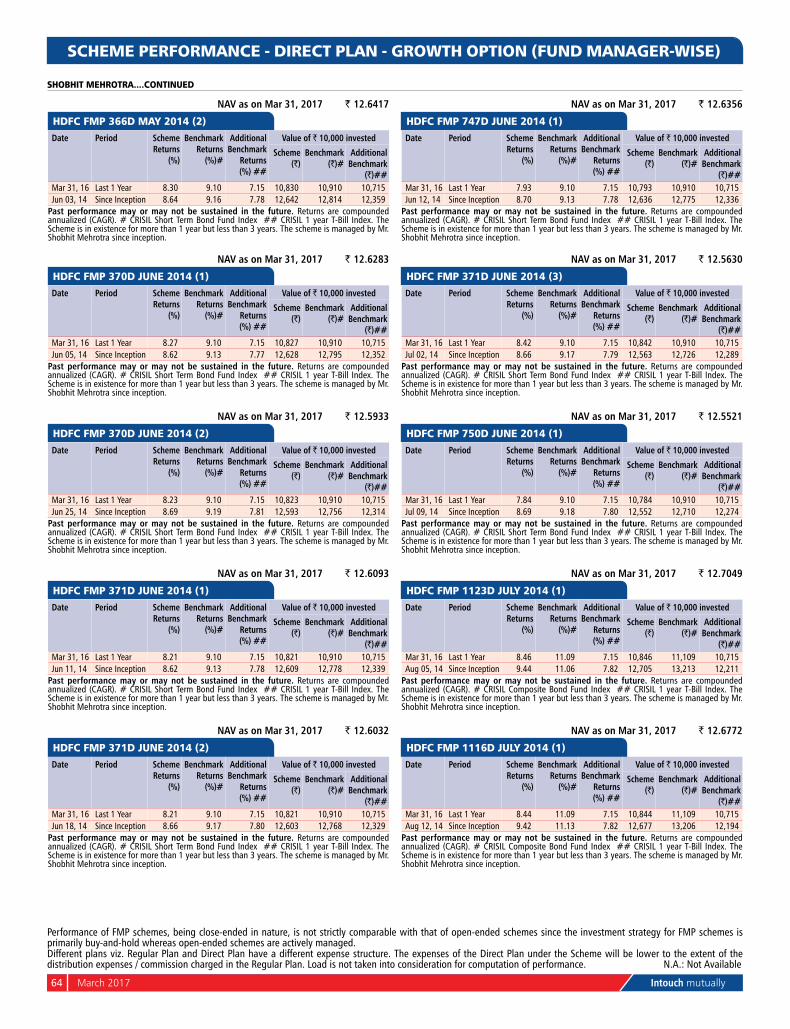
64 March 2017 Intouch mutually
SCHEME PERFORMANCE - DIRECT PLAN - GROWTH OPTION (FUND MANAGER-WISE)
NAV as on Mar 31, 2017 ` 12.6417
HDFC FMP 366D MAY 2014 (2) Date Period Scheme
Returns (%)
Benchmark Returns
(%)#
Additional Benchmark
Returns (%) ##
Value of ` 10,000 invested
Scheme (`)
Benchmark (`)#
Additional Benchmark
(`)##Mar 31, 16 Last 1 Year 8.30 9.10 7.15 10,830 10,910 10,715Jun 03, 14 Since Inception 8.64 9.16 7.78 12,642 12,814 12,359
Past performance may or may not be sustained in the future. Returns are compounded annualized (CAGR). # CRISIL Short Term Bond Fund Index ## CRISIL 1 year T-Bill Index. The Scheme is in existence for more than 1 year but less than 3 years. The scheme is managed by Mr. Shobhit Mehrotra since inception.
NAV as on Mar 31, 2017 ` 12.6283
HDFC FMP 370D JUNE 2014 (1) Date Period Scheme
Returns (%)
Benchmark Returns
(%)#
Additional Benchmark
Returns (%) ##
Value of ` 10,000 invested
Scheme (`)
Benchmark (`)#
Additional Benchmark
(`)##Mar 31, 16 Last 1 Year 8.27 9.10 7.15 10,827 10,910 10,715Jun 05, 14 Since Inception 8.62 9.13 7.77 12,628 12,795 12,352
Past performance may or may not be sustained in the future. Returns are compounded annualized (CAGR). # CRISIL Short Term Bond Fund Index ## CRISIL 1 year T-Bill Index. The Scheme is in existence for more than 1 year but less than 3 years. The scheme is managed by Mr. Shobhit Mehrotra since inception.
NAV as on Mar 31, 2017 ` 12.5933
HDFC FMP 370D JUNE 2014 (2) Date Period Scheme
Returns (%)
Benchmark Returns
(%)#
Additional Benchmark
Returns (%) ##
Value of ` 10,000 invested
Scheme (`)
Benchmark (`)#
Additional Benchmark
(`)##Mar 31, 16 Last 1 Year 8.23 9.10 7.15 10,823 10,910 10,715Jun 25, 14 Since Inception 8.69 9.19 7.81 12,593 12,756 12,314
Past performance may or may not be sustained in the future. Returns are compounded annualized (CAGR). # CRISIL Short Term Bond Fund Index ## CRISIL 1 year T-Bill Index. The Scheme is in existence for more than 1 year but less than 3 years. The scheme is managed by Mr. Shobhit Mehrotra since inception.
NAV as on Mar 31, 2017 ` 12.6093
HDFC FMP 371D JUNE 2014 (1) Date Period Scheme
Returns (%)
Benchmark Returns
(%)#
Additional Benchmark
Returns (%) ##
Value of ` 10,000 invested
Scheme (`)
Benchmark (`)#
Additional Benchmark
(`)##Mar 31, 16 Last 1 Year 8.21 9.10 7.15 10,821 10,910 10,715Jun 11, 14 Since Inception 8.62 9.13 7.78 12,609 12,778 12,339
Past performance may or may not be sustained in the future. Returns are compounded annualized (CAGR). # CRISIL Short Term Bond Fund Index ## CRISIL 1 year T-Bill Index. The Scheme is in existence for more than 1 year but less than 3 years. The scheme is managed by Mr. Shobhit Mehrotra since inception.
NAV as on Mar 31, 2017 ` 12.6032
HDFC FMP 371D JUNE 2014 (2) Date Period Scheme
Returns (%)
Benchmark Returns
(%)#
Additional Benchmark
Returns (%) ##
Value of ` 10,000 invested
Scheme (`)
Benchmark (`)#
Additional Benchmark
(`)##Mar 31, 16 Last 1 Year 8.21 9.10 7.15 10,821 10,910 10,715Jun 18, 14 Since Inception 8.66 9.17 7.80 12,603 12,768 12,329
Past performance may or may not be sustained in the future. Returns are compounded annualized (CAGR). # CRISIL Short Term Bond Fund Index ## CRISIL 1 year T-Bill Index. The Scheme is in existence for more than 1 year but less than 3 years. The scheme is managed by Mr. Shobhit Mehrotra since inception.
SHOBHIT MEHROTRA....CONTINUED
NAV as on Mar 31, 2017 ` 12.6356
HDFC FMP 747D JUNE 2014 (1) Date Period Scheme
Returns (%)
Benchmark Returns
(%)#
Additional Benchmark
Returns (%) ##
Value of ` 10,000 invested
Scheme (`)
Benchmark (`)#
Additional Benchmark
(`)##Mar 31, 16 Last 1 Year 7.93 9.10 7.15 10,793 10,910 10,715Jun 12, 14 Since Inception 8.70 9.13 7.78 12,636 12,775 12,336
Past performance may or may not be sustained in the future. Returns are compounded annualized (CAGR). # CRISIL Short Term Bond Fund Index ## CRISIL 1 year T-Bill Index. The Scheme is in existence for more than 1 year but less than 3 years. The scheme is managed by Mr. Shobhit Mehrotra since inception.
NAV as on Mar 31, 2017 ` 12.5630
HDFC FMP 371D JUNE 2014 (3) Date Period Scheme
Returns (%)
Benchmark Returns
(%)#
Additional Benchmark
Returns (%) ##
Value of ` 10,000 invested
Scheme (`)
Benchmark (`)#
Additional Benchmark
(`)##Mar 31, 16 Last 1 Year 8.42 9.10 7.15 10,842 10,910 10,715Jul 02, 14 Since Inception 8.66 9.17 7.79 12,563 12,726 12,289
Past performance may or may not be sustained in the future. Returns are compounded annualized (CAGR). # CRISIL Short Term Bond Fund Index ## CRISIL 1 year T-Bill Index. The Scheme is in existence for more than 1 year but less than 3 years. The scheme is managed by Mr. Shobhit Mehrotra since inception.
NAV as on Mar 31, 2017 ` 12.5521
HDFC FMP 750D JUNE 2014 (1) Date Period Scheme
Returns (%)
Benchmark Returns
(%)#
Additional Benchmark
Returns (%) ##
Value of ` 10,000 invested
Scheme (`)
Benchmark (`)#
Additional Benchmark
(`)##Mar 31, 16 Last 1 Year 7.84 9.10 7.15 10,784 10,910 10,715Jul 09, 14 Since Inception 8.69 9.18 7.80 12,552 12,710 12,274
Past performance may or may not be sustained in the future. Returns are compounded annualized (CAGR). # CRISIL Short Term Bond Fund Index ## CRISIL 1 year T-Bill Index. The Scheme is in existence for more than 1 year but less than 3 years. The scheme is managed by Mr. Shobhit Mehrotra since inception.
NAV as on Mar 31, 2017 ` 12.7049
HDFC FMP 1123D JULY 2014 (1) Date Period Scheme
Returns (%)
Benchmark Returns
(%)#
Additional Benchmark
Returns (%) ##
Value of ` 10,000 invested
Scheme (`)
Benchmark (`)#
Additional Benchmark
(`)##Mar 31, 16 Last 1 Year 8.46 11.09 7.15 10,846 11,109 10,715Aug 05, 14 Since Inception 9.44 11.06 7.82 12,705 13,213 12,211
Past performance may or may not be sustained in the future. Returns are compounded annualized (CAGR). # CRISIL Composite Bond Fund Index ## CRISIL 1 year T-Bill Index. The Scheme is in existence for more than 1 year but less than 3 years. The scheme is managed by Mr. Shobhit Mehrotra since inception.
NAV as on Mar 31, 2017 ` 12.6772
HDFC FMP 1116D JULY 2014 (1) Date Period Scheme
Returns (%)
Benchmark Returns
(%)#
Additional Benchmark
Returns (%) ##
Value of ` 10,000 invested
Scheme (`)
Benchmark (`)#
Additional Benchmark
(`)##Mar 31, 16 Last 1 Year 8.44 11.09 7.15 10,844 11,109 10,715Aug 12, 14 Since Inception 9.42 11.13 7.82 12,677 13,206 12,194
Past performance may or may not be sustained in the future. Returns are compounded annualized (CAGR). # CRISIL Composite Bond Fund Index ## CRISIL 1 year T-Bill Index. The Scheme is in existence for more than 1 year but less than 3 years. The scheme is managed by Mr. Shobhit Mehrotra since inception.
Different plans viz. Regular Plan and Direct Plan have a different expense structure. The expenses of the Direct Plan under the Scheme will be lower to the extent of the distribution expenses / commission charged in the Regular Plan. Load is not taken into consideration for computation of performance. n.A.: not Available
Performance of FMP schemes, being close-ended in nature, is not strictly comparable with that of open-ended schemes since the investment strategy for FMP schemes is primarily buy-and-hold whereas open-ended schemes are actively managed.
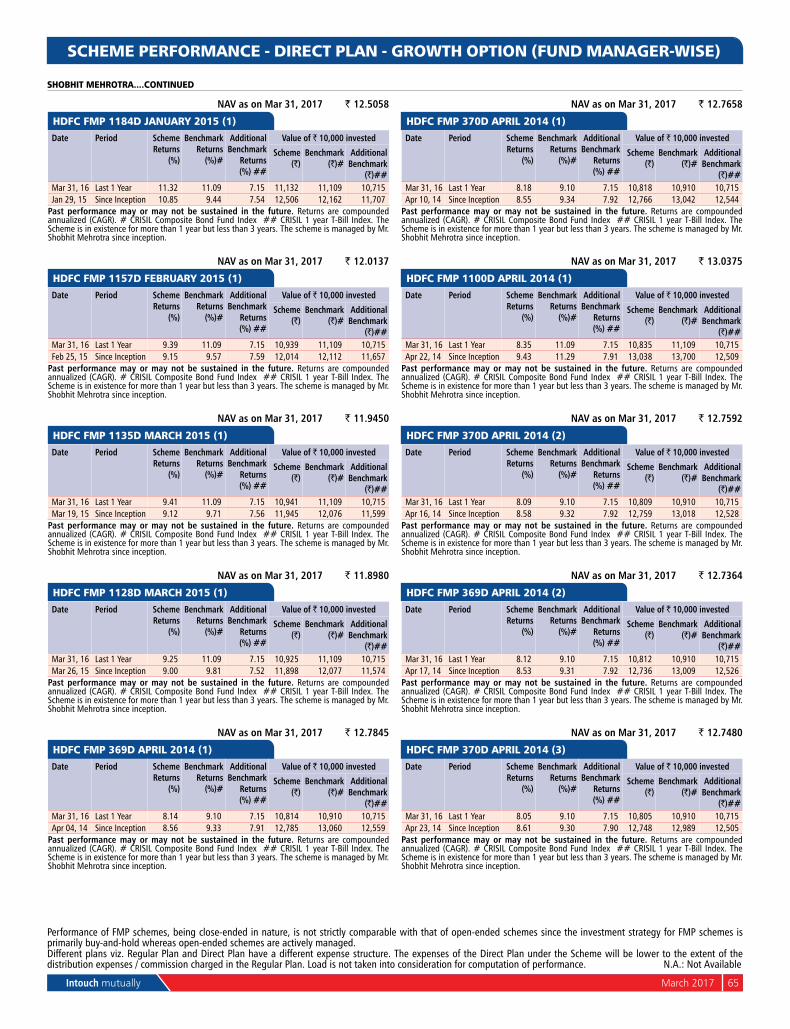
Intouch mutually March 2017 65
SCHEME PERFORMANCE - DIRECT PLAN - GROWTH OPTION (FUND MANAGER-WISE)
SHOBHIT MEHROTRA....CONTINUED
NAV as on Mar 31, 2017 ` 12.5058
HDFC FMP 1184D JANUARY 2015 (1) Date Period Scheme
Returns (%)
Benchmark Returns
(%)#
Additional Benchmark
Returns (%) ##
Value of ` 10,000 invested
Scheme (`)
Benchmark (`)#
Additional Benchmark
(`)##Mar 31, 16 Last 1 Year 11.32 11.09 7.15 11,132 11,109 10,715Jan 29, 15 Since Inception 10.85 9.44 7.54 12,506 12,162 11,707
Past performance may or may not be sustained in the future. Returns are compounded annualized (CAGR). # CRISIL Composite Bond Fund Index ## CRISIL 1 year T-Bill Index. The Scheme is in existence for more than 1 year but less than 3 years. The scheme is managed by Mr. Shobhit Mehrotra since inception.
NAV as on Mar 31, 2017 ` 12.0137
HDFC FMP 1157D FEBRUARY 2015 (1) Date Period Scheme
Returns (%)
Benchmark Returns
(%)#
Additional Benchmark
Returns (%) ##
Value of ` 10,000 invested
Scheme (`)
Benchmark (`)#
Additional Benchmark
(`)##Mar 31, 16 Last 1 Year 9.39 11.09 7.15 10,939 11,109 10,715Feb 25, 15 Since Inception 9.15 9.57 7.59 12,014 12,112 11,657
Past performance may or may not be sustained in the future. Returns are compounded annualized (CAGR). # CRISIL Composite Bond Fund Index ## CRISIL 1 year T-Bill Index. The Scheme is in existence for more than 1 year but less than 3 years. The scheme is managed by Mr. Shobhit Mehrotra since inception.
NAV as on Mar 31, 2017 ` 11.9450
HDFC FMP 1135D MARCH 2015 (1) Date Period Scheme
Returns (%)
Benchmark Returns
(%)#
Additional Benchmark
Returns (%) ##
Value of ` 10,000 invested
Scheme (`)
Benchmark (`)#
Additional Benchmark
(`)##Mar 31, 16 Last 1 Year 9.41 11.09 7.15 10,941 11,109 10,715Mar 19, 15 Since Inception 9.12 9.71 7.56 11,945 12,076 11,599
Past performance may or may not be sustained in the future. Returns are compounded annualized (CAGR). # CRISIL Composite Bond Fund Index ## CRISIL 1 year T-Bill Index. The Scheme is in existence for more than 1 year but less than 3 years. The scheme is managed by Mr. Shobhit Mehrotra since inception.
NAV as on Mar 31, 2017 ` 11.8980
HDFC FMP 1128D MARCH 2015 (1) Date Period Scheme
Returns (%)
Benchmark Returns
(%)#
Additional Benchmark
Returns (%) ##
Value of ` 10,000 invested
Scheme (`)
Benchmark (`)#
Additional Benchmark
(`)##Mar 31, 16 Last 1 Year 9.25 11.09 7.15 10,925 11,109 10,715Mar 26, 15 Since Inception 9.00 9.81 7.52 11,898 12,077 11,574
Past performance may or may not be sustained in the future. Returns are compounded annualized (CAGR). # CRISIL Composite Bond Fund Index ## CRISIL 1 year T-Bill Index. The Scheme is in existence for more than 1 year but less than 3 years. The scheme is managed by Mr. Shobhit Mehrotra since inception.
NAV as on Mar 31, 2017 ` 12.7845
HDFC FMP 369D APRIL 2014 (1) Date Period Scheme
Returns (%)
Benchmark Returns
(%)#
Additional Benchmark
Returns (%) ##
Value of ` 10,000 invested
Scheme (`)
Benchmark (`)#
Additional Benchmark
(`)##Mar 31, 16 Last 1 Year 8.14 9.10 7.15 10,814 10,910 10,715Apr 04, 14 Since Inception 8.56 9.33 7.91 12,785 13,060 12,559
Past performance may or may not be sustained in the future. Returns are compounded annualized (CAGR). # CRISIL Composite Bond Fund Index ## CRISIL 1 year T-Bill Index. The Scheme is in existence for more than 1 year but less than 3 years. The scheme is managed by Mr. Shobhit Mehrotra since inception.
NAV as on Mar 31, 2017 ` 12.7658
HDFC FMP 370D APRIL 2014 (1) Date Period Scheme
Returns (%)
Benchmark Returns
(%)#
Additional Benchmark
Returns (%) ##
Value of ` 10,000 invested
Scheme (`)
Benchmark (`)#
Additional Benchmark
(`)##Mar 31, 16 Last 1 Year 8.18 9.10 7.15 10,818 10,910 10,715Apr 10, 14 Since Inception 8.55 9.34 7.92 12,766 13,042 12,544
Past performance may or may not be sustained in the future. Returns are compounded annualized (CAGR). # CRISIL Composite Bond Fund Index ## CRISIL 1 year T-Bill Index. The Scheme is in existence for more than 1 year but less than 3 years. The scheme is managed by Mr. Shobhit Mehrotra since inception.
NAV as on Mar 31, 2017 ` 13.0375
HDFC FMP 1100D APRIL 2014 (1) Date Period Scheme
Returns (%)
Benchmark Returns
(%)#
Additional Benchmark
Returns (%) ##
Value of ` 10,000 invested
Scheme (`)
Benchmark (`)#
Additional Benchmark
(`)##Mar 31, 16 Last 1 Year 8.35 11.09 7.15 10,835 11,109 10,715Apr 22, 14 Since Inception 9.43 11.29 7.91 13,038 13,700 12,509
Past performance may or may not be sustained in the future. Returns are compounded annualized (CAGR). # CRISIL Composite Bond Fund Index ## CRISIL 1 year T-Bill Index. The Scheme is in existence for more than 1 year but less than 3 years. The scheme is managed by Mr. Shobhit Mehrotra since inception.
NAV as on Mar 31, 2017 ` 12.7592
HDFC FMP 370D APRIL 2014 (2) Date Period Scheme
Returns (%)
Benchmark Returns
(%)#
Additional Benchmark
Returns (%) ##
Value of ` 10,000 invested
Scheme (`)
Benchmark (`)#
Additional Benchmark
(`)##Mar 31, 16 Last 1 Year 8.09 9.10 7.15 10,809 10,910 10,715Apr 16, 14 Since Inception 8.58 9.32 7.92 12,759 13,018 12,528
Past performance may or may not be sustained in the future. Returns are compounded annualized (CAGR). # CRISIL Composite Bond Fund Index ## CRISIL 1 year T-Bill Index. The Scheme is in existence for more than 1 year but less than 3 years. The scheme is managed by Mr. Shobhit Mehrotra since inception.
NAV as on Mar 31, 2017 ` 12.7364
HDFC FMP 369D APRIL 2014 (2) Date Period Scheme
Returns (%)
Benchmark Returns
(%)#
Additional Benchmark
Returns (%) ##
Value of ` 10,000 invested
Scheme (`)
Benchmark (`)#
Additional Benchmark
(`)##Mar 31, 16 Last 1 Year 8.12 9.10 7.15 10,812 10,910 10,715Apr 17, 14 Since Inception 8.53 9.31 7.92 12,736 13,009 12,526
Past performance may or may not be sustained in the future. Returns are compounded annualized (CAGR). # CRISIL Composite Bond Fund Index ## CRISIL 1 year T-Bill Index. The Scheme is in existence for more than 1 year but less than 3 years. The scheme is managed by Mr. Shobhit Mehrotra since inception.
NAV as on Mar 31, 2017 ` 12.7480
HDFC FMP 370D APRIL 2014 (3) Date Period Scheme
Returns (%)
Benchmark Returns
(%)#
Additional Benchmark
Returns (%) ##
Value of ` 10,000 invested
Scheme (`)
Benchmark (`)#
Additional Benchmark
(`)##Mar 31, 16 Last 1 Year 8.05 9.10 7.15 10,805 10,910 10,715Apr 23, 14 Since Inception 8.61 9.30 7.90 12,748 12,989 12,505
Past performance may or may not be sustained in the future. Returns are compounded annualized (CAGR). # CRISIL Composite Bond Fund Index ## CRISIL 1 year T-Bill Index. The Scheme is in existence for more than 1 year but less than 3 years. The scheme is managed by Mr. Shobhit Mehrotra since inception.
Different plans viz. Regular Plan and Direct Plan have a different expense structure. The expenses of the Direct Plan under the Scheme will be lower to the extent of the distribution expenses / commission charged in the Regular Plan. Load is not taken into consideration for computation of performance. n.A.: not Available
Performance of FMP schemes, being close-ended in nature, is not strictly comparable with that of open-ended schemes since the investment strategy for FMP schemes is primarily buy-and-hold whereas open-ended schemes are actively managed.
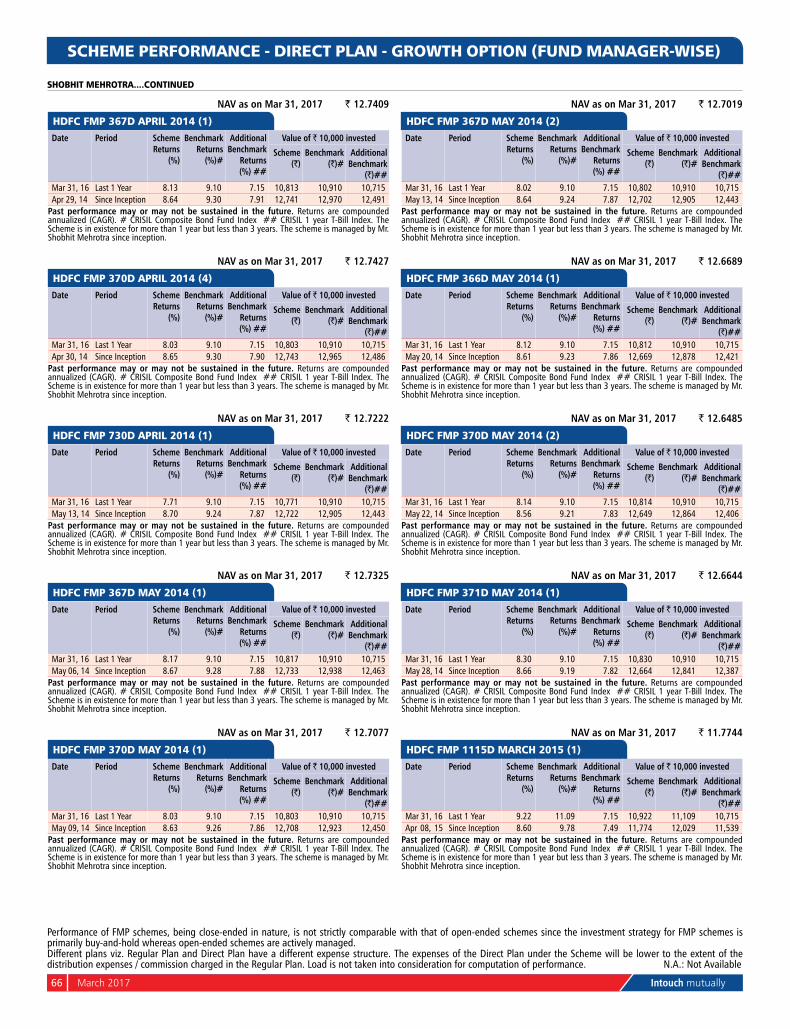
66 March 2017 Intouch mutually
SCHEME PERFORMANCE - DIRECT PLAN - GROWTH OPTION (FUND MANAGER-WISE)
SHOBHIT MEHROTRA....CONTINUED
NAV as on Mar 31, 2017 ` 12.7409
HDFC FMP 367D APRIL 2014 (1) Date Period Scheme
Returns (%)
Benchmark Returns
(%)#
Additional Benchmark
Returns (%) ##
Value of ` 10,000 invested
Scheme (`)
Benchmark (`)#
Additional Benchmark
(`)##Mar 31, 16 Last 1 Year 8.13 9.10 7.15 10,813 10,910 10,715Apr 29, 14 Since Inception 8.64 9.30 7.91 12,741 12,970 12,491
Past performance may or may not be sustained in the future. Returns are compounded annualized (CAGR). # CRISIL Composite Bond Fund Index ## CRISIL 1 year T-Bill Index. The Scheme is in existence for more than 1 year but less than 3 years. The scheme is managed by Mr. Shobhit Mehrotra since inception.
NAV as on Mar 31, 2017 ` 12.7427
HDFC FMP 370D APRIL 2014 (4) Date Period Scheme
Returns (%)
Benchmark Returns
(%)#
Additional Benchmark
Returns (%) ##
Value of ` 10,000 invested
Scheme (`)
Benchmark (`)#
Additional Benchmark
(`)##Mar 31, 16 Last 1 Year 8.03 9.10 7.15 10,803 10,910 10,715Apr 30, 14 Since Inception 8.65 9.30 7.90 12,743 12,965 12,486
Past performance may or may not be sustained in the future. Returns are compounded annualized (CAGR). # CRISIL Composite Bond Fund Index ## CRISIL 1 year T-Bill Index. The Scheme is in existence for more than 1 year but less than 3 years. The scheme is managed by Mr. Shobhit Mehrotra since inception.
NAV as on Mar 31, 2017 ` 12.7222
HDFC FMP 730D APRIL 2014 (1) Date Period Scheme
Returns (%)
Benchmark Returns
(%)#
Additional Benchmark
Returns (%) ##
Value of ` 10,000 invested
Scheme (`)
Benchmark (`)#
Additional Benchmark
(`)##Mar 31, 16 Last 1 Year 7.71 9.10 7.15 10,771 10,910 10,715May 13, 14 Since Inception 8.70 9.24 7.87 12,722 12,905 12,443
Past performance may or may not be sustained in the future. Returns are compounded annualized (CAGR). # CRISIL Composite Bond Fund Index ## CRISIL 1 year T-Bill Index. The Scheme is in existence for more than 1 year but less than 3 years. The scheme is managed by Mr. Shobhit Mehrotra since inception.
NAV as on Mar 31, 2017 ` 12.7325
HDFC FMP 367D MAY 2014 (1) Date Period Scheme
Returns (%)
Benchmark Returns
(%)#
Additional Benchmark
Returns (%) ##
Value of ` 10,000 invested
Scheme (`)
Benchmark (`)#
Additional Benchmark
(`)##Mar 31, 16 Last 1 Year 8.17 9.10 7.15 10,817 10,910 10,715May 06, 14 Since Inception 8.67 9.28 7.88 12,733 12,938 12,463
Past performance may or may not be sustained in the future. Returns are compounded annualized (CAGR). # CRISIL Composite Bond Fund Index ## CRISIL 1 year T-Bill Index. The Scheme is in existence for more than 1 year but less than 3 years. The scheme is managed by Mr. Shobhit Mehrotra since inception.
NAV as on Mar 31, 2017 ` 12.7077
HDFC FMP 370D MAY 2014 (1) Date Period Scheme
Returns (%)
Benchmark Returns
(%)#
Additional Benchmark
Returns (%) ##
Value of ` 10,000 invested
Scheme (`)
Benchmark (`)#
Additional Benchmark
(`)##Mar 31, 16 Last 1 Year 8.03 9.10 7.15 10,803 10,910 10,715May 09, 14 Since Inception 8.63 9.26 7.86 12,708 12,923 12,450
Past performance may or may not be sustained in the future. Returns are compounded annualized (CAGR). # CRISIL Composite Bond Fund Index ## CRISIL 1 year T-Bill Index. The Scheme is in existence for more than 1 year but less than 3 years. The scheme is managed by Mr. Shobhit Mehrotra since inception.
NAV as on Mar 31, 2017 ` 12.7019
HDFC FMP 367D MAY 2014 (2) Date Period Scheme
Returns (%)
Benchmark Returns
(%)#
Additional Benchmark
Returns (%) ##
Value of ` 10,000 invested
Scheme (`)
Benchmark (`)#
Additional Benchmark
(`)##Mar 31, 16 Last 1 Year 8.02 9.10 7.15 10,802 10,910 10,715May 13, 14 Since Inception 8.64 9.24 7.87 12,702 12,905 12,443
Past performance may or may not be sustained in the future. Returns are compounded annualized (CAGR). # CRISIL Composite Bond Fund Index ## CRISIL 1 year T-Bill Index. The Scheme is in existence for more than 1 year but less than 3 years. The scheme is managed by Mr. Shobhit Mehrotra since inception.
NAV as on Mar 31, 2017 ` 12.6689
HDFC FMP 366D MAY 2014 (1) Date Period Scheme
Returns (%)
Benchmark Returns
(%)#
Additional Benchmark
Returns (%) ##
Value of ` 10,000 invested
Scheme (`)
Benchmark (`)#
Additional Benchmark
(`)##Mar 31, 16 Last 1 Year 8.12 9.10 7.15 10,812 10,910 10,715May 20, 14 Since Inception 8.61 9.23 7.86 12,669 12,878 12,421
Past performance may or may not be sustained in the future. Returns are compounded annualized (CAGR). # CRISIL Composite Bond Fund Index ## CRISIL 1 year T-Bill Index. The Scheme is in existence for more than 1 year but less than 3 years. The scheme is managed by Mr. Shobhit Mehrotra since inception.
NAV as on Mar 31, 2017 ` 12.6485
HDFC FMP 370D MAY 2014 (2) Date Period Scheme
Returns (%)
Benchmark Returns
(%)#
Additional Benchmark
Returns (%) ##
Value of ` 10,000 invested
Scheme (`)
Benchmark (`)#
Additional Benchmark
(`)##Mar 31, 16 Last 1 Year 8.14 9.10 7.15 10,814 10,910 10,715May 22, 14 Since Inception 8.56 9.21 7.83 12,649 12,864 12,406
Past performance may or may not be sustained in the future. Returns are compounded annualized (CAGR). # CRISIL Composite Bond Fund Index ## CRISIL 1 year T-Bill Index. The Scheme is in existence for more than 1 year but less than 3 years. The scheme is managed by Mr. Shobhit Mehrotra since inception.
NAV as on Mar 31, 2017 ` 12.6644
HDFC FMP 371D MAY 2014 (1) Date Period Scheme
Returns (%)
Benchmark Returns
(%)#
Additional Benchmark
Returns (%) ##
Value of ` 10,000 invested
Scheme (`)
Benchmark (`)#
Additional Benchmark
(`)##Mar 31, 16 Last 1 Year 8.30 9.10 7.15 10,830 10,910 10,715May 28, 14 Since Inception 8.66 9.19 7.82 12,664 12,841 12,387
Past performance may or may not be sustained in the future. Returns are compounded annualized (CAGR). # CRISIL Composite Bond Fund Index ## CRISIL 1 year T-Bill Index. The Scheme is in existence for more than 1 year but less than 3 years. The scheme is managed by Mr. Shobhit Mehrotra since inception.
NAV as on Mar 31, 2017 ` 11.7744
HDFC FMP 1115D MARCH 2015 (1) Date Period Scheme
Returns (%)
Benchmark Returns
(%)#
Additional Benchmark
Returns (%) ##
Value of ` 10,000 invested
Scheme (`)
Benchmark (`)#
Additional Benchmark
(`)##Mar 31, 16 Last 1 Year 9.22 11.09 7.15 10,922 11,109 10,715Apr 08, 15 Since Inception 8.60 9.78 7.49 11,774 12,029 11,539
Past performance may or may not be sustained in the future. Returns are compounded annualized (CAGR). # CRISIL Composite Bond Fund Index ## CRISIL 1 year T-Bill Index. The Scheme is in existence for more than 1 year but less than 3 years. The scheme is managed by Mr. Shobhit Mehrotra since inception.
Different plans viz. Regular Plan and Direct Plan have a different expense structure. The expenses of the Direct Plan under the Scheme will be lower to the extent of the distribution expenses / commission charged in the Regular Plan. Load is not taken into consideration for computation of performance. n.A.: not Available
Performance of FMP schemes, being close-ended in nature, is not strictly comparable with that of open-ended schemes since the investment strategy for FMP schemes is primarily buy-and-hold whereas open-ended schemes are actively managed.
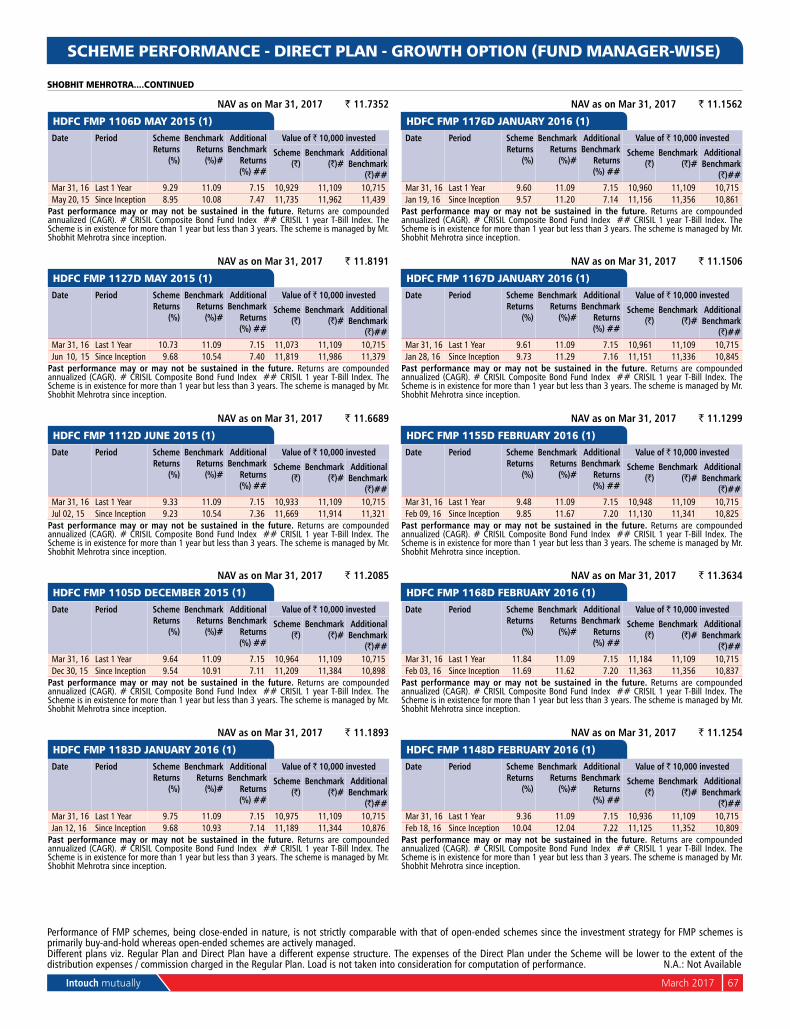
Intouch mutually March 2017 67
SCHEME PERFORMANCE - DIRECT PLAN - GROWTH OPTION (FUND MANAGER-WISE)
SHOBHIT MEHROTRA....CONTINUED
NAV as on Mar 31, 2017 ` 11.7352
HDFC FMP 1106D MAY 2015 (1) Date Period Scheme
Returns (%)
Benchmark Returns
(%)#
Additional Benchmark
Returns (%) ##
Value of ` 10,000 invested
Scheme (`)
Benchmark (`)#
Additional Benchmark
(`)##Mar 31, 16 Last 1 Year 9.29 11.09 7.15 10,929 11,109 10,715May 20, 15 Since Inception 8.95 10.08 7.47 11,735 11,962 11,439
Past performance may or may not be sustained in the future. Returns are compounded annualized (CAGR). # CRISIL Composite Bond Fund Index ## CRISIL 1 year T-Bill Index. The Scheme is in existence for more than 1 year but less than 3 years. The scheme is managed by Mr. Shobhit Mehrotra since inception.
NAV as on Mar 31, 2017 ` 11.8191
HDFC FMP 1127D MAY 2015 (1) Date Period Scheme
Returns (%)
Benchmark Returns
(%)#
Additional Benchmark
Returns (%) ##
Value of ` 10,000 invested
Scheme (`)
Benchmark (`)#
Additional Benchmark
(`)##Mar 31, 16 Last 1 Year 10.73 11.09 7.15 11,073 11,109 10,715Jun 10, 15 Since Inception 9.68 10.54 7.40 11,819 11,986 11,379
Past performance may or may not be sustained in the future. Returns are compounded annualized (CAGR). # CRISIL Composite Bond Fund Index ## CRISIL 1 year T-Bill Index. The Scheme is in existence for more than 1 year but less than 3 years. The scheme is managed by Mr. Shobhit Mehrotra since inception.
NAV as on Mar 31, 2017 ` 11.6689
HDFC FMP 1112D JUNE 2015 (1) Date Period Scheme
Returns (%)
Benchmark Returns
(%)#
Additional Benchmark
Returns (%) ##
Value of ` 10,000 invested
Scheme (`)
Benchmark (`)#
Additional Benchmark
(`)##Mar 31, 16 Last 1 Year 9.33 11.09 7.15 10,933 11,109 10,715Jul 02, 15 Since Inception 9.23 10.54 7.36 11,669 11,914 11,321
Past performance may or may not be sustained in the future. Returns are compounded annualized (CAGR). # CRISIL Composite Bond Fund Index ## CRISIL 1 year T-Bill Index. The Scheme is in existence for more than 1 year but less than 3 years. The scheme is managed by Mr. Shobhit Mehrotra since inception.
NAV as on Mar 31, 2017 ` 11.2085
HDFC FMP 1105D DECEMBER 2015 (1) Date Period Scheme
Returns (%)
Benchmark Returns
(%)#
Additional Benchmark
Returns (%) ##
Value of ` 10,000 invested
Scheme (`)
Benchmark (`)#
Additional Benchmark
(`)##Mar 31, 16 Last 1 Year 9.64 11.09 7.15 10,964 11,109 10,715Dec 30, 15 Since Inception 9.54 10.91 7.11 11,209 11,384 10,898
Past performance may or may not be sustained in the future. Returns are compounded annualized (CAGR). # CRISIL Composite Bond Fund Index ## CRISIL 1 year T-Bill Index. The Scheme is in existence for more than 1 year but less than 3 years. The scheme is managed by Mr. Shobhit Mehrotra since inception.
NAV as on Mar 31, 2017 ` 11.1893
HDFC FMP 1183D JANUARY 2016 (1) Date Period Scheme
Returns (%)
Benchmark Returns
(%)#
Additional Benchmark
Returns (%) ##
Value of ` 10,000 invested
Scheme (`)
Benchmark (`)#
Additional Benchmark
(`)##Mar 31, 16 Last 1 Year 9.75 11.09 7.15 10,975 11,109 10,715Jan 12, 16 Since Inception 9.68 10.93 7.14 11,189 11,344 10,876
Past performance may or may not be sustained in the future. Returns are compounded annualized (CAGR). # CRISIL Composite Bond Fund Index ## CRISIL 1 year T-Bill Index. The Scheme is in existence for more than 1 year but less than 3 years. The scheme is managed by Mr. Shobhit Mehrotra since inception.
NAV as on Mar 31, 2017 ` 11.1562
HDFC FMP 1176D JANUARY 2016 (1) Date Period Scheme
Returns (%)
Benchmark Returns
(%)#
Additional Benchmark
Returns (%) ##
Value of ` 10,000 invested
Scheme (`)
Benchmark (`)#
Additional Benchmark
(`)##Mar 31, 16 Last 1 Year 9.60 11.09 7.15 10,960 11,109 10,715Jan 19, 16 Since Inception 9.57 11.20 7.14 11,156 11,356 10,861
Past performance may or may not be sustained in the future. Returns are compounded annualized (CAGR). # CRISIL Composite Bond Fund Index ## CRISIL 1 year T-Bill Index. The Scheme is in existence for more than 1 year but less than 3 years. The scheme is managed by Mr. Shobhit Mehrotra since inception.
NAV as on Mar 31, 2017 ` 11.1506
HDFC FMP 1167D JANUARY 2016 (1) Date Period Scheme
Returns (%)
Benchmark Returns
(%)#
Additional Benchmark
Returns (%) ##
Value of ` 10,000 invested
Scheme (`)
Benchmark (`)#
Additional Benchmark
(`)##Mar 31, 16 Last 1 Year 9.61 11.09 7.15 10,961 11,109 10,715Jan 28, 16 Since Inception 9.73 11.29 7.16 11,151 11,336 10,845
Past performance may or may not be sustained in the future. Returns are compounded annualized (CAGR). # CRISIL Composite Bond Fund Index ## CRISIL 1 year T-Bill Index. The Scheme is in existence for more than 1 year but less than 3 years. The scheme is managed by Mr. Shobhit Mehrotra since inception.
NAV as on Mar 31, 2017 ` 11.1299
HDFC FMP 1155D FEBRUARY 2016 (1) Date Period Scheme
Returns (%)
Benchmark Returns
(%)#
Additional Benchmark
Returns (%) ##
Value of ` 10,000 invested
Scheme (`)
Benchmark (`)#
Additional Benchmark
(`)##Mar 31, 16 Last 1 Year 9.48 11.09 7.15 10,948 11,109 10,715Feb 09, 16 Since Inception 9.85 11.67 7.20 11,130 11,341 10,825
Past performance may or may not be sustained in the future. Returns are compounded annualized (CAGR). # CRISIL Composite Bond Fund Index ## CRISIL 1 year T-Bill Index. The Scheme is in existence for more than 1 year but less than 3 years. The scheme is managed by Mr. Shobhit Mehrotra since inception.
NAV as on Mar 31, 2017 ` 11.3634
HDFC FMP 1168D FEBRUARY 2016 (1) Date Period Scheme
Returns (%)
Benchmark Returns
(%)#
Additional Benchmark
Returns (%) ##
Value of ` 10,000 invested
Scheme (`)
Benchmark (`)#
Additional Benchmark
(`)##Mar 31, 16 Last 1 Year 11.84 11.09 7.15 11,184 11,109 10,715Feb 03, 16 Since Inception 11.69 11.62 7.20 11,363 11,356 10,837
Past performance may or may not be sustained in the future. Returns are compounded annualized (CAGR). # CRISIL Composite Bond Fund Index ## CRISIL 1 year T-Bill Index. The Scheme is in existence for more than 1 year but less than 3 years. The scheme is managed by Mr. Shobhit Mehrotra since inception.
NAV as on Mar 31, 2017 ` 11.1254
HDFC FMP 1148D FEBRUARY 2016 (1) Date Period Scheme
Returns (%)
Benchmark Returns
(%)#
Additional Benchmark
Returns (%) ##
Value of ` 10,000 invested
Scheme (`)
Benchmark (`)#
Additional Benchmark
(`)##Mar 31, 16 Last 1 Year 9.36 11.09 7.15 10,936 11,109 10,715Feb 18, 16 Since Inception 10.04 12.04 7.22 11,125 11,352 10,809
Past performance may or may not be sustained in the future. Returns are compounded annualized (CAGR). # CRISIL Composite Bond Fund Index ## CRISIL 1 year T-Bill Index. The Scheme is in existence for more than 1 year but less than 3 years. The scheme is managed by Mr. Shobhit Mehrotra since inception.
Different plans viz. Regular Plan and Direct Plan have a different expense structure. The expenses of the Direct Plan under the Scheme will be lower to the extent of the distribution expenses / commission charged in the Regular Plan. Load is not taken into consideration for computation of performance. n.A.: not Available
Performance of FMP schemes, being close-ended in nature, is not strictly comparable with that of open-ended schemes since the investment strategy for FMP schemes is primarily buy-and-hold whereas open-ended schemes are actively managed.
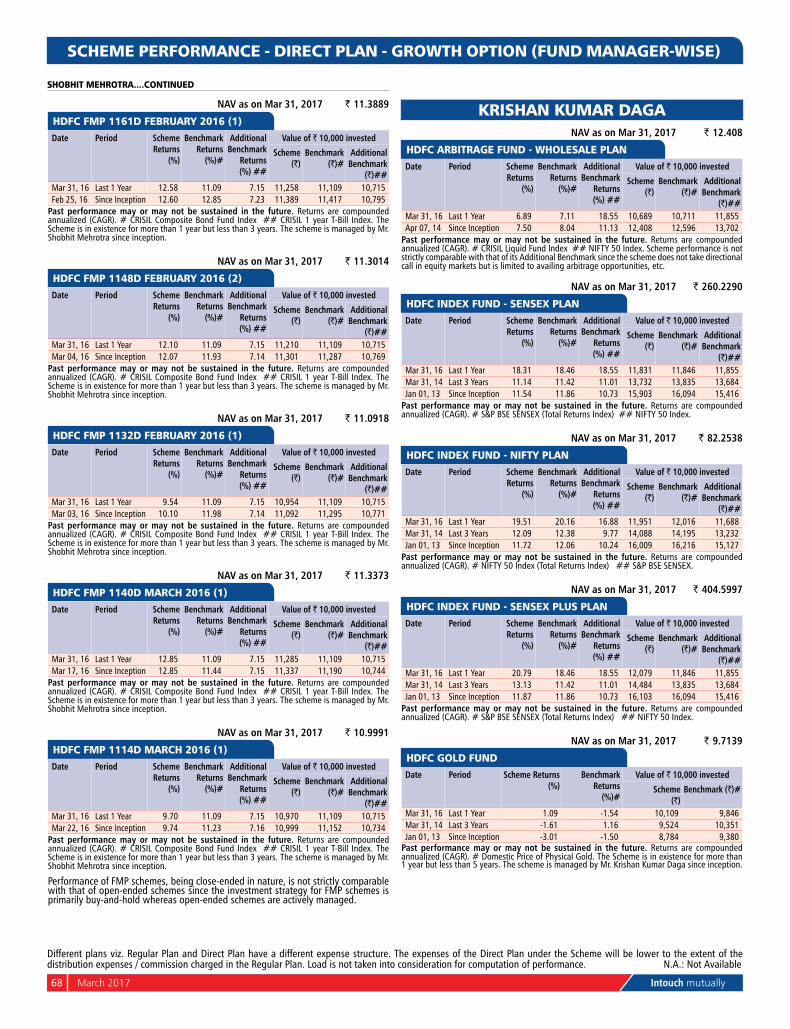
68 March 2017 Intouch mutually
SCHEME PERFORMANCE - DIRECT PLAN - GROWTH OPTION (FUND MANAGER-WISE)
SHOBHIT MEHROTRA....CONTINUED
Different plans viz. Regular Plan and Direct Plan have a different expense structure. The expenses of the Direct Plan under the Scheme will be lower to the extent of the distribution expenses / commission charged in the Regular Plan. Load is not taken into consideration for computation of performance. n.A.: not Available
NAV as on Mar 31, 2017 ` 11.3889
HDFC FMP 1161D FEBRUARY 2016 (1) Date Period Scheme
Returns (%)
Benchmark Returns
(%)#
Additional Benchmark
Returns (%) ##
Value of ` 10,000 invested
Scheme (`)
Benchmark (`)#
Additional Benchmark
(`)##Mar 31, 16 Last 1 Year 12.58 11.09 7.15 11,258 11,109 10,715Feb 25, 16 Since Inception 12.60 12.85 7.23 11,389 11,417 10,795
Past performance may or may not be sustained in the future. Returns are compounded annualized (CAGR). # CRISIL Composite Bond Fund Index ## CRISIL 1 year T-Bill Index. The Scheme is in existence for more than 1 year but less than 3 years. The scheme is managed by Mr. Shobhit Mehrotra since inception.
NAV as on Mar 31, 2017 ` 11.3014
HDFC FMP 1148D FEBRUARY 2016 (2) Date Period Scheme
Returns (%)
Benchmark Returns
(%)#
Additional Benchmark
Returns (%) ##
Value of ` 10,000 invested
Scheme (`)
Benchmark (`)#
Additional Benchmark
(`)##Mar 31, 16 Last 1 Year 12.10 11.09 7.15 11,210 11,109 10,715Mar 04, 16 Since Inception 12.07 11.93 7.14 11,301 11,287 10,769
Past performance may or may not be sustained in the future. Returns are compounded annualized (CAGR). # CRISIL Composite Bond Fund Index ## CRISIL 1 year T-Bill Index. The Scheme is in existence for more than 1 year but less than 3 years. The scheme is managed by Mr. Shobhit Mehrotra since inception.
NAV as on Mar 31, 2017 ` 11.0918
HDFC FMP 1132D FEBRUARY 2016 (1) Date Period Scheme
Returns (%)
Benchmark Returns
(%)#
Additional Benchmark
Returns (%) ##
Value of ` 10,000 invested
Scheme (`)
Benchmark (`)#
Additional Benchmark
(`)##Mar 31, 16 Last 1 Year 9.54 11.09 7.15 10,954 11,109 10,715Mar 03, 16 Since Inception 10.10 11.98 7.14 11,092 11,295 10,771
Past performance may or may not be sustained in the future. Returns are compounded annualized (CAGR). # CRISIL Composite Bond Fund Index ## CRISIL 1 year T-Bill Index. The Scheme is in existence for more than 1 year but less than 3 years. The scheme is managed by Mr. Shobhit Mehrotra since inception.
NAV as on Mar 31, 2017 ` 11.3373
HDFC FMP 1140D MARCH 2016 (1) Date Period Scheme
Returns (%)
Benchmark Returns
(%)#
Additional Benchmark
Returns (%) ##
Value of ` 10,000 invested
Scheme (`)
Benchmark (`)#
Additional Benchmark
(`)##Mar 31, 16 Last 1 Year 12.85 11.09 7.15 11,285 11,109 10,715Mar 17, 16 Since Inception 12.85 11.44 7.15 11,337 11,190 10,744
Past performance may or may not be sustained in the future. Returns are compounded annualized (CAGR). # CRISIL Composite Bond Fund Index ## CRISIL 1 year T-Bill Index. The Scheme is in existence for more than 1 year but less than 3 years. The scheme is managed by Mr. Shobhit Mehrotra since inception.
NAV as on Mar 31, 2017 ` 10.9991
HDFC FMP 1114D MARCH 2016 (1) Date Period Scheme
Returns (%)
Benchmark Returns
(%)#
Additional Benchmark
Returns (%) ##
Value of ` 10,000 invested
Scheme (`)
Benchmark (`)#
Additional Benchmark
(`)##Mar 31, 16 Last 1 Year 9.70 11.09 7.15 10,970 11,109 10,715Mar 22, 16 Since Inception 9.74 11.23 7.16 10,999 11,152 10,734
Past performance may or may not be sustained in the future. Returns are compounded annualized (CAGR). # CRISIL Composite Bond Fund Index ## CRISIL 1 year T-Bill Index. The Scheme is in existence for more than 1 year but less than 3 years. The scheme is managed by Mr. Shobhit Mehrotra since inception.
Performance of FMP schemes, being close-ended in nature, is not strictly comparable with that of open-ended schemes since the investment strategy for FMP schemes is primarily buy-and-hold whereas open-ended schemes are actively managed.
KRISHAN KUMAR DAGA NAV as on Mar 31, 2017 ` 12.408
HDFC ARBITRAGE FUND - WHOLESALE PLAN Date Period Scheme
Returns (%)
Benchmark Returns
(%)#
Additional Benchmark
Returns (%) ##
Value of ` 10,000 invested
Scheme (`)
Benchmark (`)#
Additional Benchmark
(`)##Mar 31, 16 Last 1 Year 6.89 7.11 18.55 10,689 10,711 11,855Apr 07, 14 Since Inception 7.50 8.04 11.13 12,408 12,596 13,702
Past performance may or may not be sustained in the future. Returns are compounded annualized (CAGR). # CRISIL Liquid Fund Index ## nIFTY 50 Index. Scheme performance is not strictly comparable with that of its Additional Benchmark since the scheme does not take directional call in equity markets but is limited to availing arbitrage opportunities, etc.
NAV as on Mar 31, 2017 ` 260.2290
HDFC INDEX FUND - SENSEX PLAN Date Period Scheme
Returns (%)
Benchmark Returns
(%)#
Additional Benchmark
Returns (%) ##
Value of ` 10,000 invested
Scheme (`)
Benchmark (`)#
Additional Benchmark
(`)##Mar 31, 16 Last 1 Year 18.31 18.46 18.55 11,831 11,846 11,855Mar 31, 14 Last 3 Years 11.14 11.42 11.01 13,732 13,835 13,684Jan 01, 13 Since Inception 11.54 11.86 10.73 15,903 16,094 15,416
Past performance may or may not be sustained in the future. Returns are compounded annualized (CAGR). # S&P BSE SEnSEx (Total Returns Index) ## nIFTY 50 Index.
NAV as on Mar 31, 2017 ` 82.2538
HDFC INDEX FUND - NIFTY PLAN Date Period Scheme
Returns (%)
Benchmark Returns
(%)#
Additional Benchmark
Returns (%) ##
Value of ` 10,000 invested
Scheme (`)
Benchmark (`)#
Additional Benchmark
(`)##Mar 31, 16 Last 1 Year 19.51 20.16 16.88 11,951 12,016 11,688Mar 31, 14 Last 3 Years 12.09 12.38 9.77 14,088 14,195 13,232Jan 01, 13 Since Inception 11.72 12.06 10.24 16,009 16,216 15,127
Past performance may or may not be sustained in the future. Returns are compounded annualized (CAGR). # nIFTY 50 Index (Total Returns Index) ## S&P BSE SEnSEx.
NAV as on Mar 31, 2017 ` 404.5997
HDFC INDEX FUND - SENSEX PLUS PLAN Date Period Scheme
Returns (%)
Benchmark Returns
(%)#
Additional Benchmark
Returns (%) ##
Value of ` 10,000 invested
Scheme (`)
Benchmark (`)#
Additional Benchmark
(`)##Mar 31, 16 Last 1 Year 20.79 18.46 18.55 12,079 11,846 11,855Mar 31, 14 Last 3 Years 13.13 11.42 11.01 14,484 13,835 13,684Jan 01, 13 Since Inception 11.87 11.86 10.73 16,103 16,094 15,416
Past performance may or may not be sustained in the future. Returns are compounded annualized (CAGR). # S&P BSE SEnSEx (Total Returns Index) ## nIFTY 50 Index.
NAV as on Mar 31, 2017 ` 9.7139
HDFC GOLD FUND Date Period Scheme Returns
(%)Benchmark
Returns (%)#
Value of ` 10,000 invested
Scheme (`)
Benchmark (`)#
Mar 31, 16 Last 1 Year 1.09 -1.54 10,109 9,846Mar 31, 14 Last 3 Years -1.61 1.16 9,524 10,351Jan 01, 13 Since Inception -3.01 -1.50 8,784 9,380
Past performance may or may not be sustained in the future. Returns are compounded annualized (CAGR). # Domestic Price of Physical Gold. The Scheme is in existence for more than 1 year but less than 5 years. The scheme is managed by Mr. Krishan Kumar Daga since inception.
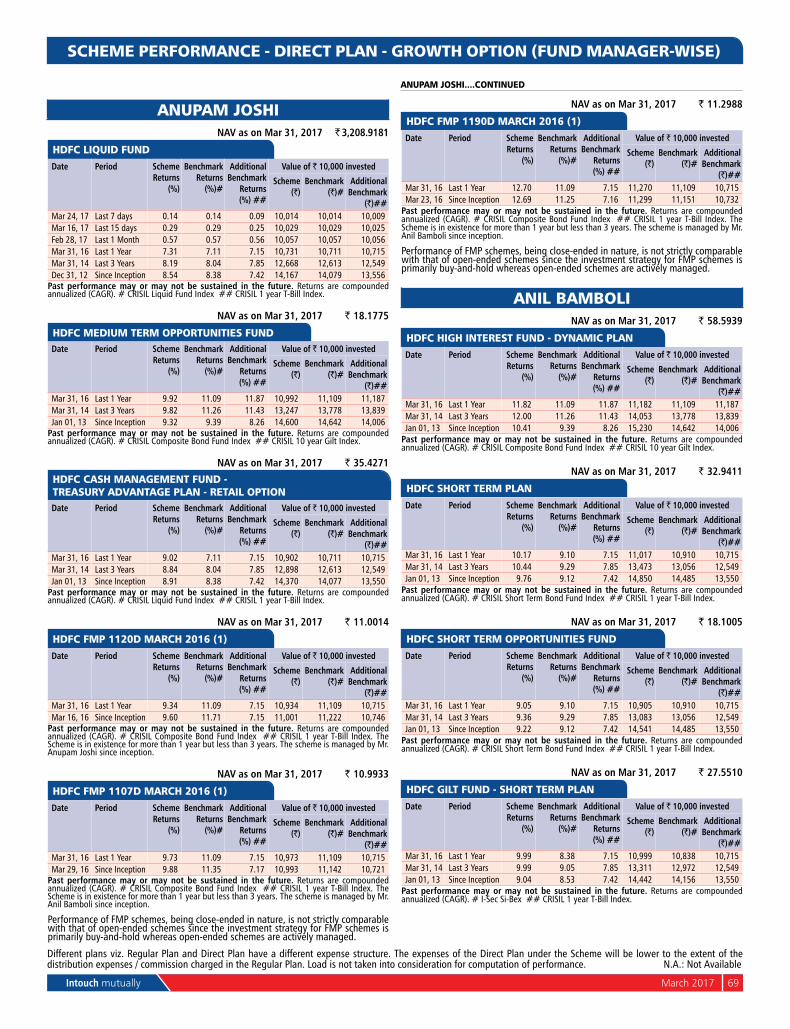
Intouch mutually March 2017 69
Different plans viz. Regular Plan and Direct Plan have a different expense structure. The expenses of the Direct Plan under the Scheme will be lower to the extent of the distribution expenses / commission charged in the Regular Plan. Load is not taken into consideration for computation of performance. n.A.: not Available
SCHEME PERFORMANCE - DIRECT PLAN - GROWTH OPTION (FUND MANAGER-WISE)
ANUPAM JOSHI NAV as on Mar 31, 2017 ` 3,208.9181
HDFC LIQUID FUND Date Period Scheme
Returns (%)
Benchmark Returns
(%)#
Additional Benchmark
Returns (%) ##
Value of ` 10,000 invested
Scheme (`)
Benchmark (`)#
Additional Benchmark
(`)##Mar 24, 17 Last 7 days 0.14 0.14 0.09 10,014 10,014 10,009Mar 16, 17 Last 15 days 0.29 0.29 0.25 10,029 10,029 10,025Feb 28, 17 Last 1 Month 0.57 0.57 0.56 10,057 10,057 10,056Mar 31, 16 Last 1 Year 7.31 7.11 7.15 10,731 10,711 10,715Mar 31, 14 Last 3 Years 8.19 8.04 7.85 12,668 12,613 12,549Dec 31, 12 Since Inception 8.54 8.38 7.42 14,167 14,079 13,556
Past performance may or may not be sustained in the future. Returns are compounded annualized (CAGR). # CRISIL Liquid Fund Index ## CRISIL 1 year T-Bill Index.
NAV as on Mar 31, 2017 ` 18.1775
HDFC MEDIUM TERM OPPORTUNITIES FUND Date Period Scheme
Returns (%)
Benchmark Returns
(%)#
Additional Benchmark
Returns (%) ##
Value of ` 10,000 invested
Scheme (`)
Benchmark (`)#
Additional Benchmark
(`)##Mar 31, 16 Last 1 Year 9.92 11.09 11.87 10,992 11,109 11,187Mar 31, 14 Last 3 Years 9.82 11.26 11.43 13,247 13,778 13,839Jan 01, 13 Since Inception 9.32 9.39 8.26 14,600 14,642 14,006
Past performance may or may not be sustained in the future. Returns are compounded annualized (CAGR). # CRISIL Composite Bond Fund Index ## CRISIL 10 year Gilt Index.
NAV as on Mar 31, 2017 ` 35.4271
HDFC CASH MANAGEMENT FUND - TREASURY ADVANTAGE PLAN - RETAIL OPTION Date Period Scheme
Returns (%)
Benchmark Returns
(%)#
Additional Benchmark
Returns (%) ##
Value of ` 10,000 invested
Scheme (`)
Benchmark (`)#
Additional Benchmark
(`)##Mar 31, 16 Last 1 Year 9.02 7.11 7.15 10,902 10,711 10,715Mar 31, 14 Last 3 Years 8.84 8.04 7.85 12,898 12,613 12,549Jan 01, 13 Since Inception 8.91 8.38 7.42 14,370 14,077 13,550
Past performance may or may not be sustained in the future. Returns are compounded annualized (CAGR). # CRISIL Liquid Fund Index ## CRISIL 1 year T-Bill Index.
NAV as on Mar 31, 2017 ` 11.0014
HDFC FMP 1120D MARCH 2016 (1) Date Period Scheme
Returns (%)
Benchmark Returns
(%)#
Additional Benchmark
Returns (%) ##
Value of ` 10,000 invested
Scheme (`)
Benchmark (`)#
Additional Benchmark
(`)##Mar 31, 16 Last 1 Year 9.34 11.09 7.15 10,934 11,109 10,715Mar 16, 16 Since Inception 9.60 11.71 7.15 11,001 11,222 10,746
Past performance may or may not be sustained in the future. Returns are compounded annualized (CAGR). # CRISIL Composite Bond Fund Index ## CRISIL 1 year T-Bill Index. The Scheme is in existence for more than 1 year but less than 3 years. The scheme is managed by Mr. Anupam Joshi since inception.
NAV as on Mar 31, 2017 ` 10.9933
HDFC FMP 1107D MARCH 2016 (1) Date Period Scheme
Returns (%)
Benchmark Returns
(%)#
Additional Benchmark
Returns (%) ##
Value of ` 10,000 invested
Scheme (`)
Benchmark (`)#
Additional Benchmark
(`)##Mar 31, 16 Last 1 Year 9.73 11.09 7.15 10,973 11,109 10,715Mar 29, 16 Since Inception 9.88 11.35 7.17 10,993 11,142 10,721
Past performance may or may not be sustained in the future. Returns are compounded annualized (CAGR). # CRISIL Composite Bond Fund Index ## CRISIL 1 year T-Bill Index. The Scheme is in existence for more than 1 year but less than 3 years. The scheme is managed by Mr. Anil Bamboli since inception.
Performance of FMP schemes, being close-ended in nature, is not strictly comparable with that of open-ended schemes since the investment strategy for FMP schemes is primarily buy-and-hold whereas open-ended schemes are actively managed.
NAV as on Mar 31, 2017 ` 11.2988
HDFC FMP 1190D MARCH 2016 (1) Date Period Scheme
Returns (%)
Benchmark Returns
(%)#
Additional Benchmark
Returns (%) ##
Value of ` 10,000 invested
Scheme (`)
Benchmark (`)#
Additional Benchmark
(`)##Mar 31, 16 Last 1 Year 12.70 11.09 7.15 11,270 11,109 10,715Mar 23, 16 Since Inception 12.69 11.25 7.16 11,299 11,151 10,732
Past performance may or may not be sustained in the future. Returns are compounded annualized (CAGR). # CRISIL Composite Bond Fund Index ## CRISIL 1 year T-Bill Index. The Scheme is in existence for more than 1 year but less than 3 years. The scheme is managed by Mr. Anil Bamboli since inception.
Performance of FMP schemes, being close-ended in nature, is not strictly comparable with that of open-ended schemes since the investment strategy for FMP schemes is primarily buy-and-hold whereas open-ended schemes are actively managed.
ANIL BAMBOLI NAV as on Mar 31, 2017 ` 58.5939
HDFC HIGH INTEREST FUND - DYNAMIC PLAN Date Period Scheme
Returns (%)
Benchmark Returns
(%)#
Additional Benchmark
Returns (%) ##
Value of ` 10,000 invested
Scheme (`)
Benchmark (`)#
Additional Benchmark
(`)##Mar 31, 16 Last 1 Year 11.82 11.09 11.87 11,182 11,109 11,187Mar 31, 14 Last 3 Years 12.00 11.26 11.43 14,053 13,778 13,839Jan 01, 13 Since Inception 10.41 9.39 8.26 15,230 14,642 14,006
Past performance may or may not be sustained in the future. Returns are compounded annualized (CAGR). # CRISIL Composite Bond Fund Index ## CRISIL 10 year Gilt Index.
NAV as on Mar 31, 2017 ` 32.9411
HDFC SHORT TERM PLAN Date Period Scheme
Returns (%)
Benchmark Returns
(%)#
Additional Benchmark
Returns (%) ##
Value of ` 10,000 invested
Scheme (`)
Benchmark (`)#
Additional Benchmark
(`)##Mar 31, 16 Last 1 Year 10.17 9.10 7.15 11,017 10,910 10,715Mar 31, 14 Last 3 Years 10.44 9.29 7.85 13,473 13,056 12,549Jan 01, 13 Since Inception 9.76 9.12 7.42 14,850 14,485 13,550
Past performance may or may not be sustained in the future. Returns are compounded annualized (CAGR). # CRISIL Short Term Bond Fund Index ## CRISIL 1 year T-Bill Index.
NAV as on Mar 31, 2017 ` 18.1005
HDFC SHORT TERM OPPORTUNITIES FUND Date Period Scheme
Returns (%)
Benchmark Returns
(%)#
Additional Benchmark
Returns (%) ##
Value of ` 10,000 invested
Scheme (`)
Benchmark (`)#
Additional Benchmark
(`)##Mar 31, 16 Last 1 Year 9.05 9.10 7.15 10,905 10,910 10,715Mar 31, 14 Last 3 Years 9.36 9.29 7.85 13,083 13,056 12,549Jan 01, 13 Since Inception 9.22 9.12 7.42 14,541 14,485 13,550
Past performance may or may not be sustained in the future. Returns are compounded annualized (CAGR). # CRISIL Short Term Bond Fund Index ## CRISIL 1 year T-Bill Index.
NAV as on Mar 31, 2017 ` 27.5510
HDFC GILT FUND - SHORT TERM PLAN Date Period Scheme
Returns (%)
Benchmark Returns
(%)#
Additional Benchmark
Returns (%) ##
Value of ` 10,000 invested
Scheme (`)
Benchmark (`)#
Additional Benchmark
(`)##Mar 31, 16 Last 1 Year 9.99 8.38 7.15 10,999 10,838 10,715Mar 31, 14 Last 3 Years 9.99 9.05 7.85 13,311 12,972 12,549Jan 01, 13 Since Inception 9.04 8.53 7.42 14,442 14,156 13,550
Past performance may or may not be sustained in the future. Returns are compounded annualized (CAGR). # I-Sec Si-Bex ## CRISIL 1 year T-Bill Index.
ANUPAM JOSHI....CONTINUED
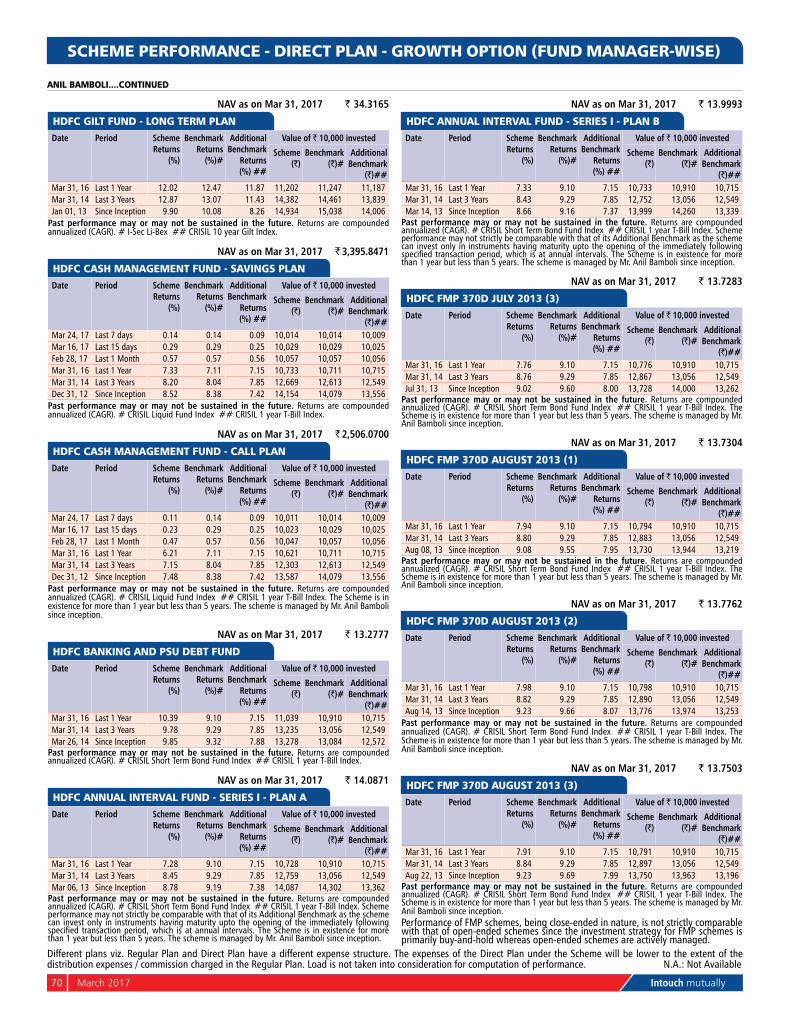
70 March 2017 Intouch mutually
SCHEME PERFORMANCE - DIRECT PLAN - GROWTH OPTION (FUND MANAGER-WISE)
ANIL BAMBOLI....CONTINUED
Different plans viz. Regular Plan and Direct Plan have a different expense structure. The expenses of the Direct Plan under the Scheme will be lower to the extent of the distribution expenses / commission charged in the Regular Plan. Load is not taken into consideration for computation of performance. n.A.: not Available
NAV as on Mar 31, 2017 ` 34.3165
HDFC GILT FUND - LONG TERM PLAN Date Period Scheme
Returns (%)
Benchmark Returns
(%)#
Additional Benchmark
Returns (%) ##
Value of ` 10,000 invested
Scheme (`)
Benchmark (`)#
Additional Benchmark
(`)##Mar 31, 16 Last 1 Year 12.02 12.47 11.87 11,202 11,247 11,187Mar 31, 14 Last 3 Years 12.87 13.07 11.43 14,382 14,461 13,839Jan 01, 13 Since Inception 9.90 10.08 8.26 14,934 15,038 14,006
Past performance may or may not be sustained in the future. Returns are compounded annualized (CAGR). # I-Sec Li-Bex ## CRISIL 10 year Gilt Index.
NAV as on Mar 31, 2017 ` 3,395.8471
HDFC CASH MANAGEMENT FUND - SAVINGS PLAN Date Period Scheme
Returns (%)
Benchmark Returns
(%)#
Additional Benchmark
Returns (%) ##
Value of ` 10,000 invested
Scheme (`)
Benchmark (`)#
Additional Benchmark
(`)##Mar 24, 17 Last 7 days 0.14 0.14 0.09 10,014 10,014 10,009Mar 16, 17 Last 15 days 0.29 0.29 0.25 10,029 10,029 10,025Feb 28, 17 Last 1 Month 0.57 0.57 0.56 10,057 10,057 10,056Mar 31, 16 Last 1 Year 7.33 7.11 7.15 10,733 10,711 10,715Mar 31, 14 Last 3 Years 8.20 8.04 7.85 12,669 12,613 12,549Dec 31, 12 Since Inception 8.52 8.38 7.42 14,154 14,079 13,556
Past performance may or may not be sustained in the future. Returns are compounded annualized (CAGR). # CRISIL Liquid Fund Index ## CRISIL 1 year T-Bill Index.
NAV as on Mar 31, 2017 ` 2,506.0700
HDFC CASH MANAGEMENT FUND - CALL PLAN Date Period Scheme
Returns (%)
Benchmark Returns
(%)#
Additional Benchmark
Returns (%) ##
Value of ` 10,000 invested
Scheme (`)
Benchmark (`)#
Additional Benchmark
(`)##Mar 24, 17 Last 7 days 0.11 0.14 0.09 10,011 10,014 10,009Mar 16, 17 Last 15 days 0.23 0.29 0.25 10,023 10,029 10,025Feb 28, 17 Last 1 Month 0.47 0.57 0.56 10,047 10,057 10,056Mar 31, 16 Last 1 Year 6.21 7.11 7.15 10,621 10,711 10,715Mar 31, 14 Last 3 Years 7.15 8.04 7.85 12,303 12,613 12,549Dec 31, 12 Since Inception 7.48 8.38 7.42 13,587 14,079 13,556
Past performance may or may not be sustained in the future. Returns are compounded annualized (CAGR). # CRISIL Liquid Fund Index ## CRISIL 1 year T-Bill Index. The Scheme is in existence for more than 1 year but less than 5 years. The scheme is managed by Mr. Anil Bamboli since inception.
NAV as on Mar 31, 2017 ` 13.2777
HDFC BANKING AND PSU DEBT FUND Date Period Scheme
Returns (%)
Benchmark Returns
(%)#
Additional Benchmark
Returns (%) ##
Value of ` 10,000 invested
Scheme (`)
Benchmark (`)#
Additional Benchmark
(`)##Mar 31, 16 Last 1 Year 10.39 9.10 7.15 11,039 10,910 10,715Mar 31, 14 Last 3 Years 9.78 9.29 7.85 13,235 13,056 12,549Mar 26, 14 Since Inception 9.85 9.32 7.88 13,278 13,084 12,572
Past performance may or may not be sustained in the future. Returns are compounded annualized (CAGR). # CRISIL Short Term Bond Fund Index ## CRISIL 1 year T-Bill Index.
NAV as on Mar 31, 2017 ` 14.0871
HDFC ANNUAL INTERVAL FUND - SERIES I - PLAN A Date Period Scheme
Returns (%)
Benchmark Returns
(%)#
Additional Benchmark
Returns (%) ##
Value of ` 10,000 invested
Scheme (`)
Benchmark (`)#
Additional Benchmark
(`)##Mar 31, 16 Last 1 Year 7.28 9.10 7.15 10,728 10,910 10,715Mar 31, 14 Last 3 Years 8.45 9.29 7.85 12,759 13,056 12,549Mar 06, 13 Since Inception 8.78 9.19 7.38 14,087 14,302 13,362
Past performance may or may not be sustained in the future. Returns are compounded annualized (CAGR). # CRISIL Short Term Bond Fund Index ## CRISIL 1 year T-Bill Index. Scheme performance may not strictly be comparable with that of its Additional Benchmark as the scheme can invest only in instruments having maturity upto the opening of the immediately following specified transaction period, which is at annual intervals. The Scheme is in existence for more than 1 year but less than 5 years. The scheme is managed by Mr. Anil Bamboli since inception.
NAV as on Mar 31, 2017 ` 13.9993
HDFC ANNUAL INTERVAL FUND - SERIES I - PLAN B Date Period Scheme
Returns (%)
Benchmark Returns
(%)#
Additional Benchmark
Returns (%) ##
Value of ` 10,000 invested
Scheme (`)
Benchmark (`)#
Additional Benchmark
(`)##Mar 31, 16 Last 1 Year 7.33 9.10 7.15 10,733 10,910 10,715Mar 31, 14 Last 3 Years 8.43 9.29 7.85 12,752 13,056 12,549Mar 14, 13 Since Inception 8.66 9.16 7.37 13,999 14,260 13,339
Past performance may or may not be sustained in the future. Returns are compounded annualized (CAGR). # CRISIL Short Term Bond Fund Index ## CRISIL 1 year T-Bill Index. Scheme performance may not strictly be comparable with that of its Additional Benchmark as the scheme can invest only in instruments having maturity upto the opening of the immediately following specified transaction period, which is at annual intervals. The Scheme is in existence for more than 1 year but less than 5 years. The scheme is managed by Mr. Anil Bamboli since inception.
NAV as on Mar 31, 2017 ` 13.7283
HDFC FMP 370D JULY 2013 (3) Date Period Scheme
Returns (%)
Benchmark Returns
(%)#
Additional Benchmark
Returns (%) ##
Value of ` 10,000 invested
Scheme (`)
Benchmark (`)#
Additional Benchmark
(`)##Mar 31, 16 Last 1 Year 7.76 9.10 7.15 10,776 10,910 10,715Mar 31, 14 Last 3 Years 8.76 9.29 7.85 12,867 13,056 12,549Jul 31, 13 Since Inception 9.02 9.60 8.00 13,728 14,000 13,262
Past performance may or may not be sustained in the future. Returns are compounded annualized (CAGR). # CRISIL Short Term Bond Fund Index ## CRISIL 1 year T-Bill Index. The Scheme is in existence for more than 1 year but less than 5 years. The scheme is managed by Mr. Anil Bamboli since inception.
NAV as on Mar 31, 2017 ` 13.7304
HDFC FMP 370D AUGUST 2013 (1) Date Period Scheme
Returns (%)
Benchmark Returns
(%)#
Additional Benchmark
Returns (%) ##
Value of ` 10,000 invested
Scheme (`)
Benchmark (`)#
Additional Benchmark
(`)##Mar 31, 16 Last 1 Year 7.94 9.10 7.15 10,794 10,910 10,715Mar 31, 14 Last 3 Years 8.80 9.29 7.85 12,883 13,056 12,549Aug 08, 13 Since Inception 9.08 9.55 7.95 13,730 13,944 13,219
Past performance may or may not be sustained in the future. Returns are compounded annualized (CAGR). # CRISIL Short Term Bond Fund Index ## CRISIL 1 year T-Bill Index. The Scheme is in existence for more than 1 year but less than 5 years. The scheme is managed by Mr. Anil Bamboli since inception.
NAV as on Mar 31, 2017 ` 13.7762
HDFC FMP 370D AUGUST 2013 (2) Date Period Scheme
Returns (%)
Benchmark Returns
(%)#
Additional Benchmark
Returns (%) ##
Value of ` 10,000 invested
Scheme (`)
Benchmark (`)#
Additional Benchmark
(`)##Mar 31, 16 Last 1 Year 7.98 9.10 7.15 10,798 10,910 10,715Mar 31, 14 Last 3 Years 8.82 9.29 7.85 12,890 13,056 12,549Aug 14, 13 Since Inception 9.23 9.66 8.07 13,776 13,974 13,253
Past performance may or may not be sustained in the future. Returns are compounded annualized (CAGR). # CRISIL Short Term Bond Fund Index ## CRISIL 1 year T-Bill Index. The Scheme is in existence for more than 1 year but less than 5 years. The scheme is managed by Mr. Anil Bamboli since inception.
NAV as on Mar 31, 2017 ` 13.7503
HDFC FMP 370D AUGUST 2013 (3) Date Period Scheme
Returns (%)
Benchmark Returns
(%)#
Additional Benchmark
Returns (%) ##
Value of ` 10,000 invested
Scheme (`)
Benchmark (`)#
Additional Benchmark
(`)##Mar 31, 16 Last 1 Year 7.91 9.10 7.15 10,791 10,910 10,715Mar 31, 14 Last 3 Years 8.84 9.29 7.85 12,897 13,056 12,549Aug 22, 13 Since Inception 9.23 9.69 7.99 13,750 13,963 13,196
Past performance may or may not be sustained in the future. Returns are compounded annualized (CAGR). # CRISIL Short Term Bond Fund Index ## CRISIL 1 year T-Bill Index. The Scheme is in existence for more than 1 year but less than 5 years. The scheme is managed by Mr. Anil Bamboli since inception. Performance of FMP schemes, being close-ended in nature, is not strictly comparable with that of open-ended schemes since the investment strategy for FMP schemes is primarily buy-and-hold whereas open-ended schemes are actively managed.
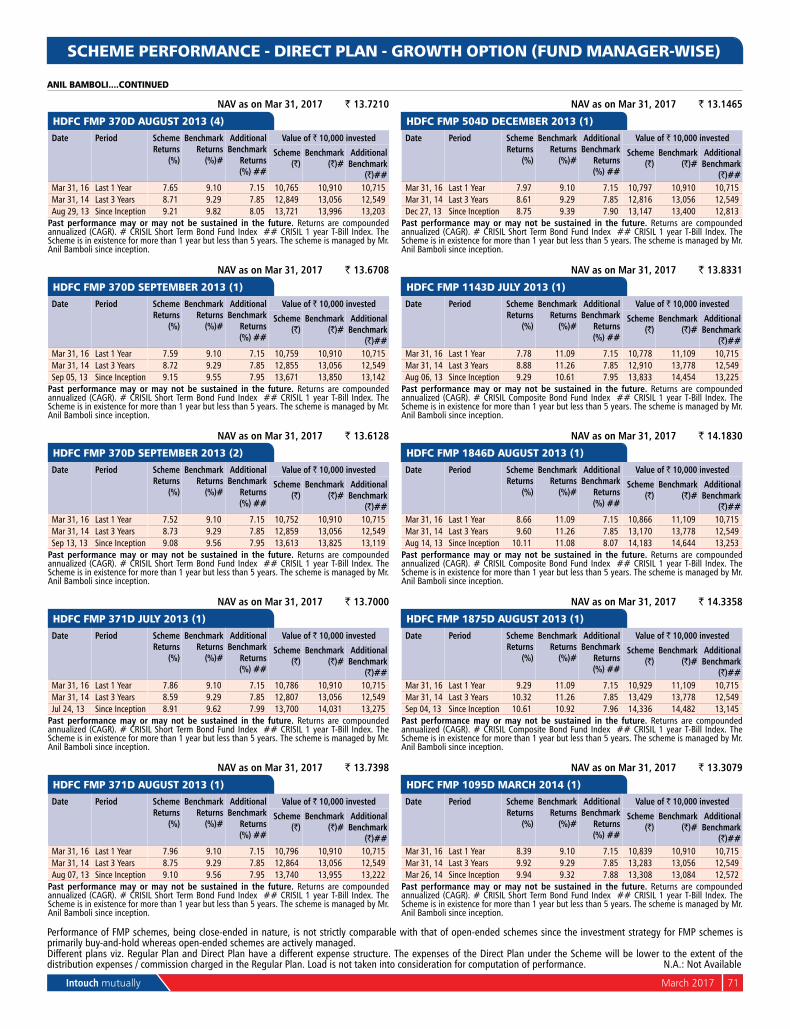
Intouch mutually March 2017 71
ANIL BAMBOLI....CONTINUED
Different plans viz. Regular Plan and Direct Plan have a different expense structure. The expenses of the Direct Plan under the Scheme will be lower to the extent of the distribution expenses / commission charged in the Regular Plan. Load is not taken into consideration for computation of performance. n.A.: not Available
SCHEME PERFORMANCE - DIRECT PLAN - GROWTH OPTION (FUND MANAGER-WISE)
NAV as on Mar 31, 2017 ` 13.7210
HDFC FMP 370D AUGUST 2013 (4) Date Period Scheme
Returns (%)
Benchmark Returns
(%)#
Additional Benchmark
Returns (%) ##
Value of ` 10,000 invested
Scheme (`)
Benchmark (`)#
Additional Benchmark
(`)##Mar 31, 16 Last 1 Year 7.65 9.10 7.15 10,765 10,910 10,715Mar 31, 14 Last 3 Years 8.71 9.29 7.85 12,849 13,056 12,549Aug 29, 13 Since Inception 9.21 9.82 8.05 13,721 13,996 13,203
Past performance may or may not be sustained in the future. Returns are compounded annualized (CAGR). # CRISIL Short Term Bond Fund Index ## CRISIL 1 year T-Bill Index. The Scheme is in existence for more than 1 year but less than 5 years. The scheme is managed by Mr. Anil Bamboli since inception.
NAV as on Mar 31, 2017 ` 13.6708
HDFC FMP 370D SEPTEMBER 2013 (1) Date Period Scheme
Returns (%)
Benchmark Returns
(%)#
Additional Benchmark
Returns (%) ##
Value of ` 10,000 invested
Scheme (`)
Benchmark (`)#
Additional Benchmark
(`)##Mar 31, 16 Last 1 Year 7.59 9.10 7.15 10,759 10,910 10,715Mar 31, 14 Last 3 Years 8.72 9.29 7.85 12,855 13,056 12,549Sep 05, 13 Since Inception 9.15 9.55 7.95 13,671 13,850 13,142
Past performance may or may not be sustained in the future. Returns are compounded annualized (CAGR). # CRISIL Short Term Bond Fund Index ## CRISIL 1 year T-Bill Index. The Scheme is in existence for more than 1 year but less than 5 years. The scheme is managed by Mr. Anil Bamboli since inception.
NAV as on Mar 31, 2017 ` 13.6128
HDFC FMP 370D SEPTEMBER 2013 (2) Date Period Scheme
Returns (%)
Benchmark Returns
(%)#
Additional Benchmark
Returns (%) ##
Value of ` 10,000 invested
Scheme (`)
Benchmark (`)#
Additional Benchmark
(`)##Mar 31, 16 Last 1 Year 7.52 9.10 7.15 10,752 10,910 10,715Mar 31, 14 Last 3 Years 8.73 9.29 7.85 12,859 13,056 12,549Sep 13, 13 Since Inception 9.08 9.56 7.95 13,613 13,825 13,119
Past performance may or may not be sustained in the future. Returns are compounded annualized (CAGR). # CRISIL Short Term Bond Fund Index ## CRISIL 1 year T-Bill Index. The Scheme is in existence for more than 1 year but less than 5 years. The scheme is managed by Mr. Anil Bamboli since inception.
NAV as on Mar 31, 2017 ` 13.7000
HDFC FMP 371D JULY 2013 (1) Date Period Scheme
Returns (%)
Benchmark Returns
(%)#
Additional Benchmark
Returns (%) ##
Value of ` 10,000 invested
Scheme (`)
Benchmark (`)#
Additional Benchmark
(`)##Mar 31, 16 Last 1 Year 7.86 9.10 7.15 10,786 10,910 10,715Mar 31, 14 Last 3 Years 8.59 9.29 7.85 12,807 13,056 12,549Jul 24, 13 Since Inception 8.91 9.62 7.99 13,700 14,031 13,275
Past performance may or may not be sustained in the future. Returns are compounded annualized (CAGR). # CRISIL Short Term Bond Fund Index ## CRISIL 1 year T-Bill Index. The Scheme is in existence for more than 1 year but less than 5 years. The scheme is managed by Mr. Anil Bamboli since inception.
NAV as on Mar 31, 2017 ` 13.7398
HDFC FMP 371D AUGUST 2013 (1) Date Period Scheme
Returns (%)
Benchmark Returns
(%)#
Additional Benchmark
Returns (%) ##
Value of ` 10,000 invested
Scheme (`)
Benchmark (`)#
Additional Benchmark
(`)##Mar 31, 16 Last 1 Year 7.96 9.10 7.15 10,796 10,910 10,715Mar 31, 14 Last 3 Years 8.75 9.29 7.85 12,864 13,056 12,549Aug 07, 13 Since Inception 9.10 9.56 7.95 13,740 13,955 13,222
Past performance may or may not be sustained in the future. Returns are compounded annualized (CAGR). # CRISIL Short Term Bond Fund Index ## CRISIL 1 year T-Bill Index. The Scheme is in existence for more than 1 year but less than 5 years. The scheme is managed by Mr. Anil Bamboli since inception.
NAV as on Mar 31, 2017 ` 13.1465
HDFC FMP 504D DECEMBER 2013 (1) Date Period Scheme
Returns (%)
Benchmark Returns
(%)#
Additional Benchmark
Returns (%) ##
Value of ` 10,000 invested
Scheme (`)
Benchmark (`)#
Additional Benchmark
(`)##Mar 31, 16 Last 1 Year 7.97 9.10 7.15 10,797 10,910 10,715Mar 31, 14 Last 3 Years 8.61 9.29 7.85 12,816 13,056 12,549Dec 27, 13 Since Inception 8.75 9.39 7.90 13,147 13,400 12,813
Past performance may or may not be sustained in the future. Returns are compounded annualized (CAGR). # CRISIL Short Term Bond Fund Index ## CRISIL 1 year T-Bill Index. The Scheme is in existence for more than 1 year but less than 5 years. The scheme is managed by Mr. Anil Bamboli since inception.
NAV as on Mar 31, 2017 ` 13.8331
HDFC FMP 1143D JULY 2013 (1) Date Period Scheme
Returns (%)
Benchmark Returns
(%)#
Additional Benchmark
Returns (%) ##
Value of ` 10,000 invested
Scheme (`)
Benchmark (`)#
Additional Benchmark
(`)##Mar 31, 16 Last 1 Year 7.78 11.09 7.15 10,778 11,109 10,715Mar 31, 14 Last 3 Years 8.88 11.26 7.85 12,910 13,778 12,549Aug 06, 13 Since Inception 9.29 10.61 7.95 13,833 14,454 13,225
Past performance may or may not be sustained in the future. Returns are compounded annualized (CAGR). # CRISIL Composite Bond Fund Index ## CRISIL 1 year T-Bill Index. The Scheme is in existence for more than 1 year but less than 5 years. The scheme is managed by Mr. Anil Bamboli since inception.
NAV as on Mar 31, 2017 ` 14.1830
HDFC FMP 1846D AUGUST 2013 (1) Date Period Scheme
Returns (%)
Benchmark Returns
(%)#
Additional Benchmark
Returns (%) ##
Value of ` 10,000 invested
Scheme (`)
Benchmark (`)#
Additional Benchmark
(`)##Mar 31, 16 Last 1 Year 8.66 11.09 7.15 10,866 11,109 10,715Mar 31, 14 Last 3 Years 9.60 11.26 7.85 13,170 13,778 12,549Aug 14, 13 Since Inception 10.11 11.08 8.07 14,183 14,644 13,253
Past performance may or may not be sustained in the future. Returns are compounded annualized (CAGR). # CRISIL Composite Bond Fund Index ## CRISIL 1 year T-Bill Index. The Scheme is in existence for more than 1 year but less than 5 years. The scheme is managed by Mr. Anil Bamboli since inception.
NAV as on Mar 31, 2017 ` 14.3358
HDFC FMP 1875D AUGUST 2013 (1) Date Period Scheme
Returns (%)
Benchmark Returns
(%)#
Additional Benchmark
Returns (%) ##
Value of ` 10,000 invested
Scheme (`)
Benchmark (`)#
Additional Benchmark
(`)##Mar 31, 16 Last 1 Year 9.29 11.09 7.15 10,929 11,109 10,715Mar 31, 14 Last 3 Years 10.32 11.26 7.85 13,429 13,778 12,549Sep 04, 13 Since Inception 10.61 10.92 7.96 14,336 14,482 13,145
Past performance may or may not be sustained in the future. Returns are compounded annualized (CAGR). # CRISIL Composite Bond Fund Index ## CRISIL 1 year T-Bill Index. The Scheme is in existence for more than 1 year but less than 5 years. The scheme is managed by Mr. Anil Bamboli since inception.
NAV as on Mar 31, 2017 ` 13.3079
HDFC FMP 1095D MARCH 2014 (1) Date Period Scheme
Returns (%)
Benchmark Returns
(%)#
Additional Benchmark
Returns (%) ##
Value of ` 10,000 invested
Scheme (`)
Benchmark (`)#
Additional Benchmark
(`)##Mar 31, 16 Last 1 Year 8.39 9.10 7.15 10,839 10,910 10,715Mar 31, 14 Last 3 Years 9.92 9.29 7.85 13,283 13,056 12,549Mar 26, 14 Since Inception 9.94 9.32 7.88 13,308 13,084 12,572
Past performance may or may not be sustained in the future. Returns are compounded annualized (CAGR). # CRISIL Short Term Bond Fund Index ## CRISIL 1 year T-Bill Index. The Scheme is in existence for more than 1 year but less than 5 years. The scheme is managed by Mr. Anil Bamboli since inception.
Performance of FMP schemes, being close-ended in nature, is not strictly comparable with that of open-ended schemes since the investment strategy for FMP schemes is primarily buy-and-hold whereas open-ended schemes are actively managed.
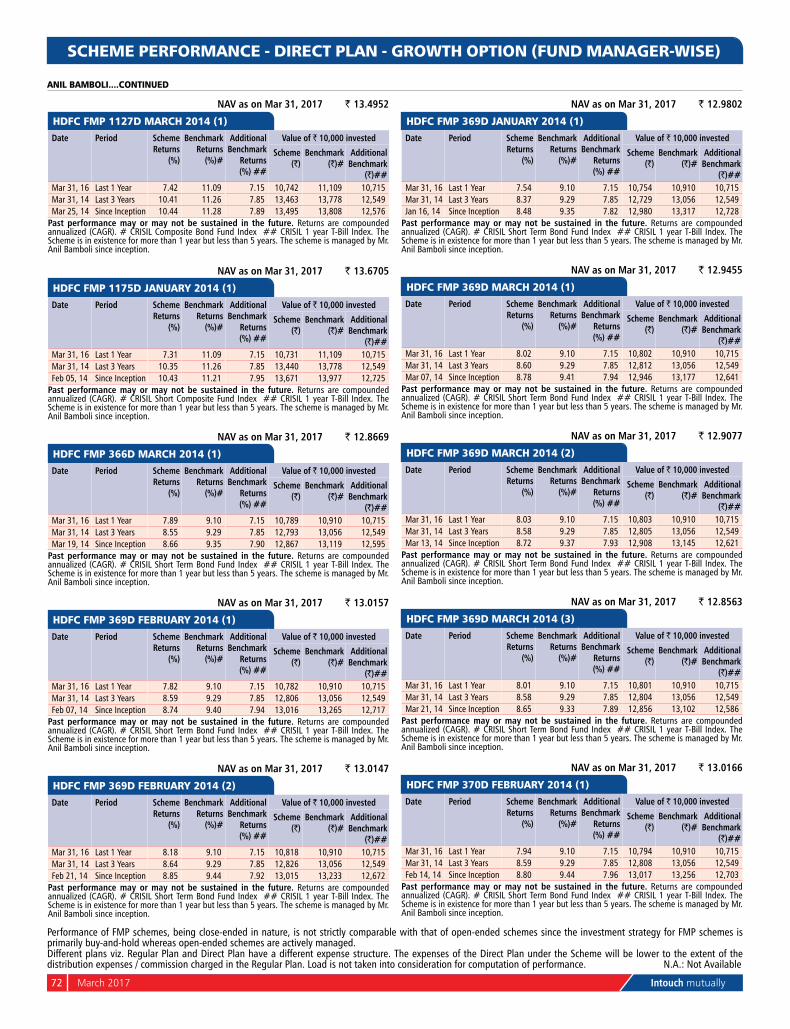
72 March 2017 Intouch mutually
SCHEME PERFORMANCE - DIRECT PLAN - GROWTH OPTION (FUND MANAGER-WISE)
ANIL BAMBOLI....CONTINUED
Different plans viz. Regular Plan and Direct Plan have a different expense structure. The expenses of the Direct Plan under the Scheme will be lower to the extent of the distribution expenses / commission charged in the Regular Plan. Load is not taken into consideration for computation of performance. n.A.: not Available
NAV as on Mar 31, 2017 ` 13.4952
HDFC FMP 1127D MARCH 2014 (1) Date Period Scheme
Returns (%)
Benchmark Returns
(%)#
Additional Benchmark
Returns (%) ##
Value of ` 10,000 invested
Scheme (`)
Benchmark (`)#
Additional Benchmark
(`)##Mar 31, 16 Last 1 Year 7.42 11.09 7.15 10,742 11,109 10,715Mar 31, 14 Last 3 Years 10.41 11.26 7.85 13,463 13,778 12,549Mar 25, 14 Since Inception 10.44 11.28 7.89 13,495 13,808 12,576
Past performance may or may not be sustained in the future. Returns are compounded annualized (CAGR). # CRISIL Composite Bond Fund Index ## CRISIL 1 year T-Bill Index. The Scheme is in existence for more than 1 year but less than 5 years. The scheme is managed by Mr. Anil Bamboli since inception.
NAV as on Mar 31, 2017 ` 13.6705
HDFC FMP 1175D JANUARY 2014 (1) Date Period Scheme
Returns (%)
Benchmark Returns
(%)#
Additional Benchmark
Returns (%) ##
Value of ` 10,000 invested
Scheme (`)
Benchmark (`)#
Additional Benchmark
(`)##Mar 31, 16 Last 1 Year 7.31 11.09 7.15 10,731 11,109 10,715Mar 31, 14 Last 3 Years 10.35 11.26 7.85 13,440 13,778 12,549Feb 05, 14 Since Inception 10.43 11.21 7.95 13,671 13,977 12,725
Past performance may or may not be sustained in the future. Returns are compounded annualized (CAGR). # CRISIL Short Composite Fund Index ## CRISIL 1 year T-Bill Index. The Scheme is in existence for more than 1 year but less than 5 years. The scheme is managed by Mr. Anil Bamboli since inception.
NAV as on Mar 31, 2017 ` 12.8669
HDFC FMP 366D MARCH 2014 (1) Date Period Scheme
Returns (%)
Benchmark Returns
(%)#
Additional Benchmark
Returns (%) ##
Value of ` 10,000 invested
Scheme (`)
Benchmark (`)#
Additional Benchmark
(`)##Mar 31, 16 Last 1 Year 7.89 9.10 7.15 10,789 10,910 10,715Mar 31, 14 Last 3 Years 8.55 9.29 7.85 12,793 13,056 12,549Mar 19, 14 Since Inception 8.66 9.35 7.90 12,867 13,119 12,595
Past performance may or may not be sustained in the future. Returns are compounded annualized (CAGR). # CRISIL Short Term Bond Fund Index ## CRISIL 1 year T-Bill Index. The Scheme is in existence for more than 1 year but less than 5 years. The scheme is managed by Mr. Anil Bamboli since inception.
NAV as on Mar 31, 2017 ` 13.0157
HDFC FMP 369D FEBRUARY 2014 (1) Date Period Scheme
Returns (%)
Benchmark Returns
(%)#
Additional Benchmark
Returns (%) ##
Value of ` 10,000 invested
Scheme (`)
Benchmark (`)#
Additional Benchmark
(`)##Mar 31, 16 Last 1 Year 7.82 9.10 7.15 10,782 10,910 10,715Mar 31, 14 Last 3 Years 8.59 9.29 7.85 12,806 13,056 12,549Feb 07, 14 Since Inception 8.74 9.40 7.94 13,016 13,265 12,717
Past performance may or may not be sustained in the future. Returns are compounded annualized (CAGR). # CRISIL Short Term Bond Fund Index ## CRISIL 1 year T-Bill Index. The Scheme is in existence for more than 1 year but less than 5 years. The scheme is managed by Mr. Anil Bamboli since inception.
NAV as on Mar 31, 2017 ` 13.0147
HDFC FMP 369D FEBRUARY 2014 (2) Date Period Scheme
Returns (%)
Benchmark Returns
(%)#
Additional Benchmark
Returns (%) ##
Value of ` 10,000 invested
Scheme (`)
Benchmark (`)#
Additional Benchmark
(`)##Mar 31, 16 Last 1 Year 8.18 9.10 7.15 10,818 10,910 10,715Mar 31, 14 Last 3 Years 8.64 9.29 7.85 12,826 13,056 12,549Feb 21, 14 Since Inception 8.85 9.44 7.92 13,015 13,233 12,672
Past performance may or may not be sustained in the future. Returns are compounded annualized (CAGR). # CRISIL Short Term Bond Fund Index ## CRISIL 1 year T-Bill Index. The Scheme is in existence for more than 1 year but less than 5 years. The scheme is managed by Mr. Anil Bamboli since inception.
NAV as on Mar 31, 2017 ` 12.9802
HDFC FMP 369D JANUARY 2014 (1) Date Period Scheme
Returns (%)
Benchmark Returns
(%)#
Additional Benchmark
Returns (%) ##
Value of ` 10,000 invested
Scheme (`)
Benchmark (`)#
Additional Benchmark
(`)##Mar 31, 16 Last 1 Year 7.54 9.10 7.15 10,754 10,910 10,715Mar 31, 14 Last 3 Years 8.37 9.29 7.85 12,729 13,056 12,549Jan 16, 14 Since Inception 8.48 9.35 7.82 12,980 13,317 12,728
Past performance may or may not be sustained in the future. Returns are compounded annualized (CAGR). # CRISIL Short Term Bond Fund Index ## CRISIL 1 year T-Bill Index. The Scheme is in existence for more than 1 year but less than 5 years. The scheme is managed by Mr. Anil Bamboli since inception.
NAV as on Mar 31, 2017 ` 12.9455
HDFC FMP 369D MARCH 2014 (1) Date Period Scheme
Returns (%)
Benchmark Returns
(%)#
Additional Benchmark
Returns (%) ##
Value of ` 10,000 invested
Scheme (`)
Benchmark (`)#
Additional Benchmark
(`)##Mar 31, 16 Last 1 Year 8.02 9.10 7.15 10,802 10,910 10,715Mar 31, 14 Last 3 Years 8.60 9.29 7.85 12,812 13,056 12,549Mar 07, 14 Since Inception 8.78 9.41 7.94 12,946 13,177 12,641
Past performance may or may not be sustained in the future. Returns are compounded annualized (CAGR). # CRISIL Short Term Bond Fund Index ## CRISIL 1 year T-Bill Index. The Scheme is in existence for more than 1 year but less than 5 years. The scheme is managed by Mr. Anil Bamboli since inception.
NAV as on Mar 31, 2017 ` 12.9077
HDFC FMP 369D MARCH 2014 (2) Date Period Scheme
Returns (%)
Benchmark Returns
(%)#
Additional Benchmark
Returns (%) ##
Value of ` 10,000 invested
Scheme (`)
Benchmark (`)#
Additional Benchmark
(`)##Mar 31, 16 Last 1 Year 8.03 9.10 7.15 10,803 10,910 10,715Mar 31, 14 Last 3 Years 8.58 9.29 7.85 12,805 13,056 12,549Mar 13, 14 Since Inception 8.72 9.37 7.93 12,908 13,145 12,621
Past performance may or may not be sustained in the future. Returns are compounded annualized (CAGR). # CRISIL Short Term Bond Fund Index ## CRISIL 1 year T-Bill Index. The Scheme is in existence for more than 1 year but less than 5 years. The scheme is managed by Mr. Anil Bamboli since inception.
NAV as on Mar 31, 2017 ` 12.8563
HDFC FMP 369D MARCH 2014 (3) Date Period Scheme
Returns (%)
Benchmark Returns
(%)#
Additional Benchmark
Returns (%) ##
Value of ` 10,000 invested
Scheme (`)
Benchmark (`)#
Additional Benchmark
(`)##Mar 31, 16 Last 1 Year 8.01 9.10 7.15 10,801 10,910 10,715Mar 31, 14 Last 3 Years 8.58 9.29 7.85 12,804 13,056 12,549Mar 21, 14 Since Inception 8.65 9.33 7.89 12,856 13,102 12,586
Past performance may or may not be sustained in the future. Returns are compounded annualized (CAGR). # CRISIL Short Term Bond Fund Index ## CRISIL 1 year T-Bill Index. The Scheme is in existence for more than 1 year but less than 5 years. The scheme is managed by Mr. Anil Bamboli since inception.
NAV as on Mar 31, 2017 ` 13.0166
HDFC FMP 370D FEBRUARY 2014 (1) Date Period Scheme
Returns (%)
Benchmark Returns
(%)#
Additional Benchmark
Returns (%) ##
Value of ` 10,000 invested
Scheme (`)
Benchmark (`)#
Additional Benchmark
(`)##Mar 31, 16 Last 1 Year 7.94 9.10 7.15 10,794 10,910 10,715Mar 31, 14 Last 3 Years 8.59 9.29 7.85 12,808 13,056 12,549Feb 14, 14 Since Inception 8.80 9.44 7.96 13,017 13,256 12,703
Past performance may or may not be sustained in the future. Returns are compounded annualized (CAGR). # CRISIL Short Term Bond Fund Index ## CRISIL 1 year T-Bill Index. The Scheme is in existence for more than 1 year but less than 5 years. The scheme is managed by Mr. Anil Bamboli since inception.
Performance of FMP schemes, being close-ended in nature, is not strictly comparable with that of open-ended schemes since the investment strategy for FMP schemes is primarily buy-and-hold whereas open-ended schemes are actively managed.
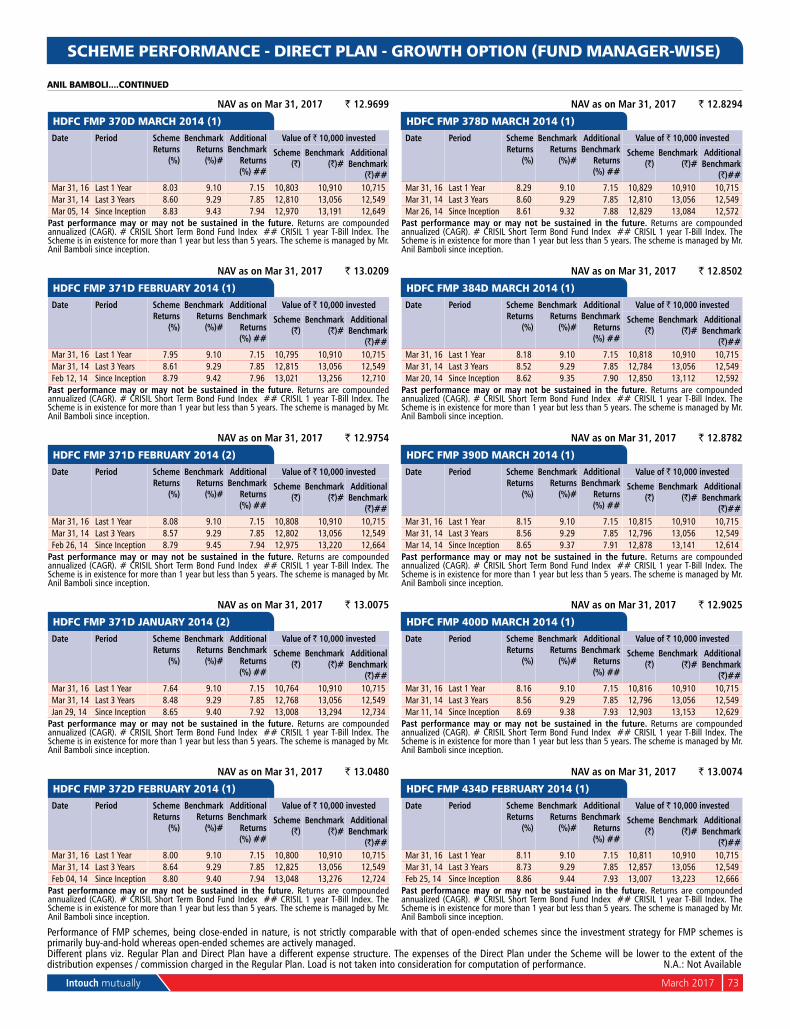
Intouch mutually March 2017 73
ANIL BAMBOLI....CONTINUED
Different plans viz. Regular Plan and Direct Plan have a different expense structure. The expenses of the Direct Plan under the Scheme will be lower to the extent of the distribution expenses / commission charged in the Regular Plan. Load is not taken into consideration for computation of performance. n.A.: not Available
SCHEME PERFORMANCE - DIRECT PLAN - GROWTH OPTION (FUND MANAGER-WISE)
NAV as on Mar 31, 2017 ` 12.9699
HDFC FMP 370D MARCH 2014 (1) Date Period Scheme
Returns (%)
Benchmark Returns
(%)#
Additional Benchmark
Returns (%) ##
Value of ` 10,000 invested
Scheme (`)
Benchmark (`)#
Additional Benchmark
(`)##Mar 31, 16 Last 1 Year 8.03 9.10 7.15 10,803 10,910 10,715Mar 31, 14 Last 3 Years 8.60 9.29 7.85 12,810 13,056 12,549Mar 05, 14 Since Inception 8.83 9.43 7.94 12,970 13,191 12,649
Past performance may or may not be sustained in the future. Returns are compounded annualized (CAGR). # CRISIL Short Term Bond Fund Index ## CRISIL 1 year T-Bill Index. The Scheme is in existence for more than 1 year but less than 5 years. The scheme is managed by Mr. Anil Bamboli since inception.
NAV as on Mar 31, 2017 ` 13.0209
HDFC FMP 371D FEBRUARY 2014 (1) Date Period Scheme
Returns (%)
Benchmark Returns
(%)#
Additional Benchmark
Returns (%) ##
Value of ` 10,000 invested
Scheme (`)
Benchmark (`)#
Additional Benchmark
(`)##Mar 31, 16 Last 1 Year 7.95 9.10 7.15 10,795 10,910 10,715Mar 31, 14 Last 3 Years 8.61 9.29 7.85 12,815 13,056 12,549Feb 12, 14 Since Inception 8.79 9.42 7.96 13,021 13,256 12,710
Past performance may or may not be sustained in the future. Returns are compounded annualized (CAGR). # CRISIL Short Term Bond Fund Index ## CRISIL 1 year T-Bill Index. The Scheme is in existence for more than 1 year but less than 5 years. The scheme is managed by Mr. Anil Bamboli since inception.
NAV as on Mar 31, 2017 ` 12.9754
HDFC FMP 371D FEBRUARY 2014 (2) Date Period Scheme
Returns (%)
Benchmark Returns
(%)#
Additional Benchmark
Returns (%) ##
Value of ` 10,000 invested
Scheme (`)
Benchmark (`)#
Additional Benchmark
(`)##Mar 31, 16 Last 1 Year 8.08 9.10 7.15 10,808 10,910 10,715Mar 31, 14 Last 3 Years 8.57 9.29 7.85 12,802 13,056 12,549Feb 26, 14 Since Inception 8.79 9.45 7.94 12,975 13,220 12,664
Past performance may or may not be sustained in the future. Returns are compounded annualized (CAGR). # CRISIL Short Term Bond Fund Index ## CRISIL 1 year T-Bill Index. The Scheme is in existence for more than 1 year but less than 5 years. The scheme is managed by Mr. Anil Bamboli since inception.
NAV as on Mar 31, 2017 ` 13.0075
HDFC FMP 371D JANUARY 2014 (2) Date Period Scheme
Returns (%)
Benchmark Returns
(%)#
Additional Benchmark
Returns (%) ##
Value of ` 10,000 invested
Scheme (`)
Benchmark (`)#
Additional Benchmark
(`)##Mar 31, 16 Last 1 Year 7.64 9.10 7.15 10,764 10,910 10,715Mar 31, 14 Last 3 Years 8.48 9.29 7.85 12,768 13,056 12,549Jan 29, 14 Since Inception 8.65 9.40 7.92 13,008 13,294 12,734
Past performance may or may not be sustained in the future. Returns are compounded annualized (CAGR). # CRISIL Short Term Bond Fund Index ## CRISIL 1 year T-Bill Index. The Scheme is in existence for more than 1 year but less than 5 years. The scheme is managed by Mr. Anil Bamboli since inception.
NAV as on Mar 31, 2017 ` 13.0480
HDFC FMP 372D FEBRUARY 2014 (1) Date Period Scheme
Returns (%)
Benchmark Returns
(%)#
Additional Benchmark
Returns (%) ##
Value of ` 10,000 invested
Scheme (`)
Benchmark (`)#
Additional Benchmark
(`)##Mar 31, 16 Last 1 Year 8.00 9.10 7.15 10,800 10,910 10,715Mar 31, 14 Last 3 Years 8.64 9.29 7.85 12,825 13,056 12,549Feb 04, 14 Since Inception 8.80 9.40 7.94 13,048 13,276 12,724
Past performance may or may not be sustained in the future. Returns are compounded annualized (CAGR). # CRISIL Short Term Bond Fund Index ## CRISIL 1 year T-Bill Index. The Scheme is in existence for more than 1 year but less than 5 years. The scheme is managed by Mr. Anil Bamboli since inception.
NAV as on Mar 31, 2017 ` 12.8294
HDFC FMP 378D MARCH 2014 (1) Date Period Scheme
Returns (%)
Benchmark Returns
(%)#
Additional Benchmark
Returns (%) ##
Value of ` 10,000 invested
Scheme (`)
Benchmark (`)#
Additional Benchmark
(`)##Mar 31, 16 Last 1 Year 8.29 9.10 7.15 10,829 10,910 10,715Mar 31, 14 Last 3 Years 8.60 9.29 7.85 12,810 13,056 12,549Mar 26, 14 Since Inception 8.61 9.32 7.88 12,829 13,084 12,572
Past performance may or may not be sustained in the future. Returns are compounded annualized (CAGR). # CRISIL Short Term Bond Fund Index ## CRISIL 1 year T-Bill Index. The Scheme is in existence for more than 1 year but less than 5 years. The scheme is managed by Mr. Anil Bamboli since inception.
NAV as on Mar 31, 2017 ` 12.8502
HDFC FMP 384D MARCH 2014 (1) Date Period Scheme
Returns (%)
Benchmark Returns
(%)#
Additional Benchmark
Returns (%) ##
Value of ` 10,000 invested
Scheme (`)
Benchmark (`)#
Additional Benchmark
(`)##Mar 31, 16 Last 1 Year 8.18 9.10 7.15 10,818 10,910 10,715Mar 31, 14 Last 3 Years 8.52 9.29 7.85 12,784 13,056 12,549Mar 20, 14 Since Inception 8.62 9.35 7.90 12,850 13,112 12,592
Past performance may or may not be sustained in the future. Returns are compounded annualized (CAGR). # CRISIL Short Term Bond Fund Index ## CRISIL 1 year T-Bill Index. The Scheme is in existence for more than 1 year but less than 5 years. The scheme is managed by Mr. Anil Bamboli since inception.
NAV as on Mar 31, 2017 ` 12.8782
HDFC FMP 390D MARCH 2014 (1) Date Period Scheme
Returns (%)
Benchmark Returns
(%)#
Additional Benchmark
Returns (%) ##
Value of ` 10,000 invested
Scheme (`)
Benchmark (`)#
Additional Benchmark
(`)##Mar 31, 16 Last 1 Year 8.15 9.10 7.15 10,815 10,910 10,715Mar 31, 14 Last 3 Years 8.56 9.29 7.85 12,796 13,056 12,549Mar 14, 14 Since Inception 8.65 9.37 7.91 12,878 13,141 12,614
Past performance may or may not be sustained in the future. Returns are compounded annualized (CAGR). # CRISIL Short Term Bond Fund Index ## CRISIL 1 year T-Bill Index. The Scheme is in existence for more than 1 year but less than 5 years. The scheme is managed by Mr. Anil Bamboli since inception.
NAV as on Mar 31, 2017 ` 12.9025
HDFC FMP 400D MARCH 2014 (1) Date Period Scheme
Returns (%)
Benchmark Returns
(%)#
Additional Benchmark
Returns (%) ##
Value of ` 10,000 invested
Scheme (`)
Benchmark (`)#
Additional Benchmark
(`)##Mar 31, 16 Last 1 Year 8.16 9.10 7.15 10,816 10,910 10,715Mar 31, 14 Last 3 Years 8.56 9.29 7.85 12,796 13,056 12,549Mar 11, 14 Since Inception 8.69 9.38 7.93 12,903 13,153 12,629
Past performance may or may not be sustained in the future. Returns are compounded annualized (CAGR). # CRISIL Short Term Bond Fund Index ## CRISIL 1 year T-Bill Index. The Scheme is in existence for more than 1 year but less than 5 years. The scheme is managed by Mr. Anil Bamboli since inception.
NAV as on Mar 31, 2017 ` 13.0074
HDFC FMP 434D FEBRUARY 2014 (1) Date Period Scheme
Returns (%)
Benchmark Returns
(%)#
Additional Benchmark
Returns (%) ##
Value of ` 10,000 invested
Scheme (`)
Benchmark (`)#
Additional Benchmark
(`)##Mar 31, 16 Last 1 Year 8.11 9.10 7.15 10,811 10,910 10,715Mar 31, 14 Last 3 Years 8.73 9.29 7.85 12,857 13,056 12,549Feb 25, 14 Since Inception 8.86 9.44 7.93 13,007 13,223 12,666
Past performance may or may not be sustained in the future. Returns are compounded annualized (CAGR). # CRISIL Short Term Bond Fund Index ## CRISIL 1 year T-Bill Index. The Scheme is in existence for more than 1 year but less than 5 years. The scheme is managed by Mr. Anil Bamboli since inception.
Performance of FMP schemes, being close-ended in nature, is not strictly comparable with that of open-ended schemes since the investment strategy for FMP schemes is primarily buy-and-hold whereas open-ended schemes are actively managed.
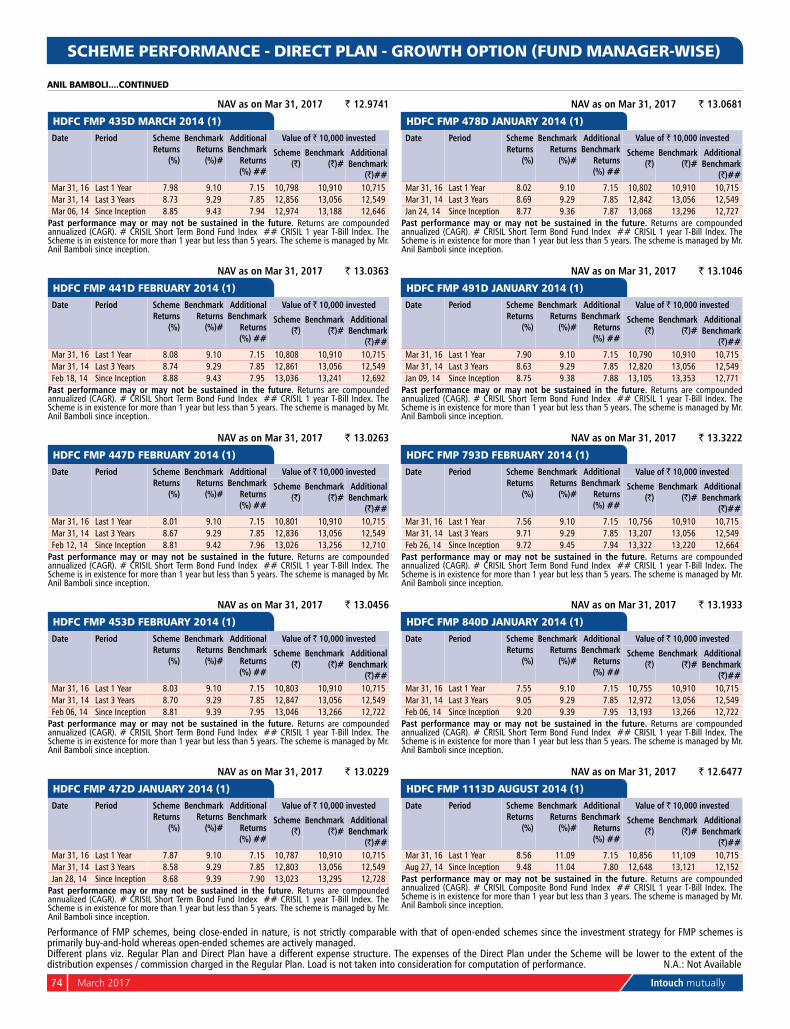
74 March 2017 Intouch mutually
SCHEME PERFORMANCE - DIRECT PLAN - GROWTH OPTION (FUND MANAGER-WISE)
Different plans viz. Regular Plan and Direct Plan have a different expense structure. The expenses of the Direct Plan under the Scheme will be lower to the extent of the distribution expenses / commission charged in the Regular Plan. Load is not taken into consideration for computation of performance. n.A.: not Available
NAV as on Mar 31, 2017 ` 12.9741
HDFC FMP 435D MARCH 2014 (1) Date Period Scheme
Returns (%)
Benchmark Returns
(%)#
Additional Benchmark
Returns (%) ##
Value of ` 10,000 invested
Scheme (`)
Benchmark (`)#
Additional Benchmark
(`)##Mar 31, 16 Last 1 Year 7.98 9.10 7.15 10,798 10,910 10,715Mar 31, 14 Last 3 Years 8.73 9.29 7.85 12,856 13,056 12,549Mar 06, 14 Since Inception 8.85 9.43 7.94 12,974 13,188 12,646
Past performance may or may not be sustained in the future. Returns are compounded annualized (CAGR). # CRISIL Short Term Bond Fund Index ## CRISIL 1 year T-Bill Index. The Scheme is in existence for more than 1 year but less than 5 years. The scheme is managed by Mr. Anil Bamboli since inception.
NAV as on Mar 31, 2017 ` 13.0363
HDFC FMP 441D FEBRUARY 2014 (1) Date Period Scheme
Returns (%)
Benchmark Returns
(%)#
Additional Benchmark
Returns (%) ##
Value of ` 10,000 invested
Scheme (`)
Benchmark (`)#
Additional Benchmark
(`)##Mar 31, 16 Last 1 Year 8.08 9.10 7.15 10,808 10,910 10,715Mar 31, 14 Last 3 Years 8.74 9.29 7.85 12,861 13,056 12,549Feb 18, 14 Since Inception 8.88 9.43 7.95 13,036 13,241 12,692
Past performance may or may not be sustained in the future. Returns are compounded annualized (CAGR). # CRISIL Short Term Bond Fund Index ## CRISIL 1 year T-Bill Index. The Scheme is in existence for more than 1 year but less than 5 years. The scheme is managed by Mr. Anil Bamboli since inception.
NAV as on Mar 31, 2017 ` 13.0263
HDFC FMP 447D FEBRUARY 2014 (1) Date Period Scheme
Returns (%)
Benchmark Returns
(%)#
Additional Benchmark
Returns (%) ##
Value of ` 10,000 invested
Scheme (`)
Benchmark (`)#
Additional Benchmark
(`)##Mar 31, 16 Last 1 Year 8.01 9.10 7.15 10,801 10,910 10,715Mar 31, 14 Last 3 Years 8.67 9.29 7.85 12,836 13,056 12,549Feb 12, 14 Since Inception 8.81 9.42 7.96 13,026 13,256 12,710
Past performance may or may not be sustained in the future. Returns are compounded annualized (CAGR). # CRISIL Short Term Bond Fund Index ## CRISIL 1 year T-Bill Index. The Scheme is in existence for more than 1 year but less than 5 years. The scheme is managed by Mr. Anil Bamboli since inception.
NAV as on Mar 31, 2017 ` 13.0456
HDFC FMP 453D FEBRUARY 2014 (1) Date Period Scheme
Returns (%)
Benchmark Returns
(%)#
Additional Benchmark
Returns (%) ##
Value of ` 10,000 invested
Scheme (`)
Benchmark (`)#
Additional Benchmark
(`)##Mar 31, 16 Last 1 Year 8.03 9.10 7.15 10,803 10,910 10,715Mar 31, 14 Last 3 Years 8.70 9.29 7.85 12,847 13,056 12,549Feb 06, 14 Since Inception 8.81 9.39 7.95 13,046 13,266 12,722
Past performance may or may not be sustained in the future. Returns are compounded annualized (CAGR). # CRISIL Short Term Bond Fund Index ## CRISIL 1 year T-Bill Index. The Scheme is in existence for more than 1 year but less than 5 years. The scheme is managed by Mr. Anil Bamboli since inception.
NAV as on Mar 31, 2017 ` 13.0229
HDFC FMP 472D JANUARY 2014 (1) Date Period Scheme
Returns (%)
Benchmark Returns
(%)#
Additional Benchmark
Returns (%) ##
Value of ` 10,000 invested
Scheme (`)
Benchmark (`)#
Additional Benchmark
(`)##Mar 31, 16 Last 1 Year 7.87 9.10 7.15 10,787 10,910 10,715Mar 31, 14 Last 3 Years 8.58 9.29 7.85 12,803 13,056 12,549Jan 28, 14 Since Inception 8.68 9.39 7.90 13,023 13,295 12,728
Past performance may or may not be sustained in the future. Returns are compounded annualized (CAGR). # CRISIL Short Term Bond Fund Index ## CRISIL 1 year T-Bill Index. The Scheme is in existence for more than 1 year but less than 5 years. The scheme is managed by Mr. Anil Bamboli since inception.
NAV as on Mar 31, 2017 ` 13.0681
HDFC FMP 478D JANUARY 2014 (1) Date Period Scheme
Returns (%)
Benchmark Returns
(%)#
Additional Benchmark
Returns (%) ##
Value of ` 10,000 invested
Scheme (`)
Benchmark (`)#
Additional Benchmark
(`)##Mar 31, 16 Last 1 Year 8.02 9.10 7.15 10,802 10,910 10,715Mar 31, 14 Last 3 Years 8.69 9.29 7.85 12,842 13,056 12,549Jan 24, 14 Since Inception 8.77 9.36 7.87 13,068 13,296 12,727
Past performance may or may not be sustained in the future. Returns are compounded annualized (CAGR). # CRISIL Short Term Bond Fund Index ## CRISIL 1 year T-Bill Index. The Scheme is in existence for more than 1 year but less than 5 years. The scheme is managed by Mr. Anil Bamboli since inception.
NAV as on Mar 31, 2017 ` 13.1046
HDFC FMP 491D JANUARY 2014 (1) Date Period Scheme
Returns (%)
Benchmark Returns
(%)#
Additional Benchmark
Returns (%) ##
Value of ` 10,000 invested
Scheme (`)
Benchmark (`)#
Additional Benchmark
(`)##Mar 31, 16 Last 1 Year 7.90 9.10 7.15 10,790 10,910 10,715Mar 31, 14 Last 3 Years 8.63 9.29 7.85 12,820 13,056 12,549Jan 09, 14 Since Inception 8.75 9.38 7.88 13,105 13,353 12,771
Past performance may or may not be sustained in the future. Returns are compounded annualized (CAGR). # CRISIL Short Term Bond Fund Index ## CRISIL 1 year T-Bill Index. The Scheme is in existence for more than 1 year but less than 5 years. The scheme is managed by Mr. Anil Bamboli since inception.
NAV as on Mar 31, 2017 ` 13.3222
HDFC FMP 793D FEBRUARY 2014 (1) Date Period Scheme
Returns (%)
Benchmark Returns
(%)#
Additional Benchmark
Returns (%) ##
Value of ` 10,000 invested
Scheme (`)
Benchmark (`)#
Additional Benchmark
(`)##Mar 31, 16 Last 1 Year 7.56 9.10 7.15 10,756 10,910 10,715Mar 31, 14 Last 3 Years 9.71 9.29 7.85 13,207 13,056 12,549Feb 26, 14 Since Inception 9.72 9.45 7.94 13,322 13,220 12,664
Past performance may or may not be sustained in the future. Returns are compounded annualized (CAGR). # CRISIL Short Term Bond Fund Index ## CRISIL 1 year T-Bill Index. The Scheme is in existence for more than 1 year but less than 5 years. The scheme is managed by Mr. Anil Bamboli since inception.
NAV as on Mar 31, 2017 ` 13.1933
HDFC FMP 840D JANUARY 2014 (1) Date Period Scheme
Returns (%)
Benchmark Returns
(%)#
Additional Benchmark
Returns (%) ##
Value of ` 10,000 invested
Scheme (`)
Benchmark (`)#
Additional Benchmark
(`)##Mar 31, 16 Last 1 Year 7.55 9.10 7.15 10,755 10,910 10,715Mar 31, 14 Last 3 Years 9.05 9.29 7.85 12,972 13,056 12,549Feb 06, 14 Since Inception 9.20 9.39 7.95 13,193 13,266 12,722
Past performance may or may not be sustained in the future. Returns are compounded annualized (CAGR). # CRISIL Short Term Bond Fund Index ## CRISIL 1 year T-Bill Index. The Scheme is in existence for more than 1 year but less than 5 years. The scheme is managed by Mr. Anil Bamboli since inception.
NAV as on Mar 31, 2017 ` 12.6477
HDFC FMP 1113D AUGUST 2014 (1) Date Period Scheme
Returns (%)
Benchmark Returns
(%)#
Additional Benchmark
Returns (%) ##
Value of ` 10,000 invested
Scheme (`)
Benchmark (`)#
Additional Benchmark
(`)##Mar 31, 16 Last 1 Year 8.56 11.09 7.15 10,856 11,109 10,715Aug 27, 14 Since Inception 9.48 11.04 7.80 12,648 13,121 12,152
Past performance may or may not be sustained in the future. Returns are compounded annualized (CAGR). # CRISIL Composite Bond Fund Index ## CRISIL 1 year T-Bill Index. The Scheme is in existence for more than 1 year but less than 3 years. The scheme is managed by Mr. Anil Bamboli since inception.
Performance of FMP schemes, being close-ended in nature, is not strictly comparable with that of open-ended schemes since the investment strategy for FMP schemes is primarily buy-and-hold whereas open-ended schemes are actively managed.
ANIL BAMBOLI....CONTINUED
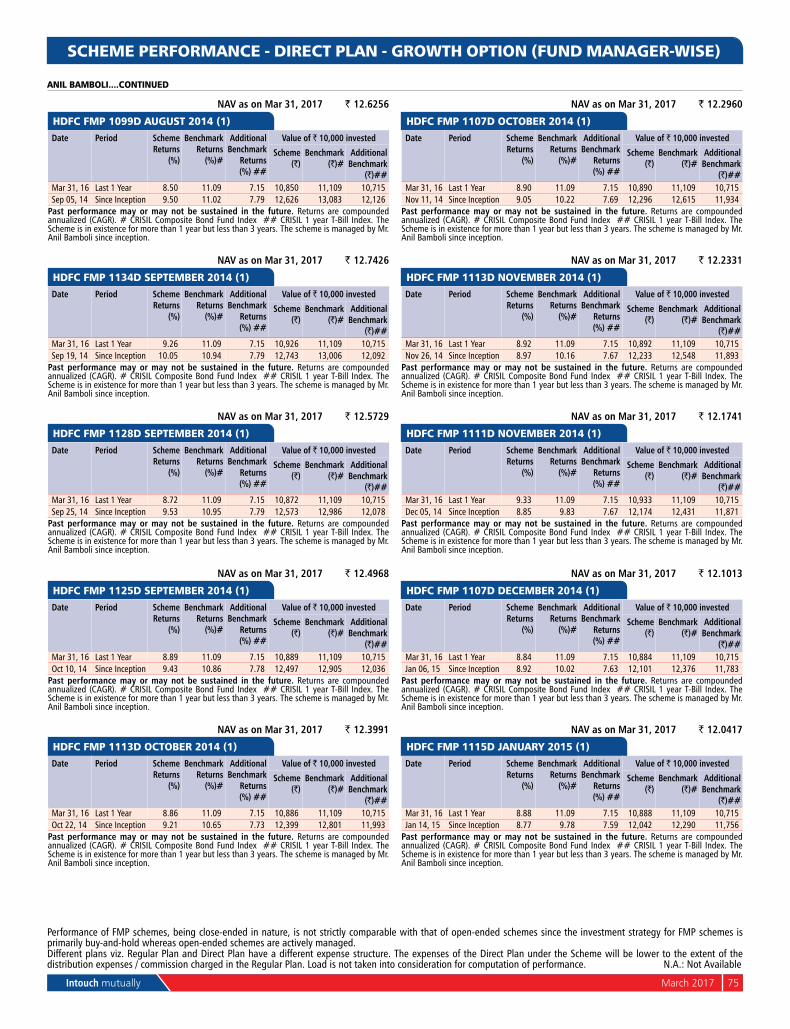
Intouch mutually March 2017 75
Different plans viz. Regular Plan and Direct Plan have a different expense structure. The expenses of the Direct Plan under the Scheme will be lower to the extent of the distribution expenses / commission charged in the Regular Plan. Load is not taken into consideration for computation of performance. n.A.: not Available
SCHEME PERFORMANCE - DIRECT PLAN - GROWTH OPTION (FUND MANAGER-WISE)
NAV as on Mar 31, 2017 ` 12.6256
HDFC FMP 1099D AUGUST 2014 (1) Date Period Scheme
Returns (%)
Benchmark Returns
(%)#
Additional Benchmark
Returns (%) ##
Value of ` 10,000 invested
Scheme (`)
Benchmark (`)#
Additional Benchmark
(`)##Mar 31, 16 Last 1 Year 8.50 11.09 7.15 10,850 11,109 10,715Sep 05, 14 Since Inception 9.50 11.02 7.79 12,626 13,083 12,126
Past performance may or may not be sustained in the future. Returns are compounded annualized (CAGR). # CRISIL Composite Bond Fund Index ## CRISIL 1 year T-Bill Index. The Scheme is in existence for more than 1 year but less than 3 years. The scheme is managed by Mr. Anil Bamboli since inception.
NAV as on Mar 31, 2017 ` 12.7426
HDFC FMP 1134D SEPTEMBER 2014 (1) Date Period Scheme
Returns (%)
Benchmark Returns
(%)#
Additional Benchmark
Returns (%) ##
Value of ` 10,000 invested
Scheme (`)
Benchmark (`)#
Additional Benchmark
(`)##Mar 31, 16 Last 1 Year 9.26 11.09 7.15 10,926 11,109 10,715Sep 19, 14 Since Inception 10.05 10.94 7.79 12,743 13,006 12,092
Past performance may or may not be sustained in the future. Returns are compounded annualized (CAGR). # CRISIL Composite Bond Fund Index ## CRISIL 1 year T-Bill Index. The Scheme is in existence for more than 1 year but less than 3 years. The scheme is managed by Mr. Anil Bamboli since inception.
NAV as on Mar 31, 2017 ` 12.5729
HDFC FMP 1128D SEPTEMBER 2014 (1) Date Period Scheme
Returns (%)
Benchmark Returns
(%)#
Additional Benchmark
Returns (%) ##
Value of ` 10,000 invested
Scheme (`)
Benchmark (`)#
Additional Benchmark
(`)##Mar 31, 16 Last 1 Year 8.72 11.09 7.15 10,872 11,109 10,715Sep 25, 14 Since Inception 9.53 10.95 7.79 12,573 12,986 12,078
Past performance may or may not be sustained in the future. Returns are compounded annualized (CAGR). # CRISIL Composite Bond Fund Index ## CRISIL 1 year T-Bill Index. The Scheme is in existence for more than 1 year but less than 3 years. The scheme is managed by Mr. Anil Bamboli since inception.
NAV as on Mar 31, 2017 ` 12.4968
HDFC FMP 1125D SEPTEMBER 2014 (1) Date Period Scheme
Returns (%)
Benchmark Returns
(%)#
Additional Benchmark
Returns (%) ##
Value of ` 10,000 invested
Scheme (`)
Benchmark (`)#
Additional Benchmark
(`)##Mar 31, 16 Last 1 Year 8.89 11.09 7.15 10,889 11,109 10,715Oct 10, 14 Since Inception 9.43 10.86 7.78 12,497 12,905 12,036
Past performance may or may not be sustained in the future. Returns are compounded annualized (CAGR). # CRISIL Composite Bond Fund Index ## CRISIL 1 year T-Bill Index. The Scheme is in existence for more than 1 year but less than 3 years. The scheme is managed by Mr. Anil Bamboli since inception.
NAV as on Mar 31, 2017 ` 12.3991
HDFC FMP 1113D OCTOBER 2014 (1) Date Period Scheme
Returns (%)
Benchmark Returns
(%)#
Additional Benchmark
Returns (%) ##
Value of ` 10,000 invested
Scheme (`)
Benchmark (`)#
Additional Benchmark
(`)##Mar 31, 16 Last 1 Year 8.86 11.09 7.15 10,886 11,109 10,715Oct 22, 14 Since Inception 9.21 10.65 7.73 12,399 12,801 11,993
Past performance may or may not be sustained in the future. Returns are compounded annualized (CAGR). # CRISIL Composite Bond Fund Index ## CRISIL 1 year T-Bill Index. The Scheme is in existence for more than 1 year but less than 3 years. The scheme is managed by Mr. Anil Bamboli since inception.
NAV as on Mar 31, 2017 ` 12.2960
HDFC FMP 1107D OCTOBER 2014 (1) Date Period Scheme
Returns (%)
Benchmark Returns
(%)#
Additional Benchmark
Returns (%) ##
Value of ` 10,000 invested
Scheme (`)
Benchmark (`)#
Additional Benchmark
(`)##Mar 31, 16 Last 1 Year 8.90 11.09 7.15 10,890 11,109 10,715nov 11, 14 Since Inception 9.05 10.22 7.69 12,296 12,615 11,934
Past performance may or may not be sustained in the future. Returns are compounded annualized (CAGR). # CRISIL Composite Bond Fund Index ## CRISIL 1 year T-Bill Index. The Scheme is in existence for more than 1 year but less than 3 years. The scheme is managed by Mr. Anil Bamboli since inception.
NAV as on Mar 31, 2017 ` 12.2331
HDFC FMP 1113D NOVEMBER 2014 (1) Date Period Scheme
Returns (%)
Benchmark Returns
(%)#
Additional Benchmark
Returns (%) ##
Value of ` 10,000 invested
Scheme (`)
Benchmark (`)#
Additional Benchmark
(`)##Mar 31, 16 Last 1 Year 8.92 11.09 7.15 10,892 11,109 10,715nov 26, 14 Since Inception 8.97 10.16 7.67 12,233 12,548 11,893
Past performance may or may not be sustained in the future. Returns are compounded annualized (CAGR). # CRISIL Composite Bond Fund Index ## CRISIL 1 year T-Bill Index. The Scheme is in existence for more than 1 year but less than 3 years. The scheme is managed by Mr. Anil Bamboli since inception.
NAV as on Mar 31, 2017 ` 12.1741
HDFC FMP 1111D NOVEMBER 2014 (1) Date Period Scheme
Returns (%)
Benchmark Returns
(%)#
Additional Benchmark
Returns (%) ##
Value of ` 10,000 invested
Scheme (`)
Benchmark (`)#
Additional Benchmark
(`)##Mar 31, 16 Last 1 Year 9.33 11.09 7.15 10,933 11,109 10,715Dec 05, 14 Since Inception 8.85 9.83 7.67 12,174 12,431 11,871
Past performance may or may not be sustained in the future. Returns are compounded annualized (CAGR). # CRISIL Composite Bond Fund Index ## CRISIL 1 year T-Bill Index. The Scheme is in existence for more than 1 year but less than 3 years. The scheme is managed by Mr. Anil Bamboli since inception.
NAV as on Mar 31, 2017 ` 12.1013
HDFC FMP 1107D DECEMBER 2014 (1) Date Period Scheme
Returns (%)
Benchmark Returns
(%)#
Additional Benchmark
Returns (%) ##
Value of ` 10,000 invested
Scheme (`)
Benchmark (`)#
Additional Benchmark
(`)##Mar 31, 16 Last 1 Year 8.84 11.09 7.15 10,884 11,109 10,715Jan 06, 15 Since Inception 8.92 10.02 7.63 12,101 12,376 11,783
Past performance may or may not be sustained in the future. Returns are compounded annualized (CAGR). # CRISIL Composite Bond Fund Index ## CRISIL 1 year T-Bill Index. The Scheme is in existence for more than 1 year but less than 3 years. The scheme is managed by Mr. Anil Bamboli since inception.
NAV as on Mar 31, 2017 ` 12.0417
HDFC FMP 1115D JANUARY 2015 (1) Date Period Scheme
Returns (%)
Benchmark Returns
(%)#
Additional Benchmark
Returns (%) ##
Value of ` 10,000 invested
Scheme (`)
Benchmark (`)#
Additional Benchmark
(`)##Mar 31, 16 Last 1 Year 8.88 11.09 7.15 10,888 11,109 10,715Jan 14, 15 Since Inception 8.77 9.78 7.59 12,042 12,290 11,756
Past performance may or may not be sustained in the future. Returns are compounded annualized (CAGR). # CRISIL Composite Bond Fund Index ## CRISIL 1 year T-Bill Index. The Scheme is in existence for more than 1 year but less than 3 years. The scheme is managed by Mr. Anil Bamboli since inception.
Performance of FMP schemes, being close-ended in nature, is not strictly comparable with that of open-ended schemes since the investment strategy for FMP schemes is primarily buy-and-hold whereas open-ended schemes are actively managed.
ANIL BAMBOLI....CONTINUED
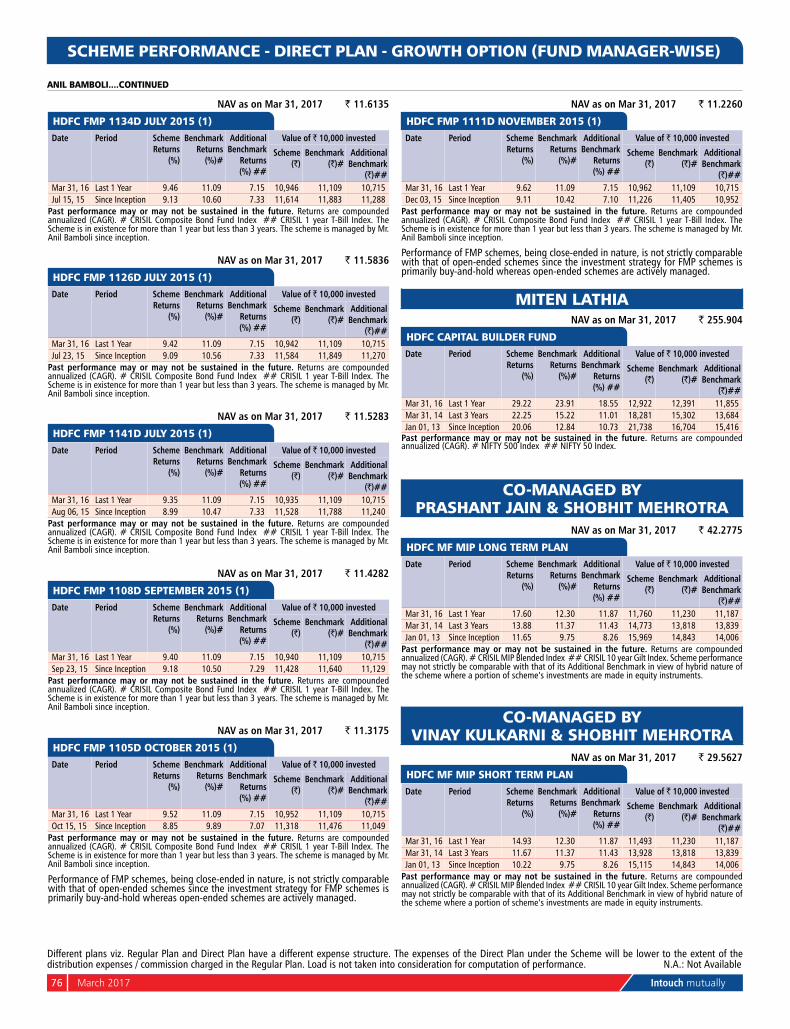
76 March 2017 Intouch mutually
SCHEME PERFORMANCE - DIRECT PLAN - GROWTH OPTION (FUND MANAGER-WISE)
Different plans viz. Regular Plan and Direct Plan have a different expense structure. The expenses of the Direct Plan under the Scheme will be lower to the extent of the distribution expenses / commission charged in the Regular Plan. Load is not taken into consideration for computation of performance. n.A.: not Available
NAV as on Mar 31, 2017 ` 11.6135
HDFC FMP 1134D JULY 2015 (1) Date Period Scheme
Returns (%)
Benchmark Returns
(%)#
Additional Benchmark
Returns (%) ##
Value of ` 10,000 invested
Scheme (`)
Benchmark (`)#
Additional Benchmark
(`)##Mar 31, 16 Last 1 Year 9.46 11.09 7.15 10,946 11,109 10,715Jul 15, 15 Since Inception 9.13 10.60 7.33 11,614 11,883 11,288
Past performance may or may not be sustained in the future. Returns are compounded annualized (CAGR). # CRISIL Composite Bond Fund Index ## CRISIL 1 year T-Bill Index. The Scheme is in existence for more than 1 year but less than 3 years. The scheme is managed by Mr. Anil Bamboli since inception.
NAV as on Mar 31, 2017 ` 11.5836
HDFC FMP 1126D JULY 2015 (1) Date Period Scheme
Returns (%)
Benchmark Returns
(%)#
Additional Benchmark
Returns (%) ##
Value of ` 10,000 invested
Scheme (`)
Benchmark (`)#
Additional Benchmark
(`)##Mar 31, 16 Last 1 Year 9.42 11.09 7.15 10,942 11,109 10,715Jul 23, 15 Since Inception 9.09 10.56 7.33 11,584 11,849 11,270
Past performance may or may not be sustained in the future. Returns are compounded annualized (CAGR). # CRISIL Composite Bond Fund Index ## CRISIL 1 year T-Bill Index. The Scheme is in existence for more than 1 year but less than 3 years. The scheme is managed by Mr. Anil Bamboli since inception.
NAV as on Mar 31, 2017 ` 11.5283
HDFC FMP 1141D JULY 2015 (1) Date Period Scheme
Returns (%)
Benchmark Returns
(%)#
Additional Benchmark
Returns (%) ##
Value of ` 10,000 invested
Scheme (`)
Benchmark (`)#
Additional Benchmark
(`)##Mar 31, 16 Last 1 Year 9.35 11.09 7.15 10,935 11,109 10,715Aug 06, 15 Since Inception 8.99 10.47 7.33 11,528 11,788 11,240
Past performance may or may not be sustained in the future. Returns are compounded annualized (CAGR). # CRISIL Composite Bond Fund Index ## CRISIL 1 year T-Bill Index. The Scheme is in existence for more than 1 year but less than 3 years. The scheme is managed by Mr. Anil Bamboli since inception.
NAV as on Mar 31, 2017 ` 11.4282
HDFC FMP 1108D SEPTEMBER 2015 (1) Date Period Scheme
Returns (%)
Benchmark Returns
(%)#
Additional Benchmark
Returns (%) ##
Value of ` 10,000 invested
Scheme (`)
Benchmark (`)#
Additional Benchmark
(`)##Mar 31, 16 Last 1 Year 9.40 11.09 7.15 10,940 11,109 10,715Sep 23, 15 Since Inception 9.18 10.50 7.29 11,428 11,640 11,129
Past performance may or may not be sustained in the future. Returns are compounded annualized (CAGR). # CRISIL Composite Bond Fund Index ## CRISIL 1 year T-Bill Index. The Scheme is in existence for more than 1 year but less than 3 years. The scheme is managed by Mr. Anil Bamboli since inception.
NAV as on Mar 31, 2017 ` 11.3175
HDFC FMP 1105D OCTOBER 2015 (1) Date Period Scheme
Returns (%)
Benchmark Returns
(%)#
Additional Benchmark
Returns (%) ##
Value of ` 10,000 invested
Scheme (`)
Benchmark (`)#
Additional Benchmark
(`)##Mar 31, 16 Last 1 Year 9.52 11.09 7.15 10,952 11,109 10,715Oct 15, 15 Since Inception 8.85 9.89 7.07 11,318 11,476 11,049
Past performance may or may not be sustained in the future. Returns are compounded annualized (CAGR). # CRISIL Composite Bond Fund Index ## CRISIL 1 year T-Bill Index. The Scheme is in existence for more than 1 year but less than 3 years. The scheme is managed by Mr. Anil Bamboli since inception.
Performance of FMP schemes, being close-ended in nature, is not strictly comparable with that of open-ended schemes since the investment strategy for FMP schemes is primarily buy-and-hold whereas open-ended schemes are actively managed.
NAV as on Mar 31, 2017 ` 11.2260
HDFC FMP 1111D NOVEMBER 2015 (1) Date Period Scheme
Returns (%)
Benchmark Returns
(%)#
Additional Benchmark
Returns (%) ##
Value of ` 10,000 invested
Scheme (`)
Benchmark (`)#
Additional Benchmark
(`)##Mar 31, 16 Last 1 Year 9.62 11.09 7.15 10,962 11,109 10,715Dec 03, 15 Since Inception 9.11 10.42 7.10 11,226 11,405 10,952
Past performance may or may not be sustained in the future. Returns are compounded annualized (CAGR). # CRISIL Composite Bond Fund Index ## CRISIL 1 year T-Bill Index. The Scheme is in existence for more than 1 year but less than 3 years. The scheme is managed by Mr. Anil Bamboli since inception.
Performance of FMP schemes, being close-ended in nature, is not strictly comparable with that of open-ended schemes since the investment strategy for FMP schemes is primarily buy-and-hold whereas open-ended schemes are actively managed.
MITEN LATHIA NAV as on Mar 31, 2017 ` 255.904
HDFC CAPITAL BUILDER FUND Date Period Scheme
Returns (%)
Benchmark Returns
(%)#
Additional Benchmark
Returns (%) ##
Value of ` 10,000 invested
Scheme (`)
Benchmark (`)#
Additional Benchmark
(`)##Mar 31, 16 Last 1 Year 29.22 23.91 18.55 12,922 12,391 11,855Mar 31, 14 Last 3 Years 22.25 15.22 11.01 18,281 15,302 13,684Jan 01, 13 Since Inception 20.06 12.84 10.73 21,738 16,704 15,416
Past performance may or may not be sustained in the future. Returns are compounded annualized (CAGR). # nIFTY 500 Index ## nIFTY 50 Index.
CO-MANAGED BY PRASHANT JAIN & SHOBHIT MEHROTRA
NAV as on Mar 31, 2017 ` 42.2775
HDFC MF MIP LONG TERM PLAN Date Period Scheme
Returns (%)
Benchmark Returns
(%)#
Additional Benchmark
Returns (%) ##
Value of ` 10,000 invested
Scheme (`)
Benchmark (`)#
Additional Benchmark
(`)##Mar 31, 16 Last 1 Year 17.60 12.30 11.87 11,760 11,230 11,187Mar 31, 14 Last 3 Years 13.88 11.37 11.43 14,773 13,818 13,839Jan 01, 13 Since Inception 11.65 9.75 8.26 15,969 14,843 14,006
Past performance may or may not be sustained in the future. Returns are compounded annualized (CAGR). # CRISIL MIP Blended Index ## CRISIL 10 year Gilt Index. Scheme performance may not strictly be comparable with that of its Additional Benchmark in view of hybrid nature of the scheme where a portion of scheme’s investments are made in equity instruments.
CO-MANAGED BY VINAY KULKARNI & SHOBHIT MEHROTRA
NAV as on Mar 31, 2017 ` 29.5627
HDFC MF MIP SHORT TERM PLAN Date Period Scheme
Returns (%)
Benchmark Returns
(%)#
Additional Benchmark
Returns (%) ##
Value of ` 10,000 invested
Scheme (`)
Benchmark (`)#
Additional Benchmark
(`)##Mar 31, 16 Last 1 Year 14.93 12.30 11.87 11,493 11,230 11,187Mar 31, 14 Last 3 Years 11.67 11.37 11.43 13,928 13,818 13,839Jan 01, 13 Since Inception 10.22 9.75 8.26 15,115 14,843 14,006
Past performance may or may not be sustained in the future. Returns are compounded annualized (CAGR). # CRISIL MIP Blended Index ## CRISIL 10 year Gilt Index. Scheme performance may not strictly be comparable with that of its Additional Benchmark in view of hybrid nature of the scheme where a portion of scheme’s investments are made in equity instruments.
ANIL BAMBOLI....CONTINUED
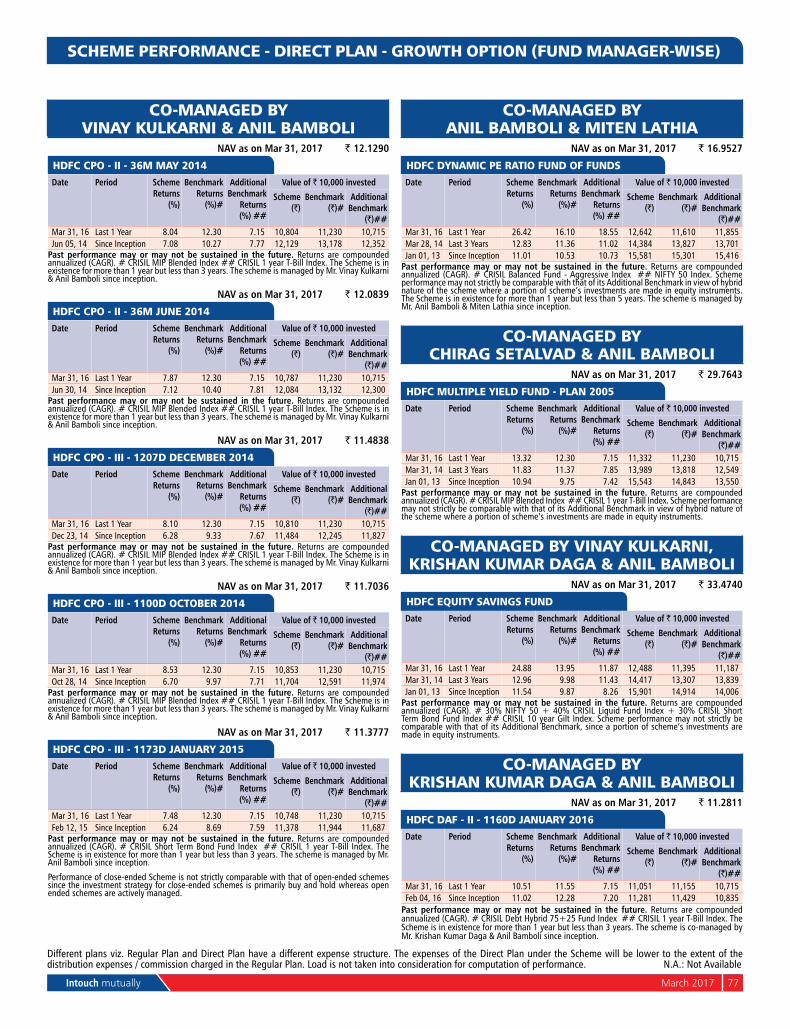
Intouch mutually March 2017 77
Different plans viz. Regular Plan and Direct Plan have a different expense structure. The expenses of the Direct Plan under the Scheme will be lower to the extent of the distribution expenses / commission charged in the Regular Plan. Load is not taken into consideration for computation of performance. n.A.: not Available
SCHEME PERFORMANCE - DIRECT PLAN - GROWTH OPTION (FUND MANAGER-WISE)
CO-MANAGED BY VINAY KULKARNI & ANIL BAMBOLI
NAV as on Mar 31, 2017 ` 12.1290
HDFC CPO - II - 36M MAY 2014 Date Period Scheme
Returns (%)
Benchmark Returns
(%)#
Additional Benchmark
Returns (%) ##
Value of ` 10,000 invested
Scheme (`)
Benchmark (`)#
Additional Benchmark
(`)##Mar 31, 16 Last 1 Year 8.04 12.30 7.15 10,804 11,230 10,715Jun 05, 14 Since Inception 7.08 10.27 7.77 12,129 13,178 12,352
Past performance may or may not be sustained in the future. Returns are compounded annualized (CAGR). # CRISIL MIP Blended Index ## CRISIL 1 year T-Bill Index. The Scheme is in existence for more than 1 year but less than 3 years. The scheme is managed by Mr. Vinay Kulkarni & Anil Bamboli since inception.
NAV as on Mar 31, 2017 ` 12.0839
HDFC CPO - II - 36M JUNE 2014 Date Period Scheme
Returns (%)
Benchmark Returns
(%)#
Additional Benchmark
Returns (%) ##
Value of ` 10,000 invested
Scheme (`)
Benchmark (`)#
Additional Benchmark
(`)##Mar 31, 16 Last 1 Year 7.87 12.30 7.15 10,787 11,230 10,715Jun 30, 14 Since Inception 7.12 10.40 7.81 12,084 13,132 12,300
Past performance may or may not be sustained in the future. Returns are compounded annualized (CAGR). # CRISIL MIP Blended Index ## CRISIL 1 year T-Bill Index. The Scheme is in existence for more than 1 year but less than 3 years. The scheme is managed by Mr. Vinay Kulkarni & Anil Bamboli since inception.
NAV as on Mar 31, 2017 ` 11.4838
HDFC CPO - III - 1207D DECEMBER 2014 Date Period Scheme
Returns (%)
Benchmark Returns
(%)#
Additional Benchmark
Returns (%) ##
Value of ` 10,000 invested
Scheme (`)
Benchmark (`)#
Additional Benchmark
(`)##Mar 31, 16 Last 1 Year 8.10 12.30 7.15 10,810 11,230 10,715Dec 23, 14 Since Inception 6.28 9.33 7.67 11,484 12,245 11,827
Past performance may or may not be sustained in the future. Returns are compounded annualized (CAGR). # CRISIL MIP Blended Index ## CRISIL 1 year T-Bill Index. The Scheme is in existence for more than 1 year but less than 3 years. The scheme is managed by Mr. Vinay Kulkarni & Anil Bamboli since inception.
NAV as on Mar 31, 2017 ` 11.7036
HDFC CPO - III - 1100D OCTOBER 2014 Date Period Scheme
Returns (%)
Benchmark Returns
(%)#
Additional Benchmark
Returns (%) ##
Value of ` 10,000 invested
Scheme (`)
Benchmark (`)#
Additional Benchmark
(`)##Mar 31, 16 Last 1 Year 8.53 12.30 7.15 10,853 11,230 10,715Oct 28, 14 Since Inception 6.70 9.97 7.71 11,704 12,591 11,974
Past performance may or may not be sustained in the future. Returns are compounded annualized (CAGR). # CRISIL MIP Blended Index ## CRISIL 1 year T-Bill Index. The Scheme is in existence for more than 1 year but less than 3 years. The scheme is managed by Mr. Vinay Kulkarni & Anil Bamboli since inception.
NAV as on Mar 31, 2017 ` 11.3777
HDFC CPO - III - 1173D JANUARY 2015 Date Period Scheme
Returns (%)
Benchmark Returns
(%)#
Additional Benchmark
Returns (%) ##
Value of ` 10,000 invested
Scheme (`)
Benchmark (`)#
Additional Benchmark
(`)##Mar 31, 16 Last 1 Year 7.48 12.30 7.15 10,748 11,230 10,715Feb 12, 15 Since Inception 6.24 8.69 7.59 11,378 11,944 11,687
Past performance may or may not be sustained in the future. Returns are compounded annualized (CAGR). # CRISIL Short Term Bond Fund Index ## CRISIL 1 year T-Bill Index. The Scheme is in existence for more than 1 year but less than 3 years. The scheme is managed by Mr. Anil Bamboli since inception.
Performance of close-ended Scheme is not strictly comparable with that of open-ended schemes since the investment strategy for close-ended schemes is primarily buy and hold whereas open ended schemes are actively managed.
CO-MANAGED BY ANIL BAMBOLI & MITEN LATHIA
NAV as on Mar 31, 2017 ` 16.9527
HDFC DYNAMIC PE RATIO FUND OF FUNDS Date Period Scheme
Returns (%)
Benchmark Returns
(%)#
Additional Benchmark
Returns (%) ##
Value of ` 10,000 invested
Scheme (`)
Benchmark (`)#
Additional Benchmark
(`)##Mar 31, 16 Last 1 Year 26.42 16.10 18.55 12,642 11,610 11,855Mar 28, 14 Last 3 Years 12.83 11.36 11.02 14,384 13,827 13,701Jan 01, 13 Since Inception 11.01 10.53 10.73 15,581 15,301 15,416
Past performance may or may not be sustained in the future. Returns are compounded annualized (CAGR). # CRISIL Balanced Fund - Aggressive Index ## nIFTY 50 Index. Scheme performance may not strictly be comparable with that of its Additional Benchmark in view of hybrid nature of the scheme where a portion of scheme’s investments are made in equity instruments. The Scheme is in existence for more than 1 year but less than 5 years. The scheme is managed by Mr. Anil Bamboli & Miten Lathia since inception.
CO-MANAGED BY CHIRAG SETALVAD & ANIL BAMBOLI
NAV as on Mar 31, 2017 ` 29.7643
HDFC MULTIPLE YIELD FUND - PLAN 2005 Date Period Scheme
Returns (%)
Benchmark Returns
(%)#
Additional Benchmark
Returns (%) ##
Value of ` 10,000 invested
Scheme (`)
Benchmark (`)#
Additional Benchmark
(`)##Mar 31, 16 Last 1 Year 13.32 12.30 7.15 11,332 11,230 10,715Mar 31, 14 Last 3 Years 11.83 11.37 7.85 13,989 13,818 12,549Jan 01, 13 Since Inception 10.94 9.75 7.42 15,543 14,843 13,550
Past performance may or may not be sustained in the future. Returns are compounded annualized (CAGR). # CRISIL MIP Blended Index ## CRISIL 1 year T-Bill Index. Scheme performance may not strictly be comparable with that of its Additional Benchmark in view of hybrid nature of the scheme where a portion of scheme’s investments are made in equity instruments.
CO-MANAGED BY VINAY KULKARNI, KRISHAN KUMAR DAGA & ANIL BAMBOLI
NAV as on Mar 31, 2017 ` 33.4740
HDFC EQUITY SAVINGS FUND Date Period Scheme
Returns (%)
Benchmark Returns
(%)#
Additional Benchmark
Returns (%) ##
Value of ` 10,000 invested
Scheme (`)
Benchmark (`)#
Additional Benchmark
(`)##Mar 31, 16 Last 1 Year 24.88 13.95 11.87 12,488 11,395 11,187Mar 31, 14 Last 3 Years 12.96 9.98 11.43 14,417 13,307 13,839Jan 01, 13 Since Inception 11.54 9.87 8.26 15,901 14,914 14,006
Past performance may or may not be sustained in the future. Returns are compounded annualized (CAGR). # 30% nIFTY 50 + 40% CRISIL Liquid Fund Index + 30% CRISIL Short Term Bond Fund Index ## CRISIL 10 year Gilt Index. Scheme performance may not strictly be comparable with that of its Additional Benchmark, since a portion of scheme’s investments are made in equity instruments.
CO-MANAGED BY KRISHAN KUMAR DAGA & ANIL BAMBOLI
NAV as on Mar 31, 2017 ` 11.2811
HDFC DAF - II - 1160D JANUARY 2016 Date Period Scheme
Returns (%)
Benchmark Returns
(%)#
Additional Benchmark
Returns (%) ##
Value of ` 10,000 invested
Scheme (`)
Benchmark (`)#
Additional Benchmark
(`)##Mar 31, 16 Last 1 Year 10.51 11.55 7.15 11,051 11,155 10,715Feb 04, 16 Since Inception 11.02 12.28 7.20 11,281 11,429 10,835
Past performance may or may not be sustained in the future. Returns are compounded annualized (CAGR). # CRISIL Debt Hybrid 75+25 Fund Index ## CRISIL 1 year T-Bill Index. The Scheme is in existence for more than 1 year but less than 3 years. The scheme is co-managed by Mr. Krishan Kumar Daga & Anil Bamboli since inception.
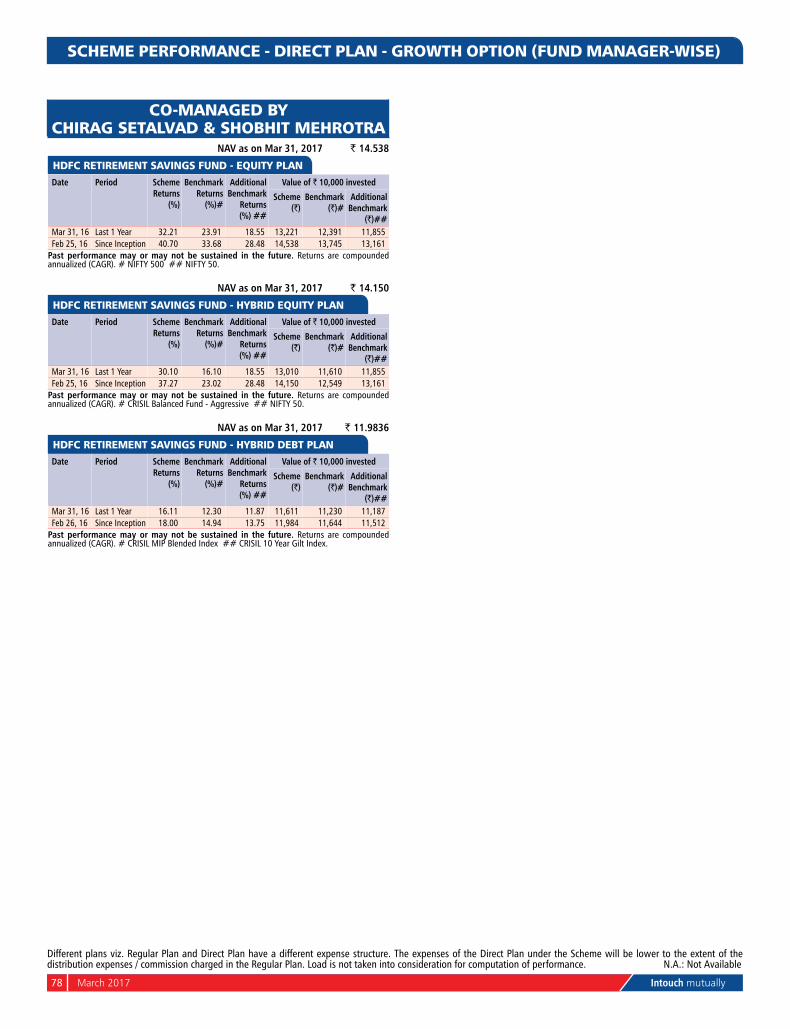
78 March 2017 Intouch mutually
SCHEME PERFORMANCE - DIRECT PLAN - GROWTH OPTION (FUND MANAGER-WISE)
Different plans viz. Regular Plan and Direct Plan have a different expense structure. The expenses of the Direct Plan under the Scheme will be lower to the extent of the distribution expenses / commission charged in the Regular Plan. Load is not taken into consideration for computation of performance. n.A.: not Available
CO-MANAGED BY CHIRAG SETALVAD & SHOBHIT MEHROTRA
NAV as on Mar 31, 2017 ` 14.538
HDFC RETIREMENT SAVINGS FUND - EQUITY PLAN Date Period Scheme
Returns (%)
Benchmark Returns
(%)#
Additional Benchmark
Returns (%) ##
Value of ` 10,000 invested
Scheme (`)
Benchmark (`)#
Additional Benchmark
(`)##Mar 31, 16 Last 1 Year 32.21 23.91 18.55 13,221 12,391 11,855Feb 25, 16 Since Inception 40.70 33.68 28.48 14,538 13,745 13,161
Past performance may or may not be sustained in the future. Returns are compounded annualized (CAGR). # nIFTY 500 ## nIFTY 50.
NAV as on Mar 31, 2017 ` 14.150
HDFC RETIREMENT SAVINGS FUND - HYBRID EQUITY PLAN Date Period Scheme
Returns (%)
Benchmark Returns
(%)#
Additional Benchmark
Returns (%) ##
Value of ` 10,000 invested
Scheme (`)
Benchmark (`)#
Additional Benchmark
(`)##Mar 31, 16 Last 1 Year 30.10 16.10 18.55 13,010 11,610 11,855Feb 25, 16 Since Inception 37.27 23.02 28.48 14,150 12,549 13,161
Past performance may or may not be sustained in the future. Returns are compounded annualized (CAGR). # CRISIL Balanced Fund - Aggressive ## nIFTY 50.
NAV as on Mar 31, 2017 ` 11.9836
HDFC RETIREMENT SAVINGS FUND - HYBRID DEBT PLAN Date Period Scheme
Returns (%)
Benchmark Returns
(%)#
Additional Benchmark
Returns (%) ##
Value of ` 10,000 invested
Scheme (`)
Benchmark (`)#
Additional Benchmark
(`)##Mar 31, 16 Last 1 Year 16.11 12.30 11.87 11,611 11,230 11,187Feb 26, 16 Since Inception 18.00 14.94 13.75 11,984 11,644 11,512
Past performance may or may not be sustained in the future. Returns are compounded annualized (CAGR). # CRISIL MIP Blended Index ## CRISIL 10 Year Gilt Index.
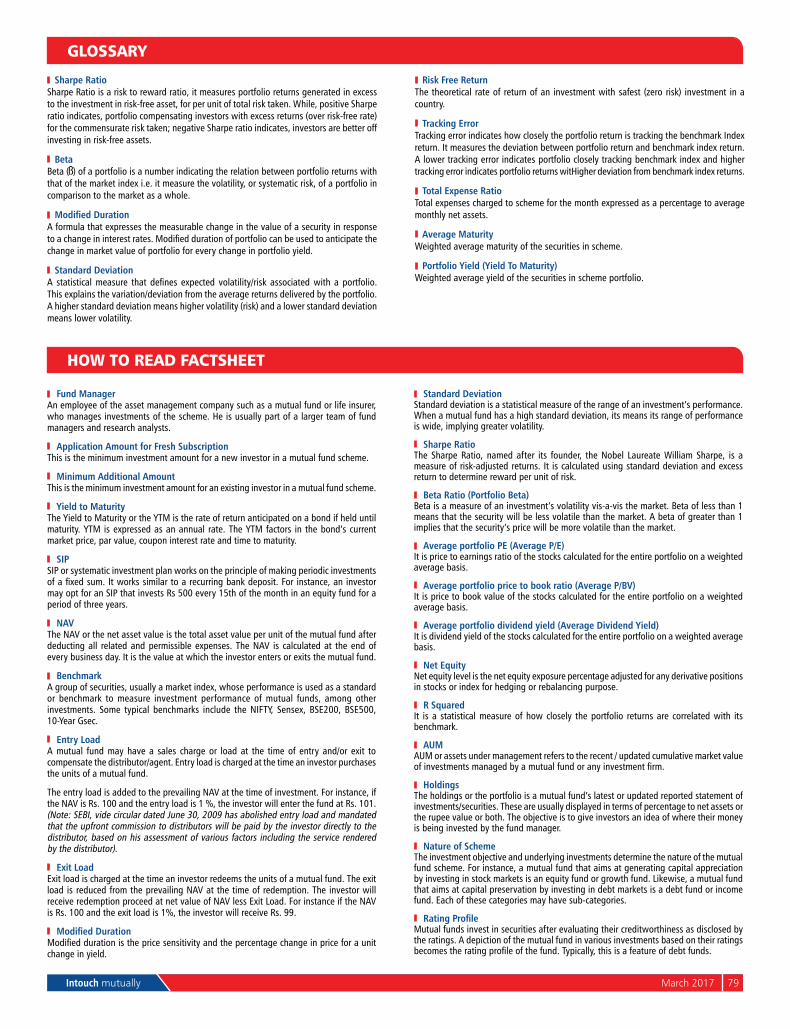
Intouch mutually March 2017 79
Fund ManagerAn employee of the asset management company such as a mutual fund or life insurer, who manages investments of the scheme. He is usually part of a larger team of fund managers and research analysts.
Application Amount for Fresh SubscriptionThis is the minimum investment amount for a new investor in a mutual fund scheme.
Minimum Additional AmountThis is the minimum investment amount for an existing investor in a mutual fund scheme.
Yield to MaturityThe Yield to Maturity or the YTM is the rate of return anticipated on a bond if held until maturity. YTM is expressed as an annual rate. The YTM factors in the bond’s current market price, par value, coupon interest rate and time to maturity.
SIPSIP or systematic investment plan works on the principle of making periodic investments of a fixed sum. It works similar to a recurring bank deposit. For instance, an investor may opt for an SIP that invests Rs 500 every 15th of the month in an equity fund for a period of three years.
NAVThe nAV or the net asset value is the total asset value per unit of the mutual fund after deducting all related and permissible expenses. The nAV is calculated at the end of every business day. It is the value at which the investor enters or exits the mutual fund.
BenchmarkA group of securities, usually a market index, whose performance is used as a standard or benchmark to measure investment performance of mutual funds, among other investments. Some typical benchmarks include the nIFTY, Sensex, BSE200, BSE500, 10-Year Gsec.
Entry LoadA mutual fund may have a sales charge or load at the time of entry and/or exit to compensate the distributor/agent. Entry load is charged at the time an investor purchases the units of a mutual fund.
The entry load is added to the prevailing nAV at the time of investment. For instance, if the nAV is Rs. 100 and the entry load is 1 %, the investor will enter the fund at Rs. 101. (note: SEBI, vide circular dated June 30, 2009 has abolished entry load and mandated that the upfront commission to distributors will be paid by the investor directly to the distributor, based on his assessment of various factors including the service rendered by the distributor).
Exit LoadExit load is charged at the time an investor redeems the units of a mutual fund. The exit load is reduced from the prevailing nAV at the time of redemption. The investor will receive redemption proceed at net value of nAV less Exit Load. For instance if the nAV is Rs. 100 and the exit load is 1%, the investor will receive Rs. 99.
Modified DurationModified duration is the price sensitivity and the percentage change in price for a unit change in yield.
Standard DeviationStandard deviation is a statistical measure of the range of an investment’s performance. When a mutual fund has a high standard deviation, its means its range of performance is wide, implying greater volatility.
Sharpe RatioThe Sharpe Ratio, named after its founder, the nobel Laureate William Sharpe, is a measure of risk-adjusted returns. It is calculated using standard deviation and excess return to determine reward per unit of risk.
Beta Ratio (Portfolio Beta)Beta is a measure of an investment’s volatility vis-a-vis the market. Beta of less than 1 means that the security will be less volatile than the market. A beta of greater than 1 implies that the security’s price will be more volatile than the market.
Average portfolio PE (Average P/E)It is price to earnings ratio of the stocks calculated for the entire portfolio on a weighted average basis.
Average portfolio price to book ratio (Average P/BV)It is price to book value of the stocks calculated for the entire portfolio on a weighted average basis.
Average portfolio dividend yield (Average Dividend Yield)It is dividend yield of the stocks calculated for the entire portfolio on a weighted average basis.
Net Equitynet equity level is the net equity exposure percentage adjusted for any derivative positions in stocks or index for hedging or rebalancing purpose.
R SquaredIt is a statistical measure of how closely the portfolio returns are correlated with its benchmark.
AUMAUM or assets under management refers to the recent / updated cumulative market value of investments managed by a mutual fund or any investment firm.
HoldingsThe holdings or the portfolio is a mutual fund’s latest or updated reported statement of investments/securities. These are usually displayed in terms of percentage to net assets or the rupee value or both. The objective is to give investors an idea of where their money is being invested by the fund manager.
Nature of SchemeThe investment objective and underlying investments determine the nature of the mutual fund scheme. For instance, a mutual fund that aims at generating capital appreciation by investing in stock markets is an equity fund or growth fund. Likewise, a mutual fund that aims at capital preservation by investing in debt markets is a debt fund or income fund. Each of these categories may have sub-categories.
Rating ProfileMutual funds invest in securities after evaluating their creditworthiness as disclosed by the ratings. A depiction of the mutual fund in various investments based on their ratings becomes the rating profile of the fund. Typically, this is a feature of debt funds.
HOW TO READ FACTSHEET
Sharpe RatioSharpe Ratio is a risk to reward ratio, it measures portfolio returns generated in excess to the investment in risk-free asset, for per unit of total risk taken. While, positive Sharpe ratio indicates, portfolio compensating investors with excess returns (over risk-free rate) for the commensurate risk taken; negative Sharpe ratio indicates, investors are better off investing in risk-free assets.
BetaBeta ( ) of a portfolio is a number indicating the relation between portfolio returns with that of the market index i.e. it measure the volatility, or systematic risk, of a portfolio in comparison to the market as a whole.
Modified DurationA formula that expresses the measurable change in the value of a security in response to a change in interest rates. Modified duration of portfolio can be used to anticipate the change in market value of portfolio for every change in portfolio yield.
Standard DeviationA statistical measure that defines expected volatility/risk associated with a portfolio. This explains the variation/deviation from the average returns delivered by the portfolio. A higher standard deviation means higher volatility (risk) and a lower standard deviation means lower volatility.
Risk Free ReturnThe theoretical rate of return of an investment with safest (zero risk) investment in a country.
Tracking ErrorTracking error indicates how closely the portfolio return is tracking the benchmark Index return. It measures the deviation between portfolio return and benchmark index return. A lower tracking error indicates portfolio closely tracking benchmark index and higher tracking error indicates portfolio returns witHigher deviation from benchmark index returns.
Total Expense RatioTotal expenses charged to scheme for the month expressed as a percentage to average monthly net assets.
Average MaturityWeighted average maturity of the securities in scheme.
Portfolio Yield (Yield To Maturity)Weighted average yield of the securities in scheme portfolio.
GLOSSARY
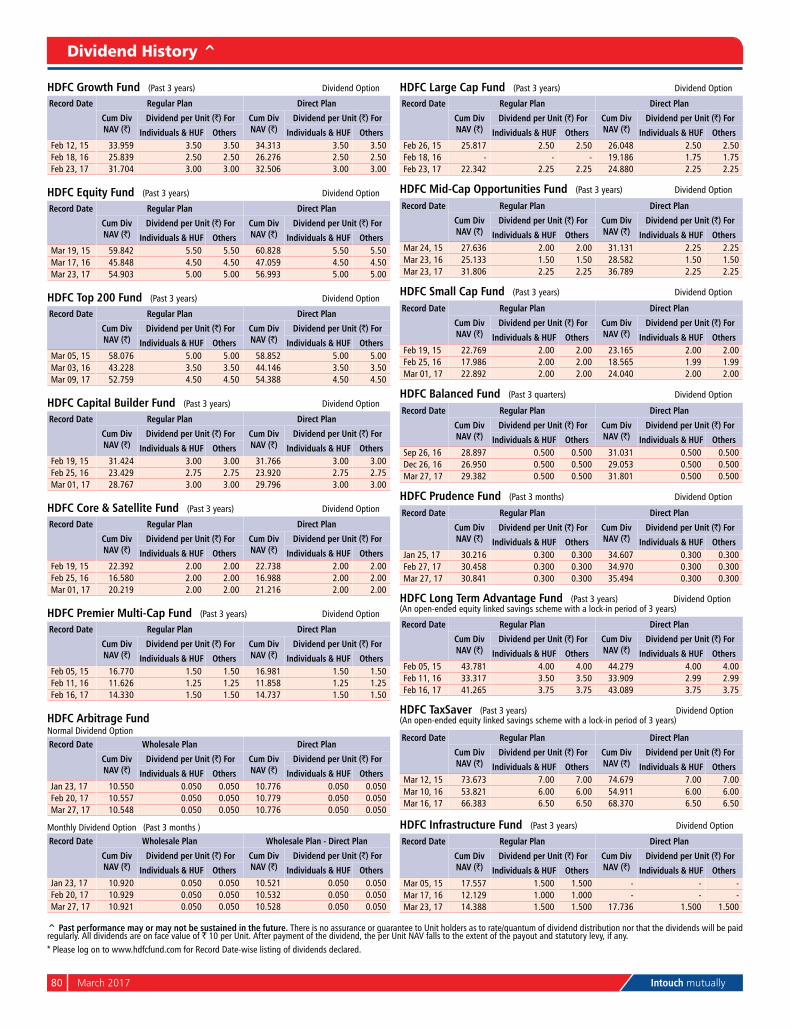
80 March 2017 Intouch mutually
Dividend History ^
^ Past performance may or may not be sustained in the future. There is no assurance or guarantee to Unit holders as to rate/quantum of dividend distribution nor that the dividends will be paid regularly. All dividends are on face value of ` 10 per Unit. After payment of the dividend, the per Unit nAV falls to the extent of the payout and statutory levy, if any. * Please log on to www.hdfcfund.com for Record Date-wise listing of dividends declared.
HDFC Growth Fund (Past 3 years) Dividend Option
Record Date Regular Plan Direct Plan
Cum Div NAV (`)
Dividend per Unit (`) For Cum Div NAV (`)
Dividend per Unit (`) For
Individuals & HUF Others Individuals & HUF OthersFeb 12, 15 33.959 3.50 3.50 34.313 3.50 3.50Feb 18, 16 25.839 2.50 2.50 26.276 2.50 2.50Feb 23, 17 31.704 3.00 3.00 32.506 3.00 3.00
HDFC Equity Fund (Past 3 years) Dividend Option
Record Date Regular Plan Direct Plan
Cum Div NAV (`)
Dividend per Unit (`) For Cum Div NAV (`)
Dividend per Unit (`) For
Individuals & HUF Others Individuals & HUF OthersMar 19, 15 59.842 5.50 5.50 60.828 5.50 5.50Mar 17, 16 45.848 4.50 4.50 47.059 4.50 4.50Mar 23, 17 54.903 5.00 5.00 56.993 5.00 5.00
HDFC Top 200 Fund (Past 3 years) Dividend Option
Record Date Regular Plan Direct Plan
Cum Div NAV (`)
Dividend per Unit (`) For Cum Div NAV (`)
Dividend per Unit (`) For
Individuals & HUF Others Individuals & HUF OthersMar 05, 15 58.076 5.00 5.00 58.852 5.00 5.00Mar 03, 16 43.228 3.50 3.50 44.146 3.50 3.50Mar 09, 17 52.759 4.50 4.50 54.388 4.50 4.50
HDFC Capital Builder Fund (Past 3 years) Dividend Option
Record Date Regular Plan Direct Plan
Cum Div NAV (`)
Dividend per Unit (`) For Cum Div NAV (`)
Dividend per Unit (`) For
Individuals & HUF Others Individuals & HUF OthersFeb 19, 15 31.424 3.00 3.00 31.766 3.00 3.00Feb 25, 16 23.429 2.75 2.75 23.920 2.75 2.75Mar 01, 17 28.767 3.00 3.00 29.796 3.00 3.00
HDFC Core & Satellite Fund (Past 3 years) Dividend Option
Record Date Regular Plan Direct Plan
Cum Div NAV (`)
Dividend per Unit (`) For Cum Div NAV (`)
Dividend per Unit (`) For
Individuals & HUF Others Individuals & HUF OthersFeb 19, 15 22.392 2.00 2.00 22.738 2.00 2.00Feb 25, 16 16.580 2.00 2.00 16.988 2.00 2.00Mar 01, 17 20.219 2.00 2.00 21.216 2.00 2.00
HDFC Premier Multi-Cap Fund (Past 3 years) Dividend Option
Record Date Regular Plan Direct Plan
Cum Div NAV (`)
Dividend per Unit (`) For Cum Div NAV (`)
Dividend per Unit (`) For
Individuals & HUF Others Individuals & HUF OthersFeb 05, 15 16.770 1.50 1.50 16.981 1.50 1.50Feb 11, 16 11.626 1.25 1.25 11.858 1.25 1.25Feb 16, 17 14.330 1.50 1.50 14.737 1.50 1.50
HDFC Arbitrage Fundnormal Dividend Option Record Date Wholesale Plan Direct Plan
Cum Div NAV (`)
Dividend per Unit (`) For Cum Div NAV (`)
Dividend per Unit (`) For
Individuals & HUF Others Individuals & HUF OthersJan 23, 17 10.550 0.050 0.050 10.776 0.050 0.050Feb 20, 17 10.557 0.050 0.050 10.779 0.050 0.050Mar 27, 17 10.548 0.050 0.050 10.776 0.050 0.050
Monthly Dividend Option (Past 3 months )Record Date Wholesale Plan Wholesale Plan - Direct Plan
Cum Div NAV (`)
Dividend per Unit (`) For Cum Div NAV (`)
Dividend per Unit (`) For
Individuals & HUF Others Individuals & HUF OthersJan 23, 17 10.920 0.050 0.050 10.521 0.050 0.050Feb 20, 17 10.929 0.050 0.050 10.532 0.050 0.050Mar 27, 17 10.921 0.050 0.050 10.528 0.050 0.050
HDFC Large Cap Fund (Past 3 years) Dividend Option
Record Date Regular Plan Direct Plan
Cum Div NAV (`)
Dividend per Unit (`) For Cum Div NAV (`)
Dividend per Unit (`) For
Individuals & HUF Others Individuals & HUF OthersFeb 26, 15 25.817 2.50 2.50 26.048 2.50 2.50Feb 18, 16 - - - 19.186 1.75 1.75Feb 23, 17 22.342 2.25 2.25 24.880 2.25 2.25
HDFC Mid-Cap Opportunities Fund (Past 3 years) Dividend Option
Record Date Regular Plan Direct Plan
Cum Div NAV (`)
Dividend per Unit (`) For Cum Div NAV (`)
Dividend per Unit (`) For
Individuals & HUF Others Individuals & HUF OthersMar 24, 15 27.636 2.00 2.00 31.131 2.25 2.25Mar 23, 16 25.133 1.50 1.50 28.582 1.50 1.50Mar 23, 17 31.806 2.25 2.25 36.789 2.25 2.25
HDFC Small Cap Fund (Past 3 years) Dividend Option
Record Date Regular Plan Direct Plan
Cum Div NAV (`)
Dividend per Unit (`) For Cum Div NAV (`)
Dividend per Unit (`) For
Individuals & HUF Others Individuals & HUF OthersFeb 19, 15 22.769 2.00 2.00 23.165 2.00 2.00Feb 25, 16 17.986 2.00 2.00 18.565 1.99 1.99Mar 01, 17 22.892 2.00 2.00 24.040 2.00 2.00
HDFC Balanced Fund (Past 3 quarters) Dividend Option
Record Date Regular Plan Direct Plan
Cum Div NAV (`)
Dividend per Unit (`) For Cum Div NAV (`)
Dividend per Unit (`) For
Individuals & HUF Others Individuals & HUF OthersSep 26, 16 28.897 0.500 0.500 31.031 0.500 0.500Dec 26, 16 26.950 0.500 0.500 29.053 0.500 0.500Mar 27, 17 29.382 0.500 0.500 31.801 0.500 0.500
HDFC Prudence Fund (Past 3 months) Dividend Option
Record Date Regular Plan Direct Plan
Cum Div NAV (`)
Dividend per Unit (`) For Cum Div NAV (`)
Dividend per Unit (`) For
Individuals & HUF Others Individuals & HUF OthersJan 25, 17 30.216 0.300 0.300 34.607 0.300 0.300Feb 27, 17 30.458 0.300 0.300 34.970 0.300 0.300Mar 27, 17 30.841 0.300 0.300 35.494 0.300 0.300
HDFC Long Term Advantage Fund (Past 3 years) Dividend Option(An open-ended equity linked savings scheme with a lock-in period of 3 years)
Record Date Regular Plan Direct Plan
Cum Div NAV (`)
Dividend per Unit (`) For Cum Div NAV (`)
Dividend per Unit (`) For
Individuals & HUF Others Individuals & HUF OthersFeb 05, 15 43.781 4.00 4.00 44.279 4.00 4.00Feb 11, 16 33.317 3.50 3.50 33.909 2.99 2.99Feb 16, 17 41.265 3.75 3.75 43.089 3.75 3.75
HDFC TaxSaver (Past 3 years) Dividend Option(An open-ended equity linked savings scheme with a lock-in period of 3 years)
Record Date Regular Plan Direct Plan
Cum Div NAV (`)
Dividend per Unit (`) For Cum Div NAV (`)
Dividend per Unit (`) For
Individuals & HUF Others Individuals & HUF OthersMar 12, 15 73.673 7.00 7.00 74.679 7.00 7.00Mar 10, 16 53.821 6.00 6.00 54.911 6.00 6.00Mar 16, 17 66.383 6.50 6.50 68.370 6.50 6.50
HDFC Infrastructure Fund (Past 3 years) Dividend Option
Record Date Regular Plan Direct Plan
Cum Div NAV (`)
Dividend per Unit (`) For Cum Div NAV (`)
Dividend per Unit (`) For
Individuals & HUF Others Individuals & HUF OthersMar 05, 15 17.557 1.500 1.500 - - -Mar 17, 16 12.129 1.000 1.000 - - -Mar 23, 17 14.388 1.500 1.500 17.736 1.500 1.500
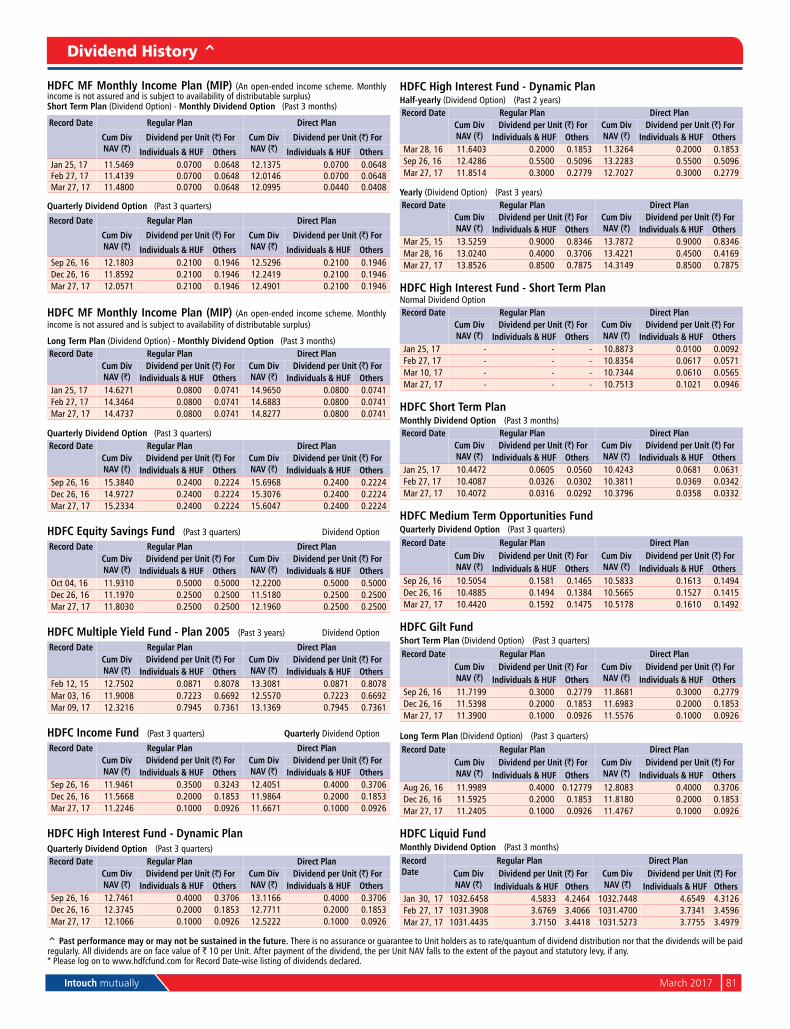
Intouch mutually March 2017 81
Dividend History ^
^ Past performance may or may not be sustained in the future. There is no assurance or guarantee to Unit holders as to rate/quantum of dividend distribution nor that the dividends will be paid regularly. All dividends are on face value of ` 10 per Unit. After payment of the dividend, the per Unit nAV falls to the extent of the payout and statutory levy, if any.* Please log on to www.hdfcfund.com for Record Date-wise listing of dividends declared.
HDFC MF Monthly Income Plan (MIP) (An open-ended income scheme. Monthly income is not assured and is subject to availability of distributable surplus) Short Term Plan (Dividend Option) - Monthly Dividend Option (Past 3 months)
Record Date Regular Plan Direct Plan
Cum Div NAV (`)
Dividend per Unit (`) For Cum Div NAV (`)
Dividend per Unit (`) For
Individuals & HUF Others Individuals & HUF OthersJan 25, 17 11.5469 0.0700 0.0648 12.1375 0.0700 0.0648Feb 27, 17 11.4139 0.0700 0.0648 12.0146 0.0700 0.0648Mar 27, 17 11.4800 0.0700 0.0648 12.0995 0.0440 0.0408
Quarterly Dividend Option (Past 3 quarters)
Record Date Regular Plan Direct Plan
Cum Div NAV (`)
Dividend per Unit (`) For Cum Div NAV (`)
Dividend per Unit (`) For
Individuals & HUF Others Individuals & HUF OthersSep 26, 16 12.1803 0.2100 0.1946 12.5296 0.2100 0.1946Dec 26, 16 11.8592 0.2100 0.1946 12.2419 0.2100 0.1946Mar 27, 17 12.0571 0.2100 0.1946 12.4901 0.2100 0.1946
HDFC MF Monthly Income Plan (MIP) (An open-ended income scheme. Monthly income is not assured and is subject to availability of distributable surplus)
Long Term Plan (Dividend Option) - Monthly Dividend Option (Past 3 months)Record Date Regular Plan Direct Plan
Cum Div NAV (`)
Dividend per Unit (`) For Cum Div NAV (`)
Dividend per Unit (`) ForIndividuals & HUF Others Individuals & HUF Others
Jan 25, 17 14.6271 0.0800 0.0741 14.9650 0.0800 0.0741Feb 27, 17 14.3464 0.0800 0.0741 14.6883 0.0800 0.0741Mar 27, 17 14.4737 0.0800 0.0741 14.8277 0.0800 0.0741
Quarterly Dividend Option (Past 3 quarters)Record Date Regular Plan Direct Plan
Cum Div NAV (`)
Dividend per Unit (`) For Cum Div NAV (`)
Dividend per Unit (`) ForIndividuals & HUF Others Individuals & HUF Others
Sep 26, 16 15.3840 0.2400 0.2224 15.6968 0.2400 0.2224Dec 26, 16 14.9727 0.2400 0.2224 15.3076 0.2400 0.2224Mar 27, 17 15.2334 0.2400 0.2224 15.6047 0.2400 0.2224
HDFC Equity Savings Fund (Past 3 quarters) Dividend Option
Record Date Regular Plan Direct PlanCum Div NAV (`)
Dividend per Unit (`) For Cum Div NAV (`)
Dividend per Unit (`) ForIndividuals & HUF Others Individuals & HUF Others
Oct 04, 16 11.9310 0.5000 0.5000 12.2200 0.5000 0.5000Dec 26, 16 11.1970 0.2500 0.2500 11.5180 0.2500 0.2500Mar 27, 17 11.8030 0.2500 0.2500 12.1960 0.2500 0.2500
HDFC Multiple Yield Fund - Plan 2005 (Past 3 years) Dividend Option
Record Date Regular Plan Direct PlanCum Div NAV (`)
Dividend per Unit (`) For Cum Div NAV (`)
Dividend per Unit (`) ForIndividuals & HUF Others Individuals & HUF Others
Feb 12, 15 12.7502 0.0871 0.8078 13.3081 0.0871 0.8078Mar 03, 16 11.9008 0.7223 0.6692 12.5570 0.7223 0.6692Mar 09, 17 12.3216 0.7945 0.7361 13.1369 0.7945 0.7361
HDFC Income Fund (Past 3 quarters) Quarterly Dividend Option
Record Date Regular Plan Direct PlanCum Div NAV (`)
Dividend per Unit (`) For Cum Div NAV (`)
Dividend per Unit (`) ForIndividuals & HUF Others Individuals & HUF Others
Sep 26, 16 11.9461 0.3500 0.3243 12.4051 0.4000 0.3706Dec 26, 16 11.5668 0.2000 0.1853 11.9864 0.2000 0.1853Mar 27, 17 11.2246 0.1000 0.0926 11.6671 0.1000 0.0926
HDFC High Interest Fund - Dynamic PlanQuarterly Dividend Option (Past 3 quarters) Record Date Regular Plan Direct Plan
Cum Div NAV (`)
Dividend per Unit (`) For Cum Div NAV (`)
Dividend per Unit (`) ForIndividuals & HUF Others Individuals & HUF Others
Sep 26, 16 12.7461 0.4000 0.3706 13.1166 0.4000 0.3706Dec 26, 16 12.3745 0.2000 0.1853 12.7711 0.2000 0.1853Mar 27, 17 12.1066 0.1000 0.0926 12.5222 0.1000 0.0926
HDFC High Interest Fund - Dynamic PlanHalf-yearly (Dividend Option) (Past 2 years) Record Date Regular Plan Direct Plan
Cum Div NAV (`)
Dividend per Unit (`) For Cum Div NAV (`)
Dividend per Unit (`) ForIndividuals & HUF Others Individuals & HUF Others
Mar 28, 16 11.6403 0.2000 0.1853 11.3264 0.2000 0.1853Sep 26, 16 12.4286 0.5500 0.5096 13.2283 0.5500 0.5096Mar 27, 17 11.8514 0.3000 0.2779 12.7027 0.3000 0.2779
Yearly (Dividend Option) (Past 3 years) Record Date Regular Plan Direct Plan
Cum Div NAV (`)
Dividend per Unit (`) For Cum Div NAV (`)
Dividend per Unit (`) ForIndividuals & HUF Others Individuals & HUF Others
Mar 25, 15 13.5259 0.9000 0.8346 13.7872 0.9000 0.8346Mar 28, 16 13.0240 0.4000 0.3706 13.4221 0.4500 0.4169Mar 27, 17 13.8526 0.8500 0.7875 14.3149 0.8500 0.7875
HDFC High Interest Fund - Short Term Plannormal Dividend OptionRecord Date Regular Plan Direct Plan
Cum Div NAV (`)
Dividend per Unit (`) For Cum Div NAV (`)
Dividend per Unit (`) ForIndividuals & HUF Others Individuals & HUF Others
Jan 25, 17 - - - 10.8873 0.0100 0.0092Feb 27, 17 - - - 10.8354 0.0617 0.0571Mar 10, 17 - - - 10.7344 0.0610 0.0565Mar 27, 17 - - - 10.7513 0.1021 0.0946
HDFC Short Term PlanMonthly Dividend Option (Past 3 months)Record Date Regular Plan Direct Plan
Cum Div NAV (`)
Dividend per Unit (`) For Cum Div NAV (`)
Dividend per Unit (`) ForIndividuals & HUF Others Individuals & HUF Others
Jan 25, 17 10.4472 0.0605 0.0560 10.4243 0.0681 0.0631Feb 27, 17 10.4087 0.0326 0.0302 10.3811 0.0369 0.0342Mar 27, 17 10.4072 0.0316 0.0292 10.3796 0.0358 0.0332
HDFC Medium Term Opportunities FundQuarterly Dividend Option (Past 3 quarters) Record Date Regular Plan Direct Plan
Cum Div NAV (`)
Dividend per Unit (`) For Cum Div NAV (`)
Dividend per Unit (`) ForIndividuals & HUF Others Individuals & HUF Others
Sep 26, 16 10.5054 0.1581 0.1465 10.5833 0.1613 0.1494Dec 26, 16 10.4885 0.1494 0.1384 10.5665 0.1527 0.1415Mar 27, 17 10.4420 0.1592 0.1475 10.5178 0.1610 0.1492
HDFC Gilt FundShort Term Plan (Dividend Option) (Past 3 quarters) Record Date Regular Plan Direct Plan
Cum Div NAV (`)
Dividend per Unit (`) For Cum Div NAV (`)
Dividend per Unit (`) ForIndividuals & HUF Others Individuals & HUF Others
Sep 26, 16 11.7199 0.3000 0.2779 11.8681 0.3000 0.2779Dec 26, 16 11.5398 0.2000 0.1853 11.6983 0.2000 0.1853Mar 27, 17 11.3900 0.1000 0.0926 11.5576 0.1000 0.0926
Long Term Plan (Dividend Option) (Past 3 quarters) Record Date Regular Plan Direct Plan
Cum Div NAV (`)
Dividend per Unit (`) For Cum Div NAV (`)
Dividend per Unit (`) ForIndividuals & HUF Others Individuals & HUF Others
Aug 26, 16 11.9989 0.4000 0.12779 12.8083 0.4000 0.3706Dec 26, 16 11.5925 0.2000 0.1853 11.8180 0.2000 0.1853Mar 27, 17 11.2405 0.1000 0.0926 11.4767 0.1000 0.0926
HDFC Liquid FundMonthly Dividend Option (Past 3 months) Record Date
Regular Plan Direct PlanCum Div NAV (`)
Dividend per Unit (`) For Cum Div NAV (`)
Dividend per Unit (`) ForIndividuals & HUF Others Individuals & HUF Others
Jan 30, 17 1032.6458 4.5833 4.2464 1032.7448 4.6549 4.3126Feb 27, 17 1031.3908 3.6769 3.4066 1031.4700 3.7341 3.4596Mar 27, 17 1031.4435 3.7150 3.4418 1031.5273 3.7755 3.4979
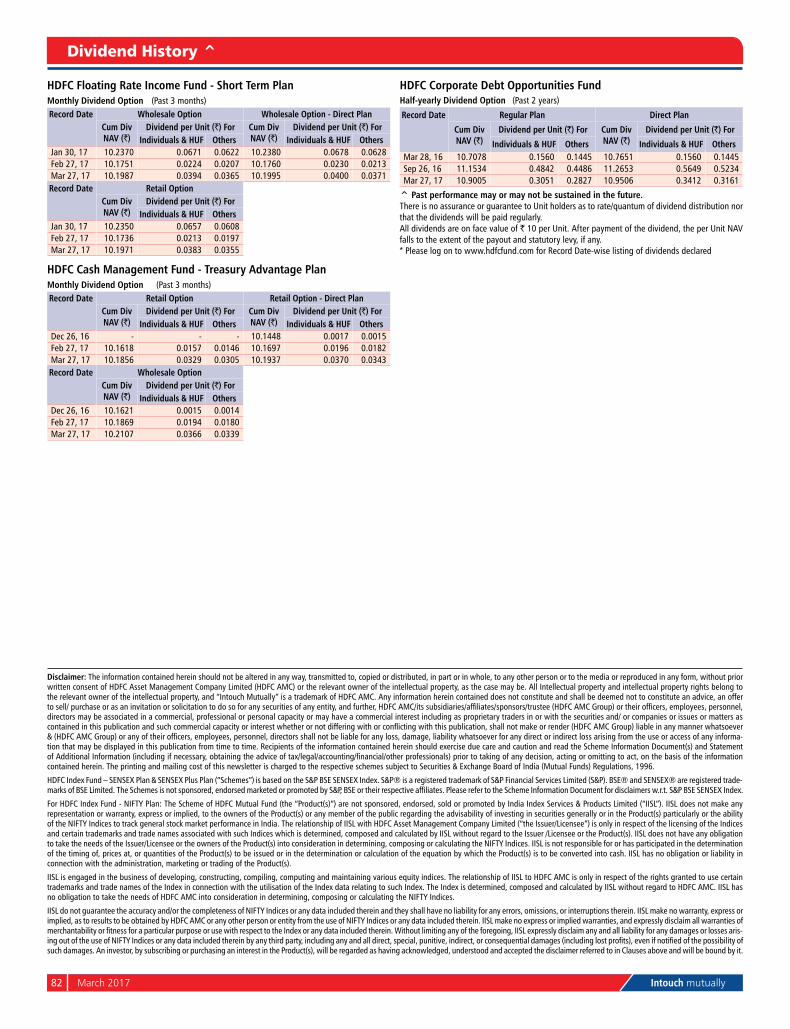
82 March 2017 Intouch mutually
Dividend History ^
Disclaimer: The information contained herein should not be altered in any way, transmitted to, copied or distributed, in part or in whole, to any other person or to the media or reproduced in any form, without prior written consent of HDFC Asset Management Company Limited (HDFC AMC) or the relevant owner of the intellectual property, as the case may be. All Intellectual property and intellectual property rights belong to the relevant owner of the intellectual property, and “Intouch Mutually” is a trademark of HDFC AMC. Any information herein contained does not constitute and shall be deemed not to constitute an advice, an offer to sell/ purchase or as an invitation or solicitation to do so for any securities of any entity, and further, HDFC AMC/its subsidiaries/affiliates/sponsors/trustee (HDFC AMC Group) or their officers, employees, personnel, directors may be associated in a commercial, professional or personal capacity or may have a commercial interest including as proprietary traders in or with the securities and/ or companies or issues or matters as contained in this publication and such commercial capacity or interest whether or not differing with or conflicting with this publication, shall not make or render (HDFC AMC Group) liable in any manner whatsoever & (HDFC AMC Group) or any of their officers, employees, personnel, directors shall not be liable for any loss, damage, liability whatsoever for any direct or indirect loss arising from the use or access of any informa-tion that may be displayed in this publication from time to time. Recipients of the information contained herein should exercise due care and caution and read the Scheme Information Document(s) and Statement of Additional Information (including if necessary, obtaining the advice of tax/legal/accounting/financial/other professionals) prior to taking of any decision, acting or omitting to act, on the basis of the information contained herein. The printing and mailing cost of this newsletter is charged to the respective schemes subject to Securities & Exchange Board of India (Mutual Funds) Regulations, 1996.
HDFC Index Fund – SEnSEx Plan & SEnSEx Plus Plan (“Schemes”) is based on the S&P BSE SEnSEx Index. S&P® is a registered trademark of S&P Financial Services Limited (S&P). BSE® and SEnSEx® are registered trade-marks of BSE Limited. The Schemes is not sponsored, endorsed marketed or promoted by S&P, BSE or their respective affiliates. Please refer to the Scheme Information Document for disclaimers w.r.t. S&P BSE SENSEX Index.
For HDFC Index Fund - nIFTY Plan: The Scheme of HDFC Mutual Fund (the “Product(s)”) are not sponsored, endorsed, sold or promoted by India Index Services & Products Limited (“IISL”). IISL does not make any representation or warranty, express or implied, to the owners of the Product(s) or any member of the public regarding the advisability of investing in securities generally or in the Product(s) particularly or the ability of the nIFTY Indices to track general stock market performance in India. The relationship of IISL with HDFC Asset Management Company Limited (“the Issuer/Licensee”) is only in respect of the licensing of the Indices and certain trademarks and trade names associated with such Indices which is determined, composed and calculated by IISL without regard to the Issuer /Licensee or the Product(s). IISL does not have any obligation to take the needs of the Issuer/Licensee or the owners of the Product(s) into consideration in determining, composing or calculating the nIFTY Indices. IISL is not responsible for or has participated in the determination of the timing of, prices at, or quantities of the Product(s) to be issued or in the determination or calculation of the equation by which the Product(s) is to be converted into cash. IISL has no obligation or liability in connection with the administration, marketing or trading of the Product(s).
IISL is engaged in the business of developing, constructing, compiling, computing and maintaining various equity indices. The relationship of IISL to HDFC AMC is only in respect of the rights granted to use certain trademarks and trade names of the Index in connection with the utilisation of the Index data relating to such Index. The Index is determined, composed and calculated by IISL without regard to HDFC AMC. IISL has no obligation to take the needs of HDFC AMC into consideration in determining, composing or calculating the nIFTY Indices.
IISL do not guarantee the accuracy and/or the completeness of nIFTY Indices or any data included therein and they shall have no liability for any errors, omissions, or interruptions therein. IISL make no warranty, express or implied, as to results to be obtained by HDFC AMC or any other person or entity from the use of nIFTY Indices or any data included therein. IISL make no express or implied warranties, and expressly disclaim all warranties of merchantability or fitness for a particular purpose or use with respect to the Index or any data included therein. Without limiting any of the foregoing, IISL expressly disclaim any and all liability for any damages or losses aris-ing out of the use of NIFTY Indices or any data included therein by any third party, including any and all direct, special, punitive, indirect, or consequential damages (including lost profits), even if notified of the possibility of such damages. An investor, by subscribing or purchasing an interest in the Product(s), will be regarded as having acknowledged, understood and accepted the disclaimer referred to in Clauses above and will be bound by it.
HDFC Floating Rate Income Fund - Short Term PlanMonthly Dividend Option (Past 3 months) Record Date Wholesale Option Wholesale Option - Direct Plan
Cum Div NAV (`)
Dividend per Unit (`) For Cum Div NAV (`)
Dividend per Unit (`) ForIndividuals & HUF Others Individuals & HUF Others
Jan 30, 17 10.2370 0.0671 0.0622 10.2380 0.0678 0.0628Feb 27, 17 10.1751 0.0224 0.0207 10.1760 0.0230 0.0213Mar 27, 17 10.1987 0.0394 0.0365 10.1995 0.0400 0.0371Record Date Retail Option
Cum Div NAV (`)
Dividend per Unit (`) ForIndividuals & HUF Others
Jan 30, 17 10.2350 0.0657 0.0608Feb 27, 17 10.1736 0.0213 0.0197Mar 27, 17 10.1971 0.0383 0.0355
HDFC Cash Management Fund - Treasury Advantage PlanMonthly Dividend Option (Past 3 months) Record Date Retail Option Retail Option - Direct Plan
Cum Div NAV (`)
Dividend per Unit (`) For Cum Div NAV (`)
Dividend per Unit (`) ForIndividuals & HUF Others Individuals & HUF Others
Dec 26, 16 - - - 10.1448 0.0017 0.0015Feb 27, 17 10.1618 0.0157 0.0146 10.1697 0.0196 0.0182Mar 27, 17 10.1856 0.0329 0.0305 10.1937 0.0370 0.0343Record Date Wholesale Option
Cum Div NAV (`)
Dividend per Unit (`) ForIndividuals & HUF Others
Dec 26, 16 10.1621 0.0015 0.0014Feb 27, 17 10.1869 0.0194 0.0180Mar 27, 17 10.2107 0.0366 0.0339
HDFC Corporate Debt Opportunities FundHalf-yearly Dividend Option (Past 2 years)
Record Date Regular Plan Direct Plan
Cum Div NAV (`)
Dividend per Unit (`) For Cum Div NAV (`)
Dividend per Unit (`) For
Individuals & HUF Others Individuals & HUF OthersMar 28, 16 10.7078 0.1560 0.1445 10.7651 0.1560 0.1445Sep 26, 16 11.1534 0.4842 0.4486 11.2653 0.5649 0.5234Mar 27, 17 10.9005 0.3051 0.2827 10.9506 0.3412 0.3161
^ Past performance may or may not be sustained in the future.There is no assurance or guarantee to Unit holders as to rate/quantum of dividend distribution nor that the dividends will be paid regularly.All dividends are on face value of ` 10 per Unit. After payment of the dividend, the per Unit nAV falls to the extent of the payout and statutory levy, if any.* Please log on to www.hdfcfund.com for Record Date-wise listing of dividends declared
Intouch mutually March 2017 83
ANDHRA PRADESHHDFC AMC Ltd., 18-2-299/B, 1st Floor, Leela Mahal Circle, Tirumala Bypass Road, Tirupati - 517 507.Tel: (0877) 2222 871 / 872 / 873 / 874, Fax: (0877) 2222689.HDFC AMC Ltd., 2nd Floor, Above HDFC Bank, near Benz Circle, M. G. Road, Vijayawada - 520 010.Tele Fax: (0866) 3988029.HDFC AMC Ltd., First Floor, Saigopal Arcade, Waltair Main Road, Siripuram, Visakhapatnam - 530 003.Tel: (0891) 3263457, 6634001, Fax: (0891) 6634004.
ASSAMHDFC AMC Ltd., Premises- 1C, 1st Floor, Ganpati Enclave, G.S.Road, Guwahati - 781 007.Tel: (0361) 2464759/60. Fax: (0361) 2464758.
BIHARHDFC AMC Ltd., Ishwari Complex, 1st Floor, Dr. Rajendra Prasad Road, Bhagalpur - 812 002.Tel: (0641) 2300 390, Fax: (0641) 2300391.HDFC AMC Ltd., Premises no. 04, 1st Floor, Dighra House, KPS Market, (Above Bandhan Bank),Pani Tanki Chowk, Ramna, Muzaffarpur - 842001.Tel: (0621) 2245036/37, Fax: (0621) 2245037.HDFC AMC Ltd., C/o Hera Enclave (Above TATA Docomo Office), 1st Floor, New Dak Bunglow Road, Patna - 800 001.Tel: (0612) 6457554/6457557/ 3201439, Telefax: (0612) 2200747.
CHHATTISGARHHDFC AMC Ltd., Shop no 1, Ground Floor, Old Sada Office Block, Nehru Nagar East, Bhilai - 490020.Tel: (0788) 4092948, 4092846, Fax: (0788) 4092901.HDFC AMC Ltd., 2nd Floor, Rama Trade Centre, Opposite Rajiv Plaza, near Bus stand, Bilaspur - 495 001.Tel: (07752) 400305/ 06. Fax: (07752) 400307.HDFC AMC Ltd., Ground Floor, Chawla Complex, Devendra nagar, Sai nagar Road, near Vanijya Bhawan, near Indhira Gandhi Square, Raipur - 492 001. Tel: (0771) 4020 167 / 168.
DELHIHDFC AMC Ltd., Ground Floor - 2 & 3 and First Floor, Prakashdeep Building, 7, Tolstoy Marg, Connaught Place,New Delhi - 110 001.Tel: (011) 6632 4000, Fax: (011) 23351317 /18.HDFC AMC Ltd. Unit Nos. 402, 404, 406, 4th floor, Mahatta Tower, 54 B-1 Block, Community Center, Janakpuri,New Delhi - 110 058. Fax: (011) 41082131HDFC AMC Ltd., 134/4 , Bhandari House, Lala Lajpat Rai Marg, Kailash Colony - Main Road, near Kailash Colony Metro Station, South Delhi, New Delhi - 110 048.Tel : 011-29244801/02. Fax : 011-29244805.
GOAHDFC AMC Ltd., Ground Floor, G3 & G4, Jivottam, Minguel Miranda Road, Off. Abade Faria Road, Margao - 403 601. Salcete. Tel: (0832) 2737410 / 11. Fax: (0832) 2736477.HDFC AMC Ltd., S1, Second Floor, Above Axis Bank, Edcon Centre, Angod, Mapusa - 403 507, Bardez, Goa. Tel: (0832) 2253 460 / 461, Fax: (0832) 2253465.HDFC AMC Ltd., A-3, First Floor, Krishna Building, Opp. Education Department, Behind Susheela Building, G. P. Road, Panaji - 403 001. Tel: 0832 - 2425609, 2425610, Fax: 0832 - 2425614.HDFC AMC Ltd., 6, Ground Floor, Pereira Chambers, Padre Jose Vaz Road, Vasco - 403 802, Mormugao. Tel: (0832) 2513 402 / 406, Fax: (0832) 2513448.
GUJARATHDFC AMC Ltd., 2nd Floor, Amruta Arcade, Maninagar station road, Maninagar, Ahmedabad - 380 008.HDFC AMC Ltd., 2nd Floor, Megha House, Besides GRUH House, Mithakhali Six Roads, Ahmedabad - 380 009. Tel.: 079 – 40220099/00, Fax: 079 - 40050506.HDFC AMC Ltd., Maruti Sharanam, no.117, 1st Floor, Anand-Vidhyanagar Road, Opposite nandbhumi Party Plot, Anand - 388 001. Tel: (02692) - 398200, Fax: (02692) - 398222.HDFC AMC Ltd., 3rd Floor, Shreemangalam Complex, Above IDBI Bank, Patel Society Road, Ward no. 1, Kasak Circle, Bharuch - 392 012. Tel: (0264) 2227205, Fax: (0264) 2227206.HDFC AMC Ltd., 2nd Floor, Gangotri Plaza, Opposite Daxinamurty School, Waghawadi Road, Bhavnagar - 364 001. Tel: (0278) - 3988029, Fax: (0278) - 3984039.HDFC AMC Ltd., 1st Floor, B Wing, Katira Complex, RTO Circle, Bhuj - 370 001. Tel: (02832) 223 223, Fax: (02832) 251. 946.
HDFC AMC Ltd., 2nd Floor, Keshav Complex, P n Marg, Opposite Dhanvantry, Jamnagar - 361 001. Tel: (0288) - 3988029, 2555663, Fax: (0288) - 3982426.HDFC AMC Ltd., 1st Floor, nos. 104 - 105, MaryGold-2 Complex, Opp. Bahhaudin College, College Road, Junagadh - 362001. Tel: (0285) 2670622/23, Fax: (0285) 2670624.HDFC AMC Ltd., F-2, First Floor, Sigma Oasis Complex, near HDFC Bank, State Highway Road, Mehsana - 384002,Tel: 02762-230121.HDFC AMC Ltd., 1st Floor, nandini Complex, Above HDFC Bank, Opp. Daboo Hospital, Station Road, Navsari - 396445. Tel: (02637) 252681/82/83, Fax: (02637) 252684.HDFC AMC Ltd., 2nd Floor, Shiv Darshan, Dr. Radha Krishnan Road, 5, Jagnath, Plot Corner, Rajkot - 360 001. Tel: 0281- 6624881 / 82, Fax: 0281 - 6624883.HDFC AMC Ltd., U1 - U3, Jolly Plaza, Opp. Athwa Gate Police Station, Athwa Gate, Surat - 395 001.Tel: 0261 – 2460082 / 83, Fax: 0261 - 2460091.HDFC AMC Ltd., Upper Ground Floor, Gokulesh, R. C. Dutt Road, Vadodara - 390 007. Tel: 0265 - 6621110 / 20, Fax: 0265 - 6621150.HDFC AMC Ltd., 5-B, 2nd Floor, Sapphire Building, Daulatnagar, Chala-Vapi Road, Vapi - 396 191. Tel: (0260) 3983900, Fax: (0260) 3983908.
HARYANAHDFC AMC Ltd., 3rd Floor, Shanti Complex, Jagadhri Road, Opp.Civil Hospital, Ambala Cantt - 133001. Tel: (0171) 2631995, Fax: (0171) 2631994.HDFC AMC Ltd., TA - 12A, 15-18, Third Floor, Crown Plaza, Sector 15A, Mathura Road, Faridabad - 121 001. Tel: (0124) 2221 338 / 339 / 341 / 342 / 343, Fax: (0129) 2221340.HDFC AMC Ltd., Premises 105, 106 & 107, 1st Floor, Vipul Agora Building, MG Road, Gurgaon - 122 002. Tel: (0124) 4056 916/ 4056 781 / 4056 586 / 4054 722, Fax: (0124) 4056 755.HDFC AMC Ltd., 1175 B Royal 1, 1st Floor, Adjoining Gurudawara, G.T Road, Panipat - 132 103. Tel: (0180) 3985400/ 01, Fax: (0180) 3985403.
HIMACHAL PRADESHHDFC AMC Ltd., 2nd Floor, Opposite Town Hall, 30, The Mall, Shimla - 171 001. Tel: (0177) 2816861.
JAMMU & KASHMIRHDFC AMC Ltd., Hall no-102 A/2, South Block, Bahu Plaza, Gandhi nagar, Jammu - 180 012. Tel: (0191)-2477911/12/13 / (0191) 2474297/98/99.
JHARKHANDHDFC AMC Ltd., Office Unit No. 105 & 106,1st Floor, Ozone Plaza, Bankmore, Dhanbad Jharia Road, Dhanbad - 826 001. Tel: (0326) 3205352, 2300552, Fax: (0326) 2301756.HDFC AMC Ltd., Gayatri Enclave, 2nd Floor, “K Road”, Bistupur, Jamshedpur - 831 001.Tel: (0657) 3021203/05, Telefax: (0657) 3021204.HDFC AMC Ltd., Pradhan Towers, 1st Floor, 5, Main Road, Ranchi - 834 001. Tel: (0651) 6003358, 3242077. Fax: (0651) 3988029.
KARNATAKAHDFC AMC Ltd., nitesh Broadway, no. 9/3, 1-A, Ground Floor, M. G. Road, Opposite Trinity Metro Station, Bangalore - 560001. Tel: 080-66205300, Fax: 080-41125255.HDFC AMC Ltd., #80/1, Ground Floor, Sriranga nilaya, West Park Road,18th Cross Road, Malleswaram, Bangalore - 560 003.HDFC AMC Ltd., Garla Garnet no. 119/A/36, 9th Main, 4th Block, Jayanagar, Bangalore - 560011. Tel no: (080) 41460260/61/62, Fax no: (080) 41460263.HDFC AMC Ltd., no. 3, 1st Floor, A.V.S. Compound, 80 feet Road, Koramangala, Bangalore - 560 034.HDFC AMC Ltd., Premises no. 4830 / B, First Floor,Dr. Ambedkar Road, Opp. Civil Medical College, Belgaum - 590 002. Tel: (0831) 4206 915 / 916 / 918, Fax: (0831) 4206918.HDFC AMC Ltd., Office No. 39 (Old No - 41), Ground Floor, Behind Maremma Temple, Opposite HDFC Bank, Kappagal Road, Bellary - 583103.Tel: 08392-256577. Fax: 08392-256575.HDFC AMC Ltd., 190/3, 1st Floor, S.V.C. Plaza, Opposite Mothi Talkies, Gandhi Circle, Davangere - 577 002. Tel: (08192) 250 240 / 241 / 242, Fax: (08192) 250243.HDFC AMC Ltd., no. 1, First Floor, Revankar Comforts, Vivekanand Road, Court Circle, Hubli - 580 029. Tel: (0836) 4252 294 / 95. Fax: (0836) 4252 290.
HDFC AMC Ltd., UG-II, 6 & 7, Upper Ground Floor, Maximus Commercial Complex, Light House Hill Road, Opp. KMC, Mangalore - 575 001. Tel. 0824 – 6620667/668, Fax: 0824 – 6620666.HDFC AMC Ltd., no. 2918, CH 51 / 1 B, 1st Floor, Patel Mansion, Kantharaj Urs Road, Saraswathipuram, Mysore - 570 009. Tel: (0821) 4000 530, Fax: (0821) 4000 535.
KERALAHDFC AMC Ltd., 3rd Floor, City Mall, Opposite YMCA, Kannur Road, Calicut - 673 001. Tel: (0495) - 4099222 / 333, 3982310, Fax: (0495) - 3982330.HDFC AMC Ltd., Ground Floor Cinema cum Commercial Complex, Behind Ravipuram Bus Stop, M. G. Road, Kochi - 682 016. Tel: 0484 - 6555155 / 255, Fax: 0484 - 2358462.HDFC AMC Ltd., 14/868, Ground Floor, Sri Krishna Complex, Coimbatore Road, Palghat - 678 001.Tel: (0491) 2548300/302, 6452188, Fax: (0491) 2548303.HDFC AMC Ltd., 2nd Floor, E-Town Shopping, College Road, East Fort, Thrissur - 680 005. Tel: (0487) 2441976. Telefax: (0487) 2422925.HDFC AMC Ltd., 1st Floor, Kaniamparambil Arcade, G S Junction, Shastri Road, Kottayam - 686 001. Tel: (0481) 2585456 / 57. Fax: (0481) 3018397.HDFC AMC Ltd., Ground Floor, Bhadra Tower, Cotton Hill Road, Vazhuthacaud, Thycaud P.O., Trivandrum – 695 014. Tel: (0471) 3983 730 / 731 / 732 Fax: (0471) 3983738.
MADHYA PRADESHHDFC AMC Ltd., 1st Floor, Ranjeet Tower, 8, Zone-II, M. P. nagar, Bhopal - 462 011. Tel: 0755 - 4285385, 4246995, Fax: 0755 - 4058890.HDFC AMC Ltd., M1, M2 & M3, Mezzanine Floor, Sterling Arcade,15 / 3, Race Course Road, Indore - 452 001.Tel: 0731 - 4022241 / 42. Fax: 0731 - 4245436.HDFC AMC Ltd., First Floor, Muthye Udyog Bhawan,1039, Wright Town, Opp. Telephone Exchange, Jabalpur - 482 002. Tel: (0761) - 4049800, 3988029 Fax: (0761) - 4068814.HDFC AMC Ltd., First Floor, Alakhnanda Towers, Shrimant Madhav Rao Scindia Marg, City Centre, Gwalior - 474 001. Tel: (0751) - 4066060, 3988029 Fax: (0751) – 3982803.
MAHARASHTRAHDFC AMC Ltd., 1st Floor, Amar Arcade - 2, Opp. Rajapeth Police Station, Raja Peth, Amravati - 444 601. Tel: (0721) 2562 112 / 113 Fax: (0721) 2564115.HDFC AMC Ltd., near Samarth Cyber Cafe, 3419-Khist Galli, Ahmednagar - 414 001. Tel: (0241) 2345 800, Fax: (0241) 2345 801.HDFC AMC Ltd., 2nd Floor, Renuka Commercial Complex, Samarth nagar, nirala Bazar, nageshwar Wadi Road, Aurangabad - 431 001. Tel: (0240) 3988029, Fax: (0240) 3982068.HDFC AMC Ltd., 138, Ground Floor, Kavya Ratnavali Chowk, Omkareshwar Road, Jalgaon – 425 002. Tel: (0257) 3982100/ 01. Fax: (0257) 3982114.HDFC AMC Ltd., Royal Prestige, C1/C9, 1st Floor, E - Ward, Sykes Extension, Rajarampuri Road, Kolhapur - 416 008. Tel: (0231) - 3988029, Fax: (0231) - 3982060.HDFC AMC Ltd.**, Premises nos.. F1, 2, 3 & 4, 1st Floor, “Center Square”, S.V. Road, Andheri (W), Mumbai - 400 058. Tel: (022) 26708239 / 26285389. Fax: (022) 26241131.HDFC AMC Ltd.** Shop no. 5 - 6, 1st Floor, Mayfair 14,Ramdas Sutrale Marg, Off Chandravarkar Road, Borivali (W), Mumbai - 400 092. Tel: (022) 28952702/ 28901497, Fax: (022) 28949392.HDFC AMC Ltd.,* HDFC House, 2nd floor, H.T. Parekh Marg,165-166 Backbay Reclamation, Churchgate, Mumbai - 400 020.Tel: (022) 66316333, Fax: (022) 66580200.HDFC AMC Ltd., Ramon House, 1st Floor, H.T Parekh Marg, 169, Backbay Reclamation, Churchgate, Mumbai - 400 020. Fax: (022) 66146385.HDFC AMC Ltd.**, 119, First Floor, Zest Business Space, M.G Road, Ghatkopar East, Mumbai - 400 077.Tel: (022) 25011507, 25011664, Fax: (022) 25116805.HDFC AMC Ltd.**, # 201, Durga Centre, 2nd Floor, Water Field Road, Bandra (West), Mumbai - 400 050. Tel: (022) 2643 4760 / 762 / 763 / 764, Fax: (022) 2643 4768.HDFC AMC Ltd., 159, 1st floor, Galleria Shopping Mall, Hiranandani Garden, Powai, Mumbai - 400 076.Tel: (022) 2570 8471 / 72. Fax: (022) 2570 8473.HDFC AMC Ltd. Shop no 2, Ground floor, Sunvision Avenue, Opp SBBJ and LIC, S.V Road, Malad (W), Mumbai - 400 064.HDFC AMC Ltd. Shop no 13 & 14, Ground floor, Virar Bolinj Shakti, Agasi Road, Virar (W), Mumbai - 401 303.
INVESTOR SERVICE CENTRES (ISCs)
(Continued on next page)
HDFC AMC Ltd., Shop no 127, Bahirwade Chambers, Opp. Hotel Hilton (erstwhile Panchshil), Telco Road, Chinchwad, Pune - 411019. Tel: (020) 2747 7771 / 2, Fax: (020) 2747 7774.HDFC AMC Ltd.**, Shop no. 1 & 2, Ground floor, Gurangi Chambers, Opp. Damani Chambers, near Teen Haath naka, LBS Marg, Thane (West) - 400 602. Tel: (022) 2538 5659, 2539 1125, 2538 6848, 6502 0205, 6536 5246, 6536 5245, 6414 2389, Fax: (022) 25301125.HDFC AMC Ltd., 106-110, 2nd Floor, Shriram Shyam Towers, near nIT Building, Kingsway, Sadar, Nagpur - 440 001. Tel: (0712) 663 0301/02/04, Fax: (0712) 663 0206.HDFC AMC Ltd., G-2, “Suyojit Heights”,Opp. Rajiv Gandhi Bhavan, Sharanpur Road, Nashik - 422 002. Tel: (0253) 6611831 / 32. Fax: (0253) 6611836.HDFC AMC Ltd., Shop no. 2 & 3, East Street Galleria, 2421, East Street, Camp, Pune - 411 001.Tel.: (020) 41223301/02, Fax: (020) 41223310.HDFC AMC Ltd., Ground Floor, City Mall, University Circle, Ganeshkhind Road, Pune - 411 007. Tel: (020) 66073301, Fax: (020) 66073310.HDFC AMC Ltd.,** Office No. 13, Shanti Center Premises, Plot no. 8, Sector 17, Vashi, Navi Mumbai - 400 703. Tel: (022) 27661121. Fax: (022) 39855612.HDFC AMC Ltd.**, 1st Floor, Anant Kuti (Bibikar Bldg.), Manpada Road, Opp. Muncipal Corporation Bldg., Dombivli (East), Mumbai - 421 201. Tel: (0251) 2860 648 / 649 / 645 / 656, Fax: (0251) 2863953.
ORISSAHDFC AMC Ltd., Sri Jagannath Complex, 1st Floor, Opposite Hari - Omm Bhawan, Barbil - 758 035. Tel: 09238106515 / 09238106525, Fax: (06767) 275565.HDFC AMC Ltd., Vinayak, 2nd Floor, 96, Janpath, Bhubaneswar - 751 001. Tel: (0674) 6450502 / 1502, Fax: 0674 - 2531483.HDFC AMC Ltd., 1st Floor, Plot no. 2690 (P), Bajrakabati Road, Ranihat, Cuttack - 753 001. Tel: (0671) 2323724/ 725, Fax: (0671) 2324741.HDFC AMC Ltd., Praful Tower, 1st Floor, Panposh Road, Rourkela - 769 004. Tel: (0661) 2400261/2/7, Fax: (0661) 2400269.HDFC AMC Ltd., Kadambari Complex, 1st Floor, Unit - 4, nayapara, Golbazar, Sambalpur - 768 001. Tel: (0663) 2400 323 / 339, Fax: (0663) 2400324.
PONDICHERRYHDFC AMC Ltd., no.17, I Floor, Sree Velayudham Complex, near Indhira Gandhi Square, natesan nagar, Pondicherry - 605 005. Tel: (0413) 3043 293 / 500 / 600. Fax: (0413) 2206776.
PUNJABHDFC AMC Ltd., SCO-28, 1st Floor, Taneja Towers, District Shopping Complex, Ranjit Avenue, Amritsar -143 001. Tel: (0183) 3988028 /29/ 2570, Fax: (0183) 3982599.HDFC AMC Ltd., Ground Floor, Liberty Chowk, Corner Building, Municipal no. 83 - B, 3A, Bhatinda - 151 001. Tel.: (0164) 5001982, Fax: (0164) 5191283.HDFC AMC Ltd., 1st Floor, SCO- 2909- 2910, Sector - 22-C, Opp. Hotel J W Marriot, Chandigarh - 160 022. Tel: (0172) 5050888, Fax: (0172) 277 1219.HDFC AMC Ltd., Ground Floor, Eminent Mall, Sutheri Road, near Indusind Bank, Hoshiarpur - 146 001.Tel : 01882- 502029, Fax : 01882- 502078.HDFC AMC Ltd., Office No. 31, 1st Floor, City Square Building, Civil Lines, GT Road, Jalandhar - 144001. Tel: (0181) 5004028, Fax: (0181) 5004029.HDFC AMC Ltd., SCO 122, Feroze Gandhi Market, Ludhiana - 141 001. Tel.: (0161) 277 4321 / 5014321. Fax: (0161) 3013838.
HDFC AMC Ltd., SCO no - 70 , Ground Floor, new Leela Bhawan Market, Patiala -147 001. Tel : 0175 - 5010082, Fax : 0175 - 5010084.
RAJASTHANHDFC AMC Ltd., 2nd Floor, Above ICICI Bank, India Heights Building, India Motor Circle, Ajmer - 305 001. Tel: (0145) 2620660, Fax: (0145) 2420660.HDFC AMC Ltd., “Moondhra Bhavan”, 3-Ajmer Road, Jaipur - 302 001. Tel: (0141) 421 9000, Fax: (0141) 421 9004.HDFC AMC Ltd., Plot no. 654 A/B, 1st Floor, Shree Pratap Tower, Jaljog Circle, Jodhpur - 342 003.Tel: (0291) 510 1927, 510 1937, Fax: (0291) 510 5919. HDFC AMC Ltd., 1st Floor, Gowardhan Plaza, 25, Trench Colony, Opposite Lok Kalamandal, Udaipur - 313 001. Tel: (0294) 3988029, Fax: (0294) 3982000.
TAMIL NADUHDFC AMC Ltd., ITC Centre, 1st Floor, 760, Anna Salai, Chennai - 600 002. Tel: (044) 43979797 / 43979716, Fax: (044) 28415855.HDFC AMC Ltd., 1371A, Ground Floor, nadar Building, Trichy Road, Coimbatore - 641 018. HDFC AMC Ltd., No : 9, “Aurum” Building, First floor, Kannusamy Road, R.S.Puram, Coimbatore - 641002.Tel: (0422) 4391861/62/63. Fax: (0422) 4391714.HDFC AMC Ltd., 127 C/3 East Veli Street, Madurai - 625 001. TeleFax: (0452) 3988029.HDFC AMC Ltd., 1st Floor, no1 Bhimsena Garden Street, Royapettah High Road, Mylapore, Chennai - 600 004. Tel: (044) 30913060, Fax: (044) 30913082.HDFC AMC Ltd., 74, V Block, 5th Avenue, near Ganga Sweets, Anna nagar, Chennai - 600 040.HDFC AMC Ltd., 1st floor, Ram Complex, No. 454/3, Meyanoor Main Road, Salem - 636 009. Phone: (0427) 398 2680, Fax: (0427) 398 2700.HDFC AMC Ltd., 1st floor, No. 142/7, Sri Balaji Arcade, Opp. Alagar Jewellery, Trivandrum Road, Palayamkottai, Tirunelveli - 627 002. Tel: (0462) 257 6174, Fax: (0462) 257 6173.HDFC AMC Ltd., no. 60, Sri Krishna Arcade, First Floor, Tennur High Road, Tennur, Trichy - 620 017. Tel: (0431) 3982830, Fax: (0431) 3982835.HDFC AMC Ltd., Premises no.73, 1st Floor, Door no. 73/19,Thiyagarjapuram Officer’s Line Officer’s Line, Vellore - 632 001,Tel: (0416) 2214670/2. Fax: (0416) 2214671.
TELANGANAHDFC AMC Ltd., 6-3-883/7, IInd Floor, Saphire Square, Somajiguda, Hyderabad - 500 282. Tel.: (040) 6704 3657, Fax: (040) 23417407.HDFC AMC Ltd., Gem Square, 1-88/2, 1st floor, Hi-tech City main road, Above HDFC Bank Madhapur, After Indian Oil Petrol Pump, near Krissh Saphire, Madhapur, Hyderabad - 500081.Tel.: (040) 66636690/1/3/4 , Fax: (040) 66636692.HDFC AMC Ltd., 2-5-83/84, 1st Floor, Mitralaxmi narayana Arcade, nakkala Gutta, Hanmakonda, Warangal - 506 002. Tel: (0870) 2566 005 / 006 / 007 / 008/ 009, Fax: (0870) 2566010.
UTTARAKHANDHDFC AMC Ltd., 74 (new no 250/466), Rajpur Road,1st Floor, Shri Ram Arcade, Dehradun - 248 001.Tel: (0135) 3988029 / 7434, Fax: (0135) 3987444.HDFC AMC Ltd., Plot no. 1, 1st Floor, Durga City Centre, Bhotia Parao, nainital Road, Haldwani - 263 139. Tel: (05946) 285286 Fax: (05946) 285290.HDFC AMC Ltd., 1st Floor, Kumar Complex, Chandracharya Chowk, Haridwar - 249407.Tel: (01334) 222406/7 Fax: (01334) 222410.
UTTAR PRADESHHDFC AMC Ltd., 1-C, First Floor, Block no 10/8, Padamdeep Building, Sanjay Place, Agra - 282 002.Tel: (0562) 3984761-73, Fax: (0562) 3984777.HDFC AMC Ltd., 3/260-A, Arena Complex, Laxmibai Marg, Marris Road, Aligarh - 202 001. Tel: (0571) 6453 106 / 9, Fax: (0571) 2740772.HDFC AMC Ltd., 3rd Floor, Agarwal Arcade, Hyundai Motors Showroom, 4 Sardar Patel Marg, Civil Lines, Allahabad - 211 001. Tel: (0532) 2561 035/036/038, Fax: (0532) 2561035.HDFC AMC Ltd., 146 Civil Lines, 1st Floor, Gupta Complex, near Circuit House Chouraha, Bareilly - 243 001. Tel: (0581) 2510 749 / 759, Fax: (0581) 2510709.HDFC AMC Ltd., D-2, 1st Floor, Raj nagar District Centre, Raj nagar, Gaziabad - 201 010. Tel: (0120) 301 0635, Fax: (0120) 3010636.HDFC AMC Ltd., 4th Floor, A.D. Tower Compound, Bank Road, Gorakhpur - 273 001, Tel. no: (0551) 6060011/2/3.HDFC AMC Ltd., 101 & 201, Sai Arcade, 16/34 Bhargava Estate, Civil Lines, Kanpur - 208 001. Tel: (0512) 3935592/93/94, Fax: (0512) 3935596.HDFC AMC Ltd., 1st Floor, narain Ford Building, 4 Shah najaf Road, Hazratganj, Lucknow - 226 001. Tel: (0522) 4155500/ 01, Fax: (0522) 4155555.HDFC AMC Ltd., 143/145/1, Ganpati Plaza, Ground Floor, Magal Pandey nagar, Meerut - 250 005. Tel: (0121) 2602 380 / 2601 965, Fax: (0121) 2602380.HDFC AMC Ltd., Parsvnath Plaza-II, UGF Hall no.4, Delhi Road, Moradabad - 244 001. Tel: (0591) 3988029 / 3982131. Fax: (0591) 3982137.HDFC AMC Ltd., K-24/25, First Floor, Pearl Plaza Building, Sector-18, Noida - 204 301. Tel: (0120) 432 5757/ 5959. Fax: (0120) 423 4349.HDFC AMC Ltd., D-64/127, 4th Floor, Arihant Complex, Sigra, Varanasi - 221 010. Tel: (0542) 6450711/ 6450712.
WEST BENGALHDFC AMC Ltd., 2nd Floor, Chatterjee Plaza, 69/101, GT Road, Rambandhutala, Asansol - 713 303. Tel: (0341) 2221220, Fax: (0341) 2221219.HDFC AMC Ltd., City Plaza, City Centre, 1st Floor,Durgapur - 713 216. Tel: (0343) 3982150, Fax: (0343) 3982153. HDFC AMC Ltd., Krishna Enclave, 2nd Floor, 2/1, Bhajanlal Lohia Lane, Opposite Howrah A.C. Market, Howrah - 711 101, Phone: (033) 33546150/163, Fax: (033) 33546157.HDFC AMC Ltd., Menaka Estate, 1st Floor, 3 Red Cross Place, Kolkata - 700 001. Tel: (033) 22312875, 22312876, Fax: (033) 22439582.HDFC AMC Ltd., 2nd Floor, 209A, Sarat Bose Road, Besides Sarat Bose Road Post Office, Kolkata - 700029. Tel: (033) 33546028, Fax: (033) 33541172.HDFC AMC Ltd., CF 352, Sector 1, Salt Lake City, Kolkata - 700 064.HDFC AMC Ltd., Hinterland Complex - 2, 6/A Roy Ghat Lane, Serampore - 712201.HDFC AMC Ltd., Gitanjali Complex, 2nd Floor, Above Corporation Bank, Sevoke Road, Siliguri - 734 001. Tel: (0353) 6453474. Fax: (0353) 2545270.
* This is not an Investor Service Centre for HDFC Mutual Fund. However, this is an official point of acceptance for acceptance of all on-going transactions from Institutional Investors only, i.e. broadly covering all entities other than resident / non resident individuals. Institutional Investors are free to lodge their applications at any other official points of acceptance also.** Official points of acceptance of transactions for schemes of HDFC Mutual Fund except purchase transactions of Liquid Schemes / Plans viz. HDFC Liquid Fund, HDFC Liquid Fund - Premium Plan and HDFC Cash Management Fund - Savings Plan & Call Plan.
INVESTOR SERVICE CENTRES (ISCs)(Continued from previous page)
WAnT TO HAVE THE LATEST InFORMATIOn ABOUT US?Visit us at www.hdfcfund.com
Telephone ServicesToll-free number: 1800 3010 6767 / 1800 419 7676
For any query or suggestions:-
Investors may contact us at:[email protected]
Distributors may contact us at:[email protected]
SMS: HDFCMF to 56767
Registered Office: HDFC House, 2nd Floor, H.T. Parekh Marg, 165-166 Backbay Reclamation, Churchgate, Mumbai - 400 020.
MUTUAL FUND INVESTMENTS ARE SUBJECT TO MARKET RISKS, READ ALL SCHEME RELATED DOCUMENTS CAREFULLY.