march 2014 • number 136 why is reducing energy subsidies a...
TRANSCRIPT
1 POVERTY REDUCTION AND ECONOMIC MANAGEMENT (PREM) NETWORK www.worldbank.org/economicpremise
MARCH 2014 • Number 136
Why Is Reducing Energy Subsidies a Prudent, Fair, and Transformative Policy for Indonesia?
If there was one bold and timely policy to transform Indonesia, this is it. In 2012, spending on energy subsidies claimed more than one-fifth of the central government’s budget, that is, more than three times the allocation for infrastructure such as roads, water, electricity and irrigation networks, and three times the governmentwide spending on health. In addition to crowding out high-priority spending, subsidies disproportionately benefit households at the top of the income distribution and throw sand on Indonesia’s remarkable record of prudent macroeconomic management. Not to mention how subsidies create disincentives for saving energy, developing alternative energy sources, and reducing carbon dioxide emissions. Given their adverse short- and long-term economic consequences, reducing them—with the appropriate safe-guards to protect the poor—is a fair, prudent, and transformative policy.
How Large Are Energy Subsidies?
Indonesia has been subsidizing fuel (gasoline, diesel, kero-sene, and liquefied petroleum gas [LPG]) since the 1970s, when the world experienced its first oil price shock. The government fixed and kept the price of fuel at a very low level (below $.201 per litre) until 2005, with the budget bearing the cost differential between the administered and market price. In 2012, the market price of gasoline, reflect-ing the world oil price in U.S. dollars and the dollar-rupiah exchange rate, averaged Rp9,500 per litre. The adminis-tered price for the product stood at Rp4,500 per litre, im-plying a subsidy rate of a bit more than 50 percent. The sub-sidy for gasoline and other fuel products translated into a budget allocation of Rp212 trillion ($21 billion), or 21 per-cent of the central government’s budget and 2.6 percent of gross domestic product (GDP). Adding the subsidy spend-ing for electricity (Rp94.6 trillion, or about $9.4 billion), total energy subsidies reached Rp306.5 trillion ($30 bil-lion), or 3.7 percent of GDP in 2012.
Ndiame Diop
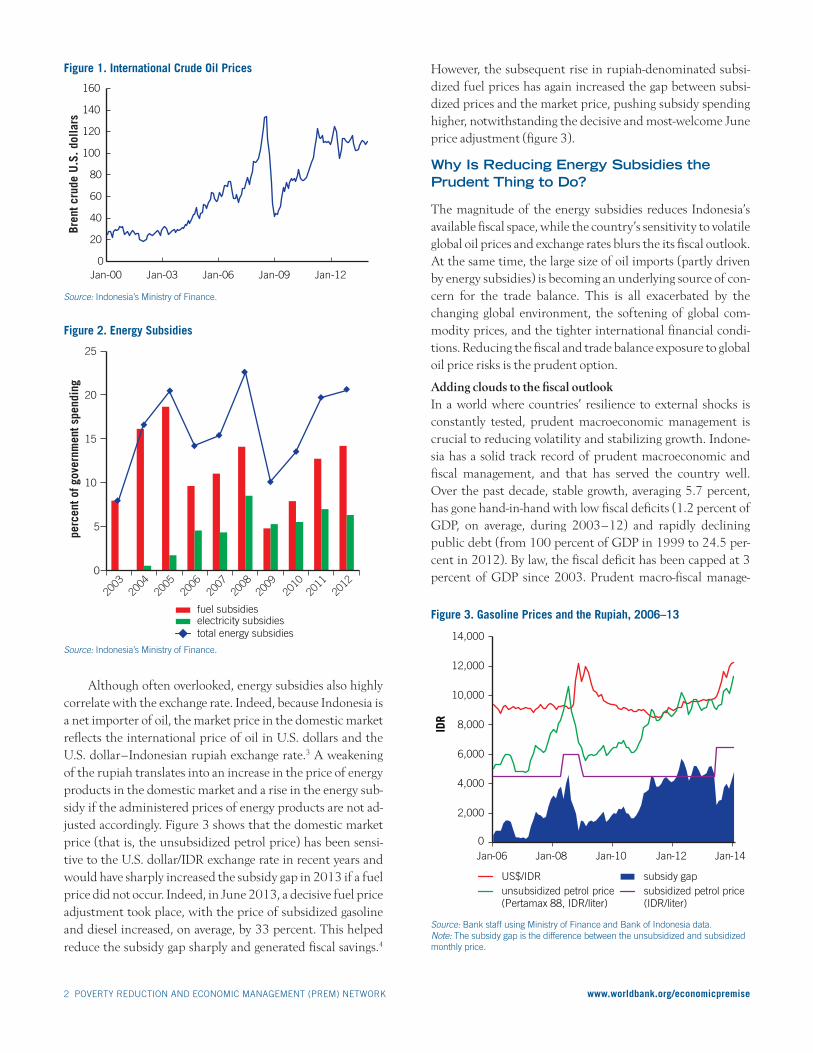
Naturally, the fiscal burden of energy subsidies closely tracks the vagaries of global oil prices. Over the past decade, the world experienced several peaks in global oil prices, for ex-ample, in 2005 and 2008, and in February 2011, when oil prices again breached $100 per barrel and have stayed above this level ever since (figure 1). Mimicking oil prices, the cost of Indonesia’s energy subsidies rose sharply in 2005 and 2008, triggering two major fuel subsidy reforms. In 2005, the gov-ernment more than doubled the price of fuel. After this move, the fiscal burden of energy subsidies declined significantly, un-til 2007, when world oil prices began to rise again. In May 2008, when the global oil prices reached a record high, the government raised the prices of gasoline and diesel by nearly 30 percent. When world oil prices rallied again in 2010–12, following a sharp drop in 2009, the government tried to un-dertake another series of fuel price hikes, but could not imple-ment them.2 As a result, energy subsidies have remained slightly above 20 percent of the central government’s total spending since 2011, against 10 percent in 2009 (figure 2).
2 POVERTY REDUCTION AND ECONOMIC MANAGEMENT (PREM) NETWORK www.worldbank.org/economicpremise
Although often overlooked, energy subsidies also highly correlate with the exchange rate. Indeed, because Indonesia is a net importer of oil, the market price in the domestic market reflects the international price of oil in U.S. dollars and the U.S. dollar–Indonesian rupiah exchange rate.3 A weakening of the rupiah translates into an increase in the price of energy products in the domestic market and a rise in the energy sub-sidy if the administered prices of energy products are not ad-justed accordingly. Figure 3 shows that the domestic market price (that is, the unsubsidized petrol price) has been sensi-tive to the U.S. dollar/IDR exchange rate in recent years and would have sharply increased the subsidy gap in 2013 if a fuel price did not occur. Indeed, in June 2013, a decisive fuel price adjustment took place, with the price of subsidized gasoline and diesel increased, on average, by 33 percent. This helped reduce the subsidy gap sharply and generated fiscal savings.4
However, the subsequent rise in rupiah-denominated subsi-dized fuel prices has again increased the gap between subsi-dized prices and the market price, pushing subsidy spending higher, notwithstanding the decisive and most-welcome June price adjustment (figure 3).
Why Is Reducing Energy Subsidies the Prudent Thing to Do?
The magnitude of the energy subsidies reduces Indonesia’s available fiscal space, while the country’s sensitivity to volatile global oil prices and exchange rates blurs the its fiscal outlook. At the same time, the large size of oil imports (partly driven by energy subsidies) is becoming an underlying source of con-cern for the trade balance. This is all exacerbated by the changing global environment, the softening of global com-modity prices, and the tighter international financial condi-tions. Reducing the fiscal and trade balance exposure to global oil price risks is the prudent option.
Adding clouds to the fiscal outlookIn a world where countries’ resilience to external shocks is constantly tested, prudent macroeconomic management is crucial to reducing volatility and stabilizing growth. Indone-sia has a solid track record of prudent macroeconomic and fiscal management, and that has served the country well. Over the past decade, stable growth, averaging 5.7 percent, has gone hand-in-hand with low fiscal deficits (1.2 percent of GDP, on average, during 2003–12) and rapidly declining public debt (from 100 percent of GDP in 1999 to 24.5 per-cent in 2012). By law, the fiscal deficit has been capped at 3 percent of GDP since 2003. Prudent macro-fiscal manage-
Figure 2. Energy Subsidies
Figure 1. International Crude Oil Prices
0
20
40
60
80
100
120
140
160
Jan-00 Jan-03 Jan-06 Jan-09 Jan-12
Bren
t cru
de U
.S. d
olla
rs
Source: Indonesia’s Ministry of Finance.
Source: Indonesia’s Ministry of Finance.
Source: Bank staff using Ministry of Finance and Bank of Indonesia data.Note: The subsidy gap is the difference between the unsubsidized and subsidized monthly price.
Figure 3. Gasoline Prices and the Rupiah, 2006–13
0
2,000
4,000
6,000
8,000
10,000
12,000
14,000
Jan-06 Jan-08 Jan-10 Jan-12 Jan-14
IDR
subsidy gapUS$/IDRunsubsidized petrol price (Pertamax 88, IDR/liter)
subsidized petrol price (IDR/liter)
0
5
10
15
20
25
perc
ent o
f gov
ernm
ent s
pend
ing
fuel subsidies electricity subsidies total energy subsidies
2003
2012
2011
2010
2009
2008
2007
2006
2005
2004
3 POVERTY REDUCTION AND ECONOMIC MANAGEMENT (PREM) NETWORK www.worldbank.org/economicpremise
ment has allowed Indonesia to weather a range of external shocks, including the 2009 global financial crisis, and main-tain high and stable growth over the past four decades. Going forward, good macro and fiscal policies remain central to sus-taining Indonesia’s rapid and stable economic growth.
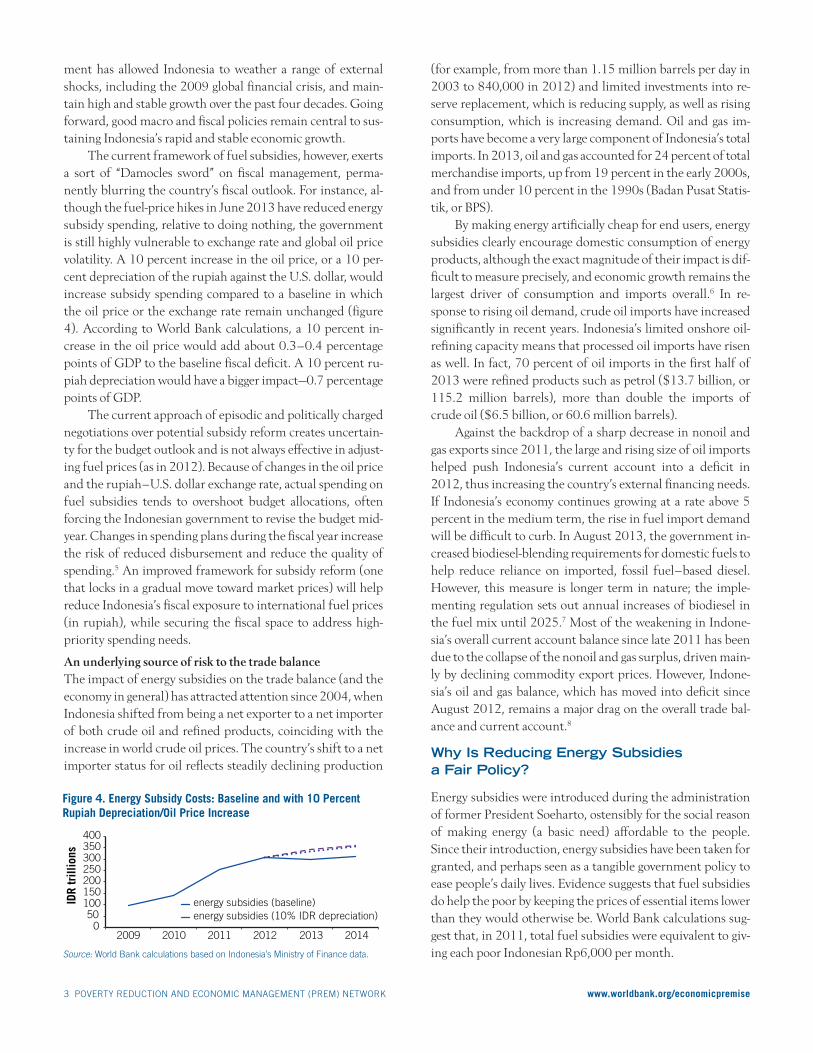
The current framework of fuel subsidies, however, exerts a sort of “Damocles sword” on fiscal management, perma-nently blurring the country’s fiscal outlook. For instance, al-though the fuel-price hikes in June 2013 have reduced energy subsidy spending, relative to doing nothing, the government is still highly vulnerable to exchange rate and global oil price volatility. A 10 percent increase in the oil price, or a 10 per-cent depreciation of the rupiah against the U.S. dollar, would increase subsidy spending compared to a baseline in which the oil price or the exchange rate remain unchanged (figure 4). According to World Bank calculations, a 10 percent in-crease in the oil price would add about 0.3–0.4 percentage points of GDP to the baseline fiscal deficit. A 10 percent ru-piah depreciation would have a bigger impact—0.7 percentage points of GDP.
The current approach of episodic and politically charged negotiations over potential subsidy reform creates uncertain-ty for the budget outlook and is not always effective in adjust-ing fuel prices (as in 2012). Because of changes in the oil price and the rupiah–U.S. dollar exchange rate, actual spending on fuel subsidies tends to overshoot budget allocations, often forcing the Indonesian government to revise the budget mid-year. Changes in spending plans during the fiscal year increase the risk of reduced disbursement and reduce the quality of spending.5 An improved framework for subsidy reform (one that locks in a gradual move toward market prices) will help reduce Indonesia’s fiscal exposure to international fuel prices (in rupiah), while securing the fiscal space to address high-priority spending needs.
An underlying source of risk to the trade balance The impact of energy subsidies on the trade balance (and the economy in general) has attracted attention since 2004, when Indonesia shifted from being a net exporter to a net importer of both crude oil and refined products, coinciding with the increase in world crude oil prices. The country’s shift to a net importer status for oil reflects steadily declining production
(for example, from more than 1.15 million barrels per day in 2003 to 840,000 in 2012) and limited investments into re-serve replacement, which is reducing supply, as well as rising consumption, which is increasing demand. Oil and gas im-ports have become a very large component of Indonesia’s total imports. In 2013, oil and gas accounted for 24 percent of total merchandise imports, up from 19 percent in the early 2000s, and from under 10 percent in the 1990s (Badan Pusat Statis-tik, or BPS).
By making energy artificially cheap for end users, energy subsidies clearly encourage domestic consumption of energy products, although the exact magnitude of their impact is dif-ficult to measure precisely, and economic growth remains the largest driver of consumption and imports overall.6 In re-sponse to rising oil demand, crude oil imports have increased significantly in recent years. Indonesia’s limited onshore oil-refining capacity means that processed oil imports have risen as well. In fact, 70 percent of oil imports in the first half of 2013 were refined products such as petrol ($13.7 billion, or 115.2 million barrels), more than double the imports of crude oil ($6.5 billion, or 60.6 million barrels).
Against the backdrop of a sharp decrease in nonoil and gas exports since 2011, the large and rising size of oil imports helped push Indonesia’s current account into a deficit in 2012, thus increasing the country’s external financing needs. If Indonesia’s economy continues growing at a rate above 5 percent in the medium term, the rise in fuel import demand will be difficult to curb. In August 2013, the government in-creased biodiesel-blending requirements for domestic fuels to help reduce reliance on imported, fossil fuel–based diesel. However, this measure is longer term in nature; the imple-menting regulation sets out annual increases of biodiesel in the fuel mix until 2025.7 Most of the weakening in Indone-sia’s overall current account balance since late 2011 has been due to the collapse of the nonoil and gas surplus, driven main-ly by declining commodity export prices. However, Indone-sia’s oil and gas balance, which has moved into deficit since August 2012, remains a major drag on the overall trade bal-ance and current account.8
Why Is Reducing Energy Subsidies a Fair Policy?
Energy subsidies were introduced during the administration of former President Soeharto, ostensibly for the social reason of making energy (a basic need) affordable to the people. Since their introduction, energy subsidies have been taken for granted, and perhaps seen as a tangible government policy to ease people’s daily lives. Evidence suggests that fuel subsidies do help the poor by keeping the prices of essential items lower than they would otherwise be. World Bank calculations sug-gest that, in 2011, total fuel subsidies were equivalent to giv-ing each poor Indonesian Rp6,000 per month. Source: World Bank calculations based on Indonesia’s Ministry of Finance data.
Figure 4. Energy Subsidy Costs: Baseline and with 10 Percent Rupiah Depreciation/Oil Price Increase
050
100150200250300350400
2009 2010 2011 2012 2013 2014
IDR
trill
ions
energy subsidies (baseline)energy subsidies (10% IDR depreciation)
4 POVERTY REDUCTION AND ECONOMIC MANAGEMENT (PREM) NETWORK www.worldbank.org/economicpremise
However, fuel subsidies disproportionately benefit households at the top of the income distribution: 84 percent of all benefits (that is, Rp178 trillion out of the Rp212 tril-lion, or $18 billion out of $21 billion, in 2012) go to the top half of households by consumption, and only 16 percent (Rp33 trillion) to the bottom half. Forty percent of subsidy benefits go to the richest 10 percent of households, and less than 1 percent goes to the poorest 10 percent. Fuel subsidies are, in fact, generous transfers of taxpayer money to the rich.
Moreover, about two-thirds of poor and near-poor house-holds do not consume any gasoline at all, although the likeli-hood of them consuming gasoline, and the actual volume that they would consume, would rise if their incomes increased. With respect to diesel, few households report any consump-tion. Therefore, commercial and other users are estimated to account for virtually all (98 percent) consumption of subsi-dized diesel. If the objective was to provide social assistance to the poor and the near poor, the energy subsidy has been high-ly ineffective.
Because raising fuel prices temporarily augments head-line inflation (the June 2013 fuel subsidy reform added 2.9 percentage points to inflation by August, year on year), it is important that poor and vulnerable households are cush-ioned from the immediate adverse impacts of higher energy prices. Indonesia has systematically been able to soften the impacts so far. In 2005 and 2008, the government introduced temporary unconditional cash transfers, with monthly cash payments distributed to 19 million people with low incomes. In 2008, the government funded additional compensation programs, such as the distribution of rice, control of rice pric-es, financial support for education (school fees), and subsidy increases for small-scale credit facilities. In June 2013, the government again extended temporary unconditional cash transfers to 15.5 million households through post offices us-ing newly printed Social Protection Cards. In addition, the Indonesian government expanded three existing social assis-tance programs: the conditional cash transfers (PKH), schol-arships (BSM), and the “rice for the poor” program (RASKIN).
Why Can Reducing Energy Subsidies Help Transform Indonesia?
Indonesia faces some significant, well-known development challenges. Perhaps the biggest one is the need to close the country’s infrastructure gap. The country has foregone more than 1 percentage point in additional GDP growth due to un-derinvestment in infrastructure, chiefly in transportation (World Bank 2013).9 Firm surveys show that transportation problems are among the top constraints for manufacturing firms. Household and village survey data show that one-quar-ter of urban populations and more than half of rural residents have poor access to transport services. Rural producers find themselves unable to compete with imports in urban areas. It
is cheaper to import oranges from China than to source them from Kalimantan (that is, within Indonesia).
How did Indonesia land in this situation? Because invest-ment in infrastructure as a share of GDP has remained low, notwithstanding increases in nominal allocations in recent years. The central government invests less than 1 percent of GDP in infrastructure, and governmentwide investment (that is, central and subnational) is only about 2.5 percent of GDP, slightly less than the amount spent on the fuel subsidy in 2012 (2.6 percent of GDP), and about one-third of the amount spent by Indonesia’s Asian neighbors on average. As a result, Indonesia’s core infrastructure stock (roads, ports, and electricity and water networks) grew by only 3 percent annu-ally during 2001–11, compared with GDP growth of 5.3 per-cent. Inadequate investment has resulted in serious capacity gaps (roads, ports, electricity, water, and more), congestion problems, and high logistics costs, which are undermining productivity, competitiveness, and poverty reduction.
Challenges in the social sectors are equally daunting. Over the past decade, income inequality (measured by the Gini coefficient) has increased by 10 percentage points to 0.42, in line with the rapid rise in commodity and other asset prices (including land and properties), which proportionately has benefited the rich. Rather than offsetting this trend, en-ergy subsidies have actually exacerbated it (World Bank 2014). Furthermore, large disparities remain across income levels and geographical areas regarding access to key services. In health, the maternal mortality ratio, recently estimated at 220 per 100,000 live births, is higher than that of India and the Republic of the Union of Myanmar, and much higher than what would be expected for Indonesia’s income level. Indonesia still spends only 0.5 percent of GDP on social as-sistance, compared with 1–1.5 percent of GDP in emerging economies such as Brazil, Turkey, and Thailand. The country is gradually building a modern social protection system; how-ever, improving social outcomes would require a significant increase in social protection allocations and greater quality of spending (World Bank 2014).
Energy subsidy reform is perhaps the single most impor-tant instrument to finance an increase in infrastructure in-vestment and social protection, while dramatically reducing macroeconomic risks and accelerating the Indonesia’s jour-ney toward greater and shared prosperity. World Bank simula-tions show that fully phasing out the energy subsidies by 2018 in four equal increments would free up spending to a cumulative 3.3 percent of GDP in 2018, relative to a “busi-ness as usual” baseline. This would enable the doubling of central government spending on infrastructure and on social protection spending (World Bank 2014).
Clearly, Indonesia’s growth and development objectives would be much better served by redirecting spending on fuel subsidies toward infrastructure and social sectors (health, so-
5 POVERTY REDUCTION AND ECONOMIC MANAGEMENT (PREM) NETWORK www.worldbank.org/economicpremise
breach in the target. The quarterly limits would be based on observed fuel consumption patterns and assumed prices, converted into rupiah. This would allow adjust-ment of prices in the subsequent quarter based on the prior quarter’s total subsidy spending. The basis upon which this could be done would be transparent and rule-based, removing from political and populist pressure the government decision-makers. An important component of energy subsidy reform is en-
suring that vulnerable households are cushioned from the immediate adverse impacts of higher energy prices. Imple-mentation of fuel price hikes should be accompanied or pre-ceded by the strengthening of social safety nets to protect the poor. Indonesia has systematically done that over the past de-cade and has developed strong expertise for developing and managing compensation programs. Going forward, as Indo-nesia expands and strengthens its social safety net, all poor and vulnerable households would receive comprehensive as-sistance to protect them from lifecycle shocks and provide them with opportunities to lift themselves out of poverty. Once a solid safety net system is fully established, the poten-tial adverse impacts of energy subsidy reform on the poor would be greatly reduced.
Acknowledgment
The author is grateful for the useful comments and assistance from Alex Sienaert, Jim Brumby, Shubham Chaudhuri, Anh Nguyet Pham, and Violeta Vulovic.
About the Author
Ndiame Diop is Lead Economist, Indonesia, for the World Bank.
Notes
1. All dollars are U.S. dollars unless otherwise noted.2. Indeed, as part of the 2012 Budget Law, Parliament at-tached hard strings to any reform: government was autho-rized to hike fuel prices only if the 6-month average of the In-donesia crude price rose 15 percent above the budget assumption of $105 per barrel. 3. The cost of the fuel subsidy for any product i can be esti-mated by the difference between the market price that would prevail in the absence of subsidy and the administered price fixed by the government , multiplied by the quan-tity of fuel consumed (q
i). The free market price, in turn, is
the world price in U.S. dollars (Indonesia uses the Mid Oil Platts Singapore or MOPS) times the dollar–rupiah exchange rate (ER), plus a margin for transport, storage and distribu-tion, and an economic profit (α) and value-added and fuel taxes (tax). The total fuel subsidies across fuel products i can be expressed as:
cial assistance, and community development). Energy subsi-dy reform would also support a reduction in inequality of outcomes and opportunity. Today, not only do the poor re-ceive fewer benefits from fuel subsidies, they also are likely to suffer more from the poor infrastructure that is an indirect consequence of large subsidies: they live in the most flood-prone areas and often have the most difficulty accessing basic services.
Reform Options
If reforming energy subsidies is fair, prudent, and transforma-tive, how can reforms be effectively implemented? As dis-cussed above, the current approach of episodic, negotiated price adjustments is not always effective and does not elimi-nate budget uncertainty due to subsequent changes in global oil prices and fluctuations in the rupiah exchange rate. Thus, a reform framework that offers a more predictable and trans-parent price-adjustment mechanism, along with an automat-ic convergence toward market prices, would be better. A large number of alternative formulas/pricing regimes exist (Kojima 2013). Technical solutions that could be considered in the context of Indonesia include:10
• Periodically moving prices through a pre-agreed rule. Through a pre-agreed rule, a new domestic price is set, with reference to recent world prices, on a periodic basis (monthly, quarterly, and so forth). For instance, China has adopted a formula whereby final consumer prices are adjusted if the base price changes more than 4 percent in a 22-day cycle. If Indonesia was to adopt a similar rule, the price-setting rule could specify how much of the gap between world and domestic prices would be closed in successive cumulative years. For example, the rule might be that domestic prices should reach 70 percent of aver-age world prices for 2014 (from about 50 percent in 2013), changing to 80 percent in 2015, 90 percent in 2016, and 100 percent in 2017.
• Periodically moving prices set by a pre-agreed rule, with a price ceiling (a variant of option 1). This option intro-duces consumers to moving prices, but provides assur-ance that there is a maximum price that they will pay in the first year, regardless of international prices. For in-stance, even if the objective is to set the domestic price at 70 percent of the world price in 2014, the monthly or quarterly increase is capped, to avoid exceptionally high increases and limit the exposure of consumers in any given month or quarter. In following years, the price ceil-ing can be successively raised, while closing the index-ation gap, thus leading to an incremental and predictable move to market prices.
• Quarterly subsidy spending limits. Announce subsidy limits for the coming budget year by quarter, and then adjust prices in subsequent quarters when there is a
7
World Bank. 2014. Indonesia Development Policy Review: Rising or Muddling Along? Washington, DC.
1 All dollars are U.S. dollars unless otherwise noted. 2 Indeed, as part of the 2012 Budget Law, Parliament attached hard strings to any reform: government was authorized to hike fuel prices only if the 6-month average of the Indonesia crude price rose 15 percent above the budget assumption of $105 per barrel. 3 The cost of the fuel subsidy for any product i can be estimated by the difference between the market price that would prevail in the absence of subsidy (���) and the administered price fixed by the government (�����), multiplied by the quantity of fuel consumed (��). The free market price, in turn, is the world price in U.S. dollars (Indonesia uses the Mid Oil Platts Singapore or MOPS) times the dollar–rupiah exchange rate (ER), plus a margin for transport, storage and distribution, and an economic profit (∝) and value-added and fuel taxes (tax). The total fuel subsidies across fuel products i can be expressed as: ∑ �� � ∑ ���� � ���������� , ��� � ��� � ������∝��� � ����. 4At contemporaneous prices and exchange rates, direct fiscal savings from this reform are estimated as Rp39 trillion for 2013 ($3.5 billion), and are expected to rise to Rp86 trillion in 2014 ($7.5 billion), the first full year in which the higher prices will apply.5 Over the past few years, actual spending on energy subsidies has systematically overshot allocations in the budget, creating uncertainty and constraining fiscal management. 6 Indeed, a 1 percent increase in real GDP leads to about 0.83 percent increase in domestic consumption. 7 Potential distortions due to this policy and complex spill-over effects (including substitution from crude palm oil exports, and so forth) also need to be considered. 8Indonesia is a net importer of oil and a net exporter of gas. In 2012, the size of the oil deficit was almost double the size ofthe gas surplus. 9 Assuming a causal relationship between changes in infrastructure capital stock and changes in output, had the growth rate in infrastructure capital stock stood at 5 percent instead of 3 percent, real GDP growth would have been 5.8 percent instead of 5.3 percent—a difference of 0.5 percentage points. Real GDP growth would have reached 7 percent if real infrastructure growth had been 10 percent. 10 These examples draw on unpublished work conducted by the World Bank team in the Jakarta Office.
6 POVERTY REDUCTION AND ECONOMIC MANAGEMENT (PREM) NETWORK www.worldbank.org/economicpremise
The Economic Premise note series is intended to summarize good practices and key policy findings on topics related to economic policy. They are produced by the Poverty Reduction and Economic Management (PREM) Network Vice-Presidency of the World Bank. The views expressed here are those of the authors and do not necessarily reflect those of the World Bank. The notes are available at: www.worldbank.org/economicpremise.
4. At contemporaneous prices and exchange rates, direct fiscal savings from this reform are estimated as Rp39 trillion for 2013 ($3.5 billion), and are expected to rise to Rp86 trillion in 2014 ($7.5 billion), the first full year in which the higher prices will apply.5. Over the past few years, actual spending on energy subsi-dies has systematically overshot allocations in the budget, cre-ating uncertainty and constraining fiscal management.6. Indeed, a 1 percent increase in real GDP leads to about 0.83 percent increase in domestic consumption. 7. Potential distortions due to this policy and complex spill-over effects (including substitution from crude palm oil ex-ports, and so forth) also need to be considered.8. Indonesia is a net importer of oil and a net exporter of gas. In 2012, the size of the oil deficit was almost double the size of the gas surplus. 9. Assuming a causal relationship between changes in infra-structure capital stock and changes in output, had the growth
rate in infrastructure capital stock stood at 5 percent instead of 3 percent, real GDP growth would have been 5.8 percent instead of 5.3 percent—a difference of 0.5 percentage points. Real GDP growth would have reached 7 percent if real infra-structure growth had been 10 percent.10. These examples draw on unpublished work conducted by the World Bank team in the Jakarta Office.
References
Kojima, Masami. 2013. “Petroleum Product Pricing and Comple-mentary Policies: Experience of 65 Countries Since 2009.” World Bank Policy Research Working Paper No. 6396, Wash-ington, DC.
World Bank. 2013. “Indonesia Quarterly Economic Update.” July, Washington, DC.
World Bank. 2014. Indonesia Development Policy Review: Rising or
Muddling Along? Washington, DC.