march 2012blue cross blue shield of massachusetts foundation health care costs and spending in...
TRANSCRIPT

MARCH 2012 BLUE CROSS BLUE SHIELD OF MASSACHUSETTS FOUNDATION
HEALTH CARE COSTS AND SPENDING IN MASSACHUSETTSA Review of the Evidence
MARCH 2012

MARCH 2012 BLUE CROSS BLUE SHIELD OF MASSACHUSETTS FOUNDATION 2
March 2012
Health Care Costs and Spending in Massachusetts: A Review of the Evidence pulls together in one chart pack the findings and analyses from numerous state and national research projects on health care costs and spending in the Commonwealth of Massachusetts. There is a surfeit of data and reports on this topic, especially in the wake of Chapter 305 of the Acts of 2008, which gave new authority and responsibilities to several Massachusetts state agencies to collect health care data and report on their findings. This publication is an effort to synthesize this expansive body of research into a simple, easy-to-use resource.
Charts in this report draw heavily on analyses conducted by the Massachusetts Division of Health Care Finance and Policy, the Massachusetts Office of the Attorney General, the Office of the Actuary at the Centers for Medicare and Medicaid Services, and the Dartmouth Atlas of Health Care. The research efforts undertaken by these organizations form the analytical bedrock for informed and thoughtful policy discussions.
This report has been designed to support use of the charts in slide presentations, and we encourage readers to do so. We plan to update this chart pack regularly with the latest results from ongoing research efforts as they become available.
This publication was assembled by the Foundation in collaboration with Amitabh Chandra at the Harvard Kennedy School of Government and Josephine Fisher at Amherst College. Numerous individuals including Katherine Baicker, John Cai, Mike Caljouw, Jon Gruber, and Lois Johnson provided invaluable comments and assistance.
Design Credit: Madolyn Allison

MARCH 2012 BLUE CROSS BLUE SHIELD OF MASSACHUSETTS FOUNDATION
TABLE OF CONTENTS
SLIDE 3 Executive Summary SLIDES 4-15 The Impact of Rising Health Care Costs in Massachusetts SLIDES 16-23 Where Health Care Dollars Go SLIDES 24-36 Drivers of Spending Growth SLIDES 37-48 Variations in Spending SLIDE 49 Conclusions SLIDE 50 References and Resources
3

MARCH 2012 BLUE CROSS BLUE SHIELD OF MASSACHUSETTS FOUNDATION 4
EXECUTIVE SUMMARYThe structure of the state’s health care delivery system, which includes many specialists and teaching hospitals, also likely contributes to higher overall spending. In recent years, however, increasing prices have been the major driver of higher health spending in the private market.
Across the state there are large variations in both total spending and prices. Per person spending on health care in some towns is up to 15% higher than others, with richer towns generally spending more. Likewise, some hospitals are paid up to 10 times more than others for the same services.
High prices are likely due to the market power of large physician and hospital groups; there is no evidence that high prices are associated with higher quality of service. Greater overall use of services, likewise, is not associated with higher quality or better health outcomes.
These variations in prices and spending that have no apparent association with health care value suggests that health care spending can be lowered while maintaining or improving the overall quality of care.
Massachusetts spends more per capita on health care than any other state. From 2009 to 2020, health spending is projected to double, outpacing both inflation and growth in the overall economy. The rapid rate of growth squeezes out other spending, both for individual households and in the state budget.
Massachusetts residents spend more than the U.S. average on every category of health care services, though they spend less than average on health care administration. Spending on hospitals and nursing homes comprises the majority of the difference between Massachusetts and U.S. average spending. Recent increases in total health spending are dominated by disproportionate growth in physician services and hospital outpatient services for the private market. Growth in Medicare spending is driven more by hospital inpatient services, nursing home care, and prescription drugs.
Massachusetts demographic factors predict higher overall use of services — the population is older, richer, and better insured than average — but these factors do not explain all the differences.

THE IMPACT OF RISING HEALTH CARE COSTS IN MASSACHUSETTS
WHERE HEALTH CAREDOLLARS GO
DRIVERS OFSPENDING GROWTH
VARIATIONSIN SPENDING
BLUE CROSS BLUE SHIELD OF MASSACHUSETTS FOUNDATIONMARCH 2012 5
SECTION 1:THE COST OF RISING COSTS
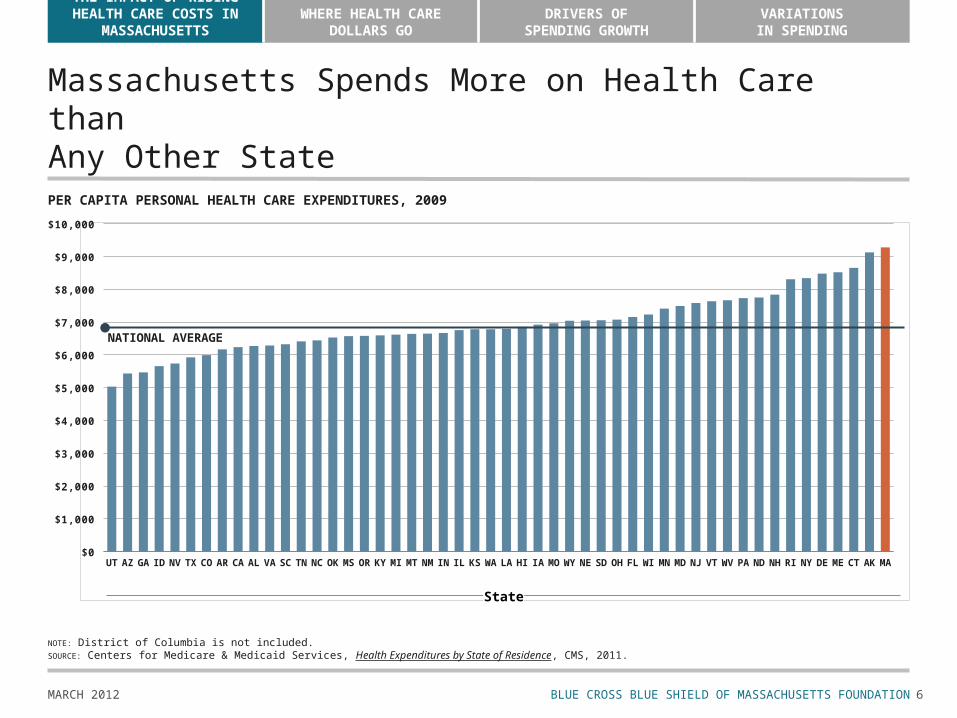
Massachusetts spends the most per capita in the country on health care. Even after taking into account that wages in the state are higher than average and that Massachusetts attracts a large amount of health care research funding, spending is still 15% above the national average.
Massachusetts has long been a high health care spending state, and the 2006 health reform law did not significantly increase the rate of growth in the state’s health insurance premiums.
All payers — commercial insurers, Medicare, and Medicaid — have seen significant growth in spending over the past 20 years.
Health care spending is growing much faster than household incomes or the economy, squeezing out spending on other areas — education, housing, infrastructure — both for households and in the state budget.
THE IMPACT OF RISING HEALTH CARE COSTS IN MASSACHUSETTS
WHERE HEALTH CAREDOLLARS GO
DRIVERS OFSPENDING GROWTH
VARIATIONSIN SPENDING
BLUE CROSS BLUE SHIELD OF MASSACHUSETTS FOUNDATIONMARCH 2012
Massachusetts Spends More on Health Care than Any Other State
6
PER CAPITA PERSONAL HEALTH CARE EXPENDITURES, 2009
NOTE: District of Columbia is not included.SOURCE: Centers for Medicare & Medicaid Services, Health Expenditures by State of Residence, CMS, 2011.
UT AZ GA ID NV TX CO AR CA AL VA SC TN NC OK MS OR KY MI MT NM IN IL KS WA LA HI IA MO WY NE SD OH FL WI MN MD NJ VT WV PA ND NH RI NY DE ME CT AK MA$0
$1,000
$2,000
$3,000
$4,000
$5,000
$6,000
$7,000
$8,000
$9,000
$10,000
State
NATIONAL AVERAGE

THE IMPACT OF RISING HEALTH CARE COSTS IN MASSACHUSETTS
WHERE HEALTH CAREDOLLARS GO
DRIVERS OFSPENDING GROWTH
VARIATIONSIN SPENDING
BLUE CROSS BLUE SHIELD OF MASSACHUSETTS FOUNDATIONMARCH 2012
Even After Adjusting for Higher Wages and Research Spending, Massachusetts Per Capita Spending Is Still 15% Higher than the National Average
7
SOURCE: Wallack, S.S. et. al. for Massachusetts Division of Health Care Finance and Policy, “Massachusetts Health Care Cost Trends, Part I: The Massachusetts Health Care System in Context,” February 2010.
Massachusetts’ higher per capita health spending is explained in part by relatively high wages and by the large amount of research funding and investment income received by the state’s hospital sector. Even after adjusting for those factors, however, Massachusetts per capita health spending is still 15% higher than the national average.
Series1
$6,683$6,430
$6,025
$5,283 $5,245 $5,243
MA US
Unadjusted
PER CAPITA PERSONAL HEALTH SPENDING, 2004
MA US
Adjusted for researchand
investment income
MA US
Adjusted for researchand
investment incomeand local wages
DIFFERENCE:
27%DIFFERENCE:
23%DIFFERENCE:
15%

THE IMPACT OF RISING HEALTH CARE COSTS IN MASSACHUSETTS
WHERE HEALTH CAREDOLLARS GO
DRIVERS OFSPENDING GROWTH
VARIATIONSIN SPENDING
BLUE CROSS BLUE SHIELD OF MASSACHUSETTS FOUNDATIONMARCH 2012 8
Total Health Spending Will Double from 2009 to 2020ACTUAL AND PROJECTED MASSACHUSETTS TOTAL PERSONAL HEALTH CARE EXPENDITURES, 1991-2020(BILLIONS OF DOLLARS)
SOURCES: Centers for Medicare & Medicaid Services, Health Expenditures by State of Residence, CMS, 2011; Massachusetts Division of Health Care Finance and Policy, “Massachusetts Health Care Cost Trends, Historical (1991-2004) and Projected (2004-2020),” November 2009.
1991 1992 1993 1994 1995 1996 1997 1998 1999 2000 2001 2002 2003 2004 2005 2006 2007 2008 2009 2010 2011 2012 2013 2014 2015 2016 2017 2018 2019 2020
$20 $21 $23 $24 $25 $27 $28 $30 $31 $33 $36 $39 $42 $45 $48$52
$56 $58 $6168
7277
8186
9297
103109
116123ACTUAL PROJECTED
Year
THE IMPACT OF RISING HEALTH CARE COSTS IN MASSACHUSETTS
WHERE HEALTH CAREDOLLARS GO
DRIVERS OFSPENDING GROWTH
VARIATIONSIN SPENDING
BLUE CROSS BLUE SHIELD OF MASSACHUSETTS FOUNDATIONMARCH 2012 9
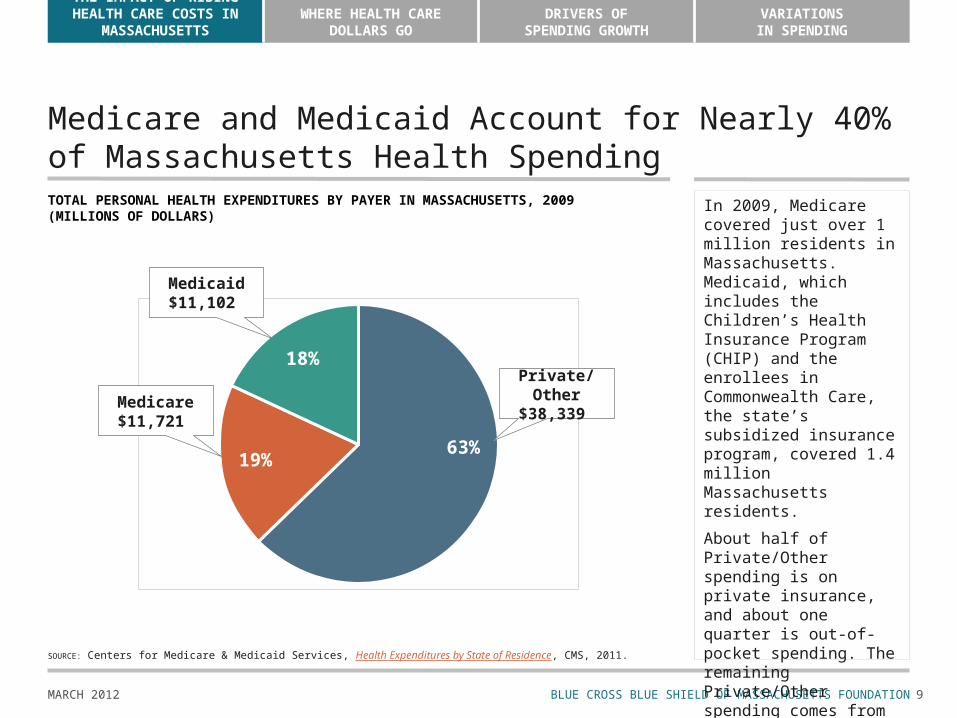
Medicare and Medicaid Account for Nearly 40% of Massachusetts Health Spending
SOURCE: Centers for Medicare & Medicaid Services, Health Expenditures by State of Residence, CMS, 2011.
18%
19%63%
Private/Other$38,339
TOTAL PERSONAL HEALTH EXPENDITURES BY PAYER IN MASSACHUSETTS, 2009(MILLIONS OF DOLLARS)
Medicare$11,721
Medicaid$11,102
In 2009, Medicare covered just over 1 million residents in Massachusetts. Medicaid, which includes the Children’s Health Insurance Program (CHIP) and the enrollees in Commonwealth Care, the state’s subsidized insurance program, covered 1.4 million Massachusetts residents.
About half of Private/Other spending is on private insurance, and about one quarter is out-of-pocket spending. The remaining Private/Other spending comes from programs run by the Department of Defense and Department of Veterans Affairs and other third-party payers such as Workers Compensation.

THE IMPACT OF RISING HEALTH CARE COSTS IN MASSACHUSETTS
WHERE HEALTH CAREDOLLARS GO
DRIVERS OFSPENDING GROWTH
VARIATIONSIN SPENDING
BLUE CROSS BLUE SHIELD OF MASSACHUSETTS FOUNDATIONMARCH 2012
All Payers in Massachusetts Have Experienced Significant Spending Growth
10
SOURCE: Centers for Medicare & Medicaid Services, Health Expenditures by State of Residence, CMS, 2011.
TOTAL PERSONAL HEALTH EXPENDITURES BY PAYER IN MASSACHUSETTS, 1991-2009(MILLIONS OF DOLLARS) These numbers reflect
total increases in spending, resulting from both increasing enrollment, especially in Medicaid, and higher per capita spending.
1991 1992 1993 1994 1995 1996 1997 1998 1999 2000 2001 2002 2003 2004 2005 2006 2007 2008 2009$0
$5,000
$10,000
$15,000
$20,000
$25,000
$30,000
$35,000
$40,000
$45,000
PRIVATE/OTHER MEDICARE MEDICAID
Year

THE IMPACT OF RISING HEALTH CARE COSTS IN MASSACHUSETTS
WHERE HEALTH CAREDOLLARS GO
DRIVERS OFSPENDING GROWTH
VARIATIONSIN SPENDING
BLUE CROSS BLUE SHIELD OF MASSACHUSETTS FOUNDATIONMARCH 2012
Total Growth Rates by Payer Have Been SimilarSince 1991
11
SOURCE: Centers for Medicare & Medicaid Services, Health Expenditures by State of Residence, CMS, 2011.
ANNUAL GROWTH INDEX BY PAYER IN MASSACHUSETTS, 1991-2009; BASE YEAR 1991(ANNUAL GROWTH RATE) Though private spending
accounts for the majority of health care costs in Massachusetts, all types of payers had similar growth rates from 1991 to 2009: Private/Other average
annual growth rate,1991-2009: 6.2%
Medicare average annual growth rate, 1991-2009: 7.1%
Medicaid average annual growth rate, 1991-2009: 6.9%
1991 1992 1993 1994 1995 1996 1997 1998 1999 2000 2001 2002 2003 2004 2005 2006 2007 2008 2009100
150
200
250
300
350
PRIVATE/OTHER MEDICARE MEDICAID
Year

THE IMPACT OF RISING HEALTH CARE COSTS IN MASSACHUSETTS
WHERE HEALTH CAREDOLLARS GO
DRIVERS OFSPENDING GROWTH
VARIATIONSIN SPENDING
BLUE CROSS BLUE SHIELD OF MASSACHUSETTS FOUNDATIONMARCH 2012
Year
Private Spending Grew Faster Per Capita thanBoth Medicare and Medicaid
12
SOURCE: Centers for Medicare & Medicaid Services, Health Expenditures by State of Residence, CMS, 2011.
HEALTH CARE EXPENDITURES PER CAPITA BY PAYER IN MASSACHUSETTS, 1991-2009 The sharp drop in Medicaid per capita spending resulted in part from the 2006 expansion of Medicaid, in which lower-cost and less sick populations enrolled. Private/Other average
annual per capita growth rate, 1991-2009: 6.6%
Medicare average annual per capita growth rate, 1991-2009: 6.1%
Medicaid average annual per capita growth rate, 1991-2009: 3.0%1991 1992 1993 1994 1995 1996 1997 1998 1999 2000 2001 2002 2003 2004 2005 2006 2007 2008 2009
$0
$2,000
$4,000
$6,000
$8,000
$10,000
$12,000
PRIVATE/OTHER MEDICARE MEDICAID

THE IMPACT OF RISING HEALTH CARE COSTS IN MASSACHUSETTS
WHERE HEALTH CAREDOLLARS GO
DRIVERS OFSPENDING GROWTH
VARIATIONSIN SPENDING
BLUE CROSS BLUE SHIELD OF MASSACHUSETTS FOUNDATIONMARCH 2012 13
Massachusetts Health Reform Did Not Escalate the Trend in Health Care Cost Growth
NOTE: Data for 2007 is inferred from the average of 2006 and 2008, as data for this year is unavailable.SOURCE: Agency for Healthcare Research and Quality, Medical Expenditure Panel Survey — Insurance Component.
FAMILY HEALTH INSURANCE PREMIUMS IN MASSACHUSETTS AND THE U.S., 2000-2010 Massachusetts health insurance premiums have long been higher than the national average. In the years after Massachusetts passed health care reform legislation in 2006, however, private premiums have actually grown more slowly than the national average.
Massachusetts U.S.
$7,341$6,772
$8,176
$7,509
$8,779$8,469
$9,867
$9,249
$10,559$10,006
$11,435
$10,728
$12,290
$11,381
$13,039
$11,840
$13,788
$12,298
$14,723
$13,027
$14,606
$13,871MA Average AnnualGrowth Rate,
2000-2006: 9.0%U.S. Average Annual
Growth Rate, 2000-2006: 9.1%
MA Average AnnualGrowth Rate,
2007-2010: 4.5% U.S. Average AnnualGrowth Rate,
2007-2010: 5.1%
2000 2002 2004 2006 2008 20102001 2003 2005 2007 2009 2000 2002 2004 2006 2008 20102001 2003 2005 2007 2009
THE IMPACT OF RISING HEALTH CARE COSTS IN MASSACHUSETTS
WHERE HEALTH CAREDOLLARS GO
DRIVERS OFSPENDING GROWTH
VARIATIONSIN SPENDING
BLUE CROSS BLUE SHIELD OF MASSACHUSETTS FOUNDATIONMARCH 2012 14
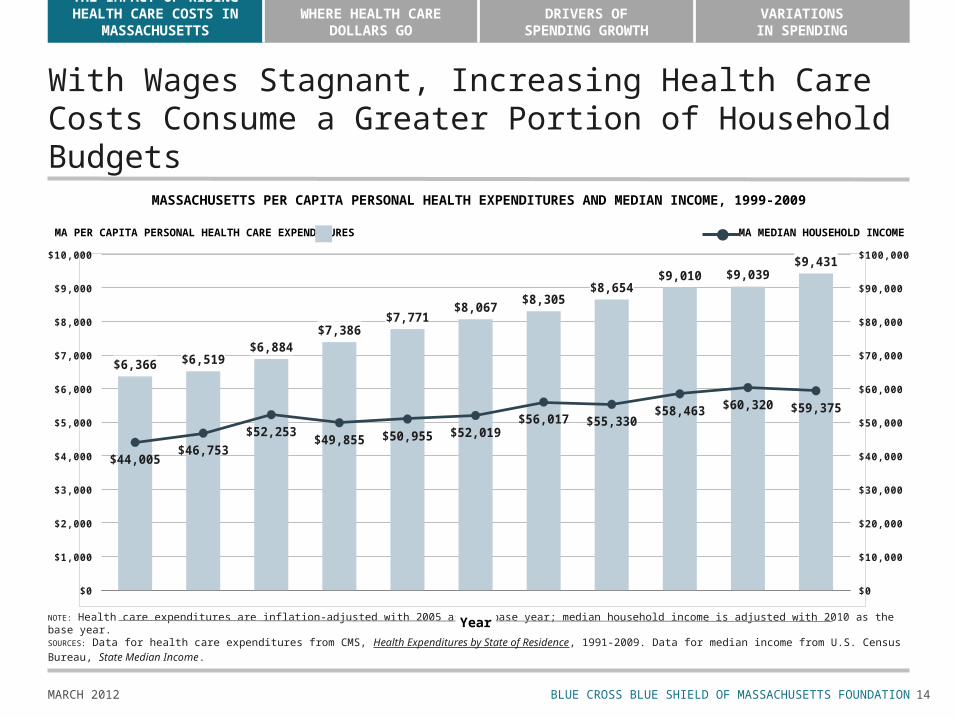
With Wages Stagnant, Increasing Health Care Costs Consume a Greater Portion of Household Budgets
MASSACHUSETTS PER CAPITA PERSONAL HEALTH EXPENDITURES AND MEDIAN INCOME, 1999-2009
NOTE: Health care expenditures are inflation-adjusted with 2005 as the base year; median household income is adjusted with 2010 as the base year.SOURCES: Data for health care expenditures from CMS, Health Expenditures by State of Residence, 1991-2009. Data for median income from U.S. Census Bureau, State Median Income.
Year1999 2000 2001 2002 2003 2004 2005 2006 2007 2008 2009
$0
$1,000
$2,000
$3,000
$4,000
$5,000
$6,000
$7,000
$8,000
$9,000
$10,000
$0
$10,000
$20,000
$30,000
$40,000
$50,000
$60,000
$70,000
$80,000
$90,000
$100,000
$6,366 $6,519$6,884
$7,386$7,771
$8,067$8,305
$8,654$9,010 $9,039
$9,431
$44,005 $46,753
$52,253 $49,855 $50,955 $52,019
$56,017 $55,330 $58,463 $60,320 $59,375
MA PER CAPITA PERSONAL HEALTH CARE EXPENDITURES MA MEDIAN HOUSEHOLD INCOME

THE IMPACT OF RISING HEALTH CARE COSTS IN MASSACHUSETTS
WHERE HEALTH CAREDOLLARS GO
DRIVERS OFSPENDING GROWTH
VARIATIONSIN SPENDING
BLUE CROSS BLUE SHIELD OF MASSACHUSETTS FOUNDATIONMARCH 2012 15
Employers Are Shifting More of the Cost of Premiums onto EmployeesPERCENT CONTRIBUTION TO INDIVIDUAL AND FAMILY HEALTH INSURANCE PREMIUMS BY MASSACHUSETTS EMPLOYERS, 2001-2010
NOTE: Data reflect medians.SOURCE: Massachusetts Division of Health Care Finance and Policy, Employer Survey.
2001 2003 2005 2007 2009 2010
82%78% 77% 75%
72%75%75% 75% 75% 75%
68% 70%
INDIVIDUAL PREMIUM FAMILY PREMIUM

THE IMPACT OF RISING HEALTH CARE COSTS IN MASSACHUSETTS
WHERE HEALTH CAREDOLLARS GO
DRIVERS OFSPENDING GROWTH
VARIATIONSIN SPENDING
BLUE CROSS BLUE SHIELD OF MASSACHUSETTS FOUNDATIONMARCH 2012 16
The Increasing Costs of Health Care Squeeze Out Other Public Spending PrioritiesMASSACHUSETTS STATE BUDGET, FY2001 VS. FY2011
SOURCE: Massachusetts Budget and Policy Center Budget Browser.
Series1$0
$2
$4
$6
$8
$10
$12
$14
$16
STATE SPENDING (BILLIONS OF DOLLARS) FY2011FY2001
+$5.1 B(+59%)
-38% -33%
-15%
-23%
-13%
-50%
-11%
-$4.0 B(-20%)
Health Care Coverage(State Employees/GIC;
Medicaid/Health Reform)
PublicHealth
MentalHealth
Education Infrastructure/Housing
HumanServices
LocalAid
PublicSafety

BLUE CROSS BLUE SHIELD OF MASSACHUSETTS FOUNDATION
THE IMPACT OF RISING HEALTH CARE COSTS IN MASSACHUSETTS
WHERE HEALTH CAREDOLLARS GO
DRIVERS OFSPENDING GROWTH
VARIATIONSIN SPENDING
MARCH 2012 17
SECTION 2:WHERE THE HEALTH CARE DOLLARS GO — SPENDING AND COST GROWTH BY TYPES OF HEALTH CARE SERVICES Per capita spending in Massachusetts is higher than the national average in every major
category of health care services, including physician and hospital services, prescription drugs, and nursing homes. The biggest gaps between the U.S. average and Massachusetts occur in spending on hospitals and nursing homes.
Per capita private spending is spread evenly across hospital inpatient, outpatient, and physician care. Per capita Medicare spending is much higher overall, and a larger proportion goes to inpatient care and nursing homes.
Recent increases in private spending on health care have been disproportionately driven by outpatient care and physician services. Medicare spending growth is dominated by inpatient care, nursing homes, and prescription drugs.
About 11% of private spending on health care in Massachusetts goes to insurer administrative costs, well below the national average.
Only about 2.4% of all health spending is attributable to medical malpractice costs.

BLUE CROSS BLUE SHIELD OF MASSACHUSETTS FOUNDATION
THE IMPACT OF RISING HEALTH CARE COSTS IN MASSACHUSETTS
WHERE HEALTH CAREDOLLARS GO
DRIVERS OFSPENDING GROWTH
VARIATIONSIN SPENDING
MARCH 2012 18
The Distribution of Total Spending by Type of Service Is Similar for Massachusetts and the U.S. as a Whole
SOURCE: Centers for Medicare & Medicaid Services, Health Expenditures by State of Residence, CMS, 2011.
38%
22%
11%
20%
MASSACHUSETTS PER CAPITA SPENDING BY SERVICE, 2009
Hospital Care Physician andClinical Services
Drugs andOther Medical Nondurables
Nursing Home,Home Health, and Other Personal Care
Dental and OtherProfessional Services
Medical Durables
8%
1%
36%
24%
14%
16%
UNITED STATES PER CAPITA SPENDING BY SERVICE, 2009
8%
2%

BLUE CROSS BLUE SHIELD OF MASSACHUSETTS FOUNDATION
THE IMPACT OF RISING HEALTH CARE COSTS IN MASSACHUSETTS
WHERE HEALTH CAREDOLLARS GO
DRIVERS OFSPENDING GROWTH
VARIATIONSIN SPENDING
MARCH 2012 19
Per Person Spending in Massachusetts Is Higher than the National Average in Every Category of ServiceUNITED STATES AND MASSACHUSETTS PER CAPITA SPENDING BY SERVICE, 2009
SOURCE: Centers for Medicare & Medicaid Services, Health Expenditures by State of Residence, CMS, 2011.
$2,475
$1,650
$956$1,069
$551
$114
$3,505
$2,078
$1,033
$1,840
$703
$119
UNITED STATES MASSACHUSETTS
Hospital Care Physician andClinical Services
Drugs andOther Medical Nondurables
Nursing Home,Home Health, and
Other Personal Care
Dental and OtherProfessional
Services
Medical Durables

BLUE CROSS BLUE SHIELD OF MASSACHUSETTS FOUNDATION
THE IMPACT OF RISING HEALTH CARE COSTS IN MASSACHUSETTS
WHERE HEALTH CAREDOLLARS GO
DRIVERS OFSPENDING GROWTH
VARIATIONSIN SPENDING
MARCH 2012 20
Spending on Hospitals and Nursing Homes Makes Up the Majority of the Difference Between Massachusetts and the U.S.
SOURCE: Centers for Medicare & Medicaid Services, Health Expenditures by State of Residence, CMS, 2011.
41.8%
17.4%3.1%
31.3% Hospital Care($1,030)
Physician andClinical Services($428)
Drugsand Other
Medical Nondurables
($77)
Nursing Home,Home Health,
and Other Personal Care
($771)
Dental and OtherProfessional
Services($152)
Medical Durables($5)
6.2%
0.2%
CONTRIBUTION TO DIFFERENCE IN MA AND U.S. SPENDING BY SERVICE, 2009 In total, per person spending in Massachusetts is $2,463 more than the national average. Higher spending on hospitals and nursing homes accounts for 73% of this difference. These two categories of spending are among the largest for both MA and the U.S., and would therefore be expected to account for much of the difference. All the same, they have a disproportionate impact on the gap between the U.S. and MA.
BLUE CROSS BLUE SHIELD OF MASSACHUSETTS FOUNDATION
THE IMPACT OF RISING HEALTH CARE COSTS IN MASSACHUSETTS
WHERE HEALTH CAREDOLLARS GO
DRIVERS OFSPENDING GROWTH
VARIATIONSIN SPENDING
MARCH 2012 21
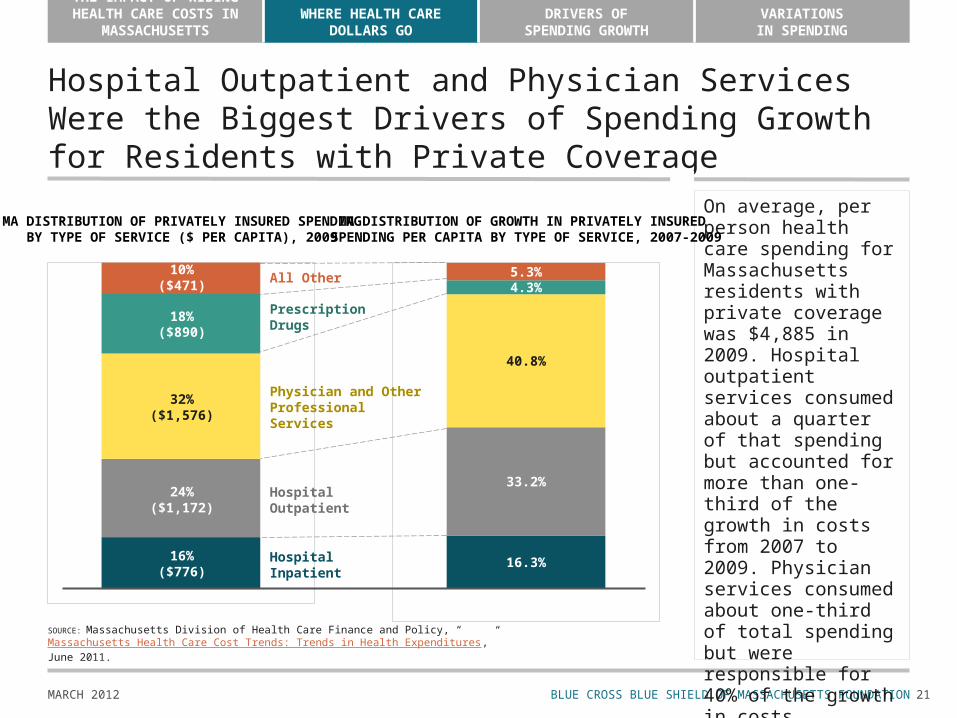
16.3%
33.2%
40.8%
4.3%5.3%
Hospital Outpatient and Physician Services Were the Biggest Drivers of Spending Growth for Residents with Private Coverage
MA DISTRIBUTION OF PRIVATELY INSURED SPENDINGBY TYPE OF SERVICE ($ PER CAPITA), 2009
On average, per person health care spending for Massachusetts residents with private coverage was $4,885 in 2009. Hospital outpatient services consumed about a quarter of that spending but accounted for more than one-third of the growth in costs from 2007 to 2009. Physician services consumed about one-third of total spending but were responsible for 40% of the growth in costs. Prescription drugs, however, accounted for less than expected of the overall growth in spending.
MA DISTRIBUTION OF GROWTH IN PRIVATELY INSURED SPENDING PER CAPITA BY TYPE OF SERVICE, 2007-2009
SOURCE: Massachusetts Division of Health Care Finance and Policy, “Massachusetts Health Care Cost Trends: Trends in Health Expenditures,” June 2011.
10%($471)
24%($1,172)
32%($1,576)
18%($890)
16%($776)
Hospital Inpatient
Hospital Outpatient
Physician and Other Professional Services
Prescription Drugs
All Other

BLUE CROSS BLUE SHIELD OF MASSACHUSETTS FOUNDATION
THE IMPACT OF RISING HEALTH CARE COSTS IN MASSACHUSETTS
WHERE HEALTH CAREDOLLARS GO
DRIVERS OFSPENDING GROWTH
VARIATIONSIN SPENDING
MARCH 2012 22
The Growth in Spending for Different Categories of Services Was More Proportional for Medicare Beneficiaries
SOURCE: Massachusetts Division of Health Care Finance and Policy, “Massachusetts Health Care Cost Trends: Trends in Health Expenditures,” June 2011.
At $12,995, spending per Medicare beneficiary is more than twice the level for the privately insured (previous slide). Much of the difference is for spending on long-term care; most services contribute an expected level to the growth in total spending, though drug spending contributes proportionally more and physician services contributes slightly less than expected.
MA DISTRIBUTION OF GROWTH IN MEDICARE FFSPER CAPITA SPENDING BY TYPE OF SERVICE, 2007- 2008
MA DISTRIBUTION OF MEDICARE FFS SPENDINGBY TYPE OF SERVICE ($PER CAPITA), 2008
10%($1,232.8)
16%($2,013.8)
23%($2,961.6)
32%($4,031.9)
19%($2,421.9)$3,998
(31.0%)
$1,569(11.9%)
$2,464(18.7%)
$1,172(9.0%)
$3,648(28.4%)
$144 (1.0%)
31.7%
15.6%
2.9%7.6%
14.6%
27.5%
Free-Standing Facilities
Physician and Other Professional Services
Prescription Drugs
Long-Term Care and All Other
Hospital Inpatient
Hospital Outpatient

BLUE CROSS BLUE SHIELD OF MASSACHUSETTS FOUNDATION
THE IMPACT OF RISING HEALTH CARE COSTS IN MASSACHUSETTS
WHERE HEALTH CAREDOLLARS GO
DRIVERS OFSPENDING GROWTH
VARIATIONSIN SPENDING
MARCH 2012 23
Administrative Spending Is Low in Massachusetts and Has Been a Small Contributor Toward Growth
SOURCE: Massachusetts Division of Health Care Finance and Policy, “Massachusetts Health Care Cost Trends, Part II: Private Health Insurance Premium Trends, 2006-2008” February 2010.
11%
89%
Though it’s difficult to compare different measures of administrative spending, non-medical spending in Massachusetts is lower than the national average both as a percent of premiums (11% in MA vs. 16% nationally) and in real dollar terms. Non-medical expenses grew at the same rate as or faster than overall premiums from 2002 to 2006, but they were responsible for only 5% of total premium increases from 2006 to 2008.
PREMIUM GROWTH IN MASSACHUSETTSBY CONTRIBUTION, 2006-2008
95%
5%
MASSACHUSETTSTYPE OF SPENDING AS A PERCENT OF PREMIUM, 2008
Non-Medical
89%
11%
Medical

BLUE CROSS BLUE SHIELD OF MASSACHUSETTS FOUNDATION
THE IMPACT OF RISING HEALTH CARE COSTS IN MASSACHUSETTS
WHERE HEALTH CAREDOLLARS GO
DRIVERS OFSPENDING GROWTH
VARIATIONSIN SPENDING
MARCH 2012 24
Medical Malpractice Costs Account for Only aSmall Portion of Total Health Spending
SOURCES: Mello, M., et. al., “National Costs of the Medical Liability System,” Health Affairs, 2010; Massachusetts Office of Consumer Affairs & Business Regulation, “Medical Malpractice Insurance In The Massachusetts Market Report,” December 2008; Baicker, K., et al., “Malpractice Liability Costs and the Practice of Medicine in the Medicare Program,” Health Affairs, 2007; 2009 total personal health expenditures from Centers for Medicare & Medicaid Services, Health Expenditures by State of Residence, CMS, 2011.
Payouts and Defense Costs
$0.31
0.5%
97.6%
All Other Health Care Spending
$59.69
TOTAL MASSACHUSETTS HEALTH CARE SPENDING, 2009(BILLIONS OF DOLLARS)
The best available evidence suggests that the medical malpractice system in the U.S. is responsible for 2.4% of total health spending. This includes 0.5% of total spending for lawsuit payouts and defense costs — direct expenses — and 1.9% of spending attributed to “defensive medicine” — health care services providers deliver in order to reduce the threat of lawsuits. Applied to Massachusetts total spending, that would be $1.47 billion in 2009. Average malpractice payouts are higher in Massachusetts than they are nationally, which may increase the total spent on direct costs. However, economists find little evidence that higher payouts lead to increased practice of defensive medicine.
Defensive Medicine$1.16
1.9%

BLUE CROSS BLUE SHIELD OF MASSACHUSETTS FOUNDATION
THE IMPACT OF RISING HEALTH CARE COSTS IN MASSACHUSETTS
WHERE HEALTH CAREDOLLARS GO
DRIVERS OFSPENDING GROWTH
VARIATIONSIN SPENDING
MARCH 2012 25
SECTION 3:DRIVERS OF COST GROWTH IN MASSACHUSETTS
The state’s high and growing spending is attributable to four factors:
1. Utilization. Health care spending rises when a population uses more services overall. For example, if the average number of physician visits increased in Massachusetts, then total health spending would rise. Massachusetts has several demographic characteristics, such as an older average age, that generally increase the amount of health care a population uses. These characteristics do not, however, explain all the differences between Massachusetts and the U.S. as a whole.
2. Provider mix. Health spending can also increase when a population begins to make disproportionate use of the services of higher-priced providers. For example, if in place of primary care providers, Massachusetts residents began to see specialists, who tend to charge more even for the same services, overall spending would increase.
3. Service mix. Health care spending can rise if a population starts to receive more expensive services in place of cheaper ones. For example, if many residents started to receive MRI or CT scans instead of lower-priced X-rays, spending would increase.
4. Price. Health care spending can also rise if the price of each service increases.
BLUE CROSS BLUE SHIELD OF MASSACHUSETTS FOUNDATION
THE IMPACT OF RISING HEALTH CARE COSTS IN MASSACHUSETTS
WHERE HEALTH CAREDOLLARS GO
DRIVERS OFSPENDING GROWTH
VARIATIONSIN SPENDING
MARCH 2012 26
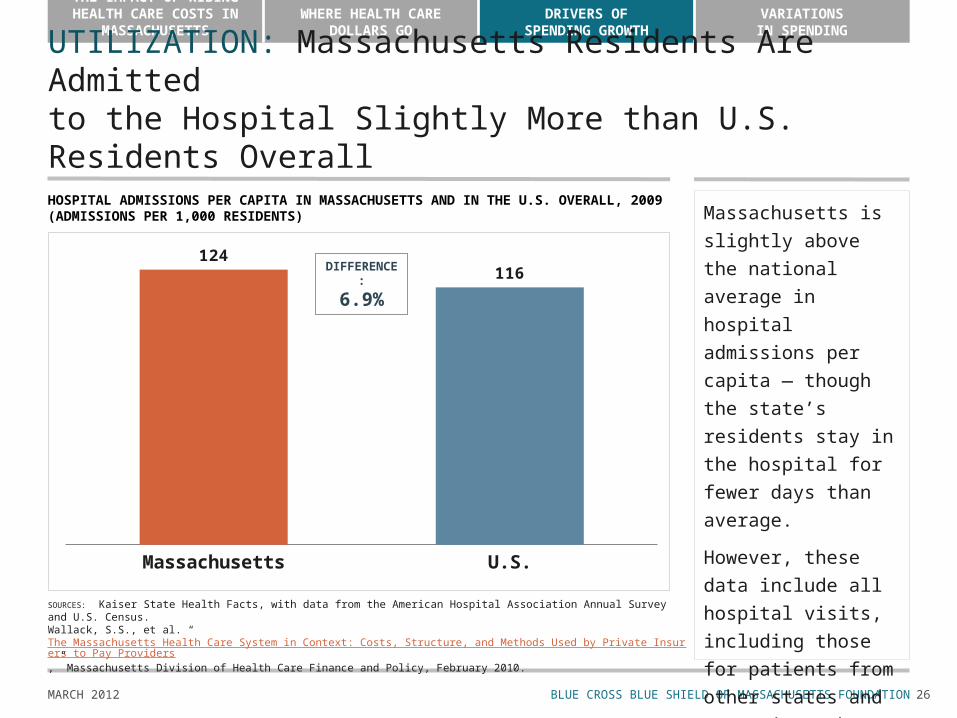
UTILIZATION: Massachusetts Residents Are Admitted to the Hospital Slightly More than U.S. Residents Overall
SOURCES: Kaiser State Health Facts, with data from the American Hospital Association Annual Survey and U.S. Census. Wallack, S.S., et al. “The Massachusetts Health Care System in Context: Costs, Structure, and Methods Used by Private Insurers to Pay Providers,” Massachusetts Division of Health Care Finance and Policy, February 2010.
Massachusetts is slightly above the national average in hospital admissions per capita — though the state’s residents stay in the hospital for fewer days than average.
However, these data include all hospital visits, including those for patients from other states and countries. The real utilization rate for Massachusetts residents is likely 2-5% lower.
Massachusetts U.S.
124116
HOSPITAL ADMISSIONS PER CAPITA IN MASSACHUSETTS AND IN THE U.S. OVERALL, 2009(ADMISSIONS PER 1,000 RESIDENTS)
DIFFERENCE:
6.9%
BLUE CROSS BLUE SHIELD OF MASSACHUSETTS FOUNDATION
THE IMPACT OF RISING HEALTH CARE COSTS IN MASSACHUSETTS
WHERE HEALTH CAREDOLLARS GO
DRIVERS OFSPENDING GROWTH
VARIATIONSIN SPENDING
MARCH 2012 27
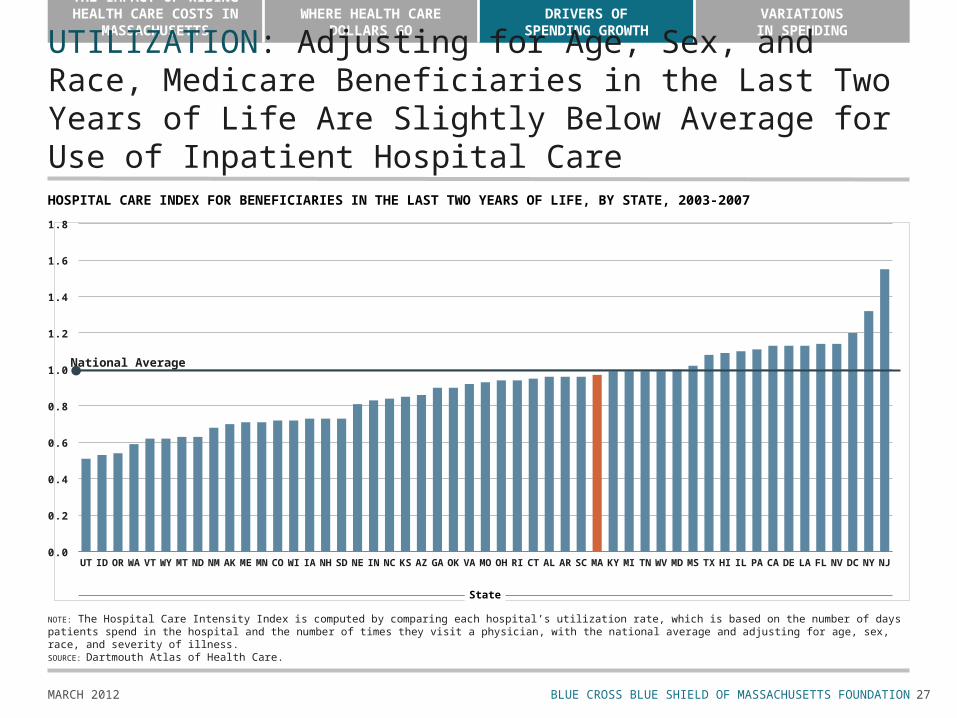
UTILIZATION: Adjusting for Age, Sex, and Race, Medicare Beneficiaries in the Last Two Years of Life Are Slightly Below Average for Use of Inpatient Hospital CareHOSPITAL CARE INDEX FOR BENEFICIARIES IN THE LAST TWO YEARS OF LIFE, BY STATE, 2003-2007
NOTE: The Hospital Care Intensity Index is computed by comparing each hospital’s utilization rate, which is based on the number of days patients spend in the hospital and the number of times they visit a physician, with the national average and adjusting for age, sex, race, and severity of illness.SOURCE: Dartmouth Atlas of Health Care.
UT ID OR WA VT WY MT ND NM AK ME MN CO WI IA NH SD NE IN NC KS AZ GA OK VA MO OH RI CT AL AR SC MA KY MI TN WV MD MS TX HI IL PA CA DE LA FL NV DC NY NJ0.0
0.2
0.4
0.6
0.8
1.0
1.2
1.4
1.6
1.8
State
National Average
BLUE CROSS BLUE SHIELD OF MASSACHUSETTS FOUNDATION
THE IMPACT OF RISING HEALTH CARE COSTS IN MASSACHUSETTS
WHERE HEALTH CAREDOLLARS GO
DRIVERS OFSPENDING GROWTH
VARIATIONSIN SPENDING
MARCH 2012 28
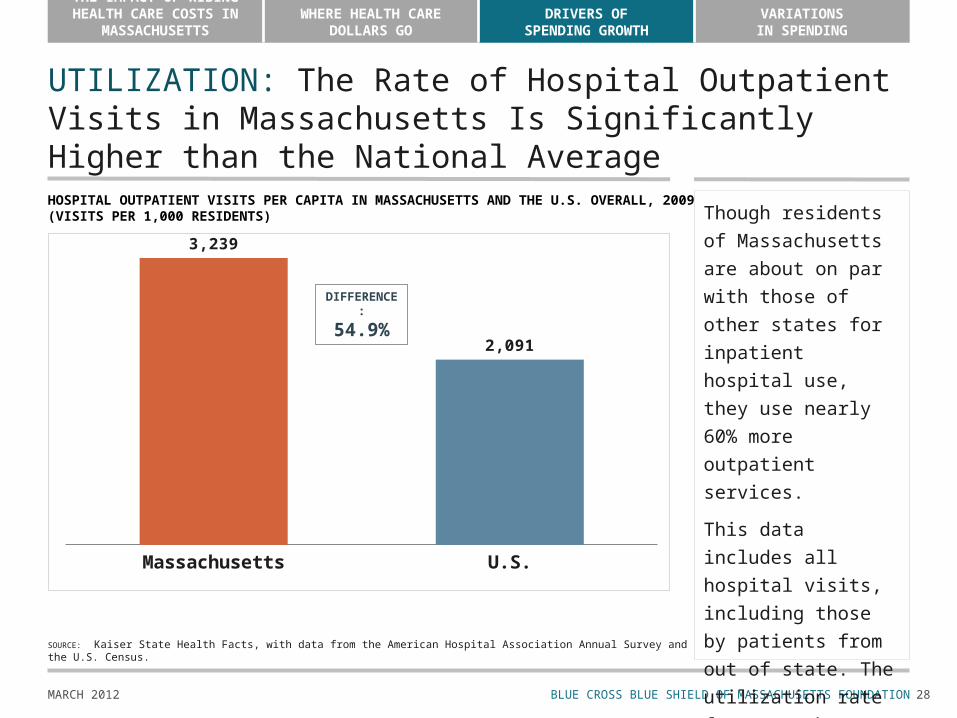
UTILIZATION: The Rate of Hospital Outpatient Visits in Massachusetts Is Significantly Higher than the National Average
SOURCE: Kaiser State Health Facts, with data from the American Hospital Association Annual Survey and the U.S. Census.
Though residents of Massachusetts are about on par with those of other states for inpatient hospital use, they use nearly 60% more outpatient services.
This data includes all hospital visits, including those by patients from out of state. The utilization rate for Massachusetts residents, therefore, may be slightly lower.
Massachusetts U.S.
3,239
2,091
HOSPITAL OUTPATIENT VISITS PER CAPITA IN MASSACHUSETTS AND THE U.S. OVERALL, 2009(VISITS PER 1,000 RESIDENTS)
DIFFERENCE:
54.9%

BLUE CROSS BLUE SHIELD OF MASSACHUSETTS FOUNDATION
THE IMPACT OF RISING HEALTH CARE COSTS IN MASSACHUSETTS
WHERE HEALTH CAREDOLLARS GO
DRIVERS OFSPENDING GROWTH
VARIATIONSIN SPENDING
MARCH 2012 29
UTILIZATION: Some of the Differences in Utilization Are Due to Demographic Characteristics and Insurance Coverage, but These Factors Don’t Explain Everything
On average, Massachusetts residents are both older and richer than the U.S. population as a whole — characteristics that are associated with higher rates of health care utilization.
– Massachusetts is the 9th oldest and 6th richest U.S. state. Massachusetts has a high rate of insurance coverage with relatively low
out-of-pocket costs, which also induces a higher rate of overall spending.– 98.1% of individuals in Massachusetts have insurance, compared with just
83.7% nationwide.– At $793 in 2010, Massachusetts has the 5th lowest average deductible for an
individual health insurance plan. Research demonstrates, however, that these factors do not account for all
of the differences in health care spending across the U.S.
SOURCES: U.S. Census; Agency for Healthcare Research and Quality, Medical Expenditure Panel Survey — Insurance Component, 2010; Zuckerman, S., et al., “Clarifying Sources of Geographic Differences in Medicare Spending,” New England Journal of Medicine, 2010.
BLUE CROSS BLUE SHIELD OF MASSACHUSETTS FOUNDATION
THE IMPACT OF RISING HEALTH CARE COSTS IN MASSACHUSETTS
WHERE HEALTH CAREDOLLARS GO
DRIVERS OFSPENDING GROWTH
VARIATIONSIN SPENDING
MARCH 2012 30
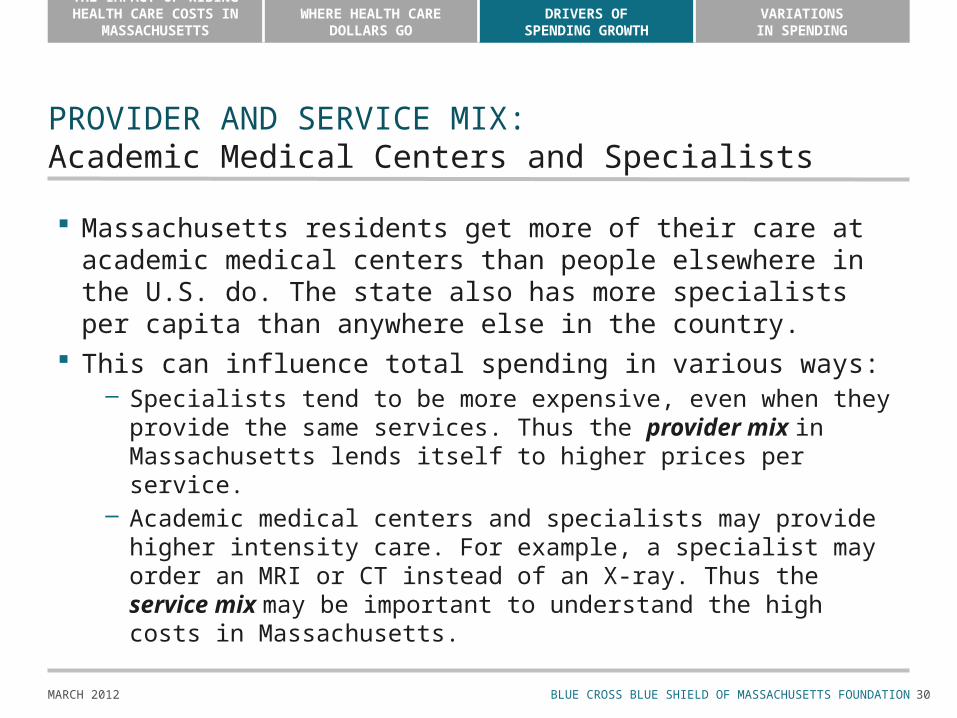
PROVIDER AND SERVICE MIX:Academic Medical Centers and Specialists
Massachusetts residents get more of their care at academic medical centers than people elsewhere in the U.S. do. The state also has more specialists per capita than anywhere else in the country.
This can influence total spending in various ways: – Specialists tend to be more expensive, even when they provide the same
services. Thus the provider mix in Massachusetts lends itself to higher prices per service.
– Academic medical centers and specialists may provide higher intensity care. For example, a specialist may order an MRI or CT instead of an X-ray. Thus the service mix may be important to understand the high costs in Massachusetts.
BLUE CROSS BLUE SHIELD OF MASSACHUSETTS FOUNDATION
THE IMPACT OF RISING HEALTH CARE COSTS IN MASSACHUSETTS
WHERE HEALTH CAREDOLLARS GO
DRIVERS OFSPENDING GROWTH
VARIATIONSIN SPENDING
MARCH 2012 31
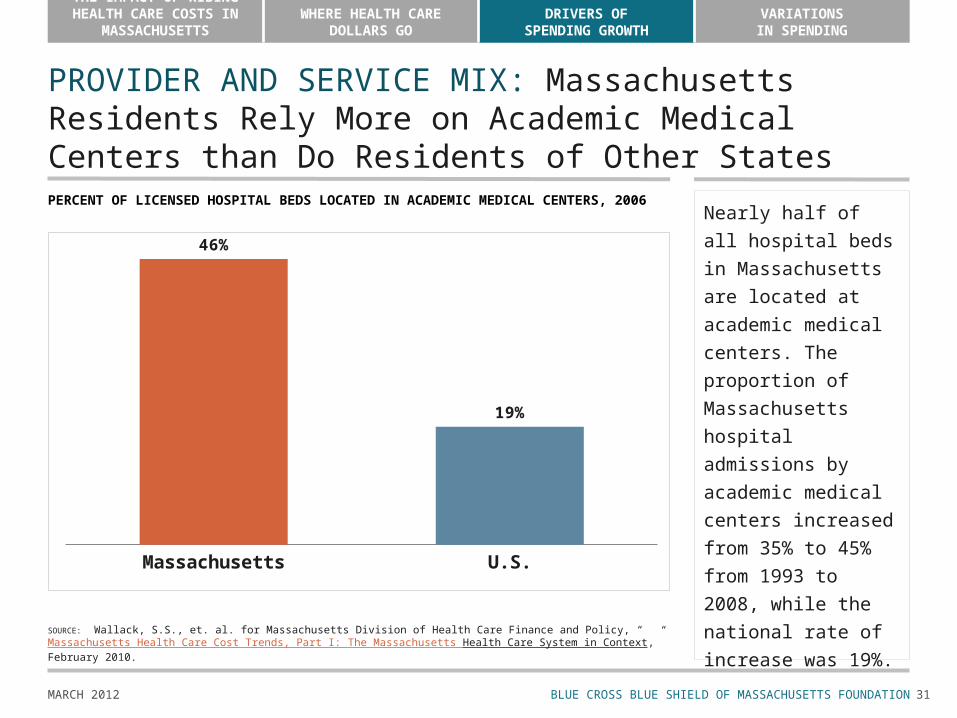
PROVIDER AND SERVICE MIX: Massachusetts Residents Rely More on Academic Medical Centers than Do Residents of Other States
SOURCE: Wallack, S.S., et. al. for Massachusetts Division of Health Care Finance and Policy, “Massachusetts Health Care Cost Trends, Part I: The Massachusetts Health Care System in Context,” February 2010.
Nearly half of all hospital beds in Massachusetts are located at academic medical centers. The proportion of Massachusetts hospital admissions by academic medical centers increased from 35% to 45% from 1993 to 2008, while the national rate of increase was 19%.
Massachusetts U.S.
46%
19%
PERCENT OF LICENSED HOSPITAL BEDS LOCATED IN ACADEMIC MEDICAL CENTERS, 2006

BLUE CROSS BLUE SHIELD OF MASSACHUSETTS FOUNDATION
THE IMPACT OF RISING HEALTH CARE COSTS IN MASSACHUSETTS
WHERE HEALTH CAREDOLLARS GO
DRIVERS OFSPENDING GROWTH
VARIATIONSIN SPENDING
MARCH 2012 32
PROVIDER AND SERVICE MIX: Academic Medical Centers Provide a Higher Intensity Set of Services than Community Hospitals
Among Medicare patients in the last six months of life, those whose main site of care was an academic medical center received much more care: more days in the hospital as a whole, more days in the intensive care unit, and more specialist visits.
Series1
14.2
3.4
15.5
12.2
2.5
12.8
Inpatient Days per Decedent
ICU Daysper Decedent
Specialist Visitsper Decedent
NOTE: Data for the last six months of life pertains to 2003-2007.SOURCE: Dartmouth Atlas of Health Care.
ACADEMIC MEDICAL CENTERS OTHER HOSPITALS
INTENSITY OF CARE IN LAST SIX MONTHS OF LIFE AT U.S. HOSPITALS
BLUE CROSS BLUE SHIELD OF MASSACHUSETTS FOUNDATION
THE IMPACT OF RISING HEALTH CARE COSTS IN MASSACHUSETTS
WHERE HEALTH CAREDOLLARS GO
DRIVERS OFSPENDING GROWTH
VARIATIONSIN SPENDING
MARCH 2012
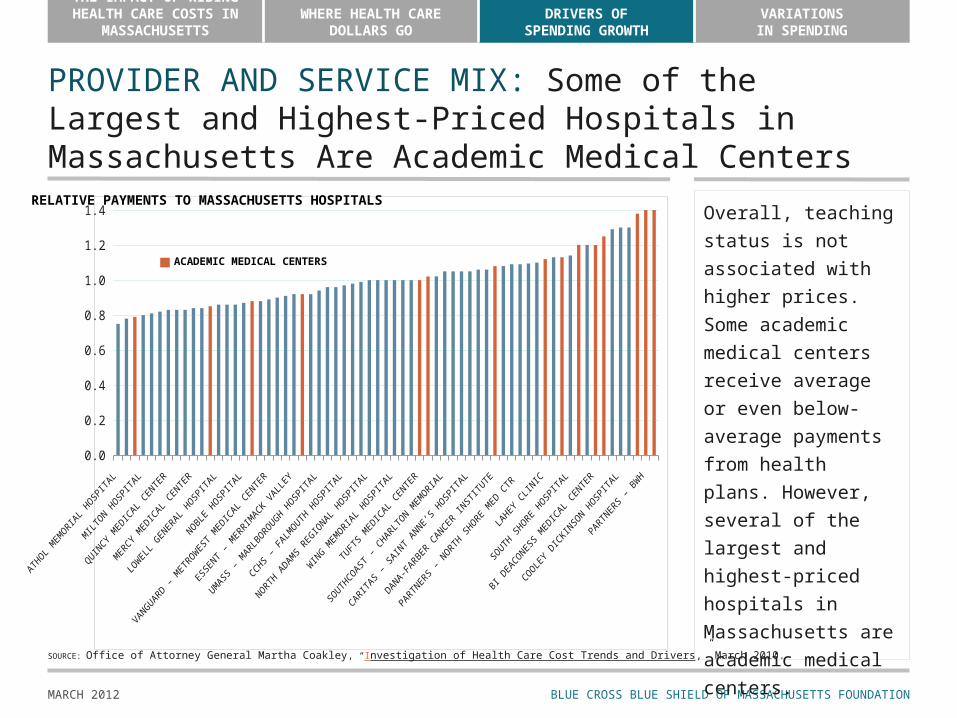
PROVIDER AND SERVICE MIX: Some of the Largest and Highest-Priced Hospitals in Massachusetts Are Academic Medical Centers
0.0
0.2
0.4
0.6
0.8
1.0
1.2
1.4RELATIVE PAYMENTS TO MASSACHUSETTS HOSPITALS
Overall, teaching status is not associated with higher prices. Some academic medical centers receive average or even below-average payments from health plans. However, several of the largest and highest-priced hospitals in Massachusetts are academic medical centers.
SOURCE: Office of Attorney General Martha Coakley, “Investigation of Health Care Cost Trends and Drivers,” March 2010.
ACADEMIC MEDICAL CENTERS

BLUE CROSS BLUE SHIELD OF MASSACHUSETTS FOUNDATION
THE IMPACT OF RISING HEALTH CARE COSTS IN MASSACHUSETTS
WHERE HEALTH CAREDOLLARS GO
DRIVERS OFSPENDING GROWTH
VARIATIONSIN SPENDING
MARCH 2012 34
PROVIDER AND SERVICE MIX: Massachusetts Leads All States in Total Physicians and Specialists Per CapitaSPECIALISTS AS A SHARE OF ALL PHYSICIANS BY STATE, 2006(PHYSICIANS PER 100,000)
0
50
100
150
200
250
300
SPECIALISTS NON-SPECIALISTS
State
Massachusetts has more physicians per capita, and also more specialists per capita, than any other state. Research finds that regions with more total physicians tend to spend more on health care than other regions, and that states with a higher proportion of specialists also tend to spend more on health care.
NOTE: Physician counts are estimated from rates and population and are not exact. DC is excluded.SOURCES: Physicians per capita data from Dartmouth Atlas. Evidence for relationship between more physicians and higher spending from Fisher, E.S., et. al., “The Implications of Regional Variations in Medicare Spending. Part 1: The Content, Quality, and Accessibility of Care,” Annals of Internal Medicine, Feb. 18, 2003.

BLUE CROSS BLUE SHIELD OF MASSACHUSETTS FOUNDATION
THE IMPACT OF RISING HEALTH CARE COSTS IN MASSACHUSETTS
WHERE HEALTH CAREDOLLARS GO
DRIVERS OFSPENDING GROWTH
VARIATIONSIN SPENDING
MARCH 2012 35
PRICE: Utilization, Provider, and Service Mix Are Important, but Increases in Price Are the Most Significant Cost Drivers
NOTES: 1) Reflects fully-insured commercial trend.2) “Utilization” reflects the number of services provided. “Provider Mix and Service Mix” reflect changes in providers and location of care (shift to more or less expensive providers) and the intensity of services provided. “Price” reflects increases in provider rates. SOURCE: Office of Attorney General Martha Coakley, March 2010, “Investigation of Health Care Cost Trends and Drivers.”
COST DRIVERS 2004-2008 FOR BCBSMAPERCENT INCREASE IN SPENDING DUE TO CHANGES IN UTILIZATION, PROVIDER/SERVICE MIX, AND PRICE
2004 2005 2006 2007 20080%
10%
20%
30%
40%
50%
60%
70%
80%
90%
100%
PRICE(amount providers get paid)
PROVIDER MIX AND SERVICE MIX
UTILIZATION(number of visits)
33.1%
53.3%58.0%
54.8% 53.8%
In recent years, price increases were responsible for more than half of the total rise in spending at Blue Cross Blue Shield of Massachusetts. Prices drove an even larger share of cost increases for other large commercial health plans in Massachusetts (not shown).

BLUE CROSS BLUE SHIELD OF MASSACHUSETTS FOUNDATION
THE IMPACT OF RISING HEALTH CARE COSTS IN MASSACHUSETTS
WHERE HEALTH CAREDOLLARS GO
DRIVERS OFSPENDING GROWTH
VARIATIONSIN SPENDING
MARCH 2012 36
6.1%
9.8%
# ofAdmissions
6.9%
0.2%
-2.1%
1.0%
5.4%
0.1%
3.9%
0.2%
PRICE: Higher Prices Explain Nearly All the Increases in Private Spending on Inpatient Care and More than Half of Increases on Outpatient Care PERCENT CHANGE IN MASSACHUSETTS PRIVATELY INSURED SPENDING, 2007-2009
SOURCE: Massachusetts Division of Health Care Finance and Policy, “Massachusetts Health Care Cost Trends: Trends in Health Expenditures,” June 2011.
Change inTotal
InpatientCare
Spending
Price Provider Mix ServiceMix
Change inTotal
OutpatientCare
Spending
Price Provider Mix # ofAdmissions
ServiceMix
Price increases alone would have driven up hospital inpatient spending by 6.9%, but this rise was offset by lower utilization rates. Changes in the provider mix (the use of higher priced hospitals) caused minimal increases in total spending, as did changes in the service mix (the use of higher priced services, like CT, in place of lower priced ones, like X-rays). Price increases accounted for 55% of the total change in spending on outpatient hospital care.
BLUE CROSS BLUE SHIELD OF MASSACHUSETTS FOUNDATION
THE IMPACT OF RISING HEALTH CARE COSTS IN MASSACHUSETTS
WHERE HEALTH CAREDOLLARS GO
DRIVERS OFSPENDING GROWTH
VARIATIONSIN SPENDING
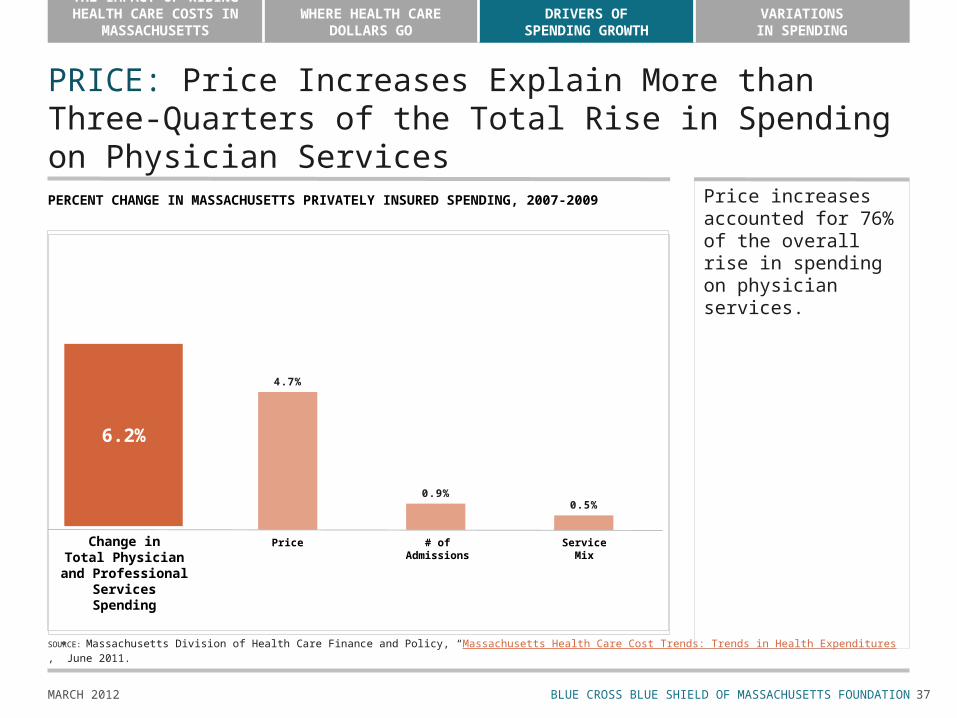
MARCH 2012 37
4.7%
0.9%0.5%
PRICE: Price Increases Explain More than Three-Quarters of the Total Rise in Spending on Physician ServicesPERCENT CHANGE IN MASSACHUSETTS PRIVATELY INSURED SPENDING, 2007-2009
SOURCE: Massachusetts Division of Health Care Finance and Policy, “Massachusetts Health Care Cost Trends: Trends in Health Expenditures,” June 2011.
Change inTotal Physician
and ProfessionalServices
Spending
Price # ofAdmissions
ServiceMix
Price increases accounted for 76% of the overall rise in spending on physician services.
6.2%

BLUE CROSS BLUE SHIELD OF MASSACHUSETTS FOUNDATION
THE IMPACT OF RISING HEALTH CARE COSTS IN MASSACHUSETTS
WHERE HEALTH CAREDOLLARS GO
DRIVERS OFSPENDING GROWTH
VARIATIONSIN SPENDING
MARCH 2012 38
SECTION 4:VARIATIONS IN SPENDING WITHIN MASSACHUSETTS
Massachusetts spends more on health care than other states. But within Massachusetts, there are large variations in overall health spending. Per person spending in some towns or regions is up to 15% higher than others. This variation is likely driven by factors including utilization of services, provider mix and service mix, as well as the prices paid to different providers for the same services.
Research suggests that neither higher prices nor higher use of services is associated with better quality or better health outcomes.
Providers who receive the highest prices likely have higher market or negotiating power with insurers.
These large variations in spending, together with their lack of connection to the actual value of care, suggest that there is considerable opportunity to reduce health care costs without reducing quality or outcomes. This becomes even more clear when looking at particularly costly — and wasted — health care dollars, such as avoidable hospital admissions and Emergency Department visits.

BLUE CROSS BLUE SHIELD OF MASSACHUSETTS FOUNDATION
THE IMPACT OF RISING HEALTH CARE COSTS IN MASSACHUSETTS
WHERE HEALTH CAREDOLLARS GO
DRIVERS OFSPENDING GROWTH
VARIATIONSIN SPENDING
MARCH 2012 39
Spending Varies Significantly Across the State Among Privately Insured ResidentsTOTAL MEDICAL EXPENDITURES PER PERSON PER MONTH, 2009
SOURCE: Massachusetts Division of Health Care Finance and Policy, “Massachusetts Total Medical Expenses: 2009 Baseline Report,” June 2011.
$375 or Less$376 to $402$403 to $425$426 or More
No Data Available
Total per capita medical spending for the privately insured population ranges from less than $375 per month to more than $426 per month. People living in towns where average incomes are higher tend spend more on health care. Similarly, those living in towns with older populations tend to spend more. Both higher age and greater income are associated with greater utilization of health care services.

BLUE CROSS BLUE SHIELD OF MASSACHUSETTS FOUNDATION
THE IMPACT OF RISING HEALTH CARE COSTS IN MASSACHUSETTS
WHERE HEALTH CAREDOLLARS GO
DRIVERS OFSPENDING GROWTH
VARIATIONSIN SPENDING
MARCH 2012 40
Spending for Those Covered by Medicare Also Varies SignificantlyTOTAL MEDICARE REIMBURSEMENTS (PART A AND PART B) PER ENROLLEE BY HSA, 2007
$8,250 or Less$8,251 to $9,350$9,351 to $10,250$10,251 or More
No Data Available
SOURCE: Dartmouth Atlas of Health Care.

BLUE CROSS BLUE SHIELD OF MASSACHUSETTS FOUNDATION
THE IMPACT OF RISING HEALTH CARE COSTS IN MASSACHUSETTS
WHERE HEALTH CAREDOLLARS GO
DRIVERS OFSPENDING GROWTH
VARIATIONSIN SPENDING
MARCH 2012 41
Even Within the Extended Boston Health Care Market, Total Spending for Medicare Beneficiaries Varies Significantly
$8,250 or Less$8,251 to $9,350$9,351 to $10,250$10,251 or More
No Data Available
TOTAL MEDICARE REIMBURSEMENTS (EXCLUDING PRESCRIPTION DRUGS) PER ENROLLEE BY HOSPITAL SERVICE AREA, 2007
SOURCE: Dartmouth Atlas of Health Care.

BLUE CROSS BLUE SHIELD OF MASSACHUSETTS FOUNDATION
THE IMPACT OF RISING HEALTH CARE COSTS IN MASSACHUSETTS
WHERE HEALTH CAREDOLLARS GO
DRIVERS OFSPENDING GROWTH
VARIATIONSIN SPENDING
MARCH 2012 42
$23,599
$20,141
$14,309
$8,466$7,261
$4,647
$1,400 $1,204$695 $264
The Prices Paid to Providers for Delivering the Same Services Vary EnormouslyHOSPITAL-SPECIFIC SEVERITY-ADJUSTED PRICE VARIATION FOR SELECTED PROCEDURES IN MASSACHUSETTS
Prices can vary enormously, even for common services unlikely to be affected by patient sickness or complexity. Prices at the highest-paid providers can be more than 10 times as much as prices at the lowest-paid providers.
NOTE: Includes only hospitals with at least 30 discharges.SOURCE: Massachusetts Division of Health Care Finance and Policy, “Massachusetts Health Care Cost Trends: Price Variation in Health Care Services,” May 2011.
PNEUMONIATREATMENT
MAMMOGRAM
HIP JOINT REPLACEMENT
KNEEJOINT
REPLACEMENT
ACUTE MYOCARDIAL INFARCTION
APPENDECTOMY
VAGINAL DELIVERY
INTENSITY MODULATED TREATMENT
DELIVERY (RADIATION ONCOLOGY)
COLONOSCOPY
COMPUTED TOMOGRAPHY,
PELVIS
$27,342
$20,010
$25,284
$19,059
$11,889$14,153
$9,684
$6,141
$9,225
$5,524
$6,185
$3,430
$3,457
$339
$2,570
$425
$1,797
$316
$509
$93

BLUE CROSS BLUE SHIELD OF MASSACHUSETTS FOUNDATION
THE IMPACT OF RISING HEALTH CARE COSTS IN MASSACHUSETTS
WHERE HEALTH CAREDOLLARS GO
DRIVERS OFSPENDING GROWTH
VARIATIONSIN SPENDING
MARCH 2012 43
Higher-Paid Providers Do Not Score Better on Quality Measures
Researchers for the MA Division of Health Care Finance and Policy found no connection between prices and quality scores for any of the services they investigated, including appendectomy (shown); laparoscopic cholecystectomy; procedures for obesity; uterine and adnexa procedures for nonmalignancy except leiomyoma; knee replacement; intervertebral disc excision and decompression; knee and lower leg procedures; hip replacement; treatment for chronic obstructive pulmonary disease, pneumonia, heart attacks, and congestive heart failure; cesarean delivery; and vaginal delivery.
MIL
FORD
REG
ION
AL M
ED C
TR
LOW
ELL
GEN
HO
SP
LAW
REN
CE G
EN H
OSP
BAYS
TATE
FRA
NKL
IN M
ED C
TR
SAIN
T VI
NCE
NT
HO
SP
MET
ROW
EST
MED
CTR
EMER
SON
HO
SP
MO
UN
T AU
BURN
HO
SP
CARI
TAS
NO
RWO
OD
HO
SP
NO
RTH
EAST
HLT
H S
YS
WIN
CHES
TER
HO
SP
FAU
LKN
ER H
OSP
CARI
TAS
GO
OD
SAM
ARIT
AN H
OSP
CAPE
CO
D H
OSP
JORD
AN H
OSP
BETH
ISRA
EL D
EACO
NES
S M
ED C
TR
NEW
TON
WEL
LESL
EY H
OSP
SOU
THCO
AST
HLT
H S
YS S
T. L
UKE
’S
SOU
TH S
HO
RE H
OSP
U M
ASS
MEM
ORI
AL M
ED C
TR
COO
LEY
DIC
KIN
SON
HO
SP
MAS
SACH
USE
TTS
GEN
HO
SP
BRIG
HAM
AN
D W
OM
EN'S
HO
SP
STU
RDY
MEM
ORI
AL H
OSP
0.0
0.2
0.4
0.6
0.8
1.0
1.2
1.4
0.0
0.2
0.4
0.6
0.8
1.0
1.2
1.4
COMPOSITE QUALITY RATIO AND PRICE RELATIVITY FOR APPENDECTOMY BY MASSACHUSETTS HOSPITAL, 2009
SOURCE: Massachusetts Division of Health Care Finance and Policy, “Massachusetts Health Care Cost Trends: Price Variation in Massachusetts Health Care Services,” May 2011.
PRICE RELATIVITY QUALITY RELATIVITY

BLUE CROSS BLUE SHIELD OF MASSACHUSETTS FOUNDATION
THE IMPACT OF RISING HEALTH CARE COSTS IN MASSACHUSETTS
WHERE HEALTH CAREDOLLARS GO
DRIVERS OFSPENDING GROWTH
VARIATIONSIN SPENDING
MARCH 2012 44
Price and Quality Remain Uncorrelated When Using a Different Quality Metric
The survey “Hospital Care Quality Information from the Consumer Perspective” reflects patients’ reports of the quality of care they received. It too showed no connection between price and quality.
BEVE
RLY
HO
SP
CARI
TAS
NO
RWO
OD
HO
SP
MO
UN
T AU
BURN
HO
SP
WIN
CHES
TER
HO
SP
CARI
TAS
GO
OD
SAM
ARIT
AN H
OSP
JORD
AN H
OSP
TUFT
S M
ED C
TR
SOU
TH S
HO
RE H
OSP
SOU
THCO
AST
HO
SPIT
ALS
GRP
BETH
ISRA
EL D
EACO
NES
S M
ED C
TR
U M
ASS
MEM
ORI
AL M
ED C
TR
LAH
EY C
LIN
IC H
OSP
NEW
TON
-WEL
LESL
EY H
OSP
NO
RTH
SH
ORE
MED
CTR
BRIG
HAM
AN
D W
OM
EN'S
HO
SP
COO
LEY
DIC
KIN
SON
HO
SP
MAS
SACH
USE
TTS
GEN
HO
SP 0.0
0.2
0.4
0.6
0.8
1.0
1.2
1.4
0.0
0.2
0.4
0.6
0.8
1.0
1.2
1.4
QUALITY AND PRICE RELATIVITY FOR TREATMENT OF PNEUMONIA BY MASSACHUSETTS HOSPITAL, 2009
PRICE RELATIVITY QUALITY RELATIVITY
NOTE: Includes only hospitals with at least 30 discharges and those available in the CMS quality score.SOURCE: Massachusetts Division of Health Care Finance and Policy, “Massachusetts Health Care Cost Trends: Price Variation in Massachusetts Health Care Services,” May 2011.

BLUE CROSS BLUE SHIELD OF MASSACHUSETTS FOUNDATION
THE IMPACT OF RISING HEALTH CARE COSTS IN MASSACHUSETTS
WHERE HEALTH CAREDOLLARS GO
DRIVERS OFSPENDING GROWTH
VARIATIONSIN SPENDING
MARCH 2012 45
0.6 0.7 0.8 0.9 1.0 1.1 1.2 1.3 1.4 1.5$0
$200
$400
$600
$800
$1,000
$1,200
$1,400
$1,600
Prices Are Likely Driven By the Market Power or Bargaining Power of Different Hospitals
The Massachusetts Attorney General found that high prices were related to how “big” a hospital was, in terms of both the total revenue earned by its overarching hospital system (y-axis) and the number of patients the hospital system served (size of dot).
SYSTEM-WIDE HOSPITAL REVENUE FROM BCBSMA (SELECTED TEACHING HOSPITALS)(MILLIONS OF DOLLARS)
MGH (1.35)BWH (1.31)
TMC(1.41)
BCBS’S RELATIVE PRICE PAID TO AMC
UMMC(1.17)
BIDMC(1.21)
BMC(1.06)
NOTE: The systems’ BCBSMA HMO/POS membership in 2008 is indicated by dot size. The hospitals' case mix index is noted in parentheses; Beth Israel Deaconess Medical Center (BIDMC) and UMass Memorial Medical Center (UMMC) are similar in size in terms of BCBSMA membership and also receive similar prices . As such, both hospital systems is are reflected in one split dot. SOURCE: Office of Attorney General Martha Coakley, Examination of Health Care Cost Trends and Cost Drivers, March 2010.

BLUE CROSS BLUE SHIELD OF MASSACHUSETTS FOUNDATION
THE IMPACT OF RISING HEALTH CARE COSTS IN MASSACHUSETTS
WHERE HEALTH CAREDOLLARS GO
DRIVERS OFSPENDING GROWTH
VARIATIONSIN SPENDING
MARCH 2012 46
0.0 1.0 2.0 3.0 4.0 5.0
-2%
-1%
0%
1%
2%
3%
4%
Higher-Priced Hospitals Are Gaining Market Share at the Expense of Lower-Priced Hospitals
The Attorney General found that hospitals receiving above-average payments were responsible for nearly two-thirds of 2008 inpatient discharges. What’s more, admissions at higher-paid hospitals grew by nearly 3% from 2005 to 2008. Over the same period, lower-paid hospitals had fewer discharges.
PERCENT CHANGE IN ADULT DISCHARGES 2005-2008
NOTES:
1. Data from Massachusetts Health Data Consortium; excludes normal newborn discharges (which double-count normal obstetrical deliveries since the mother is already counted in the discharge data).
2. Statewide, total discharges for all hospitals increased by 1.3% from 2005 to 2008.SOURCE: Office of Attorney General Martha Coakley, Examination of Health Care Cost Trends and Cost Drivers, March 2010.
62%of 2008
Discharges
38%of 2008
Discharges Hospitals paid below-average prices LOST 1.15% in inpatient volume from 2005 to 2008.
Hospitals paid above-average prices GAINED 2.88% in inpatient volume from 2005 to 2008.

BLUE CROSS BLUE SHIELD OF MASSACHUSETTS FOUNDATION
THE IMPACT OF RISING HEALTH CARE COSTS IN MASSACHUSETTS
WHERE HEALTH CAREDOLLARS GO
DRIVERS OFSPENDING GROWTH
VARIATIONSIN SPENDING
MARCH 2012 47
Higher Overall Utilization Is Not Correlated with Better Quality
Medicare pays all providers about the same prices, so total spending in this graph approximates total utilization and intensity of care. Studying spending in the last two years of life also controls for the severity of illness and outcomes. Even when prices and outcomes are controlled for, more care is not associated with higher quality.
BAYS
TATE
FRA
NKL
IN M
ED C
TRH
EYW
OO
D H
OSP
HO
LYO
KE M
ED C
TRCO
OLE
Y D
ICKI
NSO
N H
OSP
MER
CY M
ED C
TRST
. AN
NE'
S H
OSP
H
EALT
H A
LLIA
NCE
HO
SP'S
LOW
ELL
GEN
HO
SP
BEVE
RLY
HO
SP
SAIN
TS M
ED C
TR
QU
INCY
MED
CTR
SO
UTH
COAS
T H
OSP
S G
ROU
P M
ERRI
MAC
K VA
LLEY
HO
SP
BAYS
TATE
MED
CTR
MO
RTO
N H
OSP
& M
ED C
TR
CAPE
CO
D H
OSP
M
ILTO
N H
OSP
JORD
AN H
OSP
ST
. VIN
CEN
T H
OSP
WIN
CHES
TER
HO
SP
LAH
EY C
LIN
IC H
OSP
CA
RITA
S N
ORW
OO
D H
OSP
CA
MBR
IDG
E H
EALT
H A
LLIA
NCE
N
ORT
H S
HO
RE M
ED C
TRM
ILFO
RD R
EGIO
NAL
MED
CTR
SI
GN
ATU
RE H
EALT
HCA
RE B
ROCK
TON
SO
UTH
SH
ORE
HO
SP
ANN
A JA
QU
ES H
OSP
H
ALLM
ARK
HEA
LTH
SYS
TEM
FA
LMO
UTH
HO
SP
NEW
TON
-WEL
LESL
EY H
OSP
LA
WRE
NCE
GEN
HO
SP
MO
UN
T AU
BURN
HO
SP
MET
ROW
EST
MED
CTR
CA
RITA
S G
OO
D S
AMAR
ITAN
MED
CTR
U
MAS
S M
EM-M
ARLB
ORO
UG
H H
OSP
UM
ASS
MEM
MED
CTR
MAS
SACH
USE
TTS
GEN
HO
SP
BOST
ON
MED
CTR
BE
TH IS
RAEL
DEA
CON
ESS
MED
CTR
CA
RITA
S ST
. ELI
ZABE
TH'S
MED
CTR
BR
IGH
AM A
ND
WO
MEN
'S H
OSP
TU
FTS
MED
CTR
0.0
0.2
0.4
0.6
0.8
1.0
1.2
1.4
0.0
0.2
0.4
0.6
0.8
1.0
1.2
1.4
TOTAL MEDICARE REIMBURSEMENTS PER DECEDENT IN THE LAST TWO YEARS OF LIFE AND CMS HOSPITAL COMPARE QUALITY SCORE BY MASSACHUSETTS HOSPITAL
REIMBURSEMENT RELATIVITY
SOURCE: Dartmouth Atlas of Health Care.
QUALITY RELATIVITY

BLUE CROSS BLUE SHIELD OF MASSACHUSETTS FOUNDATION
THE IMPACT OF RISING HEALTH CARE COSTS IN MASSACHUSETTS
WHERE HEALTH CAREDOLLARS GO
DRIVERS OFSPENDING GROWTH
VARIATIONSIN SPENDING
MARCH 2012 48
Even Within the Extended Boston Region There Is No Association Between More Care and Better Care
The amount of care provided could reflect regional factors, such as the malpractice environment. But even within the extended Boston hospital market, the variation in total spending and lack of relationship to quality remain.
ST. A
NN
E'S
HO
SP
LOW
ELL
GEN
ERAL
HO
SP
BEVE
RLY
HO
SP
SAIN
TS M
ED C
TR
QU
INCY
MED
CTR
SOU
THCO
AST
HO
SPS
GRO
UP
MER
RIM
ACK
VALL
EY H
OSP
MO
RTO
N H
OSP
& M
ED C
TR
CAPE
CO
D H
OSP
MIL
TON
HO
SP
JORD
AN H
OSP
WIN
CHES
TER
HO
SP
LAH
EY C
LIN
IC H
OSP
CARI
TAS
NO
RWO
OD
HO
SP
CAM
BRID
GE
HEA
LTH
ALL
IAN
CE
NO
RTH
SH
ORE
MED
CTR
MIL
FORD
REG
ION
AL M
ED C
TR
SIG
NAT
URE
HEA
LTH
CARE
BRO
CKTO
N
SOU
TH S
HO
RE H
OSP
ANN
A JA
QU
ES H
OSP
HAL
LMAR
K H
EALT
H S
YSTE
M
FALM
OU
TH H
OSP
NEW
TON
-WEL
LESL
EY H
OSP
LAW
REN
CE G
ENER
AL H
OSP
MO
UN
T AU
BURN
HO
SP
MET
ROW
EST
MED
CTR
CARI
TAS
GO
OD
SAM
ARIT
AN M
ED C
TR
MAS
SACH
USE
TTS
GEN
ERAL
HO
SP
BOST
ON
MED
CTR
BETH
ISRA
EL D
EACO
NES
S M
ED C
TR
CARI
TAS
ST. E
LIZA
BETH
'S M
ED C
TR
BRIG
HAM
AN
D W
OM
EN'S
HO
SP
TUFT
S M
ED C
TR 0.0
0.2
0.4
0.6
0.8
1.0
1.2
1.4
0.0
0.2
0.4
0.6
0.8
1.0
1.2
1.4
TOTAL MEDICARE REIMBURSEMENTS PER DECEDENT IN THE LAST TWO YEARS OF LIFE AND CMS HOSPITAL COMPARE QUALITY SCORE BY HOSPITAL, BOSTON HEALTH REFERRAL REGION
REIMBURSEMENT RELATIVITY QUALITY RELATIVITY
SOURCE: Dartmouth Atlas of Health Care.

BLUE CROSS BLUE SHIELD OF MASSACHUSETTS FOUNDATION
THE IMPACT OF RISING HEALTH CARE COSTS IN MASSACHUSETTS
WHERE HEALTH CAREDOLLARS GO
DRIVERS OFSPENDING GROWTH
VARIATIONSIN SPENDING
MARCH 2012 49
More Care May Actually Signal Poorer Quality, As Nearly 10% of Hospital Spending Is for Potentially Avoidable Services
SOURCES: 2009 total MA hospital spending from Centers for Medicare & Medicaid Services, Health Expenditures by State of Residence, 2011; potentially avoidable hospital admissions from Massachusetts Division of Health Care Policy and Finance, Health Care Cost Trends Public Hearings, “Challenges in Coordination of Health Care Services,” June 30, 2011.
9%
Potentially Avoidable Hospital Admissions
$719 million
Preventable Emergency Department Visits
$571 million
Avoidable Hospital Readmissions
$704 million
PotentiallyAvoidable Hospital Spending
TOTAL MA HOSPITAL SPENDING: $21.3 BILLION IN 2009
MARCH 2012 BLUE CROSS BLUE SHIELD OF MASSACHUSETTS FOUNDATION
CONCLUSIONS
Massachusetts spends more on health care than any other state. Higher costs were not caused or markedly accelerated by health reform, as
Massachusetts has been a high spending state for years. The underlying difference in spending between Massachusetts and the U.S. overall
is rooted in the state’s demographics, insurance coverage, and health care market structure, which includes disproportionately many specialists and teaching hospitals and some very large and powerful hospital systems.
Though the amount of most services used increases every year, the majority of the growth in health spending comes from increased prices.
There is enormous variation in total health care spending across the state, stemming from variations in both price and utilization.
However, neither higher prices nor higher utilization of services is associated with higher quality or better health outcomes, suggesting that there is a significant amount of waste in the Massachusetts health care system. It also suggests that costs can be lowered without decreasing overall quality or health outcomes.
50

MARCH 2012 BLUE CROSS BLUE SHIELD OF MASSACHUSETTS FOUNDATION
REFERENCES AND RESOURCES
Massachusetts Division of Health Care Finance and Policy http://www.mass.gov/eohhs/gov/departments/hcf/
Massachusetts Office of the Attorney General http://www.mass.gov/ago/ Massachusetts Cost Trends Reports and Hearings
http://www.mass.gov/eohhs/researcher/physical-health/health-care-delivery/health-care-cost-trends/ Dartmouth Atlas of Health Care http://www.dartmouthatlas.org/ National Health Expenditure Accounts, Centers for Medicare and Medicaid Services
http://www.cms.gov/NationalHealthExpendData/
51