march 1988 annoyance caused advanced turboprop aircraft flyover noise · pdf filetechnical...
TRANSCRIPT

NASA Technical Paper 2782
March 1988 Annoyance Caused by Advanced Turboprop Aircraft Flyover Noise
Single-Rotating Propeller Configuration
I
David A. McCurdy
https://ntrs.nasa.gov/search.jsp?R=19880008057 2018-05-19T02:18:42+00:00Z

NASA Tech n ica I Paper 2782
1988
National Aeronautics and Space Administration
Scientific and Technical Information Division
Annoyance Caused by Advanced Turboprop Aircraft Flyover No&e
Single-Rotating Propeller Conzguration
David A. McCurdy Langley Research Center Hampt o n, Virginia

Summary Introduction
Two laboratory experiments were conducted to quantify the annoyance response of people to synthe- sized advanced turboprop (propfan) aircraft flyover noise. The specific objectives were (1) to determine the effects on annoyance of fundamental frequency (blade passage frequency), frequency envelope shape (helical-tip Mach number), and tone-to-broadband noise ratio; (2) to compare the annoyance response to advanced turboprop aircraft with the annoyance responses to conventional turboprop and jet aircraft; and (3) to determine the ability of aircraft-noise mea- surement procedures and corrections to predict an- noyance. Analyses of the data obtained from the two experiments are presented in this report.
In the first experiment a computer synthesis system was used to generate 45 realistic, time- varying simulations of propeller-aircraft takeoff noise in which the tonal content was systematically varied to represent the factorial combinations of 5 funda- mental frequencies, 3 frequency envelope shapes, and 3 tone-to-broadband noise ratios. Sixty-four subjects judged the annoyance of recordings of the 45 synthe- sized takeoff noises presented at 3 sound pressure lev- els in a test facility that simulates the outdoor acous- tic environment. In the second experiment, the com- puter synthesis system was used to generate 18 simu- lations of propeller-aircraft takeoff noise representing the factorial combinations of 6 fundamental frequen- cies and 3 tone-to-broadband noise ratios. These ad- vanced turboprop simulations along with recordings of 5 conventional turboprop takeoffs and 5 conven- tional jet takeoffs were presented at 3 sound pressure levels to 32 subjects in an anechoic chamber.
Analyses of the judgments from the first exper- iment showed that frequency envelope did not sig- nificantly affect the annoyance response. The in- teraction of fundamental frequency with tone-to- broadband noise ratio did have a large and complex effect on annoyance. Duration-corrected, A-weighted sound pressure level with a modified tone correction predicted the annoyance of the first-experiment stim- uli better than any other measurement procedure. Analyses of the judgments from the second experi- ment also indicated a significant interaction of fun- damental frequency and tone-to-broadband noise ra- tio. The advanced turboprop stimuli were slightly less annoying than the conventional turboprop and jet stimuli. The use of a duration correction and a modified tone correction improved the annoyance prediction for the second-experiment stimuli.
The return of the propeller to long-haul com- mercial service may be rapidly approaching in the form of the advanced turboprop, or “propfan,” air- craft. The advanced turboprop aircraft, whose pro- peller is vastly different from conventional propellers in shape and number of blades, offers substantial sav- ings in operating costs through improved energy ef- ficiency. However, such an aircraft will come into general usage only if its noise, which has unique spectral characteristics, meets the standards of com- munity acceptability currently applied to existing aircraft. Much research has been directed toward understanding and quantifying the annoyance caused by jet-aircraft flyover noise; but relatively little re- search has been conducted for conventional propeller noise, and almost none has been conducted for ad- vanced turboprop noise. To address this need, two laboratory experiments were conducted to quantify the annoyance of people to advanced turboprop air- craft flyover noise.
The primary concern in quantifying advanced tur- boprop noise annoyance is the unique spectral char- acteristics of the noise. In general, propeller noise consists of a number of harmonically related pure tone components that are superimposed on broad- band noise (fig. 1). The fundamental frequency of these tones, which can dominate the total noise produced by the aircraft, occurs at the propeller blade passage frequency and ranges from 50 Hz to about 150 Hz for conventional propeller aircraft. For advanced turboprop aircraft, the fundamental fre- quency is predicted to range from 150 Hz to as high as 300 Hz, hence the uniqueness of the noise. The annoyance caused by noise sources with strong tonal components has historically been more diffi- cult to quantify than the annoyance caused by broad- band noise. The uncertainty in accounting for tonal content is increased in this case because less basic psychoacoustic research has been conducted in the lower frequency ranges of tones from conventional and advanced turboprop propellers than in the higher frequency range of tones from jet aircraft.
The first laboratory experiment examined the ef- fects of tonal characteristics on annoyance. The ex- periment had two specific objectives. The first objec- tive was to determine the effects on annoyance of fun- damental frequency, frequency envelope shape (i.e., the sound pressure levels of the harmonics relative to the fundamental), and tone-to-broadband noise ratio (fig. 1). The controlling mechanisms for these three tonal characteristics are, respectively, blade passage frequency, blade helical-tip Mach number, and engine core and airframe noise. The second objective was to

determine the ability of aircraft-noise measurement procedures and corrections to predict annoyance to advanced turboprop aircraft.
The primary objective of the second laboratory experiment was to compare the annoyance response to advanced turboprop aircraft with the annoyance responses to conventional turboprop and jet aircraft. The effects on annoyance of fundamental frequency and tone-to-broadband noise ratio were also exam- ined in the second experiment. The final objective of the second experiment was to determine the ability of aircraft-noise measurement procedures and correc- tions to predict annoyance to the combined set of aircraft types.
Noise Metrics, Symbols, and Abbreviations
Noise Metrics
EPNL
L A
L D
L E
L1
LL
LLZ
PL
PNL
PNLK, PNLM, PNLw
effective perceived noise level, dB
A-weighted sound pres- sure level, dB
D-weighted sound pres- sure level, dB
Eweighted sound pres- sure level, dB
weighted sound pressure level based on modified frequency weighting from reference 1 (see “Acoustic Data Analyses” section), dB
loudness level (Stevens Mark VI procedure), dB
Zwicker’s loudness level, dB
perceived level (Stevens Mark VI1 procedure), dB
perceived noise level, dB
perceived noise level with critical-band corrections (see “Acoustic Data Analyses” section), dB
Detailed descriptions of the noise metrics used in this report can be found in references 1, 2, and 3.
Symbols and Abbreviations ATP FAR
Fo
LS Mht
P Tl T2
TIN
advanced turboprop Federal Aviation Regulation fundamental frequency (blade passage frequency), Hz subjective noise level, dB helical-tip Mach number probability EPNL tone-correction method (ref. 2) tone-correction method identical to TI except that no corrections are applied for tones below the 500-Hz 1/3-octave band tone-to-broadband noise ratio (defined as the difference between the level of the fundamental tone and the level of the highest 1/3-octave band of broadband noise), dB
Experimental Method Test Facilities
First experiment. The Exterior Effects Room in the Langley Aircraft Noise Reduction Laboratory (fig. 2) was used as the test facility in the first experiment. This room, which has a volume of approximately 340 m3 and a reverberation time of approximately 0.25 sec at 1000 Hz, simulates the outdoor acoustic environment. The subjects pictured in figure 2 occupy the seats used by each group of four subjects during testing. The monophonic recordings of the aircraft noise stimuli were played on a studio-quality tape recorder and presented to the subjects by means of six overhead loudspeakers. A commercially available noise reduction system that provided a nominal 30-dB increase in signal-to-noise ratio was used to reduce tape hiss to inaudible levels.
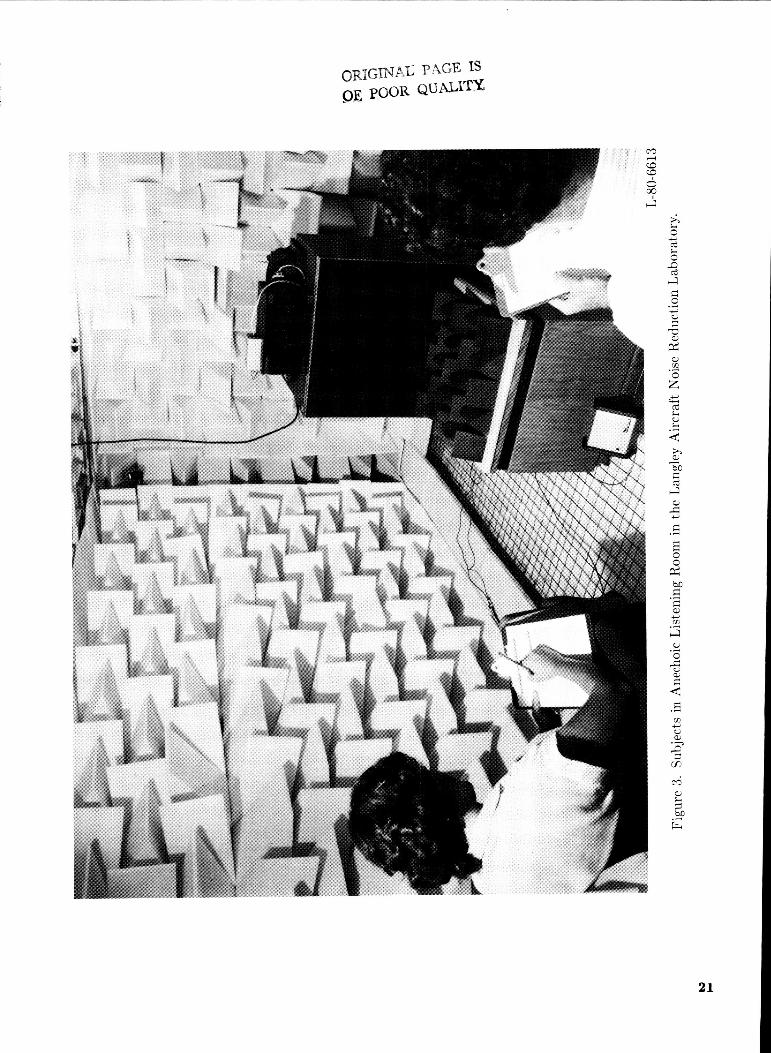
Second experiment. The Anechoic Listening Room in the Langley Aircraft Noise Reduction Laboratory (fig. 3) was used as the test facility in the second ex- periment. This room, which has a volume of 20 m3 and an A-weighted ambient noise level of 15 dB, provides an essentially echo-free environment. This test facility was used instead of the facility used in the first experiment to eliminate any possibility of standing waves affecting the data. As in the first ex- periment, the aircraft-noise stimuli were played on a studio-quality tape recorder using a noise reduction system to reduce tape hiss. The stimuli were pre- sented to the subjects using a special speaker system consisting of one high-frequency unit and one low- frequency unit. The high-frequency unit has a usable
2

frequency range from 100 to 10000 Hz, and the low- frequency subwoofer provides a flat response within f l dB in the frequency range from 30 to 100 Hz.
Test Subjects Ninety-six subjects, 64 for the first experiment
and 32 for the second experiment, were randomly selected from a pool of local residents with a wide range of socioeconomic backgrounds and were paid to participate in the experiments. All test subjects were given audiograms prior to the experiment to verify normal hearing. Table I gives the sex and age data for the subjects in each experiment.
Noise Stimuli
Advanced turboprop stimuli in first experiment. A recently developed Aircraft Noise Synthesis Sys- tem was used to generate the advanced turboprop noise stimuli used in the first experiment (ref. 4). The computer-based system generates realistic, time- varying, audio simulations of aircraft flyover noise at a specified observer location on the ground. The synthesis takes into account the time-varying aircraft position relative to the observer; specified reference spectra consisting of broadband, narrowband, and pure tone components; directivity patterns; Doppler shift; atmospheric effects; and ground effects. These parameters can be specified and controlled in such a way as to generate stimuli in which certain noise characteristics such as fundamental frequency or du- ration are independently varied while the remaining characteristics such as broadband content are held constant. The synthesis system was used to gener- ate 45 simulations of advanced turpoprop aircraft fly- over noise in which the tonal content was systemat- ically varied to represent the factorial combinations of 5 fundamental frequencies, 3 frequency envelope shapes, and 3 tone-to-broadband noise ratios.
The first step in generating the simulations was to define a synthesis-system input data set for each of the 45 flyovers. A literature review was conducted to determine the typical characteristics of advanced turboprop aircraft and the expected ranges of the tonal characteristics (refs. 5 to 19). Because of test- ing time constraints, the simulations were limited to one takeoff flight profile, one observer location, one broadband noise spectrum, and one broadband noise directivity pattern. Each of these parameters was the same for each simulation. The selected takeoff flight profile resulted in an altitude at closest a p proach to the observer of 380 m, about the altitude expected at the FAR 36 takeoff noise measurement location (ref. 2). The observer was located on the centerline of the ground track. Since predictions of
advanced turboprop broadband noise were not avail- able, the broadband spectral content was based on measurements of an existing, large, turboprop air- craft. The broadband 1/3-octave spectrum is given in figure 4. Aircraft speed was 70 m/sec (Mach num- ber = 0.2). The propeller characteristics are given in table 11. A wing-mounted, tractor, single-rotating propeller configuration was assumed for all the simu- lations. A model of this configuration is shown in fig- ure 5. The numbers of blades correspond to a range of fundamental frequencies that covers both the con- ventional propeller aircraft (50 to 150 Hz) and the advanced turboprop aircraft (150 to 300 Hz). The blade diameters and aircraft speed resulted in helical- tip Mach numbers of 0.63, 0.73, and 0.78, which rep- resent three frequency envelope shapes.
The propeller characteristics and descriptions of the SR-3 blade were used as data for a computer program that calculates the discrete frequency noise of propellers (ref. 20). This program determined the tonal components, frequency envelope shape (i.e., the sound pressure levels of the harmonics relative to the fundamental), and directivity patterns for each of the 15 combinations of number of blades and blade diameter. This information was then used in the synthesis-system input data sets. The numbers of blades yielded five fundamental frequencies: 67.5, 135, 180, 225, and 292.5 Hz. The three helical- tip Mach numbers, 0.63, 0.73, and 0.78, resulted in frequency envelope shapes with approximately linear roll-off rates of 11, 6.2, and 4.6 dB per 100 Hz, respectively.
The desired tone-to-broadband noise ratios of 0, 15, and 30 dB were obtained by specifying the rel- ative levels of the tonal content and the broadband noise in the synthesis-system input data sets. (The tone-to-broadband noise ratio was defined to be the difference between the level of the fundamental tone and the level of the highest 1/3-octave band of broad- band noise.)
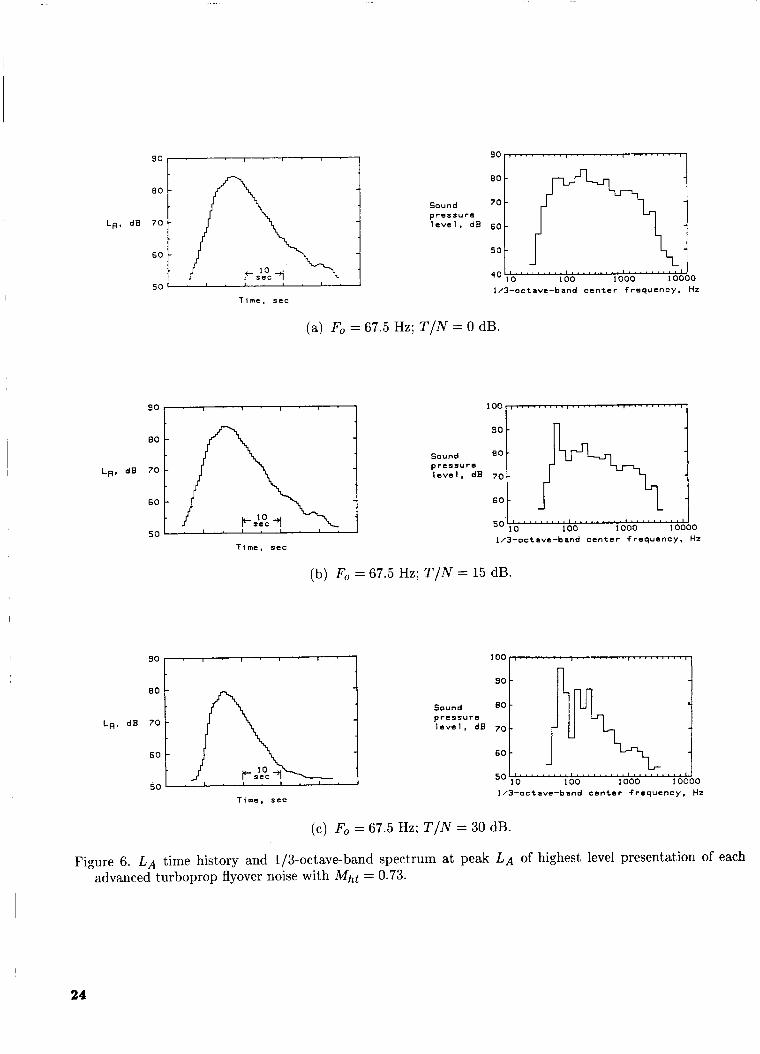
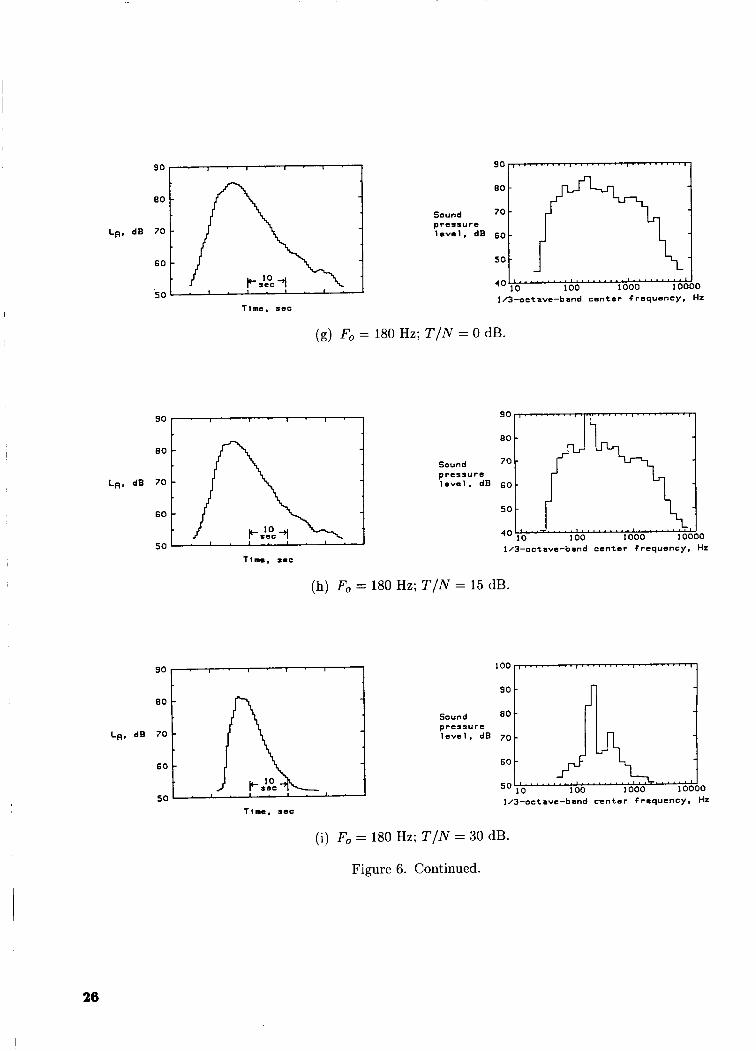
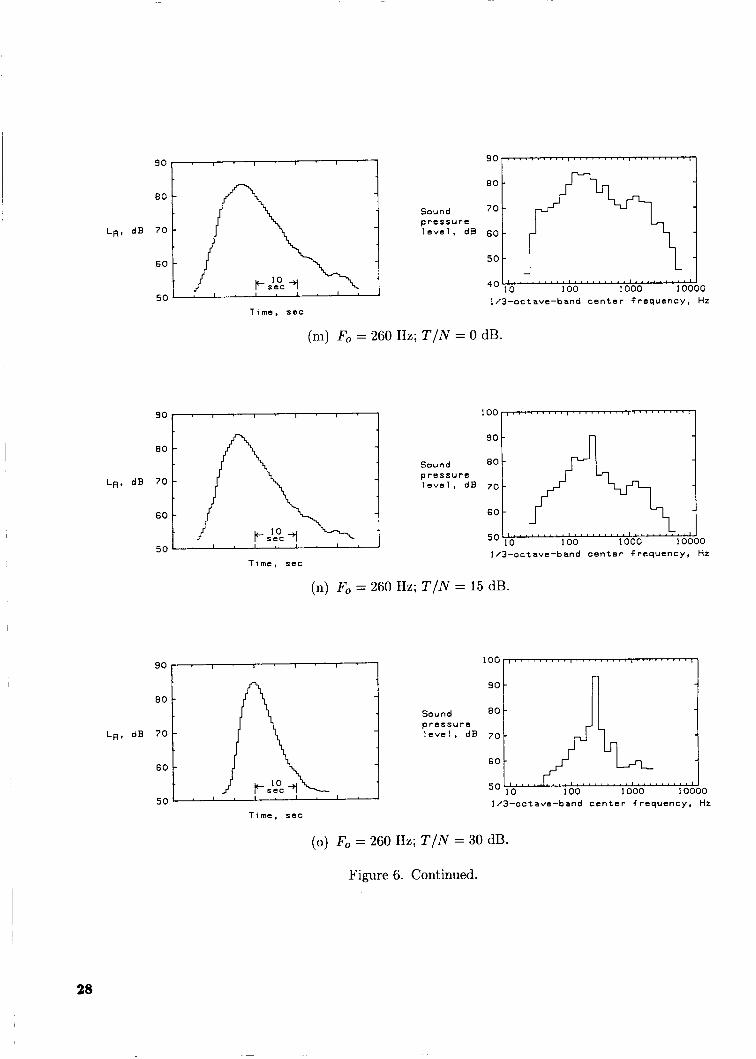
For each of the 45 input data sets, the synthe- sis system generated an audio simulation that was recorded on tape. Each of these recordings was pre- sented to the test subjects at D-weighted sound pres- sure levels of 70, 80, and 90 dB. The factorial com- binations of 5 fundamental frequencies, 3 frequency envelope shapes, 3 tone-to-broadband noise ratios, and 3 sound levels resulted in 135 advanced turbo- prop aircraft flyover noise stimuli. The LA time his- tory and the 1/3-octave-band spectrum at peak L A of the highest level presentation of each flyover noise with a helical-tip Mach number of 0.73 are given in figure 6. The time histories and 1/3-octave spec- tra of the noise stimuli with helical-tip Mach num- bers of 0.63 and 0.78 are similar to the corresponding
3
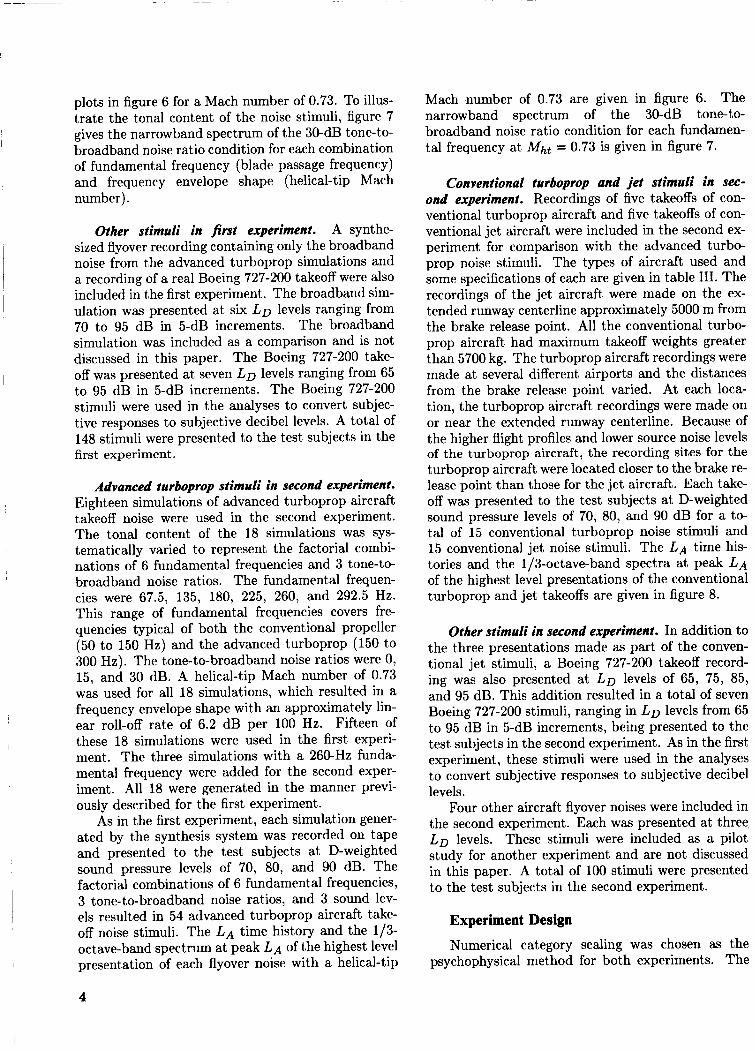
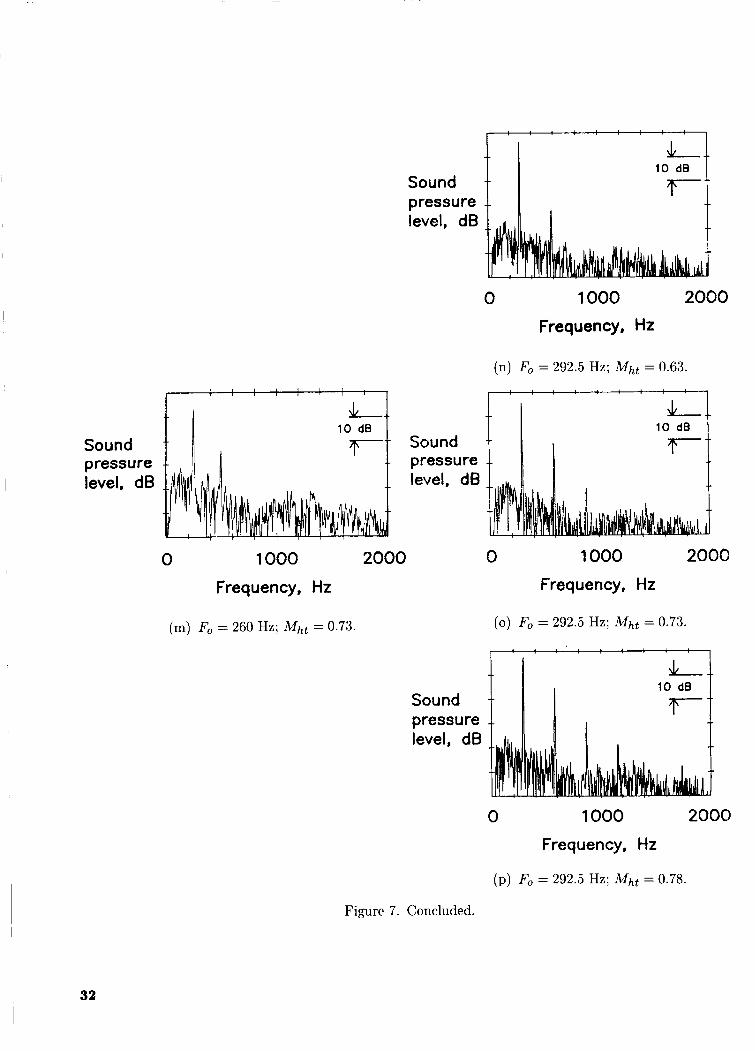
plots in figure 6 for a Mach number of 0.73. To illus- trate the tonal content of the noise stimuli, figure 7 gives the narrowband spectrum of the 30-dB tone-to- broadband noise ratio condition for each combination of fundamental frequency (blade passage frequency) and frequency envelope shape (helical-tip Mach number).
I
Other stimuli in first experiment. A synthe- sized flyover recording containing only the broadband noise from the advanced turboprop simulations and a recording of a real Boeing 727-200 takeoff were also included in the first experiment. The broadband sim- ulation was presented at six LD levels ranging from 70 to 95 dB in 5-dB increments. The broadband simulation was included as a comparison and is not discussed in this paper. The Boeing 727-200 take-
to 95 dB in 5-dB increments. The Boeing 727-200 stimuli were used in the analyses to convert subjec- tive responses to subjective decibel levels. A total of 148 stimuli were presented to the test subjects in the first experiment.
I off was presented at seven LD levels ranging from 65
Advanced turboprop stimuli in second experiment. Eighteen simulations of advanced turboprop aircraft takeoff noise were used in the second experiment.
I The tonal content of the 18 simulations was sys- tematically varied to represent the factorial combi- nations of 6 fundamental frequencies and 3 tone-to- broadband noise ratios. The fundamental frequen- cies were 67.5, 135, 180, 225, 260, and 292.5 Hz. This range of fundamental frequencies covers fre- quencies typical of both the conventional propeller (50 to 150 Hz) and the advanced turboprop (150 to 300 Hz). The tone-to-broadband noise ratios were 0, 15, and 30 dB. A helical-tip Mach number of 0.73 was used for all 18 simulations, which resulted in a frequency envelope shape with an approximately lin- ear roll-off rate of 6.2 dB per 100 Hz. Fifteen of these 18 simulations were used in the first experi- ment. The three simulations with a 260-Hz funda- mental frequency were added for the second exper- iment. All 18 were generated in the manner previ- ously described for the first experiment.
As in the first experiment, each simulation gener- ated by the synthesis system was recorded on tape and presented to the test subjects at D-weighted sound pressure levels of 70, 80, and 90 dB. The factorial combinations of 6 fundamental frequencies, 3 tone-to-broadband noise ratios, and 3 sound lev- els resulted in 54 advanced turboprop aircraft take- off noise stimuli. The LA time history and the 1/3- octave-band spectrum at peak L A of the highest level
I
, presentation of each flyover noise with a helical-tip
Mach number of 0.73 are given in figure 6. The narrowband spectrum of the 30-dB tone-to- broadband noise ratio condition for each fundamen- tal frequency at Mht = 0.73 is given in figure 7.
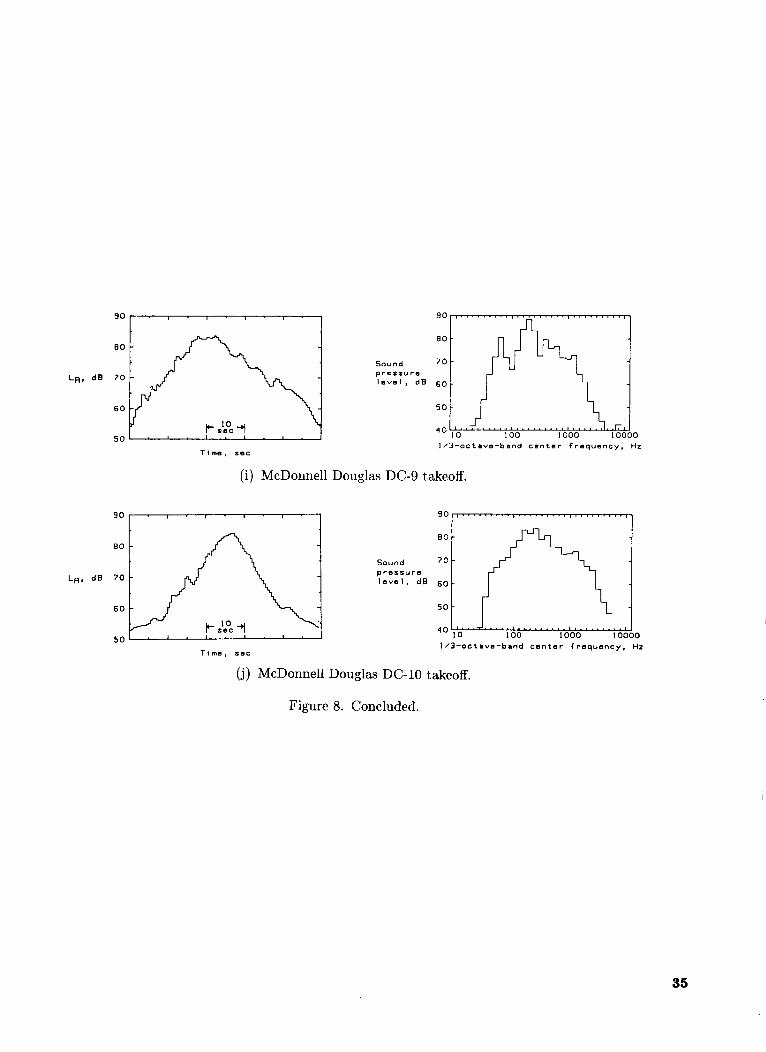
Conventional turboprop and jet stimuli in sec- ond experiment. Recordings of five takeoffs of con- ventional turboprop aircraft and five takeoffs of con- ventional jet aircraft were included in the second ex- periment for comparison with the advanced turbo- prop noise stimuli. The types of aircraft used and some specifications of each are given in table 111. The recordings of the jet aircraft were made on the ex- tended runway centerline approximately 5000 m from the brake release point. All the conventional turbo- prop aircraft had maximum takeoff weights greater than 5700 kg. The turboprop aircraft recordings were made at several different airports and the distances from the brake release point varied. At each loca- tion, the turboprop aircraft recordings were made on or near the extended runway centerline. Because of the higher flight profiles and lower source noise levels of the turboprop aircraft, the recording sites for the turboprop aircraft were located closer to the brake re- lease point than those for the jet aircraft. Each take- off was presented to the test subjects at D-weighted sound pressure levels of 70, 80, and 90 dB for a to- tal of 15 conventional turboprop noise stimuli and 15 conventional jet noise stimuli. The LA time his- tories and the 1/3-octave-band spectra at peak LA of the highest level presentations of the conventional turboprop and jet takeoffs are given in figure 8.
Other stimuli in second experiment. In addition to the three presentations made as part of the conven- tional jet stimuli, a Boeing 727-200 takeoff record- ing was also presented at LD levels of 65, 75, 85, and 95 dB. This addition resulted in a total of seven Boeing 727-200 stimuli, ranging in LD levels from 65 to 95 dB in 5-dB increments, being presented to the test subjects in the second experiment. As in the first experiment, these stimuli were used in the analyses to convert subjective responses to subjective decibel levels.
Four other aircraft flyover noises were included in the second experiment. Each was presented at three. LD levels. These stimuli were included as a pilot study for another experiment and are not discussed in this paper. A total of 100 stimuli were presented to the test subjects in the second experiment.
Experiment Design Numerical category scaling was chosen as the
psychophysical method for both experiments. The
4
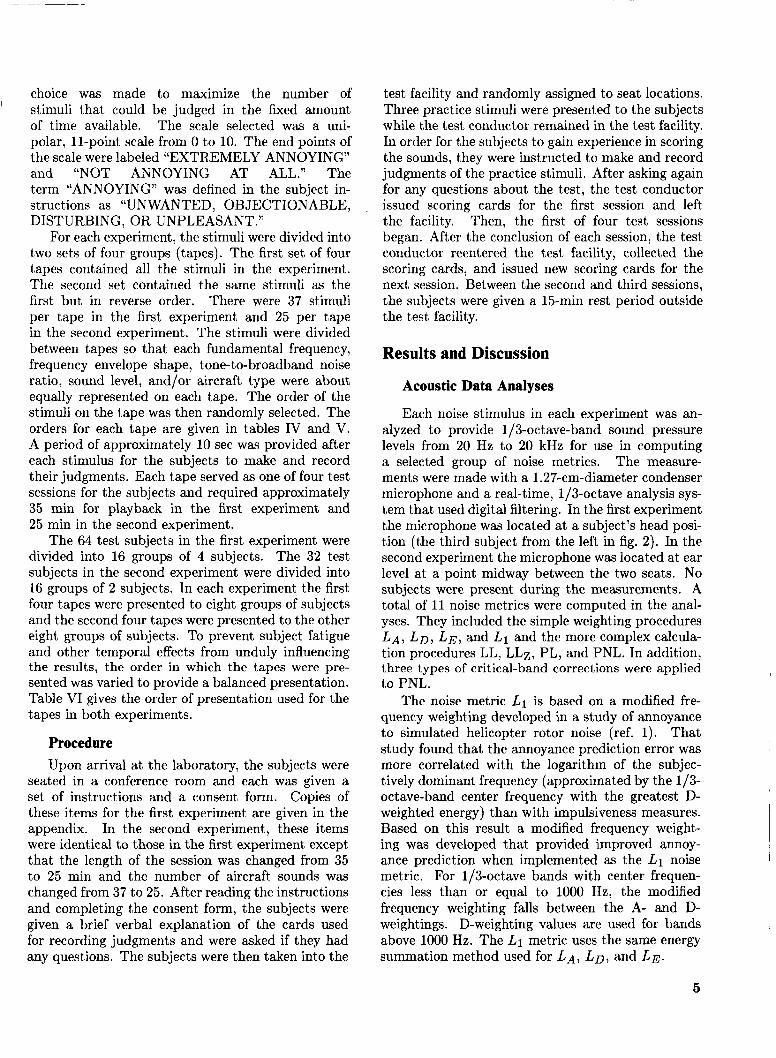
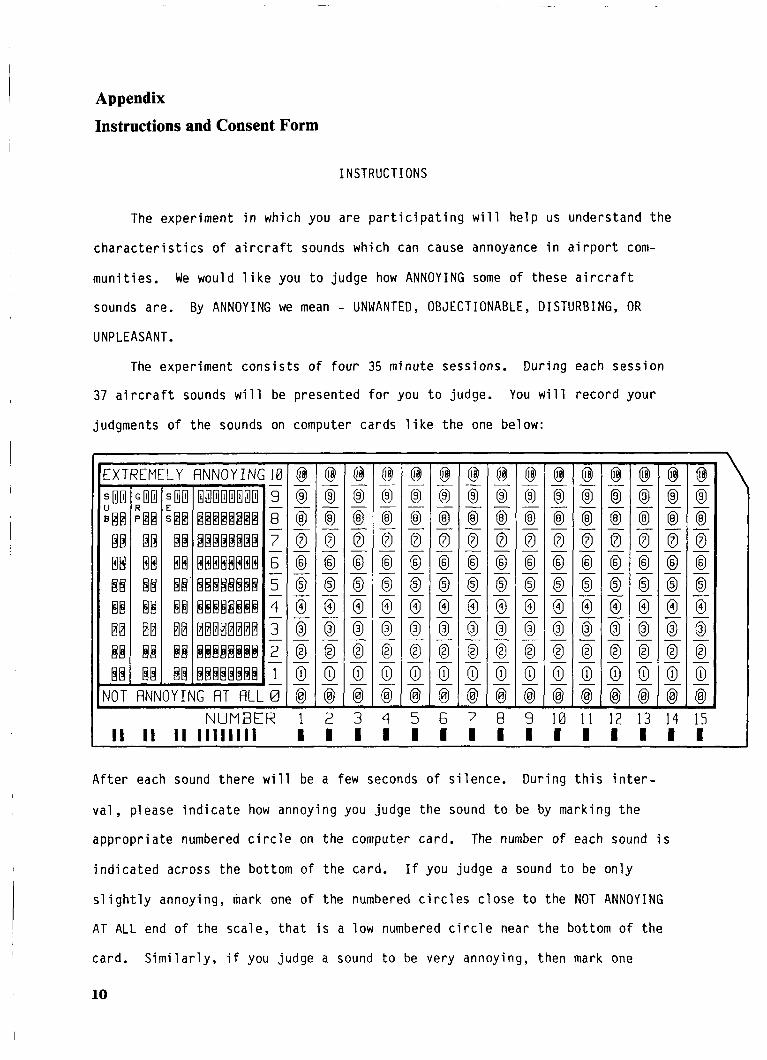
choice was made to maximize the number of stimuli that could be judged in the fixed amount of time available. The scale selected was a uni- polar, 11-point scale from 0 to 10. The end points of the scale were labeled “EXTREMELY ANNOYING” and “NOT ANNOYING AT ALL.” The term “ANNOYING” was defined in the subject in- structions as “UNWANTED, OBJECTIONABLE, DISTURBING, OR UNPLEASANT.”
For each experiment, the stimuli were divided into two sets of four groups (tapes). The first set of four tapes contained all the stimuli in the experiment. The second set contained the same stimuli as the first but in reverse order. There were 37 stimuli per tape in the first experiment and 25 per tape in the second experiment. The stimuli were divided between tapes so that each fundamental frequency, frequency envelope shape, tone-to-broadband noise ratio, sound level, and/or aircraft type were about equally represented on each tape. The order of the stimuli on the tape was then randomly selected. The orders for each tape are given in tables IV and V. A period of approximately 10 sec was provided after each stimulus for the subjects to make and record their judgments. Each tape served as one of four test sessions for the subjects and required approximately 35 min for playback in the first experiment and 25 min in the second experiment.
The 64 test subjects in the first experiment were divided into 16 groups of 4 subjects. The 32 test subjects in the second experiment were divided into 16 groups of 2 subjects. In each experiment the first four tapes were presented to eight groups of subjects and the second four tapes were presented to the other eight groups of subjects. To prevent subject fatigue and other temporal effects from unduly influencing the results, the order in which the tapes were pre- sented was varied to provide a balanced presentation. Table VI gives the order of presentation used for the tapes in both experiments.
I
Procedure Upon arrival at the laboratory, the subjects were
seated in a conference room and each was given a set of instructions and a consent form. Copies of these items for the first experiment are given in the appendix. In the second experiment, these items were identical to those in the first experiment except that the length of the session was changed from 35 to 25 min and the number of aircraft sounds was changed from 37 to 25. After reading the instructions and completing the consent form, the subjects were given a brief verbal explanation of the cards used for recording judgments and were asked if they had any questions. The subjects were then taken into the
test facility and randomly assigned to seat locations. Three practice stimuli were presented to the subjects while the test conductor remained in the test facility. In order for the subjects to gain experience in scoring the sounds, they were instructed to make and record judgments of the practice stimuli. After asking again for any questions about the test, the test conductor issued scoring cards for the first session and left the facility. Then, the first of four test sessions began. After the conclusion of each session, the test conductor reentered the test facility, collected the scoring cards, and issued new scoring cards for the next session. Between the second and third sessions, the subjects were given a 15-min rest period outside the test facility.
Results and Discussion
Acoustic Data Analyses
Each noise stimulus in each experiment was an- alyzed to provide 1/3-octave-band sound pressure levels from 20 Hz to 20 kHz for use in computing a selected group of noise metrics. The measure- ments were made with a 1.27-cm-diameter condenser microphone and a real-time, 1/3-octave analysis sys- tem that used digital filtering. In the first experiment the microphone was located at a subject’s head posi- tion (the third subject from the left in fig. 2). In the second experiment the microphone was located at ear level at a point midway between the two seats. No subjects were present during the measurements. A total of 11 noise metrics were computed in the anal- yses. They included the simple weighting procedures LA, L D , L E , and L1 and the more complex calcula- tion procedures LL, LLz, PL, and PNL. In addition, three types of critical-band corrections were applied to PNL.
The noise metric L1 is based on a modified fre- quency weighting developed in a study of annoyance to simulated helicopter rotor noise (ref. 1). That I study found that the annoyance prediction error was more correlated with the logarithm of the subjec- tively dominant frequency (approximated by the 1/3- octave-band center frequency with the greatest D- weighted energy) than with impulsiveness measures. Based on this result a modified frequency weight- ing was developed that provided improved annoy- ance prediction when implemented as the L1 noise metric. For 1/3-octave bands with center frequen- cies less than or equal to 1000 Hz, the modified frequency weighting falls between the A- and D- weightings. D-weighting values are used for bands above 1000 Hz. The L1 metric uses the same energy summation method used for LA, LD, and LE.
5

The first critical-band correction procedure a p plied to PNL was suggested by Kryter (ref. 21). In this procedure, the increased bandwidths of criti- cal bands below 400 Hz are approximated by three groups of 1/3-0ctave bands. The groups are the bands with the following center frequencies: 315 and 250 Hz; 200, 160, and 125 Hz; and 100, 80, 63, and 50 Hz. Within each group the band levels are summed on an energy basis, and the summed band levels are assigned to the band center frequency hav- ing the greatest intensity within the group. The PNL calculation procedure then uses these “crit- ical bands” instead of the 1/3-octave bands be- low 400 Hz. The metric using this procedure is designated “PNLK” in further discussions in this report.
The second critical-band correction procedure used the same groups for summing the 1/3-octave bands. The summed band levels, however, were as- signed to the band center frequency responsible for the greatest “noy” value within the group before summing. The metric using this procedure is des- ignated “PNLM .”
The third critical-band correction procedure also used the same groups of 1/3-octave bands. In this case, the noy values of the 1/3-octave-band levels were added on an energy basis within each group. The resultant noy values for all critical bands were then summed by using the PNL procedure. The metric using this procedure is designated “PNLw .”
Six different variations of each of the 11 previously described noise metrics were calculated. The first was the peak (maximum) level occurring during the flyover noise. Two other variations were calculated by applying two different tone corrections. Three more variations were attained by applying duration corrections to the non tone-corrected level and the two tone-corrected levels. The duration correction and the first tone correction TI are identical to those used in the effective perceived noise level procedure defined in the FAR 36 regulation of the Federal Aviation Administration (ref. 2). The second tone correction T2 is identical to the first except that no corrections are applied for tones identified in bands with center frequencies less than 500 Hz.
Subjective Data Analyses The means (across subjects) of the judgments
were calculated for each stimulus in each experiment. In order to obtain a subjective scale with meaning- ful units of measure, these mean annoyance scores were converted to subjective noise levels L s hav- ing decibel-like properties through the following pro- cess. Included in each experiment for the purpose of converting the mean annoyance scores to Ls values
were seven presentations of a Boeing 727-200 takeoff recording ranging in values of LD from 65 to 95 dB in 5-dB increments. Second-order polynomial regres- sion analyses were performed separately for each ex- periment on data obtained for these seven stimuli. The dependent variable was the calculated PNL, and the independent variable was the mean annoyance score for each of the seven stimuli. Figure 9 presents the data for the first and second experiments and the resulting best fit regression curves. The regres- sion equations were then used to predict the level of the Boeing 727-200 takeoff noise that would produce the same mean annoyance score as each of the other noise stimuli in the separate experiments. These lev- els were then considered as the subjective noise level for each stimulus. Comparisons in these studies and in previous studies indicate that analyses using sub- jective noise levels yield the same results as analyses using mean annoyance scores.
Comparison of Noise Metrics
In order to investigate the prediction ability of the aircraft-noise measurement procedures and cor- rections, the differences between the subjective noise level L s and the calculated noise level for each of the six variations of the measurement procedures and corrections were determined for each stimulus in each experiment. These differences were considered to be the “prediction error” for each stimulus and noise metric variation. The standard deviation of the pre- diction errors for each noise metric variation is a mea- surement of how accurately the variation predicts an- noyance. The smaller the standard deviation, the greater the prediction accuracy.
It should be noted that because of interrelation- ships between the data cases, statistical tests for sig- nificance of differences in the standard deviations of prediction error are not straightforward. The fol- lowing results are based primarily on the consis- tent trends found in the data. Approximate statisti- cal tests indicate that differences in standard devia- tions as small as 0.07 to 0.10 dB could be significant ( p 5 0.05).
First experiment. Table VI1 gives the standard deviations of prediction error for each noise metric variation examined for the 135 advanced turboprop stimuli in the first experiment. Comparisons of the standard deviations indicate that annoyance predic- tion ability was improved by the addition of duration corrections. The T2 tone correction improved pre- diction ability, but the TI tone correction degraded prediction ability. The L A with duration corrections and T2 tone corrections had the smallest standard
6
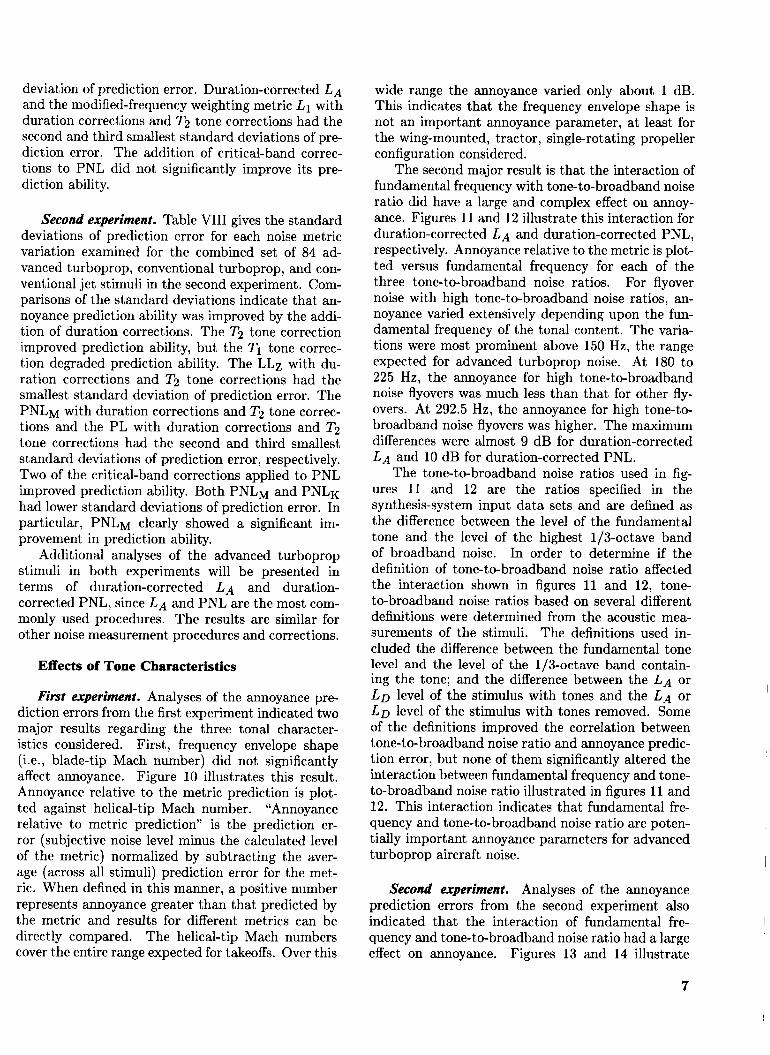
deviation of prediction error. Duration-corrected L A and the modified-frequency weighting metric L1 with duration corrections and T2 tone corrections had the second and third smallest standard deviations of pre- diction error. The addition of critical-band correc- tions to PNL did not significantly improve its pre- diction ability.
~
Second experiment. Table VI11 gives the standard deviations of prediction error for each noise metric variation examined for the combined set of 84 ad- vanced turboprop, conventional turboprop, and con- ventional jet stimuli in the second experiment. Com- parisons of the standard deviations indicate that an- noyance prediction ability was improved by the addi- tion of duration corrections. The T2 tone correction improved prediction ability, but the TI tone correc- tion degraded prediction ability. The LLz with du- ration corrections and T2 tone corrections had the smallest standard deviation of prediction error. The PNLM with duration corrections and T2 tone correc- tions and the PL with duration corrections and T2 tone corrections had the second and third smallest standard deviations of prediction error, respectively. Two of the critical-band corrections applied to PNL improved prediction ability. Both PNLM and PNLK had lower standard deviations of prediction error. In particular, PNLM clearly showed a significant im- provement in prediction ability.
Additional analyses of the advanced turboprop stimuli in both experiments will be presented in terms of duration-corrected LA and duration- corrected PNL, since LA and PNL are the most com- monly used procedures. The results are similar for other noise measurement procedures and corrections.
Effects of Tone Characteristics
First experiment. Analyses of the annoyance pre- diction errors from the first experiment indicated two major results regarding the three tonal character- istics considered. First, frequency envelope shape (i.e., blade-tip Mach number) did not significantly affect annoyance. Figure 10 illustrates this result. Annoyance relative to the metric prediction is plot- ted against helical-tip Mach number. “Annoyance relative to metric prediction” is the prediction er- ror (subjective noise level minus the calculated level of the metric) normalized by subtracting the aver- age (across all stimuli) prediction error for the met- ric. When defined in this manner, a positive number represents annoyance greater than that predicted by the metric and results for different metrics can be directly compared. The helical-tip Mach numbers cover the entire range expected for takeoffs. Over this
wide range the annoyance varied only about 1 dB. This indicates that the frequency envelope shape is not an important annoyance parameter, at least for the wing-mounted, tractor, single-rotating propeller configuration considered.
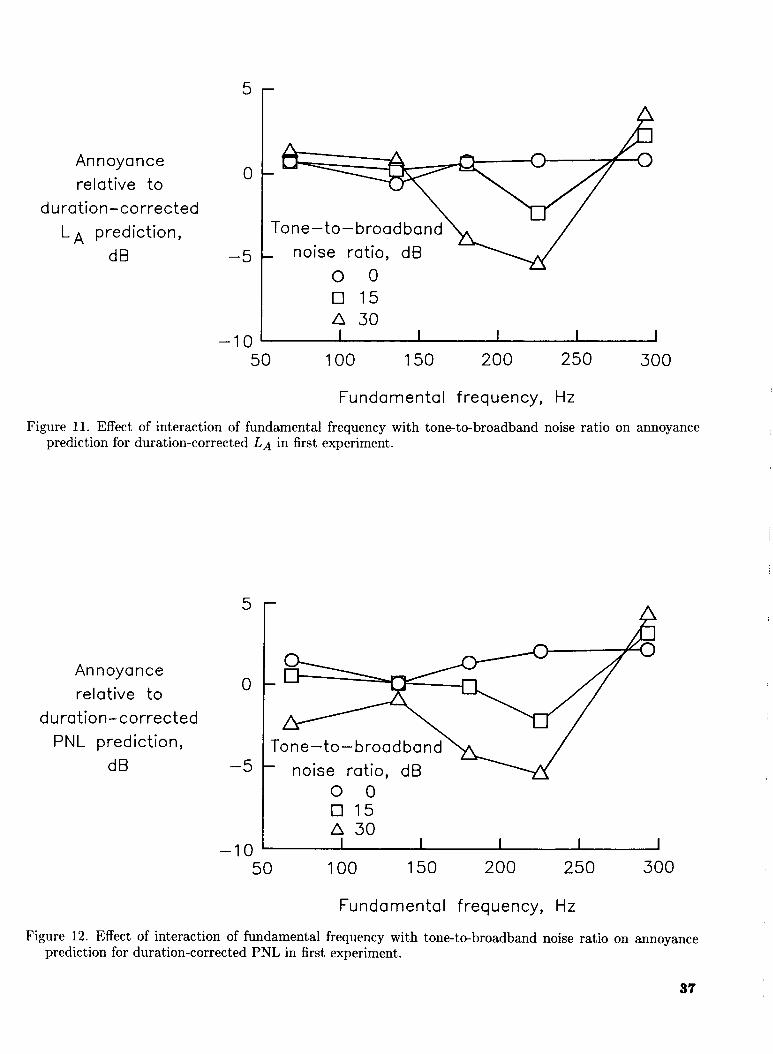
The second major result is that the interaction of fundamental frequency with tone-to-broadband noise ratio did have a large and complex effect on annoy- ance. Figures 11 and 12 illustrate this interaction for duration-corrected LA and duration-corrected PNL, respectively. Annoyance relative to the metric is plot- ted versus fundamental frequency for each of the three tone-to-broadband noise ratios. For flyover noise with high tone-to-broadband noise ratios, an- noyance varied extensively depending upon the fun- damental frequency of the tonal content. The varia- tions were most prominent above 150 Hz, the range expected for advanced turboprop noise. At 180 to 225 Hz, the annoyance for high tone-to-broadband noise flyovers was much less than that for other fly- overs. At 292.5 Hz, the annoyance for high tone-to- broadband noise flyovers was higher. The maximum differences were almost 9 dB for duration-corrected LA and 10 dB for duration-corrected PNL.
The tone-to-broadband noise ratios used in fig- ures 11 and 12 are the ratios specified in the synthesis-system input data sets and are defined as the difference between the level of the fundamental tone and the level of the highest 1/3-octave band of broadband noise. In order to determine if the definition of tone-to-broadband noise ratio affected the interaction shown in figures 11 and 12, tone- to-broadband noise ratios based on several different definitions were determined from the acoustic mea- surements of the stimuli. The definitions used in- cluded the difference between the fundamental tone level and the level of the 1/3-octave band contain- ing the tone; and the difference between the LA or LD level of the stimulus with tones and the LA or LD level of the stimulus with tones removed. Some of the definitions improved the correlation between tone-to-broadband noise ratio and annoyance predic- tion error, but none of them significantly altered the interaction between fundamental frequency and tone- to-broadband noise ratio illustrated in figures 11 and 12. This interaction indicates that fundamental fre- quency and tone-to-broadband noise ratio are poten- tially important annoyance parameters for advanced turboprop aircraft noise.
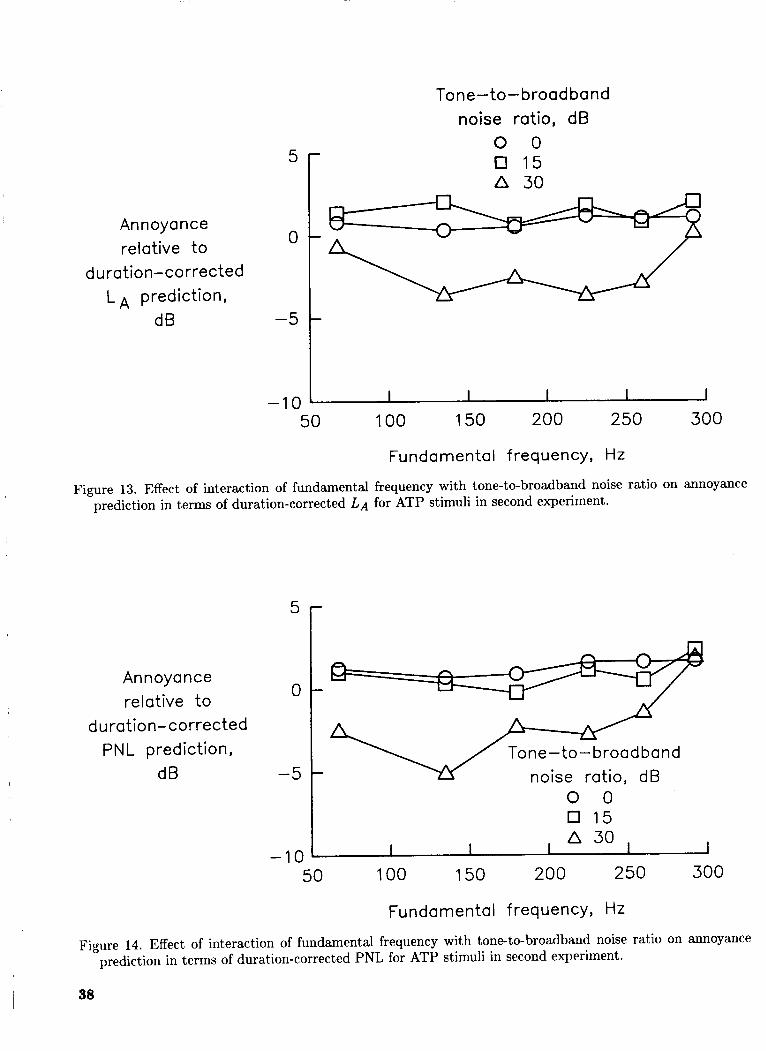
Second experiment. Analyses of the annoyance prediction errors from the second experiment also indicated that the interaction of fundamental fre- quency and tone-to-broadband noise ratio had a large effect on annoyance. Figures 13 and 14 illustrate
7
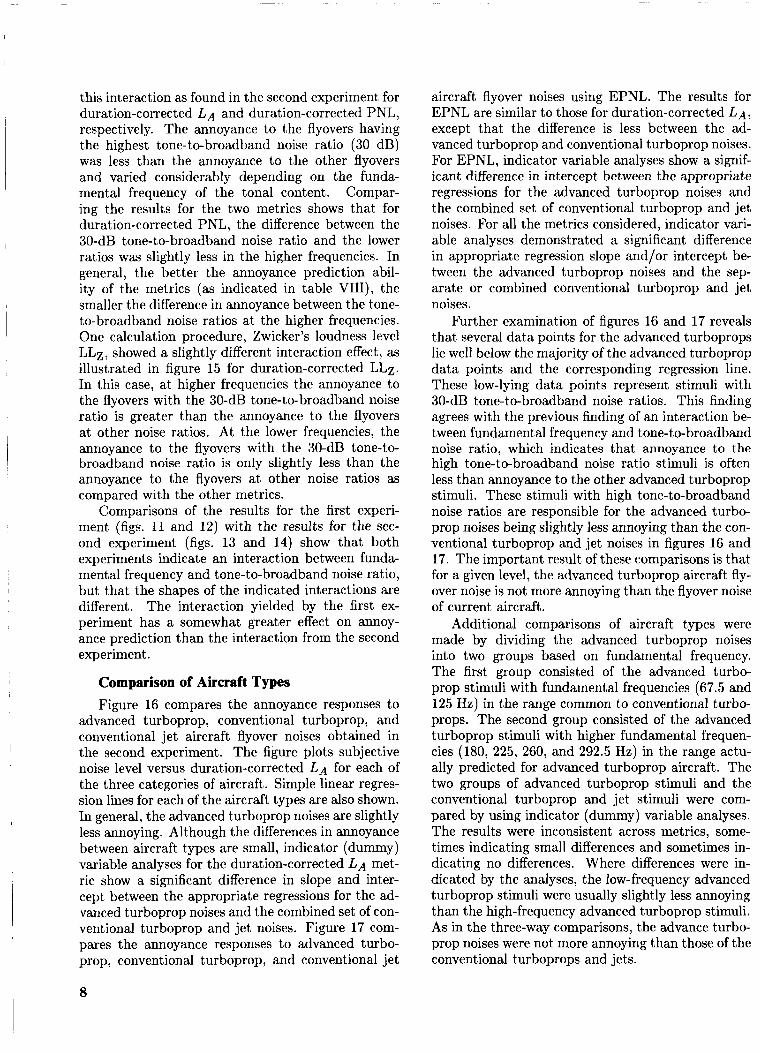
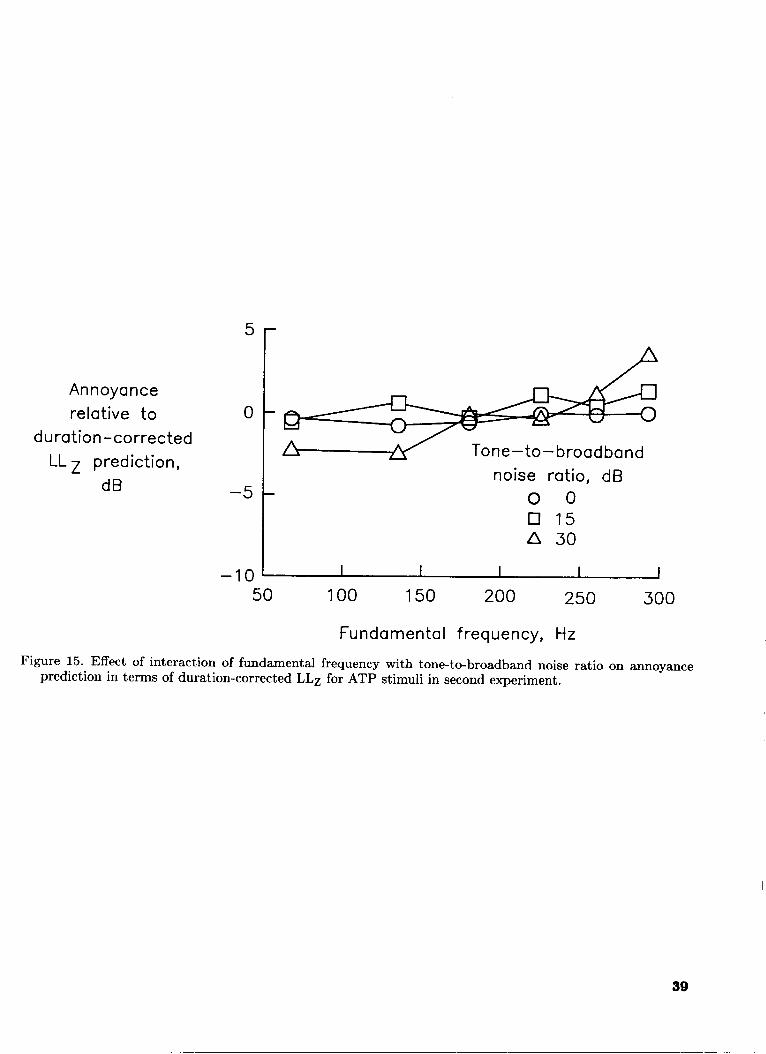
this interaction as found in the second experiment for duration-corrected LA and duration-corrected PNL, respectively. The annoyance to the flyovers having the highest tone-to-broadband noise ratio (30 dB) was less than the annoyance to the other flyovers and varied considerably depending on the funda- mental frequency of the tonal content. Compar- ing the results for the two metrics shows that for duration-corrected PNL, the difference between the 30-dB tone-to-broadband noise ratio and the lower ratios was slightly less in the higher frequencies. In general, the better the annoyance prediction abil- ity of the metrics (as indicated in table VIII), the smaller the difference in annoyance between the tone- to-broadband noise ratios at the higher frequencies. One calculation procedure, Zwicker’s loudness level LLz, showed a slightly different interaction effect, as illustrated in figure 15 for duration-corrected LLz. In this case, at higher frequencies the annoyance to the flyovers with the 30-dB tone-to-broadband noise ratio is greater than the annoyance to the flyovers at other noise ratios. At the lower frequencies, the annoyance to the flyovers with the 30-dB tone-to- broadband noise ratio is only slightly less than the annoyance to the flyovers at other noise ratios as compared with the other metrics.
Comparisons of the results for the first experi- ment (figs. 11 and 12) with the results for the sec- ond experiment (figs. 13 and 14) show that both experiments indicate an interaction between funda- mental frequency and tone-to-broadband noise ratio, but that the shapes of the indicated interactions are different. The interaction yielded by the first ex- periment has a somewhat greater effect on annoy- ance prediction than the interaction from the second experiment.
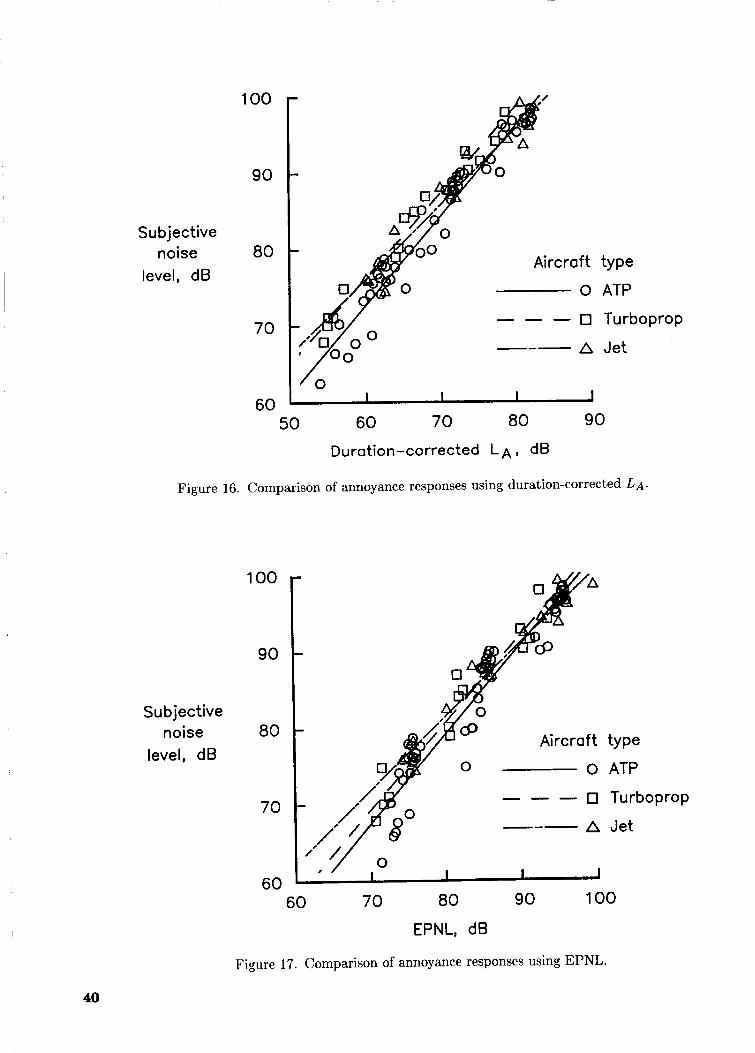
Comparison of Aircraft Types Figure 16 compares the annoyance responses to
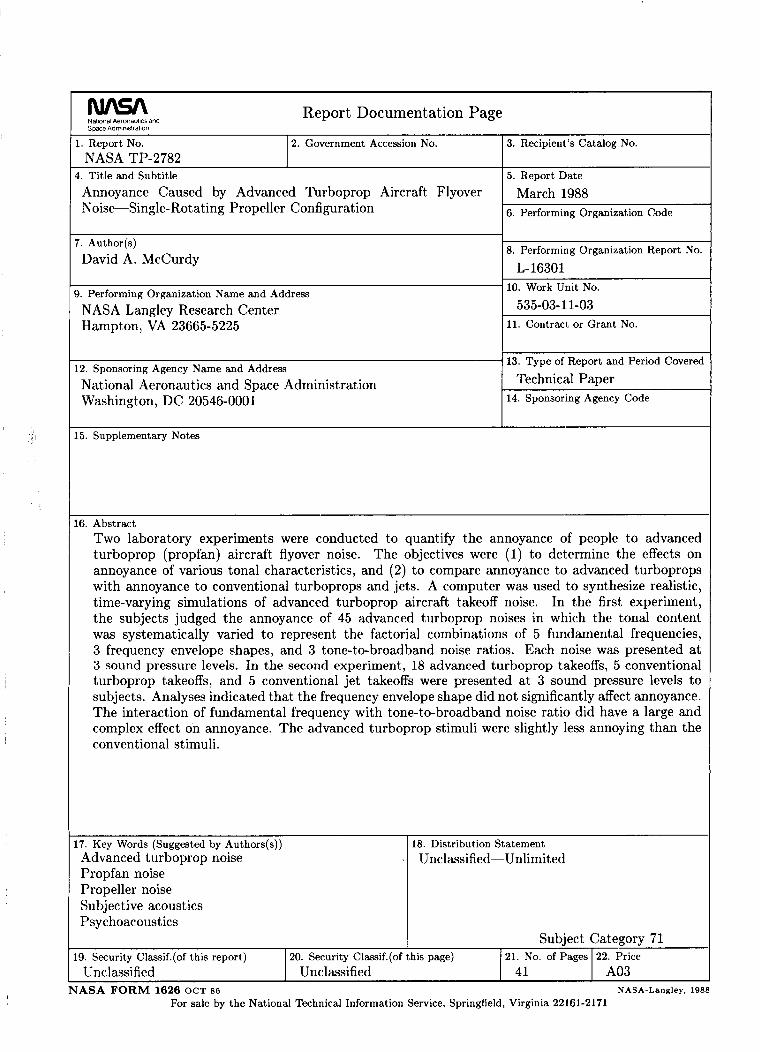
advanced turboprop, conventional turboprop, and conventional jet aircraft flyover noises obtained in the second experiment. The figure plots subjective noise level versus duration-corrected LA for each of the three categories of aircraft. Simple linear regres- sion lines for each of the aircraft types are also shown. In general, the advanced turboprop noises are slightly less annoying. Although the differences in annoyance between aircraft types are small, indicator (dummy) variable analyses for the duration-corrected LA met- ric show a significant difference in slope and inter- cept between the appropriate regressions for the ad- vanced turboprop noises and the combined set of con- ventional turboprop and jet noises. Figure 17 com- pares the annoyance responses to advanced turbo- prop, conventional turboprop, and conventional jet
aircraft flyover noises using EPNL. The results for EPNL are similar to those for duration-corrected L A , except that the difference is less between the ad- vanced turboprop and conventional turboprop noises. For EPNL, indicator variable analyses show a signif- icant difference in intercept between the appropriate regressions for the advanced turboprop noises and the combined set of conventional turboprop and jet noises. For all the metrics considered, indicator vari- able analyses demonstrated a significant difference in appropriate regression slope and/or intercept be- tween the advanced turboprop noises and the sep- arate or combined conventional turboprop and jet noises.
Further examination of figures 16 and 17 reveals that several data points for the advanced turboprops lie well below the majority of the advanced turboprop data points and the corresponding regression line. These low-lying data points represent stimuli with 30-dB tone-to-broadband noise ratios. This finding agrees with the previous finding of an interaction be- tween fundamental frequency and tone-to-broadband noise ratio, which indicates that annoyance to the high tone-to-broadband noise ratio stimuli is often less than annoyance to the other advanced turboprop stimuli. These stimuli with high tone-to-broadband noise ratios are responsible for the advanced turbo- prop noises being slightly less annoying than the con- ventional turboprop and jet noises in figures 16 and 17. The important result of these comparisons is that for a given level, the advanced turboprop aircraft fly- over noise is not more annoying than the flyover noise of current aircraft.
Additional comparisons of aircraft types were made by dividing the advanced turboprop noises into two groups based on fundamental frequency. The first group consisted of the advanced turbo- prop stimuli with fundamental frequencies (67.5 and 125 Hz) in the range common to conventional turbo- props. The second group consisted of the advanced turboprop stimuli with higher fundamental frequen- cies (180, 225, 260, and 292.5 Hz) in the range actu- ally predicted for advanced turboprop aircraft. The two groups of advanced turboprop stimuli and the conventional turboprop and jet stimuli were com- pared by using indicator (dummy) variable analyses. The results were inconsistent across metrics, some- times indicating small differences and sometimes in- dicating no differences. Where differences were in- dicated by the analyses, the low-frequency advanced turboprop stimuli were usually slightly less annoying than the high-frequency advanced turboprop stimuli. As in the three-way comparisons, the advance turbo- prop noises were not more annoying than those of the conventional turboprops and jets.
8
Conclusions
Two laboratory experiments were conducted to provide information on quantifying the annoyance re- sponse of people to synthesized advanced turboprop (propfan) aircraft flyover noise. In both experiments, a computer synthesis system was used to generate realistic simulations of advanced turboprop aircraft takeoff noise. The simulations were based on a wing- mounted, tractor, single-rotating propeller configura- tion of the advanced turboprop. The first experiment examined 45 advanced turboprop simulations repre- senting the factorial combinations of 5 fundamental frequencies, 3 frequency envelope shapes, and 3 tone- to-broadband noise ratios. Sixty-four subjects judged the annoyance of recordings of the 45 synthesized takeoff noises presented at 3 sound pressure levels in a test facility that simulates the outdoor acous- tic environment. The second experiment examined 18 advanced turboprop simulations representing the factorial combinations of 6 fundamental frequencies and 3 tone-to-broadband noise ratios. The advanced turboprop simulations along with recordings of 5 con- ventional turboprop takeoffs and 5 conventional jet takeoffs were presented at 3 sound pressure levels to 32 subjects in an anechoic chamber. Analyses of the annoyance responses were conducted in terms of several variations of seven conventional noise metrics (A-, D-, and E-weighted sound pressure levels, loud- ness level (Stevens Mark VI procedure), Zwicker’s loudness level, perceived level (Stevens Mark VI1 pro- cedure), and perceived noise level) and one other re- cently developed noise metric (L1) based on a modi- fied frequency weighting.
Based on the results presented in this paper, the following conclusions were noted:
1. In both experiments, the annoyance prediction ability of the noise metrics was improved by the addition of a duration correction.
2. In both experiments, the annoyance prediction ability of the noise metrics was improved by the addition of a tone correction similar to the one used in the effective perceived noise level (EPNL) but limited to tones in 1/3-octave bands with center frequencies greater than or equal to 500 Hz. Addition of the effective perceived noise level (EPNL) tone correction to the noise metrics degraded prediction ability in both experiments.
3. Critical-band corrections to the perceived noise level (PNL) did not significantly improve annoyance prediction for the advanced turboprop aircraft in the first experiment. However, for the combination of advanced turboprop, conventional turboprop, and conventional jet aircraft in the second experiment, two of the three critical-band correction methods did significantly improve annoyance prediction.
4. The frequency envelope shape of the tonal components (i.e., blade helical-tip Mach number) of the advanced turboprop noise did not significantly affect annoyance.
5. The interaction of fundamental frequency and tone-to-broadband noise ratio did have a large and complex effect on annoyance to the advanced turboprop aircraft noise. Although the indicated interaction varied somewhat between noise metrics and between the two experiments, in most cases the annoyance to the higher tone-to-broadband noise ra- tio flyovers was less than the annoyance to the other flyovers. The difference in annoyance between the higher tone-to-broadband noise ratio flyovers and the other flyovers varied with fundamental frequency.
6 . For a given level, the flyover noise of advanced turboprop aircraft is not more annoying than the fly- over noise of conventional turboprop and jet aircraft.
NASA Langley Research Center Hampton, VA 23665-5225 December 4. 1987
Appendix
Instructions and Consent Form
I N S T R U C T I O N S
The exper iment i n which you are p a r t i c i p a t i n g w i l l he lp us understand t h e
c h a r a c t e r i s t i c s o f a i r c r a f t sounds which can cause annoyance i n a i r p o r t com-
mun i t i es .
sounds are. By ANNOYING we mean - UNWANTED, OBJECTIONABLE, DISTURBING, OR
UNPLEASANT.
We would l i k e you t o judge how ANNOYING some o f these a i r c r a f t
The exper iment c o n s i s t s o f f o u r 35 minute sessions. Dur ing each sess ion
37 a i r c r a f t sounds w i l l be presented f o r you t o judge. You w i l l r e c o r d your
judgments o f t h e sounds on computer cards l i k e t h e one below:
EXTREMELY flNNOYING I Q
NOT flNNOYING f l T H L L 8 NUMBER
- 8 8 -
0
I
A f t e r each sound t h e r e w i l l be a few seconds o f s i l e n c e . Dur ing t h i s i n t e r -
v a l , p lease i n d i c a t e how annoying you judge t h e sound t o be by marking t h e
approp r ia te numbered c i r c l e on the computer card.
i n d i c a t e d across t h e bottom o f t h e card. I f you judge a sound t o be on ly
s l i g h t l y annoying, mark one o f t h e numbered c i r c l e s c l o s e t o the NOT ANNOYING
AT ALL end o f t he scale, t h a t i s a low numbered c i r c l e near t h e bottom o f t h e
card. S i m i l a r l y , if you judge a sound t o be very annoying, then mark one
10
The number o f each sound i s

o f the numbered c i r c l e s c lose t o the EXTREMELY ANNOYING end o f t he scale, t h a t
i s a h igh numbered c i r c l e near the top o f t he card. A moderate ly annoying
judgment should be marked i n the midd le p o r t i o n o f the scale. I n any case,
make your mark so t h a t t he c i r c l e t h a t most c l o s e l y i n d i c a t e s your annoyance
t o the sound i s comple te ly f i l l e d i n . There are no r i g h t o r wrong answers; we
are on ly i n t e r e s t e d i n your judgment o f each sound.
Before the f i r s t session begins you w i l l be g iven a p r a c t i c e computer
ca rd and t h r e e sounds w i l l be presented t o f a m i l i a r i z e you w i t h making and
reco rd ing judgments. I w i l l remain i n the t e s t i n g room w i t h you d u r i n g t h e
p r a c t i c e t ime t o answer any ques t ions you may have.
Thank you f o r your he lp i n conduct ing the experiment.
11

VOLUNTARY CONSENT FORM FOR SURJECTS FOR HUYAN
RESPONSE TO A I R C R A F T WOIqF: P.ND V I B R A T I O N
I understand t h e purpose o f t he research and t h e technique
t o be used, i n c l u d i n g my p a r t i c i p a t i o n i n t h e research, as exp la ined t o me by t h e P r i n c i p a l I n v e s t i g a t o r ( o r q u a l i f i e d
designee) .
human response t o a i r c r a f t no i se exper iment t o be conducted a t
NASA Langley Research Center on
I do v o l u n t a r i l y consent t o p a r t i c i p a t e as a s u b j e c t i n t h e
Date
I understand t h a t I may a t any t ime wi thdraw f rom t h e ex-
pe r imen t and t h a t I am under no o b l i g a t i o n t o g i v e reasons f o r
wi thdrawal o r t o a t t e n d again f o r exper imentat ion.
I under take t o obey t h e r e q u l a t i o n s o f t h e l a b o r a t o r y and
i n s t r u c t i o n s o f t h e P r i n c i pa 1 I n v e s t i g a t o r r e q a r d i ng s a f e t y , s u b j e c t o n l y t o my r i g h t t o wi thdraw dec la red above.
I a f f i r m t h a t , t o m.y knowledge, m.y s t a t e o f h e a l t h has n o t changed s i n c e t h e t i m e a t which I completed and signed t h e
medica l r e p o r t f o rm r e q u i r e d f o r my p a r t i c i p a t i o n as a t e s t
sub jec t .
S i qna t u r e o f Su b j e c t
i 12

References
1. Powell, Clemans A.; and McCurdy, David A.: Effects of Repetition Rate and Impulsiveness of Simulated Heli- copter Rotor Noise on Annoyance. NASA TP-1969, 1982.
2. Noise Standards: Aircraft Type and Airworthiness Cer- tification. Federal Aviation Regulations, vol. 111, pt. 36, Federal Aviation Admin., 1978.
3. Pearsons, Karl S.; and Bennett, Ricarda L.: Handbook of Noise Ratings. NASA CR-2376, 1974.
4. McCurdy, David A.; and Grandle, Robert E.: Aircraft Noise Synthesis System. NASA TM-89040, 1987.
5. Stern, John A.: Aircraft Propulsion-A Key to Fuel Conservation, an Aircraft Manufacturer's View. SAE Paper 760538, May 1976.
6. Kraus, E. F.; and Van Abkoude, J. C.: Cost/Benefit Tradeoffs f o r Reducing the Energy Consumption of the Commercial A i r Transportation System-Summary Re-
7. Douglas Aircraft Co.: Cost/Benefit Tradeoffs for Re- ducing the Energy Consumption of the Commercial Air Transportation System. Volume I: Technical Analysk.
8. Hanson, Donald B.: Near Field Noise of High Tip Speed Propellers in Forward Flight. AIAA Paper No. 76-565, July 1976.
9. Dugan, J. F.; Miller, B. A.; and Sagerser, D. A.: Sta- tus of Advanced Turboprop Technology. C T O L Trans- port Technology-1978, NASA CP-2036, Part I, 1978, pp. 139-166.
10. Dugan, James F., Jr.; Gatzen, Bernard S.; and Adamson, William M.: Prop-Fan Propulsion-Its Status and Potential. [Preprint] 780995, SOC. of Auto- motive Engineers, 1978.
port. NASA CR-137925, 1976.
NASA CR-137923, 1976.
11. Hanson, Donald B.: The Influence of Propeller Design Parameters on Far Field Harmonic Noise in Forward Flight. AIAA Paper 79-0609, Mar. 1979.
12. Dittmar, James H.; Jeracki, Robert J.; and Blaha, Bernard J.: Tone Noise of Three Supersonic Helical Tip Speed Propellers in a Wind Tunnel. NASA TM-79167, [ 19791.
13. Rennison, D. C.; Wilby, J. F.; Marsh, A. H.; and Wilby, E. G.: Interior Noise Control Prediction Study for High-speed Propeller-Driven Aircraft. NASA CR-159200, 1979.
14. Brooks, Bennett M.; and Metzger, F. B.: Acoustic Test and Analysis of Three Advanced Turboprop Models.
15. Revell, J. D.; Balena, F. J.; and Koval, L. R.: Analytical Study of Interior Noise Control by Fuselage Design Teeh- niques on High-speed, Propeller-Driven Aircraft. NASA
16. Dugan, James F.; Miller, Brent A.; Graber, Edwin J.; and Sagerser, David A.: Th,e NASA High-speed Turbo- prop Program. NASA TM-81561, [1980].
17. Muehlbauer, J. C.; Hewell, J . G., Jr.; Lindenbaum, S. P.; Randall, C. C.; Searle, N.; and Stone, F. R., Jr.: Turboprop Cargo Aircraft Systems Study, Phase I. NASA
18. Muehlbauer, J. C.; Hewell, J. G., Jr.; Lindenbaum, S. P.; Randall, C. C.; Searle, N.; and Stone, F. R., Jr.: Turboprop Cargo Aircraft Systems Study. NASA
19. Arndt, William E.: Fuel Efficient and Mach 0.8, Too. Lockheed Horiz., Issue 10, Spring 1982, pp. 27-34.
20. Martin, R. M.; and Farassat, F.: Users' Manual for a Computer Program To Calculate Discrete Frequency Noise of Conventional and Advanced Propellers. NASA
21. Kryter, K. D.: Possible Modifications to the Calculation
NASA CR-159667, 1980.
CR-159222, 1980.
CR-159355, 1980.
CR-165813, 1981.
TM-83135, 1981.
of Perceived Noisiness. NASA CR-1636, 1970.

Table I. Data on Test Subjects
Number of Mean Median Experiment Sex participants age age
1 Male 22 29 24.5 Female 42 39 35 All subjects . 64 35 27.5
2 Male 9 33 33 Female 23 35 34 All subjects 32 35 33.5
Age range
20 to 65 23 to 62 20 to 65 18 to 57 19 to 63 18 to 63
Table 11. Characteristics of Advanced Turboprop Propeller
Parameter Configuration
Blade Rotational speed Disk loading Number of blades Blade diameter
Condition W ing-mounted, tract or,
single-rotating propeller SR-3 1350 rpm 550 kW/m2 3, 6, 8, 10, 13 2.93, 3.42, 3.66 m
Table 111. Conventional Turboprop and Jet Aircraft in Second Experiment
Number of Engine Aircraft engines type
de Havilland Canada DHC-7 Dash 7 4 Turboprop Lockheed P-3 4 NAMC YS-11 2 Nord 262 2 Shorts 330 2 Airbus Industrie A-300 Boeing 707 4 Boeing 727-200 3 McDonnell Douglas DC-9 2 McDonnell Douglas DC-10 3
1 2 Turbofan
1
Maximum takeoff weight,
kg 20 000 61 200 24 500 10 600 10 300
2142 000 2117000
86 900 2 4 1 100
2206 400
14
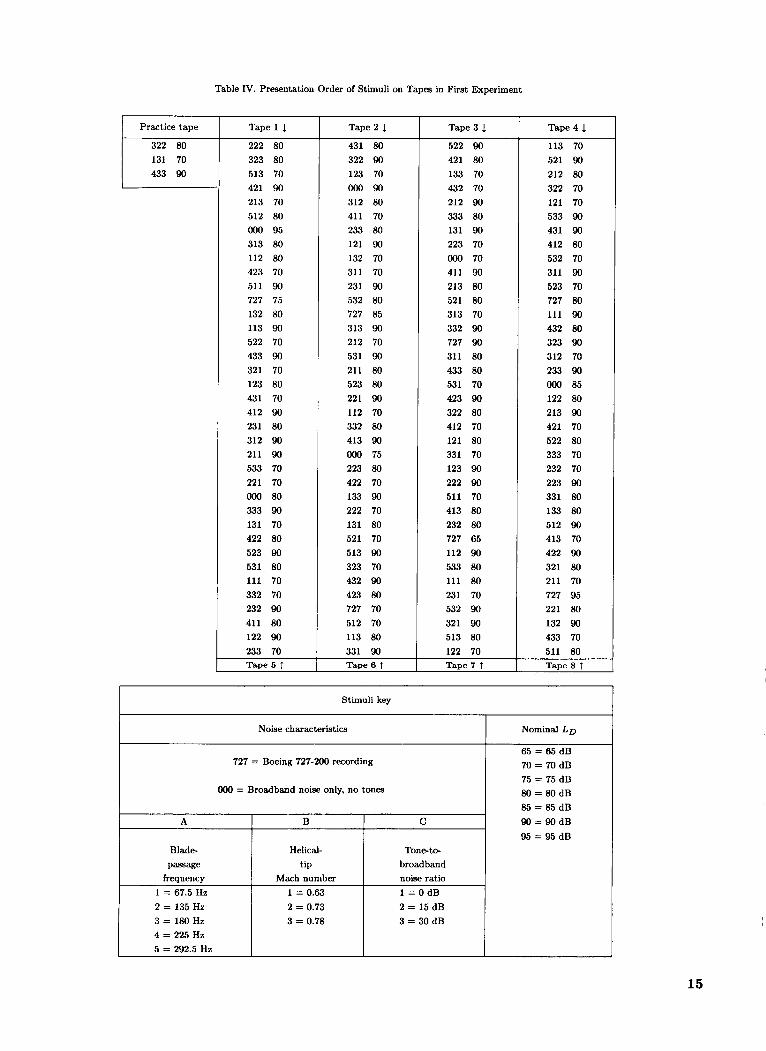
Table IV. Presentation Order of Stimuli on Tapes in First Experiment
Noise characteristics
727 = Boeing 727-200 recording
Practice tape
322 80 131 70
Nominal Lg
65 = 65 dB 70 = 70 dB
Tape 1 1
222 80 323 80 513 70 421 90 213 70 512 80 000 95 313 80 112 80 423 70 511 90 727 75 132 80 113 90 522 70 433 90 321 70 123 80 431 70 412 90 231 80 312 90 211 90 533 70 221 70 000 80 333 90 131 70 422 80 523 90 531 80 111 70 332 70 232 90 411 80 122 90 233 70
A B C
Blade- Helical- Tonet* passage tip broadband
frequency Mach number noise ratio 1 = 67.5 Hz 1 = 0.63 1 = 0 d B
Tape 5 T
85 = 85 dB 9 0 = 9 0 d B 95 = 95 dB
Tape 2 1
431 80 322 90 123 70 000 90 312 80 411 70 233 80 121 90 132 70 311 70 231 90 532 80 727 85 313 90 212 70 531 90 211 80 523 80 221 90 112 70 332 80 413 90 000 75 223 80 422 70 133 90 222 70 131 80 521 70 513 90 323 70 432 90 423 80 727 70 512 70 113 80 331 90 Tape6 t
Tape 3 1 522 90 421 80 133 70 432 70 212 90 333 80 131 90 223 70 OOO 70 411 90 213 80 521 80 313 70 332 90 727 90 311 80 433 80 531 70 423 90 322 80 412 70 121 80 331 70 123 90 222 90 511 70 413 80 232 80 727 65 112 90 533 80 111 80 231 70 532 90 321 90 513 80 122 70 Tape 7
Tape 4 1 113 70 521 90 212 80 322 70 121 70 533 90 431 90 412 80 532 70 311 90 523 70 727 80 111 90 432 80 323 90 312 70 233 90 OOO 85 122 80 213 90 421 70 522 80 333 70 232 70 223 90 331 80 133 80 512 90 413 70 422 90 321 80 211 70 727 95 221 80 132 90 433 70 511 80 Tape 8 T
I I Stimuli key
OOO = Broadband noise only, no tones I 75 = 75 dB 80 = 80 dB
2 = 135 Hz 3 = 1 8 0 H z 4 = 225 Hz 5 = 292.5 Hz
2 = 0.73 3 = 0.78
2 = 15 dB 3 = 30 dB
15

Table V. Presentation Order of Stimuli on Tapes in Second Experiment
180 1 90
Practice tape
DC9 T 80 180 3 70 LP3 T 90
707 T 70
Tape 1 1
260 1 90 DC9 T 80 292 3 90 LP3 T 70 135 3 70 YYY T 80 727 T 85 067 3 90 292 2 70 XXX T 70 180 3 80 DD7 T 80 262 T 90 260 2 70 225 1 80 067 2 80 YS1 T 70 707 T 90 260 3 80 X X X F 9 0 135 1 80 225 2 90 727 T 70 067 1 70
225 3 70
Tape 2 1
135 3 80 727 T 90 180 2 80 225 1 70 DD7 T 90 180 1 70 262 T 80 300 T 90 YYY F 90 135 2 70 292 3 70 067 1 80 D10 T 80 135 1 90 XXX F 70 260 2 80 727 T 65 067 2 90 292 1 80 225 3 90 330 T 70 XXX T 80 260 3 70 292 2 90
067 3 70 Tape 5 f
Tape 3 1
LP3 T 90 067 2 70 YYY T 70 707 T 80 180 2 90 260 3 90 300 T 80 135 1 70 292 1 90 330 T 80 135 2 90 067 3 80 260 1 70 727 T 75 292 3 80 D10 T 90 XXX T 90 DD7 T 70 180 3 70 225 2 80 180 1 80 YS1 T 90 DC9 T 70 YYY F 80
Tape 6 t
Tape 4 1 292 2 80 YYY T 90 225 2 70 YS1 T 80 135 3 90 260 1 80 292 1 70 XXX F 80 300 T 70 260 2 90 180 3 90 LP3 T 80 180 2 70 727 T 95 262 T 70 067 1 90 T35 2 80 330 T 90 D10 T 70 225 1 90 727 T 80 YYY F 70 225 3 80 DC9 T 90
Conventional jet
300 = Airbus A-300 707 = Boeing 707 727 = Boeing 727-200 DC9 = DC-9 D10 = DClO
F = Flyover Pilot study
XXX = Aircraft 1 1 = 0 d B YYY = Aircraft 2 2 = 15 dB
3 = 3 0 d B
I Stimuli kev Operation type or r Aircraft type and/or bladepaasage frequency tone-to-broadband
Advanced turboprop
067 = 67.5 Hz 135 = 135 Hz 180 = 180 Hz 225 = 225 Hz 260 = 260 Hz 292 = 292.5 Hz
Conventional turboprop
DD7 = Dash 7 LP3 = P-3 YS1= Y S l l 262 = Nord 262 330 = Shorts 330
noise ratio I T = Takeoff
Nominal
L D 65 = 65 dB 70 = 70 dB 75 = 75 dB 80 = 80 dB 85 = 85 dB 9 0 = 9 0 d B 95 = 95 dB
16
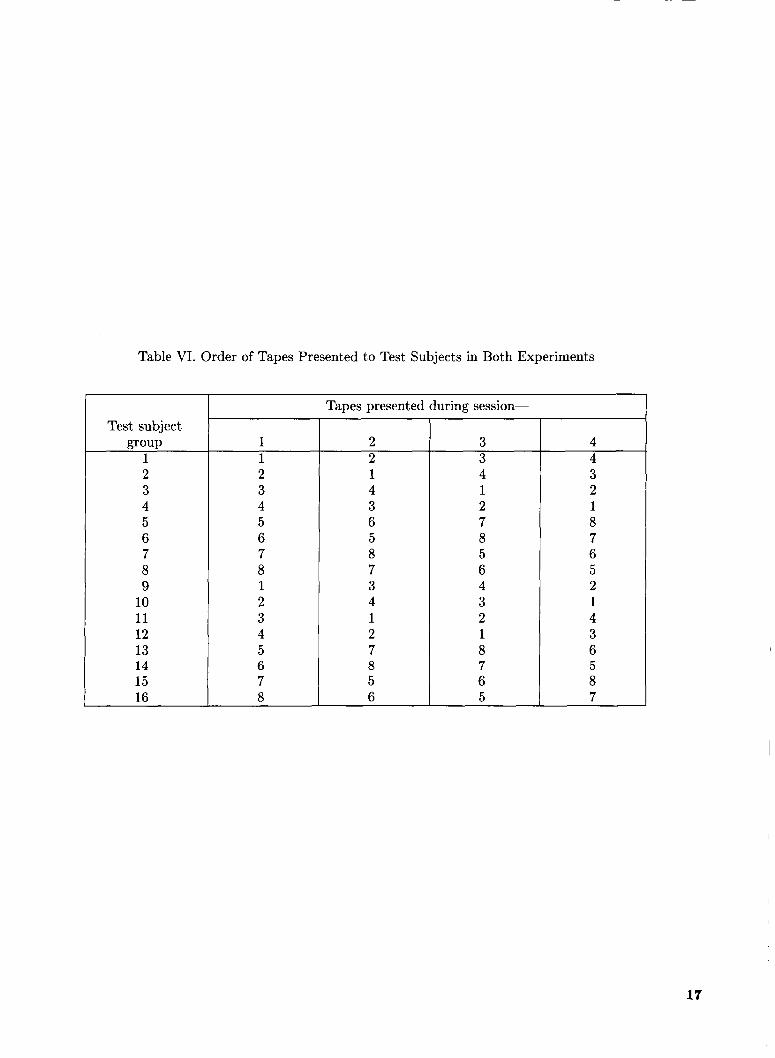
Table VI. Order of Tapes Presented to Test Subjects in Both Experiments
Test subject group
1 2 3 4 5 6 7 8 9
10 11 12 13 14 15 16
1 1 2 3 4 5 6 7 8 1 2 3 4 5 6 7 8
Tapes presented during session-
2 2 1 4 3 6 5 8 7 3 4 1 2 7 8 5 6
3 3 4 1 2 7 8 5 6 4 3 2 1 8 7 6 5
4 4 3 2 1 8 7 6 5 2 1 4 3 6 5 8 7
17

~ ~~~
Metric L A L D L E L1 LL LLZ PL PNL PNLK PNLM PNLw
No duration correction
Table VII. Standard Deviations of Prediction Error for Advanced Turboprop Stimuli in First Experiment
Duration corrected
Standard deviation, dB, for-
Metric L A L D L E L1 LL LLZ PL PNL PNLK PNLM PNLw
No duration correction No tone
No tone correct ion
3.18 3.84 3.83 3.09 3.37 2.78 2.85 3.01 2.95 2.90 3.11
correct ion 3.89 4.85 4.71 4.08 4.19 3.70 3.83 4.01 4.04 4.04 4.14
Tl 4.16 5.19 5.05 4.36 4.38 3.81 4.06 4.29 4.34 4.31 4.44
3.89 3.99
Duration corrected No tone
correction 3.18 3.95 3.78 3.37 3.71 3.44 3.43 3.46 3.40 3.41 3.59
Tl 3.29 4.16 3.99 3.50 3.82 3.46 3.52 3.59 3.54 3.54 3.73
7-2 3.08 3.82 3.66 3.26 3.61 3.37 3.35 3.34 3.29 3.29 3.47
Table VIII. Standard Deviations of Prediction Error for Advanced Turboprop, Conventional Turboprop, and Conventional Jet Stimuli in Second Experiment
Tl 3.52 4.28 4.27 3.57 3.72 3.00 3.19 3.48 3.39 3.26 3.55
No tone T2
3.09 3.76 3.77 3.11 3.21 2.60 2.71 2.93 2.85 2.75 3.01
correct ion 2.53 3.16 3.08 2.57 2.79 2.33 2.36 2.51 2.41 2.35 2.55
Tl 2.88 3.64 3.57 2.99 3.11 2.45 2.63 2.90 2.80 2.68 2.97
T2 2.51 3.12 3.07 2.54 2.69 2.21 2.26 2.42 2.33 2.25 2.48
I 18

Sound pressure
level
Frequency envelope shape /- % \ $
Tone- to- b road b \
- - 4
Broadband I I I I I I
land
I I c
PO Frequency
f Fundamental frequency
noise ratio
Figure 1. Noise characteristics of propeller aircraft.
19

ONGINALL PAGE IS OF POOR QUALITY
20

Sound pressure level, d6
10 100 1000 10000 I/ 3 -octave -ba nd center frequency, Hz
Figure 4. Broadband 1/3-octave spectrum used in synthesis of advanced turboprop aircraft noise.
1 22

ORIGINAC PAGE IS POOR QUALITY
23
Sound pressure level. dB
1/3-octave-band center frequency, Time, sec
(a) Fo = 67.5 Hz; T I N = 0 dB.
eo
Lp. d B 70
60
5 0
Sound pressure level, dB
Tlme, sec
fhl F, = 67.5 Hz: T I N = 15
Time, sec
dB .
HZ
Sound pressure level, d B
1/3-octave-band center frequency, Hz
(c) Fo = 67.5 Hz; T I N = 30 dB.
Figure 6. L A time history and lI3-octave-band spectrum at peak L A of highest level presentation of each advanced turboprop flyover noise with k f h t = 0.73.
24

901, . . . . . . . . . . . . . . . . . . . . . . . . . . . . . . .
EO
Time, scc
(4 Fo =
-
eo
LR. dB 7 0
6 0
50
dB
Sound p r e s s u r e l e v e l . dB 111
L
100 1000 10000 1/3-octave-band c e n t e r f r e q u e n c y , Hz
135 Hz; TIN = 0 dB.
Sound p r e s s u r e l e v e I , dB
1/3-octave-band c e n t e r f r e q u e n c y , Hz Time, sec
(e) Fo = 135 Hz; T I N = 15 dB.
Sound p r e s s u r e l e v e l . dB
Time, scc 1/3-octave-band c e n t e r f requency , Ht
( f ) Fo = 135 Hz; T I N = 30 dB.
Figure 6. Continued.
25
BO
7 0
60
50 Time, sec
(g) Fo =
p r e s s u r e l e v e l . dB 60
5 0
100 1 0 0 0 1 0 0 0 0
1/3-octave-band c e n t e r f r e q u e n c y , HZ
180 Hz; T I N = 0 dB.
Sound p r e s s u r e l e v e l , dB
1/3-octave-band c e n t e r f r e q u e n c y , Hz T l m e , smc
(h) Fo = 180 Hz; T I N = 15 dB.
Sound p r e s s u r e l e v e l , d B
90 -
1/3-octave-band c e n t e r f r e q u e n c y , HZ Tfme. sec
(i) Fo = 180 Hz; T I N = 30 dB.
Figure 6. Continued.
26

Sound p r e s s u r e l e v e l , dB
90
BO
7 0
60
50
. . . . . . . . . . . . . . . . . . . . . . . . . . . . . .
-
-
- -
. ' ' ' . . . ' . . I . . ' ' ' . ' " 1/3-octave-band c e n t e r f requency ,
T i m e , sec
(j) Fo = 225 Hz; T I N = 0 dB.
60
90
8 0
LR, dB 7 0
60
50
T t m e . sec
(k) Fo = 225
90
BO
LR, dB 7 0
6 0
5 0
T t m e , s e c
(1) Fo = 225
Figure
IO HZ
Sound p r e s s u r e l e v e l , dB
Hz; T I N = 15 dB.
Sound p r e s s u r e l e v e l . dB
Hz; T I N = 30 dB.
6. Continued.
27
90
eo
LA. d B 70
60
50
level, d B 60
Sound pressure
90-,.. . . . . . . . , . . . . . . . . " ~ " " ' ~ ' I
Time, sec
(m) Fo = 260 Hz; T I N = 0 dB.
Time, sec
(n) Fo = 260 Hz;
loo;
t level, dB 70
Sound pressure
10 HZ
T I N = 15 dB.
t level, d B 70
Sound pressure
6ot Time, sec
(0) Fo = 260 Hz; T I N = 30 dB.
Figure 6. Continued.
28

90
80
L R , dB 70
6 0
5 0
T i m e . sec
(p) Fo = 292.5 Hz;
Time, see
Sound p r e s s u r e l e v e l . dE
1/3-octave-band c s n t e r f r e q u e n c y , Hs
T I N = 0 dB.
Sound p r e s s u r e l e v e l , dB
1/3-octave-band c e n t e r f r e q u e n c y . Hz
(9) Fo = 292.5 Hz; T I N = 15 dB.
Sound p r e s s u r e l e v e l , dB
T i m e , sec
(r) Fo = 292.5 Hz; T I N = 30
Figure 6. Concluded.
BO - 70 -
100 1000 10000 4o
1/3-octave-band c a n t e r f r e q u e n c y . Hz
1;. ' t , , ' , , * . * , . * ' * ' . , . ' c . '
dB .
29

I I
Sound /I 1 lo;/ Sound press u re pressure level, dB level, dB
10 Lt dB
0 1000 2000 0 1000 2000 Frequency, Hz Frequency, Hz
(a) Fo = 67.5 Hz; Mht = 0.63. (d) Fo = 135 Hz; Mht = 0.63.
Sound pressure
Sound pressure level, dB level, dB
0 1000 2000 0 1000 2000 Frequency, Hz Frequency, Hz
(b) Fo = 67.5 Hz; Mht = 0.73. (e) Fo = 135 Hz; Mht = 0.73.
Sound pressure level, dB
I Li L -- 10 dB
- - I I Sound pressure level, dB
0 1000 2000 0 1000 2000 Frequency, Hz Frequency, Hz
(c) Fo = 67.5 Hz; Mht = 0.78. ( f ) Fo = 135 Hz; Mht = 0.78.
Figure 7. Narrowband spectrum of each advanced turboprop flyover noise with 30-dB tone-to-broadband nois ratio.
30

Sound Sound pressure pressure level, dB level, dB
0 1000 2000 C 1000 2000
Frequency, Hr Frequency, Hz
( g ) Fo = 180 Hz; Mht = 0.63. (j) Fo = 225 Hz; Mht = 0.63.
Sound pressure level, dB
0 1000 2000 0 1000 2000 Frequency, Hz
(h) Fo = 180 Hz; Mht = 0.73.
Sound / I l l lo$/ Sound
level, dB level, dB
Frequency, Hz
(k) Fo = 225 Hz; Mht = 0.73.
10 dB
2000 0 1000 2000 0 1000
Frequency, Hz Frequency, Hz
(i) Fo = 180 Hz; Mht = 0.78. (1) Fo = 225 Hz; Mht = 0.78.
Figure 7. Continued. I
31
Sound pressure level, dB
0 1000 2000 Frequency, Hz
(n) Fo = 292.5 Hz; Mht = 0.63.
Sound pressure level, dB
2000 0 1000 200c 0 1000 Frequency, Hz Frequency, Hz
(0) Fo = 292.5 Hz; Mht = 0.73. (m) Fo = 260 Hz; Mht = 0.73.
Sound pressure level, dB
10 “t dB
A I
0 1000 2000 Frequency, Hz
(p) Fo = 292.5 Hz; Mht = 0.78.
Figure 7. Concluded.
32

901 . . . I . , .
(a) de Havilland Canada
Sound p r e s s u r e level, dB
90
80
7 0
6 0
5 0
T l m e , s o c
(b) Lockheed
90 . , . , . , . , .
1/3-octave-band c e n t e r f r e q u e n c y . HZ
DHC-7 Dash 7 takeoff.
T l m e , s e c
(c) NAMC YS-
Sound p r e s s u r e l e v e l , dB
P-3 takeoff.
90
E O
Sound 7 0 p r e s s u r e l e v e l , dB 6 0
50
40
I /
11 takeoff.
90 I . I . I . I . 1 . , Sound p r e s s u r e l e v e l , dB
T l m e , s o c
(d) Nord 262 takeoff.
10 IO0 IO00 IO000 3-octave-band c e n t e r f r e q u e n c y . Hz
E O - 7 0 -
6 0 -
5 0 -
Figure 8. L A time histories and 1/3-octave-band spectra at peak L A of highest level presentations of takeoffs of conventional turboprop and jet aircraft.
33

80
Sound 7 0
1
IO Hz
T t m e , rec
(e) Shorts 330 takeoff.
l e v e l , dB 60
Sound p r e s s u r e
IO0 IO00 IO000 1/3-octave-band c e n t e r f r e q u e n c y . Hz
T t m e , sec
( f ) Airbus Industrie A-300 takeoff.
70 Sound p r e s s u r e l e v e l , dB 6 0 .
50
'lo ?o IO0 IO00 I O 0 0 0 . , , , . . , I , I , ,
1/3-octavc-ba"d c e n t e r f r e q u e n c y , Hz
T i m e , sec
(g) Boeing 707 takeoff.
Sound p r e s s u r e l e v e l , dB 6 0 -
1/3-octave-band c e n t e r f r e q u e n c y , Hz T i m e , sec
(h) Boeing 727-200 takeoff.
Figure 8. Continued. I
I
I 34
90
EO
LR, dB 7 0
60
5 0 IO
90
eo
LA. dB 70
6 0
5 0
Sound p r e s s u r e Ieve I , dB
9 0
EO
70
60
50
4 0 IO IO0 IO00 101
T l m e . s e c
(i) McDonnell
113-octave-band c e n t e r f r e q u e n c y ,
Douglas DC-9 takeoff.
Sound p r e s s u r e l e v e l . dE
1/3-octava-band c e n t e r f r e q u e n c y . HZ Tlrnc. sec
(j) McDonnell Douglas DC-10 takeoff.
Figure 8. Concluded.
35

105
95
Perceived noise level of reference stimuli and subjective noise level of test stimuli, dB
85
75 0 Second - -
65 0 2 4 6 8 10
Mean annoyance score
Figure 9. Regression analyses of PNL on mean annoyance scores for Boeing 727-200 takeoff stimuli used to convert annoyance judgments to subjective noise levels Ls.
Annoyance relative to
metric prediction, dB
O t 4 -5
Noise metric
0 Duration- corrected L A -
0 Duration-corrected PNL
-10 1 1 .6 .7 .8
I Helical-tip Mach number
Figure 10. Effect of helical-tip Mach number (frequency envelope shape) on annoyance prediction for duration- corrected LA and duration-corrected PNL.
I 36
Annoyance relative to
PNL prediction, dB -5
O t
Tone-to- broad band
0 0 CI 15 A 30
v - noise ratio, dB
I I I I
dura tion- corrected I L A prediction, Tone-to- broadband
noise ratio, dB -5 t 0 0
dB
0 15 A 30
I W -
50 100 150 200 250 300
Fundamental frequency, Hz
Figure 11. Effect of interaction of fundamental frequency with tone-to-broadband noise ratio on annoyance prediction for duration-corrected LA in first experiment.
O t
Annoyance re I a tive to
duration-corrected
P
Fundamental frequency, Hz
Figure 12. Effect of interaction of fundamental frequency with tone-to-broadband noise ratio on annoyance prediction for duration-corrected PNL in first experiment.
37
To ne - to- broad band noise ratio, dB
0 0 0 15 A 30
Annoyance relative to
d u ration- co rrected L A prediction,
0 ’
5 r
5 -
Annoyance relative to
duration-corrected PNL prediction,
0 -
dB -5
-10
noise ratio, dB 0 0 0 15 A 30
-
I I I
-5 r dB
-10 50 100 150 200 250 300
Fundamental frequency, Hz
Figure 13. Effect of interaction of fundamental frequency with tone-to-broadband noise ratio on annoyance prediction in terms of duration-corrected L A for ATP stimuli in second experiment.
Fundamental frequency, Hz
Figure 14. Effect of interaction of fundamental frequency with tone-to-broadband noise ratio on annoyance prediction in terms of duration-corrected PNL for ATP stimuli in second experiment.
38
An n oya n ce relative to
dura tion -corrected LL z prediction,
dB
5
0
-5
-10
A - 4 Tone-to-broadband
noise ratio, dB 0 0 0 15 A 30
50 100 150 200 250 300
Fundamental frequency, Hz Figure 15. Effect of interaction of fundamental frequency with tone-to-broadband noise ratio on annoyance
prediction in terms of duration-corrected LLz for ATP stimuli in second experiment.
39
Subjective noise
level, dB
100
90
80
70
60
t Y Pe ATP
Turboprop
Jet
50 60 70 80 90
Duration-corrected L A , dB
Figure 16. Comparison of annoyance responses using duration-corrected LA.
Subjective noise
level, dB
40
Aircraft type
- - - 0 Turboprop
A Jet
60 70 80 90 100
EPNL, dB
Figure 17. Comparison of annoyance responses using EPNL.
National Aeronautics and
NASA TP-2782 4. Title and Subtitle
Annoyance Caused by Advanced Turboprop Aircraft Flyover Noise-Single-Rotating Propeller Configuration
Report Documentation Page
5. Report Date
March 1988 6. Performing Organization Code
Space Adrnmislralion
1. Report No. 12. Government Accession No. 13. Recipient’s Catalog No.
9. Performing Organization Name and Address
NASA Langley Research Center Hampton, VA 23665-5225
10. Work Unit No.
535-03-11-03 11. C o n t r x t or Grant No.
7. Author(s)
David A. McCurdy
12. Sponsoring Agency Name and Address
National Aeronautics and Space Administration Washington, DC 20546-0001
8. Performing Organization Report No.
L-16301
13. Type of Report and Period Covered
Technical Paper 14. Sponsoring Agency Code
15. Supplementary Notes
16. Abstract Two laboratory experiments were conducted to quantify the annoyance of people to advanced turboprop (propfan) aircraft flyover noise. The objectives were (1) to determine the effects on annoyance of various tonal characteristics, and (2) to compare annoyance to advanced turboprops with annoyance to conventional turboprops and jets. A computer was used to synthesize realistic, time-varying simulations of advanced turboprop aircraft takeoff noise. In the first experiment, the subjects judged the annoyance of 45 advanced turboprop noises in which the tonal content was systematically varied to represent the factorial combinations of 5 fundamental frequencies, 3 frequency envelope shapes, and 3 tone-to-broadband noise ratios. Each noise was presented at 3 sound pressure levels. In the second experiment, 18 advanced turboprop takeoffs, 5 conventional turboprop takeoffs, and 5 conventional jet takeoffs were presented at 3 sound pressure levels to subjects. Analyses indicated that the frequency envelope shape did not significantly affect annoyance. The interaction of fundamental frequency with tone-to-broadband noise ratio did have a large and complex effect on annoyance. The advanced turboprop stimuli were slightly less annoying than the conventional stimuli.
17. Key Words (Suggested by Authors(s)) Advanced turboprop noise Propfan noise Propeller noise Subjective acoustics Psychoacoustics
18. Distribution Statement Unclassified-Unlimit ed
Subiect Category 71 19. Security Classif.(of this report) 20. Security Classif.(of this page) 1 2li;0. of Pages 22. Price
Unclassified Unclassified I A03 NASA FORM 1626 OCT 86 NASA-Langley, 1988
For sale by the National Technical Information Service, Springfield, Virginia 22161-2171