maps and mobilities: on the possibilities and limits of
TRANSCRIPT

University of WollongongResearch Online
Faculty of Social Sciences - Papers Faculty of Social Sciences
2015
Maps and mobilities: On the possibilities and limitsof spatial technologies for humanities researchChristopher R. Brennan-HorleyUniversity of Wollongong, [email protected]
Research Online is the open access institutional repository for the University of Wollongong. For further information contact the UOW Library:[email protected]
Publication DetailsBrennan-Horley, C. (2015). Maps and mobilities: On the possibilities and limits of spatial technologies for humanities research.International Journal of Humanities and Arts Computing, 9 (2), 242-261.

Maps and mobilities: On the possibilities and limits of spatial technologiesfor humanities research
AbstractThis paper explores the limits of spatial representation for understanding historic mobilities in a ruralAustralian setting. For this research, an historical GIS was populated from paper map archives denoting whereand when bitumen roads were sealed in the Bega Valley, NSW. Using existing geospatial methods, atemporally sensitive network analysis was conducted, revealing a picture of regional mobility reshaped bymodernist infrastructure improvements. Yet a straightforward binary pitting sealed roads as 'good' vs unsealedroads as 'bad' was challenged in subsequent qualitative interviews with long-time residents. Instead, a range ofopinions emerged about the role that differing road surfaces played in everyday and historic mobilities. Afuller picture of the motivations and cultural associations of bitumen vs dirt road driving resulted fromdeploying humanities research methods of interviewing and discourse analysis. Such an approach revealedpreferences and motivations that sometimes challenged inferences gained from mapping results alone. Thereare limits then in relying solely on historical cartographic data to produce maps and spatial representationsand existing humanities techniques may hold, in some instances, greater explanatory power.
Keywordspossibilities, limits, technologies, maps, humanities, spatial, research, mobilities
DisciplinesEducation | Social and Behavioral Sciences
Publication DetailsBrennan-Horley, C. (2015). Maps and mobilities: On the possibilities and limits of spatial technologies forhumanities research. International Journal of Humanities and Arts Computing, 9 (2), 242-261.
This journal article is available at Research Online: http://ro.uow.edu.au/sspapers/2260

1
Brennan-Horley, C (2015) ‘Maps and Mobilities: On the possibilities and limits of spatial technologies
for humanities research’ International Journal of Humanities and Arts Computing 9:2, 242-261
Abstract
This paper explores the limits of spatial representation for understanding historic mobilities in a rural
Australian setting. For this research, an historical GIS was populated from paper map archives
denoting where and when bitumen roads were sealed in the Bega Valley, NSW. Using existing
geospatial methods, a temporally sensitive network analysis was conducted, revealing a picture of
regional mobility reshaped by modernist infrastructure improvements. Yet a straight forward binary
pitting sealed roads as ‘good’ vs unsealed roads as ‘bad’ was challenged in subsequent qualitative
interviews with long-time residents. Instead, a range of opinions emerged about the role that
differing road surfaces played in everyday and historic mobilities. A fuller picture of the motivations
and cultural associations of bitumen vs dirt road driving resulted from deploying humanities
research methods of interviewing and discourse analysis. Such an approach revealed preferences
and motivations that sometimes challenged inferences gained from mapping results alone. There
are limits then in relying solely on historical cartographic data to produce maps and spatial
representations and that existing humanities techniques may hold, in some instances, greater
explanatory power.
Keywords
Historical GIS, network analysis, roads, transport, mobilities
Contact email and mailing address:
University of Wollongong
Wollongong NSW
Australia 2522
2
Introduction
Fresh insights into past lives and cultures are possible as spatial information technologies become
ever-more entwined with the humanities. Historical GIS (HGIS) are being constructed from an ever
widening range of data sources including past censuses, cadastral and land use records, spatial text
mining and georeferenced old maps, to name a few. Opening up these resources via locative
attributes to GIS analysis offers tantalising possibilities to develop spatio-temporal data sets,
compare qualitative and quantitative sources and attempt new visualisation strategies that
sometimes challenge existing orthodoxies.1 Yet despite the possibilities, humanist scholars have also
expressed reservations and critical appraisals of this burgeoning interest in spatial technologies,
exposing epistemological issues and frictions when melding quantitative and statistical methods
inherent to spatial analysis with humanities methods attuned to contingency and subjectivity.2
This article explores similar territory, tracing a research journey that began by building an HGIS on
road sealing in one Australian region, with spatial analysis for mapping how rural automobility has
altered in response to infrastructural evolution. However, what began as a relatively straightforward
archival mapping and GIS analysis task, quickly morphed into mixed method research, with
productive tensions emerging between cartographic outputs and more nuanced discourse analysis.
In relaying this journey, with its problems, pitfalls and illuminations, I hope to illustrate how one
predictive analytic tool might be applied retrospectively to historical infrastructure data, while also
highlighting how qualitative methods provided a much needed counterpoint to spatial outputs.
In recent years, sociologists and geographers have expanded on static explanations of social and
physical formations, incorporating movement as an equally significant force shaping identities and
the geographies of everyday life.3 Important to this burgeoning mobilities field is a continuing focus
on automobility, positioning the car within a socio-technical system with profound impacts on a
range of domains, from public space and social relations, to spatial arrangements and images of
modernity.4 Beyond simply studying the motor vehicle, automobilities scholars seek to understand
3
the complex systems of provision that enable fluid interconnection, with roads being a vital
component of this wider system of automobility. As geographer Peter Merriman explains, “Roads
and motorways have a history, they serve as familiar places for those that work in them and for
commuters who repeatedly traverse them, and they enable and facilitate a broad array of mediated
socio-material relations and entanglements”.5 Vital then to any discussion of past and present
geographies of automobility are the roads and tracks that facilitate travel.
This paper adds to this automobilities research agenda, by mapping and analysing the gradual
emergence of sealed roads in a rural setting and discussing its effects with local residents. Relative to
its urban counterparts, the comparatively slow emergence of bitumen in the case study locale
presented an excellent means to investigate how infrastructure modernisation enacted time-space
convergence in this rural locale. Donald Janelle first defined this phenomenon in 1968, describing
“our shrinking world” mathematically, as transport innovations decrease travel time between places,
making them appear closer together in time-space6. By reducing the friction of distance, time-space
convergence has resulted in multi-scalar reshapings of economic and social possibilities.
The Bega Valley as a case study region
This research was conducted as part of a wider project on the sustainability of cultural life in three
Australian country regions.7 In consultation with local Bega Valley residents, mobility was highlighted
as a factor in sustaining social relations8. Road sealing was also discussed as a factor to be taken into
account when making decisions about where and when to travel, with dirt road driving remaining an
everyday experience for many local residents. The varied conditions under which automobility is
made possible or hindered via road surface conditions warranted further inquiry, especially as many
roads in the Bega Valley remain in a majority unsealed state.
The Bega Valley Local Government Area (Bega LGA) is located on the Far South Coast of New South
Wales. European colonists arrived in the 1830s, displacing the Indigenous owners of the Yuin-

4
Monaro Nation9. Economic activity coalesced around Bega town, now the regional business centre
servicing a handful of smaller towns and hamlets dotted amongst a range of rural, forested and
coastal settings. The region maintains its place in the national psyche through its major export –
Bega Cheese – but its past reliance on dairying, forestry, whaling and fishing have waned since the
1970s 10
. Successive waves of amenity-seeking migrants and retirees from the 1980s onwards have
contributed to a gradual diversification into tourism and service industries.
Looking at its mobility history, the Valley’s coastal location guaranteed dominance for shipping of
goods and passengers from the port towns of Eden, Bermagui, Merimbula and Tathra (Bega’s
nearest port). By the 1920s, in line with the explosive growth in everyday car use, automobile-based
road transport began outcompeting passenger ship services, with the seafaring goods trade ceasing
in the 1950s11
. A rail connection never breached the Great Dividing Range to the west, placing
greater demand on road connections within and beyond the region. Australia’s domestic car
manufacturing industry matured after WWII, increasing the availability of vehicles designed
specifically for Australian conditions12
. By this time, hardened road surfaces such as bitumen and
concrete were a feature of inner urban road networks, but its spread into regional areas was
uneven.
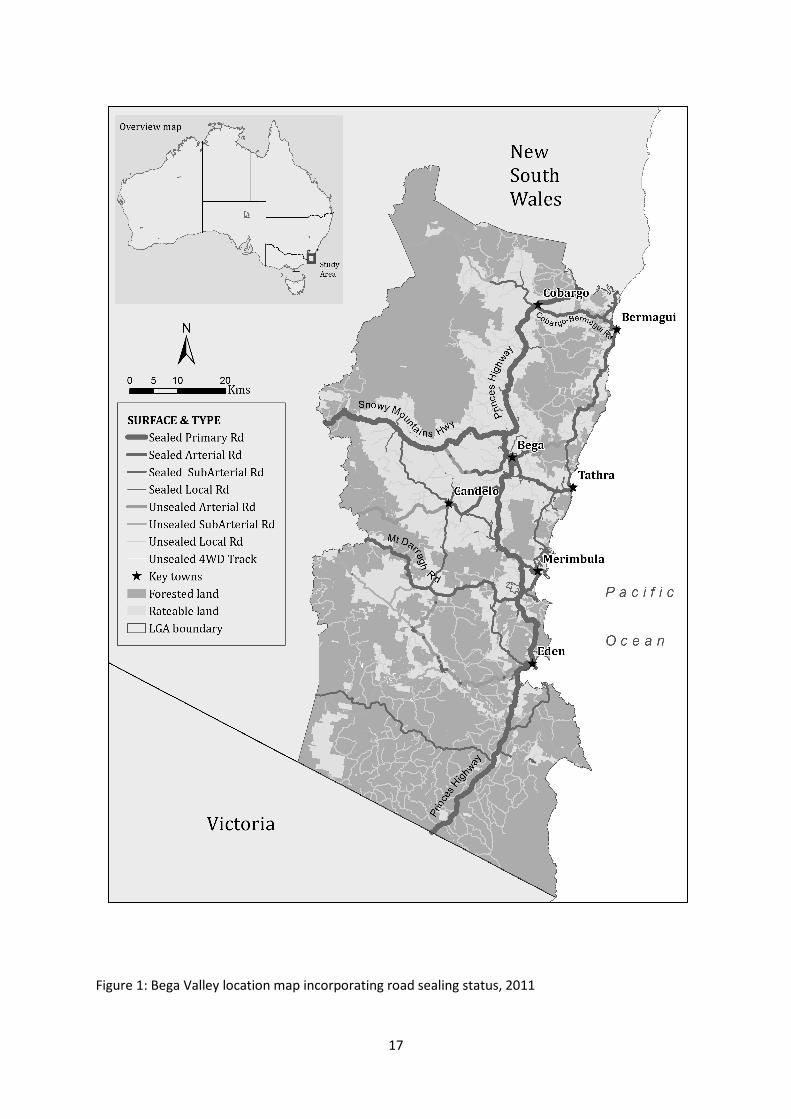
At the time of writing, bitumen is by no means a ubiquitous feature, with 70 percent of the road
network remaining unsealed (refer to Figure 1). Moving up the governance scale from private roads
to State highways signals a greater prevalence of bitumen over dirt with all Primary roads in a sealed
state (Princes and Snowy Mountains Hwy) and the majority of Arterial roads currently sealed.
Despite increasing car travel from the 1950s onwards, the evolution of the Bega Valley’s bituminised
road network has been glacial in comparison to the state capital13
. The Valley’s low population
density translates into an under-resourced local council reliant on state funds for road sealing and
maintenance.
[Figure 1 here]

5
Reconstructing the history of Bega’s sealed roads
This research began with the aim of building an HGIS capable of charting the emergence of Bega’s
sealed roads from their beginnings to the present day distribution shown in Figure 1. It was hoped
that first order geographic questions could be answered about where and when particular segments
appeared. For example, did bitumen radiate out from a central point or did it emerge in a more
piecemeal fashion? Were certain roads favoured over others? Once populated, the HGIS would then
be open to spatio-temporal analysis.
The present day Bega Valley road network is markedly similar in layout and topology to that which
existed in the 1930s. The main routes between towns, ostensibly the main roads, are assigned as
Primary, Arterial and Sub-Arterial roads in the network hierarchy. These began solidifying into their
current patterning by the early 1900s, in line with the advent of motor vehicles. At the State level,
the creation of the Main Roads Board in 1925 saw funds apportioned for road improvements
including sealing and realigning for main roads, but it would be many decades before the Bega Valley
was to see its first fully sealed highway14
. Since the 1930s, energies were directed primarily at
surface and realignment improvements rather than forging new road projects15
. Prior to this time,
roads developed in an ad hoc manner, tracing over existing Indigenous pathways and expanding
bridle paths16
. Early road construction and maintenance was sometimes a private affair, carried out
by locals with scant road engineering experience or directives from government17
. Apocryphal tales
abound of roads too treacherous to attempt passage by night, and exhibiting a range of freeform
repair strategies.18
Specific connections between towns solidified as sealing advanced, with priority given to Primary
roads, the region’s two highways (the Princes Highway, the main north/south connector and the
Snowy Mountains Highway linking Bega westward to the Australian Capital Territory). Locally, new
roads are constructed and sealed in residential subdivisions, in keeping with planning laws deflecting
sealing costs to property developers, and small bypasses and realignments associated with road
6
sealing on public road continue. However this research did not seek to reconstruct the minutiae of
localised alterations and additions since the 1930s – many of which would not greatly impact
cartographic display or analysis at the regional scale – rather, I sought to map the appearance of
bitumen onto pre-existing dirt roads. The subsequent data search was reduced to uncover
incidences of road sealing only from the 1930s onward, in order not to overlap with earlier times
when many roads were under construction.19
A GIS file of the present day road network was provided by Bega Valley Shire Council, containing the
spatial extent of the current sealed network and hierarchical categorisations. Unfortunately it did
not include any sealing dates. Despite lacking in temporal sealing data, this shapefile formed the
basis for the HGIS.
A range of textual and cartographic resources were searched for information about historic road
sealing. Newspaper archives (microfiche and digital repositories), council minute books, local and
state libraries, holdings at regional historical and genealogical societies, and map libraries held by
UOW and the National Library of Australia each provided glimpses to the overall story. Yet a singular
data set detailing exactly where and when bitumen appeared at regular intervals across the entire
network was not forthcoming. This is due to the variety of jurisdictions including private landholders,
government departments and various local councils who have had control of different parts of the
network at different times in its history, each with diverse means for recording sealing status (if at
all). State-controlled roads tend toward availability in cartographic form, whereas Bega Valley Shire
Council kept written records in monthly minute books.20
While technically feasible, sifting through
thousands of pages of council minutes and converting textual records into cartographic form fell
beyond the scope of this project.
[Table 1 here]
7
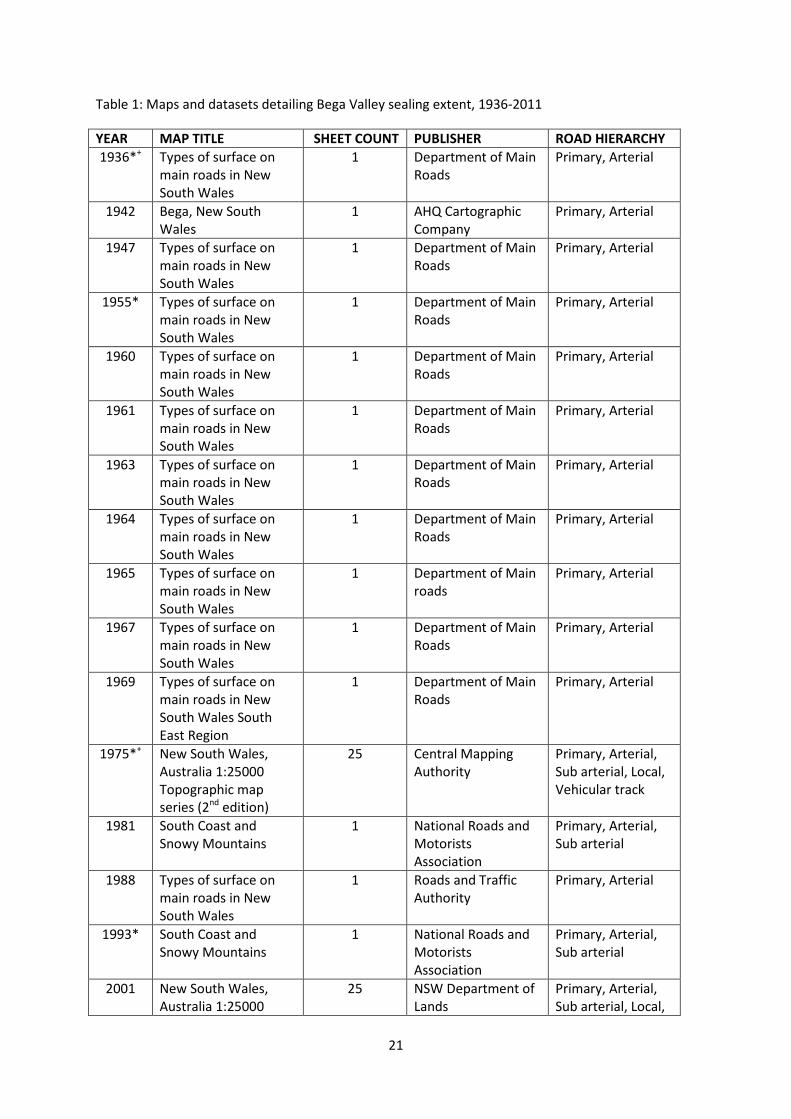
Despite this paucity of data, a partial cartographic record of the advancement of sealing was pieced
together from an archive of State Road Authority maps, NRMA touring maps and topographic maps
produced by the State Lands Department (detailed in Table 1). To add each map to the spatial
database, each map was scanned at 300dpi and importing into ArcGIS as a jpeg image. Each image
was then georeferenced against the road network shapefile. Each road segment was then visually
inspected against each georeferenced historical map and its surface status recorded in the attribute
table as either ‘sealed’ or ‘unsealed’ for that corresponding year.
[Figure 2 here]
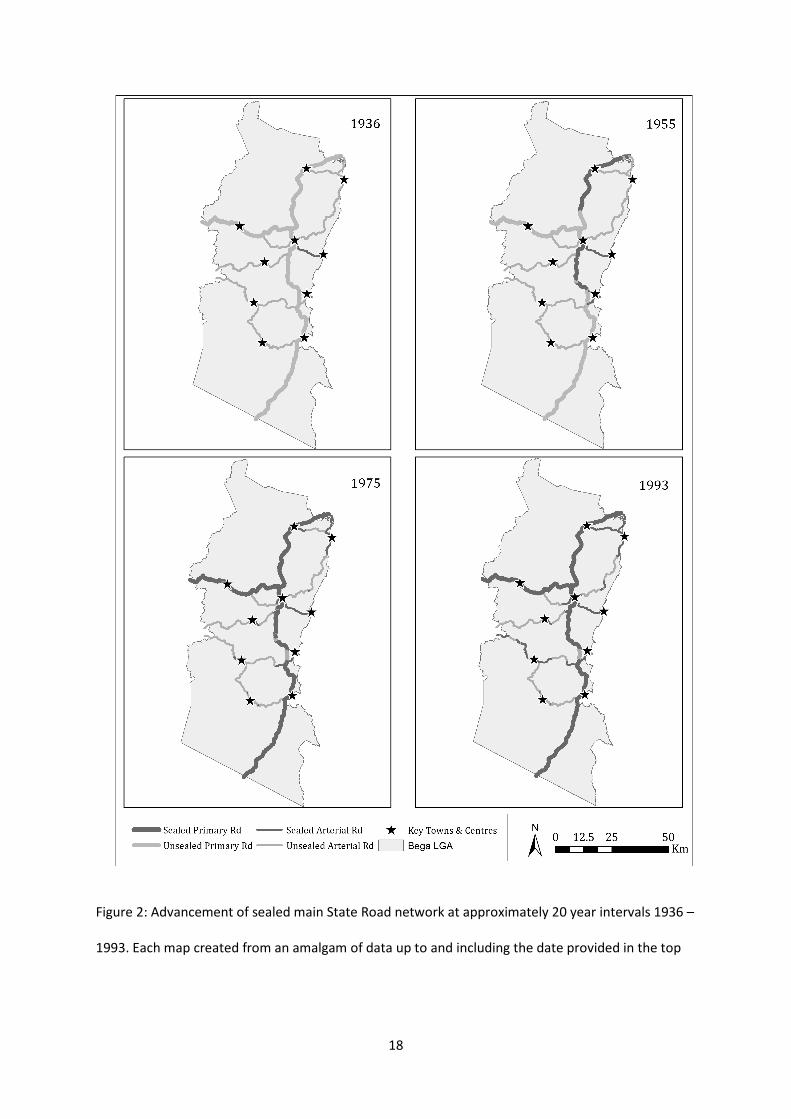
A selection of this time series is given in Figure 2, charting progression of the bitumen network at
approximately 20 year intervals upon primary and arterial roads. The first sealed road in the region,
The Bega-Tathra Rd (ex-Snowy Mountains Highway) appeared in the historic map record in 1936,
linking Bega to its coastal port. Passing through extensive river flats, sealing this road stemmed
repeated damage from regular flooding, providing safer passage for freight to and from the Tathra
Wharf. At this time the majority of freight transportation was still by sea, but faster automobile
transport for public and private travel beyond the region had already spelled the demise of ocean-
going passenger liners21
.
The end of WWII saw an exponential increase in motor vehicle use in Australia for both freight and
private transport22
. Peak motoring group the NRMA (National Road Motorists Association)
maintained pressure on all levels of government to commit funds to road sealing, but isolated
regional areas such as the Bega Valley still lagged behind their urban counterparts. The opening of a
Main Roads Board depot in Bega in 1951 permitted works to be carried out southwards from Bega
rather than only adding to the existing sealed network from the north23
. By the mid-1950s, bitumen
continued its southward extension along the Princes Highway, where it was already sealed back to
Sydney.
8
The greatest amount of sealing took place over the next twenty years, with completion of a sealed
surface to both the Princes and Snowy Mountains Highways. Not only did this herald a qualitative
shift in the driving experience of local residents, but smoother and faster passage to the Far South
Coast region was now possible for self-drive tourists24
. Previously accessible only to locals or intrepid
tourists who could handle the often slow and dusty unsealed road connections, the Bega Valley’s
seaside towns were now on the radar for influxes of seasonal travellers. Tourist towns became ever
more prominent along the Bega Valley’s coastal strip, with motels and caravan parks springing up to
cater for seasonal demand. In a similar fashion to other towns along Australia’s east coast, rural road
sealing projects played a part in economic restructuring, broadening the range of business
opportunities beyond primary production toward a service economy.
The rate of change to sealing of the primary and arterial network dropped off during the 1980s and
90s. Outliers included Mt Darragh Road which received state funding following public pressure for a
sealed surface. This road was becoming a vital yet dangerous alternate east-west route whenever
the Snowy Mountains Highway was blocked by landslips. Another main arterial link completed by
the mid-1990s was the connection between Cobargo and the coastal town of Bermagui. First
proposed for sealing some 20 years prior, a sealed connection to the northern coastal section was
now available for travellers from the south and west, without detouring beyond the Shire – an
important link strengthening Bermagui’s emergence as a seaside tourist town and retiree haven25
.
From mapping road sealing to analysing travel
As the previous section illustrates, historical maps acted as convenient visual aids when recounting
histories of infrastructural change. Mapped over time, cartographic data on Bega’s road network
aided understanding of when sealed connections were made between towns and which routes were
prioritised over others. This approach was not strictly spatial analysis per se, rather it simply collated
and displayed spatial information from archival maps. After transferring the historical maps into a
spatial data format, I wanted to explore the possibilities that spatial analysis might offer in

9
understanding changes to travel patterns as the Bega Valley network selectively modernised.
Analysing shifts in travel accessibility between towns over time seemed a plausible approach for
mapping decreasing travel times as sealing expanded. In other words, could spatial analysis provide
any insight into bitumen’s capacity for time-space convergence?
Given that the roads data was structured as a system of links and nodes, spatial network analysis
appeared the most applicable toolset. Building off theoretical foundations in graph theory and
topology, spatial network analysis has become increasingly common practice in transport geography
and urban planning, for understanding network centrality, modelling travel demand and as an input
into multi-criteria site selection problems. A common subset of network analysis involves delineating
service areas or drive-time catchments for a new facility. The outputs of service area analysis, known
as isochrones, represent zones of equal travel time radiating away from an assigned centre. Service
area analysis appeared relevant for mapping changing one hour drive-time catchments from the
Bega town centre out into the hinterland as the sealed network evolved.
Key to this network analysis approach would be modelling with GIS the difference in driving
experience between sealed and unsealed roads. Sealed roads represent a marked decrease in
surface variability over dirt roads with the latter being notoriously slippery, especially for two-wheel
drive vehicles. Dirt roads degrade daily in response to traffic volumes, vehicle weight and weather
events. Cautious driving techniques are often required to pick a path through ever-changing
potholed and corrugated sections, making the average dirt road driving experience in the Bega
Valley much slower than traversing the same distance on bitumen. Hence, speed increases would
represent a proxy measure in the network model of the change from dirt to bitumen. ArcGIS
Network Analyst Extension permits the addition of speed as a cost attribute to specified sections of
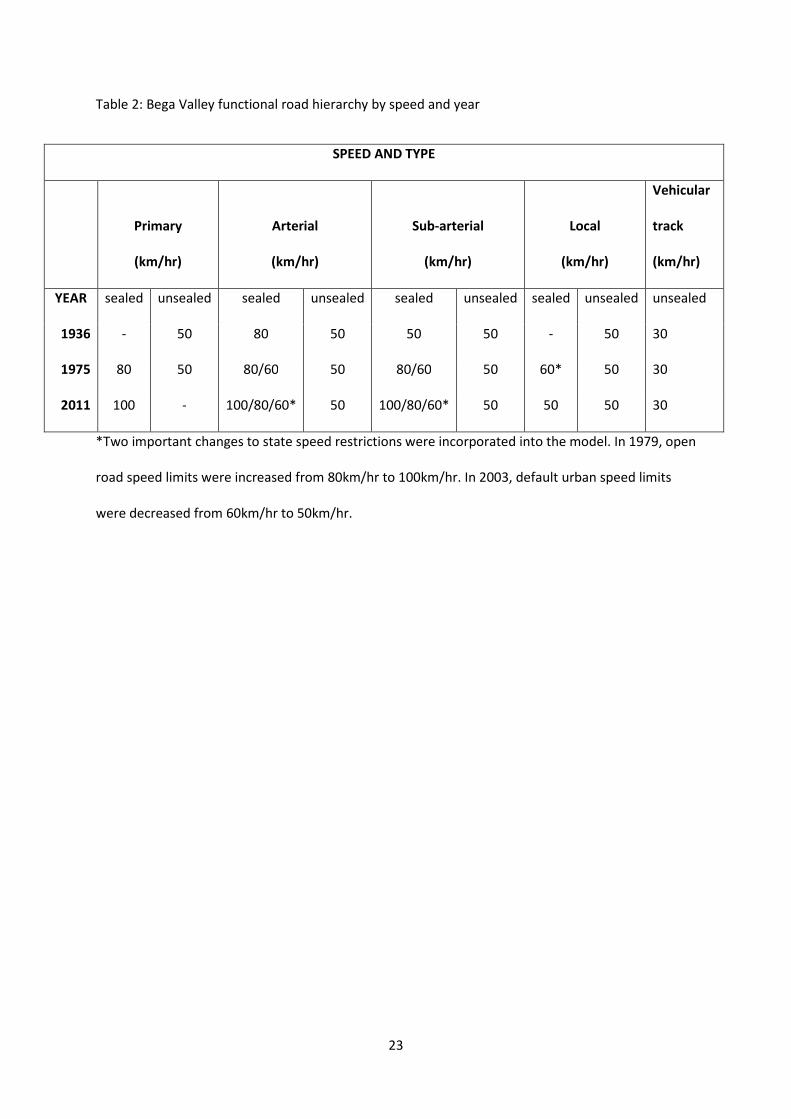
the network. Table 2 lists the various speeds input into this historical network model across the
three time periods, taking into account each road’s position within the hierarchy alongside speed
regulations of the time.

10
Network analysis can simulate travel scenarios under a range of conditions but in order to build a
more realistic model, data about the entire network’s sealed status – from primary roads to farm
tracks – at a given point in time was required. As discussed previously, a detailed year-to-year time
series was out of reach, but three time periods were identified that provided an accurate depiction
of the entire network’s sealed status: An early-sealed scenario (1936) a 1975 edition of the 1:25000
topographic map series covering the region and Council’s road shapefile (2011).26
[Table 2 here]
Service area analysis results
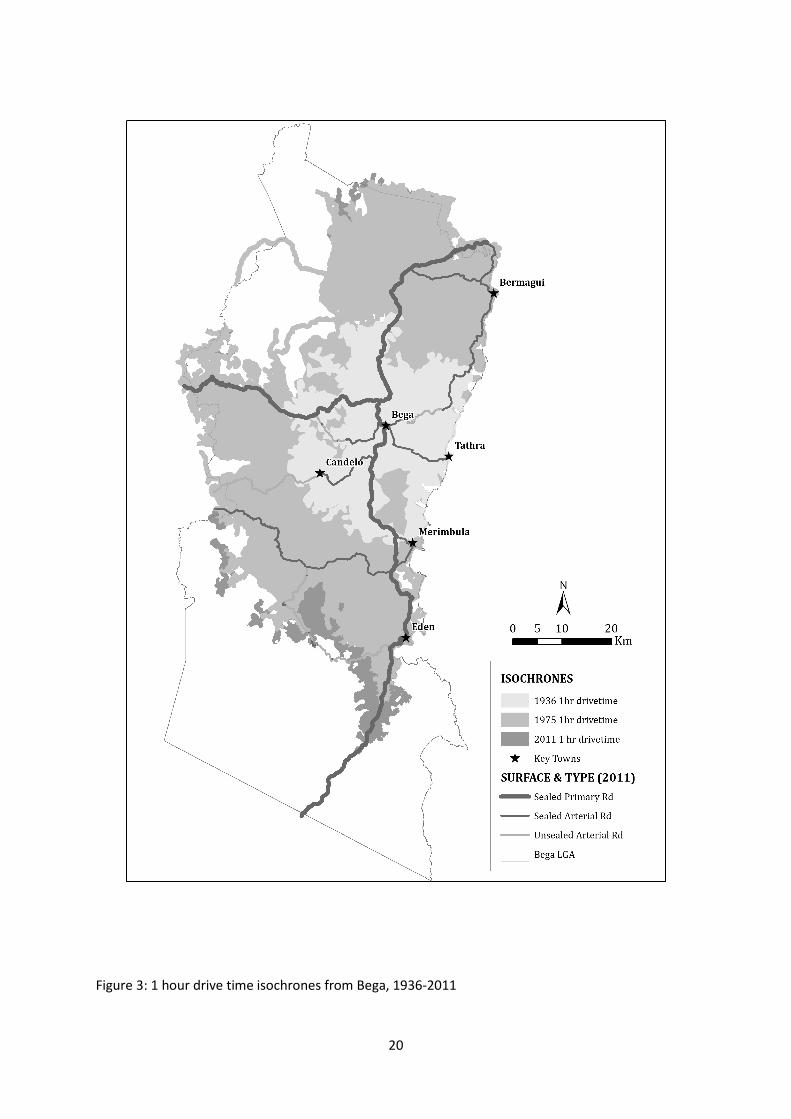
Figure 3 maps the result of the service area analysis, displaying isochrones for drive times in one
hour increments for the three time periods of the 1930s, 1970s and present day. Most prominently
the service area analysis illustrates a vast increase in travel potential by the time the 1970s sealing
extent was reached. Efforts made over the previous half century in sealing primary and arterial
routes had the effect of decreasing travel times to and from Bega for the majority of the Valley’s
population. By the 1970s the stage had been set for transport times now experienced with only a
minor increase in travel potential between the 1970s and the present day. This is due in part to a
drop in speed restrictions from 60 to 50 km/hr within towns which is not greatly counteracted by the
raising of speed limits by 20km/hr on open roads. Even though more sealing has been completed
within the urban areas of towns, regulation has decreased propensity for faster travel in these
zones.
[Figure 3 here]
At face value the network analysis appears to support the case that at the regional scale, bitumen
has enacted time-space convergence for motorists of the Bega Valley with a greater number of
towns drawn into a plausible daily commuting catchment of the regional business centre. From the
1930s onwards, as bitumen became more prominent, time-space convergence has reshaped

11
everyday life and relations between towns. Anecdotes and informal discussions with local residents
who commute daily into Bega from the Shire’s northern outskirts were in line with the map’s
isochrones. Accessing Bega’s employment opportunities and services on a daily basis is a regular
occurrence for these residents. Additionally, shopping habits have adapted in line with the spatial
reorganisation of food retailing.27
Increasing levels of accessibility mean that most foodstuffs are no
longer sourced locally and delivered to residents. Rather, daily commuting patterns into larger
centres to collect food are the norm, with grocery retailers reliant less on local produce but by wider
goods networks emanating from larger distribution centres beyond the Valley. These large
supermarket chains are themselves predicated on efficient bitumen road links to and from the
region.
Time-space conversion through bitumen is a two-way relationship, with bitumen not only affording a
gravitational pull to the centre, but underpinning stable populations in hamlets and towns at a
distance. Originally settled as district centres servicing nearby farming communities, farm
mechanisation and declining employment in forestry and fishing fuelled rural-urban migration from
the Bega Valley since the 1950s28
. Successive waves of amenity-led and retiree migration from the
late 1970s onwards has underpinned the viability of some local towns. But lifestyles in these outer
districts are now predicated on automobile travel over greater distances to access centralised
employment opportunities and services29
. Ironically, many amenity migrants from the cities are
conditioned to long commutes in terms of travel time, but are happy to travel for similar lengths of
time with little to no traffic issues.
A fork in the road: confronting cartographic limitations
Upon completing the service area analysis, I was faced with a choice: continue down a spatial
analysis route or compare the mapping outputs with alternate sources that also speak to impacts of
road sealing – albeit data not in a form readily capable of integration into the spatial database.
12
Prior to deciding, further spatial analysis possibilities were reviewed, including tweaking existing
network parameters (turn impedances, adding bridges) and modelling differential speed limits for
two wheel vs four wheel drive. Given that the existing analysis was conducted in a flat plane I looked
at incorporating terrain modelling, particularly as hilly areas necessitate more careful dirt road
driving tactics. Other more advanced map-based strategies were also considered, including time
space maps which swap linear topographic and time units, producing a time-based cartogram. Three
dimensional accessibility surfaces presented yet another avenue, by displaying more accessible
zones as higher 3D peaks.
Despite investigating these additional possibilities, the analysis given in Figure 3 had illustrated that
increasing levels of bitumen might enact time-space convergence, leaving me hesitant as to what
could be gained in refining the spatial analysis. Furthermore, there is an inherent tension working
with HGIS, whereby an overt focus on cartographic strategies can direct attention away from deeper
contextualisation while masking possible open-ended contingency.30
No matter how finely tuned or
snappily displayed, attempting to recreate ‘real world’ driving scenarios with spatial analysis
techniques would only provide partial insight. As cultural geographer Tim Creswell argues, “…there
are pervading constellations of mobility, particular patterns of movement, representations of
movement, and ways of practising movement that make sense together.”31
Despite moving away
from a strictly spatial approach, understanding some of the more subjective, cultural dimensions of
driving would provide a more rounded view of the impact of a changing road network.
To unveil driving practices I turned to qualitative, semi-structured interviews with a select group of
local residents, alongside unsolicited and anecdotal discussions with acquaintances living in the Bega
Valley. The strengths of qualitative investigation, of thick description, depth and context, permitted
a range of quotidian interactions between actual drivers and variable road conditions to emerge.
Attitudes toward dirt and bitumen roads were revealed, including routing choices and driving
behaviours made in response to differing surfaces and how driving practices become shaped by a

13
lifetime of experiences behind the wheel. From wide-ranging discussions, themes of safety and
routing emerged as most relevant to considerations of temporal change to the bitumen network.
Sealed roads are regularly represented as a safer alternative to dirt roads32
. Smooth surfaces,
cambered corners, dividing lines and reflectors all enhance driver safety33
. Unsurprisingly, safety was
a recurrent theme in discussions about driving upon different surfaces. Many of those interviewed
agreed that bitumen was a safer place to travel than dirt roads. Some were not overly fond of dirt
road driving and spoke of incessant dust, the uncomfortable driving experience and the extra effort
required in steering a course over an ever-changing surface. Fears were expressed around facing
oncoming traffic on often narrow and slippery corners with little or no road shoulder, of sliding or
getting bogged during wet weather.
Yet how different surfaces were perceived did not always fit neatly into a binary of sealed roads as
safe vs unsealed as unsafe. Upon reflection, some respondents positioned dirt roads not as fearful
spaces but enjoyable places to drive, even if it meant a slower journey. Dirt roads were positioned
by some as natural, an extension of untamed forested landscapes that held mystery and wonder and
could be a space for recreational driving. Dirt roads were seen by others as an expected element of
the transport landscape, and part of everyday life in a rural locale. A hardship not simply to be
endured, but a point of difference from other drivers restricting themselves to bitumen.
Of relevance to this study, was how the road network was negotiated ‘safely’ in diverse ways at
different times. Stories were relayed of drivers sneaking past possible police detection by detouring
along dirt back roads after a night out. After dusk, one participant spoke of dirt roads as a place to
escape from other drivers travelling at excessive speeds on the bitumen. The dirt road was
conversely viewed as a place of relative safety, where one could travel with less fear of collision.
Route choices were influenced by notions of safety, but these may not fall out in a simplistic manner
but were inflected by individual driving experiences and preferences.
14
Unlike the mapping algorithm, which modelled the driver as a rational decision maker looking to
minimise travel time between two points, interviews revealed that drivers consider multiple factors
when deciding upon a route. These decisions can be tempered by a range of emotional and bodily
reactions to past driving scenarios, either positive or negative. Apart from safety, other factors
influencing routing decisions included considerations of time constraints, vehicle type, vehicle wear
and tear, dust potential, and recent road conditions. This meant that sometimes dirt roads were
avoided in favour of a longer sealed road route. Time became a less important factor than a
smoother, faster (in terms of travelling speed) and uneventful bitumen road journey. These drivers
placed personal comfort ahead of shorter travel time.
Conclusion
This paper sought to highlight both the possibilities and limits that service area analysis might
provide historical mobilities research. GIS collation and visualisation was applied to a corpus of
historical infrastructure data, illustrating the emergence of sealed roads over time. Despite facing an
incomplete temporal data set, hypothetical drive-time isochrones were generated using facility area
analysis, with travel speed as a proxy for changing surface conditions.
Mapping broad changes in travel times between towns was made possible via this spatial approach,
and may prove useful for mobilities researchers looking to spatially represent evolving
transportation networks and resultant time-space convergence, especially those modes that run to
timetables such as trains or airport networks. This approach may also be particularly applicable for
HGIS projects operating at large scales, for example, charting the emergence over time of rail or
highway networks at the state and national level. Further applications could include melding service
area isochrones with cadastral records in GIS to reveal possible path-dependent evolution of land
subdivision and evolving mobility networks.

15
Yet wherever historic transport and mobility studies intersect with private vehicle usage at the
regional and local scale, the role that personal choice plays in shaping spatial patterns of
automobility cannot be ignored. For this research, qualitative methods were turned to, principally
because successive rounds of GIS mapping and analysis remained silent about the motivations and
experiences of actual car drivers.
Subsequent interviews and discussions revealed that driving upon different surfaces elicited a range
of reactions, with these in turn shaping individual choices about when and where to travel.
Whenever personal choice is involved, time-space convergence is perhaps not as straightforward as
quantitative mapping algorithms might suggest. Furthermore, perceptions of travel time were
inflected by surface conditions but in ways that sometimes challenged taken for granted
assumptions representing sealed roads as the safer option.
Rather than assuming that all people drive the same way, conforming only to legislated speed
restrictions, qualitative inquiry uncovered a broader range of driving experiences and motivations
beyond the purview of historic maps and spatial analysis. Personal routing choices matter and exert
spatio-temporal impacts on mobility. These choices are modulated by drivers balancing out any
number of competing and often subjective factors, many borne from past driving experiences. If one
was to attempt to map subjective travel potentials cartographically, variegated isochrones
representing travel patterns of different respondents would undoubtedly result. Future research
could look to mental mapping and Qualitative GIS techniques to investigate this further.
Qualitative insights have implications for how we should interpret mapping outputs s from this HGIS
analysis of automobile travel potentials. Foremost, they should be viewed as exactly that – a
mapping of an upper limit of possibility based only on time, rather than an amalgam of individual
driving experiences. But this should not be grounds for dismissing the network analysis. Indeed for
some travel upon the network – especially that between towns where bitumen was the most direct
and fastest possible route – the spatial analysis holds true. The qualitative findings provide a window
16
into the range of driving practices carried out by drivers facing choices about where and when to
travel upon differing road surfaces. By extension, time-space convergence was experienced
subjectively as the Bega Valley bitumen network developed.
Echoing the words of Ian Gregory, GIS and spatial analyses are at best “broad brush” awaiting
complementary insights from existing humanities methods.34
As was the case in this research, some
data sources were difficult to encapsulate within the strictures of a geospatial database. Yet these
are necessary in fleshing out details of driving practices. If GIS is to only offer “a radically incomplete
account of everyday life in public space”35
then humanists must remain open to existing methods
that may present complementary or divergent results. In the wider digital humanities, spatial and
qualitative approaches will both remain necessary, albeit topic and data dependant. The challenge
lies in working productively with the confines and prospects of each.
17
Figure 1: Bega Valley location map incorporating road sealing status, 2011
18
Figure 2: Advancement of sealed main State Road network at approximately 20 year intervals 1936 –
1993. Each map created from an amalgam of data up to and including the date provided in the top

19
corner of each frame, but stylised to show only State-owned roads. Refer to Table 1 for
corresponding years and to Figure 1 for extent of most recent sealing data (2011).
20
Figure 3: 1 hour drive time isochrones from Bega, 1936-2011
21
Table 1: Maps and datasets detailing Bega Valley sealing extent, 1936-2011
YEAR MAP TITLE SHEET COUNT PUBLISHER ROAD HIERARCHY
1936*+
Types of surface on
main roads in New
South Wales
1 Department of Main
Roads
Primary, Arterial
1942 Bega, New South
Wales
1 AHQ Cartographic
Company
Primary, Arterial
1947 Types of surface on
main roads in New
South Wales
1 Department of Main
Roads
Primary, Arterial
1955* Types of surface on
main roads in New
South Wales
1 Department of Main
Roads
Primary, Arterial
1960 Types of surface on
main roads in New
South Wales
1 Department of Main
Roads
Primary, Arterial
1961 Types of surface on
main roads in New
South Wales
1 Department of Main
Roads
Primary, Arterial
1963 Types of surface on
main roads in New
South Wales
1 Department of Main
Roads
Primary, Arterial
1964 Types of surface on
main roads in New
South Wales
1 Department of Main
Roads
Primary, Arterial
1965 Types of surface on
main roads in New
South Wales
1 Department of Main
roads
Primary, Arterial
1967 Types of surface on
main roads in New
South Wales
1 Department of Main
Roads
Primary, Arterial
1969 Types of surface on
main roads in New
South Wales South
East Region
1 Department of Main
Roads
Primary, Arterial
1975*+
New South Wales,
Australia 1:25000
Topographic map
series (2nd
edition)
25 Central Mapping
Authority
Primary, Arterial,
Sub arterial, Local,
Vehicular track
1981 South Coast and
Snowy Mountains
1 National Roads and
Motorists
Association
Primary, Arterial,
Sub arterial
1988 Types of surface on
main roads in New
South Wales
1 Roads and Traffic
Authority
Primary, Arterial
1993* South Coast and
Snowy Mountains
1 National Roads and
Motorists
Association
Primary, Arterial,
Sub arterial
2001 New South Wales,
Australia 1:25000
25 NSW Department of
Lands
Primary, Arterial,
Sub arterial, Local,

22
Topographic map
series (2nd
edition)
Vehicular track
2011*+
Untitled N/A Bega Valley Council
spatial database,
road network extract
Primary, Arterial,
Sub arterial, Local,
Vehicular track
* Used in time series mapping detailed in Figure 2
+ Input layer for service area analysis shown in Figure 3
23
Table 2: Bega Valley functional road hierarchy by speed and year
SPEED AND TYPE
Primary
(km/hr)
Arterial
(km/hr)
Sub-arterial
(km/hr)
Local
(km/hr)
Vehicular
track
(km/hr)
YEAR sealed unsealed sealed unsealed sealed unsealed sealed unsealed unsealed
1936 - 50 80 50 50 50 - 50 30
1975 80 50 80/60 50 80/60 50 60* 50 30
2011 100 - 100/80/60* 50 100/80/60* 50 50 50 30
*Two important changes to state speed restrictions were incorporated into the model. In 1979, open
road speed limits were increased from 80km/hr to 100km/hr. In 2003, default urban speed limits
were decreased from 60km/hr to 50km/hr.
24
END NOTES
1 I. Gregory, and R. Healey, ‘Historical GIS: Structuring, Mapping and Analysing Geographies of the
Past’, Progress in Human Geography 31 (2007), 638–53.
2 A range of engagements with the spatial humanities field are evident in recent edited collections
including: A. von Lunen and C. Travis, eds, History and GIS: Epistemologies, Considerations and
Reflections, (United States 2012) and D. Bodenhamer, J. Corrigan, and T. Harris, eds, The Spatial
Humanities: GIS and the Future of Humanities Scholarship, (Indiana 2010). Journal articles critically
appraising GIS within the context of historical research projects include: L. Espinha da Silveira,
‘Geographic Information Systems and Historical Research: An Appraisal’, International Journal of
Humanities and Arts Computing 8, (2014), 28–45 and K. Bowles, ‘Limit of Maps? Locality and
Cinemagoing in Australia’, Media International Australia 131 (2009), 83–94.
3 T. Cresswell, ‘Mobilities I: Catching up’, Progress in Human Geography 35 (2010), 550–58.
4 J. Urry, ‘The “System” of Automobility’, Theory, Culture & Society 21 (2004), 25–39.
5 P. Merriman, ‘Automobility and the Geographies of the Car’, Geography Compass 3 (2009), 586–99.
Quoted here at 589.
6 D. Janelle , ‘Central place development in a timespace framework, The Professional Geographer 20 (1958),
Quoted here at 351.
7 Australian Research Council Discovery Grant, ‘Cultural sustainability in Australian country towns:
amenity, mobility, and everyday life’. 2009-2011 (DP0984223).
8 46 Local community members (age range 30 – 75) attended a meeting to canvas important cultural research
topics. Further research activities resulted, as detailed in G. Waitt and C. Gibson, ‘The Spiral Gallery: Non-
market creativity and belonging in an Australian country town’, Journal of Rural Studies 30 (2013), 75 -85.
9 N. Evans, Tales of the Far South Coast (Bega, 1982).
10 Waitt,’Spiral Gallery’ Journal of Rural Studies.
11 N. Evans, Roads to Water: the history and story of Tathra, Kalaru, Wallagoot (Kalaru, 1987).
12 R. Lee, Linking a nation Australia's transport and communications 1788-1970. (Canberra, 2003).
25
13
An example of the disparities in road development between rural and urban regions of NSW is evidenced in
the opening of the Cahill expressway – Sydney’s first multi-lane freeway – in 1962 a full two years prior to the
Bega Valley’s Princes highway becoming fully sealed. Detailed in Lee, Linking a nation.
14 Prior to the advent of the Main Roads Board in 1925, all the Bega Valley’s public roads fell under municipal
control. Post 1925, main and arterial roads passed over to control of the Main Roads Board. Kass, T, Roads and
Traffic Authority Heritage and Conservation Register: Thematic History (Sydney 2006).
15 The archival map search did not return cartographic data on the full study area road hierarchy for the 1930s.
Upon reviewing council minutes and yearly journals issued by the Department of Main roads between 1920
and 1975, all discussions of main and arterial roads in the study region were in reference to maintenance and
sealing as opposed to initial construction.
16 J. Blay Report of the Bega Valley Region Old Path Ways And Trails Mapping Project (Bega, 2005). Also noted
in Kass, RTA thematic history.
17 Bega District News, W.H. Balmain looks back: 50 years of Balmain bros. Bega Limited (Bega, 1959).
18 “Alexander Weatherhead on a trip from Wyndham to Bega in the late forties contributes another
picture of the times, “I saw a man mending some of the worst places by putting bushes in the holes
and then covering them with earth, so that it looked better till a heavy load came along. One always
expects to see things better as they come towards a town, in that I was not disappointed, at least I
saw that they had a different way of filling up the bog holes. There was then a nasty hole on the
south side where Frog’s Hollow bridge is now, when I got there the hole was filled up, not with
bushes, but with a dead bullock, a worker, I suppose, it appeared to fill the hole nicely.”” ‘Historical
Roads of New South Wales “Princes Hwy”’, Journal of Department of Main Roads, New South Wales
16 (1951). Quoted here at 82.
19 This decision to restrict searching was influenced by the fact that the first sealing did not appear in
the Bega Valley until the 1930s.
20 Bega Valley Shire Council formed in 1981 via amalgamation of three prior councils: Mumbulla
Shire Council (1907), Bega Municipal Council (1885) and Imlay Shire Council (1907). Of interest to
26
this research, the Australian Local Government System has its roots in establishing a tax base to fund
road construction and maintenance, particularly in regional and rural locales.
21 Evans, Roads to Water.
22 Lee, Linking a nation.
23 Department of Main Roads Journal of Department of Main Roads, New South Wales 16.
24 Ferguson, B. A short history of Merimbula (Merimbula 1971).
25 Bega Valley Shire Council, Your Place – Our Place: Character profiles for towns and villages of the Bega Valley
Shire (Bega, 2002).
26 The 1973 1:25000 data series consisted of multiple map sheets with a high degree of horizontal
accuracy (12.5 metres) with the sealed or unsealed state of the entire road hierarchy provided. Each
paper map was georeferenced and sealed status assigned to corresponding sealed sections. Each
sealed segment was assigned its relevant maximum speed as listed in Table 2.
27 D. Janelle, ‘Spatial reorganisation: a model and concept’, Annals of the Association of American
Geographers 59 (1969), 348–64
28 Hanson, S, “Electrical Wonders of the Present Age: Cinema-going on the Far South Coast of NSW and rural
perceptions of modernity (Unpublished Honours Thesis, UOW Arts Faculty, 2007).
29 Bega Valley Shire Council, Your Place – Our Place.
30 S. Griffiths, ‘GIS and Research Into Historical “Spaces of Practice”: Overcoming the Epistemological
Barriers’, in A. von Lunen and C. Travis, eds, History and GIS: Epistemologies, Considerations and
Reflections, (United States 2012), 153-171.
31 T. Cresswell, ‘Towards a Politics of Mobility’, Environment and Planning D: Society and Space 28
(2010), 17–31. Cited here at 19.
32 That sealed roads are safer than dirt is a taken-for-granted assumption permeating road
discourses internationally. In the Australian context extensive literature produced by Australian
State and National Road Departments, and multiple publicity campaigns waged over the last century
by the NRMA all paint a similar picture.

27
33
S. Redshaw, In the Company of Cars: Driving as a Social and Cultural Practice (London, 2008).
34 I. Gregory, ‘Exploiting Time and Space: A Challenge for GIS in the Digital Humanities’, in D.
Bodenhamer, J. Corrigan, and T. Harris, eds, The Spatial Humanities: GIS and the Future of
Humanities Scholarship, (Indiana 2010), 58-76. Cited here at 70.
35 Bowles, ‘Limit of Maps? Locality and Cinemagoing in Australia’, 90.