maps: a quantitative radiomics approach for prostate...
TRANSCRIPT

0018-9294 (c) 2015 IEEE. Personal use is permitted, but republication/redistribution requires IEEE permission. Seehttp://www.ieee.org/publications_standards/publications/rights/index.html for more information.
This article has been accepted for publication in a future issue of this journal, but has not been fully edited. Content may change prior to final publication. Citation information: DOI10.1109/TBME.2015.2485779, IEEE Transactions on Biomedical Engineering
IEEE TRANSACTIONS ON BIOMEDICAL ENGINEERING 1
MAPS: A Quantitative Radiomics Approach for Prostate CancerDetection
Andrew Cameron, Farzad Khalvati∗ IEEE Member, Masoom A. Haider, Alexander Wong IEEE Member
Abstract—This paper presents a quantitative radiomics featuremodel for performing prostate cancer detection using Multi-Parametric MRI (mpMRI). It incorporates a novel tumourcandidate identification algorithm to efficiently and thoroughlyidentify regions of concern and constructs a comprehensiveradiomics feature model to detect tumourous regions. In contrastto conventional automated classification schemes, this radiomics-based feature model aims to ground its decisions in a way thatcan be interpreted and understood by the diagnostician. Thisis done by grouping features into high-level feature categorieswhich are already used by radiologists to diagnose prostatecancer: Morphology, Asymmetry, Physiology, and Size (MAPS),using biomarkers inspired by the PI-RADS guidelines for per-forming structured reporting on prostate MRI. Clinical mpMRIdata were collected from thirteen men with histology-confirmedprostate cancer and labeled by an experienced radiologist. Theseannotated data were used to train classifiers using the proposedradiomics-driven feature model in order to evaluate the classifica-tion performance. The preliminary experimental results indicatedthat the proposed model outperformed each of its constituentfeature groups as well as a comparable conventional mpMRIfeature model. A further validation of the proposed algorithmwill be conducted using a larger dataset as future work.
Index Terms—Radiomics, Feature Models, Prostate MRI,Multi-Parametric MRI, Prostate Cancer Detection, Computer-Aided Detection
I. INTRODUCTION
Prostate cancer is the most-diagnosed form of cancer inCanadian men, with roughly 23,500 new cases and 4,000deaths in 2014 [1]. Although it is the third leading causeof cancer death in men, prostate cancer has good prognosisif detected early [2]. Thus, effective and reliable screeningmethods are crucial for high survivability rate.
Conventional methods of screening for prostate cancerinclude the prostate-specific antigen (PSA) test, trans-rectalultrasound (TRUS), and magnetic resonance imaging (MRI).Some of these methods, such as the PSA test, have been crit-icized for oversensitivity, causing expensive and often painfulfollow-up procedures [3], [4], [5]. Imaging-based methodsproduce image series which require expert review from an ex-perienced diagnostician, who looks for subtle features to makea diagnosis. When multiple types of imaging are performed,they must be registered to a common coordinate system. Evenwhen registered, it can be challenging to search for features
A. Cameron and A. Wong are with the Department of Systems DesignEngineering, University of Waterloo, Waterloo, Ontario, Canada, N2L [email protected]
F. Khalvati∗ and M. A. Haider are with the Department of Medical Imaging,University of Toronto, and Sunnybrook Research Institute, Toronto, Ontario,Canada, M4N 3M5. [email protected]
Copyright (c) 2015 IEEE. Personal use of this material is permitted.However, permission to use this material for any other purposes must beobtained from the IEEE by sending a request to [email protected].
across multiple imaging modalities at once leading to intra-and inter-observer variability in diagnosis.
The European Society of Urogenital Radiology recentlyintroduced a set of guidelines for interpreting several MRIimage series together known as PI-RADS (Prostate Imaging,Reporting and Diagnosis System). This scoring system aimsto improve consistency between diagnosticians by providinga common set of criteria to consider when diagnosing a case.However, as the features laid out in PI-RADS are subjective,it is not immune to inter-observer variability [6].
Research on automatic methods for detecting and localizingprostate cancer consists mostly of ensemble classifiers trainedon huge numbers of features. Furthermore, the feature calcu-lations are usually performed on all local windows of pixels(e.g., 5 × 5) that cover the prostate gland. The classificationdecisions made by such automatic systems can be difficult fora radiologist to reason about, consisting of a binary outputor some kind of probability or confidence score. Withouta mechanism to reason about why an automatic classifiercomputes the result it does, clinicians tend to distrust them.
The aim of this work is twofold. First to incorporate acomprehensive quantitative feature sequences or radiomics asa high dimensional mineable feature space that can be usedas both detection and prognostic tools for prostate cancer [7].To achieve this goal, instead of applying the feature extractionfunction on all local windows without discrimination, we firstidentify the candidate regions which might contain cancer-ous pixels from which the features are extracted. Second,we introduce a framework to help bridge the gap betweenthe quantitative characterization and clinical interpretationof prostate cancer diagnosis. By grouping classifier featurestogether, we aim to create a diagnostic support system whichclinicians can leverage to augment their understanding ratherthan supplant it. Beyond stating that a region is suspected tobe cancerous, a system built on this framework can explainthat the region has an unusual morphology, for instance. Withintuitive features, classification decisions can be more easilyjustified and explained to medical practitioners, while simul-taneously providing more consistently quantifiable measures.In this work, we introduce a novel strategy for a radiomicsfeature model for prostate cancer analysis that combines: i) atumour candidate identification scheme based on multipara-metric MRI (mpMRI) and morphology, and ii) a comprehen-sive feature model comprising groups of features evaluatingtumour candidate morphology, asymmetry, physiology, andsize. By presenting results as a collection of factors that theclinicians are already used to for evaluating prostate cancer,the proposed system should foster user acceptance, and theuse of objective, quantitative features can help to reduce inter-and intra-observer variability.
0018-9294 (c) 2015 IEEE. Personal use is permitted, but republication/redistribution requires IEEE permission. Seehttp://www.ieee.org/publications_standards/publications/rights/index.html for more information.
This article has been accepted for publication in a future issue of this journal, but has not been fully edited. Content may change prior to final publication. Citation information: DOI10.1109/TBME.2015.2485779, IEEE Transactions on Biomedical Engineering
2 IEEE TRANSACTIONS ON BIOMEDICAL ENGINEERING
II. RELATED WORK
In this section, a background review on prostate cancerclinical workflow and computer-aided detection tools is given.
A. Clinical Workflow
The prostate-specific antigen (PSA) test measures the con-centration of specific markers in the patient’s blood of whichhigh levels indicate high risk for prostate cancer. AlthoughPSA is used as a biomarker for prostate cancer, its use hasbeen criticized for having an unacceptably high occurrence offalse positives, causing healthy patients to undergo expensiveand sometimes invasive tests to determine whether the PSAtest result was simply a false positive [8], [9]. The PSA test istherefore recommended particularly for patients with a predis-position, such as those with a family history of prostate cancer.Following a positive PSA test, a series of images might beacquired followed by systematic transrectal ultrasound (TRUS)guided biopsy where multiple samples are collected. Althoughcore biopsies are very accurate, they are intrinsically invasive,causing significant discomfort to the patient and exposinghim to possibly unnecessary surgical risk. Furthermore, sometumours are isoechoic and respond to ultrasound similarly tothe surrounding tissues, making TRUS-guided biopsies evenmore difficult as the surgeon must attempt to collect tissuesamples from invisible tumours. Depending on the results,further biopsies may be indicated, bearing further surgicalrisk. Following any biopsies, the patient may be treated withfocal therapy, chemotherapy or even a radical prostatectomy,depending on the severity of his cancer.
The European Society of Urogenital Radiology recentlyintroduced the Prostate Imaging – Reporting and Data System(PI-RADS) [10], modeled after the BI-RADS system for breastcancer reporting. PI-RADS breaks the decision process intoseveral component scores, providing guidelines on the scoringof the various recommended modalities.
B. Multi-Parametric MR Imaging
mpMRI has shown considerable promise for diagnosis,especially the combination of T2-weighted MRI (T2w) anddiffusion-weighted MRI (DWI). T2w gives the clinicians theability to see relatively high-resolution imagery of the prostateand surrounding tissue, while allowing detection of subtlestructural features. Recent research has focused on DWIand the DWI-derived Apparent Diffusion Coefficient (ADC),which quantifies the diffusion of water molecules throughtissue and has been shown to delineate between healthy andcancerous tissue [11], [12].
Other MRI modalities include dynamic contrast-enhancedMRI (DCE-MRI), in which a contrast agent is introduced andthe subject is repeatedly imaged while the contrast agent isabsorbed into the tissue. The contrast agent uptake behaviourof any given voxel of tissue is modeled and the time-series im-agery is used to estimate tissue parameters such as onset time,time to peak, and washout. Magnetic resonance spectroscopy(MRS) is a rarely-used MRI modality, known as magneticresonance spectroscopic imaging or in vivo nuclear magnetic
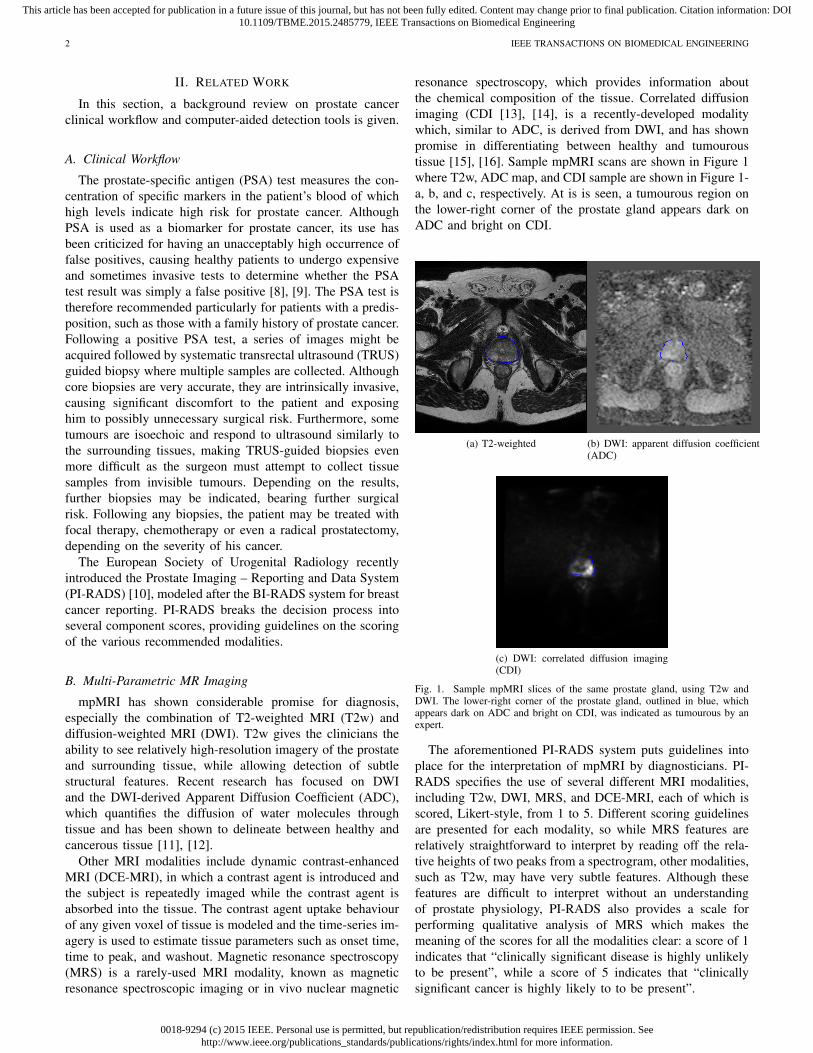
resonance spectroscopy, which provides information aboutthe chemical composition of the tissue. Correlated diffusionimaging (CDI [13], [14], is a recently-developed modalitywhich, similar to ADC, is derived from DWI, and has shownpromise in differentiating between healthy and tumouroustissue [15], [16]. Sample mpMRI scans are shown in Figure 1where T2w, ADC map, and CDI sample are shown in Figure 1-a, b, and c, respectively. At is is seen, a tumourous region onthe lower-right corner of the prostate gland appears dark onADC and bright on CDI.
(a) T2-weighted (b) DWI: apparent diffusion coefficient(ADC)
(c) DWI: correlated diffusion imaging(CDI)
Fig. 1. Sample mpMRI slices of the same prostate gland, using T2w andDWI. The lower-right corner of the prostate gland, outlined in blue, whichappears dark on ADC and bright on CDI, was indicated as tumourous by anexpert.
The aforementioned PI-RADS system puts guidelines intoplace for the interpretation of mpMRI by diagnosticians. PI-RADS specifies the use of several different MRI modalities,including T2w, DWI, MRS, and DCE-MRI, each of which isscored, Likert-style, from 1 to 5. Different scoring guidelinesare presented for each modality, so while MRS features arerelatively straightforward to interpret by reading off the rela-tive heights of two peaks from a spectrogram, other modalities,such as T2w, may have very subtle features. Although thesefeatures are difficult to interpret without an understandingof prostate physiology, PI-RADS also provides a scale forperforming qualitative analysis of MRS which makes themeaning of the scores for all the modalities clear: a score of 1indicates that “clinically significant disease is highly unlikelyto be present”, while a score of 5 indicates that “clinicallysignificant cancer is highly likely to to be present”.

0018-9294 (c) 2015 IEEE. Personal use is permitted, but republication/redistribution requires IEEE permission. Seehttp://www.ieee.org/publications_standards/publications/rights/index.html for more information.
This article has been accepted for publication in a future issue of this journal, but has not been fully edited. Content may change prior to final publication. Citation information: DOI10.1109/TBME.2015.2485779, IEEE Transactions on Biomedical Engineering
CAMERON et al.: MAPS: A QUANTITATIVE RADIOMICS APPROACH FOR PROSTATE CANCER DETECTION 3
Unfortunately, despite the wealth of information providedby various MRI modalities, prostate cancer remains difficultto distinguish from other conditions, notably benign pro-static hyperplasia (BPH). The additional tissue growth in thetransitional zone (TZ) occurring due to BPH causes similarMRI signal intensity changes as prostate cancer. Furthermore,attempts to differentiate cancerous tissue from healthy tissuein the central gland have failed to show differences in meanT2w or ADC values [17]. However, since BPH only occursin the central gland, this issue only arises in the minority ofcases which occur elsewhere than the peripheral zone.
C. Computer-Aided Prostate Cancer Detection
Automatic approaches to prostate cancer detection can begrouped into methods which attempt to segment the prostateinto discrete regions of concern, and methods which insteadassign some kind of numeric score to each voxel in theprostate. A variety of features and classification strategies areused to produce these scores, whether the scores are region-based or voxel-based. Features and classifiers will be discussedlater, but for region-based methods an additional step mustfirst be performed, namely the segmentation of the prostateinto regions of concern.
1) Segmenting tumour candidates: The problem of seg-menting tumour candidates is not yet well-explored; mostclassifiers built on MRI intensity features did not performany tumour candidate segmentation, but instead computedvoxelwise feature statistics, using ROC curve analysis, oroutput from SVMs, RVMs, or MRFs [18], [19], [20], [21],[22], [17], [23], [24], [25], [26]. Some high-level classifiersleveraged the added detail apparent in stained histology scansto segment different gland structures in the prostate, namelylumen regions, the cytoplasm surrounding the lumen, and thenuclei of the surrounding cells [27], [28]. Classifiers weretrained on features computed from these regions to predictthe Gleason grade of prostate tissue, but MRI modalities donot have adequate resolution to observe these structures, sothese features cannot be leveraged for MRI tumour candidateidentification.
2) Feature extraction: Detecting prostate cancer automat-ically has been a popular area of research and to date,these methods have focused primarily on low-level features.Conventional mpMRI prostate cancer analysis approaches useone or more of the MRI modality values or derived values,including ADC and T2w, with no complementary high-levelfeatures [23]. Published values for classification accuracyusing these low-level features ranges from 64% to 89% [25],[23], [18], [11], [19], [29].
More sophisticated approaches calculate large numbers oflow-level features and then combine them in various ways;low-level features considered in such approaches includestatistical features (e.g. local variance) and change-of-basisfeatures such as Gabor filter coefficients [30], discrete cosinetransform (DCT) coefficients, and textural features (both firstand second-order) such as those derived from co-occurrencematrices (CMs). Chan et al. [25] reported that compared to us-ing MRI intensity features exclusively, DCT and CM features
improved accuracy between 6.2% and 11.0% (accuracy of72.9% without those features, and 79.1% – 83.9% with them).Madabhushi et al. [30] reported a positive predictive value(PPV) of approximately 21% when using a combination offirst and second-order statistical features, gradient features, andGabor features within an ensemble classification framework.However, since the low-level features lack semantic meaning,the classification decisions made by such approaches are diffi-cult to justify to radiologists and clinicians, who typically usesubjective heuristics to diagnose patient cases. Although thelatter approach is easy to understand and justify, its subjectivenature makes it highly inconsistent.
In contrast to low-level features, which typically char-acterize some kind of voxelwise physiology characteristic,high-level features often exploit a priori knowledge of theproblem to quantify high-level domain concepts. High-levelfeatures have been used in detecting and localizing prostatecancer; however, their use is still limited, mostly to analysis ofhistopathology, which necessitates invasive surgery to acquirethe tissue samples subsequently scanned at high resolution; forinstance, Naik et al. [27] demonstrated that classifiers builtusing high-level features designed using domain knowledgeare effective in diagnosing prostate tissue as cancerous anddistinguishing cancerous tissue between two grades on theGleason scale, with classification accuracy in the range of86–95%. Notable among these high-level features was theuse of region-based features; the added magnification achievedby histopathology scans allows observation and segmentationof structures too small to be apparent via MRI. Naik et al.computed features on the segmentation boundaries of thesestructures, such as smoothness and area, and used thesefeatures to perform classification. The use of such region-basedfeatures is not currently well-explored for MR imagery. Theseparticular high-level features cannot be computed at all formpMRI, as the structures used are too small to be resolved.Haider et al. [23] described a scoring scheme for diagnosingprostate cancer based on high-level features observed in T2wand ADC imagery. However, these features are not easilyquantifiable and are intended for use by trained radiologistsand not classification algorithms.
As an initial attempt for a radiomics-driven feature modelfor prostate cancer detection, some preliminary results werepresented in [31]. In this paper, we have significantly extendedupon the work presented in [31]. First, the previous workonly used T2w and ADC for texture feature calculationswhereas the current work also incorporates DWI and CDIfor both textural and intensity features. Second, in [31], weonly used textural and morphological features while here inaddition to these two classes of features, we incorporate sizeand asymmetry features. Using more data and features (moreimages using DWI and CDI and more features) makes thetexture feature model more accurate, in terms of the cancerdetection accuracy. Third, only 5 patients datasets were used inthe previous work whereas 13 patients datasets have been usedin this paper allowing for a better validation of the proposedtexture feature model.
We have used the proposed radiomics-driven model in thispaper for prostate cancer detection. Given that the proposed

0018-9294 (c) 2015 IEEE. Personal use is permitted, but republication/redistribution requires IEEE permission. Seehttp://www.ieee.org/publications_standards/publications/rights/index.html for more information.
This article has been accepted for publication in a future issue of this journal, but has not been fully edited. Content may change prior to final publication. Citation information: DOI10.1109/TBME.2015.2485779, IEEE Transactions on Biomedical Engineering
4 IEEE TRANSACTIONS ON BIOMEDICAL ENGINEERING
model incorporates candidate tumour regions for feature calcu-lations, it can be augmented for prognostic of prostate canceras well. Studies on lung and head-and-neck cancer patientshave confirmed the prognostic power of radiomics featuresfor patient outcome prediction for personalized medicine [32],[33]. However, the prognostic capability of radiomics featureshas not been fully investigated for prostate cancer and this isa novel approach for identifying prostate tumours phenotypes.
D. Classification
To date, several approaches of classification have beenapplied in various prostate cancer imaging contexts. Amongapproaches investigating mpMRI, support vector machines(SVMs) are widely-used [11], [29], [34], [25], while othermethods applied maximum likelihood (ML) classification [25],[23], logistic regression [19], or Markov random fields(MRFs) [18], [29]. Approaches attempting classification ofhistopathology data tended to use more features and thusmore sophisticated methods of combining those features; forinstance, combining many weak Bayesian predictors usingan ensemble method such as AdaBoost [24], [30], or usinga manifold learning technique such as Graph Embedding orLocal Linear Embedding to reduce the size of the feature spacepassed into a SVM classifier [35], [27], [36]. Interestingly, thempMRI approach with the greatest number of features reportedgreatest classification accuracy with the comparatively simpleFisher’s linear discriminant (FLD) classifier [25].
Despite the recent introduction of PI-RADS, systematicprostate cancer evaluation schemes are still in their infancy.Although much research has been carried out on the useof various modalities and numerous features for detectingprostate cancer, most of the automatic approaches do notsupport their decisions with a similar framework as those usedby radiologists diagnosing prostate cancer manually. There isno attempt to map automatic classification decisions to thelanguage familiar to diagnosticians in their work. The frame-works which do group features together in this manner, suchas those presented by Haider et al. [23] or in PI-RADS [10],are meant for interpretation by radiologists. They are notquantifiable, and due to their subjective nature lack consistencyin interpretation from one session to the next and from oneclinician to the next. The field is ripe for a comprehensivefeature model which enables consistent, quantifiable featureanalysis in a manner that is familiar to diagnosticians. Ourproposed feature model has been designed with the aim ofproviding a quantitative model for PI-RADS scheme to makeit a more systematic approach leading to consistent diagnosis.To our best knowledge, this is the first attempt in quantifyingthe PI-RADS scoring scheme for prostate cancer.
III. PROPOSED MAPS FEATURE MODEL
The proposed model consists of an initial tumour candidateidentification scheme followed by the MAPS (Morphology,Asymmetry, Physiology, and Size) feature model used to scorethe candidate regions. The goal of the proposed model isto incorporate high-level radiomics features using candidatetumour regions to construct a high-dimensional feature space
that can be mined for different purposes such as detection orprognosis of cancer. In the proposed method, initial identifica-tion of candidate tumour regions is automatically performedusing mpMRI and region morphology. After candidate regionsare identified by the automatic tumour candidate identificationalgorithm, numerous features are extracted from the variousmpMRI modalities. These features are grouped into high-levelcategories according to the type of characteristics they de-scribe. The Morphology feature group describes region shape;whether the boundary is smoothly-varying or jagged, whetherit consists of small protrusions or a focal mass, and so on.The Asymmetry feature group describes the extent to whichthe two halves of the region appear similar when split alongits major and minor axes. Tissue characteristics are captured inthe Physiology group, which includes mean signal intensity forall the MRI modalities as well as a series of textural featuresand filter responses. Finally, the Size feature group capturesthe physical extent of the region. Collectively, these featuregroups provide the diagnostician with an improved ability tointerpret the system’s decisions.
Figure 2 illustrates a detailed block diagram of the proposedradiomics feature model for a given slice where 10 tumourcandidate regions have been identified by the model. Fourgroups of features (Morphology, Asymmetry, Physiology, andSize) are also shown which are used to construct the radiomicssequences. The tumour candidate identification algorithm, aswell as each of the feature groups and all their constituentfeatures, are described in detail in the following sections.
A. Automatic Tumour Candidate Identification
Tumour candidate region identification is the first step inradiomics-driven diagnosis of prostate cancer. An automatedsystem working from straightforward screening procedurescan quickly and thoroughly scan all the imagery for a givencase, flagging screened regions for review by a radiologist,producing screening results with less inter-observer variability.Tumour candidate regions were identified automatically inthe proposed system using guidelines for clinical mpMRIprostate cancer screening by a radiologist [23]. Tissue re-gions satisfying these criteria were grouped into connectedregions and analyzed further with the feature model detailedin section III-B. In particular, diffusion characteristics andmorphology were used to automatically identify candidateregions in the proposed system.
As low ADC values are associated with tumourous tis-sue [23], tissue with ADC values below a particular thresh-old were automatically identified by the proposed system aspossible tumour candidates. Considering that the priority ofthe candidate identification phase is to highlight regions forconsideration, rather than to eliminate them, the thresholdvalue used in [23] was relaxed to capture more regions. Allvoxels with an ADC value less than 700× 10−6 mm2/s wereflagged as possible tumour candidates. These flagged voxelswere then grouped into connected regions, and a second phasewas used in the automatic tumour candidate identificationalgorithm to take morphology into account. In particular,to eliminate single islands smaller than most tumours, all

0018-9294 (c) 2015 IEEE. Personal use is permitted, but republication/redistribution requires IEEE permission. Seehttp://www.ieee.org/publications_standards/publications/rights/index.html for more information.
This article has been accepted for publication in a future issue of this journal, but has not been fully edited. Content may change prior to final publication. Citation information: DOI10.1109/TBME.2015.2485779, IEEE Transactions on Biomedical Engineering
CAMERON et al.: MAPS: A QUANTITATIVE RADIOMICS APPROACH FOR PROSTATE CANCER DETECTION 5
Fig. 2. Detailed block diagram of the proposed radiomics feature model. For each feature group, rows and columns represent tumour candidate regions andfeature values, respectively
connected regions larger than the voxel resolution, which isusually about 1.6mm2 were considered as the final set oftumour candidate regions.
Fig. 3. Sample tumour candidate identification results; prostate gland (blue),true positive regions (red), and regions identified by the tumour candidateidentification algorithm (green), overlaid on the ADC image.
Sample candidate identification results are shown in Fig-ure 3. The tendency of the identification scheme to identifymany false positives is evident; although the region labelled astumourous in the ground truth was successfully identified, sowere many other regions. This practice is common in clinicalscreening, which is effectively the purpose of tumour candidateidentification: to identify all suspects, so that a more specifictest can eliminate the false positives. This helps reduce thenumber of false negatives, or regions of concern missed by
the test that are nevertheless cancerous.
B. MAPS Feature ModelIn this section, we discuss the proposed radiomics-based
feature model which provides a high-level description ofthe tumour candidate regions. Each feature group in theMAPS model (Morphology, Asymmetry, Physiology, Size) isexpounded along with its component features.
1) Morphology: The PI-RADS guidelines make mention ofmorphology in several areas; the appearance of a “focal mass”,for instance, is an indicator for a higher PI-RADS score inseveral categories. Viewed with T2w, a “bulging” effect in theperipheral zone (PZ) is highly indicative of cancer, while in thetransitional zone (TZ) cancerous regions are “usually lenticularor water-drop shaped”. Viewed with DWI, focal regions aswell as “linear, triangular, or geographical [regions]” areimportant biomarkers [10]. In the proposed feature model, aset of features are computed to characterize the morphologyof the tumour candidate region. The morphological featuresused in the MAPS model capture structural information abouta candidate region by applying operations which smooth theshape of the region boundary. Regions with little morpho-logical irregularity undergo little change with the smoothingoperator, while regions with highly irregular shapes will seea drastic difference. The various smoothing operators used tocompute morphology features capture different characteristicsabout the region shape. In total, three morphological featuresare computed from the region boundary.
The first feature in this group is the normalized differencein area between the morphological closing of the region andthe morphological opening of the region, using an identicaldisk structuring element for both operations [37]:

0018-9294 (c) 2015 IEEE. Personal use is permitted, but republication/redistribution requires IEEE permission. Seehttp://www.ieee.org/publications_standards/publications/rights/index.html for more information.
This article has been accepted for publication in a future issue of this journal, but has not been fully edited. Content may change prior to final publication. Citation information: DOI10.1109/TBME.2015.2485779, IEEE Transactions on Biomedical Engineering
6 IEEE TRANSACTIONS ON BIOMEDICAL ENGINEERING
fM1 =Aclosed −Aopened
Ainitial(1)
Here, A denotes the area of a region. Peaks and valleys inthe border of the region will cause the area to increase afterclosing, while it will decrease after opening (i.e., Aclosed ≥Aopened); therefore, regions with very irregular borders willhave a greater difference between these two values, and thefeature value will be greater. Smaller feature values thencorrespond to regions with borders which do not feature sharppeaks and valleys. An example region is shown in Figure 4-a.
(a) Morphological area feature
(b) Morphological perimeter feature
Fig. 4. Illustrations of the morphological features. In (a), the large differencein areas between the closing and opening contours results in a high featurevalue for this region. (b), the perimeter feature illustration, a candidate regioncontour, shown in blue, has a perimeter similar in length to that of the region’slow-frequency Fourier reconstruction, shown in red, resulting in a low featurevalue for this region.
The second morphological feature compares the lengthof the region’s perimeter before and after eliminating high-frequency components in the Fourier space, and normalizingthe difference:
fM2 =|Pinitial − Preconstruction|
Pinitial, (2)
where each P is the perimeter of the region denoted byits subscript. Since high-frequency components capture rapidchanges in the shape of the region, this feature will be greaterfor regions with rapidly-varying boundaries than for those withsmooth, slowly-varying boundaries [37]. An example region isshown in Figure 4-b.
The third morphological feature is similar to the second,in that it examines the difference between two Fourier recon-structions of the region boundary, one at a low frequency andone at a higher frequency. However, it computes difference inarea, rather than perimeter:
fM3 =|Ainitial ⊕Areconstruction||Ainitial ∪Areconstruction|
, (3)
where ⊕ denotes the set symmetric difference, finding voxelswhich are in the low-frequency reconstruction or the high-frequency one, but not both. This value is normalized by thearea of the union of both reconstructions, denoted by ∪.
2) Asymmetry: The PI-RADS guidelines suggest that asym-metry in a lesions denotes an increased likelihood of can-cerousness [10]. The Asymmetry feature group represents thedegree of bilateral symmetry exhibited by a candidate region.In order to quantify the region’s symmetry, the region is splitin half along an axis passing through the region’s center ofmass. The halves to either side of this axis are then comparedby taking the difference in their areas, and normalizing it:
fA· =Alarge −Asmall
Anormalize, (4)
where Alarge and Asmall represent the areas of the regionhalves, chosen such that Alarge ≥ Asmall, and Anormalize
represents the area of the region used to normalize thedifference. Four different Asymmetry features (illustrated inFigure 5) are computed in total by choosing either the majoror the minor axis to split the region, and by choosing eitherthe entire region area or the area of the smaller half-region asAnormalize. As regions may be symmetric about one axis butnot the other, using both the major and minor axes to measureregion asymmetry allows the feature model to distinguish agreater variety of regions.
Fig. 5. Asymmetry feature illustration: A sample region contour is shownin blue, with the major axis drawn in black. The difference in area betweenthe green and magenta regions is taken and then normalized in two differentways, producing two different features. The process is then repeated using theminor axis.
3) Physiology: Cancerous tissue is often indicated by anumber of physiological factors. PI-RADS includes severalphysiological MRI biomarkers as criteria, including “uniformhigh signal intensity”, “homogeneous low signal intensity”, or“heterogeneous [. . . ] adenoma”. The Physiology feature groupattempts to capture such physiological factors. In addition toraw mpMRI signal values, many derived features are computedfrom the mpMRI data. Many of these features emulate variousparts of the human visual system, such as second-order texturalfeature images, or Gabor filter responses.
While the features in the other groups can be computedfrom the region boundary, Physiology features are computedon a per-voxel basis. For each feature, the mean feature scorewas taken from all the voxels in the region, and the meanvalue used as the feature score for the region.

0018-9294 (c) 2015 IEEE. Personal use is permitted, but republication/redistribution requires IEEE permission. Seehttp://www.ieee.org/publications_standards/publications/rights/index.html for more information.
This article has been accepted for publication in a future issue of this journal, but has not been fully edited. Content may change prior to final publication. Citation information: DOI10.1109/TBME.2015.2485779, IEEE Transactions on Biomedical Engineering
CAMERON et al.: MAPS: A QUANTITATIVE RADIOMICS APPROACH FOR PROSTATE CANCER DETECTION 7
a) Raw mpMRI Signal Intensities: The most directlyinterpretable features consist of the MRI signal intensity valuesfor the T2w, ADC, DWI, and CDI modalities. Important T2wbiomarkers in the PI-RADS scheme include areas in the PZof “uniform high signal intensity (SI)” and “homogeneouslow signal [intensity] focus/mass”, as well as “areas of [. . . ]homogeneous low SI” in the TZ [10]. DWI measures theability water to diffuse through tissue, and involves repeatedimaging while varying several acquisition parameters, collec-tively referred to as the b-factor or b-value, to vary the degreeof diffusion allowed to occur during acquisition. The DWIacquisitions at the various b-values are used collectively toestimate the ADC. Unlike DWI, which induces signal decaythrough diffusion (resulting in dark areas where water candiffuse), the ADC measures the rate of diffusion of tissue,so poorly-diffusing areas appear dark. Raw DWI and ADCintensity values are used in PI-RADS where areas of concernare indicated by “focal areas of reduced ADC” and “intenseSI on high b-value images” [10]. CDI is not yet widely-used,but evidence suggests that CDI signal intensity is effective atdelineating tumours from healthy prostate tissue [13].
b) Textural Features: Texture features were included tocapture the different textural characteristics between cancerousand healthy tissue [30]. They play an important role inPI-RADS, which uses properties including uniformity andhomogeneity (or heterogeneity) in diagnosis of T2w imagingof the TZ [10]. A series of local statistical features wereextracted from the mpMRI images in order to quantify texturalcharacteristics of imaged tissue [30]. Feature values for eachregion were obtained by averaging texture image values overthe region.
For each candidate region, a set of low-level texture featureswere computed. Texture features quantify the occurrence ofvarious patterns in an image. Whereas raw mpMRI valuesindicate the signal response from each respective voxel, textureimages derived from the MR images indicate how the signalresponse at any given voxel relates to those around it. Forexample, the mean texture image can be computed using ak × k sliding window, where each voxel in the mean textureimage consists of the mean value of the k2 voxels in the k×kwindow centered around that voxel in the original image. Asfour different raw modalities were used (T2w, DWI, ADC,CDI), each texture operation described below constitutes fourfeatures in the Physiology group.
Texture features may be classified as first-, second-, orhigher-order features, depending on the number of voxelsin a particular spatial arrangement being compared in thecomputation of each class of feature. The first-order featurescompare a single voxel to some global value; e.g., the medianfeature. By contrast, second-order features such as homogene-ity are computed using a co-occurrence matrix (CM), whichis a measure of the distribution of pairs of intensities in animage. Higher-order textural features compare the relationshipbetween more than two voxels.
First-order Features: The first-order textural features inthe MAPS model consist of the median, standard deviation,and mean absolute deviation. Each of these three features iscomputed on the T2w, ADC, DWI, and CDI modalities using
a sliding window. Two window sizes were used for a totalof 24 first-order texture features. The median and standarddeviation feature images are straightforward to compute; eachvoxel (i, j) in the feature image is the result of evaluating theappropriate function (e.g. median) on Ni,j , the set of voxelvalues belonging to the sliding window around voxel (i, j) inthe original image I:
fmedian(i, j) = median(Ni,j) , (5)
fstdev(i, j) =√
var(Ni,j) ; (6)
while the mean absolute deviation feature image is simply theabsolute value of the voxelwise difference between the originalimage and the mean feature image:
fabsdev(i, j) = |I(i, j)−mean(Ni,j)| . (7)
Second-order Features: The second-order features in theMAPS model consist of contrast, correlation, and homogene-ity, previously used in [30], computed on T2w imagery at twoscales each for a total of six features. Computed from a CM,the second-order textures are given by:
contrast =∑i,j
|i− j|2 p(i, j) , (8)
correlation =∑i,j
(i− µi)(j − µj)p(i, j)
(σiσj), (9)
homogeneity =∑i,j
p(i, j)
1 + |i− j|. (10)
where p is the corresponding value from gray-level co-occurrence matrix of the sliding local window.
4) Size: Region size is used by clinicians to assess mpMRI;the scheme proposed by Haider et al. [23] uses the presenceof nodules larger than 5 mm in the TZ as indicative of cancerand further uses size to distinguish between classificationsof “Probably cancer” and “Definite cancer”, while PI-RADSsuggests that if the size of the region’s interface with theprostate surface is too large, cancer is indicated [10]. TheSize feature group contains a single feature measuring thearea of the candidate region. Since the resolution of a voxelchanges with the modality and with the equipment, countingregion sizes by number of voxels would be inconsistent. Thesize is therefore calculated in physical units, such as squaremillimeters. The size feature is shown in Figure 6.
The proposed method introduces a novel means of segment-ing candidate tumour regions by combining physiological andmorphological information. Features are then extracted fromthe candidate regions in several high-level categories derivedfrom clinical practice: Morphology, Asymmetry, Physiology,and Size. These feature groups are summarized along with thenumber of features in each group in Table I. The proposedradiomics feature model uses all features in each of thefeature groups to train the classifier. These feature groupscapture information commonly used by radiologists in thediagnosis of prostate cancer using mpMRI data, and group thisinformation in a way familiar to the diagnosticians. Featuresin the Morphology, Asymmetry, and Size groups describeproperties of the region, while features in the Physiology

0018-9294 (c) 2015 IEEE. Personal use is permitted, but republication/redistribution requires IEEE permission. Seehttp://www.ieee.org/publications_standards/publications/rights/index.html for more information.
This article has been accepted for publication in a future issue of this journal, but has not been fully edited. Content may change prior to final publication. Citation information: DOI10.1109/TBME.2015.2485779, IEEE Transactions on Biomedical Engineering
8 IEEE TRANSACTIONS ON BIOMEDICAL ENGINEERING
TABLE ISUMMARY OF FEATURE GROUPS IN PROPOSED MAPS MODEL
Feature group Number of features DescriptionMorphology 3 area regularity (1), perimeter regularity (2)Asymmetry 4 region bilateral symmetry (4)Physiology 34raw mpMRI 4 mean values for T2w, ADC, DWI, and CDI
textural (1st-order) 24 median, standard deviation, and mean absolute deviation at two scales for T2w, ADC, DWI, and CDItextural (2nd-order) 6 contrast, correlation, and homogeneity at two scales for T2w
Size 1 size of regiontotal 42 all features
Fig. 6. Size feature (area) illustration for a tumour candidate.
group more traditionally describe properties of the tissue ona finer scale. In order to produce a single feature score forany given region, then, the feature values at the finer scaleare averaged, and their mean value is used as the region’sfeature score. Collectively, this tumour candidate identificationscheme and set of feature groups are the MAPS feature model.The proposed model lays out the fundamentals for radiomics-based computer-aided diagnosis and prognosis for prostatecancer. The high-level feature model, MAPS, proposed herecan be used for both detection of prostate cancer, as presentedin this paper, and prognosis of this disease where patientoutcome data is available. In the next section, the performanceof this model at detecting prostate cancer will be evaluated andanalyzed.
IV. EXPERIMENTAL RESULTS
The proposed MAPS feature model was tested by usingactual clinical mpMRI data to extract the MAPS features,which were then used to train automated classifiers. Theperformance of classifiers using the proposed feature modeland various related feature sets was measured against groundtruth diagnoses provided by an expert diagnostician confirmedby histopathology data. Various subsets of the entire modelwere independently evaluated to compare, for instance, theperformance of the Morphology features on their own com-pared to the Asymmetry features. This section describes theclinical mpMRI data, feature extraction, and classifiers trainingevaluation. Numeric results are presented and discussed inSection IV-C.
A. Data Acquisition ProtocolThirteen patients were imaged in total where the mpMRI
images and expert annotations were compared to the corre-sponding histopathology data, obtained through radical prosta-tectomy with Gleason score 7 and above, as ground-truthto confirm the accuracy of the mpMRI markings. Informedconsent was obtained from all patients, and approval forthis study was obtained from the ethics review board ofSunnybrook Health Sciences Centre (SHSC), Toronto, ON,Canada. All acquisitions were made at SHSC with a PhilipsAchieva 3.0T device with SENSE-Cardiac coil. Patient agesand DWI acquisition parameters are summarized in Table II.Images were reviewed and annotated by a trained radiologistwith 18 and 13 years of experience interpreting body MRIand prostate MRI, respectively. Each annotation consists of acontour of the prostate gland as well as a contour around anycancerous regions identifiable by MRI.
Next, tumour candidates were identified by the proposedMAPS tumour candidate identification algorithm. Initially,all voxels with ADC values under 700× 10−6 mm2/s weresegmented as tumour candidates. Following this, only theconnected regions larger than the voxel resolution consideredas the final set of tumour candidate regions. An affine transfor-mation (scaling, rotation, and translation) was applied to theDWI and ADC imagery as to register it to the T2w imageryaccording to the patient coordinates in the MRI metadata. Thegland and region masks were likewise transformed. This en-sured the various modalities could be meaningfully comparedon a voxelwise basis by registering the imagery to a commoncoordinate system and interpolating to a common resolution.Finally, MAPS feature values were computed for each region,and the resulting feature vectors used to train and evaluateclassifiers.
B. Classification and Cross-validationThe features extracted from the clinical mpMRI data were
used to train many naıve Bayes classifiers. Naıve Bayesclassifiers assume that each feature is independent from oneanother. Formally, the joint probability of the region label (C)and feature values (f ) is equal to the product of the priorprobability and the likelihood of the assumed-independentfeature values:
p(C|fM1 , fM2 , fM3 , fA1 , · · · ) = p(C)∏i
fi . (11)
Although this produces an unsophisticated classifier, in prac-tice they often perform quite well; furthermore, the simplicity

0018-9294 (c) 2015 IEEE. Personal use is permitted, but republication/redistribution requires IEEE permission. Seehttp://www.ieee.org/publications_standards/publications/rights/index.html for more information.
This article has been accepted for publication in a future issue of this journal, but has not been fully edited. Content may change prior to final publication. Citation information: DOI10.1109/TBME.2015.2485779, IEEE Transactions on Biomedical Engineering
CAMERON et al.: MAPS: A QUANTITATIVE RADIOMICS APPROACH FOR PROSTATE CANCER DETECTION 9
TABLE IISUMMARY OF PATIENT INFORMATION FOR DWI ACQUISITIONS
Age DFOV (cm2) Resolution (mm3) TE (ms) TR (ms)74 24× 24 1.667× 1.667× 3 61 669261 20× 20 1.5625× 1.5625× 3 61 617870 20× 20 1.5625× 1.5625× 3 61 617853 20× 20 1.5625× 1.5625× 3 61 669353 20× 20 1.5625× 1.5625× 3 61 617874 24× 24 1.875× 1.875× 3 63 871756 20× 20 1.786× 1.786× 3 61 666757 24× 24 1.667× 1.667× 3 61 617760 20× 20 1.5625× 1.5625× 3 61 617875 20× 20 1.5625× 1.5625× 3 61 617862 20× 20 1.5625× 1.5625× 3 61 617870 20× 20 1.5625× 1.5625× 3 61 617860 24× 24 1.667× 1.667× 3 61 6692
of the model implies a lower number of parameters to train,which is helpful considering that the dataset used here hadin the order of twice as many training samples as there arefeatures in the model. Ultimately, the classifications performedfor the sake of this research were done to compare theperformance of different feature groups in a consistent way,rather than to maximize classification performance, so whilea reduction in model complexity and classification accuracymay seem to be a trade-off for the sake of limited trainingdata, it actually serves to facilitate analysis.
In total, 251 regions were used to train and evaluate clas-sifiers. These 251 tumour candidate regions had a mediansize of 73 mm2 (28 pixels) where the actual tumourousregions median size was 122 mm2 (46 pixels). In general,the tumour candidate regions included regions which weremuch smaller or larger than the actual tumourous regions.Of these 251 regions, 53 were cancerous regions identifiedby an expert diagnostician confirmed by histopathology data.In order to produce non-cancerous ground truth regions, theautomatic tumour candidate identification algorithm was runand any regions it identified which belonged to the cancerousregion labels were removed. Altogether, 198 non-cancerousregions were identified in this way and used for evaluation ina cross-validation approach. The cancerous and non-cancerousregions that belonged to one patient were grouped togetherto enable leave-one-patient-out cross-validation; to measurethe performance for a given patient’s data, all cancerous andnon-cancerous regions belonging to the patient was excludedfrom the training data and accuracy, sensitivity and specificitywere calculated for that patient data separately. The results ofindividual patients’ data were then averaged to generate thefinal results.
C. Evaluation and Discussion
Classifier performance was evaluated using three metricsin common use in clinical practice: accuracy, sensitivity, andspecificity where accuracy measures the proportion of predic-tions which are correct, sensitivity measures the proportionof positive cases correctly identified as such, and specificitymeasures the proportion of negative cases correctly identifiedas negative. Highly sensitive classifiers are typically used inthe clinical process as screens, while highly specific ones
are used to weed out false positives from the set of patientsidentified by the screen. The following section explains thecalculation and usage of these metrics. The final sectionpresents and interprets the experimental results.
Several feature groups were evaluated with the schemedescribed above: each component feature group of the MAPSmodel and the model as a whole. Results are shown inFigure 7. In the following, we will discuss the performance ofthe various MAPS feature groups relative to one another and tothe model as a whole. We will also examine the performanceof MAPS compared to commonly used mpMRI feature model(i.e., T2w + ADC).
1) Performance of the MAPS Feature Groups: Classifica-tion performance of each of the feature groups comprisingthe MAPS model is shown in Figure 7. Several trends areworth noting: some feature groups achieve almost consistentscores with each metric, such as the Physiology feature group,which achieves 73%-79% accuracy, sensitivity, and specificity.Other groups achieve a high sensitivity, but low specificity andlow accuracy: while the Size group achieves a sensitivity of91%, its accuracy is only 37% and its specificity is lowerstill. The Asymmetry group is similar, at about 87% sensitiveand 50% accurate. It is logical that the Size feature group,consisting of a single measure of total region area, shouldfail to accurately classify samples, as there are many factorswhich can contribute to region size besides cancer, such ashaemorrhaging. Likewise, while asymmetry may successfullydetect the majority of cancerous cases, it fails to distinguishfrom healthy cases, producing many false positives.
Fig. 7. Classification performance (accuracy, sensitivity, and specificity) ofeach MAPS feature group independently (Morphology, Asymmetry, Physiol-ogy, Size), and the MAPS feature model as a whole using leave-one-patient-out cross validation.
The Morphology and Physiology feature groups, on theother hand, achieve scores better than a random guess (i.e.,better than 50%) across all three performance metrics. TheMorphology group achieves an accuracy of 74% and speci-ficity of 71%, though 89% of sensitivity. Morphology wouldseem to be better at detecting true positives than true negatives;however, considering that there are only three Morphologyfeatures, their performance is better than one might expect
0018-9294 (c) 2015 IEEE. Personal use is permitted, but republication/redistribution requires IEEE permission. Seehttp://www.ieee.org/publications_standards/publications/rights/index.html for more information.
This article has been accepted for publication in a future issue of this journal, but has not been fully edited. Content may change prior to final publication. Citation information: DOI10.1109/TBME.2015.2485779, IEEE Transactions on Biomedical Engineering
10 IEEE TRANSACTIONS ON BIOMEDICAL ENGINEERING
given that the Asymmetry group has a similar number offeatures and nearly twice the misclassification rate. Clearlythe inclusion of region shape adds to the diagnostic power.
The unabridged MAPS model performs better than anyone of its feature groups (accuracy of 87%). Taken together,each group provides complementary information, so that tissueinformation captured by the Physiology features and shapeinformation captured by the Morphology features bolster eachothers’ shortcomings; the sensitivity of the Size and Morphol-ogy groups can be exploited while using the strength of theother groups to reject more false positives. The MAPS featuremodel achieved sensitivity and specificity scores of 86%, and88%, respectively. Although Size and Morphology groups givehigher sensitivity results compared to MAPS (91% and 89%vs. 86%), theirs accuracy and specificity are significantly lowerthan those of MAPS (Table III). When averaging all threemetrics (accuracy, sensitivity, and specificity), MAPS producesthe best results (i.e., 87%) compared to other feature groups.Table III summarizes the results.
In addition to leave-one-patient-out cross validation, weran another experiment for all features combined (MAPS)where half the data was selected randomly for training andthe remaining was used for testing. A 10-fold cross validationwas run using this setting and as shown in Table III (rowMAPS∗), the final results were almost similar to that of leave-one-patient-out approach (accuracy 87%, sensitivity 84% vs.86%, specificity 88%).
To investigate the contribution of each feature groups tothe final results, we used maximum relevance, minimumredundancy (mRMR) feature ranking technique [38]. The firstfive top discriminant features included 2 morphology features(area and perimeter regularity) and 3 physiology features(mean ADC, mean CDI, and correlation CDI). The first 10top discriminant features included 2 morphology features (areaand perimeter regularity), 1 asymmetry feature, and 7 physi-ology features (mean T2, mean and median ADC, mean CDI,standard deviation DWI, correlation T2, and correlation CDI).Interestingly, the size feature ranked 21 out of 42 features.This is also reflected in Figure 7 where Size feature yieldslow specificity and accuracy.
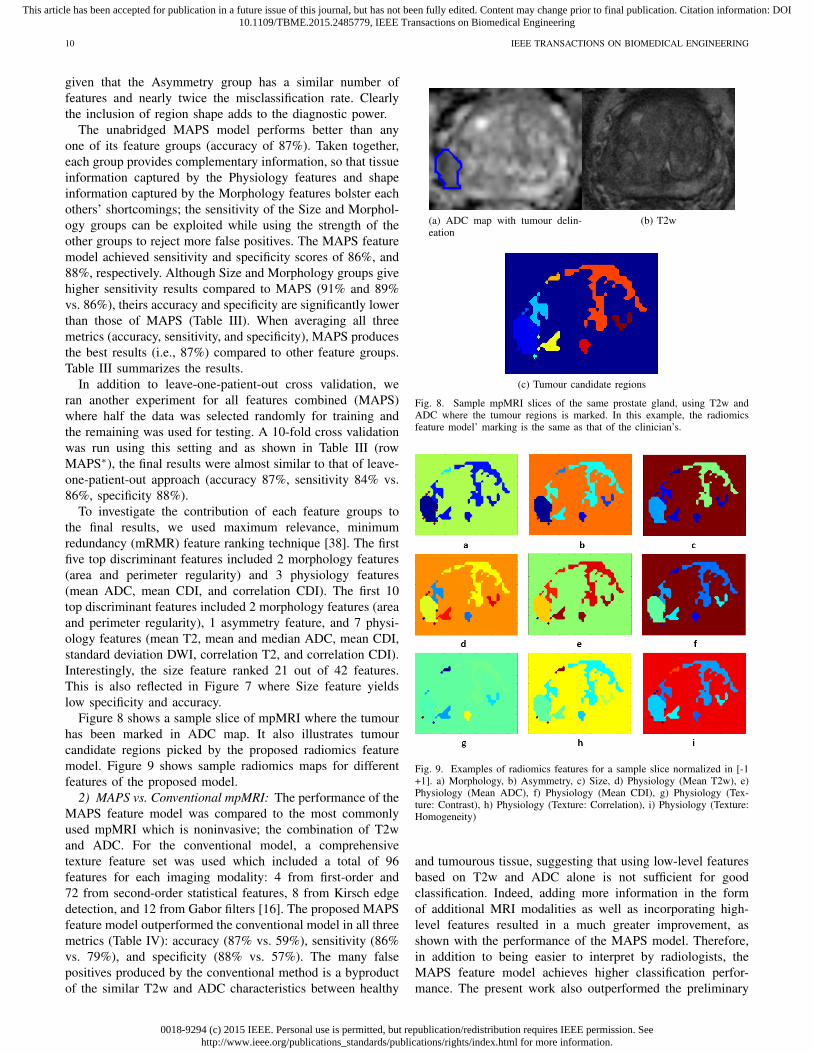
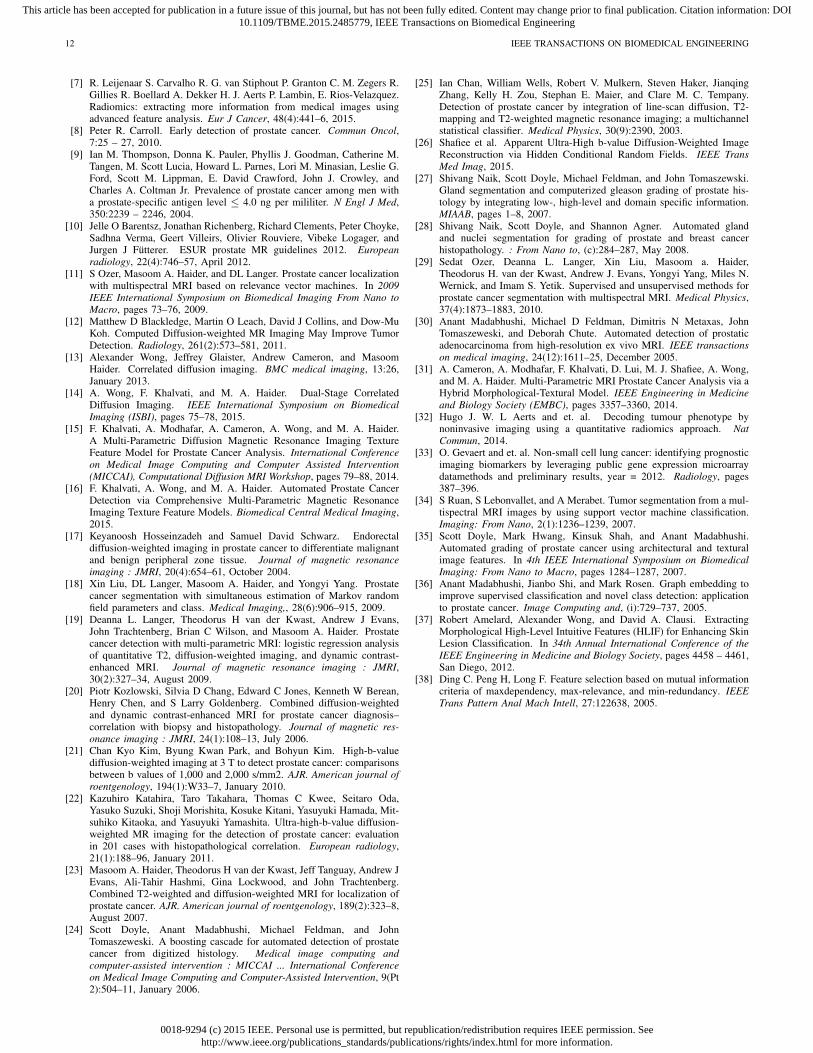
Figure 8 shows a sample slice of mpMRI where the tumourhas been marked in ADC map. It also illustrates tumourcandidate regions picked by the proposed radiomics featuremodel. Figure 9 shows sample radiomics maps for differentfeatures of the proposed model.
2) MAPS vs. Conventional mpMRI: The performance of theMAPS feature model was compared to the most commonlyused mpMRI which is noninvasive; the combination of T2wand ADC. For the conventional model, a comprehensivetexture feature set was used which included a total of 96features for each imaging modality: 4 from first-order and72 from second-order statistical features, 8 from Kirsch edgedetection, and 12 from Gabor filters [16]. The proposed MAPSfeature model outperformed the conventional model in all threemetrics (Table IV): accuracy (87% vs. 59%), sensitivity (86%vs. 79%), and specificity (88% vs. 57%). The many falsepositives produced by the conventional method is a byproductof the similar T2w and ADC characteristics between healthy
(a) ADC map with tumour delin-eation
(b) T2w
(c) Tumour candidate regions
Fig. 8. Sample mpMRI slices of the same prostate gland, using T2w andADC where the tumour regions is marked. In this example, the radiomicsfeature model’ marking is the same as that of the clinician’s.
Fig. 9. Examples of radiomics features for a sample slice normalized in [-1+1]. a) Morphology, b) Asymmetry, c) Size, d) Physiology (Mean T2w), e)Physiology (Mean ADC), f) Physiology (Mean CDI), g) Physiology (Tex-ture: Contrast), h) Physiology (Texture: Correlation), i) Physiology (Texture:Homogeneity)
and tumourous tissue, suggesting that using low-level featuresbased on T2w and ADC alone is not sufficient for goodclassification. Indeed, adding more information in the formof additional MRI modalities as well as incorporating high-level features resulted in a much greater improvement, asshown with the performance of the MAPS model. Therefore,in addition to being easier to interpret by radiologists, theMAPS feature model achieves higher classification perfor-mance. The present work also outperformed the preliminary

0018-9294 (c) 2015 IEEE. Personal use is permitted, but republication/redistribution requires IEEE permission. Seehttp://www.ieee.org/publications_standards/publications/rights/index.html for more information.
This article has been accepted for publication in a future issue of this journal, but has not been fully edited. Content may change prior to final publication. Citation information: DOI10.1109/TBME.2015.2485779, IEEE Transactions on Biomedical Engineering
CAMERON et al.: MAPS: A QUANTITATIVE RADIOMICS APPROACH FOR PROSTATE CANCER DETECTION 11
TABLE III95% CONFIDENCE INTERVALS ON RADIOMICS FEATURE MODEL PERFORMANCE. ALL RESULTS OBTAINED VIA LEAVE-ONE-PATIENT-OUT CROSS
VALIDATION EXCEPT FOR THE LAST ROW (MAPS∗) WHERE A 10-FOLD RANDOM CROSS VALIDATION (50%-50% TRAINING/TESTING) WAS USED
Feature set Accuracy Sensitivity Specificity AverageMorphology 74% ± 14% [65% 82%] 89% ± 21% [76% 99%] 71% ± 17%[60% 81%] 78%Asymmetry 50% ± 16% [41% 59%] 87% ± 19% [75% 98%] 38% ± 18% [27% 49%] 58%Physiology 77% ± 11% [70% 84%] 73% ± 31% [54% 92%] 79% ± 14% [70% 87%] 76%
Size 37% ± 19% [26% 48%] 91% ± 7% [86% 95%] 22% ± 21% [10% 35%] 50%MAPS 87% ± 10% [81% 93%] 86% ± 27% [70% 99%] 88% ±10% [82% 95%] 87%
MAPS∗ 87% ± 2% [86% 89%] 84% ± 11% [76% 92%] 88% ±4% [85% 91%] 86%
reuslts reported in [31] where accuracy, and specificity werebelow 80% and sensitivity was about 60%.
TABLE IVPERFORMANCE COMPARISON BETWEEN THE PROPOSED RADIOMICS
FEATURE MODEL AND CONVENTIONAL MPMRI VIALEAVE-ONE-PATIENT-OUT CROSS VALIDATION
Feature Model Accuracy Sensitivity Specificity AverageMAPS 87% ± 1% 86% ± 3% 88% ± 1% 87%
T2w+ADC 59% ± 16% 79% ± 26% 57% ± 17% 65%
V. FUTURE WORK
Although the initial results are promising, further work isneeded to support the use of the MAPS model in the clinicaldecision-making environment.
A. Larger Dataset and Feature SelectionThe results reported in this paper are preliminary results
using a rather small dataset (13 patients) which require afurther validation using larger datasets. As future work, wewill conduct additional validation using a larger dataset (e.g.,50 patients). Further labeled MRI data would be invaluable insupporting the experimental results shown thus far. Additionaldata would provide stronger evidence of the performanceof the MAPS feature model at detecting prostate cancer.In particular, with enough data, the model could be refinedthrough feature selection in order to discard features shown tohave little predictive power.
B. New Features and Changes to Existing FeaturesFurthermore, there are many additional features that could
be considered for inclusion in the model. Although MAPS cur-rently tries to capture many of the features used by radiologistswhen they are searching for cancer, additional ones can nodoubt be designed, which should be evaluated along with theexisting features for inclusion into the model. The Size featuregroup in particular, consisting of a single feature measuringregion area, could be expanded with several different measuresof size, such as the major axis length of the region, or thediameter of the largest circle which can be inscribed therein,for example.
C. MAPS for Prognosis of Prostate CancerUsing the proposed radiomics-driven texture feature model
based on tumour candidate regions, we will investigate theprognostic power of MAPS for prediction of patient outcome.This will require additional data on the outcome and survivalof the patients in the study.
D. User Testing
Finally, and perhaps most importantly, the MAPS modelneeds to be evaluated in a clinical decision-making environ-ment. Although initial results show promise for the frame-work’s ability to automatically detect prostate cancer, noamount of automated testing can stand in for user experiencetesting. In order to validate MAPS as being easy to interpret,it must be evaluated by practitioners. Studies should be run tomeasure the impact (if any) MAPS has on observer variability,on the accuracy of the diagnostician accuracy, and on the speedwith which diagnosticians can review patient cases.
VI. CONCLUSIONS
We proposed a comprehensive feature model as a quanti-tative radiomics approach for automatic detection of prostatecancer consisting of several feature groups in order to fosteruser acceptance and facilitate interpretability of classificationresults. The initial results are promising where the featuresin the MAPS model achieved an accuracy of 87% while pro-viding a structured framework for interpretation. The strengthof the results presented in this paper is limited due to thesize of labeled dataset available for training and hence, furthervalidation is required using a larger dataset.
ACKNOWLEDGMENT
This research has been supported by the Ontario Institute ofCancer Research (OICR), Canada Research Chairs programs,Natural Sciences and Engineering Research Council of Canada(NSERC), and the Ministry of Research and Innovation ofOntario.
REFERENCES
[1] Canadian Cancer Societys Advisory Committee on Cancer Statistics.Canadian Cancer Statistics 2014. Canadian Cancer Society, Toronto,ON, 2014.
[2] Canadian Cancer Societys Steering Committee on Cancer Statistics.Canadian Cancer Statistics 2012. Canadian Cancer Society, Toronto,ON, 2012.
[3] et al. Schrder F.H. ERSPC Investigators. Screening and prostate-cancermortality in a randomized European study. N. Engl. J. Med, 360:1320–1328, 2009.
[4] et al. Andriole G.L. PLCO Project Team. Mortality results from arandomized prostate-cancer screening trial. N. Engl. J. Med., 360:1310–1319, 2009.
[5] Ahmed HU Catto J Emberton M Nam R Rosario DJ Scattoni V Lotan YLoeb S, Vellekoop A. Systematic review of complications of prostatebiopsy. Eur Urol., 64(6):876–892, 2013.
[6] Arumainayagam et al. Multiparametric MR Imaging for Detection ofClinically Significant Prostate Cancer: A Validation Cohort Study withTransperineal Template Prostate Mapping as the Reference Standard.Radiology, 268(3):761–769, 2013.
0018-9294 (c) 2015 IEEE. Personal use is permitted, but republication/redistribution requires IEEE permission. Seehttp://www.ieee.org/publications_standards/publications/rights/index.html for more information.
This article has been accepted for publication in a future issue of this journal, but has not been fully edited. Content may change prior to final publication. Citation information: DOI10.1109/TBME.2015.2485779, IEEE Transactions on Biomedical Engineering
12 IEEE TRANSACTIONS ON BIOMEDICAL ENGINEERING
[7] R. Leijenaar S. Carvalho R. G. van Stiphout P. Granton C. M. Zegers R.Gillies R. Boellard A. Dekker H. J. Aerts P. Lambin, E. Rios-Velazquez.Radiomics: extracting more information from medical images usingadvanced feature analysis. Eur J Cancer, 48(4):441–6, 2015.
[8] Peter R. Carroll. Early detection of prostate cancer. Commun Oncol,7:25 – 27, 2010.
[9] Ian M. Thompson, Donna K. Pauler, Phyllis J. Goodman, Catherine M.Tangen, M. Scott Lucia, Howard L. Parnes, Lori M. Minasian, Leslie G.Ford, Scott M. Lippman, E. David Crawford, John J. Crowley, andCharles A. Coltman Jr. Prevalence of prostate cancer among men witha prostate-specific antigen level ≤ 4.0 ng per mililiter. N Engl J Med,350:2239 – 2246, 2004.
[10] Jelle O Barentsz, Jonathan Richenberg, Richard Clements, Peter Choyke,Sadhna Verma, Geert Villeirs, Olivier Rouviere, Vibeke Logager, andJurgen J Futterer. ESUR prostate MR guidelines 2012. Europeanradiology, 22(4):746–57, April 2012.
[11] S Ozer, Masoom A. Haider, and DL Langer. Prostate cancer localizationwith multispectral MRI based on relevance vector machines. In 2009IEEE International Symposium on Biomedical Imaging From Nano toMacro, pages 73–76, 2009.
[12] Matthew D Blackledge, Martin O Leach, David J Collins, and Dow-MuKoh. Computed Diffusion-weighted MR Imaging May Improve TumorDetection. Radiology, 261(2):573–581, 2011.
[13] Alexander Wong, Jeffrey Glaister, Andrew Cameron, and MasoomHaider. Correlated diffusion imaging. BMC medical imaging, 13:26,January 2013.
[14] A. Wong, F. Khalvati, and M. A. Haider. Dual-Stage CorrelatedDiffusion Imaging. IEEE International Symposium on BiomedicalImaging (ISBI), pages 75–78, 2015.
[15] F. Khalvati, A. Modhafar, A. Cameron, A. Wong, and M. A. Haider.A Multi-Parametric Diffusion Magnetic Resonance Imaging TextureFeature Model for Prostate Cancer Analysis. International Conferenceon Medical Image Computing and Computer Assisted Intervention(MICCAI), Computational Diffusion MRI Workshop, pages 79–88, 2014.
[16] F. Khalvati, A. Wong, and M. A. Haider. Automated Prostate CancerDetection via Comprehensive Multi-Parametric Magnetic ResonanceImaging Texture Feature Models. Biomedical Central Medical Imaging,2015.
[17] Keyanoosh Hosseinzadeh and Samuel David Schwarz. Endorectaldiffusion-weighted imaging in prostate cancer to differentiate malignantand benign peripheral zone tissue. Journal of magnetic resonanceimaging : JMRI, 20(4):654–61, October 2004.
[18] Xin Liu, DL Langer, Masoom A. Haider, and Yongyi Yang. Prostatecancer segmentation with simultaneous estimation of Markov randomfield parameters and class. Medical Imaging,, 28(6):906–915, 2009.
[19] Deanna L. Langer, Theodorus H van der Kwast, Andrew J Evans,John Trachtenberg, Brian C Wilson, and Masoom A. Haider. Prostatecancer detection with multi-parametric MRI: logistic regression analysisof quantitative T2, diffusion-weighted imaging, and dynamic contrast-enhanced MRI. Journal of magnetic resonance imaging : JMRI,30(2):327–34, August 2009.
[20] Piotr Kozlowski, Silvia D Chang, Edward C Jones, Kenneth W Berean,Henry Chen, and S Larry Goldenberg. Combined diffusion-weightedand dynamic contrast-enhanced MRI for prostate cancer diagnosis–correlation with biopsy and histopathology. Journal of magnetic res-onance imaging : JMRI, 24(1):108–13, July 2006.
[21] Chan Kyo Kim, Byung Kwan Park, and Bohyun Kim. High-b-valuediffusion-weighted imaging at 3 T to detect prostate cancer: comparisonsbetween b values of 1,000 and 2,000 s/mm2. AJR. American journal ofroentgenology, 194(1):W33–7, January 2010.
[22] Kazuhiro Katahira, Taro Takahara, Thomas C Kwee, Seitaro Oda,Yasuko Suzuki, Shoji Morishita, Kosuke Kitani, Yasuyuki Hamada, Mit-suhiko Kitaoka, and Yasuyuki Yamashita. Ultra-high-b-value diffusion-weighted MR imaging for the detection of prostate cancer: evaluationin 201 cases with histopathological correlation. European radiology,21(1):188–96, January 2011.
[23] Masoom A. Haider, Theodorus H van der Kwast, Jeff Tanguay, Andrew JEvans, Ali-Tahir Hashmi, Gina Lockwood, and John Trachtenberg.Combined T2-weighted and diffusion-weighted MRI for localization ofprostate cancer. AJR. American journal of roentgenology, 189(2):323–8,August 2007.
[24] Scott Doyle, Anant Madabhushi, Michael Feldman, and JohnTomaszeweski. A boosting cascade for automated detection of prostatecancer from digitized histology. Medical image computing andcomputer-assisted intervention : MICCAI ... International Conferenceon Medical Image Computing and Computer-Assisted Intervention, 9(Pt2):504–11, January 2006.
[25] Ian Chan, William Wells, Robert V. Mulkern, Steven Haker, JianqingZhang, Kelly H. Zou, Stephan E. Maier, and Clare M. C. Tempany.Detection of prostate cancer by integration of line-scan diffusion, T2-mapping and T2-weighted magnetic resonance imaging; a multichannelstatistical classifier. Medical Physics, 30(9):2390, 2003.
[26] Shafiee et al. Apparent Ultra-High b-value Diffusion-Weighted ImageReconstruction via Hidden Conditional Random Fields. IEEE TransMed Imag, 2015.
[27] Shivang Naik, Scott Doyle, Michael Feldman, and John Tomaszewski.Gland segmentation and computerized gleason grading of prostate his-tology by integrating low-, high-level and domain specific information.MIAAB, pages 1–8, 2007.
[28] Shivang Naik, Scott Doyle, and Shannon Agner. Automated glandand nuclei segmentation for grading of prostate and breast cancerhistopathology. : From Nano to, (c):284–287, May 2008.
[29] Sedat Ozer, Deanna L. Langer, Xin Liu, Masoom a. Haider,Theodorus H. van der Kwast, Andrew J. Evans, Yongyi Yang, Miles N.Wernick, and Imam S. Yetik. Supervised and unsupervised methods forprostate cancer segmentation with multispectral MRI. Medical Physics,37(4):1873–1883, 2010.
[30] Anant Madabhushi, Michael D Feldman, Dimitris N Metaxas, JohnTomaszeweski, and Deborah Chute. Automated detection of prostaticadenocarcinoma from high-resolution ex vivo MRI. IEEE transactionson medical imaging, 24(12):1611–25, December 2005.
[31] A. Cameron, A. Modhafar, F. Khalvati, D. Lui, M. J. Shafiee, A. Wong,and M. A. Haider. Multi-Parametric MRI Prostate Cancer Analysis via aHybrid Morphological-Textural Model. IEEE Engineering in Medicineand Biology Society (EMBC), pages 3357–3360, 2014.
[32] Hugo J. W. L Aerts and et. al. Decoding tumour phenotype bynoninvasive imaging using a quantitative radiomics approach. NatCommun, 2014.
[33] O. Gevaert and et. al. Non-small cell lung cancer: identifying prognosticimaging biomarkers by leveraging public gene expression microarraydatamethods and preliminary results, year = 2012. Radiology, pages387–396.
[34] S Ruan, S Lebonvallet, and A Merabet. Tumor segmentation from a mul-tispectral MRI images by using support vector machine classification.Imaging: From Nano, 2(1):1236–1239, 2007.
[35] Scott Doyle, Mark Hwang, Kinsuk Shah, and Anant Madabhushi.Automated grading of prostate cancer using architectural and texturalimage features. In 4th IEEE International Symposium on BiomedicalImaging: From Nano to Macro, pages 1284–1287, 2007.
[36] Anant Madabhushi, Jianbo Shi, and Mark Rosen. Graph embedding toimprove supervised classification and novel class detection: applicationto prostate cancer. Image Computing and, (i):729–737, 2005.
[37] Robert Amelard, Alexander Wong, and David A. Clausi. ExtractingMorphological High-Level Intuitive Features (HLIF) for Enhancing SkinLesion Classification. In 34th Annual International Conference of theIEEE Engineering in Medicine and Biology Society, pages 4458 – 4461,San Diego, 2012.
[38] Ding C. Peng H, Long F. Feature selection based on mutual informationcriteria of maxdependency, max-relevance, and min-redundancy. IEEETrans Pattern Anal Mach Intell, 27:122638, 2005.