mapping the vegetation of national parks using … · mapping the vegetation of national parks...
TRANSCRIPT

Mapping the Vegetation of National Parks Using Standard
Ecological Classifications
Judy Teague, Rickie White, Pat ComerNatureServe
With graphics and content contributions from USGS Upper Midwest Environmental Science Center, the Center for Remote Sensing and Mapping Science at University of Georgia, and the Virginia Natural Heritage Program
• Why Use Standard Ecological Classifications
• What are Standard Ecological Classifications
• US National Park Service Vegetation Mapping Program
• How Vegetation Maps are Used• Ecological Classification Methodology• Mapping Methodology
Presentation Summary
Why Use a Standardized Ecological Classification?
• Provides consistent names and concepts
• Identifies range-wide variability of types
• Needed to assess rarity and threats to determine conservation status
A
B
C
B
C
A
A
AB
C
B
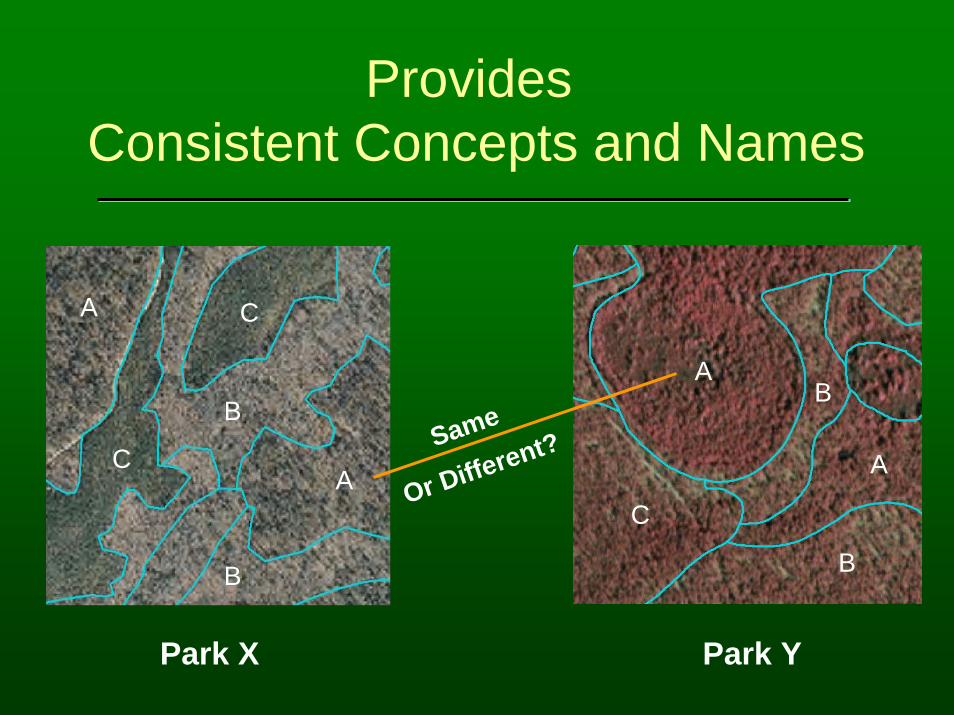
Same
Or Different?
Park X Park Y
Provides Consistent Concepts and Names

Range-wide Variability
Southern Appalachian Cove Forest (TypicMontane Type)

G1 — Critically imperiledG2 — ImperiledG3 — VulnerableG4 — Apparently secureG5 — Secure
GX — Presumed extinctGH — Possibly extinct
Global Conservation Status Ranks
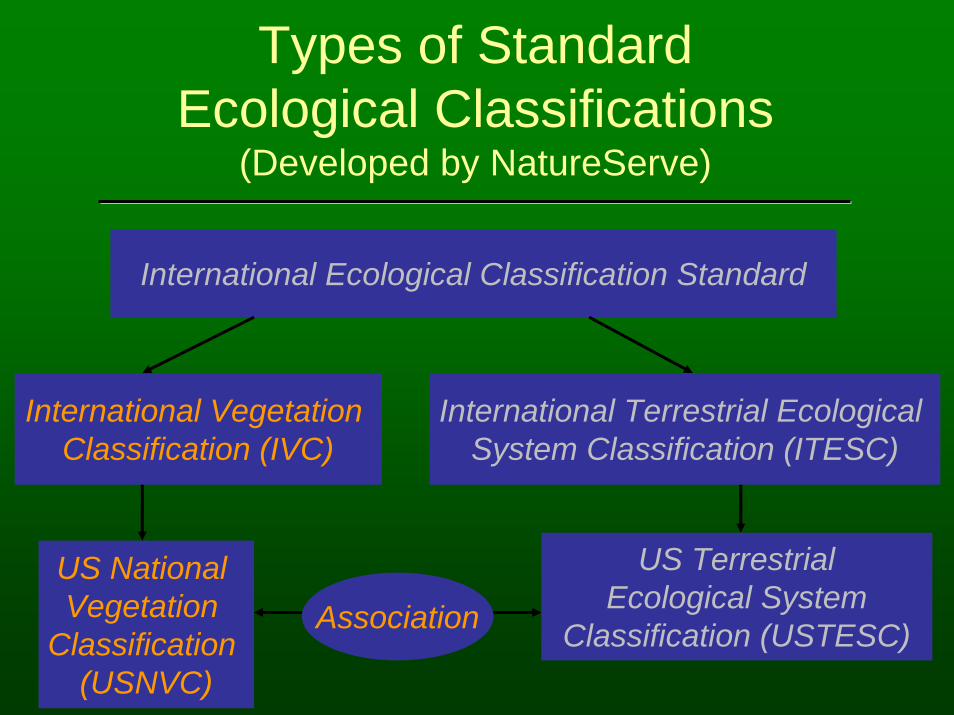
Types of Standard Ecological Classifications
(Developed by NatureServe)
International Ecological Classification Standard
International Vegetation Classification (IVC)
International Terrestrial Ecological System Classification (ITESC)
US National Vegetation
Classification (USNVC)
US TerrestrialEcological System
Classification (USTESC)Association
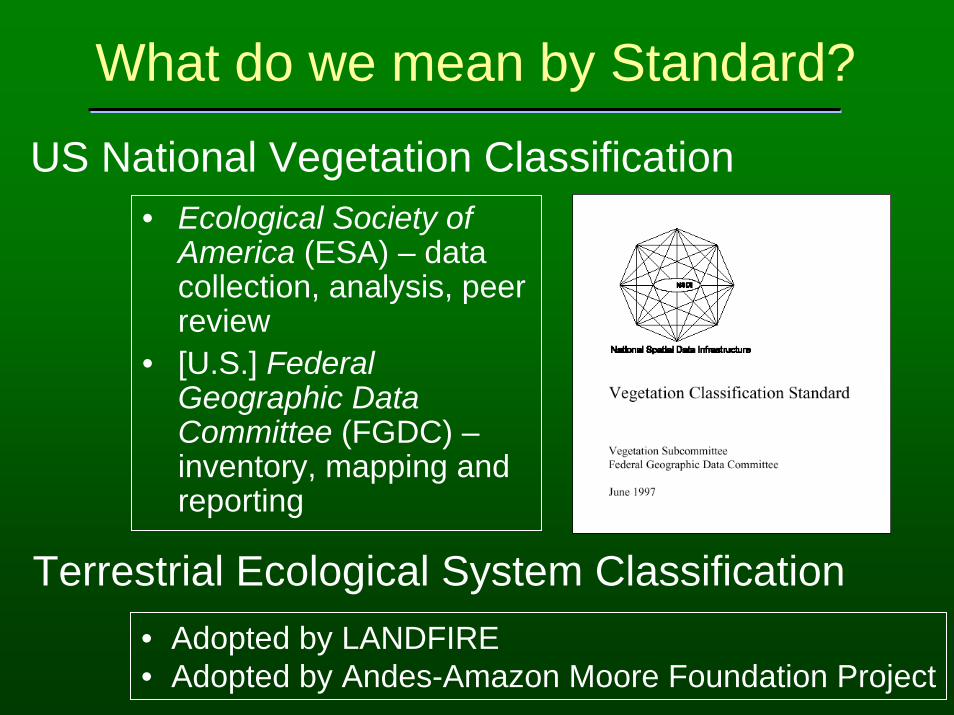
What do we mean by Standard?
• Ecological Society of America (ESA) – data collection, analysis, peer review
• [U.S.] Federal Geographic Data Committee (FGDC) –inventory, mapping and reporting
US National Vegetation Classification
Terrestrial Ecological System Classification• Adopted by LANDFIRE• Adopted by Andes-Amazon Moore Foundation Project
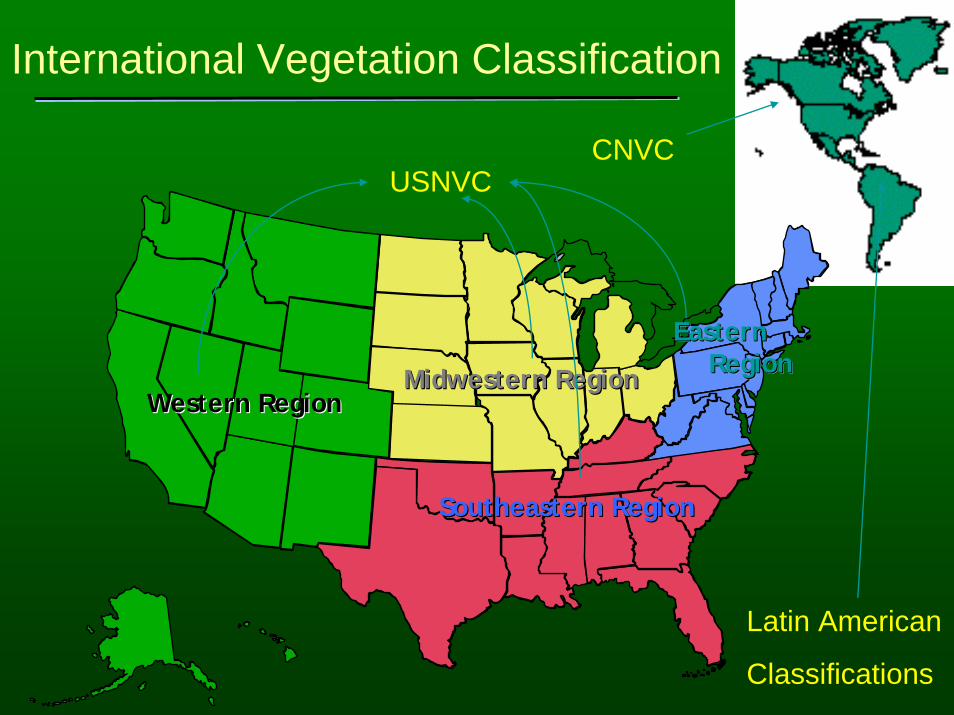
International Vegetation Classification
Southeastern RegionSoutheastern Region
Western RegionWestern Region
Eastern Region
Eastern Eastern RegionRegion
CNVC
Latin American
Classifications
Midwestern RegionMidwestern Region
USNVC

Forest (>60% treecanopy [>5 m])
Woodland (25-60% canopy)
Forest (>60% treecanopy [>5 m])
Woodland (25-60% canopy)
Herbaceous Nonvascular SparseHerbaceous Nonvascular Sparse
Shrubland (0.5-5m h.)
Dwarf-shrubland (<0.5 m h)
(<10%)(Dominant)(>10%)
(25-100% shrub canopy)
National Vegetation Classification Formation Classes

National Vegetation Classification, Association
AssociationStructure: a uniform physiognomy
Environment: veg. repeats under specific conditions
Floristics:consistent composition across all strata
•top stratum (>10% cover)
•dominant stratum(> 25% cover)
•site factors•disturbances•naturalness•biogeography
•dominant species•diagnostic (characteristic) species

Terrestrial Ecological SystemTerrestrial Ecological System
Group of associations that tend to coGroup of associations that tend to co--occur within landscapes occur within landscapes with similar ecological processes, substrates, and/or with similar ecological processes, substrates, and/or environmental gradients.environmental gradients.
Ecological Systems of Latin America and the Caribbean
A Working Classification of Terrestrial Systems

Types of Standard Ecological Classifications
(Developed by NatureServe)
International Ecological Classification Standard
International Vegetation Classification (IVC)
International Terrestrial Ecological System Classification (ITESC)
US National Vegetation
Classification (USNVC)
US TerrestrialEcological System
Classification (USTESC)Association
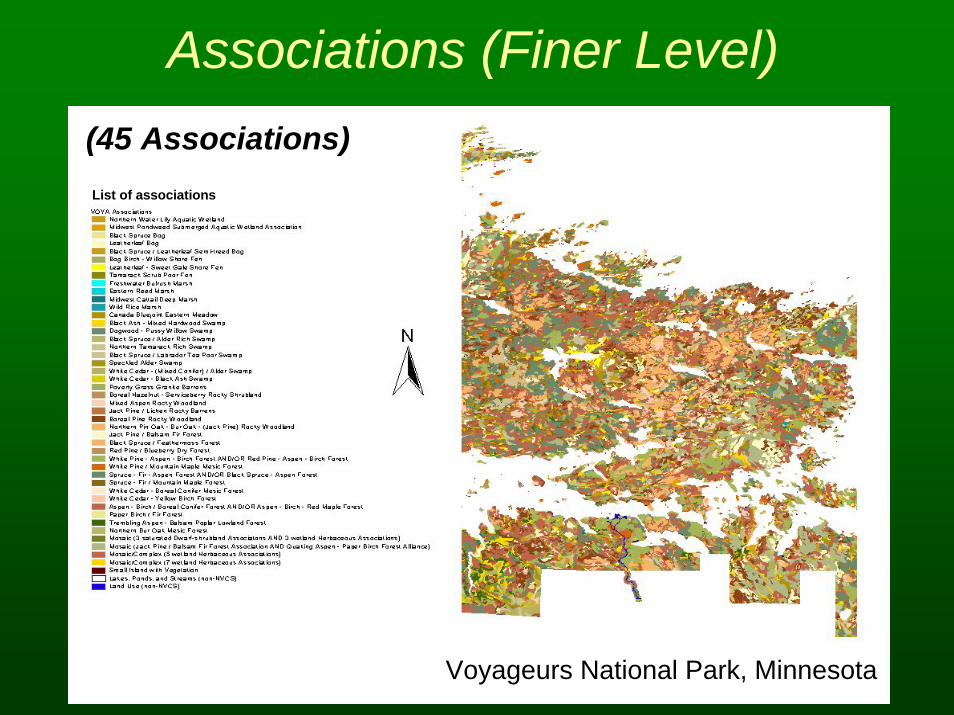
(45 Associations)
Voyageurs National Park, MinnesotaVoyageurs National Park, Minnesota
List of associations
Associations (Finer Level)

(20 Systems)
Voyageurs National Park, MinnesotaVoyageurs National Park, Minnesota
List of ecological systems
Ecological Systems (Coarser Level)
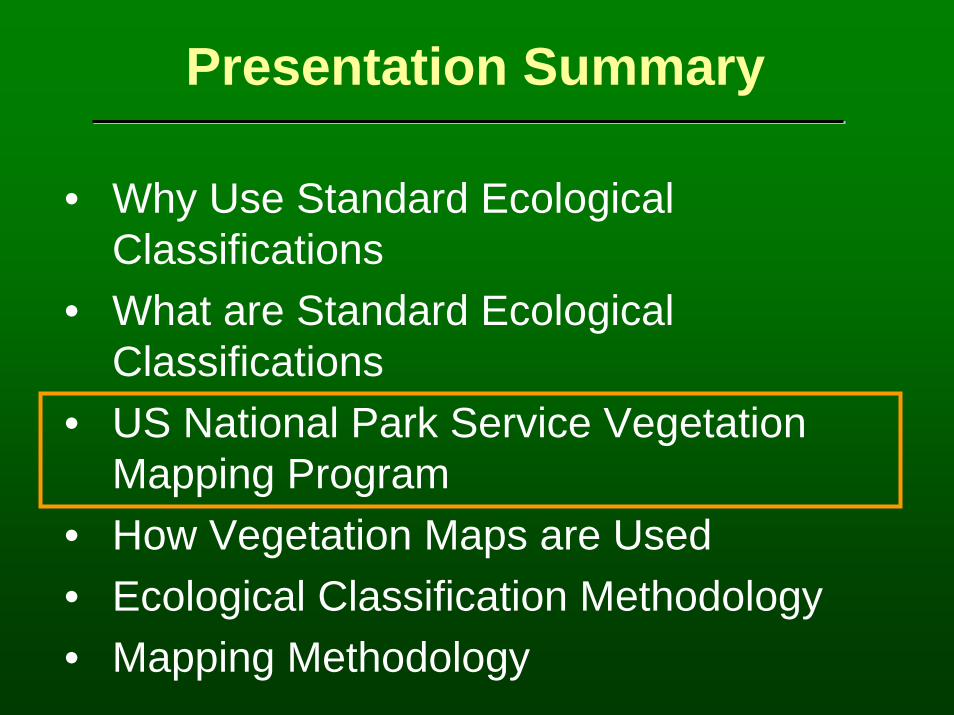
• Why Use Standard Ecological Classifications
• What are Standard Ecological Classifications
• US National Park Service Vegetation Mapping Program
• How Vegetation Maps are Used• Ecological Classification Methodology• Mapping Methodology
Presentation Summary
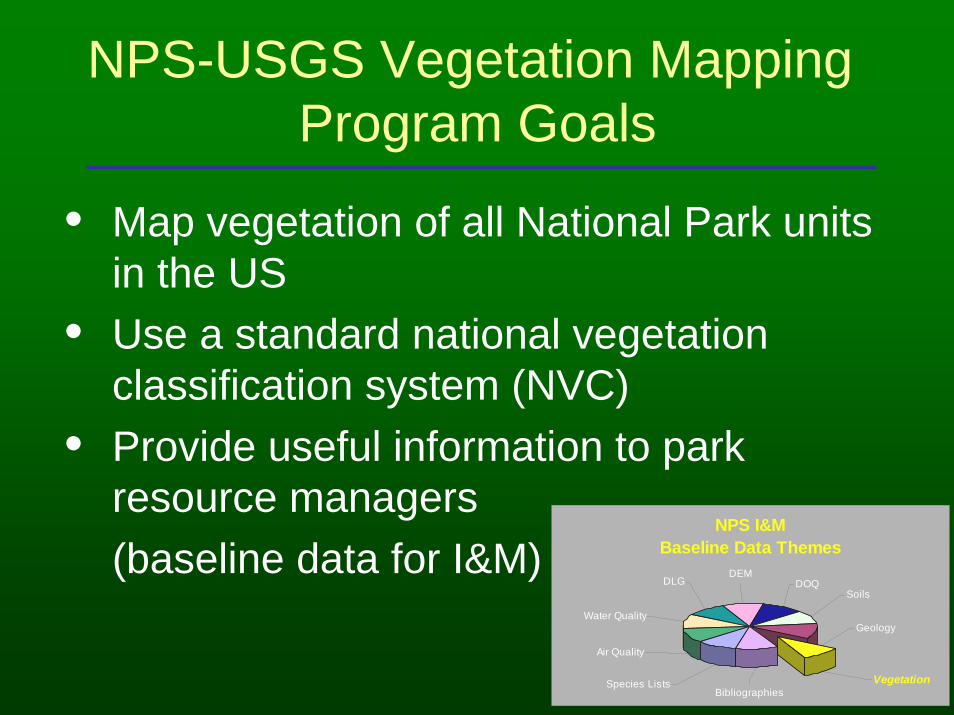
• Map vegetation of all National Park units in the US
• Use a standard national vegetation classification system (NVC)
• Provide useful information to park resource managers (baseline data for I&M)
NPS-USGS Vegetation Mapping Program Goals
NPS I&MBaseline Data Themes
Air Quality
Species Lists
Geology
SoilsDOQ
DEMDLG
Water Quality
BibliographiesVegetation
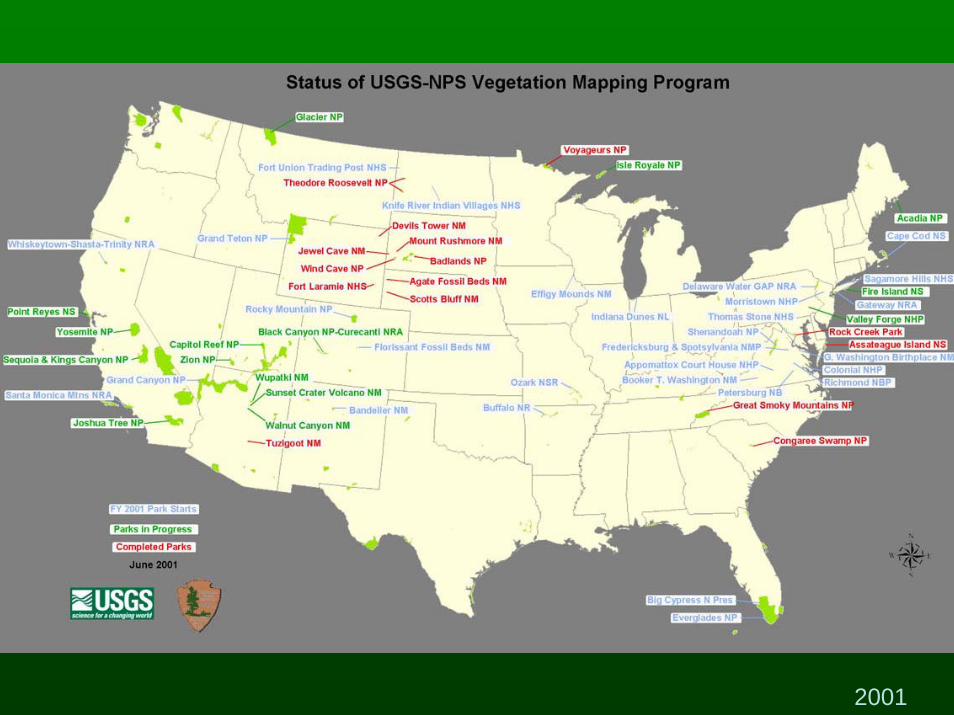
2001
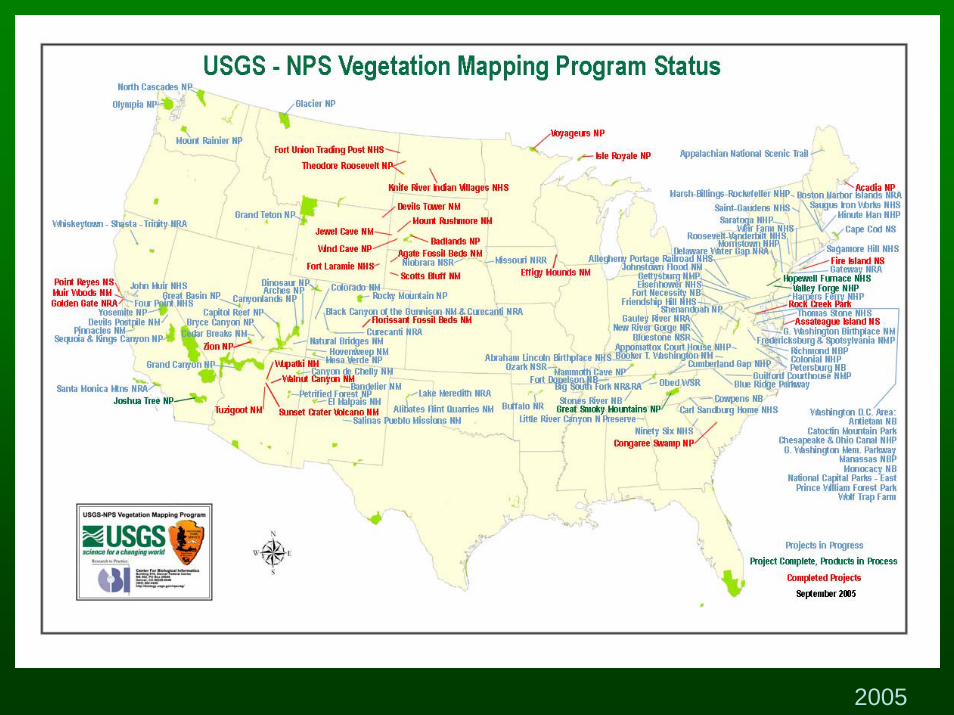
2005
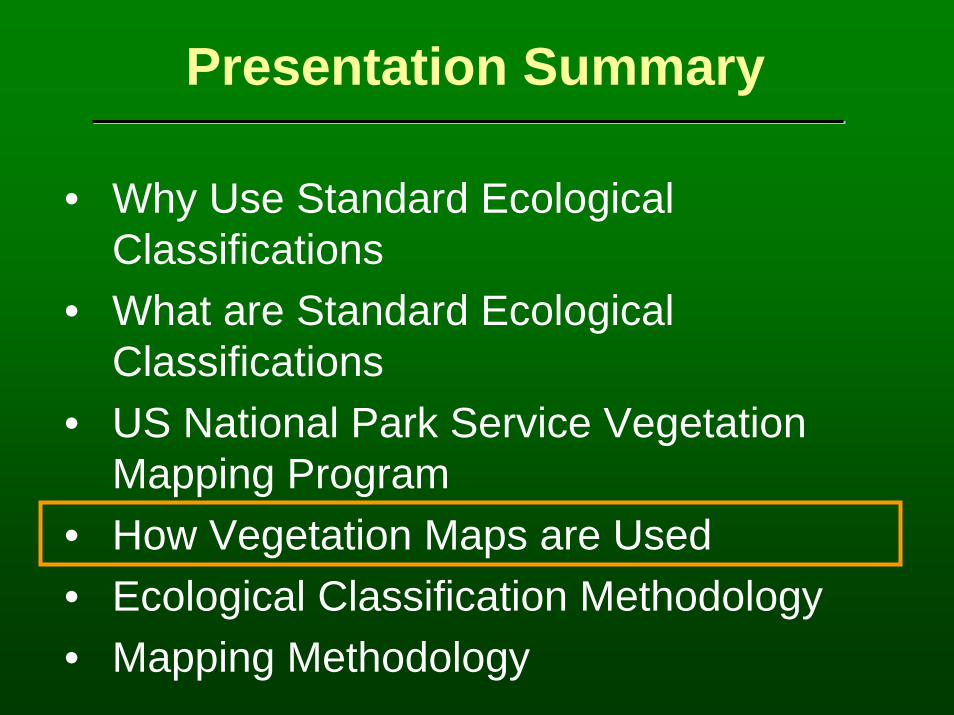
• Why Use Standard Ecological Classifications
• What are Standard Ecological Classifications
• US National Park Service Vegetation Mapping Program
• How Vegetation Maps are Used• Ecological Classification Methodology• Mapping Methodology
Presentation Summary
Why Classify and Map Vegetation?
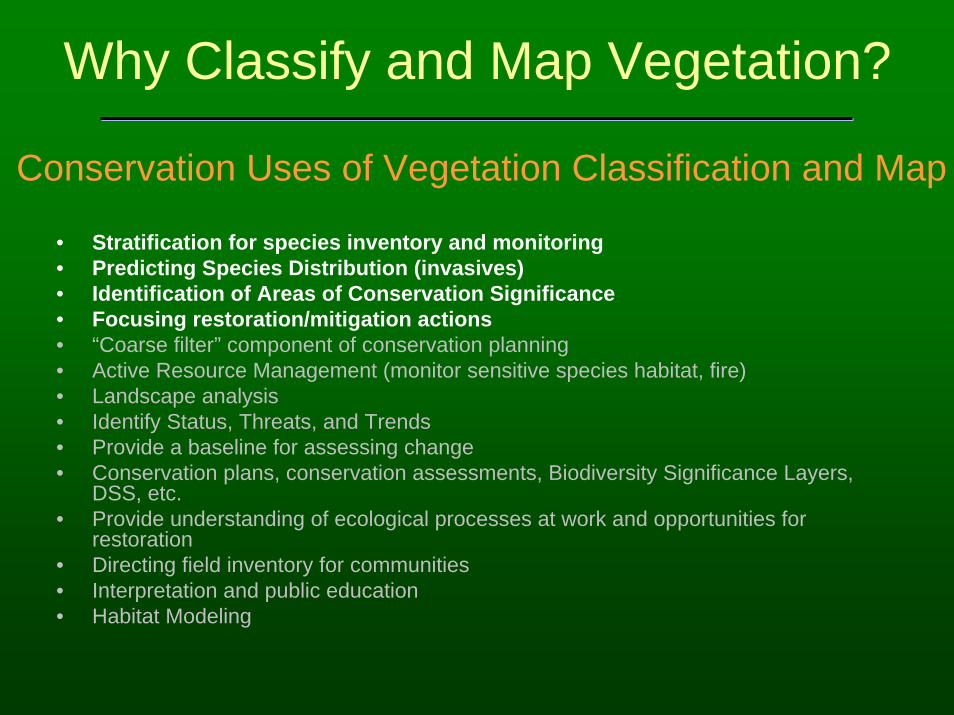
• Stratification for species inventory and monitoring • Predicting Species Distribution (invasives)• Identification of Areas of Conservation Significance• Focusing restoration/mitigation actions• “Coarse filter” component of conservation planning• Active Resource Management (monitor sensitive species habitat, fire)• Landscape analysis• Identify Status, Threats, and Trends• Provide a baseline for assessing change • Conservation plans, conservation assessments, Biodiversity Significance Layers,
DSS, etc.• Provide understanding of ecological processes at work and opportunities for
restoration• Directing field inventory for communities• Interpretation and public education• Habitat Modeling
Conservation Uses of Vegetation Classification and Map

Predict Bird Habitat And Stratify Sampling
Voyageurs National Park, MN
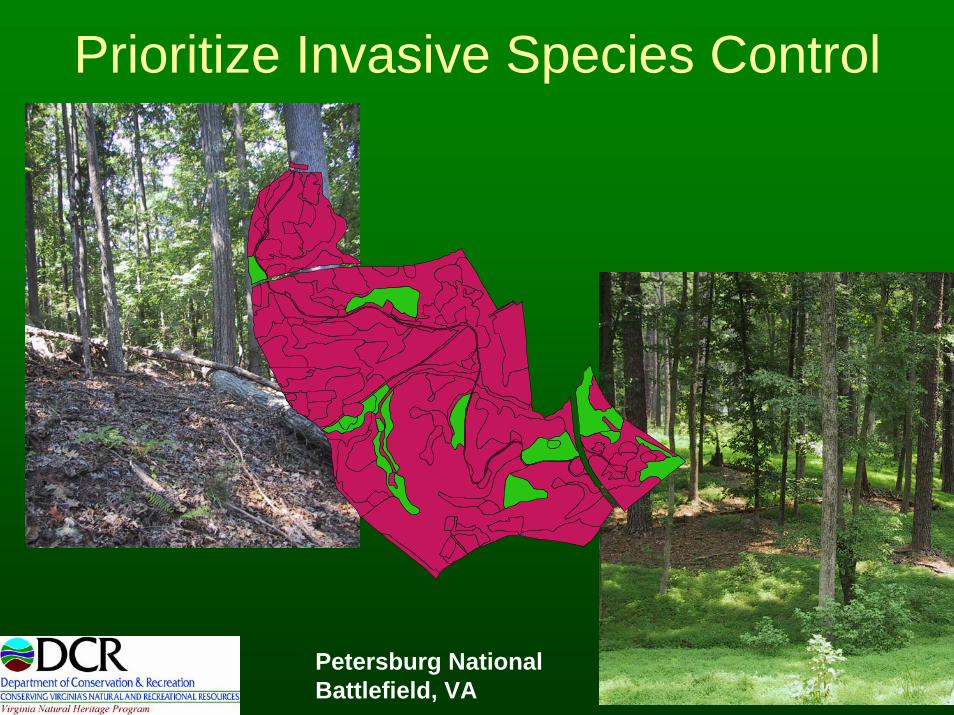
Prioritize Invasive Species Control
Petersburg National Battlefield, VA
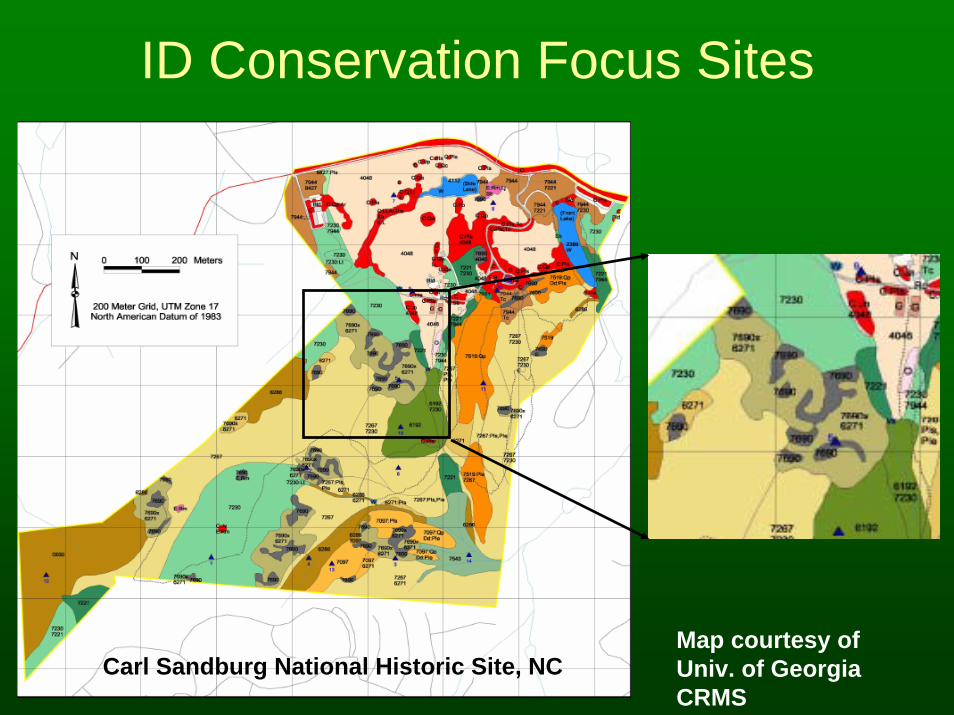
ID Conservation Focus Sites
Carl Sandburg National Historic Site, NCMap courtesy of Univ. of Georgia CRMS

Stone’s River National Battlefield, TN
Provide Understanding of Ecological Processes and Restoration Opportunities
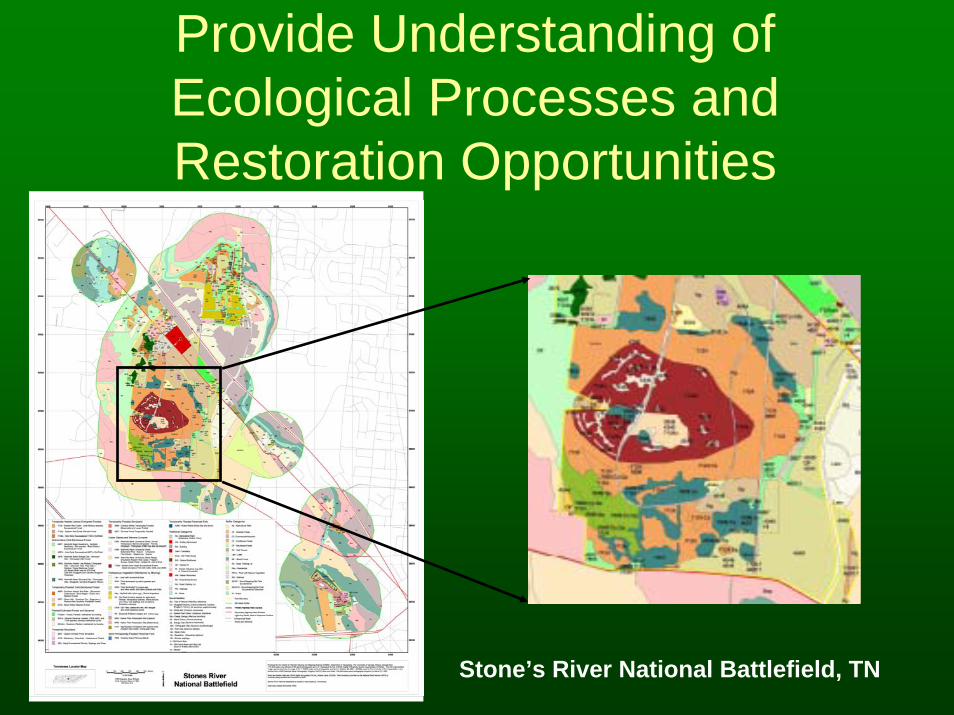
Stone’s River National Battlefield, TN
Provide Understanding of Ecological Processes and Restoration Opportunities
• Why Use Standard Ecological Classifications
• What are Standard Ecological Classifications
• US National Park Service Vegetation Mapping Program
• How Vegetation Maps are Used• Ecological Classification Methodology• Mapping Methodology
Presentation Summary
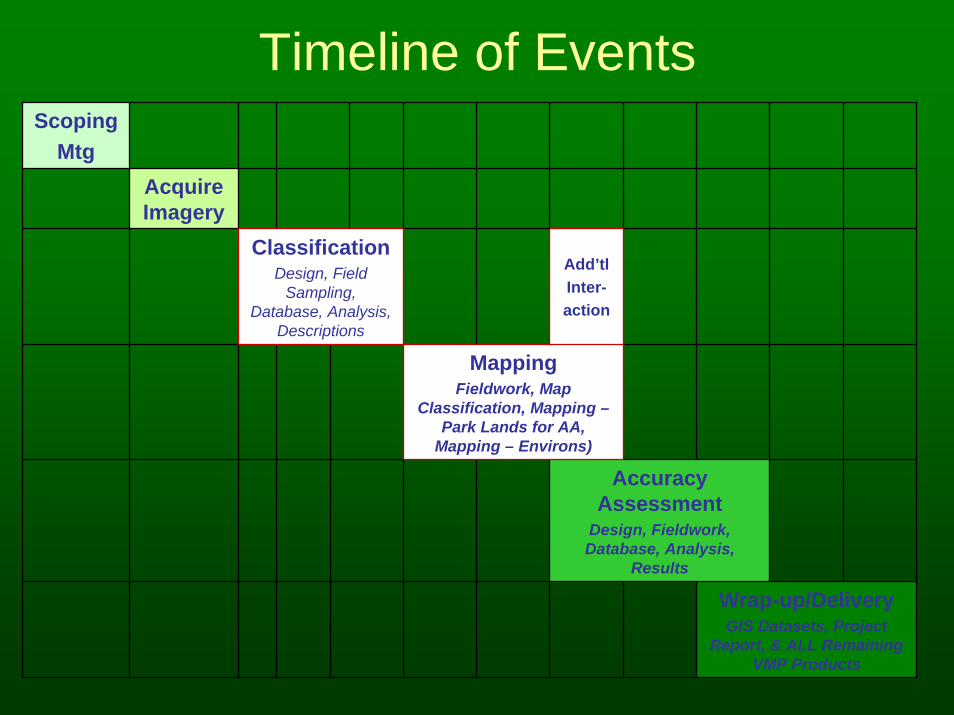
Timeline of EventsScoping
MtgAcquire Imagery
Classification Design, Field
Sampling, Database, Analysis,
Descriptions
Add’tlInter-action
MappingFieldwork, Map
Classification, Mapping –Park Lands for AA,
Mapping – Environs)
Accuracy Assessment
Design, Fieldwork, Database, Analysis,
Results
Wrap-up/DeliveryGIS Datasets, Project
Report, & ALL Remaining VMP Products
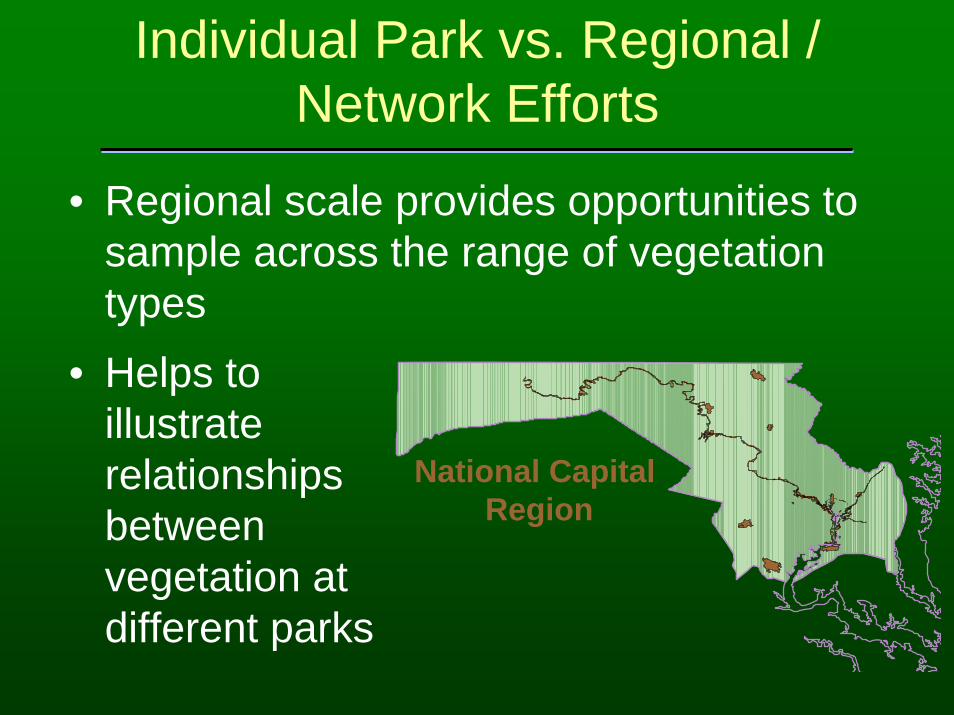
Individual Park vs. Regional / Network Efforts
• Regional scale provides opportunities to sample across the range of vegetation types
• Helps to illustrate relationships between vegetation at different parks
National Capital Region
Ecological Classification Process
• Identify sampling strategy• Collect data• Classify data• Describe vegetation types• Provide classification and location data to
photointerpreters• Classification (from analysis of field data)
and interpreted photography are mutually refined

Biophysical modeling to stratify sample locations
$Z
$Z
$Z
$Z
$Z
$Z$Z
$Z
$Z
$Z
$Z*Sample extension used to randomly locate points within stratification areas
DEM
DEM
Biotic Province
Land Position
Elevation
Land PositionOutput
Elevation Output
Reclassify
Reclassify
Reclassify ReclassedElevation
ReclassedLand
Position
ReclassedBiotic
Province
Combine StratifiedSample Areas Blue Ridge Parkway, NC

Vegetation data collected:• Cover of each plant species in
each layer• Diameter data for trees• Complete plant species lists• Plot layout follows guidelines but
may be adjusted for local circumstances
Insert community photo
Insert plant photo

Environmental Data Collected:
• Basic abiotic informationSlope, aspect, elevation, soil texture, soil drainage, topographic position
• Information on ecological processesFire, animal disturbance, wind throw, hydrologic effects
• General commentsPlot setting, nearby features that might affect plot (cliff, watercourse, road)

Classification Methods
• Hierarchical, agglomerative cluster analysis
Distance (Objec tive Func tion)
Information Remaining (% )
3.3E -02
100
1E + 01
75
2E + 01
50
3.1E + 01
25
4.1E + 01
0
BA NK.23CHA T.69TA LO.14TA LT.9TA LT.20TA LT.33CHA T.40TA LT.5TA LT.25TA LT.46CHA T.76TA LT.21TA LT.40TA LT.53TA LT.6TA LO.1TA LO.21TA LO.63TA LO.29TA LO.5TA LO.44TA LO.55TA LO.43TUSK.3TA LO.50TUSK.1TUSK.5BA NK.47CHA T.3OCON.17OCON.6OCON.30OCON.37CHA T.101CHER.17CHER.20CHER.34CHA T.50CHA T.61CHA T.83CHA T.59OCON.11CHER.26OCON.19OCON.20CHA T.56CHA T.63TA LO.26TA LO.68TA LO.57TA LT.23TA LT.1TA LT.8TA LT.30TA LT.34TA LO.17TA LO.20TA LO.45TA LO.49TA LT.14TA LT.15TA LT.36BA NK 33
ELEV
TOPPOS
BEDROCKBOULDER
pH
CaMg
P
Fe
Cu
B
-1.5
-1.5
-0.5 0.5 1.5
-0.5
0.5
1.5
Cove Forests
Axis 2
Axi
s 3
COMTYPERich Cove ForestAcidic Cove Forest
• Ordination Analysis• Summary Statistics

Mapping Process
• Acquire and use fine resolution imagery
• Match signatures to known types in the classification
• Delineate polygons
• Refine classification and polygon delineation (iterative process)

Photointerpretation / Automated Methods

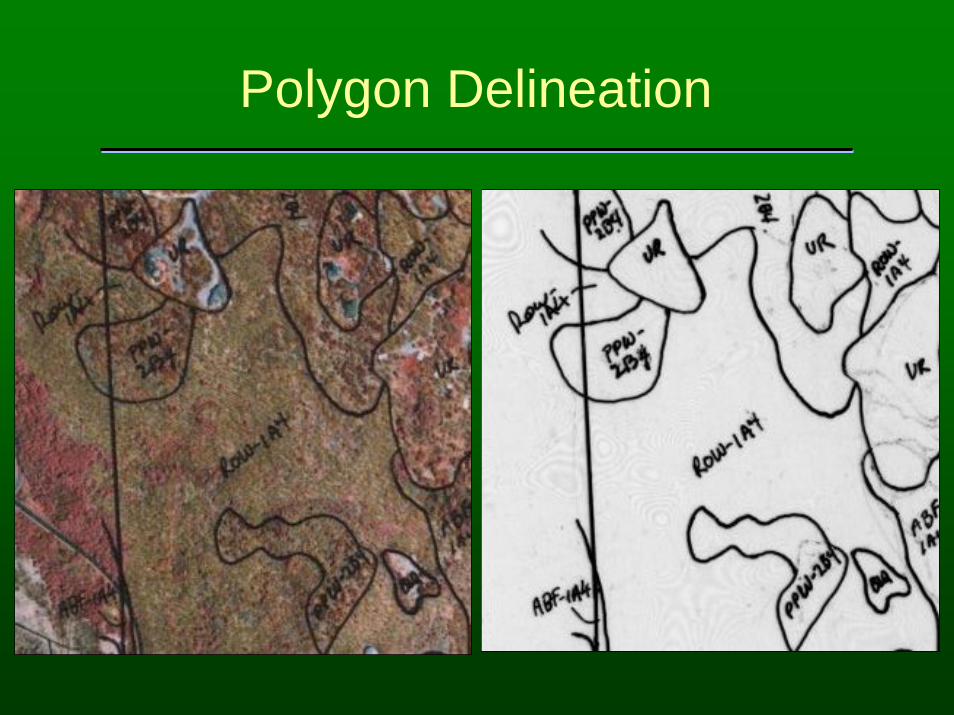
Polygon Delineation

Relating the Classification to the Imagery
Linking Field Sample Plots to remotely sensed data
Great Smoky Mountains, NC