mapping the materials universe - ulisboa · pdf fileto be oven dried before thermoforming) and...
TRANSCRIPT

New approaches to Materials Education - a course authored by Mike Ashby and David Cebon, Cambridge, UK, 2008
© MFA and DC 2008
Unit 3. Materials charts:
mapping the materials universe

2
Outline
• Exploring relationships: bar charts and bubble charts
• Hands-on session 2, with exercises
• Elementary selection
• Making charts
• Report writing

3
Relationships, perspective and comparisons
l Material bar-charts l Material property charts
Data sheets do not allow comparison, perspective. For these we need
Metals Polymers Ceramics Hybrids
PEEK PP
PTFE
WC
Alumina
Glass
CFRP
GFRP
Fibreboard
Youn
g’s
mod
ulus
, GPa
Steel
Copper
Lead Zinc
Aluminum
103
10-3
10-2
10-1
102
10
1
Log scale
Many decades

4
UntitledMaterials:\METALS Materials:\POLYMERS Materials:\CERAMICS and GLASSES Materials:\COMPOSITES
Youn
g's M
odul
us (G
Pa)
1e-004
1e-003
0.01
0.1
1
10
100
1000
Low alloy steel
Mg-alloysAl-alloys
Zn-alloys
Ti-alloys
Cu-alloys
Stainless steelHigh carbon steel
Acetal, POM
Polyurethane
EVA
IonomerPTFE
WC
Alumina
Glass CeramicSilica glass
Soda-Lime glassPolyester, rigid
PC
PSPURPE
ABS
PP
BCSiC
Al-SiC Composite
CFRP
KFRP
GFRP
Plywood
Neoprene
Natural Rubber (NR)
CompositesPolymersMetals Ceramics & glass
Youn
g’s
mod
ulus
(G
Pa)
Metals Polymers Ceramics Hybrids
Bar- chart created with CES (Level1)
Results X pass
Material 1 830 Material 2 720 Material 3 705 Material 4 679 etc...
Ranking on Modulus

5
Material property- charts: modulus - density
Families occupy discrete fields
Log scales

6
Bubble chart created with CES
Results X pass
Material 1 830 113 Material 2 720 300 Material 3 705 5.6 Material 4 679 47 etc...
Ranking Modulus Density

7
Why the differences? • Atom size and weight • Bonds as (linear) springs • Spring constant for various bond types.
Manipulating properties • Making composites • Making foams
Exploring the science: mechanical properties
8
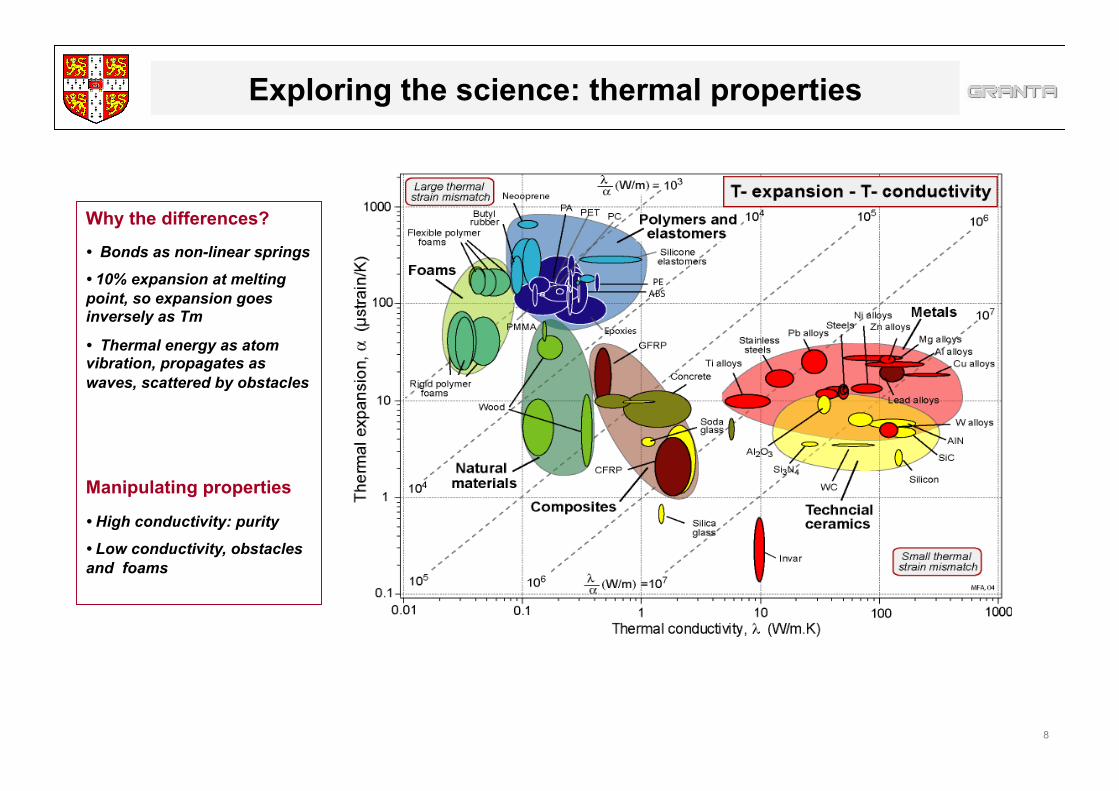
Why the differences?
• Bonds as non-linear springs
• 10% expansion at melting point, so expansion goes inversely as Tm
• Thermal energy as atom vibration, propagates as waves, scattered by obstacles
Manipulating properties
• High conductivity: purity
• Low conductivity, obstacles and foams
Exploring the science: thermal properties

9
The chart-management tool bar
Line selection tool
Box selection tool
Cancel selection
Add text
Zoom Add
envelopes
Un-zoom
Black and white chart
Hide failed materials
Grey failed materials
Add grid

10
Elementary selection
At this stage students have a tool.
l Materials with high stiffness?
l Materials with low stiffness?
Metals Polymers Ceramics Hybrids
PEEK
PP
PTFE
WC
Alumina
Glass
CFRP
GFRP
Fibreboard
Youn
g’s
mod
ulus
, GPa
Steel
Copper
Lead
Zinc
Aluminum
103
10-3
10-2
10-1
102
10
1
Metals Polymers Ceramics Hybrids
PEEK
PP
PTFE
WC
Alumina
Glass
CFRP
GFRP
Fibreboard
Metals Polymers Ceramics HybridsMetals Polymers Ceramics Hybrids
PEEK
PP
PTFE
PEEK
PP
PTFE
WC
Alumina
Glass
WC
Alumina
Glass
CFRP
GFRP
Fibreboard
CFRP
GFRP
Fibreboard
Youn
g’s
mod
ulus
, GPa
Steel
Copper
Lead
Zinc
Aluminum
Steel
Copper
Lead
Steel
Copper
Lead
Zinc
Aluminum
103
10-3
10-2
10-1
102
10
1
l Materials with high conductivity?
l Materials with low expansion?

11
Creating charts
Browse Select Search Print Search web Toolbar
File Edit View Select Tools
2. Selection Stages
Graph Limit Tree
1. Selection data Pick a selection template
Prop
erty
Bar chart
Prop
erty
2
Property 1
Bubble chart Results X pass
Material 1 830 113 Material 2 720 300 Material 3 705 5.6 Material 4 679 47 etc...
Ranking Prop 1 Prop 2

12
X-axis Y-axis
List of properties § Density § Modulus § Yield strength § etc
Advanced
Charts with functions of properties
Browse Select Search Print Search web
File Edit View Select Tools
List of properties § Density § Modulus § Yield strength § etc
+ - * / ^ ( )
Modulus Density /
2. Selection Stages
Graph Limit Tree
1. Selection data Edu Level 2: Materials

13
Report writing
File Edit View etc
Open project
Save project
Print …….
Cut
Copy
Paste….
Clip- board
What is it? ABS (Acrylonitrile-butadiene-styrene ) is tough, resilient, and easilymolded. It is usually opaque, although some grades can now be transparent, and itcan be given vivid colors. ABS-PVC alloys are tougher than standard ABS and, inself-extinguishing grades, are used for the casings of power tools.
Design guidelines. ABS has the highest impact resistance of all polymers. Ittakes color well. Integral metallics are possible (as in GE Plastics' Magix.) ABS is UVresistant for outdoor application if stabilizers are added. It is hygroscopic (may needto be oven dried before thermoforming) and can be damaged by petroleum-basedmachining oils.ABS can be extruded, compression moulded or formed to sheet that is then vacuumthermo-formed. It can be joined by ultrasonic or hot-plate welding, or bonded withpolyester, epoxy, isocyanate or nitrile-phenolic adhesives.
Technical notes. ABS is a terpolymer - one made by copolymerising 3 monomers: acrylonitrile, butadiene and syrene. Theacrylonitrile gives thermal and chemical resistance, rubber-like butadiene gives ductility and strength, the styrene gives aglossy surface, ease of machining and a lower cost. In ASA, the butadiene component (which gives poor UV resistance) isreplaced by an acrylic ester. Without the addition of butyl, ABS becomes, SAN - a similar material with lower impactresistance or toughness. It is the stiffest of the thermoplastics and has excellent resistance to acids, alkalis, salts and manysolvents.
Typical Uses. Safety helmets; camper tops; automotive instrument panels and other interior components; pipe fittings;home-security devices and housings for small appliances; communications equipment; business machines; plumbinghardware; automobile grilles; wheel covers; mirror housings; refrigerator liners; luggage shells; tote trays; mower shrouds; boathulls; large components for recreational vehicles; weather seals; glass beading; refrigerator breaker strips; conduit; pipe fordrain-waste-vent (DWV) systems.
The environment. The acrylonitrile monomer is nasty stuff, almost as poisonous as cyanide. Once polymerized withstyrene it becomes harmless. ABS is FDA compliant, can be recycled, and can be incinerated to recover the energy itcontains.

14
The main points
• Visual presentation of data as bar-charts and property (bubble) charts reveals relationships and allows comparisons
• CES allows a wide range of charts to be constructed
• Box selection tool allows elementary selection
• There are comprehensive report-writing facilities

15
Exercises: Making bar charts
File Edit View Select Tools3.1 Make a bar chart with Fracture toughness on the Y-axis using Level 1, Materials
§ Click on Select and proceed as shown opposite
§ Label two (or more) materials by clicking on the bars. § Find the bar for Magnesium alloys (right click on name in
Browse and select “Highlight”).
§ Change the name to Mg-alloys and make the font larger (right click on name on the bar chart and select “Rename” to change the name and “Format” to change font size, color etc).
§ Use the BOX selection tool to find the four materials with the highest values of fracture toughness. (Answer: Low alloy steels, Nickel alloys, Stainless steels, Titanium alloys).
§ Change the UNITS from Metric to Imperial or vice versa (Tools – Options – Units – US Imperial / Metric)
Browse Select Search
X-axis Y-axis
List of properties Density Modulus Fracture toughness etc
2. Selection Stages
Graph Limit Tree
1. Selection data
Edu Level 2: MaterialsEdu Level 2: Materials
Browse Select Search
X-axis Y-axis
List of properties Density Modulus Fracture toughness etc
X-axis Y-axis
List of properties Density Modulus Fracture toughness etc
2. Selection Stages
Graph Limit Tree
2. Selection Stages
Graph Limit Tree
1. Selection data
Edu Level 2: MaterialsEdu Level 2: MaterialsEdu Level 2: MaterialsEdu Level 2: Materials
16
Exercises: Making bubble charts
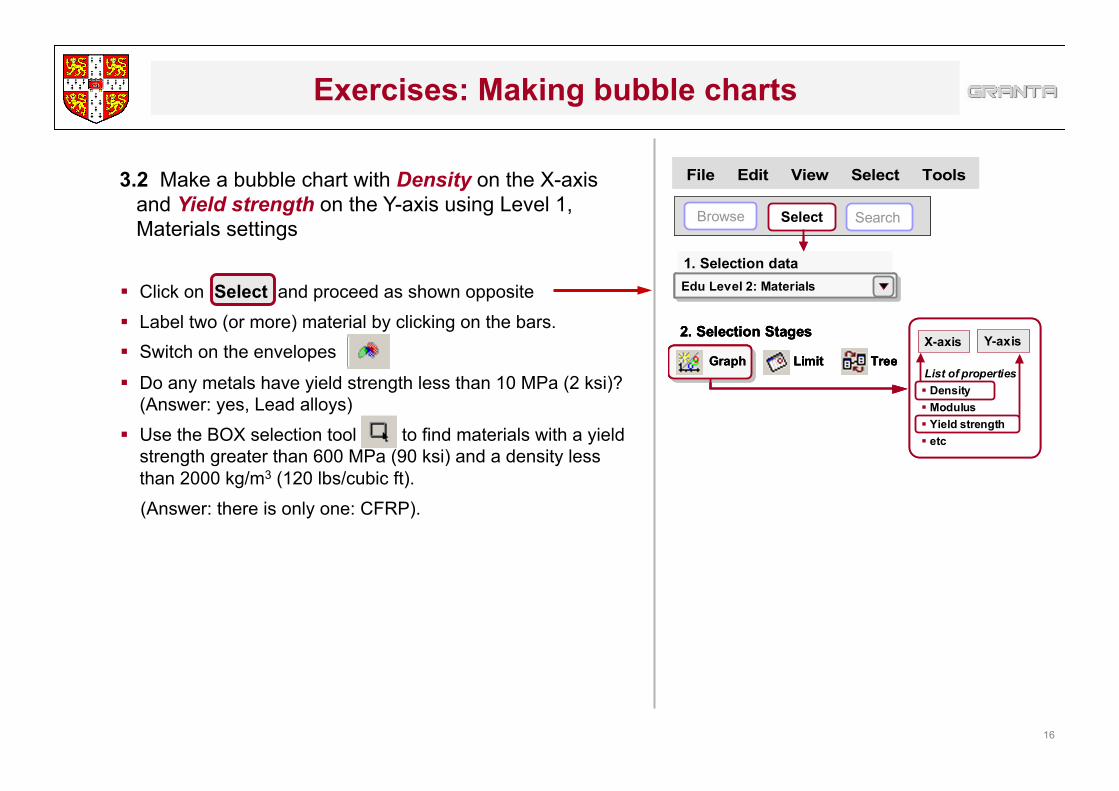
3.2 Make a bubble chart with Density on the X-axis and Yield strength on the Y-axis using Level 1, Materials settings
§ Click on Select and proceed as shown opposite
§ Label two (or more) material by clicking on the bars. § Switch on the envelopes
§ Do any metals have yield strength less than 10 MPa (2 ksi)? (Answer: yes, Lead alloys)
§ Use the BOX selection tool to find materials with a yield strength greater than 600 MPa (90 ksi) and a density less than 2000 kg/m3 (120 lbs/cubic ft).
(Answer: there is only one: CFRP).
Browse Select Search
X-axis Y-axis
List of properties Density Modulus Yield strength etc
2. Selection Stages
Graph Limit Tree
1. Selection data
Edu Level 2: MaterialsEdu Level 2: Materials
Browse Select Search
X-axis Y-axis
List of properties Density Modulus Yield strength etc
2. Selection Stages
Graph Limit Tree
2. Selection Stages
Graph Limit Tree
1. Selection data
Edu Level 2: MaterialsEdu Level 2: MaterialsEdu Level 2: MaterialsEdu Level 2: Materials
File Edit View Select Tools
17
Exercises: Making functions of properties
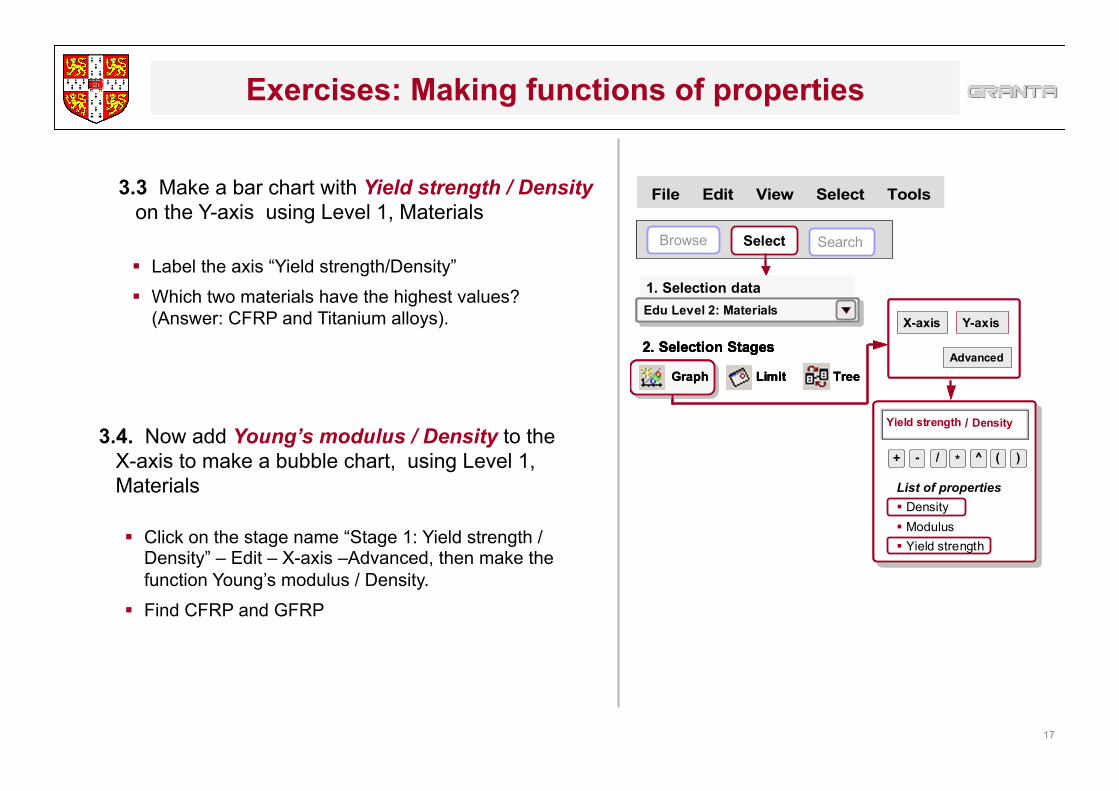
3.3 Make a bar chart with Yield strength / Density on the Y-axis using Level 1, Materials
§ Label the axis “Yield strength/Density”
§ Which two materials have the highest values? (Answer: CFRP and Titanium alloys).
3.4. Now add Young’s modulus / Density to the X-axis to make a bubble chart, using Level 1, Materials
§ Click on the stage name “Stage 1: Yield strength / Density” – Edit – X-axis –Advanced, then make the function Young’s modulus / Density.
§ Find CFRP and GFRP
List of properties Density Modulus Yield strength
+ - */ ^ ( )
Yield strength Density/
Browse Select Search
1. Selection dataEdu Level 2: MaterialsEdu Level 2: Materials
X-axis Y-axis
Advanced2. Selection Stages
Graph Limit Tree
List of properties Density Modulus Yield strength
+ - */ ^ ( )
Yield strength Density/
List of properties Density Modulus Yield strength
+ - */ ^ ( )+ - */ ^ ( )
Yield strength Density/
Browse Select Search
1. Selection dataEdu Level 2: MaterialsEdu Level 2: MaterialsEdu Level 2: MaterialsEdu Level 2: Materials
X-axis Y-axis
Advanced
X-axis Y-axis
Advanced2. Selection Stages
Graph Limit Tree
2. Selection Stages
Graph Limit Tree
File Edit View Select Tools

18
Exercises: Report writing
3.5 A manufacturer is concerned that the materials he uses have a high CO2 footprint. He wishes to know which metals have the lowest footprint, per unit weight and per unit volume. Write a brief report advising him on this, with a record for one metal with a particularly low CO2 footprint.
§ Make a bar-chart of CO2 footprint per unit weight. Label some of the materials Copy and paste it into WORD (use Edit – Paste special – Device independent bitmap).
§ Copy a record for one of the materials with a low value of CO2/kg and paste that into the same document.
§ Reformat the document until it has the form you want.
CO
2 fo
otpr
int (
kg/k
g)
0.2
0.5
1
2
5
10
20
50
Cast iron, ductile (nodular)
Cast iron, gray
Zinc alloys
Lead alloysAlumina
Magnesium alloys
Aluminum alloys
Titanium alloysCast iron, ductile (nodular) Eco properties Embodied energy 16.4 -18.2 MJ/kg CO2 footprint 0.97-1.07 kg/kg Recycle True
File Edit View etc
Cut
Copy
Paste….
Clip-board
Paste into a WORD
document