mapping shoreline changes due land reclamation...
TRANSCRIPT
MAPPING SHORELINE CHANGES DUE LAND RECLAMATION USING
LANDSAT TM DATA
JAMAAH BINTI HJ. SEKON
UNIVERSITI TEKNOLOGI MALAYSIA
MAPPING SHORELINE CHANGES DUE LAND RECLAMATION USING
LANDSAT TM DATA
JAMAAH BINTI HJ. SEKON
A thesis submitted in fulfillment of the
requirements for the award of the degree of
Master of Science (Geoinformatics)
Faculty of Geoinformation and
Real Estate
Universiti Teknologi Malaysia
JANUARY 2017
v
Specially dedicated to Mak and Bapak,
I really miss both of you.
Al-Fatihah.
To my siblings, Ruziana Sekon, Ruziani Sekon and Saadiah Sekon, thank you for the
love and warmest support.
To my lovely friends, Siti Nurhidayah Ramli, Fatin Hanani and Nurul Jannah thank
you for the patience and support.

vi
ACKNOWLEDGEMENT
BISMILLAHIRRAHMANIRRAHIM
In the Name of Allah, the Most Beneficent, the Most Merciful. Alhamdulillah
praises to Allah for giving a gracious and well-being to His servants. On the consent of
Allah, let me complete this thesis to fulfil the Master of Science (Geoinformatics).
Hopefully what I'm doing all blessed.
I wish to express my deepest appreciation to my supervisor Prof. Dr. Mazlan Bin
Hashim for the kindness in helping me in one ways or another, to complete this project.
Through the expert guidance, I was able to overcome all the obstacles that I encountered
in these to my project. In fact, my supervisor always gave me immense hope every time I
consulted to come over problems relating to my project.
Thank you.

vii
ABSTRACT
Remote sensing sources very useful to capture continuous, repeatedly and recently
data. Change detection technique using various type of satellite images in Remote Sensing
have been using frequently and continuously previously. Edge change detection used is very
sensitive to detect linear feature such as shoreline. Mapping shoreline changes due to only
coastal reclamation for urban development purposes are using edge change detection
technique in Envi 5.0 software and ArcGIS 10.2 for develop the databases. In order to
mapping this changes, images pre-processing, filtering option until feature extraction stage
will been used. Geographical Information System (GIS) as a tool for data input either spatial
or attribute, data management, data display and manipulation. Therefore, both Remote
Sensing and GIS known as a powerful approach to gather new information from primer to
secondary data. New information will be tested by statistical of filtering and feature extraction
technique and accuracy of Ground Control (GC) distortions. This testing will be produced
very accurate of coastal changes area and shoreline changes due to coastal reclamation for
urban development purposes.

viii
ABSTRAK
Kaedah pengumpulan data menggunakan Remote Sensing sangat berguna bagi
mendapatkan data yang berterusan, berulang dan terkini. Pendekatan yang digunapakai
untuk mengesan perubahan menggunakan pelbagai jenis imej satelit dalam Remote
Sensing sebelum ini sememangnya sering digunakan secara berpanjangan. Mengesan
perubahan kawasan pinggir atau tepian pantai merupakan satu kaedah yang sangat sensitif
terhadap kajian untuk mengesan garisan pantai. Teknik ini juga sesuai untuk memetakan
perubahan garisan pantai yang berlaku disebabkan faktor penambakan tanah pinggir
pantai untuk tujuan pembangunan bandar baru, menggunakan perisian ENVI 5.2 untuk
memproses imej Landsat TM 7 dan perisian ArcGIS 10.2 untuk membangunkan
pangkalan data. Bagi memetakan perubahan ini, fasa pra-pemprosesan imej, pilihan teknik
untuk tujuan penapisan imej sehingga penguraian data dalam imej Landsat TM 7 akan
digunakan dalam kajian ini. Manakala, Sistem Maklumat Geografi (GIS) pula berfungsi
sebagai alat untuk mengumpul data spatial dan attribut, menguruskan data, memaparkan
data dan memanipulasi data. Maka, samaada Remote Sensing atau GIS, kedua-duanya
amat penting untuk mengumpul data baru daripada data utama menjadi data sekunder.
Data baru ini akan di uji ketepatannya menggunakan kaedah statistik penyaringan, statistik
penguraian data dan ujian ketepatan berdasarkan selisih yang dibenarkan dalam dua belas
(12) titik kawalan di bumi yang telah dipilih. Ujian ini seterusnya akan menghasilkan
ketepatan yang tinggi dalam proses memetakan perubahan kawasan pinggir pantai dan
perubahan garisan pantai kesan daripada aktiviti penambakan bertujuan untuk
pembangunan bandar baru.

ix
TABLE OF CONTENTS
CHAPTER TITLE PAGE
DECLARATION i
DEDICATION v
ACKNOWLEDGEMENTS vi
ABSTRACT vii
ABSTRAK viii
TABLE OF CONTENTS ix
LIST OF TABLES xiii
LIST OF FIGURES xiv
LIST OF ABBREVIATIONS xix
1 INTRODUCTION 1
1.1 Background of Study 1
1.2 Problem Statement 3
1.3 Aim and Objectives of Study 3
1.4 Study Question 4
1.5 Scope of Study 4
1.6 Study Area 5
2 LITERATURE REVIEW 7
2.1 Introduction 7
2.2 Shoreline Mapping 9

x
2.2.1 Shoreline Changes Due to Land Reclamation
Mapping Using Remote Sensing
12
2.2.2 Semi-Automatics Approach of Feature
Extraction for Shoreline Reclamation
Mapping
14
2.3 Assessment of Shoreline Extraction 15
2.4 Shoreline Changes Detection and Analysis 15
2.4.1 Overlaying Line Maps Extracted from
Multispectral Data – High Resolution, and
Intermediate Images
16
2.5 Summary 17
3 METHODOLOGY 18
3.1 Introduction 18
3.2 Materials and Method 18
3.2.1 Satellite data and Ancillary data 18
3.3 Methods 19
3.4 Study Phases 22
3.4.1 Identify the Characteristics of Shoreline
Change
22
3.4.1.1 Pre-processing image 22
3.4.1.2 Ground Control Point (GCP) 36
3.4.1.3 Edge Filter 38
3.4.1.4 Feature Extraction 50
3.4.2 Identify the Spectral Bands Inherent Properties 52
3.4.2.1 Spectral Bands Criteria 52
xi
3.4.2.2 Spectral Bands Classification 54
3.4.3 Maintain Geometrically on Ground Control
Point
55
3.4.4 Mapping Shoreline Extracted from Remote
Sensing Data into Corresponding GIS Spatial
Database
56
3.4.4.1 Data input 57
3.4.4.2 Data Management 63
3.4.4.3 Data Display 64
3.4.4.4 Data Manipulation 65
3.5 Summary 66
4 RESULT AND DISCUSSION 67
4.1 Introduction 67
4.2 Result analysis 67
4.2.1 Examine and analyse linear feature extraction 67
4.2.1.1 Examine spectral bands inherent
properties in identifying shoreline changes
73
4.2.2 Result assessment 74
4.2.2.1 Accuracy examine of selected linear
feature
74
4.2.2.2 Shoreline changes due to reclamation
at medium resolution data into corresponding GIS
spatial database
77
4.3 Discussion 86
4.4 Summary 87
xii
5 CONCLUSION 88
5.1 Conclusion 88
5.2 Recommendation 89
REFERENCES 90

xiii
LIST OF TABLE
TABLE NO TITLE PAGE
3.1 Study Data Used 20
3.2 Wavelength Bands in The Landsat 7 Sensor 52
3.3 Usage of Landsat 7 Bands 53
3.4 Gantt Chart 66
4.1 Filter type use analysis 68
4.2 RMS error of Landsat 7 (1996, 2006 and 2016)
using 1st Order Polynomial (Affine) Transformation
75
4.3 Surroundings area affected of shoreline changes
identification
77
4.4 Changes area of urban development 81
4.5 Shoreline changes coordinate due to coastal reclamation 84
4.6 Shoreline changes distance due to coastal reclamation 85

xiv
LIST OF FIGURE
FIGURE NO TITLE PAGE
1.1 Country Garden, Danga Bay and RNF Tg. Puteri, Johor
Straits boundary
6
2.1 Spatial relationship of shoreline indicators sketch) 9
2.2 Level of sea tidal datum (NOAA, 2004) 10
3.1 Flowchart of the Study 21
3.2 Open ENVI 5.2, in Toolbox choose ‘Radiometric
Correction’, then choose ‘Atmospheric Correction’ and
then choose ‘Radiometric Calibration’
23
3.3 File selection dialog box shown above, choose
‘Multispectral’ file and choose ‘Calibration Type’ with use
‘Reflectance’. ‘Apply FLAASH Setting’ is method to done
Atmospheric Correction
23
3.4 Output of ‘Radiometric Correction’ process 24
3.5 Before radiometric correction with band changes from
existing to band 2, band 3 and band 4 file display
24
3.6 Ref_96.dat file display with band changes from existing to
band 3, band 2 and band 1
25
3.7 ‘Dark Subtraction’ process for ‘Ref_96.dat’ file display
with band changes from existing to band 3, band 2 and
band 1. This process purpose is to clearly images with less
black images view
25
3.8 Dark_96.dat file display with band changes from existing
to band 3ref_96, band 2ref_96 and band 1ref_96
26

xv
3.9 ‘Dark Subtraction’ process for ‘Ref_96.dat’ file display
with band changes from existing to band 3, band 2 and
band 1. This process purpose is to clearly images with less
black images view
26
3.10 ‘Save as’ ‘radiometric_corr_2006’ file with ‘Save File As
Parameters’ and ‘TIFF’ output format
27
3.11 Final output of Atmospheric Correction and Radiometric
Correction process for Landsat 1996
28
3.12 Before atmospheric correction and radiometric correction
with band changes from existing to band 2, band 3 and
band 4 file display
28
3.13 Final output of Atmospheric Correction and Radiometric
Correction process for Landsat 2006
29
3.14 Before atmospheric correction and radiometric correction
with band changes from existing to band 2, band 3 and
band 4 file display
29
3.15 Final output of Atmospheric Correction and Radiometric
Correction process for Landsat 2016
30
3.16 Subset Landsat 7 (1996) 30
3.17 Subset Landsat 7 (2006) 31
3.18 Subset Landsat 7 (2016) 31
3.19 Before cloud and noise removal of Landsat 7 (1996) 32
3.20 After cloud removal of Landsat 7 (1996) 32
3.21 After noise removal of Landsat 7 (1996) 33
3.22 Before cloud and noise removal for Landsat 7 (2006) 33
3.23 After cloud removal of Landsat 7 (2006) 34
3.24 After noise removal of Landsat 7 (2006) 34

xvi
3.25 Before cloud and noise removal for Landsat 7 (2016) 35
3.26 After cloud removal of Landsat 7 (2016) 45
3.27 After noise removal of Landsat 7 (2016) 36
3.28 Ground Control Point (GCP) on Google Earth 37
3.29 Ground Control Point (GCP) on Landsat 7 (1996) 37
3.30 Ground Control Point (GCP) on Landsat 7 (2006) 37
3.31 Ground Control Point (GCP) on Landsat 7 (2016) 38
3.32 Using ENVI 5.2, choose ‘Filter’ menu in the Toolbox
display
39
3.33 Gaussian High Pass with Kernel ‘Linear 5%’ 3x3 40
3.34 Gaussian High Pass with Kernel ‘Linear 5%’ 5x5 40
3.35 Gaussian High Pass with Kernel ‘Linear 5%’ 7x7 41
3.36 Gaussian High Pass with Kernel ‘Linear 5%’ 3x3 41
3.37 Gaussian High Pass with Kernel ‘Linear 5%’ 5x5 42
3.38 Gaussian High Pass with Kernel ‘Linear 5%’ 7x7 42
3.39 Gaussian High Pass with Kernel ‘Linear 5%’ 3x3 43
3.40 Gaussian High Pass with Kernel ‘Linear 5%’ 5x5 43
3.41 Gaussian High Pass with Kernel ‘Linear 5%’ 7x7 44
3.42 Directional filter using based on North for filtering the
edges feature
44
3.43 Edge Enhancement using Directional Filter 45
3.44 ‘Directional 180o’ with Kernel ‘Equalization’ 3x3 45
3.45 ‘Directional 180o’ with Kernel ‘Linear 5%’ 5x5 46
3.46 ‘Directional 180o’ with Kernel ‘Equalization’ 7x7 46
3.47 ‘Directional 180o’ with Kernel ‘Equalization’ 3x3 47
3.48 ‘Directional 180o’ with Kernel ‘Equalization’ 5x5 47
3.49 ‘Directional 180o’ with Kernel ‘Equalization’ 7x7 48
3.50 ‘Directional 180o’ with Kernel ‘Equalization’ 3x3 48
xvii
3.51 ‘Directional 180o’ with Kernel ‘Equalization’ 5x5 49
3.52 ‘Directional 180o’ with Kernel ‘Equalization’ 7x7 49
3.53 Feature extraction using ‘Segmentation Image’ 50
3.54 Feature extraction using ‘Segmentation Image’ 51
3.55 Feature extraction using ‘Segmentation Only Feature
Extraction Workflow’
51
3.56 RMS Error of Landsat 7 (1996) 55
3.57 RMS Error of Landsat 7 (2006) 56
3.58 RMS Error of Landsat 7 (2016) 56
3.59 Johor Strait Map 57
3.60 Part of Johor Bahru Strait Map 58
3.61 Shoreline Map of Country Garden urban development
and Danga Bay (Part of Johor Bahru Strait) using Google
Earth (1996)
58
3.62 Shoreline Map of Country Garden urban development
area and Danga Bay (Part of Johor Bahru Strait) using
Google Earth (2006)
59
3.63 Shoreline Map of Country Garden urban development
area and Danga Bay (Part of Johor Bahru Strait) using
Google Earth (2016)
59
3.64 Extracted Shoreline Map of Country Garden urban
development area and Danga Bay (Part of Johor Bahru
Straits), From Landsat (1996,2006 and 2016)
60
3.65 ER Diagram 61
3.66 Field of attribute of Johor Bahru Strait 61
3.67 Field of attribute of Shoreline Map of Country Garden
urban development area and Danga Bay (Johor Bahru
Strait) using Google Earth (1996,2006 and 2016)
63
3.68 Geodatabases file of Shoreline Changes Map (1996,2006
and 2016)
64
4.1 ‘Directional 180o’ with Kernel ‘Equalization’ 3x3 68
xviii
4.2 ‘Directional 180o’ with Kernel ‘Equalization’ 3x3 69
4.3 ‘Directional 180o’ with Kernel ‘Equalization’ 3x3 69
4.4 ‘Directional 50o’ with Kernel ‘Equalization’ 3x3 71
4.5 ‘Directional 50o’ with Kernel ‘Equalization’ 3x3 71
4.6 Gaussian High Pass Convolution with Kernel
‘Equalization’ 3x3, Image add back value 20%
72
4.7 Gaussian High Pass Convolution with Kernel
‘Equalization’ 3x3, Image add back value 60%
72
4.8 3, 2, 1 Combination band and potential content 73
4.9 4, 5, 3 Combination band and potential content 73
4.10 7, 5, 4 Combination band and potential content 74
4.11 RMS error of each GCP point (1996, 2006 and 2016)
chart
76
4.12 Google Earth of 2016 79
4.13 Topographic Map of 2016 79
4.14 Coastal reclamation changes map of 1996 80
4.15 Coastal reclamation changes map of 2006 80
4.16 Coastal reclamation changes map of 2016 81
4.17 Shoreline changes overlay Google Earth of 1996 82
4.18 Shoreline changes overlay Google Earth of 2006 82
4.19 Shoreline changes overlay Google Earth of 2016 83
4.20 Shoreline changes overlay Google Earth of 1996, 2006
and 2016
83
4.21 Point of Ground Control (GC) 84

xix
LIST OF ABBREVIATIONS
AIRSAR - Airborne Synthetic Aperture Radar
AOI - Area of Interest
CVA - Change Vector Length
CW - Continuous Wave
DN - Digital Unique
DSAS - Digital Shoreline Analysis System
DTC - Decision Tree Classifier
ENVI - Environment for Visualizing Images
EPR - Electron Spin Resonance
ER - Entity Relationship
ERDAS - Earth Resources Data Analysis System
FELCRA - Federal Land Consolidation and Rehabilitation Authority
GC - Ground Control
GCP - Ground Control Point
GIS - Geographic Information System
GPS - Global Positioning System
HTHW - High Tide High Water
HWM - Highest Water Mark
ICZM - Integrated Coastal Zone Management
ISMP - Integrated Shoreline Management Program
ISODATA - Iterative Self-Organizing Data Analysis Technique
LANDSAT - Land Remote-Sensing Satellite
LANDSAT TM - Landsat Thematic Mapper
LIDAR - Light Detection and Ranging

xx
LRR - Long-Range Requirement
LU/LC - Land Use and Land Cover
MHW - Mean High Water
MHTW - Mean High Tight Water
MLC - Maximum Likelihood Classification
MLLW - Mean Lower Low Water Line
MLTWM - Mean Low Tight Water Mark
MLW - Mean Low Water
MODIS - Moderate-Resolution Imaging Spectroradiometer
MRSO - Malaysian Rectified Skew Orthomorphic
MSL - Mean Sea Level
MTL - Mean Tide Level
NDVI - Normalized Difference Vegetation Index
NIR - Near Infra-Red
NN - Neutral Network
NOAA - National Oceanic and Atmospheric Administration
PIXEL - Picture Element
RE - Remote Sensing
RISDA - Rubber Industry Smallholders' Development Authority
RMSE - Root Mean Square Error
SPOT - Satellites Pour Observation De La Terre or Earth-
Observing Satellite
SPOT VGT - Satellites Pour Observation De La Terre or Earth-
Observing Satellite for Vegetation
VGT - Vegetation
WLR - Weapons Locating Radar
CHAPTER 1
INTRODUCTION
1.1 Background of Study
Shoreline known as a country international measurement border determination.
Shoreline changes phenomenon probably occurred by land reclamation project for urban
development purposes, erosion, water pollution and nature disasters. Monitoring of these
changes is crucial to mapped for research and development and management activities of
inland and shoreline. It is important to preserved because country area is considered by
land and oceans surrounding. Due to the Johor Straits has a length and wide shoreline,
requires high technology mapping equipment means by consistency, frequency of
observations and more systematic way of map production.
Shoreline changes mapping for the cities near to the coastal area need a regular
monitoring in order to ensure the continuity of the human ecosystem. There are a lot of
example city that have a development located along to the costal. Transportation, food and
environmental ecology system proof that in ten major of world cities such as Tokyo in
Japan, Mexico City in Mexico, Mumbai in India and Sáo Paulo in Brazil also located along
the coastal. Since Malaysia is also surrounded by the ocean, starting 1990 combination of

2
some government agency being responsible to identify and mapping the cause of the
shoreline changes for planning and further action. For urban planning and economics,
changes mapping must be made at least two to three years. While surveillance activities
and research sufficient four to five years.
High technology mapping data collecting equipment with more consistency,
frequency of observations and more systematic way of map production are needed in term
of shoreline changes mapping purposes. IKONOS, Quick Bird, Worldview AVHRR,
MODIS and SPOT VGT are example of advanced spatial resolution images which be able
to apply into landuse and landcover (LU/LC) changes detection with more accurate,
consistently and good local and global monitoring purposes. (Muhammad Iqbal Rosli et
al., (2015), Bashir Rokni Deilami et.al,.(2015). As regarded in www.geogallers.com, land
reclamation changes in inland the coastal plain has been intensively farmed for paddy in
the past and now are mainly focused for market gardens and small holdings of oil palm
using Landsat images. Recent studies have shown, there have been various land
development authorities that are active in Kuala Pontian area, FELCRA and RISDA
included.
This study focuses exclusively on shoreline land reclamation changes in Johor
Straits using remotely sensed data between several time period. The expected output from
satellite image processing steps and Google Map is a map used to applied to produced map
contains characteristics identification include roads network and several landuse types such
as agriculture, settlements, coastal development area and urban area. In this study, shoreline
reclamation changes mapping will develop within Geographical Information System (GIS)
capacity. Spatial analysis term such as overlay approach will be chosen for measure and
identify the areas where effected by land reclamation that lead to shoreline changes.
3
1.2 Problem Statement
Present satellites discrete signal in a limited number of broadbands will generated
by traditional multispectral satellite-flown instruments, such as Landsat, SPOT and
eccentric. In the other part, hyperspectral and multispectral high capable to cover large
areas of interest and provide very accurate spatial information. Shoreline extraction can be
derived from visibly discernible coastal features which mean by using true or false color
imagery and using the digital image-processing. But somehow, the pixel resolution and
high cost of data are generally limited both spatially and temporally.
Many papers and previous research have focused on coastal and shoreline changes
mapping and analysis within satellite image and GIS integration such as detecting change
at the local dimension of land use or land cover, to solve many coastal erosion problems
by providing a means for generating information, regular monitoring and analysis to predict
and visualize future scenarios, analyze and measure historic coastal patterns along several
beach experiment and detecting shoreline extraction from images with a new algorithm.
But there are no papers focus on shoreline reclamation changes mapping. Many small
villages along coastal line are being impacted by shoreline land reclamation issues and need
to be assessed continuously. Perhaps, the shoreline change detection affected by land
reclamation method used in this study can be useful for the government and private
agencies to monitor and assess area affected by land reclamation especially for decision
support making purposes.
1.3 Aim and Objectives of Study
The aim of this study is to determine and map shoreline changes due to coastal
reclamation in Johor Straits and it related changes in range of ten (10) years which is 1996,
2006 and 2016 using Landsat TM satellite data. The following are the specific objectives
of this study:

4
i. To examine and analyse selected linear feature extraction techniques for shoreline
mapping using Landsat TM data set;
ii. To examine the resultant of accuracy of shoreline details extracted from Landsat TM
data set, and,
ii. To detect shoreline changes due to reclamation at medium resolution data (Landsat TM).
1.4 Study Question
Research questions are as follows:
1. How to identify the characteristics of shoreline change due to land reclamation from
multi- temporal Landsat TM data?
2. Does spectral bands have inherent properties in identifying shoreline changes?
3. How to maintain geometrically constant shoreline in area of less available features for
Ground Control Point (GCP)?
4. What is the best robust method for rapid integration of shoreline extracted from Remote
Sensing data into corresponding GIS spatial database?
1.5. Scope of Study
The main bench mark to achieve all objectives in this study is to figure out the
characteristics of change detection from multi- temporal Landsat TM data capabilities.
Using shoreline change detection manipulation, mapping accuracy will determine. Then,
this multi – temporal Landsat TM characteristics within the high accuracy of scale and
shoreline location will meet shoreline changes due to reclamation.
For extract the characteristics of multi – temporal Landsat TM for 1996, 2006 and
2016, image processing using ENVI 5.2 will been used and for digitizing one use ArcGIS
5
10.2 version. Other than digitize, ArcGIS 10.2 also utilized for the data attribute input, data
manipulation (geodatabase development) until data analysis (overlay). The accuracy
assessment of this study will be measured using Root Mean Square Error (RMSE) below
0.5m. This RMSE can be guide the suitable location for the establishment of Ground
Control Point (GCP’s) selected. Attribute accuracy using Google Earth Map in recent year
(2016).
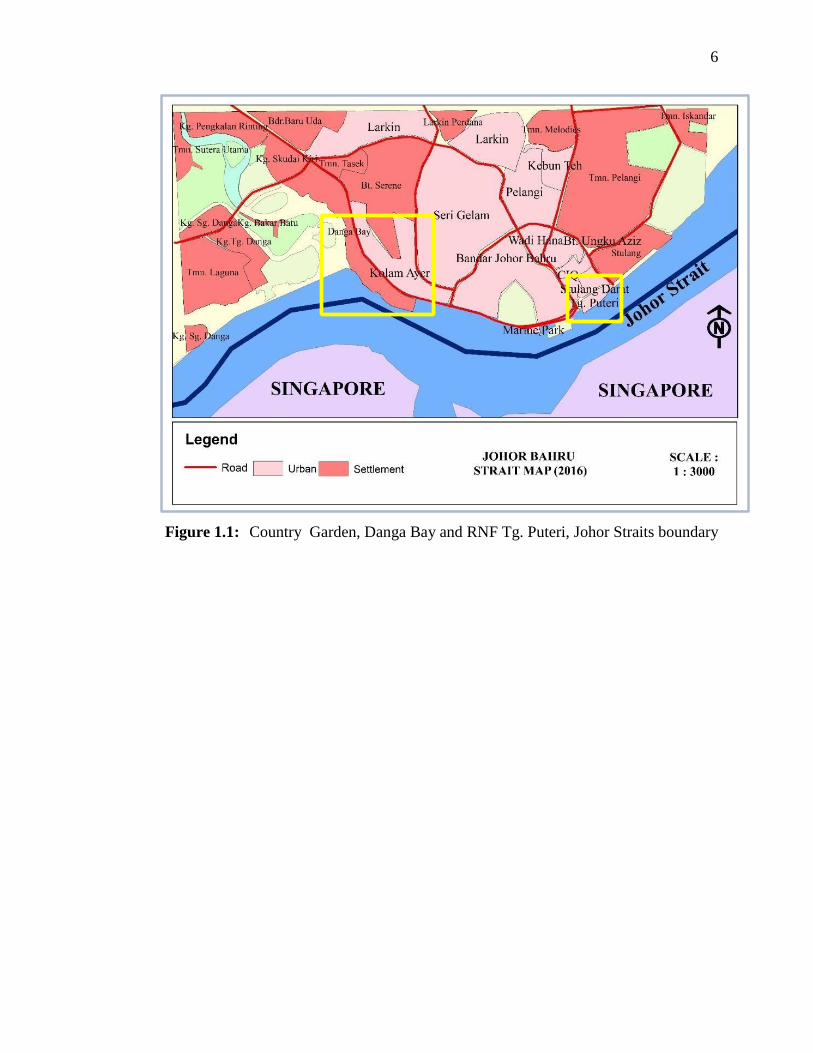
1.6 Study Area
The study area concentrates on mapping and assessed location of shoreline land
reclamation changes along Country Garden, Danga Bay to RNF, Tanjung Puteri, part of
Johor Straits. Country Garden is located in the south-central part of Iskandar Malaysia,
Danga Bay, Johor Baharu first and largest mixed residential-commercial development. It
stretches along a 25km scenic waterfront facing the Straits of Johor and covers an area of
approximately 450-acre or 22.26 hectare. Country Garden, Danga Bay, Johor Baharu
located in Latitude 1° 28' 30" North and Longitude 103° 43' 26.4" East. RNF Tanjung
Puteri Latitude 1° 27' 36.91" North and Longitude 103° 46' 12.82" East. RNF Tanjung
Puteri also residential-commercial development covers an area of approximately 157 acre.
Since 2010, both Country Garden, Danga Bay and RNF Tanjung Puteri using GDM 2000
(Johor) coordinate system replace with Malaysian Rectified Skew Ortomorphic (MRSO)
in previously.
6
Figure 1.1: Country Garden, Danga Bay and RNF Tg. Puteri, Johor Straits boundary
REFERENCES
Abdullah Hassan. (1992). Aspek Bahasa dan Kajiannya. Kuala Lumpur: Dewan
Bahasa. Edisi Terjemahan Bahasa Malaysia. Kuala Lumpur.
A’kif Al Fugura, Lawal Billa, Biswajeet Pradhan. (2011). Semi-automated procedures
for shoreline extraction using single RADARSAT-1 SAR image. Estuarine
Coastal and Shelf Science 95(4).
A.M. Muslim, K. I. Ismail, I. Khalil b, N. Razman and K. Zain. (2011). Detection of
shoreline changes at Kuala Terengganu, Malaysia from multi - temporal
satellite sensor imagery. ISPRS, proceedings, 2011, ISRSE-34/211104015.
Bashir Rokni Deilami, Baharin Bin Ahmad, Malik R.A. Saffar and Hafiz Aminu Umar.
(2014). Using Remote Sensing and GIS to Detect and Monitor Land Use and
Land Cover Change in Iskandar Malaysia During 2007–2014. Department of
Remote Sensing, Faculty of Geo Information and Real Estate, Universiti
Teknologi Malaysia, UTM, 81310 Johor Bahru, Johor, Malaysia. Middle-East
Journal of Scientific Research,22 (3), 390-394, 2014, ISSN 1990-9233 ©
IDOSI Publications, 2014.
Bashir Rokni Deilami, Baharin Bin Ahmad, Malik R.A. Saffar and Hafiz Zamin Umar.
(2015). Review of Change Detection Techniques from Remotely Sensed
Images. Research Journal of Applied Sciences, Engineering and Technology
,10(2), 221-229, 2015 ISSN, 2040-7459.
Baumgartner. (1999). Photogrammetric Engineering & Remote Sensing.Vol. 70, No.
12, December 2004, pp. 1383–1392.

91
Florence Tupin, Jordi Inglada and Jean-Marie Nicolas. (2014) Remote Sensing
Imagery. A John Wiley and Sons, Ltd., Publication.
Gary L.Prost. (2014). Remote Sensing For Geoscientists - Image and analysis
interpretation (Third Edition). CRC Press, Taylor & Francis Group.
Ivan Sekovski, Francesco Stecchi, Francesco Mancini and Laura Del Rio. (2014).
Image classification methods applied to shoreline extraction on very high-
resolution multispectral imagery. Journal. . Volume 35, 2014 - Issue 10.
Jack D. Douglas. (1967). The Social Meanings of Suicide. Princeton University Press,
Princeton, N. J. Science 28 Feb 1969: Vol. 163.
Jian Guo Liu and Philippa J. Mason. (2009). Essential Image Processing and GIS for
Remote Sensing. Imperial College London. A John Wiley and Sons, Ltd.,
Publication.
John R. Jensen. (1996). Introductory Digital Image Processing – A Remote Sensing
Perspective. Prentice Hall Publisher.
Kasturi Devi Kanniah, Afsaneh Sheikhi, Arthur P. Cracknell, Hong Ching Goh, Kian
Pang Tan, Chin Siong Ho 4 and Fateen Nabilla Rasli. (2015). Satellite Images
for Monitoring Mangrove Cover Changes in a Fast Growing Economic Region
in Southern Peninsular Malaysia. Remote Sensing Journal. 2015, 7, 14360-
14385, doi, 10.3390 /rs71114360. Remote sensing, ISSN2072-4292.
Mabwoga SO and Thukral AK. (2014). Characterization of change in the Harike
wetland, a Ramsar site in India, using landsat satellite data. Springerplus. 2014
Oct 1,3,576, doi, 10.1186/2193-1801-3-576, eCollection 2014.
Mazlan Hashim, Ridzwan Abd. Rahman, Mazlani Muhammad and Abd Wahid Rasib.
(2001). Spectral characteristics of seagrass with Landsat TM in northern
Sabah coastline, Malaysia.

92
Mazlan Hashim, Maged Marghany and Arthur P. Cracknell. (2007). Holographic
interferometry of AIRSAR data for modelling rate change of shoreline.
Mazlan Hashim and Maged Marghany. (2010). Velocity bunching and canny
algorithms for modelling shoreline change rate used synthetic aperture radar
(SAR).
Mohd Hasmadi Ismail, Che Ku Akmar Che Ku Othman, Ismail Adnan Abd Malek and
Saiful Arif Abdullah. (2012). Land Use Trends Analysis Using SPOT-5
Images and Its Effect on the Landscape of Cameron Highland, Malaysia.
Forest Surveying and Engineering Laboratory, Faculty of Forestry Universiti
Putra Malaysia, 43400 UPM, Serdang, Selangor, Malaysia. Institute for
Environment and Development (LESTARI), Universiti Kebangsaan Malaysia,
43600 Bangi, Selangor, Malaysia.
Mohd Aizuddin Mohd Raes, Ab. Latif Ibrahim and Muhammad Zulkarnain Abdul
Rahman. (2011). Monitoring and Simulation Assessment for Coastal
Reclamation Area Using Remote Sensing Approach. 1 Dec 2011 32nd Asian
Conference on Remote Sensing 2011, ACRS 2011. Vol. 1, p. 181-186 6 p.
Mohd Aizuddin Mohd Raes, Ab. Latif Ibrahim and Muhammad Zulkarnain Abdul
Rahman. (2015). Monitoring & Simulation Assessment for Coastal
Reclamation Area Using Remote Sensing Approach.
Muhammad Iqbal Rosli et al., (2015). Shoreline Delineation and Land Reclamation
Change Detection Using Landsat Image. SEIC2015 Conference, Langkawi,
Malaysia. Researchgate Journal Publication, 284479923.
Paul J. Gibson and Clare H. Power. (2000). Introductory Remote Sensing: Digital
Image Processing and Applications. London, Routledge.
93
Raju Aedla, G.S. Dwarakish, D. Venkat Reddy. (2015). Automatic Shoreline Detection
and Change Detection Analysis of Netravati - Gurpur Rivermouth Using
Histogram Equalization and Adaptive Thresholding Techniques. Volume 4,
2015, Pages 563-570.
Saci Kermani, Makhlouf Boutiba, Mostefa Guendouz, Mohamed Said Guettouche and
Dalila Khelfani. (2016). Detection and analysis of shoreline changes using
geospatial tools and automatic computation: Case of jijelian sandy coast (East
Algeria). Volume 132, November 2016, Pages 46–58.
Salwa Ramly. (2008). Impact on the coastal areas of the Tanjung Tokong Land
Reclamation Project, Penang, Malaysia. Effects on wave transformation,
sediment transport, and coastal evolution.
Shneier (1982). Photogrammetric Engineering & Remote Sensing.Vol. 70, No. 12,
December 2004, pp. 1383–1392.
Shujian Yu et al. (2013). A New Algorithm for Shoreline Extraction from Satellite
Imagery with Non-Separable Wavelet and Level Set Method.
Stacy Shafer Rogerst, Daniel H. Sandweisst, Kirk A. Maascht, Daniel F. Belknapt and
Peggy Agouris. (2004). Coastal Change and Beach Ridges along the Northwest
Coast of Peru: Image and GIS Analysis of the Chira, Piura, and Colin Beach-
Ridge Plains. Journal of Coastal Research, Vol. 20, No. 4 (Autumn, 2004), pp.
1102-1125.
Tania Golingi. (2011). Environmental sensitivity mapping for shoreline management
planning.
Trinder and Wang. (1998). Photogrammetric Engineering & Remote Sensing.Vol. 70,
No. 12, December 2004, pp. 1383–1392.
94
Xianwen Ding and Xiaofeng Li. (2013). Shoreline movement monitoring based on SAR
images in Shanghai, China. International Journal of Remote Sensing, 2014 vol.
35, Nos. 11–12, 3994–4008.
Zahrul Umar, Wan Abdul Aziz Wan Mohd Akib & Anuar Ahmad. (2013). Monitoring
Shoreline Change using Remote Sensing and GIS: A Case Study of Padang
Coastal Area, Indonesia. 2013 IEEE 9th International Colloquium on Signal
Processing and its Applications, 8 - 10 Mac. 2013, Kuala Lumpur, Malaysia.