mapping multiplex hubs in human functional brain...
TRANSCRIPT

ORIGINAL RESEARCHpublished: 15 July 2016
doi: 10.3389/fnins.2016.00326
Frontiers in Neuroscience | www.frontiersin.org 1 July 2016 | Volume 10 | Article 326
Edited by:
Xi-Nian Zuo,
Chinese Academy of Sciences, China
Reviewed by:
Mingrui Xia,
Beijing Normal University, China
Richard Betzel,
Indiana University - Bloomington, USA
*Correspondence:
Manlio De Domenico
Shuntaro Sasai
†These authors have contributed
equally to this work.
Specialty section:
This article was submitted to
Brain Imaging Methods,
a section of the journal
Frontiers in Neuroscience
Received: 18 April 2016
Accepted: 28 June 2016
Published: 15 July 2016
Citation:
De Domenico M, Sasai S and
Arenas A (2016) Mapping Multiplex
Hubs in Human Functional Brain
Networks. Front. Neurosci. 10:326.
doi: 10.3389/fnins.2016.00326
Mapping Multiplex Hubs in HumanFunctional Brain NetworksManlio De Domenico 1*†, Shuntaro Sasai 2*† and Alex Arenas 1
1Departament d’Enginyeria Informàtica i Matemàtiques, Universitat Rovira i Virgili, Tarragona, Spain, 2Department of
Psychiatry, University of Wisconsin-Madison, Madison, WI, USA
Typical brain networks consist of many peripheral regions and a few highly central ones,
i.e., hubs, playing key functional roles in cerebral inter-regional interactions. Studies have
shown that networks, obtained from the analysis of specific frequency components
of brain activity, present peculiar architectures with unique profiles of region centrality.
However, the identification of hubs in networks built from different frequency bands
simultaneously is still a challenging problem, remaining largely unexplored. Here we
identify each frequency component with one layer of a multiplex network and face this
challenge by exploiting the recent advances in the analysis of multiplex topologies. First,
we show that each frequency band carries unique topological information, fundamental
to accurately model brain functional networks. We then demonstrate that hubs in the
multiplex network, in general different from those ones obtained after discarding or
aggregating the measured signals as usual, provide a more accurate map of brain’s most
important functional regions, allowing to distinguish between healthy and schizophrenic
populations better than conventional network approaches.
Keywords: multiplex networks, brain fMRI, schizophrenia, frequency bands, multiplex hubs
INTRODUCTION
The brain functional network is generally built by interconnecting brain regions according to somemeasure of functional connectivity (Bassett and Bullmore, 2006; Bullmore and Sporns, 2009, 2012).Studies using functional magnetic resonance imaging (VanDenHeuvel and Pol, 2010; Poldrack andFarah, 2015) (fMRI) provided convincing evidence supporting the existence of special regions, i.e.,hubs, that play a fundamental role in brain functional connectivity (Achard et al., 2006; Power et al.,2013) by mediating interactions among other regions and favoring the brain’s integrated operation.Generally, the strength of this connectivity is empirically estimated by inter-regional correlationscalculated after post-processing and filtering fMRI signals with a conventional pass band, keepingcomponents between 0.01 and 0.1 Hz (Cordes et al., 2001, 2002; Fox and Raichle, 2007). Theimportance of each region with respect to the overall connectivity, i.e., nodal centrality in thefunctional network, is of particular interest in many applications (Sporns et al., 2007; Bassett et al.,2008; Bullmore and Sporns, 2009; Lynall et al., 2010; Rubinov and Sporns, 2010; Zuo et al., 2012).However, it has been shown that networks with unique hub regions can be built from differentfrequency ranges (Sasai et al., 2014) and that region centrality might largely fluctuate depending onfrequency cuts (Thompson and Fransson, 2015), with components above 0.1 Hz also contributingto functional connectivity with unique topological information (Bassett et al., 2006; Mantini et al.,2007; Supekar et al., 2008; Chavez et al., 2010; Liao et al., 2013; Chen and Glover, 2015). Such anevidence impels the development of a novel framework to account for full information from allfrequency bands separately and simultaneously, without discarding any particular component oraggregating some of them to build single networks.

De Domenico et al. Human Functional Brain Networks
In this study, we tackle this challenging issue by employingthe theoretical and computational tools recently developed foranalyzing and modeling multiplex networks (Mucha et al., 2010;De Domenico et al., 2013, 2015b,c). Multiplex architecturesare special networks consisting of different layers, eachencoding a different type of relationship or interaction betweennodes (Boccaletti et al., 2014; Kivelä et al., 2014). Recent studiesmodeled and analyzed brain networks using temporal networks,a special type of multilayer system (Bassett et al., 2011, 2013;Braun et al., 2015). In this context, we identify each frequencycomponent with a distinct layer of a multiplex network whosenodes represent the brain’s regions of interest and edges representtheir functional connectivity in a specific frequency range.
This novel approach rises two fundamental questions,requiring to (i) verify if and how brain regions playing therole of hubs in the new multiplex functional network differfrom the ones obtained using standard network approaches;and (ii) if and how we can exploit such differences to improveour understanding of brain disorders. In the following, we willprovide extensive evidence demonstrating that hub regions inmultiplex functional networks are different from hub regionsin standard functional networks and that such differences inthe nodal centrality profile allow us to identify patients affectedby schizophrenia more accurately than conventional approachesbased on discarding or aggregating information about brainfunctional activity.
MATERIALS AND METHODS
Overview of the Data Set and fMRIPreprocessingThe publicly available MR data set contributed by The Centerfor Biomedical Research Excellence (COBRE) was used inthis study. The data set was downloaded from the followingrepository: http://fcon_1000.projects.nitrc.org/indi/retro/cobre.html. It includes resting functional and anatomical MRI dataacquired from 71 Schizophrenic patients and 74 healthy controls(age: 18–65 for both groups). Parameters of fMRI acquisitionreleased by the provider are as follows: TR = 2000 ms, TE =
29 ms, voxel size = 3 × 3 × 4mm3, total scan time = 6 min.One patients data was discarded from all analyses due to theshortness of the data length. The following pre-processing stepswere applied to functionalMR images by using the SPM8 package(Wellcome Department of Imaging Neuroscience, London, UK):motion-correction, slice-timing-correction, spatial smoothingwith Gaussian kernel (5-mm full-width-at-half-maximum) andspatial normalization. Signal fluctuations of fMRI are driven bynot only neural but also physiological effects—such as respirationand cardiac pulsation—and environmental conditions—such asscanner instabilities and subject motion. These nuisance effectscan be canceled out by discarding, for instance, the signal fromthe ROI centered in the white matter, the signal from theventricular ROI, and the signal from the ROI located within thesoft-tissue. We have linearly removed these components as wellas six motion-correction parameters after temporally shiftingthem by optimal time-lags yielding the highest correlation with
the averaged signal of all gray matter voxels (Anderson et al.,2011).
Statistical Analysis of Age, Gender, andHanded-Ness DistributionWe performed a Wilcoxon rank-sum test, a non-parametricversion of unpaired two-sample t-test, to test the null hypothesisthat phenotypic details in the two groups are sampled fromcontinuous distributions with equal medians. The test didnot reject the null in the case of age (p-value = 0.4253)and gender (p-value = 0.1186), therefore the discriminationpower of the method proposed in the following can not beexplained by differences in age or gender between the twogroups (see Supplementary Table 3 for statistical descriptors).The test rejected the null in the case of handed-ness (p-value =0.004), suggesting that this factor might affect the discriminationpower of our method. However, we show in SupplementaryFigure 3 that, by including such information in the classificationprocedure, discrimination accuracy and all other statisticalindicators are not significantly improved with respect to thecase when phenotypic data is not accounted for, suggesting thatdifferences in handed-ness are not responsible for our findings.
Connectivity MatricesA set of 264 spherical ROIs (5 mm radii) was used to extract themean signal within each ROI. For each individual, the coherencebetween all pairs of in-ROI averaged signals was estimated inspecific frequency bands, as described in the text. We kept theedges between pairs of ROIs whose weight was significantlydifferent from a null model where observed signals were replacedby surrogates. More specifically, we used the well-known iterativeamplitude-adjusted Fourier transform (IAAFT) algorithm tobuild surrogate time series preserving the power spectrum andthe probability density of the original ones, while removinghigher-order self-correlations. For each pair of ROIs i and j,we have verified that the distribution of the weights obtainedfrom the null model corresponds to a Gaussian described bysample mean µij and variance σ 2
ij . Let wij indicate the weight
obtained from empirical data: we have calculated the absolute Z-score as zij = |wij − µij|/σij and discarded all those edges forwhich zij < 3, corresponding to cross-coherence not statisticallysignificant. It is worth remarking that the chosen thresholdprovides a statistical test with significance 99.8%. On one hand,lower thresholds would keep links that are more likely to beobserved by chance; on the other hand, higher thresholds woulddramatically reduce the density of the network making anyfurther analysis less reliable. Our choice provides a good trade-off between these two extremal cases. Finally, we used the valueszij as entries of the resulting connectivity matrix.
As a final remark, it is worth mentioning that usingthe absolute value of z-scores does not allow to distinguishbetween significantly correlated and anti-correlated signals, acharacteristic that is typically exploited in the neuroscienceliterature. In a future study, we plan to take into account,separately, the information obtained from correlated and anti-correlated signals by using distinct layers. By comparing against
Frontiers in Neuroscience | www.frontiersin.org 2 July 2016 | Volume 10 | Article 326

De Domenico et al. Human Functional Brain Networks
other standardmetrics, we will be able to quantify how our resultsmight be further improved.
Multiplex Network ModelA multilayer network allows to encode different types ofinteractions or relationships among a set of nodes. Morespecifically, in the case of our study we make use of multiplexnetworks to model functional connectivity. In a multiplexnetwork, the links are of different type: one can assign adifferent “color” to each type, thus obtained an edge-coloredrepresentation of the network. In this type of architectures,nodes exist in one or more layers, i.e., it is not required thatall nodes exist in all layers. Correlation networks, as the onesused in this study, define edge-colored graphs where each layerencodes the correlations observed in a specific frequency band.However, it has been shown that by interconnecting nodes withtheir replicas across layers, the resulting interconnectedmultiplexnetwork can be described by an adjacency tensor (De Domenicoet al., 2013) with components Miα
jβ , an object generalizing
the well-known concept of adjacency matrix to higher orders,encoding connections between node i in layer α and node jin layer β . While a strict biological interpretation of inter-layerlinks in this context might be difficult, we suggest that theirexistence and their weight might encode how different frequencycomponents interact each other and with which intensity. Forinterconnected multiplex networks, Miα
jβ = 0 for i6=j and
simultaneously α 6= β . The presence of interconnectionsallows to exploit tensorial algebra to generalize many single-layer network descriptors, from centrality (De Domenico et al.,2015c) to mesoscale structure (Mucha et al., 2010; De Domenicoet al., 2015a). However, it is not always possible to assign aweight to inter-layer links by using the data, and it is commonto parameterize the intensity of interconnections (Gomezet al., 2013; De Domenico et al., 2014), i.e., Miα
jβ = D
for i = j and simultaneously α 6= β , to study theresulting interconnected multiplex network as a function ofthis parameter D. This is exactly the case of the presentstudy, where the choice of D depends on the analysis ofinterest.
It is worth mentioning that, in general, care must be takenwhen network measures are applied to functional networks,because links between nodes do not directly map physicalconnections between different areas of the brain. Nevertheless,links in functional networks indirectly quantify the statisticalcorrelation or similarity between two regions of interest andare widely used in literature to gain insight about brain’sactivity (Bullmore and Sporns, 2009). In the following, we will notmake the difference between positive and negative correlations,that will be considered, for each band frequency, as additionallayers of the multiplex functional brain network in a future study.
Structural Reducibility of Brain MultiplexFunctional NetworkThe analysis of structural reducibility of a multilayer networkallows to find layers that provide redundant topologicalinformation, suggesting how to merge some layers with other
ones, to obtain an optimal multilayer network (De Domenicoet al., 2015b). The whole procedure can be summarizedas follows: (i) compute the distance (based on quantumJensen-Shannon divergence) between all pairs of layers; (ii)perform hierarchical clustering of layers using such distancematrix and use changes in the relative entropy q(•) as thequality function for the resulting partition; (iii) finally, choosethe partition which maximizes the quality function, i.e., thedistinguishability from the fully aggregated graph obtainedby summing up the adjacency matrices of all layers. It isworth remarking that this analysis is independent on thechoice of interconnections weight, i.e., it does not dependon D. Here, we do not enter into the details of the wholemethod; instead we focus on the Jensen-Shannon distance,that is a key measure for two analyses presented in thisstudy.
The components A[α]ij (i, j = 1, 2, ...,N; being N the number
of ROIs in this study) of the adjacency matrix A[α]—encoding
layer α—are obtained from the components of the multilayer
adjacency tensor as A[α]ij = Miα
jα . Here, A[α]ij > 0 if there
is correlation between ROIs i and j in the frequency bandrepresented by α. The Von Neumann entropy (Braunstein et al.,2006; Passerini and Severini, 2010) of the corresponding complexnetwork is defined by
hA[α] = −Tr[
L[α] log2 L
[α]]
, (1)
where L[α] = c × (S[α] − A
[α]) is the combinatorial Laplacian
rescaled by c = 1/
(
N∑
i,j= 1A[α]ij
)
, and S is the diagonal matrix
of the strengths of the nodes. From the eigen-decompositionof the Laplacian, it is possible to show that the entropy can becalculated by
hA[α] = −
N∑
i= 1
λ[α]i log2(λ
[α]i ), (2)
where {λ[α]1 , λ
[α]2 , . . . , λ
[α]N } are the eigenvalues of L
[α].The similarity of two layers can be calculated in terms
of differences in their entropy. Given two rescaled Laplacianmatrices L
[α] and L[β], it is possible to quantify to which
extent layer α is different from layer β by their Kullback-Lieblerdivergence, defined by
DKL(L[α]||L[β]) = Tr[L[α](log2(L
[α])− log2(L[β]))], (3)
encoding the information gained about L[β] when the
expectation is based only on L[α]. This divergence is not
a metric and a more suitable dissimilarity measure is theJensen-Shannon divergence, defined by
DJS(L[α]||L[β]) =
1
2DKL(L
[α]||L[µ])+1
2DKL(L
[β]||L[µ]), (4)
whereL[µ] = 1
2 (L[α]+L
[β]). It can be shown that√
DJS, usuallycalled Jensen–Shannon distance, takes values in [0, 1], satisfies all
Frontiers in Neuroscience | www.frontiersin.org 3 July 2016 | Volume 10 | Article 326

De Domenico et al. Human Functional Brain Networks
the properties of a metric distance and provides a very powerfulmeasure of dissimilarity between layers.
Random Forest ClassificationMachine learning has been used to train a classifier to distinguishbetween control and schizophrenic individuals. We used therandom forest classifier (Breiman, 2001), well-known for itsrobustness and for facilitating the interpretation of results. Wehave fixed to 5 the maximum number of terminal nodes treesthe forest can have and to 2 the number of variables randomlysampled as candidates at each split. We have verified that forestsconsisting of 700 trees where enough to reach stable resultswithin this setup.
Given the importance of interconnections weight for ouranalysis and, at the same time, the lack of knowledge about itsvalue, we used random forest to learn also which value ofDwouldbe more suitable for calculations.
We have performed a first exploratory classification usinga leave-one-out approach to maximize the amount of dataused for training the classifier. The result of each classification,corresponding to exactly one different individual (withoutreplacement) left out, was accompanied by the importanceassigned by the classifier to each ROI in terms of mean decrease
in its Gini index. Therefore, for each individual and each valueof D, we have ranked the ROIs according to this measureand, eventually, summed up the ranks corresponding to allclassifications.
The result of the exploratory classification was an overallranking suggesting which ROIs, in general, have been morecrucial than others in the classification process. Therefore, weperformed a second classification round by using only thetop ROIs according to the above ranking. We first varied thenumber of kept features and the value of D, to find the valueswith best classification performances in terms of accuracy (seeSupplementary Figure 1). The numerical analysis indicated thatthe best classification is achieved for interconnections weightclose to 24.7708 and about 30 top ROIs: that value of D and thatsub-set of ROIs have been used for analysis reported in the text.
Using a similar approach, we have compared the bestperformance obtained from the full multiplex functional network(12 layers) against multiplex functional networks obtained bykeeping layers in the typical band (Supplementary Figure 2)and against classifier trained by including phenotypic data(Supplementary Figure 3). In all cases, the classification obtainedusing the full multiplex functional network was equal or betterthan the other ones.
FIGURE 1 | Schematic illustration of brain multiplex functional network construction. (A) We measure the brain activity with a set of 264 ROIs (here, we only
draw five ROIs, for simplicity), and estimate the coherence spectrum of signals between any pair of ROIs. (B) Averaged coherence values are calculated in 12
frequency bands (here we only show four bands, for simplicity), to quantify the strength of frequency-specific functional connectivity. The statistical significance of each
connection is calculated (see Methods) and connections with Z-score smaller than 3 are discarded. (C) The remaining connections are used to build adjacency
matrices, weighted by Z-scores, that constitute the layers of the multiplex functional network once interconnected. (D) Resulting single-layer and multiplex networks
obtained from this procedure.
Frontiers in Neuroscience | www.frontiersin.org 4 July 2016 | Volume 10 | Article 326

De Domenico et al. Human Functional Brain Networks
ROIs PageRank CentralityPageRank is a measure of node’s centrality originally introducedby Google founders to rank Web pages according to theirimportance in the Internet (Brin and Page, 1998; Ermann et al.,2015). The algorithm consider a random walker exploring thenetwork with the following rules: 85% of times the walker jumpsfrom the current node to one chosen with uniform probabilityfrom the neighborhood, whereas 15% of times the walker isallowed to jump to any node of the network, with uniformprobability. The stationary probability of finding the walker in aspecific node is then used to rank the importance of nodes in thenetwork, the rationale being that central nodes have high numberof incoming links from other important nodes.
The natural extension of the PageRank algorithmto the context of multiplex networks has been recentlyintroduced (De Domenico et al., 2015c) and proved to performbetter than its single-layer counterpart in some applications.Let us indicate with Riαjβ the transition tensor, governing the
dynamics of a random walker jumping to neighboring nodeswith rate 0.85 and teleporting to any other node in the networkwith rate 0.15. This rank-4 tensor is given by
Riαjβ = 0.85× Tiαjβ +
0.15
NLuiαjβ , (5)
where Tiαjβ governs the standard moves of a classical random
walker from a node i in layer α to one of its neighbors j in layer β ,L is the total number of layers and uiαjβ is the rank-4 tensor with
all components equal to 1. The steady-state solution of the masterequation
πjβ (t + 1) =
N∑
i= 1
L∑
α= 1
Riαjβπiα(t), (6)
obtained in the limit t −→ ∞, provides the PageRank centralityfor interconnected multiplex networks. To compute the overallPageRank of a node, accounting for the whole interconnectedtopology, we can safely sum up the stationary probabilities π⋆
jβ
over the layers, to obtain the components of the centrality profile
vector π̃⋆j =
L∑
β=1
π⋆jβ used in our analysis. It is worth remarking
that the interconnection weight used for this purpose is D =
24.7708, the one yielding the highest classification accuracy.
FIGURE 2 | Frequency-dependent connectivity. Stacked histograms of structural descriptors where colors encode the contribution of each layer to each bin. The
distribution of the average degree (left panels), average strength (central panels) and assortative mixing coefficient (right panels) are shown for healthy (top) and
schizophrenic (bottom) subjects. For each panel, the dashed line indicates the median of the overall distribution (i.e., regardless of the frequency-dependent
contribution).
Frontiers in Neuroscience | www.frontiersin.org 5 July 2016 | Volume 10 | Article 326

De Domenico et al. Human Functional Brain Networks
RESULTS
Building Aggregated and MultiplexFunctional Connectivity NetworksWe use a publicly available COBRE data set of resting statefMRI, consisting of 71 patients affected by Schizophrenia and74 healthy controls (age: 18–65). The set of 264 regions ofinterest (ROIs) introduced by Power et al. (2011) is used toextract the mean signal within each ROI, for each individualseparately. After estimating coherence between all pairs of ROIs,the frequency-specific connectivity matrices are obtained byaveraging coherence within 12 frequency bands, defined bydecomposing the frequency range from 0.01 to 0.25 Hz intointervals with equal widths of 0.02 Hz. The upper bound ofthis frequency range corresponds to the Nyquist frequency offMRI signals, while the lower bound is obtained by followingconventional way to eliminate long term drift (Cordes et al.,2002).
Weighted adjacency matrices, defining the functional networkfor each frequency component separately, are yielded bydiscarding from frequency-specific connectivity matrices thoseconnections with non-significant amount of correlation (seeMaterials and Methods). The resulting multiplex network is
obtained, for each individual separately in control and patientgroups, by interconnecting the layers encoding functionalconnectivity in each frequency band (Figures 1A–C). Wealso define two single-layer networks, obtained by averagingcoherence signals within 0.01–0.25Hz and 0.01–0.1 Hz frequencyranges (Figure 1D). We refer to such conventional networks asfull-band and typical-band single-layer networks, respectively,both representing averaged and filtered versions of the fullmultiplex functional networks.
Frequency-Dependent Structural Analysisand Small-WorldnessFor each subject and for each layer of the correspondingmultiplex brain network, we calculate some well-knownstructural descriptors to better characterize the networks.
We show in Figure 2 the distribution of average degreeand average strength—characterizing ROI’s mean numberand weight, respectively, of functional connections in eachfrequency band—and ROI’s assortative mixing (Newman,2002)—characterizing the tendency of ROIs to connect to otherROIs with similar or dissimilar connectivity. For both healthyand schizophrenic brains we observe similar distributions and
FIGURE 3 | Frequency-dependent clustering. As in Figure 2, showing the distribution of edge density (left panels), average weighted clustering coefficient (central
panels) and modularity (right panels).
Frontiers in Neuroscience | www.frontiersin.org 6 July 2016 | Volume 10 | Article 326

De Domenico et al. Human Functional Brain Networks
positive assortativity, meaning that, on average, nodes withsimilar degree tend to be functionally connected each other.
Figure 3 shows the distribution of edge density—definedby the ratio between the number of links in the networkand the maximum number of possible connections—,average weighted clustering coefficient (Barrat et al., 2004)—characterizing the tendency of nodes to form weightedtriads—and modularity (Blondel et al., 2008)—quantifyingthe mesoscale organization of nodes into functional modules.We find that, in both groups, layers are moderately dense andmodular, with highly clustered ROIs.
Finally, we are interested in quantifying to which extent thecharacteristic path length of each layer (Figure 4, left panel)—defined by the average over all shortest paths connectingROIs each other—and the average local clustering (Figure 4,middle panel) are different from their expectation when usingan Erdos-Renyi graph, with the same number of nodes andedges, to model the network topology. We find that regardlessof the frequency band and the group, the functional brainnetworks are characterized by short average path length andhigh clustering, property typical of small-world topologies (Wattsand Strogatz, 1998). To better quantify this finding, we calculatethe small-world index (Humphries et al., 2006; Sporns, 2011)
defined by
S(f ) = (C̄(f )/Crand(f ))/(ℓ̄(f )/ℓrand(f )),
where C̄(f ) is the average local clustering coefficient and ℓ̄(f ) isthe average path length, with Crand(f ) and ℓrand(f ) being theirrandom expectations. These quantities are calculated for eachlayer separately and depend on the corresponding frequencyband. The results, shown in the right panel of Figure 4 confirmthat all layers are, on average, characterized by a small-worldtopology, being the median small-world index close to 2.5.
Structural Reducibility of the MultiplexFunctional Connectivity NetworkFirst, we verify if the multiplex network is a valid andsuitable model of the underlying brain connectivity. For thispurpose, we analyze the structural reducibility of a multiplexnetwork (De Domenico et al., 2015b), allowing to identifylayers carrying redundant topological information. The methodincorporates redundant layers into other ones to reduce theoverall structure, while still maximizing the distinguishabilitybetween the multiplex network model and the correspondingfully aggregated graph, obtained by summing up the connectivity
FIGURE 4 | Frequency-dependent small-worldness. As in Figure 2, showing the distribution of average path length (left panels), average local clustering
coefficient (central panels) and small-world index (right panels).
Frontiers in Neuroscience | www.frontiersin.org 7 July 2016 | Volume 10 | Article 326

De Domenico et al. Human Functional Brain Networks
of all layers (Figure 5A). The difference between connectivityin different layers is quantified by Jensen-Shannon divergence(see Materials and Methods), a powerful information-theoreticalmeasure of (dis)similarity. A quality function controls thereduction process and its global maxima identify optimalstructural reduction strategies.
We perform structural reducibility for each individualseparately and calculate the corresponding quality functions,for control and patients groups (Figure 5B). In both cases, wefound that the maximum value of the quality function is attainedwhen no reduction is performed at all, providing evidence thatthe topological information carried by each functional network,corresponding to a different frequency component, should notbe disregarded from structural analyses. It is worth noting thatthe behavior of the quality function alone does not allow todistinguish between the two groups of individuals.
To gain insights about (dis)similarities between differentlayers of the multiplex functional network in the two groups,we use the quantum Jensen-Shannon distance (see Materialand Methods) calculated during the structural reducibility
analysis. The distance matrix, whose entries provide the Jensen-Shannon distance between any pairs of layers, is first built foreach individual separately, and group average µ and standarddeviation σ are calculated. The signal-to-noise ratio (SNR)defined by their ratio is successively calculated for each pairof layers and for each group, separately (Figure 5C), as wellas the relative difference between the two group-averagedvalues. We observed differences of up to 30% in absolutevalue between the two groups, for specific pairs of layers.Dissimilarities between layers within the typical-band werehigher in healthy individuals than in schizophrenic patients.On one hand, functional connectivity in healthy subjects israther volatile and, in general, exhibits topological differencesacross individuals (Sasai et al., 2014) that we did not observe inpatients, suggesting the possibility that schizophrenia might alterbrain’s integrated operation to reduce such a functional diversity.On the other hand, an abnormal amount of dissimilaritybetween functional networks corresponding to other frequencybands (such as those within relatively higher ranges, e.g., 0.09–0.19 Hz) was observed in patients but not in healthy individuals.
FIGURE 5 | Structural reducibility of the multiplex functional network. (A) Schematic illustration of how the analysis structural reducibility of the network works:
it allows to identify frequency bands providing redundant topological information and to verify the validity of the multiplex model with respect to conventional
single-layer models. Global maxima in the quality function identify optimal structural reductions. (B) The median quality function is shown for healthy control (solid) and
schizophrenic patients (dashed), with shaded areas indicating the standard deviation around each value. (C) Signal-to-noise ratio (SNR; see text for further details) for
Jensen-Shannon distance calculated for each pair of layers, color-coded for both groups, and corresponding relative difference between the two groups.
Frontiers in Neuroscience | www.frontiersin.org 8 July 2016 | Volume 10 | Article 326
De Domenico et al. Human Functional Brain Networks
These results suggest that the dependence on frequency ofpatients’ functional connectivity is different from that of healthyindividuals and we might use such dissimilarity patterns as afingerprint of brain’s functional organization for each group.
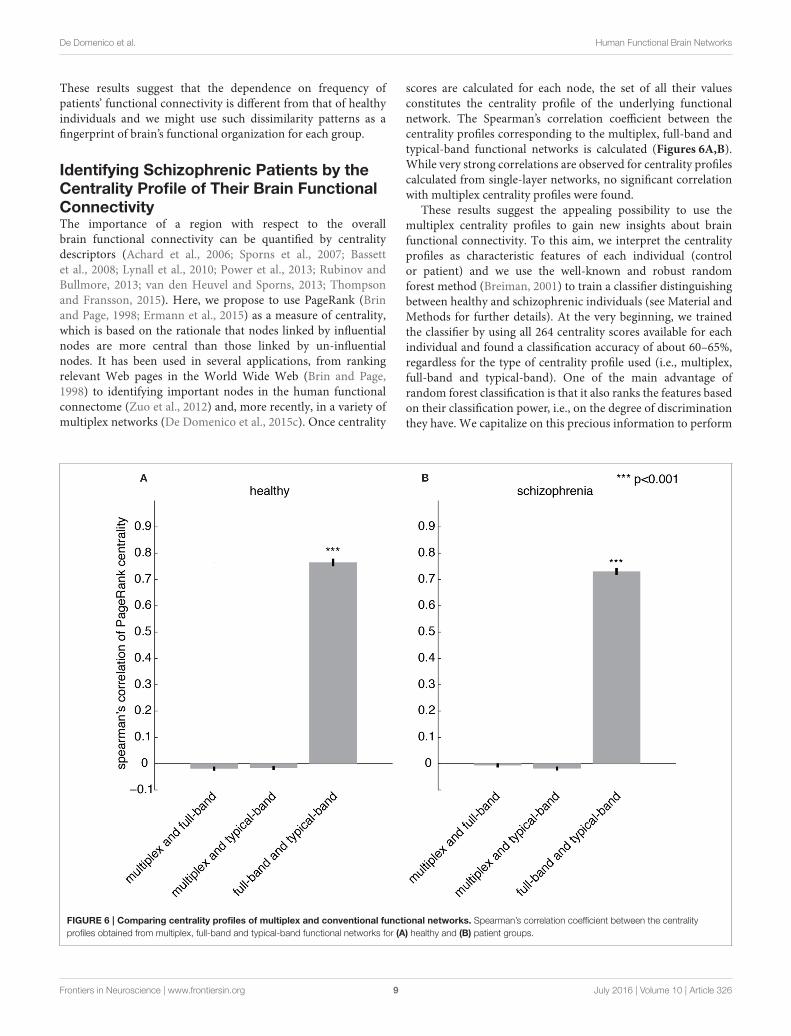
Identifying Schizophrenic Patients by theCentrality Profile of Their Brain FunctionalConnectivityThe importance of a region with respect to the overallbrain functional connectivity can be quantified by centralitydescriptors (Achard et al., 2006; Sporns et al., 2007; Bassettet al., 2008; Lynall et al., 2010; Power et al., 2013; Rubinov andBullmore, 2013; van den Heuvel and Sporns, 2013; Thompsonand Fransson, 2015). Here, we propose to use PageRank (Brinand Page, 1998; Ermann et al., 2015) as a measure of centrality,which is based on the rationale that nodes linked by influentialnodes are more central than those linked by un-influentialnodes. It has been used in several applications, from rankingrelevant Web pages in the World Wide Web (Brin and Page,1998) to identifying important nodes in the human functionalconnectome (Zuo et al., 2012) and, more recently, in a variety ofmultiplex networks (De Domenico et al., 2015c). Once centrality
scores are calculated for each node, the set of all their valuesconstitutes the centrality profile of the underlying functionalnetwork. The Spearman’s correlation coefficient between thecentrality profiles corresponding to the multiplex, full-band andtypical-band functional networks is calculated (Figures 6A,B).While very strong correlations are observed for centrality profilescalculated from single-layer networks, no significant correlationwith multiplex centrality profiles were found.
These results suggest the appealing possibility to use themultiplex centrality profiles to gain new insights about brainfunctional connectivity. To this aim, we interpret the centralityprofiles as characteristic features of each individual (controlor patient) and we use the well-known and robust randomforest method (Breiman, 2001) to train a classifier distinguishingbetween healthy and schizophrenic individuals (see Material andMethods for further details). At the very beginning, we trainedthe classifier by using all 264 centrality scores available for eachindividual and found a classification accuracy of about 60–65%,regardless for the type of centrality profile used (i.e., multiplex,full-band and typical-band). One of the main advantage ofrandom forest classification is that it also ranks the features basedon their classification power, i.e., on the degree of discriminationthey have. We capitalize on this precious information to perform
FIGURE 6 | Comparing centrality profiles of multiplex and conventional functional networks. Spearman’s correlation coefficient between the centrality
profiles obtained from multiplex, full-band and typical-band functional networks for (A) healthy and (B) patient groups.
Frontiers in Neuroscience | www.frontiersin.org 9 July 2016 | Volume 10 | Article 326
De Domenico et al. Human Functional Brain Networks
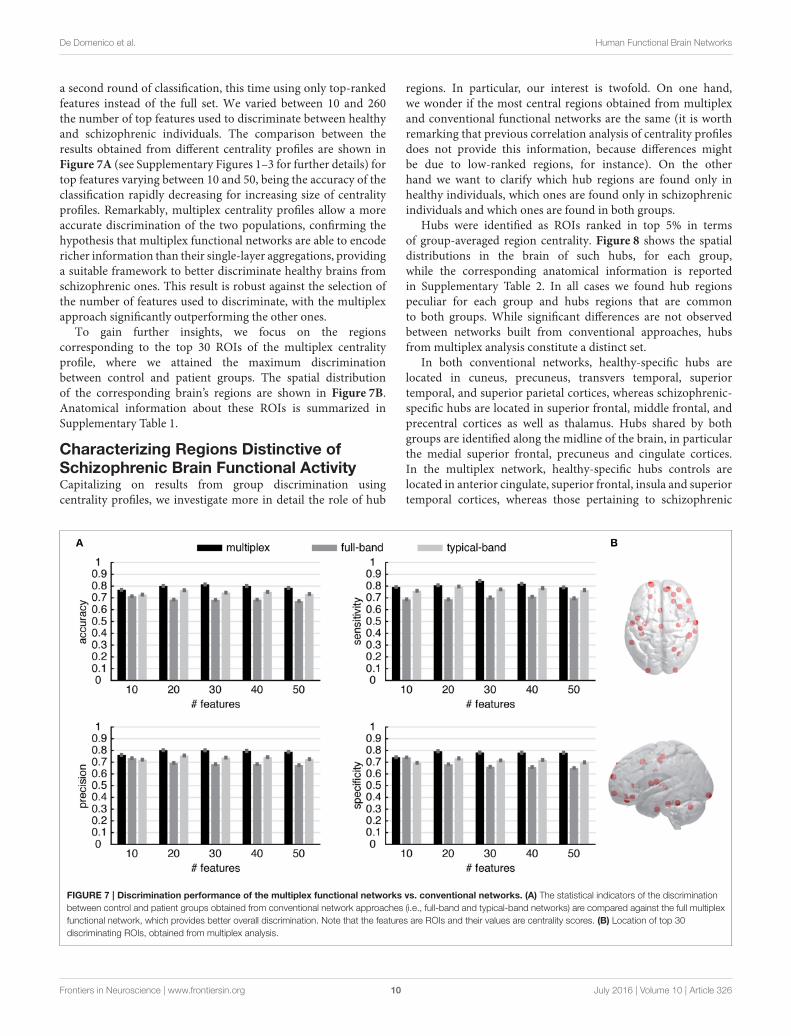
a second round of classification, this time using only top-rankedfeatures instead of the full set. We varied between 10 and 260the number of top features used to discriminate between healthyand schizophrenic individuals. The comparison between theresults obtained from different centrality profiles are shown inFigure 7A (see Supplementary Figures 1–3 for further details) fortop features varying between 10 and 50, being the accuracy of theclassification rapidly decreasing for increasing size of centralityprofiles. Remarkably, multiplex centrality profiles allow a moreaccurate discrimination of the two populations, confirming thehypothesis that multiplex functional networks are able to encodericher information than their single-layer aggregations, providinga suitable framework to better discriminate healthy brains fromschizophrenic ones. This result is robust against the selection ofthe number of features used to discriminate, with the multiplexapproach significantly outperforming the other ones.
To gain further insights, we focus on the regionscorresponding to the top 30 ROIs of the multiplex centralityprofile, where we attained the maximum discriminationbetween control and patient groups. The spatial distributionof the corresponding brain’s regions are shown in Figure 7B.Anatomical information about these ROIs is summarized inSupplementary Table 1.
Characterizing Regions Distinctive ofSchizophrenic Brain Functional ActivityCapitalizing on results from group discrimination usingcentrality profiles, we investigate more in detail the role of hub
regions. In particular, our interest is twofold. On one hand,we wonder if the most central regions obtained from multiplexand conventional functional networks are the same (it is worthremarking that previous correlation analysis of centrality profilesdoes not provide this information, because differences mightbe due to low-ranked regions, for instance). On the otherhand we want to clarify which hub regions are found only inhealthy individuals, which ones are found only in schizophrenicindividuals and which ones are found in both groups.
Hubs were identified as ROIs ranked in top 5% in termsof group-averaged region centrality. Figure 8 shows the spatialdistributions in the brain of such hubs, for each group,while the corresponding anatomical information is reportedin Supplementary Table 2. In all cases we found hub regionspeculiar for each group and hubs regions that are commonto both groups. While significant differences are not observedbetween networks built from conventional approaches, hubsfrom multiplex analysis constitute a distinct set.
In both conventional networks, healthy-specific hubs arelocated in cuneus, precuneus, transvers temporal, superiortemporal, and superior parietal cortices, whereas schizophrenic-specific hubs are located in superior frontal, middle frontal, andprecentral cortices as well as thalamus. Hubs shared by bothgroups are identified along the midline of the brain, in particularthe medial superior frontal, precuneus and cingulate cortices.In the multiplex network, healthy-specific hubs controls arelocated in anterior cingulate, superior frontal, insula and superiortemporal cortices, whereas those pertaining to schizophrenic
FIGURE 7 | Discrimination performance of the multiplex functional networks vs. conventional networks. (A) The statistical indicators of the discrimination
between control and patient groups obtained from conventional network approaches (i.e., full-band and typical-band networks) are compared against the full multiplex
functional network, which provides better overall discrimination. Note that the features are ROIs and their values are centrality scores. (B) Location of top 30
discriminating ROIs, obtained from multiplex analysis.
Frontiers in Neuroscience | www.frontiersin.org 10 July 2016 | Volume 10 | Article 326

De Domenico et al. Human Functional Brain Networks
FIGURE 8 | Brain regions playing the role of hubs in functional connectivity. The most central regions, i.e., hubs, identified in multiplex and conventional
functional networks are shown (from top to bottom). Markers indicate their locations, whereas panels from left-hand to right-hand side show hubs found only in
healthy controls (left), only in schizophrenic patients (center), or in both (right).
patients are distributed over frontal, parietal and occipitalcortices. Hub regions shared by both groups groups are localizedin frontal, occipital cortices and cerebellum. Notably, no hubregion has been identified in the precuneus cortex, a region wellknown to function as a hub in healthy individuals (van denHeuvel and Sporns, 2013).
Finally, we compared the top 30 hubs found in each groupagainst the top 30 distinctive ROIs found from the classificationprocedure previously described. In the case of random forestclassification, we ranked ROIs by their average rank to identifythe most discriminating ones; let us indicate by Rclass the setof the top 30 ROIs according to this ranking. Similarly, we firstrank the ROIs by their PageRank versatility and then calculate
their group-averaged ranks; let us indicate by RHpr and R
Spr the
sets of the top 30 ROIs found in healthy and schizophrenicgroups, respectively, according to this ranking. In the case ofhealthy subjects, 3 hubs inR
Hpr are found to be also discriminating
features; the Jaccard index of the two sets is 0.053. Remarkably,in the case of schizophrenic subjects, 13 hubs inR
Spr are found to
be also discriminating features; the Jaccard index of the two setsis 0.277. The ROIs corresponding to the two cases are reportedin Supplementary Table 4. This finding confirms that highlycentral regions in schizophrenic brains are different from highlycentral regions in healthy brains, and that this result can be usedin practical applications to better identify patients affected byschizophrenia.
Frontiers in Neuroscience | www.frontiersin.org 11 July 2016 | Volume 10 | Article 326

De Domenico et al. Human Functional Brain Networks
DISCUSSION
Resting state functional connectivity has been widely investigatedwith fMRI in the past two decades. Since the first study conductedby Biswal et al. (1995), functional connectivity has been definedas an inter-regional temporal correlation of fMRI signals thatare preprocessed with band-pass filters, removing frequencycomponents below 0.01 and above 0.1 Hz. In fact, the powerspectrum of spontaneous fluctuations of fMRI signals roughlyfollows a 1/f power-law scaling (He, 2011), where powers in thehigher frequency range are relatively weaker than lower ones,suggesting the hypothesis that only the lower frequency rangesubstantially contributes to brain’s function. However, recentstudies have reported that conventionally excluded frequencybands might provide additional insights on brain activity (Bassettet al., 2006; Liao et al., 2013; Sasai et al., 2014; Chen and Glover,2015; Thompson and Fransson, 2015). As a consequence, brainfunctional networks exhibit a peculiar architecture, consistingof a few regions acting as hubs, strongly dependent on thefrequency components of brain activity that contribute to inter-regional interactions. However, a rigorous method to identifysuch hubs in networks built from different frequency bandssimultaneously is a challenging problem remaining largelyunexplored.
Our results, based on multiplex modeling and analysis of thebrain activity, provide convincing evidence that characterizationof brain functional networks can not prescind from consideringthe whole information observed from different frequencybands, simultaneously. This crucial finding allows to exploitnew theoretical and computational tools for the analysis ofbrain activity and opens a new direction toward a deeperunderstanding of brain function and its operated integration. Asa first hint of the power of the new methodology, we have shownthat multiplex characterization of brain regions, in terms ofnetwork centrality, allows to find new areas of the brain that havenever been classified as relevant in brain’s functional integration(or the opposite). This is the case of ROIs in the precuneuscortex, a well-known region of highly central functional hubs(van den Heuvel and Sporns, 2013), that are not found byour multiplex network analysis, reflecting the importance ofconsidering the whole information simultaneously, rather thanaggregating or neglecting part of it (De Domenico et al.,2015c).
We wondered if this result could be exploited for practicalapplications, where the choice of specific frequency bands mightplay a crucial role. We focused our attention on characterizingbrain disorders in schizophrenic patients, a research topic ofgreat interest that has been largely explored (Bassett et al.,2008; Lynall et al., 2010; van den Heuvel et al., 2013), althoughindividual diagnosis based on brain imaging remains stillundeveloped (Rubinov and Bullmore, 2013). With the aid ofthe MRI technique, it has been recently shown that regionsaffected by schizophrenia are distributed across the brain (Glahnet al., 2008; Ellison-Wright and Bullmore, 2009), impellingresearchers to move from the conventional perspective wherethe causes of disorders are localized in specific areas, to a widerperspective with emphasis on abnormality in brain structural
and functional connectivity (van den Heuvel and Fornito,2014). Studies on structural connectivity provided evidence thatschizophrenic brains exhibit abnormal network architecture,characterized by reduced hierarchical organization, the lossof frontal hubs with emergence of non-frontal hubs (Bassettet al., 2008; Lynall et al., 2010) and degraded rich-cluborganization (van den Heuvel et al., 2013). Methods not basedon networks were able to provide satisfactory performance indiscriminating schizophrenic patients from the analysis of theirbrain activity (Yang et al., 2010; Chyzhyk et al., 2015), althoughthey are often based on very complicated machine learningalgorithms and make use of heterogenous data sources, thus notimproving our understanding of brain function. Here, we havefound that multiplex centrality profile of brain regions allowto discriminate between control and schizophrenic groups ofindividuals more accurately than centrality profiles calculatedfrom networks obtained by using conventional approaches,such as aggregating and/or disregarding the measured activity.Nevertheless, the discrimination accuracy is comparable toother methods, with the additional advantage of providinga framework facilitating the interpretation of results, withoutrelying on external data sources or phenotypic information.In fact, we were able to identify many regions distinctive ofschizophrenic brains, some of them localized where abnormalityhas been previously suggested (Honea et al., 2005; Rubinovand Bullmore, 2013). The analysis of dissimilarities betweennetworks corresponding to different layers of the multiplexfunctional network, confirmed significant differences betweenhealthy and schizophrenic individuals in specific frequencyranges, including the higher ones. This finding demonstratesthat brain activity in higher frequencies provides uniqueinformation about functional interaction in the brain, evenif their amplitudes are under-represented in the powerspectrum.
Nevertheless, the present study presents some limitations.First, the sampling rate of fMRI signals (0.5 Hz) is lower thanthe values recently used to investigate frequency-specificity offunctional connectivity (Wu et al., 2013; Gohel and Biswal,2015). We think that a future study would benefit fromtaking into account a wider frequency range, as the oneprovided by a higher sampling rate. Second, neural mechanismsgenerating frequency components of fMRI and their interactionsstill remain unclear. Electrophysiological signals, as well asfMRI signals, include many different frequency componentsshowing distinct network topology (Siegel et al., 2012). Thefact that electrophysiological studies have repeatedly showncross-frequency coupling as a mechanism of interactionsbetween different frequency layers (Canolty et al., 2006; Tortet al., 2009; Axmacher et al., 2010; Belluscio et al., 2012),we conjecture that inter-layer interactions between functionalnetworks built in the present study may reflect the correspondingmechanism in the case of fMRI signals. The differencesbetween healthy and schizophrenic functional brains foundin our study are related to some layers, suggesting thatpathological abnormality in schizophrenia may occur on neuralmechanisms with specific frequency-dependent fingerprints.Further studies, for instance with simultaneous recording of
Frontiers in Neuroscience | www.frontiersin.org 12 July 2016 | Volume 10 | Article 326

De Domenico et al. Human Functional Brain Networks
electroencephalography and fMRI, could allow us to examine theelectrophysiological background of fMRI frequency componentsand possible mechanisms of interactions between differentcomponents.
The proposed methodology suggests a guideline for futurestudies designed to consider brain’s inter-regional interactionsat different frequencies, encouraging the application of othermultiplex network measures to functional networks obtained, forinstance, from variable brain states.
AUTHOR CONTRIBUTIONS
MDand SS contributed equally to this work. MD and SS analyzedthe data and performed the analysis. MD, SS, and AA designedthe study and wrote the paper.
ACKNOWLEDGMENTS
MD acknowledges financial support from the Spanish programJuan de la Cierva (IJCI-2014-20225). SS was supported byJSPS Postdoctoral Fellowships for Research Abroad. AAacknowledges financial support from ICREA Academia andJames S. McDonnell Foundation and Spanish MINECOFIS2015-71582. This work has been partially supported byMINECO through Grant FIS2012-38266.
SUPPLEMENTARY MATERIAL
The Supplementary Material for this article can be foundonline at: http://journal.frontiersin.org/article/10.3389/fnins.2016.00326
REFERENCES
Achard, S., Salvador, R., Whitcher, B., Suckling, J., and Bullmore, E. (2006).
A resilient, low-frequency, small-world human brain functional network
with highly connected association cortical hubs. J. Neurosci. 26, 63–72. doi:
10.1523/JNEUROSCI.3874-05.2006
Anderson, J. S., Druzgal, T. J., Lopez-Larson, M., Jeong, E.-K., Desai, K., and
Yurgelun-Todd, D. (2011). Network anticorrelations, global regression, and
phase-shifted soft tissue correction. Hum. Brain Mapp. 32, 919–934. doi:
10.1002/hbm.21079
Axmacher, N., Henseler, M. M., Jensen, O., Weinreich, I., Elger, C. E., and Fell,
J. (2010). Cross-frequency coupling supports multi-item working memory in
the human hippocampus. Proc. Natl. Acad. Sci. U.S.A. 107, 3228–3233. doi:
10.1073/pnas.0911531107
Barrat, A., Barthelemy, M., Pastor-Satorras, R., and Vespignani, A. (2004). The
architecture of complex weighted networks. Proc. Natl. Acad. Sci. U.S.A. 101,
3747–3752. doi: 10.1073/pnas.0400087101
Bassett, D. S., and Bullmore, E. (2006). Small-world brain networks. Neuroscientist
12, 512–523. doi: 10.1177/1073858406293182
Bassett, D. S., Bullmore, E., Verchinski, B. A., Mattay, V. S., Weinberger,
D. R., and Meyer-Lindenberg, A. (2008). Hierarchical organization of human
cortical networks in health and schizophrenia. J. Neurosci. 28, 9239–9248. doi:
10.1523/JNEUROSCI.1929-08.2008
Bassett, D. S., Meyer-Lindenberg, A., Achard, S., Duke, T., and Bullmore,
E. (2006). Adaptive reconfiguration of fractal small-world human brain
functional networks. Proc. Natl. Acad. Sci. U.S.A. 103, 19518–19523. doi:
10.1073/pnas.0606005103
Bassett, D. S., Wymbs, N. F., Porter, M. A., Mucha, P. J., Carlson, J. M.,
and Grafton, S. T. (2011). Dynamic reconfiguration of human brain
networks during learning. Proc. Natl. Acad. Sci. U.S.A. 108, 7641–7646. doi:
10.1073/pnas.1018985108
Bassett, D. S., Wymbs, N. F., Rombach, M. P., Porter, M. A., Mucha, P. J.,
and Grafton, S. T. (2013). Task-based core-periphery organization of human
brain dynamics. PLoS Comput. Biol. 9:e1003171. doi: 10.1371/journal.pcbi.10
03171
Belluscio, M. A., Mizuseki, K., Schmidt, R., Kempter, R., and Buzsáki, G. (2012).
Cross-frequency phase–phase coupling between theta and gamma oscillations
in the hippocampus. J. Neurosci. 32, 423–435. doi: 10.1523/JNEUROSCI.4122-
11.2012
Biswal, B., Yetkin, F. Z., Haughton, V. M., and Hyde, J. S. (1995). Functional
connectivity in the motor cortex of resting human brain using echo-planar
MRI.Magn. Reson. Med. 34, 537–541. doi: 10.1002/mrm.1910340409
Blondel, V. D., Guillaume, J.-L., Lambiotte, R., and Lefebvre, E. (2008). Fast
unfolding of communities in large networks. J. Stat. Mech. 2008:P10008. doi:
10.1088/1742-5468/2008/10/P10008
Boccaletti, S., Bianconi, G., Criado, R., Del Genio, C., Gómez-Gardeñes, J.,
Romance, M., et al. (2014). The structure and dynamics of multilayer networks.
Phys. Rep. 544, 1–122. doi: 10.1016/j.physrep.2014.07.001
Braun, U., Schäfer, A., Walter, H., Erk, S., Romanczuk-Seiferth, N., Haddad,
L., et al. (2015). Dynamic reconfiguration of frontal brain networks during
executive cognition in humans. Proc. Natl. Acad. Sci. U.S.A. 112, 11678–11683.
doi: 10.1073/pnas.1422487112
Braunstein, S. L., Ghosh, S., and Severini, S. (2006). The laplacian of a graph as a
density matrix: a basic combinatorial approach to separability of mixed states.
Ann. Combinat. 10, 291–317. doi: 10.1007/s00026-006-0289-3
Breiman, L. (2001). Random forests. Mach. Learn. 45, 5–32. doi: 10.1023/A:10109
33404324
Brin, S., and Page, L. (1998). “The anatomy of a large-scale hypertextual web
search engine,” in Proceedings of the Seventh International Conference on World
Wide Web 7, WWW7 (Amsterdam: Elsevier Science Publishers), 107–117. doi:
10.1016/s0169-7552(98)00110-x
Bullmore, E., and Sporns, O. (2009). Complex brain networks: graph theoretical
analysis of structural and functional systems. Nat. Rev. Neurosci. 10, 186–198.
doi: 10.1038/nrn2575
Bullmore, E., and Sporns, O. (2012). The economy of brain network organization.
Nat. Rev. Neurosci. 13, 336–349. doi: 10.1038/nrn3214
Canolty, R. T., Edwards, E., Dalal, S. S., Soltani, M., Nagarajan, S. S., Kirsch, H. E.,
et al. (2006). High gamma power is phase-locked to theta oscillations in human
neocortex. Science 313, 1626–1628. doi: 10.1126/science.1128115
Chavez, M., Valencia, M., Navarro, V., Latora, V., and Martinerie, J. (2010).
Functional modularity of background activities in normal and epileptic
brain networks. Phys. Rev. Lett. 104:118701. doi: 10.1103/PhysRevLett.104.
118701
Chen, J. E., and Glover, G. H. (2015). BOLD fractional contribution to resting-
state functional connectivity above 0.1 Hz. NeuroImage 107, 207–218. doi:
10.1016/j.neuroimage.2014.12.012
Chyzhyk, D., Savio, A., and Graña, M. (2015). Computer aided diagnosis of
schizophrenia on resting state fMRI data by ensembles of ELM. Neural Netw.
68, 23–33. doi: 10.1016/j.neunet.2015.04.002
Cordes, D., Haughton, V., Carew, J. D., Arfanakis, K., and Maravilla, K.
(2002). Hierarchical clustering to measure connectivity in fMRI resting-
state data. Magn. Reson. Imaging 20, 305–317. doi: 10.1016/S0730-725X(02)0
0503-9
Cordes, D., Haughton, V. M., Arfanakis, K., Carew, J. D., Turski, P. A., Moritz,
C. H., et al. (2001). Frequencies contributing to functional connectivity in the
cerebral cortex in resting-state data. Am. J. Neuroradiol. 22, 1326–1333.
De Domenico, M., Lancichinetti, A., Arenas, A., and Rosvall, M. (2015a).
Identifying modular flows on multilayer networks reveals highly overlapping
organization in interconnected systems. Phys. Rev. X 5:011027. doi:
10.1103/PhysRevX.5.011027
De Domenico, M., Nicosia, V., Arenas, A., and Latora, V. (2015b). Structural
reducibility of multilayer networks. Nat. Commun. 6:6864. 10.1038/nco
mms7864
De Domenico, M., Solè-Ribalta, A., Cozzo, E., Kivelä, M., Moreno, Y., Porter,
M. A., et al. (2013). Mathematical formulation of multi-layer networks. Phys.
Rev. X 3:041022. doi: 10.1103/PhysRevX.3.041022
Frontiers in Neuroscience | www.frontiersin.org 13 July 2016 | Volume 10 | Article 326

De Domenico et al. Human Functional Brain Networks
De Domenico, M., Solé-Ribalta, A., Gómez, S., and Arenas, A. (2014). Navigability
of interconnected networks under random failures. Proc. Natl. Acad. Sci. U.S.A.
111, 8351–8356. doi: 10.1073/pnas.1318469111
De Domenico, M., Solé-Ribalta, A., Omodei, E., Gómez, S., and Arenas, A. (2015c).
Ranking in interconnected multilayer networks reveals versatile nodes. Nat.
Commun. 6, 6868–6868. doi: 10.1038/ncomms7868
Ellison-Wright, I., and Bullmore, E. (2009). Meta-analysis of diffusion
tensor imaging studies in schizophrenia. Schizophr. Res. 108, 3–10. doi:
10.1016/j.schres.2008.11.021
Ermann, L., Frahm, K. M., and Shepelyansky, D. L. (2015). Google matrix
analysis of directed networks. Rev. Mod. Phys. 87, 1261–1310. doi:
10.1103/RevModPhys.87.1261
Fox, M. D., and Raichle, M. E. (2007). Spontaneous fluctuations in brain activity
observed with functional magnetic resonance imaging. Nat. Rev. Neurosci. 8,
700–711. doi: 10.1038/nrn2201
Glahn, D. C., Laird, A. R., Ellison-Wright, I., Thelen, S. M., Robinson, J. L.,
Lancaster, J. L., et al. (2008). Meta-analysis of gray matter anomalies in
schizophrenia: application of anatomic likelihood estimation and network
analysis. Biol. Psychiatry 64, 774–781. doi: 10.1016/j.biopsych.2008.03.031
Gohel, S. R., and Biswal, B. B. (2015). Functional integration between brain
regions at rest occurs in multiple-frequency bands. Brain Connect. 5, 23–34.
doi: 10.1089/brain.2013.0210
Gomez, S., Diaz-Guilera, A., Gomez-Gardeñes, J., Perez-Vicente, C. J., Moreno, Y.,
and Arenas, A. (2013). Diffusion dynamics on multiplex networks. Phys. Rev.
Lett. 110:028701. PhysRevLett.110.028701
He, B. J. (2011). Scale-free properties of the functional magnetic resonance
imaging signal during rest and task. J. Neurosci. 31, 13786–13795. doi:
10.1523/JNEUROSCI.2111-11.2011
Honea, R., Crow, T. J., Passingham, D., and Mackay, C. E. (2005). Regional deficits
in brain volume in schizophrenia: a meta-analysis of voxel-based morphometry
studies. Am. J. Psychiatry 162, 2233–2245. doi: 10.1176/appi.ajp.162.12.2233
Humphries, M. D., Gurney, K., and Prescott, T. J. (2006). The brainstem reticular
formation is a small-world, not scale-free, network. Proc. R. Soc. Lond. B Biol.
Sci. 273, 503–511. doi: 10.1098/rspb.2005.3354
Kivelä, M., Arenas, A., Barthelemy, M., Gleeson, J. P., Moreno, Y., and
Porter, M. A. (2014). Multilayer networks. J. Comp. Netw. 2, 203–271. doi:
10.1093/comnet/cnu016
Liao, X.-H., Xia, M.-R., Xu, T., Dai, Z.-J., Cao, X.-Y., Niu, H.-J., et al. (2013).
Functional brain hubs and their test–retest reliability: a multiband
resting-state functional mri study. Neuroimage 83, 969–982. doi:
10.1016/j.neuroimage.2013.07.058
Lynall, M.-E., Bassett, D. S., Kerwin, R., McKenna, P. J., Kitzbichler, M., Muller, U.,
et al. (2010). Functional connectivity and brain networks in schizophrenia. J.
Neurosci. 30, 9477–9487. doi: 10.1523/JNEUROSCI.0333-10.2010
Mantini, D., Perrucci, M. G., Del Gratta, C., Romani, G. L., and Corbetta,
M. (2007). Electrophysiological signatures of resting state networks in
the human brain. Proc. Natl. Acad. Sci. U.S.A. 104, 13170–13175. doi:
10.1073/pnas.0700668104
Mucha, P. J., Richardson, T., Macon, K., Porter, M. A., and Onnela, J.-P. (2010).
Community structure in time-dependent, multiscale, and multiplex networks.
Science 328, 876–878. doi: 10.1126/science.1184819
Newman, M. E. (2002). Assortative mixing in networks. Phys. Rev. Lett. 89:208701.
doi: 10.1103/PhysRevLett.89.208701
Passerini, F., and Severini, S. (2010). “Quantifying disorder in networks: the
von neumann entropy,” in Developments in Intelligent Agent Technologies and
Multi-Agent Systems: Concepts and Applications: Concepts and Applications,
ed G. Trajkovski (Hershey, PA: IGI Global), 66.
Poldrack, R. A., and Farah, M. J. (2015). Progress and challenges in
probing the human brain. Nature 526, 371–379. doi: 10.1038/nature
15692
Power, J. D., Cohen, A. L., Nelson, S. M., Wig, G. S., Barnes, K. A., Church, J. A.,
et al. (2011). Functional network organization of the human brain. Neuron 72,
665–678. doi: 10.1016/j.neuron.2011.09.006
Power, J. D., Schlaggar, B. L., Lessov-Schlaggar, C. N., and Petersen, S. E. (2013).
Evidence for hubs in human functional brain networks. Neuron 79, 798–813.
doi: 10.1016/j.neuron.2013.07.035
Rubinov, M., and Bullmore, E. (2013). Schizophrenia and abnormal brain network
hubs. Dialogues Clin. Neurosci. 15, 339–349.
Rubinov, M., and Sporns, O. (2010). Complex network measures of brain
connectivity: uses and interpretations. Neuroimage 52, 1059–1069. doi:
10.1016/j.neuroimage.2009.10.003
Sasai, S., Homae, F., Watanabe, H., Sasaki, A., Tanabe, H., Sadato, N., et al. (2014).
Frequency-specific network topologies in the resting human brain. Front. Hum.
Neurosci. 8:1022. doi: 10.3389/fnhum.2014.01022
Siegel, M., Donner, T. H., and Engel, A. K. (2012). Spectral fingerprints of large-
scale neuronal interactions. Nat. Rev. Neurosci. 13, 121–134. doi: 10.1038/nr
n3137
Sporns, O. (2011). The non-random brain: efficiency, economy, and complex
dynamics. Front. Comput. Neurosci. 5:5. doi: 10.3389/fncom.2011.00005
Sporns, O., Honey, C. J., and Kötter, R. (2007). Identification and classification of
hubs in brain networks. PLoS ONE 2:e1049. doi: 10.1371/journal.pone.0001049
Supekar, K., Menon, V., Rubin, D., Musen, M., and Greicius, M. D. (2008).
Network analysis of intrinsic functional brain connectivity in alzheimer’s
disease. PLoS Comput. Biol. 4:e1000100. doi: 10.1371/journal.pcbi.1000100
Thompson, W. H., and Fransson, P. (2015). The frequency dimension
of fmri dynamic connectivity: network connectivity, functional hubs
and integration in the resting brain. NeuroImage 121, 227–242. doi:
10.1016/j.neuroimage.2015.07.022
Tort, A. B., Komorowski, R. W., Manns, J. R., Kopell, N. J., and Eichenbaum,
H. (2009). Theta–gamma coupling increases during the learning of item–
context associations. Proc. Natl. Acad. Sci. U.S.A. 106, 20942–20947. doi:
10.1073/pnas.0911331106
van den Heuvel, M. P., and Fornito, A. (2014). Brain networks in schizophrenia.
Neuropsychol. Rev. 24, 32–48. doi: 10.1007/s11065-014-9248-7
Van Den Heuvel, M. P., and Pol, H. E. H. (2010). Exploring the brain
network: a review on resting-state fMRI functional connectivity. Eur.
Neuropsychopharmacol. 20, 519–534. doi: 10.1016/j.euroneuro.2010.03.008
van den Heuvel, M. P., and Sporns, O. (2013). Network hubs in the human brain.
Trends Cogn. Sci. 17, 683–696. doi: 10.1016/j.tics.2013.09.012
van den Heuvel, M. P., Sporns, O., Collin, G., Scheewe, T., Mandl, R. C.,
Cahn, W., et al. (2013). Abnormal rich club organization and functional
brain dynamics in schizophrenia. JAMA Psychiatry 70, 783–792. doi:
10.1001/jamapsychiatry.2013.1328
Watts, D. J., and Strogatz, S. H. (1998). Collective dynamics of small-world
networks. Nature 393, 440–442. doi: 10.1038/30918
Wu, G.-R., Stramaglia, S., Chen, H., Liao, W., and Marinazzo, D. (2013). Mapping
the voxel-wise effective connectome in resting state fMRI. PLoS ONE 8:e73670.
doi: 10.1371/journal.pone.0073670
Yang, H., Liu, J., Sui, J., Pearlson, G., and Calhoun, V. D. (2010). A hybrid
machine learning method for fusing fMRI and genetic data: combining both
improves classification of schizophrenia. Front. Hum. Neurosci. 4:192. doi:
10.3389/fnhum.2010.00192
Zuo, X.-N., Ehmke, R., Mennes, M., Imperati, D., Castellanos, F. X., Sporns, O.,
et al. (2012). Network centrality in the human functional connectome. Cereb.
Cortex 22, 1862–1875. doi: 10.1093/cercor/bhr269
Conflict of Interest Statement: The authors declare that the research was
conducted in the absence of any commercial or financial relationships that could
be construed as a potential conflict of interest.
Copyright © 2016 De Domenico, Sasai and Arenas. This is an open-access article
distributed under the terms of the Creative Commons Attribution License (CC BY).
The use, distribution or reproduction in other forums is permitted, provided the
original author(s) or licensor are credited and that the original publication in this
journal is cited, in accordance with accepted academic practice. No use, distribution
or reproduction is permitted which does not comply with these terms.
Frontiers in Neuroscience | www.frontiersin.org 14 July 2016 | Volume 10 | Article 326