mapping luminous blue compact galaxies with … · mapping luminous blue compact galaxies with...
TRANSCRIPT

Astronomy & Astrophysics manuscript no. virus-preprint c© ESO 2012September 4, 2012
Mapping Luminous Blue Compact Galaxies with VIRUS-P:morphology, line ratios and kinematics
L. M. Cairos1, N. Caon2,3, B. Garcıa Lorenzo2,3, A. Kelz1, M. Roth1, P. Papaderos4, and O. Streicher1
1 Leibniz-Institut fur Astrophysik, An der Sternwarte 16, D-14482 Potsdam, Germanye-mail: luzma; akelz; mmroth; [email protected]
2 Instituto de Astrofısica de Canarias, E-38200 La Laguna, Tenerife, Spain3 Departamento de Astrofısica, Universidad de la Laguna, E-38206 La Laguna, Tenerife, Spain
e-mail: nicola.caon; [email protected] Centro de Astrofısica and Faculdade de Ciencias, Universidade do Porto, Rua das Estrelas, 4150-762 Porto, Portugal
e-mail: [email protected]
Received May 15, 2012; accepted August 29, 2012
ABSTRACT
Context. Blue Compact Galaxies (BCG) are narrow emission-line systems, undergoing a violent burst of star formation. They arecompact, low-luminosity galaxies, with blue colors and low chemical abundances, that offer us a unique opportunity to investigatecollective star formation and its effects on galaxy evolution in a relatively simple, dynamically unperturbed environment. Spatiallyresolved spectrophotometric studies of BCGs are essential for a better understanding of the role of starburst-driven feedback processeson the kinematical and chemical evolution of low-mass galaxies near and far.Aims. We carry out an integral field spectroscopy (IFS) study of a sample of luminous BCGs, with the aim to probe the morphology,kinematics, dust extinction and excitation mechanisms of their warm interstellar medium (ISM).Methods. IFS data for five luminous BCGs were obtained using VIRUS-P, the prototype instrument for the Visible Integral FieldReplicable Unit Spectrograph, attached to the 2.7 m Harlan J. Smith Telescope at the McDonald Observatory. VIRUS-P consists of asquare array of 247 optical fibers, which covers a 109′′ × 109′′ field of view, with a spatial sampling of 4.′′2 and a 0.3 filling factor.We observed in the 3550–5850 Å spectral range, with a resolution of 5 Å FWHM. From these data we built two-dimensional mapsof the continuum and the most prominent emission-lines ([O ii] λ3727, Hγ, Hβ and [O iii] λ5007), and investigate the morphologyof diagnostic emission-line ratios and the extinction patterns in the ISM as well as stellar and gas kinematics. Additionally, fromintegrated spectra we infer total line fluxes and luminosity-weighted extinction coefficients and gas-phase metallicities.Results. All galaxies exhibit an overall regular morphology in the stellar continuum, while their warm ISM morphology is morecomplex: in II Zw 33 and Mrk 314, the star-forming regions are aligned along a chain-structure; Haro 1, NGC 4670 and III Zw 102display several salient features, such as extended gaseous filaments and bubbles. A significant intrinsic absorption by dust is presentin all galaxies, the most extreme case being III Zw 102. Our data reveal a manifold of kinematical patterns, from overall regular gasand stellar rotation to complex velocity fields produced by structurally and kinematically distinct components.
Key words. galaxies: starburst - galaxies: dwarf - galaxies: abundances - galaxies: kinematics and dynamics
1. Introduction
Blue Compact Galaxies (BCGs) are low-luminosity (MB rangesfrom −12 to −21) and low-metallicity (7.0 ≤ 12 + log(O/H) ≤8.4) systems, which have optical spectra similar to those of H iiregions in spiral galaxies (Thuan & Martin 1981; Kunth & Ostlin2000). With star formation rates between 0.1 and 1 M� yr−1
(Fanelli et al. 1988; Hunter & Elmegreen 2004), they representthe most extreme manifestation of star-forming (SF) activity inlate-type dwarf galaxies in the local Universe.
BCGs are of paramount importance in extragalactic astron-omy and observational cosmology research, as they hold keyclues to understand fundamental topics such as galaxy formationand evolution, and the ignition and self-regulation of SF activityin relatively isolated late-type galaxies.
They represent an unparalleled link to the early Universe,since in the well accepted framework of a Cold Dark Matter(CDM) Universe, structure formed hierarchically, with smallscale objects (low mass halos) collapsing first at relatively largeredshifts. About two percent of the BCGs have very low metal-
licities, (12 + log (O/H) ≤ 7.65); these objects, often referredto as eXtremely Metal Deficient (XBCD) galaxies (Papaderoset al. 2008), constitute the best local analogs to the distant sub-galactic units from which larger galaxies are formed (Papaderoset al. 1998; Kniazev et al. 2004). Also, the more luminous BCGs(or different subsamples of them) have been regarded as the lo-cal counterparts of different high redshift SF galaxy populations(Mas-Hesse et al. 2003; Grimes et al. 2009). Detailed analysisof these nearby objects are essential to interpret the observationsof the more distant SF galaxy population, as their proximity al-lows for studies focused on their stellar content, kinematics andabundances, with an accuracy and spatial resolution that cannotbe achieved at higher redshifts (Cairos et al. 2009a,b, 2010).
Moreover, low-luminosity systems are the best laboratoriesto study the star-formation process. Without spiral density wavesto act as a triggering mechanism for star formation, these galax-ies enable us to investigate in an unbiased manner all of the otherfactors that trigger and control SF activities. In addition, BCGsoffer a unique opportunity to test star-formation models at verylow metallicities, similar to those of the early Universe.
1
arX
iv:1
209.
0310
v1 [
astr
o-ph
.CO
] 3
Sep
201
2

L. M. Cairos et al.: Mapping Luminous Blue Compact Galaxies with VIRUS-P
In spite of the strong interest gained for BCGs in the lastdecades, several key issues in the field, namely, the evolutionarystatus of BCGs, their Star Forming History (SFH) or the mecha-nisms that trigger their star-forming activity, are still open.
One of the reasons is probably that most of the BCG workpublished so far deal with analysis of samples by means of sur-face photometry (Papaderos et al. 1996; Cairos et al. 2001a,b;Doublier et al. 1997, 1999; Gil de Paz et al. 2003; Gil de Paz& Madore 2005), and spectroscopic studies typically only coverthe brightest SF regions of these systems. Studies combining sur-face photometry with spatially resolved spectroscopy and spec-tral synthesis, and aiming at a quantitative study of the formationhistory of stellar populations in BCGs, are scarce.
That very few spectrophotometric analyses can be found inthe literature, and virtually all of them focused on one singleobject (Guseva et al. 2003a,b,c; Cairos et al. 2002, 2007), is es-sentially due to the large amount of observing time that con-ventional observational techniques require: acquiring images inseveral broad-band and narrow-band filters, plus a sequence oflong-slit spectra sweeping the region of interest, translate intoobserving times of a few nights per galaxy, making analysis ofstatistically meaningful samples not feasible in terms of observ-ing time. Moreover, such observations usually suffer from vary-ing instrumental and atmospheric conditions, which make com-bining all these data together complicated.
Integral Field Spectroscopy (IFS) offers a way to approachspectrophotometric BCG studies in a highly effective manner(Izotov et al. 2006a; Garcıa-Lorenzo et al. 2008; Vanzi et al.2008; James et al. 2009; Cairos et al. 2009a,b, 2010). IFS pro-vides simultaneous spectra of each spatial resolution element,under identical instrumental and atmospheric conditions, whichis not only a more efficient way of observing, but also guaran-tees the homogeneity of the dataset. From only one Integral FieldUnit (IFU) frame we can produce a series of broad-band imagesin a large number of filters, narrow-band images in a large set ofbands, as well as derive a large collection of observables fromthe spectrum (e.g. line indices). In terms of observing time, IFSobservations of BCGs are one order of magnitude more efficientthan traditional observing techniques, implying that now spec-trophotometric studies of large samples of BCG galaxies havebecome viable.
The work presented here is part of the IFS-BCG survey, achallenging long-term project that aims to perform an exhaustivespectrophotometric survey of a large sample of BCGs by meansof IFS. The main scientific goals of this projects include: i) todisentangle and characterize the different stellar populations inBCGs (e.g. constrain their ages, Initial Mass Function and metal-licity); ii) to investigate the evolutionary status of the galaxiesand constrain their SFH; iii) to probe the mechanism responsiblefor the actual burst of star formation; iv) to analyze the feedbackeffects between massive stars and the Interstellar Medium (ISM)in dwarf galaxies; v) to investigate the recent suggestion thatsome BCGs harbor Active Galactic Nuclei (AGN) associatedwith intermediate mass black holes Izotov et al. (2010); vi) toprovide an accurate dataset of photometric and spectroscopic pa-rameters for a large sample of nearby SF dwarf galaxies, the es-sential template to understand the results of the investigations atintermediate and high-z.
This is the fourth in a series of papers presenting the find-ings of the project, in which we report on results derived for fiveluminous BCGs observed with VIRUS-P. In the first and sec-ond papers of the series (Cairos et al. 2009a,b) we illustrated thefull potential of this study by showing results on two represen-tative BCGs, Mrk 1418 and Mrk 409, both observed with the
Potsdam multi-aperture spectrophotometer (PMAS), attached atthe 3.5-m telescope at Calar Alto Observatory. A more detaileddescription of the project objectives, IFU observation and reduc-tion techniques and results for another eight objects observedwith PMAS, was presented in Cairos et al. (2010).
This paper is structured as follows: In Sect. 2 we describethe observations, the data reduction process and the method em-ployed to derive the maps. In Sect. 3 we present the main out-comes of the work, that is, the flux, line ratio and velocity maps,as well as the results derived from the analysis of the integratedspectra. Finally, the main findings for each galaxy are discussedin Sect. 4, and summarized in Sect. 5.
2. Observations and Data Processing
2.1. Galaxy sample and observations
The whole survey includes the mapping of about 40 galaxies,chosen as to cover the wide range of luminosities (−12 ≥ MB ≥
−21) and metallicities (7.0 ≤ 12+log(O/H) ≤ 8.4) found amongBCDs. We took also care that the different morphological classesobserved among BCGs be well represented in the sample (Cairoset al. 2001a).
In this paper we present results for five luminous BCGs(Bergvall & Ostlin 2002; Cairos et al. 2002). These objects arethe most luminous (MB ≤ −17), and typically also the more ir-regular BCGs; they tend to have an important contribution ofolder stars, significant amounts of dust and very distorted star-burst morphologies (Cairos et al. 2003; Bergvall 2012). As wehave already stated in the introduction, these luminous BCGshave a major relevance in cosmological studies, as they (or dif-ferent subsamples of them) have been regarded as the local coun-terparts of different galaxies populations at higher redshifts (z ≈2-6), as Lyman-break galaxies (Grimes et al. 2009) or Lyman-αemitters (Mas-Hesse et al. 2003).
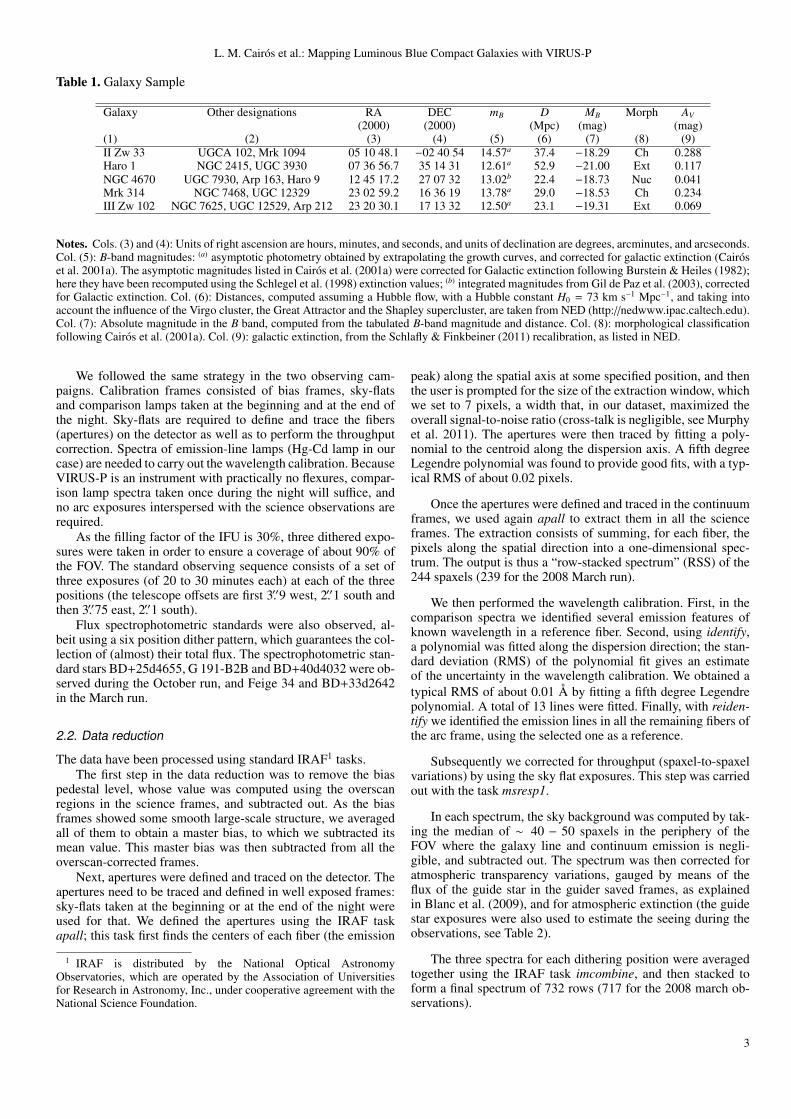
The basic data for the galaxies and the complete log ofthe observations are listed in Table 1 and Table 2 respectively.B-band images of the galaxies are displayed in Figure 1. IFSof III Zw 102 and Mrk 314 has been previously published byGarcıa-Lorenzo et al. (2008), who studied the central 33.′′6×29.′′4of III Zw 102 and 16′′ × 12′′ of Mrk 314 using INTEGRAL atthe William Herschel Telescope. In both cases, the much smallerfield of view (FOV) of INTEGRAL allows only for a partialmapping of the starburst regions.
Spectral data for the five galaxies listed in Table 1 werecollected using the VIRUS-P IFU spectrograph (Hill et al.2008), working at the 2.7m Harlan J. Smith Telescope at theMcDonald Observatory (TX, USA). VIRUS-P is the prototypeinstrument for VIRUS (= Visible Integral-field Replicable UnitSpectrograph), a massively replicated IFU made of 150 units likeVIRUS-P, which will be installed on the 9.2 m Hobby-EberlyTelescope (Hill et al. 2006, 2007).
VIRUS-P (with the VP-1 IFU bundle used in these observa-tions) consists of a square array of 247 optical fibers (of whichthree were dead in the used configuration), which samples a109′′ × 109′′ FOV with a 0.3 filling factor. Each fiber is circularand has a diameter of 4.′′2 on the sky. We observed in the spectralrange 3550–5850 Å, with a spectral resolution (FWHM) of ≈ 5Å (340 km s−1 at Hβ).
Observations were carried out during two observing runs, in2007 October and in 2008 March. During the latter run, due tocamera alignment issues, the spectra of five fibers fell off thechip, and therefore only 239 fibers were usable.
2
L. M. Cairos et al.: Mapping Luminous Blue Compact Galaxies with VIRUS-P
Table 1. Galaxy Sample
Galaxy Other designations RA DEC mB D MB Morph AV(2000) (2000) (Mpc) (mag) (mag)
(1) (2) (3) (4) (5) (6) (7) (8) (9)II Zw 33 UGCA 102, Mrk 1094 05 10 48.1 −02 40 54 14.57a 37.4 −18.29 Ch 0.288Haro 1 NGC 2415, UGC 3930 07 36 56.7 35 14 31 12.61a 52.9 −21.00 Ext 0.117NGC 4670 UGC 7930, Arp 163, Haro 9 12 45 17.2 27 07 32 13.02b 22.4 −18.73 Nuc 0.041Mrk 314 NGC 7468, UGC 12329 23 02 59.2 16 36 19 13.78a 29.0 −18.53 Ch 0.234III Zw 102 NGC 7625, UGC 12529, Arp 212 23 20 30.1 17 13 32 12.50a 23.1 −19.31 Ext 0.069
Notes. Cols. (3) and (4): Units of right ascension are hours, minutes, and seconds, and units of declination are degrees, arcminutes, and arcseconds.Col. (5): B-band magnitudes: (a) asymptotic photometry obtained by extrapolating the growth curves, and corrected for galactic extinction (Cairoset al. 2001a). The asymptotic magnitudes listed in Cairos et al. (2001a) were corrected for Galactic extinction following Burstein & Heiles (1982);here they have been recomputed using the Schlegel et al. (1998) extinction values; (b) integrated magnitudes from Gil de Paz et al. (2003), correctedfor Galactic extinction. Col. (6): Distances, computed assuming a Hubble flow, with a Hubble constant H0 = 73 km s−1 Mpc−1, and taking intoaccount the influence of the Virgo cluster, the Great Attractor and the Shapley supercluster, are taken from NED (http://nedwww.ipac.caltech.edu).Col. (7): Absolute magnitude in the B band, computed from the tabulated B-band magnitude and distance. Col. (8): morphological classificationfollowing Cairos et al. (2001a). Col. (9): galactic extinction, from the Schlafly & Finkbeiner (2011) recalibration, as listed in NED.
We followed the same strategy in the two observing cam-paigns. Calibration frames consisted of bias frames, sky-flatsand comparison lamps taken at the beginning and at the end ofthe night. Sky-flats are required to define and trace the fibers(apertures) on the detector as well as to perform the throughputcorrection. Spectra of emission-line lamps (Hg-Cd lamp in ourcase) are needed to carry out the wavelength calibration. BecauseVIRUS-P is an instrument with practically no flexures, compar-ison lamp spectra taken once during the night will suffice, andno arc exposures interspersed with the science observations arerequired.
As the filling factor of the IFU is 30%, three dithered expo-sures were taken in order to ensure a coverage of about 90% ofthe FOV. The standard observing sequence consists of a set ofthree exposures (of 20 to 30 minutes each) at each of the threepositions (the telescope offsets are first 3.′′9 west, 2.′′1 south andthen 3.′′75 east, 2.′′1 south).
Flux spectrophotometric standards were also observed, al-beit using a six position dither pattern, which guarantees the col-lection of (almost) their total flux. The spectrophotometric stan-dard stars BD+25d4655, G 191-B2B and BD+40d4032 were ob-served during the October run, and Feige 34 and BD+33d2642in the March run.
2.2. Data reduction
The data have been processed using standard IRAF1 tasks.The first step in the data reduction was to remove the bias
pedestal level, whose value was computed using the overscanregions in the science frames, and subtracted out. As the biasframes showed some smooth large-scale structure, we averagedall of them to obtain a master bias, to which we subtracted itsmean value. This master bias was then subtracted from all theoverscan-corrected frames.
Next, apertures were defined and traced on the detector. Theapertures need to be traced and defined in well exposed frames:sky-flats taken at the beginning or at the end of the night wereused for that. We defined the apertures using the IRAF taskapall; this task first finds the centers of each fiber (the emission
1 IRAF is distributed by the National Optical AstronomyObservatories, which are operated by the Association of Universitiesfor Research in Astronomy, Inc., under cooperative agreement with theNational Science Foundation.
peak) along the spatial axis at some specified position, and thenthe user is prompted for the size of the extraction window, whichwe set to 7 pixels, a width that, in our dataset, maximized theoverall signal-to-noise ratio (cross-talk is negligible, see Murphyet al. 2011). The apertures were then traced by fitting a poly-nomial to the centroid along the dispersion axis. A fifth degreeLegendre polynomial was found to provide good fits, with a typ-ical RMS of about 0.02 pixels.
Once the apertures were defined and traced in the continuumframes, we used again apall to extract them in all the scienceframes. The extraction consists of summing, for each fiber, thepixels along the spatial direction into a one-dimensional spec-trum. The output is thus a “row-stacked spectrum” (RSS) of the244 spaxels (239 for the 2008 March run).
We then performed the wavelength calibration. First, in thecomparison spectra we identified several emission features ofknown wavelength in a reference fiber. Second, using identify,a polynomial was fitted along the dispersion direction; the stan-dard deviation (RMS) of the polynomial fit gives an estimateof the uncertainty in the wavelength calibration. We obtained atypical RMS of about 0.01 Å by fitting a fifth degree Legendrepolynomial. A total of 13 lines were fitted. Finally, with reiden-tify we identified the emission lines in all the remaining fibers ofthe arc frame, using the selected one as a reference.
Subsequently we corrected for throughput (spaxel-to-spaxelvariations) by using the sky flat exposures. This step was carriedout with the task msresp1.
In each spectrum, the sky background was computed by tak-ing the median of ∼ 40 − 50 spaxels in the periphery of theFOV where the galaxy line and continuum emission is negli-gible, and subtracted out. The spectrum was then corrected foratmospheric transparency variations, gauged by means of theflux of the guide star in the guider saved frames, as explainedin Blanc et al. (2009), and for atmospheric extinction (the guidestar exposures were also used to estimate the seeing during theobservations, see Table 2).
The three spectra for each dithering position were averagedtogether using the IRAF task imcombine, and then stacked toform a final spectrum of 732 rows (717 for the 2008 march ob-servations).
3
L. M. Cairos et al.: Mapping Luminous Blue Compact Galaxies with VIRUS-P
Table 2. Log of the Observations
Galaxy Date Exp. time Airmass range Seeing Spatial scale(s) (arcsec) (pc arcsec−1)
II Zw 33 Oct 2007 3600 1.20–1.40 2.2–2.4 760Haro 1 Mar 2008 3600 1.01–1.10 2.5–3.2 1080NGC 4670 Mar 2008 4800 1.00–1.13 2.0–3.0 460Mrk 314 Oct 2007 5400 1.03–1.20 1.8–2.0 590III Zw 102 Oct 2007 4200 1.03–1.25 2.0–2.8 470
II Zw 33 Haro 1 NGC 4670
Mrk 314 III Zw 102
Fig. 1. B-band images of the galaxies (in parenthesis the instrument/telescope at which the images were obtained): II Zw 33 (CAFOSat the 2.2 m CAHA, Cairos et al. 2001b); Haro 1 (Prime Focus at 3.5-m CAHA, Cairos et al. 2001b); NGC 4670 (60 inch telescope onMt. Palomar, Gil de Paz et al. 2003); Mrk 314 (prime Focus at the 3.5-m CAHA, Cairos et al. 2001b) and III Zw 102 (ALFOSC/NOT,unpublished). North is up, east to the left. The FOV is 109′′ × 109′′ (the FOV of the VIRUS-P instrument). All images are shown inlogarithmic scale.
2.3. Flux calibration
Spectra of several spectrophotometric standard stars were ob-tained and reduced in the same way as the galaxy spectra.
The only remarkable difference is that the standard starswere observed with a six-position dithering pattern, which en-sures that only about 3% of FOV is “lost” in inter-fibers gaps,while about two thirds of the area is covered by two overlappingfibers, as shown in 2. Combined with the PSF undersampling,this dithering pattern does not allow an accurate direct flux esti-mation by simple summation of all the relevant spaxels.
If we summed together all the spaxels with sufficiently strongstellar continuum (typically about 30 spaxels in the row-stackedfinal spectrum), we would overestimate the actual stellar spec-trum, because of the dithering geometry. Moreover, the overes-timation factor is in principle wavelength-dependent, because ofboth the increase of the stellar PSF width towards bluer wave-
lengths, and the shift of the light centroid due to differential at-mospheric refraction.
To better understand it, we can think of a hypothetical starwith an extremely narrow PSF, whose blue centroid happens tofall on one of the inter-fibers gaps while the red centroid falls ona spatial location covered by two overlapping fibers: we wouldmeasure very little or zero blue flux, while the red flux would beoverestimated by a factor of two.
To assess the importance of this effect, we simulated the re-sponse of each fiber and did a χ2 fit to determine the PSF pa-rameters. The fiber response is calculated by a Monte Carlo in-tegration of the PSF over the circle area of the fiber. For the PSF,a Moffat profile is chosen to follow the instrument response tothe outer wings, as shown in Fig. 3. Fit parameters were the totalflux, source position and the PSF width α and exponent β. TheMoffat fit was done individually for each wavelength bin.
We found a tight correlation between the Moffat functionparameters and wavelength, as depicted in Fig. 4; also, the ob-
4

L. M. Cairos et al.: Mapping Luminous Blue Compact Galaxies with VIRUS-P
10 5 0 5 10δx [arcsec]
10
5
0
5
10
δy [a
rcse
c]
Fig. 2. Size and position of the fibers, centered on the positionof the star (G 191-B2B). The fiber diameter is 4.′′2, the distancebetween adjacent fibers in the same exposure is 7.′′5. The bluecircle shows the computed FWHM of this star (' 1.′′4).
served shift of the PSF centroid agrees well with the shift com-puted theoretically from the airmass and the parallactic angle ofthe spectrophotometric standard stars spectra.
However, the overestimation factor turns out to have only avery small (< 0.03 mag) dependence on wavelength (Fig. 5),because of the relatively poor seeing, which spreads out the starflux over a large number of spaxels, and of having observed thestandard stars at low airmasses.
To derive the final flux calibration function, for each spec-trophotometric standard star we summed together all spaxelswith sufficient strong signal in the stacked spectrum, and appliedthe overestimating factor correction. Then the IRAF tasks stan-dard and sensfunc were used to compute the calibration function,after combining together the data for the different spectrophoto-metric stars.
By comparing the sensitivity curves for the different standardstars in the two observing runs, we can estimate that the relativeuncertainty on the calibration factor is generally less than 2%,except at the blue end of the spectrum, where the uncertaintyincreases to about 7%.
As the diameter of the fibers and the average seeing valuesare much larger than differential atmospheric refraction (DAR)effects, no correction for DAR was applied to the data.
2.4. Emission-line fit
2.4.1. Recovering the pure emission-line spectrum
The measurement of the emission-line properties (e.g. fluxes,equivalent widths, or velocity dispersion) provides a great dealof information in regard to the nebula physical conditions andthe properties of the ionizing stellar population. However, and inparticular when dealing with SF galaxies, the derivation of accu-rate emission-line fluxes and equivalent widths is not free from
0 2 4 6 8 10distance [arcsec]
104
105
106
107
inte
nsity
[cou
nts]
Fig. 3. Measured and fitted intensity for the source G 191-B2B.The X axis shows the distance to the fitted source center, Y theintensity. Stars indicate the positions of the fiber centers. Thecurves are the best Moffat (solid) and Gaussian (dotted) fits (bothintegrated over the fiber area).
problems. At any given spatial position, the observed galaxyspectrum is the sum of the nebular and stellar emission; under-lying stellar absorption can under certain circumstances dramat-ically decrease the measured intensity and equivalent width ofBalmer emission lines.
Therefore, in order to obtain precise measurements of theemission-line parameters of the ionized gas, the flux emitted bythe stellar population must be modeled and subtracted. In thecase of IFU data, this process must be done for every spaxel,i.e., the technique chosen to model the stellar population has tobe applied to each individual spectrum of the IFS mosaic.
In order to model the stellar population, we used the penal-ized pixel-fitting (pPXF) method2 developed by Cappellari &Emsellem (2004); the pPXF software allows to simultaneouslyfit the optimal linear combination of stellar templates to the ob-served spectrum and to derive the stellar kinematics, using amaximum likelihood approach to suppress noise solutions. Wemade use of the MILES stellar library 3 (Sanchez-Blazquez et al.2006), which contains a total of 985 stars spanning a large rangein stellar age and metallicity.
As a first step, we produced, for every galaxy, a high signal-to-noise integrated spectrum, adding up all the spectra of thescience spaxels. Using this spectrum we find the ”optimal stel-lar template” for every object, i.e., the selected stars from theMILES library that produce the best fit. The fit to the stellarcontinuum was done after masking out the gas emission-linesexpected in the spectral range under study, as well as residualsfrom skyline subtraction. The number of stars combined to cre-ate the ”optimal stellar template” for each galaxy was as follows:
2 URL: http://www-astro.physics.ox.ac.uk/ mxc/idl/3 URL: http://miles.iac.es/
5

L. M. Cairos et al.: Mapping Luminous Blue Compact Galaxies with VIRUS-P
Fig. 4. The Moffat α and β parameters are plotted as a functionof the wavelength for three spectrophotometric standards. Thebottom panels show the computed FWHM (the solid line repre-sents the FWHM ∝ λ−0.2 relation) and the shift of the centroidwith respect to a reference point at λ = 5750 Å.
17 stars for II Zw 33, 20 stars for Haro 1, 22 stars for NGC 4670,20 stars for Mrk 314, and 25 stars for III Zw102.
After that, the pPXF method was run on the spectra of eachindividual spaxel, using the ”optimal stellar template” and al-lowing the weights of each star to vary. The application of the”optimal stellar template” to each individual spectrum consider-ably speed up the fitting process. As the automatization of thisprocess could lead to bad fittings, a careful individual inspectionby eye was done.
Once the stellar continuum has been successfully reproducedby a sum of templates for every spaxel, it was subtracted fromthe original spectrum to get the pure emission-line spectrum.
We must remark here that the fit to the stellar continuum isnot meant to provide a physical description of the stellar popu-lations making up the galaxy, a topic which is outside the scopeof this paper, but that the purpose of this modeling is to obtain agood representation of the underlying stellar continuum in orderto decouple it from the emission lines produced by the ionizedgas, and to derive more accurate values of emission-line fluxes.
The stellar continuum fit only works out in the central re-gions of the galaxies, while it fails, producing meaningless re-sults, in the outer regions where the signal-to-noise of the con-tinuum is too small.
Fig. 5. Ratio between the flux computed by a direct sum of thespectra of all spaxels with sufficiently good signal, and the fluxderived by the Moffat fit to the data, as a function of wavelength,for three spectrophotometric standard stars. The direct integra-tion overestimates the stellar flux by a factor of about 5/3, whichdepends very little on wavelength.
2.4.2. Fitting the lines
Emission-line fluxes for every spaxel were measured on the pureemission-line spectrum. However, the line emission extends wellbeyond the galaxy region in which the pure emission-line spec-trum could be computed.
To compute the fluxes in those spaxels outside such region,the original stacked spectra were used, fitting the continuum,typically 30–50 Å on both sides, by a straight line.
In order to measure the relevant parameters of the emis-sion lines (position, flux and width), they were fitted by sin-gle Gaussians. The fit procedure was carried out by using thethe Levenberg-Marquardt non-linear fitting algorithm imple-mented by C. B. Markwardt in the mpfitexpr IDL library 4.The [O iii] λλ4959, 5007 doublet was fitted imposing that bothlines have the same redshift and width. Uncertainties on the fitoutput parameters were computed adopting a simplified poisso-nian model on the non-flux-calibrated spectra, where the readoutnoise was set equal to the rms of the nearby continuum, and thegain set to 1.
Criteria such as flux, error on flux, velocity and width wereused to do a first automatic assessment of whether to accept orreject a fit. For instance, lines with too small (less than the in-strumental width) or too large widths were flagged as rejected,as well as lines with an error on the flux more than about 10% ofthe flux (the exact limits depending on the specific line and onthe overall quality of the spectrum). Such criteria were comple-mented by a visual inspection of all fits, which led to override,in a few cases, the automated criteria decision (by accepting a fitflagged as rejected, or vice versa).
2.5. Creating the 2D maps
The emission-line fit procedure gives, for each line and foreach line parameter (for instance flux), a table with the fiberID number, its coordinates, the measured value and the accep-tance/rejection flag.
The gaussian fit parameters for the continuum-subtractedand the original spectra were merged together. For the Hγ and
4 URL: http://purl.com/net/mpfit
6

L. M. Cairos et al.: Mapping Luminous Blue Compact Galaxies with VIRUS-P
the Hδ Balmer lines, due to their strong absorption components,only the results from the continuum-subtracted spectra wereused.
Line ratios were computed by simply dividing the fluxes ofthe corresponding lines.
To display all these maps, we explored several options. Oneis to interpolate the data on a regularly spaced grid, by means ofan algorithm such as the Renka & Cline (1984) two-dimensionalinterpolation method. However, our own experience is that theinterpolation can produce spurious oscillations, especially overnon-contiguous spaxels, and gives the false impression of a spa-tial resolution higher than the actual value.
An alternative is to represent each spaxel with measured datawith a circle with the fiber’s diameter at its spatial position.However, the irregular inter-fiber gaps (due to the fact that theactual position of the fibers is slightly and randomly offset fromthe nominal one) distract the eye of the viewer and interfere witha comfortable and effective visual assessment of the global char-acteristics of the map.
The solution we adopted was to depict each fiber by meansof an hexagon centered on the nominal (not the actual) positionof each fiber (the mean difference between nominal and actualpositions is about 0.′′4 with a maximum of 1.′′8). This we foundto be the best compromise between a truthful representation ofthe data (as no rebinning or interpolation was done: the only ma-nipulation was to slightly change the fibers positions and shape)and a map which is both pleasant to the eye and easy to appraiseand interpret.
3. Results
3.1. Emission-line and continuum intensity maps
IFS provides a simultaneous mapping of the light emitted by agalaxy in a wide spectral range. Accordingly, from one singleexposure we can retrieve maps at a given wavelength or mapsequivalent to narrow- or broad-band images within the wholeobserved range.
Following the steps described in Section 2.5 we builtemission-line flux maps for the brightest observed emission-lines, namely [O ii] λ3727, Hγ, Hβ, and [O iii] λ5007; these mapsare displayed in Figure 6 (rows 2 to 5).
Continuum maps were obtained by summing the flux withinspecific wavelength intervals, selected so as to avoid emissionlines or strong residuals from the sky spectrum subtraction.Continuum maps in the spectral interval 4500-4700 Å are shownin Figure 6 (row 1): this is the wavelength range where the con-tinuum signal is stronger and better portrays the galaxy outerregions (Wolf-Rayet features are not an issue, as they are onlyvisible in just a few central spaxels in two objects, see Sect. 4).
The emission-line maps depict the interstellar gas ionized bymassive stars, while the continuum maps mainly trace the stel-lar light from the galaxy. The five galaxies display an irregularmorphology in emission-lines; in II Zw 33 and Mrk 314, the SFregions are aligned to form a chain, while in Haro 1, NGC 4670and III Zw 102 the ionized gas departs from the inner regions,giving rise to a complex pattern, where the presence of severalbubbles and filaments is remarkable.
On the other hand, the continuum morphology is regular inthe five objects; (the jagged appearance of the Haro 1 continuummap is due to the presence of a few foreground stars, which havebeen masked out, and a foreground galaxy at the west). In all thegalaxies, the continuum peak is located roughly at the center of
the outer isophotes, and its position does not depend on whichspecific wavelength range is used to build the continuum maps.
3.2. Line ratio maps
The first row of Figure 7 displays the [O iii] λ5007/Hβ mapsfor the five studied galaxies. This ratio essentially probes thehardness of the stellar radiation field within the nebula, and sohigh values of [O iii] λ5007/Hβ are predicted when the ioniza-tion is produced predominantly by UV photons from OB stars(McCall et al. 1985). However it is also sensitive to other fac-tors as e.g. the metallicity (Searle 1971), the distance from theionizing source to the [O iii] emitting layer (Stasinska 2009), orthe presence of shocks (Dopita & Sutherland 1995). Thereforethe information provided by [O iii] λ5007/Hβ is limited unlessadditional data regarding these other parameters are added.
For II Zw 33 and Mrk 314, the excitation maps roughlymimic the emission-line maps, the highest [O iii] λ5007/Hβ val-ues (≥ 3), spatially coinciding with the highest peak in emission-lines, as usual in systems photoionized by hot stars.
Both Haro 1 and III Zw 102 show more complex[O iii] λ5007/Hβ patterns, with the highest values of the excita-tion localized in the galaxy periphery. This behavior, frequentlyfound in spiral galaxies, has been interpreted as an abundancegradient (Smith 1975). Interestingly, Haro 1 and III Zw 102 arethe two most luminous objects in the sample and both relativelyfar from the dwarf galaxy regime.
NGC 4670 shows a somewhat complex excitation morphol-ogy, with several [O iii] λ5007/Hβ peaks, located in the centralgiant H ii region and at the outer edge of the two larger filaments.For all five galaxies, the excitation levels are consistent with H ii-like ionization.
Interstellar extinction can be probed by comparing the ob-served ratios of hydrogen recombination lines with their theoret-ical values (Osterbrock & Ferland 2006). In the optical domain,extinction maps are usually derived from the ratio Hα/Hβ as itinvolves the strongest lines, and therefore, the easiest to measure.In our case, lacking Hα, we have derived the extinction from theHβ/Hγ line ratio; the extent of the extinction maps is dictated bythe extent of the Hγ maps (as said in Sect. 2.5 we measured Hγonly in the continuum-subtracted spectra.
The extinction maps are shown in the second row of Fig. 7using the AV parameter. We adopted the Case B, low densitylimit, T = 10000 K approximation, where the theoretical Hβ/Hγratio is 2.15 (Osterbrock & Ferland 2006). The Cardelli extinc-tion law was used to derive AV from the observed Hβ/Hγ value.
3.3. Ionized gas and stellar kinematics
We study the kinematics of the ionized gas using the[O iii] λ5007 emission-line, except for III Zw 102 for which weuse Hβ, much stronger than [O iii]. Due to the low spectral reso-lution of our data (about 5 Å FWHM), no reliable velocity dis-persion measurements could be obtained.
The velocity fields are shown in Figure 7 (row three); in thesemaps red and blue colors represent, respectively, redshifted andblueshifted regions with respect to the recessional velocity ofeach BCG. To estimate the errors on the velocity data, we madea combined plot (all galaxies together) of the uncertainty on the[O iii] λ5007 emission-line centroid versus the logarithm of itsflux. For log(flux) > 4 the error is . 5 km s−1, in agreement withthe mean uncertainty estimated from the scatter in the velocitymaps built on the 5577 Å skyline. The error increases to about
7

L. M. Cairos et al.: Mapping Luminous Blue Compact Galaxies with VIRUS-P
II Zw 33 Haro 1 NGC 4670 Mrk 314 III Zw 102
Fig. 6. Observed intensity maps (not reddening-corrected). First row: continuum emission between 4500 and 4700 Å (a spectralregion free from gas emission). Rows 2 to 5: emission-line flux maps derived from Gaussian fits to each line and spaxel (see the textfor details). Axis units are arcseconds; north is up, east to the left. All images are shown in logarithmic scale. Flux units are 10−18
ergs cm−2 s−1. Spaxels where the blue Wolf-Rayet bump is visible are marked by stars in the [O iii] map.
10–15 km s−1 at log(flux) = 3, to 25–30 km s−1 at log(flux) = 2,and reaches or exceeds 40 km s−1 at fainter flux levels.
The pPXF program provides, besides the best fitting stellartemplate, the radial velocity and associated uncertainty for eachfitted spaxel, allowing us to produce the galaxy’s stellar velocityfield (given in Figure 7, row four).
The uncertainty on the stellar radial velocity varies between' 10 km s−1 in the nuclear regions and ' 40 km s−1 in the outerspaxels.
3.4. Integrated spectroscopy
For every galaxy we have also produced its integrated and nu-clear spectrum. In order to generate the integrated spectrum weincluded only those spaxels in which the stellar contribution wassuccessfully modeled as a sum of templates (see Section 2.4);in this way we ensure a better correction for the contributionof the underlying stellar population and, therefore, a more ac-curate determination of the emission-lines fluxes. The integratedspectrum was produced by summing together the individual pure
8

L. M. Cairos et al.: Mapping Luminous Blue Compact Galaxies with VIRUS-P
II Zw 33 Haro 1 NGC 4670 Mrk 314 III Zw 102
Fig. 7. First row: Observed (not reddening-corrected) ionization ratio [O iii] λ5007/Hβ for the five galaxies. Second row: Interstellarextinction AV map, computed from the Hβ/Hγ ratio. Row three: Velocity field (in km s−1) of the ionized gas [O iii] λ5007 emissionline, except for III Zw 102 for which the Hβ velocity field is shown. Row four: Stellar velocity field. Axis units are arcseconds. Thesolid line in the gas velocity map of NGC 4670 is the isovelocity contour at V = 1050 km s−1 (see text for details).
emission-line spectra of the selected spaxels. A correspondingcontinuum spectrum was obtained by summing the best-fit con-tinuum spectra for the same spaxels.
On the same line, we also obtained line-emission and best-fitcontinuum spectra for the central region by summing over 6–8spaxels around the continuum peak (for short, we shall refer tothem as “nuclear spectra”).
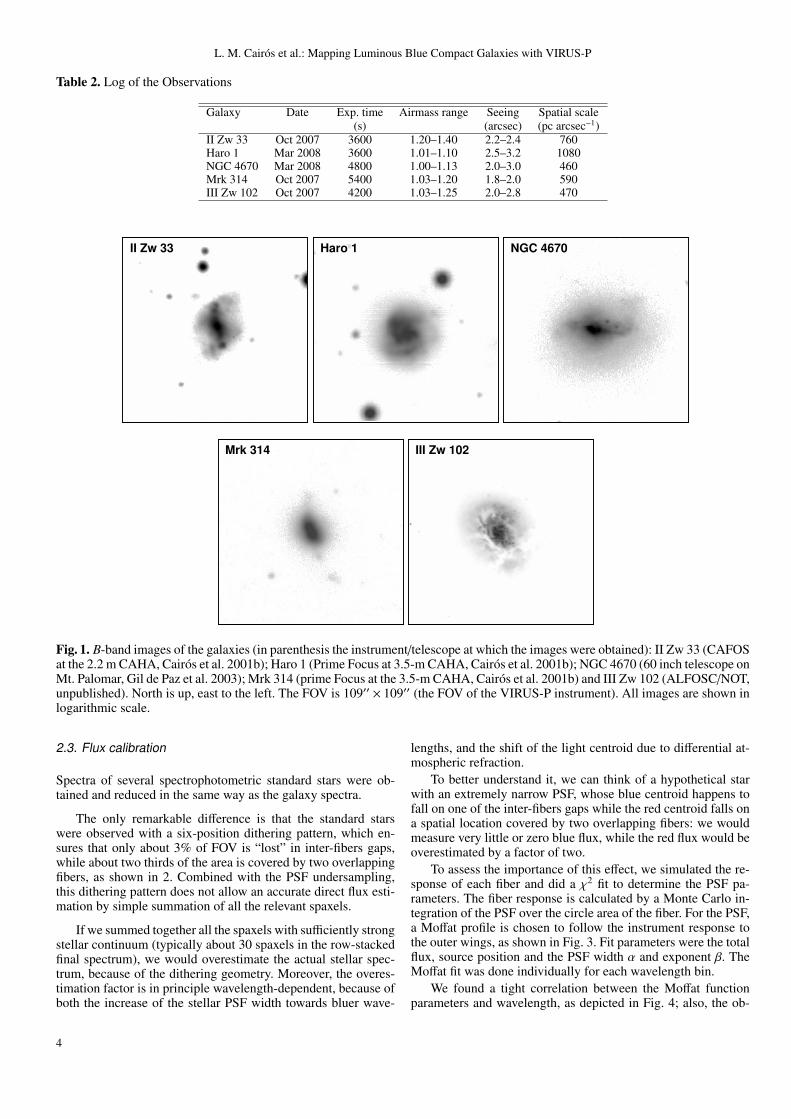
Figure 8 displays the integrated spectra for the sample ob-jects. All objects but III Zw 102 display a typical BCG spec-trum, in which strong optical emission-lines are superposed onan almost flat continuum. On the contrary, III Zw 102’s spec-tral shape, with a high and red continuum, resembles more thosetypical of an early type galaxy, rather than those of BCGs.All objects display prominent absorption features, including thehigher-order Balmer lines, Hδ, Hγ, Hβ, Ca ii H and K lines, andthe G-band at 4304 Å.
For both the integrated and nuclear spectra, the flux of thevisible emission-lines was measured on the pure emission-linespectrum using the Gaussian profile fitting option in the IRAF
task splot. In order to compute equivalent widths, the contin-uum level was measured on the best-fit continuum spectrum. ForBalmer lines, the continuum level was determined by interpolat-ing over the absorption feature using two continuum windowson either side. The interstellar extinction coefficient, C(Hβ), wascomputed through a least-square fit to the Balmer decrement,using the Hβ, Hδ and Hγ lines.
Reddening-corrected intensity ratios and equivalent widthsof the integrated and nuclear spectra are listed in Table 3. Thelisted uncertainties on the line ratios and the Hβ fluxes are de-rived by summing in quadrature measurement errors, uncertain-ties on the flux calibration (Sect. 2.3) and the uncertainty on thecomputed C(Hβ).
3.4.1. Heavy element abundances
In the two galaxies Mrk 314 and II Zw 33, where the[O iii] λ4363 auroral line could be measured, electron temper-
9

L. M. Cairos et al.: Mapping Luminous Blue Compact Galaxies with VIRUS-P
Table 3. Reddening corrected line ratios, normalized to Hβ, for the sample of galaxies
λ Ion II Zw 33 Haro 1Integrated Nucleus Integrated Nucleus
Fλ −Wλ Fλ −Wλ Fλ −Wλ Fλ −Wλ
3727 [O ii] 3.312 ± 0.284 58.94 ± 1.43 3.125 ± 0.254 48.26 ± 0.70 2.419 ± 0.217 24.25 ± 0.32 2.106 ± 0.190 19.55 ± 0.153835 H9 0.055 ± 0.006 0.80 ± 0.05 0.041 ± 0.004 0.50 ± 0.04 — — — —3868 [Ne III] 0.259 ± 0.018 3.53 ± 0.06 0.236 ± 0.015 2.66 ± 0.04 0.062 ± 0.006 0.44 ± 0.02 0.040 ± 0.004 0.27 ± 0.013889 HeI+H8 0.166 ± 0.012 2.39 ± 0.04 0.168 ± 0.011 1.95 ± 0.03 0.132 ± 0.009 0.94 ± 0.02 0.126 ± 0.009 0.85 ± 0.013968 [Ne III] 0.228 ± 0.014 3.21 ± 0.04 0.209 ± 0.012 2.47 ± 0.04 — — — —4101 Hδ 0.256 ± 0.012 3.68 ± 0.03 0.256 ± 0.012 3.02 ± 0.06 0.244 ± 0.013 1.84 ± 0.02 0.239 ± 0.012 1.73 ± 0.014340 Hγ 0.479 ± 0.017 7.82 ± 0.07 0.476 ± 0.015 6.26 ± 0.06 0.469 ± 0.018 3.96 ± 0.01 0.469 ± 0.018 3.88 ± 0.014363 [O III] 0.032 ± 0.003 0.51 ± 0.03 0.024 ± 0.002 0.31 ± 0.03 — — — —4861 Hβ 1.000 19.57 ± 0.13 1.000 15.57 ± 0.09 1.000 10.49 ± 0.05 1.000 10.64 ± 0.024959 [O III] 0.903 ± 0.023 18.66 ± 0.10 0.873 ± 0.022 14.00 ± 0.06 0.222 ± 0.006 2.45 ± 0.02 0.187 ± 0.006 2.05 ± 0.015007 [O III] 2.653 ± 0.067 57.47 ± 0.30 2.554 ± 0.064 42.93 ± 0.19 0.656 ± 0.017 7.70 ± 0.03 0.532 ± 0.013 6.22 ± 0.02
I(Hβ) = 1061.6 ± 18.5 I(Hβ) = 489.6 ± 8.5 I(Hβ) = 4185.9 ± 72.8 I(Hβ) = 1532.0 ± 26.5F(Hβ) = 2090.3 ± 283.3 F(Hβ) = 760.0 ± 80.4 F(Hβ) = 9800.7 ± 1628.1 F(Hβ) = 3600.5 ± 597.4C(Hβ) = 0.294 ± 0.058 C(Hβ) = 0.191 ± 0.045 C(Hβ) = 0.369 ± 0.072 C(Hβ) = 0.371 ± 0.072
AV = 0.630 ± 0.125 AV = 0.409 ± 0.097 AV = 0.791 ± 0.154 AV = 0.794 ± 0.154Area: 739 �′′ = 24.3 kpc2 Area: 138 �′′ = 4.5 kpc2 Area: 1432 �′′ = 94.2 kpc2 Area: 108 �′′ = 7.1 kpc2
Vstars = 2828.1 Vstars = 2829.8 Vstars = 3772.0 Vstars = 3758.0V[OIII] = 2827.4 V[OIII] = 2828.4 V[OIII] = 3781.5 V[OIII] = 3759.6
λ Ion NGC 4670 Mrk 314Integrated Nucleus Integrated Nucleus
Fλ −Wλ Fλ −Wλ Fλ −Wλ Fλ −Wλ
3727 [O ii] 3.051 ± 0.280 60.52 ± 0.97 2.487 ± 0.200 44.16 ± 0.30 3.255 ± 0.270 50.66 ± 0.92 2.859 ± 0.264 54.09 ± 0.603835 H9 0.048 ± 0.004 0.89 ± 0.03 0.044 ± 0.004 0.71 ± 0.01 0.053 ± 0.005 0.97 ± 0.07 0.037 ± 0.003 0.78 ± 0.023868 [Ne III] 0.202 ± 0.016 3.32 ± 0.03 0.208 ± 0.012 3.37 ± 0.01 0.296 ± 0.019 3.58 ± 0.06 0.297 ± 0.022 4.24 ± 0.023889 HeI+H8 0.187 ± 0.014 3.18 ± 0.02 0.182 ± 0.011 2.84 ± 0.01 0.165 ± 0.010 2.91 ± 0.08 0.148 ± 0.010 2.12 ± 0.023968 [Ne III] 0.217 ± 0.013 3.79 ± 0.02 0.215 ± 0.010 3.55 ± 0.01 0.245 ± 0.013 3.34 ± 0.03 0.214 ± 0.014 3.07 ± 0.014101 Hδ 0.263 ± 0.014 4.52 ± 0.04 0.259 ± 0.013 4.53 ± 0.02 0.256 ± 0.011 3.29 ± 0.03 0.241 ± 0.012 3.40 ± 0.014340 Hγ 0.458 ± 0.016 8.99 ± 0.04 0.468 ± 0.013 9.71 ± 0.04 0.477 ± 0.015 6.85 ± 0.05 0.469 ± 0.017 7.88 ± 0.044363 [O III] — — — — 0.037 ± 0.002 0.53 ± 0.02 0.038 ± 0.002 0.65 ± 0.024861 Hβ 1.000 21.93 ± 0.09 1.000 26.03 ± 0.14 1.000 17.29 ± 0.16 1.000 20.41 ± 0.114959 [O III] 0.765 ± 0.019 17.89 ± 0.08 0.868 ± 0.021 24.11 ± 0.08 1.070 ± 0.026 19.51 ± 0.18 1.175 ± 0.029 25.34 ± 0.205007 [O III] 2.223 ± 0.056 54.01 ± 0.23 2.500 ± 0.061 72.26 ± 0.23 3.053 ± 0.075 59.08 ± 0.55 3.354 ± 0.085 77.07 ± 0.63
I(Hβ) = 6636.0 ± 116.1 I(Hβ) = 3101.8 ± 54.3 I(Hβ) = 1491.8 ± 26.2 I(Hβ) = 992.0 ± 17.3F(Hβ) = 10489.3 ± 1598.2 F(Hβ) = 5565.2 ± 382.6 F(Hβ) = 3614.7 ± 394.0 F(Hβ) = 1976.5 ± 330.3
C(Hβ) = 0.199 ± 0.066 C(Hβ) = 0.254 ± 0.029 C(Hβ) = 0.384 ± 0.047 C(Hβ) = 0.299 ± 0.072AV = 0.426 ± 0.141 AV = 0.543 ± 0.062 AV = 0.823 ± 0.100 AV = 0.641 ± 0.155
Area: 2571 �′′ = 30.3 kpc2 Area: 92 �′′ = 1.1 kpc2 Area: 739 �′′ = 14.6 kpc2 Area: 108 �′′ = 2.1 kpc2
Vstars = 1026.2 Vstars = 1019.9 Vstars = 2067.6 Vstars = 2064.6V[OIII] = 1049.7 V[OIII] = 1051.1 V[OIII] = 2076.3 V[OIII] = 2080.3
λ Ion III Zw 102Integrated Nucleus
Fλ −Wλ Fλ −Wλ
3727 [O ii] 1.618 ± 0.155 9.81 ± 0.20 1.269 ± 0.120 11.38 ± 0.113835 H9 — — — —3868 [Ne III] — — — —3889 HeI+H8 — — — —3968 [Ne III] — — — —4101 Hδ 0.237 ± 0.015 1.01 ± 0.01 0.233 ± 0.012 1.52 ± 0.024340 Hγ 0.469 ± 0.019 2.20 ± 0.02 0.469 ± 0.018 3.45 ± 0.034363 [O III] — — — —4861 Hβ 1.000 4.93 ± 0.02 1.000 8.53 ± 0.044959 [O III] 0.112 ± 0.004 0.58 ± 0.01 0.086 ± 0.003 0.76 ± 0.015007 [O III] 0.319 ± 0.008 1.77 ± 0.01 0.230 ± 0.006 2.18 ± 0.01
I(Hβ) = 1652.9 ± 29.2 I(Hβ) = 809.2 ± 14.2F(Hβ) = 6031.4 ± 1075.0 F(Hβ) = 3647.1 ± 628.9C(Hβ) = 0.562 ± 0.077 C(Hβ) = 0.654 ± 0.075
AV = 1.203 ± 0.165 AV = 1.399 ± 0.160Area: 2171 �′′ = 27.2 kpc2 Area: 123 �′′ = 1.5 kpc2
Vstars = 1611.7 Vstars = 1621.9V[OIII] = 1615.6 V[OIII] = 1608.7
Notes. Reddening-corrected line fluxes, normalized to F(Hβ) = 1. The observed Hβ flux, I(Hβ), the reddening-corrected Hβ flux, F(Hβ) (both×10−16 ergs cm−2 s−1), the reddening coefficient, C(Hβ), and AV (derived as 2.14 × C(Hβ)) are listed for each region. Also shown are the areacovered by the integrated spectra, and the corresponding (luminosity weighted) average stellar and gas velocities. The quoted uncertainties accountfor measurement, flux-calibration and reddening coefficient errors.
atures and oxygen and neon abundances were derived using the”direct” method.
First, we computed the electron temperature Te(O III) fromthe [O iii] λ4363/[O iii] λ4959 + λ5007 ratio using the equationsprovided by Aller (1984). As in our spectra there are no useful
lines to obtain the electron density, Ne, we assumed Ne = 100cm−3.
The metal abundances were derived using the revised expres-sions in Izotov et al. (2006b), which take into account the latestatomic data and incorporate an appropriate grid of photoioniza-tion models with state-of-the-art model atmospheres. We used
10
L. M. Cairos et al.: Mapping Luminous Blue Compact Galaxies with VIRUS-P
Fig. 8. Integrated spectra of the sample galaxies, obtained bysumming together the spectra of all those spaxels in which thestellar continuum could be fitted by a template (see § 2.4).Spectra are plotted in logarithmic flux scale, and have beenshifted vertically. Major tick-marks on the y axis are spaced 1dex apart. Nuclear spectra do not exhibit significantly distinctfeatures from the integrated spectra and are not shown.
their equations (3) and (5) to compute the O+/H, O++/H andNe2+ abundances, after computing Te(O II) using equation (14).The total oxygen abundance was obtained by simply summingthe abundances of O+ and O++, as the fraction of the O+++ ionis generally negligible. The correction factor for Ne, ICF(Ne2+),was computed using equation (19). (Using the Ne++/O++ ratioinstead of the ICF we would get a Ne abundance about 0.2 dexlarger.)
For the remaining three galaxies, where [O iii] λ4363 couldnot be measured, we had to rely on the so-called ”strong-linemethods”, in order to derive the oxygen abundance. We adoptedthe revised calibration of the P-method (Pilyugin 2000, 2001),provided in Pilyugin & Thuan (2005).
Electron temperatures and abundances are listed in Table 4.For II Zw 33 and Mrk 314, we provide only the abundances de-rived from the direct method; since both galaxies lie in the tran-sition zone 8.0 ≤ 12 + log (O/H) ≤ 8.3, the Pilyugin & Thuan(2005) calibration does not give reliable abundance values.
3.4.2. Comparison with literature data
To assess the quality of our measurements, we compared ourintegrated fluxes and equivalent widths with the integrated data
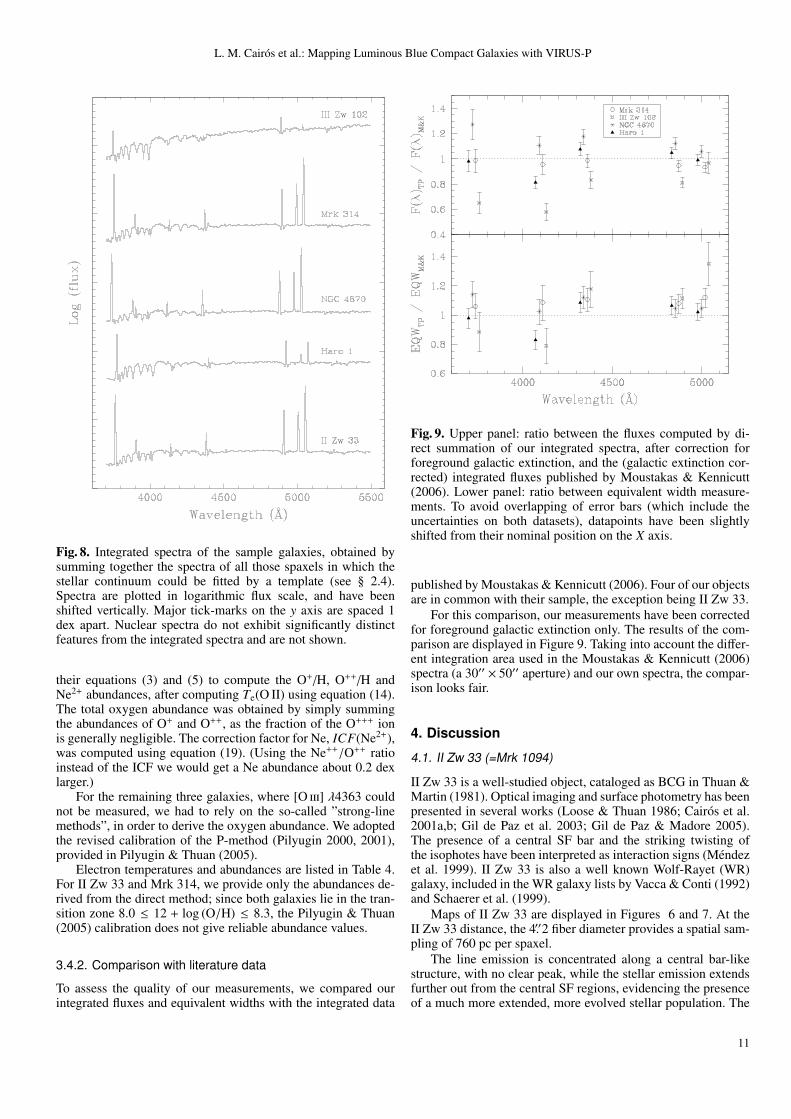
Fig. 9. Upper panel: ratio between the fluxes computed by di-rect summation of our integrated spectra, after correction forforeground galactic extinction, and the (galactic extinction cor-rected) integrated fluxes published by Moustakas & Kennicutt(2006). Lower panel: ratio between equivalent width measure-ments. To avoid overlapping of error bars (which include theuncertainties on both datasets), datapoints have been slightlyshifted from their nominal position on the X axis.
published by Moustakas & Kennicutt (2006). Four of our objectsare in common with their sample, the exception being II Zw 33.
For this comparison, our measurements have been correctedfor foreground galactic extinction only. The results of the com-parison are displayed in Figure 9. Taking into account the differ-ent integration area used in the Moustakas & Kennicutt (2006)spectra (a 30′′ × 50′′ aperture) and our own spectra, the compar-ison looks fair.
4. Discussion
4.1. II Zw 33 (=Mrk 1094)
II Zw 33 is a well-studied object, cataloged as BCG in Thuan &Martin (1981). Optical imaging and surface photometry has beenpresented in several works (Loose & Thuan 1986; Cairos et al.2001a,b; Gil de Paz et al. 2003; Gil de Paz & Madore 2005).The presence of a central SF bar and the striking twisting ofthe isophotes have been interpreted as interaction signs (Mendezet al. 1999). II Zw 33 is also a well known Wolf-Rayet (WR)galaxy, included in the WR galaxy lists by Vacca & Conti (1992)and Schaerer et al. (1999).
Maps of II Zw 33 are displayed in Figures 6 and 7. At theII Zw 33 distance, the 4.′′2 fiber diameter provides a spatial sam-pling of 760 pc per spaxel.
The line emission is concentrated along a central bar-likestructure, with no clear peak, while the stellar emission extendsfurther out from the central SF regions, evidencing the presenceof a much more extended, more evolved stellar population. The
11

L. M. Cairos et al.: Mapping Luminous Blue Compact Galaxies with VIRUS-P
Table 4. Electron temperatures and heavy metal abundances.
II Zw 33 Haro 1 NGC 4670 Mrk 314 III Zw 102Value Integrated Nuclear Integrated Nuclear Integrated Nuclear Integrated Nuclear Integrated NuclearTe(O III) (K) 12290 ± 330 11270 ± 360 — — — — 12330 ± 250 12090 ± 210 — —Te(O II) (K) 12080 ± 290 11160 ± 350 — — — — 12110 ± 210 11910 ± 190 — —12 + log (O/H)1 8.06 ± 0.03 8.16 ± 0.04 — — 8.08 ± 0.03 8.10 ± 0.0312 + log (O/H)2 — — 8.36 8.40 8.29 8.37 — — 8.44 8.49log(Ne/O) −0.85 ± 0.05 −0.85 ± 0.06 — — — — −0.83 ± 0.04 −0.82 ± 0.04 — —
Notes. (1) Oxygen abundances computed using the Te method. (2) Oxygen abundances derived from Pilyugin & Thuan (2005); uncertainties areabout 0.1 dex.
continuum map displays a well defined peak, located roughly atthe center of the galaxy.
The excitation map ([O iii]/Hβ) traces the regions of star-formation, as expected for objects photoionized by stars. Thepeak in [O iii]/Hβ is located at the southern tip of the bar (knot’A’ as labeled in Mendez et al. 1999); their value of 5.5 agreeswell with the peak value we find, ' 4.5 (the small discrepancy islikely due to the difference in spatial resolution).
The extinction is relatively uniform in the central region,with AV values around 0.4; these values are significantly smallerthan those published by Mendez et al. (1999).
The [O iii] velocity map does not show a clear rotation pat-tern, although the northwest side seems to have a slightly higherradial velocity as a whole. The ionized gas kinematics is in goodqualitative agreement with the H I kinematical map published by(Walter et al. 1997, see their Fig. 6). The stellar velocity field isnot as extended as required to make a sensible comparison, andis also much noisier.
We derived an oxygen abundance of 12 + log (O/H) = 8.06,in good agreement with the value of 12 + log (O/H) = 7.99 re-ported by Shi et al. (2005), who also used the Te method.
The Wolf-Rayet bump around 4600–4680 Å is visible in twospaxels, marked by a star in the [O iii] flux maps in Figure 6.
4.2. Haro 1 (=NGC 2415)
Haro 1 is classified as BCG by Gordon & Gottesman (1981) andKlein et al. (1984), and is included in the H ii galaxies samplestudied by Deeg et al. (1997). It has been defined as a pairedgalaxy with little (if any) tidal disturbance (Schneider & Salpeter1992). Its companion is UGC 3937, with a redshift difference ofonly 210 km s−1 and a projected distance of 350 kpc (23 arcminat Haro 1’s distance). Broad-band surface brightness photometrywas presented in Cairos et al. (2001a,b).
Maps are shown in Figures 6 and 7 (column 2). At the Haro 1distance, the spatial resolution is about 1.1 kpc per spaxel.
Haro 1 displays outer regular isophotes in the continuummaps. (The jagged appearance is the result of masking severalforeground stars; for the sake of clarity, a smaller star, located at≈ 30′′ east from the center, has been left, as well as the back-ground galaxy on the west-side). The continuum emission peakis placed roughly at the center of the isophotes. The emission-line maps display a more irregular pattern: a considerably largefilament extends out to the north-west, and the emission peakseems to be slightly offset to the west with respect to the contin-uum peak.
The [O iii]/Hβ ratio map has a shallow minimum, 0.40, inthe galaxy’s central region (where the emission peaks), and in-creases slightly outwards, reaching its maximum at the positionof the extension detected in emission-line maps. Radial changes
in the [O iii]/Hβ ratio have been found in spiral galaxies, andhave been interpreted as variation in the heavy element abun-dances (Searle 1971; Smith 1975). Interestingly, Haro 1 is themost luminous object in our sample, and it has been also classi-fied as a Sm galaxy (HyperLeda5; Paturel et al. 2003).
The extinction map shows little or no spatial variations, withan average extinction AV ∼ 0.90.
Haro 1’s kinematics show an overall regular rotation aboutan axis oriented southeast-northwest, with pretty much the samepattern and amplitude (about 160 km s−1) both in the gas and inthe stellar velocity maps.
The value derived for the metallicity, 12 + log (O/H) = 8.36,is slightly lower that the value of 12 + log (O/H) = 8.52 derivedin Shi et al. (2005), which used the P-method (as calibrated inPilyugin 2001).
4.3. NGC 4670 (=Haro 9, Arp 163)
NGC 4670 has been classified as a blue amorphous galaxy(Hunter et al. 1994; Marlowe et al. 1997), as a peculiar, barredS0/a galaxy (de Vaucouleurs et al. 1991) and as a BCG (Gil dePaz et al. 2003). It is listed as a peculiar galaxy with ”diffusecounter tails” in Arp’s catalogue (Arp 1966), and as a WR galaxyin Mas-Hesse & Kunth (1999) and Schaerer et al. (1999). Broad-band photometry and Hα imaging have been provided in Gil dePaz et al. (2003), Gil de Paz & Madore (2005) and Marlowe et al.(1997). It is also cataloged as a WR galaxy .
Maps are shown in Figures 6 and 7 (column 3). At theNGC 4670 distance, the VIRUS-P IFU 4.′′2 fiber diameter corre-sponds to about 460 pc.
The continuum map shows an outer regular morphology,with elliptical isophotes; the bulge, extremely bright, is clearlyelongated on an east-west axis. The continuum peak appears tobe a little displaced to the east, in agreement with the B-bandimage (Figure 1). In emission-lines, the galaxy displays a rathercomplex pattern, with a central, roughly circular and very brightH ii region, surrounded by an extended filamentary envelope,which has several bubbles, loops and extensions. Remarkableare the two biggest filaments, which expand to the southwest andnortheast, extending up to about 7.5 and 6.5 kpc respectively.
The ionization map displays an intriguing structure. The[O iii]/Hβ ratio clearly shows higher values in the central region,with a peak value ∼ 3, and at the outer edge of the two larger ex-tensions. Highest values of [O iii]/Hβ in the central knot, wherethe line-emission intensity also peaks, are consistent with pho-toionization produced by hot stars; it is not clear however whatthe ionizing mechanism acting on the filaments is. Althoughthe morphology suggests a shock-like excitation mechanism, no
5 http://leda.univ-lyon1.fr
12

L. M. Cairos et al.: Mapping Luminous Blue Compact Galaxies with VIRUS-P
conclusions can be drawn without the measurement of additionaldiagnostic lines. The excitation values we found agree very wellwith those reported in Hunter et al. (1994), [O iii]/Hβ = 2.97,derived for the spectra positioned on the center of the galaxy.
The extinction map shows a roughly flat behavior in the innerregion, with AV around 0.40, and seems to be dominated by noisein the outer parts.
Hunter et al. (1994), analyzing VLA data, report an “orderedrotation east-west, and the motion appears to be that of a disk atthe same position angle as the optical galaxy (∼ −100 deg)”. Ourvelocity maps show a more complex picture. At first sight a rota-tion pattern, though somewhat irregular, is visible in the gaseouscomponent, with an amplitude of about 150 km s−1, around anaxis oriented roughly northwest-southeast; the velocity gradientseems to be a little steeper in the northeast side of the galaxycompared to the southwest part. The stellar velocity field is over-all flat, and broadly agrees with the gas kinematics in the samearea, except for the slight velocity rise toward its east edge, visi-ble in the [O iii] radial velocity map but not in the stellar one.
The behavior of the gas and stellar kinematics can be betterperceived in Fig 10, where we plot a velocity profile along a linewith PA = 50 deg, where the gas distribution extends the mostfrom the galaxy center, and a velocity profile at PA = −100 deg,the value adopted by Hunter et al. (1994). Both graphs show asomewhat irregular rise of the gas velocity in a central regionof about 40′′ in size, and are flat, though noisier, outside it. Thestellar velocity profile shows that the stars co-rotate with the gas,but with a lower velocity gradient, and seems to flatten out atsomewhat smaller radial distance than the gas. Furthermore, theisovelocity contour at V = 1050 km s−1 in the [O iii] velocityfield is clearly S-shaped, a characteristic typical of barred galax-ies (Peterson et al. 1978).
Thus, the kinematics of NGC 4670 is unlike the one of arotating disk, and resembles more the kinematics of a barredgalaxy, in line with its morphological classification, SB(s)0/aP?,listed in de Vaucouleurs et al. (1991).
The derived metallicity, 12 + log (O/H) = 8.29, is slightlylower but consistent with the value of 12 + log (O/H) = 8.4reported in Mas-Hesse & Kunth (1999).
The Wolf-Rayet bump around 4600–4680 Å is visible inthree spaxels, marked by a star in the [O iii] flux maps inFigure 6.
4.4. Mrk 314 (=NGC 7468)
Mrk 314 has been cataloged as a polar-ring galaxy candidate(Whitmore et al. 1990; van Driel et al. 2000) and is includedin the Mazzarella & Boroson (1993) catalogue of multiple nu-clei galaxies. Surface photometry in the optical and in the NIRwas presented in Cairos et al. (2001a,b), Caon et al. (2005) andNoeske et al. (2005).
The maps of Mrk 314 are shown in Figures 6 and 7 (col-umn 4). The spatial sampling is about 590 pc per spaxel.
The galaxy displays a similar morphology in both emission-line and continuum maps, with the SF knots aligned along thenortheast southwest direction. In the continuum map, a moreextended stellar component, with elliptical isophotes, surroundsthe SF region. The brighter knot is located roughly at the cen-ter of the outer isophotes, and a tail-like feature departs in thesouthwest direction; a second filament extends out to the north-west. In the emission-line maps, the emission is concentrated ina central SF bar, the emission peak being slightly displaced fromthe continuum peak.
Fig. 10. Upper panel: Kinematical profile of NGC 4670 along aspatial cut through the reference point (0.0,8.0) and PA = 50 deg.The x axis is the distance of the projection of each spaxel on theabove line to the reference point; only spaxels whose distanceto the line is less than 6′′ have been selected and plotted. Lowerpanel: Kinematical profile through the same point as above andPA = −100 deg. Open points are [O iii] velocities, solid pointsstellar velocities.
The peak of the [O iii]/Hβ ratio is spatially co-located withthe line emission maximum, as expected for objects ionized byOB hot stars; the excitation peak value of ' 4.0 agrees well withthe value found by Garcıa-Lorenzo et al. (2008).
The extinction map does not show any definite pattern, buta more or less homogeneous distribution with somewhat highervalues at the south, and a AV value around 0.7–0.8 in the centralpart; this result is consistent with the Hα/Hβ map presented inGarcıa-Lorenzo et al. (2008), measured in a smaller FOV (16′′×12′′).
The ionized gas velocity field displays a complicated pat-tern. Around the main body of the galaxy, the velocity field issimilar to a rotating disk, with the rotation axis oriented east-west, the northern side approaching and the southern one reced-ing. This rotation is however perturbed in the central galaxy re-gions (within 10′′), where the velocity field shows an S-shapedistortion, indicative of the presence of a second rotating system.South of the main body (this area coincides with the tail-like fea-ture), the ionized gas is not rotating with the main-body galaxydisk.
An extensively kinematic analysis of this galaxy has beendone by Shalyapina et al. (2004), who found that Mrk 314harbors two kinematics subsystems of ionized gas: the main
13
L. M. Cairos et al.: Mapping Luminous Blue Compact Galaxies with VIRUS-P
gaseous disk, and a smaller inner disk oriented orthogonally toit. Our coarse spatial resolution does not allow us to either con-firm or disprove the existence this inner disk, but the kinematicsof the main disk agree well with the data shown by Shalyapinaet al. (2004): see for instance the peak in the velocity profile at' 30′′ south of the nucleus, and then the sharp decrease (theirFig. 2a).
The stellar velocity field looks more irregular, though thereseems to be some rotation along an axis at about PA =∼ 45 deg,with a total amplitude of about 70–80 km s−1.
The oxygen abundance we found in the integrated spectrum,12 + log (O/H) = 8.08, is somewhat lower than the one reportedby Shi et al. (2005), 12 + log (O/H) = 8.26 (derived using alsothe Te method), and the ones reported by Garcıa-Lorenzo et al.(2008), which range spatially from 8.14 to 8.35 (using the em-pirical calibrator N2, Denicolo et al. 2002).
4.5. III Zw 102 (=NGC 7625, Arp 212)
III Zw 102 is a galaxy well studied in a large range ofwavelengths, but still a puzzling system. It is included inthe Vorontsov-Velyaminov catalogue of interacting galaxies(Vorontsov-Velyaminov 1959) and in Arp’s Atlas of PeculiarGalaxies (Arp 1966). It has been classified as a SA(rs) a pecin RC2 (de Vaucouleurs et al. 1976), as a S0 pec (Lynds &Furenlid 1973), as an elliptical with dust lanes (Hawarden et al.1981; Bertola 1987; Yasuda et al. 1992), and as a BCG (Thuan &Martin 1981). Whitmore et al. (1990) considered III Zw 102 tobe ”related to polar-ring galaxies”. Broad-band photometry waspresented in Cairos et al. (2001a,b). III Zw 102 kinematics wasfirst studied by Demoulin (1969), which concludes, from opti-cal spectroscopy, that the galaxy rotates as a nearly solid bodywithin the central 30′′. H i gas displays a more complicated be-havior, with the outer H i showing apparent counter-rotation withrespect to the stellar and molecular gas components (Li et al.1993).
Results from 3D investigations of III Zw 102 have beenpublished in Garcıa-Lorenzo et al. (2008), where the central33.6′′ × 29.4′′ of the galaxy were mapped with a spatial reso-lution of 2.7′′ spaxel−1, using the IFS integral, and in Moiseev(2008), where the distribution and kinematics of the ionized gaswas studied by means of Fabry-Perot scanning interferometry.
Maps of III Zw 102 are shown in Figures 6 and 7 (col-umn 5). The VIRUS-P IFU 4.′′2 fiber diameter corresponds toabout 470 pc.
In the continuum the galaxy displays outer circularisophotes, indicative of the presence of an underlying popula-tion of older stars, extending up to a radius of about 7 kpc. Thecentral regions are more irregular, and have elliptical isophotes,with the major axis oriented in the northeast-southwest direc-tion. The presence of dust is clear seen on the continuum map: adust lane crosses the galaxy in a southwest-northeast direction,almost parallel to the ellipses’ major axis, and large dust patchesare also evident at the south, almost parallel to the galaxy minoraxis. In the narrow-band maps the morphology is more irregu-lar, with several filaments, bubbles and holes. The extended fila-ments, departing to the southeast and to the northwest, are verywell traced in the [O ii] and Hβ maps.
The [O iii]/Hβ ratio (see Figure 7) is lower in the central partof the galaxy, with a minimum value of ' 0.22, in good agree-ment with the values published by Garcıa-Lorenzo et al. (2008).The excitation, like in Haro 1, increases towards the galaxy out-skirts, a behavior often seen in spiral galaxies (Smith 1975). Just
like Haro 1, III Zw 102 is a luminous object, which has beenclassified as a spiral by de Vaucouleurs et al. (1976).
The extinction map is highly inhomogeneous, and traceswell the dust lanes detected in optical frames and color maps.The values are indicative of a considerable amount of dust.
The stellar kinematics display an overall rotation around anaxis oriented approximately northwest-southeast, with the north-east side approaching and the southwest receding, and a velocityamplitude of about 160 km s−1. The gas kinematics, which inthis galaxy is better mapped by the Hβ line (stronger than [O iii])broadly agrees with the stellar kinematics in the inner region.Notable are the two features protruding from either side of thegalaxy, and which, together with the knot 40′′ northeast of thegalaxy center, seem to form a structurally and kinematically in-dependent system. These findings are in line with the results ofthe detailed analysis of this galaxy published by Moiseev (2008):III Zw 102 is made up of two distinct systems: an inner disk,where gas and stars co-rotate, and a polar ring orthogonal to it.
The oxygen abundances, 12 + log (O/H) = 8.44 in the inte-grated spectrum, and 12 + log (O/H = 8.49 in the nuclear spec-trum, are much lower than those derived in Garcıa-Lorenzo et al.(2008) using the empirical calibrator N2 (Denicolo et al. 2002),ranging from 8.81 to 8.84 in the circumnuclear regions and about8.85 for the nucleus. While the disagreement can be due partly tothe different corrections for the underlying absorption at Hβ, dis-crepancies of up to 0.4 dex between values obtaining using theP-method and N2 have already been reported (Shi et al. 2005).
5. Summary
We present results of an IFS analysis of five luminous BCGgalaxies, based on VIRUS-P data covering the wavelength in-terval 3550–5850 Å with a resolution of about 5 Å FWHM. Themapped area is 1.′8 by 1.′8, each fiber corresponding to a circleof 4.′′2 on the sky.
For each galaxy, spaxel by spaxel, we modeled and sub-tracted the stellar continuum before fitting the most importantemission-lines with a Gaussian. We produced an atlas of mapsof the most relevant emission-lines in the spectra: [O ii] λ3727,Hγ, Hβ, and [O iii] λ5007, of the continuum, of the extinction(AV ) and the excitation ([O iii] λ5007/Hβ) ratios, as well as ofthe gas and the stellar kinematics. Integrated and nuclear spec-troscopic properties (line fluxes, extinction coefficient, and metalabundances) were also derived. From this study, we highlight thefollowing results:
– All galaxies show a regular morphology in the continuum,with outer elliptical or circular isophotes; the ionized gasdisplays a more complex pattern, with filamentary emis-sion and the presence of bubbles and holes. Remarkable areNGC 4670, where the gas emission shows two large exten-sions north and southwest of the center, and III Zw 102,where the two narrow features protruding almost symmet-rically from the main body, and a knot north of the galaxycenter, form part of a polar ring.
– The galaxies display different ionization patterns: inII Zw 33 and Mrk 314 the excitation ratio, [O iii] λ5007/Hβtraces the SF regions, as expected in objects ionized bystars. NGC 4670 has a somewhat complex pattern, with[O iii] λ5007/Hβ peaking in the central [H ii] region and atthe outer edge of the two large filaments. These three galax-ies have excitation ratios larger than one. In Haro 1 andIII Zw 102, Hβ is stronger than [O iii], and the excitation
14

L. M. Cairos et al.: Mapping Luminous Blue Compact Galaxies with VIRUS-P
does not trace the SF regions, but has a minimum in the cen-tral galaxy regions (where the emission peaks) and increasestowards the galaxy outskirts.
– All galaxies possess significant amounts of dust, with inter-stellar reddening values up to AV ∼ 1.0.
– A variety of kinematical behaviors are present in the sam-ple galaxies. II Zw 33 shows little or no rotation, while inHaro 1 gas and stars both display the same overall regularrotation pattern. The kinematics of NGC 4670 is typical ofa barred galaxy, with S-shaped isovelocity contours in thegaseous component; stars co-rotate with the gas, albeit witha smaller gradient and amplitude. Mrk 314 has an irregularrotation pattern, with a drop in velocity in its southern lobe.The most complex object is III Zw 102, with two kinemati-cally independent systems: an inner disk, where gas and starsco-rotate, and a polar ring orthogonal to it.
Acknowledgements. L. M. Cairos acknowledges the Alexander von HumboldtFoundation. VIRUS-P has been made possible by a generous donation fromthe Cynthia and George Mitchell Foundation. This paper includes data takenat The McDonald Observatory of the University of Texas at Austin. We thankJ. N. Gonzalez-Perez and J. Falcon Barroso for stimulating discussions andtips on the data processing and analysis. N. Caon is grateful for the hospi-tality of the Leibniz-Institut fur Astrophysik. This research has made use ofthe NASA/IPAC Extragalactic Database (NED), which is operated by the JetPropulsion Laboratory, Caltech, under contract with the National Aeronauticsand Space Administration. This work has been funded by the Spanish Ministryof Science and Innovation (MCINN) under the collaboration ”Estallidos”(grants HA2006-0032, AYA2007-67965-C03-01 and AYA2010-21887-C04-04).P. Papaderos is supported by Ciencia 2008 Contract, funded by FCT/MCTES(Portugal) and POPH/FSE (EC).
ReferencesAller, L. H., ed. 1984, Astrophysics and Space Science Library, Vol. 112, Physics
of thermal gaseous nebulaeArp, H. 1966, ApJS, 14, 1Bergvall, N. 2012, Star Forming Dwarf Galaxies, ed. P. Papaderos, S. Recchi, &
G. Hensler, 175Bergvall, N. & Ostlin, G. 2002, A&A, 390, 891Bertola, F. 1987, in IAU Symposium, Vol. 127, Structure and Dynamics of
Elliptical Galaxies, ed. P. T. de Zeeuw, 135–144Blanc, G. A., Heiderman, A., Gebhardt, K., Evans, N. J., & Adams, J. 2009, ApJ,
704, 842Burstein, D. & Heiles, C. 1982, AJ, 87, 1165Cairos, L. M., Caon, N., Garcıa-Lorenzo, B., et al. 2007, ApJ, 669, 251Cairos, L. M., Caon, N., Garcıa-Lorenzo, B., Vılchez, J. M., & Munoz-Tunon,
C. 2002, ApJ, 577, 164Cairos, L. M., Caon, N., Papaderos, P., et al. 2009a, ApJ, 707, 1676Cairos, L. M., Caon, N., Papaderos, P., et al. 2003, ApJ, 593, 312Cairos, L. M., Caon, N., Vılchez, J. M., Gonzalez-Perez, J. N., & Munoz-Tunon,
C. 2001a, ApJS, 136, 393Cairos, L. M., Caon, N., Zurita, C., et al. 2010, A&A, 520, A90Cairos, L. M., Caon, N., Zurita, C., et al. 2009b, A&A, 507, 1291Cairos, L. M., Vılchez, J. M., Gonzalez Perez, J. N., Iglesias-Paramo, J., & Caon,
N. 2001b, ApJS, 133, 321Caon, N., Cairos, L. M., Aguerri, J. A. L., & Munoz-Tunon, C. 2005, ApJS, 157,
218Cappellari, M. & Emsellem, E. 2004, PASP, 116, 138de Vaucouleurs, G., de Vaucouleurs, A., Corwin, Jr., H. G., et al. 1991,
Third Reference Catalogue of Bright Galaxies, ed. de Vaucouleurs, G., deVaucouleurs, A., Corwin, H. G., Jr., Buta, R. J., Paturel, G., & Fouque, P.
de Vaucouleurs, G., de Vaucouleurs, A., & Corwin, J. R. 1976, in Second refer-ence catalogue of bright galaxies, 1976, Austin: University of Texas Press.
Deeg, H., Duric, N., & Brinks, E. 1997, A&A, 323, 323Demoulin, M.-H. 1969, ApJ, 157, 69Denicolo, G., Terlevich, R., & Terlevich, E. 2002, MNRAS, 330, 69Dopita, M. A. & Sutherland, R. S. 1995, ApJ, 455, 468Doublier, V., Caulet, A., & Comte, G. 1999, A&AS, 138, 213Doublier, V., Comte, G., Petrosian, A., Surace, C., & Turatto, M. 1997, A&AS,
124, 405Fanelli, M. N., O’Connell, R. W., & Thuan, T. X. 1988, ApJ, 334, 665Garcıa-Lorenzo, B., Cairos, L. M., Caon, N., Monreal-Ibero, A., & Kehrig, C.
2008, ApJ, 677, 201
Gil de Paz, A. & Madore, B. F. 2005, ApJS, 156, 345Gil de Paz, A., Madore, B. F., & Pevunova, O. 2003, ApJS, 147, 29Gordon, D. & Gottesman, S. T. 1981, AJ, 86, 161Grimes, J. P., Heckman, T., Aloisi, A., et al. 2009, ApJS, 181, 272Guseva, N. G., Papaderos, P., Izotov, Y. I., et al. 2003a, A&A, 407, 75Guseva, N. G., Papaderos, P., Izotov, Y. I., et al. 2003b, A&A, 407, 91Guseva, N. G., Papaderos, P., Izotov, Y. I., et al. 2003c, A&A, 407, 105Hawarden, T. G., Longmore, A. J., Tritton, S. B., Elson, R. A. W., & Corwin, Jr.,
H. G. 1981, MNRAS, 196, 747Hill, G. J., MacQueen, P. J., Adams, J., et al. 2007, in Bulletin of the American
Astronomical Society, Vol. 39, American Astronomical Society MeetingAbstracts, 747
Hill, G. J., MacQueen, P. J., Smith, M. P., et al. 2008, in Presented at theSociety of Photo-Optical Instrumentation Engineers (SPIE) Conference, Vol.7014, Society of Photo-Optical Instrumentation Engineers (SPIE) ConferenceSeries
Hill, G. J., MacQueen, P. J., Tufts, J. R., et al. 2006, in Presented at theSociety of Photo-Optical Instrumentation Engineers (SPIE) Conference, Vol.6269, Society of Photo-Optical Instrumentation Engineers (SPIE) ConferenceSeries
Hunter, D. A. & Elmegreen, B. G. 2004, AJ, 128, 2170Hunter, D. A., van Woerden, H., & Gallagher, III, J. S. 1994, ApJS, 91, 79Izotov, Y. I., Guseva, N. G., Fricke, K. J., et al. 2010, A&A, 517, A90Izotov, Y. I., Schaerer, D., Blecha, A., et al. 2006a, A&A, 459, 71Izotov, Y. I., Stasinska, G., Meynet, G., Guseva, N. G., & Thuan, T. X. 2006b,
A&A, 448, 955James, B. L., Tsamis, Y. G., Barlow, M. J., et al. 2009, MNRAS, 398, 2Klein, U., Wielebinski, R., & Thuan, T. X. 1984, A&A, 141, 241Kniazev, A. Y., Pustilnik, S. A., Grebel, E. K., Lee, H., & Pramskij, A. G. 2004,
ApJS, 153, 429Kunth, D. & Ostlin, G. 2000, A&A Rev., 10, 1Li, J. G., Seaquist, E. R., Wrobel, J. M., Wang, Z., & Sage, L. J. 1993, ApJ, 413,
150Loose, H.-H. & Thuan, T. X. 1986, in Star-forming Dwarf Galaxies and Related
Objects, 73–88Lynds, B. T. & Furenlid, I. 1973, ApJ, 186, 445Marlowe, A. T., Meurer, G. R., Heckman, T. M., & Schommer, R. 1997, ApJS,
112, 285Mas-Hesse, J. M. & Kunth, D. 1999, A&A, 349, 765Mas-Hesse, J. M., Kunth, D., Tenorio-Tagle, G., et al. 2003, ApJ, 598, 858Mazzarella, J. M. & Boroson, T. A. 1993, ApJS, 85, 27McCall, M. L., Rybski, P. M., & Shields, G. A. 1985, ApJS, 57, 1Mendez, D. I., Cairos, L. M., Esteban, C., & Vılchez, J. M. 1999, AJ, 117, 1688Moiseev, A. V. 2008, Astrophysical Bulletin, 63, 201Moustakas, J. & Kennicutt, Jr., R. C. 2006, ApJS, 164, 81Murphy, J. D., Gebhardt, K., & Adams, J. J. 2011, ApJ, 729, 129Noeske, K. G., Papaderos, P., Cairos, L. M., & Fricke, K. J. 2005, A&A, 429,
115Osterbrock, D. E. & Ferland, G. J. 2006, Astrophysics of gaseous nebulae and
active galactic nuclei (Astrophysics of gaseous nebulae and active galactic nu-clei, 2nd. ed. by D.E. Osterbrock and G.J. Ferland. Sausalito, CA: UniversityScience Books, 2006)
Papaderos, P., Guseva, N. G., Izotov, Y. I., & Fricke, K. J. 2008, A&A, 491, 113Papaderos, P., Izotov, Y. I., Fricke, K. J., Thuan, T. X., & Guseva, N. G. 1998,
A&A, 338, 43Papaderos, P., Loose, H.-H., Thuan, T. X., & Fricke, K. J. 1996, A&AS, 120,
207Paturel, G., Petit, C., Prugniel, P., et al. 2003, A&A, 412, 45Peterson, C. J., Thonnard, N., Rubin, V. C., & Ford, Jr., W. K. 1978, ApJ, 219,
31Pilyugin, L. S. 2000, A&A, 362, 325Pilyugin, L. S. 2001, A&A, 369, 594Pilyugin, L. S. & Thuan, T. X. 2005, ApJ, 631, 231Renka, L. L. & Cline, A. K. 1984, Rocky Mountain J. Math, 14, 223Sanchez-Blazquez, P., Peletier, R. F., Jimenez-Vicente, J., et al. 2006, MNRAS,
371, 703Schaerer, D., Contini, T., & Pindao, M. 1999, A&AS, 136, 35Schlafly, E. F. & Finkbeiner, D. P. 2011, ApJ, 737, 103Schlegel, D. J., Finkbeiner, D. P., & Davis, M. 1998, ApJ, 500, 525Schneider, S. E. & Salpeter, E. E. 1992, ApJ, 385, 32Searle, L. 1971, ApJ, 168, 327Shalyapina, L. V., Moiseev, A. V., Yakovleva, V. A., Hagen-Thorn, V. A., &
Barsunova, O. Y. 2004, Astronomy Letters, 30, 583Shi, F., Kong, X., Li, C., & Cheng, F. Z. 2005, A&A, 437, 849Smith, H. E. 1975, ApJ, 199, 591Stasinska, G. 2009, What can emission lines tell us?, ed. J. Cepa, 1Thuan, T. X. & Martin, G. E. 1981, ApJ, 247, 823Vacca, W. D. & Conti, P. S. 1992, ApJ, 401, 543
15
L. M. Cairos et al.: Mapping Luminous Blue Compact Galaxies with VIRUS-P
van Driel, W., Arnaboldi, M., Combes, F., & Sparke, L. S. 2000, A&AS, 141,385
Vanzi, L., Cresci, G., Telles, E., & Melnick, J. 2008, A&A, 486, 393Vorontsov-Velyaminov, B. A. 1959, in Atlas and catalog of interacting galaxies
(1959), 0Walter, F., Brinks, E., Duric, N., & Klein, U. 1997, AJ, 113, 2031Whitmore, B. C., Lucas, R. A., McElroy, D. B., et al. 1990, AJ, 100, 1489Yasuda, N., Fujisawa, K., Sofue, Y., et al. 1992, PASJ, 44, 1
16