mapping literacy in india: who are the illiterates and...
TRANSCRIPT

Mapping Literacy in India
R. Govinda and K. Biswal April 20, 2005 1
Background paper prepared for the
Education for All Global Monitoring Report 2006
Literacy for Life
Mapping literacy in India: who are the illiterates
and where do we find them?
R. Govinda, and K.Biswal 2005
This paper was commissioned by the Education for All Global Monitoring Report as background information to assist in drafting the 2006 report. It has not been edited by the team. The views and opinions expressed in this paper are those of the author(s) and should not be attributed to the EFA Global Monitoring Report or to UNESCO. The papers can be cited with the following reference: “Paper commissioned for the EFA Global Monitoring Report 2006, Literacy for Life”. For further information, please contact [email protected]
2006/ED/EFA/MRT/PI/36

Mapping Literacy in India
R. Govinda and K. Biswal April 20, 2005 2
Contents
Section I: Growth in literacy 1-5
Section II: Gender and regional variations in literacy 5-11
Section III: Literacy rates by age, social group and household type 11-17
Section IV: Who are the illiterates? 17-19
Section V: Concluding remarks 19-21
Annexure I 22-31
List of Tables
Table 1: Relative position of major states in terms of gender disparity in literacy rates, 1991 and 2001
Table 2: Literacy rate of population (age 15+), India, 1981-2001
Table 3: Percentage distribution of population (age 6 and above) by literacy rate and primary level of education, India, 1998-99
Table 4: estimated number of illiterates by age group and sex, India, 2001 (based on NFHS-2 estimates of illiteracy rate in 1998-99)
Table 5: Correlations among illiterates, SC and ST population, and agricultural labour in India, 2001
List of Charts
Chart 1: Literacy rates by sex in India since 1951
Chart 2: Progress of literacy rates by sex and rural/urban area in India since 1951
Chart 3: Share of illiterates (persons) in India, 2001
Chart 4: Share of female illiterates to total illiterates in India, 2001
Chart 5: GPI of literacy rates in major states, 1991 and 2001
Chart 6: Share of females in total illiterates, 2001
Chart 7: Distribution of top 100 districts (in terms of absolute number of illiterates), 2001
Chart 8: Distribution of 81 districts where more than half of the population are illiterates, 2001
Chart 9: Literacy rate of the population in the age group 15+, 1961-2001
Chart 10: Percentage of illiterates by age group and sex, India (NFHA-2), 1998-99
Chart 11: Illiterates per 1000 persons (7+ age group) by sex and social group in rural and urban India, 1999-2000
Chart 12: Illiterates per 1000 persons (7+ age group) by sex and social group in rural area by social group in 7 major states in India, 1999-2000
Mapping Literacy in India
R. Govinda and K. Biswal April 20, 2005 3
Chart 13: Illiterates per 1000 persons (7+ age group) by sex and social group in urban area by social group in 7 major states in India, 1999-2000
Chart 14: Illiterates per 1000 persons (7+ age group) by sex and household type in rural India, 1999-2000
Chart 15: Illiterates per 1000 persons (7+ age group) by sex and household type in urban India, 1999-2000
Chart 16: illiterates per 1000 persons (7+ age group) by household type in rural area in major states in India, 1999-2000
Chart 17: Per 1000 distribution of 7+ age group population by educational level and MPCE class in rural India, 1999-2000
Chart 18: Per 1000 distribution of 7+ age group population by educational level and MPCE class in urban India, 1999-2000
List of Maps
Map 1: Female literacy in India, 2001
Map 2: 67 districts with million plus illiterates, 2001

Mapping Literacy in India
R. Govinda and K. Biswal April 20, 2005 4
Mapping Literacy in India1 Who are the illiterates and where do we find them?
I. Growth in Literacy
India covers an area of 3,287,263 sq. km from the Himalayas to the tropical rain forests of the south. The country is divided into 28 states and 7 union territories (UTs) for the purpose of governance. States and the centre function under a federal relationship. Union territories are under the direct control of the Central Government. Education has been on the Concurrent List of the Constitution of India since 1976. As per the national census, 2001, total population of India is 1027.02 million, out of which 495.74 million are females. As the second most populous country, India is home to 16 per cent of world’s population. In terms of Human Development Index (HDI), India occupies 127th position in the family of 177 nations (Human Development Report 2004). The paper makes a modest attempt at mapping out literacy in India, focusing on an analysis of the illiterates by making use of data from the Census of India, the National Family Health Survey-2, and various rounds of the National Sample Survey. The primary objective of the paper is to locate the illiterates at the sub-national and district levels, and to highlight the characteristics of the illiterates, given the limitations of the available information.
The National Adult Education Programme (NAEP), the first countrywide programme in 1978, viewed literacy as a means to bring about fundamental changes in socio-economic development. It aimed at covering 100 million illiterate persons in the age group 15-35 in the adult education centres across the country. Based on the findings of the evaluation of the NAEP, the National Policy on Education (1986) suggested creation of a National Literacy Mission (NLM) to design and manage large-scale literacy programmes. Adopting a well-defined campaign approach, the NLM launched the total literacy campaigns in 1990. The objective was to impart functional literacy (i.e. self-reliance in 3 Rs) to non-literates in the age group 15-35. The total literacy campaigns also created positive environment for implementing national and state level basic education programmes. The initial literacy campaign was followed up with post-literacy and continuing education programmes aimed at preventing relapse into illiteracy, to enroll dropouts and enable non-achievers to upgrade their literacy skills. Besides various adult literacy programmes, the literacy rate of population in 7-14 age group has been directly influenced by the implementation of a number of basic education development programmes in the 1990s, thereby directly contributing to the overall literacy status of population in 7+ age group.
In most of the developing countries, including India, literacy has been measured by the ‘literacy rate’, which is the percent (or, equivalently, fraction) of the population, usually adult population. In India, the decennial census data remain the most widely acceptable and frequently quoted estimates of literacy. Besides, the National Sample Survey Organization (NSSO) conducts sample surveys once in every five years, usually in between two census years, to collect data on literacy status and other socio-economic characteristics of the population. The estimates of literacy by the NSSO can be viewed as the mid-term assessment of literacy in the country. The NLM designs, implements and
1 R. Govinda (e-mail: [email protected]) and K. Biswal (e-mail: [email protected]), National Institute of Educational Planning and Administration (NIEPA), 17-B, Sri Aurobindo Marg, New Delhi –110 016, India, April 2005. The views expressed in the paper are that of the authors and should not be attributed to NIEPA.

Mapping Literacy in India
R. Govinda and K. Biswal April 20, 2005 5
monitors literacy programmes, and formulates guidelines for literacy assessment. Several other non-governmental bodies/organizations also carry out independent studies on assessment of literacy2. The National Family Health Surveys of the International Institute for Population Sciences (IIPS), Mumbai provide database on a variety of demographic and socio-economic indicators, including literacy, on the basis of sample study of the households.
However, the definition and method of assessment of ‘literacy’ varies across various sources such as the Census of India, NLM, NSSO and NFHS. The definition of ‘literacy’ in the population census of India is fairly liberal3. In the census enumeration, ‘a person, who can read and write with understanding in any language, is treated as literate. The person may or may not have received any formal education.’4 The data on literacy collected through census enumeration is based on self-declaration of the respondent, and thus, it classifies all individuals into only two categories, i.e. literate and illiterate. It does not make any distinction between the ‘proximate’5 and ‘isolated’6 illiterates.7 The census data thus suffer from obvious limitations, as these are not based on any objective measure to test the literacy status of the respondents.
The literacy figures of different census years are not strictly comparable. Since 1991 census, children in the age group 0-6 have been treated as illiterates by definition and the 7+ age group population has been considered for estimating the literacy rate. Prior to 1991 census, the literacy rate had been estimated taking the 5+ age group population as the denominator8. The NSSO survey covers the entire country and adopts the census definition of literacy but takes a sample as a basis for estimation. However, in1991, the NSSO administered tests to a sub-sample of the 15+ age group population to verify the literacy status of those who declared themselves as literate. One of the important outcomes of this exercise was that nearly 34% of those who claimed ‘literate’ status had failed to qualify the test (NSSO 1995). This has significant implications for assessing estimates of literacy rate provided in different population censuses.
The NSSO surveys also provide useful information on the characteristics of various types of households defined in terms of monthly per capita consumer expenditure, main occupation, etc. by literacy status. The latest survey of the NSSO (55th Round9) was conducted in July 1999- June 2000. There was only 7-month difference between the latest NSS (55th Round) and the population census in 2001. The findings of the NSS (55th Round) on literacy10 are quite robust as these are not much different from that of the Census of India, 2001 (see Table A5 in Annexure I). The National Literacy Mission defines literacy as ‘acquiring the skills of reading, writing and arithmetic and the ability to
2 For example, literacy assessment practices by the Indian Institute of Education in Maharashtra, and Digantar in Madhya Pradesh. However, these innovative literacy assessment practices have not been widely replicated in the country. For further details, see Rao, I. V. Subba (2002), “Literacy Assessment Practices (LAP) in Selected Developing Countries: India Case Study.” 3 If literacy is measured in terms of years of schooling, the average is merely 2.4 years in India for persons aged 25 and above (Dreze and Sen 1995). 4 Census of India, 2001, State of Literacy (Chapter 7), Provisional Population Totals, Series 1, India, Paper 1 of 2001. 5 An illiterate member (s) having literate member (s) in the household, which generates intra-household externalities. 6 An illiterate member (s) having no literate member in the household, which does not generate intra-household externalities. 7 For further details, see Basu, Kaushhik, et al, (2000), “Isolated and proximate illiteracy and why these concepts matter in measuring literacy and designing education programmes.” Working Paper No. 00-W02, Vanderbilt University, Nashville. 8 When total population is taken as the denominator, the estimated literacy rate is called the ‘crude literacy rate.’ 9 Sample size was 600,016. The survey followed a two stage stratified design with villages or urban blocks as first stage and households as second stage. 10 NSSO (2001), “Literacy and Levels of Education in India, 1999-2000.” Report No. 437 (55/1.0/11), Ministry of Statistics and Programme Implementation, Government of India.

Mapping Literacy in India
R. Govinda and K. Biswal April 20, 2005 6
apply them to one’s day-to-day life.’11 The definition of literacy by the NLM goes beyond the census definition and focuses on the functional literacy. The NFHS defines an ‘illiterate person’ as one who can not read and write, even if he/she may have been to school12.
Over the last five decades, there has been an impressive growth in literacy in India. In 1901, a little over 5% of Indian population was literate, which increased to around 16% in 1950, a mere increase of 11 percentage points in the literacy rate during the first half of the century. In the post-independence period, the decadal growth in literacy has shown a substantial progress – i.e. from 18.35% (5+ age group population) in 1951 to 65.38% (7+ age group population) in 2001.
Chart 1: Literacy rate by sex in India since 1951
27.16
40.4
45.96
56.38
64.13
75.85
8.86
15.35
21.97
29.76
39.29
54.16
18.33
28.3
34.45
43.57
52.21
65.38
0
10
20
30
40
50
60
70
80
1951 1961 1971 1981 1991 2001
Census Year
Per
cen
tag
e o
f lit
erat
es
Male
Female
Total
Source: Census of India, 2001.
Notes: (i) Literacy rates for 1951,1961 and 1971 censuses relate to population aged five years and above. The rates for the 1981,1991 and 2001 census relate to population aged seven years and above.
(ii) In the 1981 census, literacy rates exclude Assam where census could not be conducted and the 1991 literacy rates exclude Jammu & Kashmir where Census could not be conducted due to disturbed conditions.
(iii) In the 2001 census, literacy rates exclude entire Kachchh district, Morvi, Maliya-Miyana and Wankaner talukas of Rajkot district, Jodiya taluka of Jamnagar district of Gujarat State and entire Kinnaur district of Himachal Pradesh where population enumeration of the Census of India, 2001 could not be conducted due to natural calamities.
The female literacy rate was just 8.9% in 1951, which went up to 54.2% in 2001 (see Chart 1). The literacy rates for population in the 7+ age group are available for the last three censuses, and therefore, comparable for assessing the progress. In 1981, the literacy rate was 43.57% (56.58% for male and 29.76% for female), which increased to 52.21%13 (64.13% for males and 39.29% for females) in 1991. In 2001, almost two-thirds of India’s population (65.38%), and around three-fourths of males (75.85%) and more than half of females (54.16%) were literate.
Between 1981 and 2001, while the literacy rate of population increased by 21.82 percentage points, the female literacy rate went up by 24.41 percentage points. During this period, the increase in the female literacy rate was more than the male literacy rate, which was 19.48 percentage points. The literacy rate registered an increase of 13.17 percentage points from 1991 to 2001; the highest increase in any one-decade. Much of this increase
11 NLM, 1994, and website of the NLM. 12 IIPS (2000), NFHS-2, India. p. 28. 13 Excluding Jammu and Kashmir, where census could not be conducted.

Mapping Literacy in India
R. Govinda and K. Biswal April 20, 2005 7
may be due to the implementation of various national and state level externally funded primary education programmes and the national adult literacy programmes of the NLM. The increase in female literacy (14.87 percentage points) was also relatively higher than that of the male literacy rate (11.72 percentage points) in the 1990s.
In 1951, only 12.1% of rural population and 4.87% of females in India were literate. In 2001, rural literacy rate increased to 59.4% (71.4% for males and 46.7% for females). During 1991-2001, the increase in female literacy rate (16.1 percentage points) in rural area was relatively more compared to that of the male (13.5 percentage points). In urban India, only 34.59% of the population was literate in 1951, which increased to 80.3% in 2001. The female literacy rate was 22.33% in 1951, which increased to 73.2% in 2001 (see Chart 2). In urban area too the growth in female literacy rate (13.2 percentage points) was relatively faster than that of the male (5.6 percentage points) during 1991-2001. In 1951, the male-female differences in the literacy rate in rural and urban areas were 14.15 and 23.27 percentage points respectively. In 1991, the gaps in the male-female literacy rate in rural and urban areas were 27.3 and 17.1 percentage points respectively, which came down to 24.7 and 13.5 percentage points in 2001. In 1991, rural-urban gap in literacy rate was 28.4 percentage points, which decreased to 20.9 percentage points in 2001. In other words, while 4/5th of the urban population was literate, more than 2/5th of the rural population was illiterate in 2001.
Chart 2: Progress of literacy rates by sex and rural/urban area in India since 1951*
19.02
4.87
12.1
45.6
22.33
34.59
27.16
8.86
18.33
34.3
10.1
22.5
66
40.5
54.4
40.4
15.35
28.3
48.6
15.5
27.9
69.8
48.8
60.2
45.96
21.97
34.45
49.6
21.7
36
76.7
56.3
67.2
56.38
29.76
43.57
57.9
30.6
44.7
81.1
64
73.1
64.13
39.29
52.21
71.4
46.7
59.4
86.7
73.2
80.375.85
54.16
65.38
0
10
20
30
40
50
60
70
80
90
100
Rural
Male
Rural
Female
Rural
Total
Urban
Male
Urban
Fem
ale
Urban
Tot
al
Male
(Rur
al+ U
rban
)
Female
(Rur
al+ U
rban
)
Total
(Rur
al+Urb
an)
Per
cen
tag
e o
f lit
erat
e
1951
1961
1971
1981
1991
2001
Source: Census of India, 2001.
Notes: (*) For 1951, the population male, female and persons refer to effective literacy rates and the break up of rural, urban, male and female components are crude literacy rates.
(i), (ii), and (iii) Same as that of Chart 1.
Another notable aspect of the progress in literacy in India is that, for the first time, the number of illiterates has gone down in absolute term. During 1991-2001, the population of India in the 7+ age group increased by 172 million, while around 204 million additional persons became literate. As a result, the total number of illiterates came down from 328.88 million in 1991 to 300.14 million14 in 2001. During this period, the absolute number of illiterates decreased by around 28.74 million. In 1981, India had 235.73 million literate persons, which increased to 359.28 million in 1991 and 566.71 million in 2001. The average annual growth of literate persons was 4.30% during 1981-91,
14 As per the provisional figures, the estimated number of illiterates in India was 296 million in 2001, which excludes the number of illiterates in Jammu and Kashmir. This figure increases to 300.14 million when the estimate is based on the district level data of the Census of India 2001, and the number of illiterates in Jammu and Kashmir is included .

Mapping Literacy in India
R. Govinda and K. Biswal April 20, 2005 8
and it was 4.66% during 1991-2001. The number of illiterates grew at an average annual growth rate of 0.75% during 1981-91, while it declined at an average annual growth rate of –0.91% during 1991-2001.
II. Gender and Regional Variations in Literacy
As has been mention earlier in Section I, there has been relatively greater progress in the literacy rate of females during the last two decades. The gender gap has been reduced in 2001 compared to what it was in 1981 and 1991. Male-female differential in literacy rate was 26.62 percentage points in 1981 and 24.84 percentage points in 1991, which decreased to 21.70 percentage points in 2001. The progress in the female literacy rate hides the fact that, the decrease in absolute number of non-literate females between 1991 and 2001 is relatively small compared to that of the males. In 1991, the number of male illiterates in the country was 128.099 million, which came down to 106.654 million in 2001. The decrease in the number of male illiterates was 16.74% during 1991-2001. In 1991, the number of female illiterates was 200.068 million, which decreased to 189.554 million in 2001. The decrease was just 5.25% during the same period.
The slower progress made in the reduction of the number of non-literate females during the last decade can be attributed to relatively lower participation rate and higher dropout rate of girls at the primary level of education. According to the National Family Health Survey15 (NFHS-2), while 85.2% of boys in the age group 6-10 were attending school, only 78.3% of girls were doing so in 1998-99. In 2000-01, the percentage share of girls in total enrolment at primary level was 43.7. The boys-girls differential in the Gross Enrolment Ratio (GER) at the primary level was around 19 percentage points.16
Besides, there exist huge variations in literacy rates across states (provinces) in India. According to 2001 census, Kerala remains on the top with a literacy rate of 90.9%, while Bihar is at the bottom with a literacy rate of 47.5%. In 2001, 23 states/UTs had literacy rate equal to or above the national average (Chhatisgarh having literacy rate of 65.18% included). States/UTs having literacy below the national average are Assam, Madhya Pradesh, Orissa, Meghalaya, Andhra Pradesh, Rajasthan, Dadra and Nagar Haveli, Uttar Pradesh, Arunachal Pradesh, Jammu and Kashmir, Jharkhand and Bihar. In the same year, 24 states and UTs had male and female literacy rates equal to or more than the national average. States having female literacy rate below the national average are Chhatisgarh, Andhra Pradesh, Orissa, Madhya Pradesh, Rajasthan, Arunachal Pradesh, Dadra and Nagar Haveli, Uttar Pradesh, Jammu and Kashmir, Jharkhand and Bihar.
Between 1991 and 2001, Kerala has registered the lowest increase in the literacy rate (1.11 percentage points), primarily because of the high literacy rate in the base year. Among the educationally backward states mostly located in the north, Bihar has shown the lowest increase in the literacy rate during the last decade (i.e. 10.04 percentage points), and Rajasthan and Chhatisgarh have registered the highest increase (i.e. 22.48 and 22.27 percentage pints respectively). The literacy rate during the last decade has also increased substantially in Uttar Pradesh (16.65 percentage points), Arunachal Pradesh (17.03 percentage points), Andhra Pradesh (17.02 percentage points) and Madhya Pradesh (19.44 percentage points), and Orissa (14.52 percentage points). During the last decade, the educationally backward states located in the Hindi speaking belt of the country have
15 The survey also finds that while the median number of years of schooling was 5.5 for males (6+ age group), it was only 1.6 for females (6+ age group). The share of girls’ enrolment in total enrolment at primary level (grades I-V) 43.6% in 1999-2000, and the Gross Enrolment Ratio (GER) was 104.1% for boys and 85.2% for girls (Selected Educational Statistics, MHRD, 1999-2000). Around 39% of boys entering grade I dropped out before grade V, and 42% of girls did so (Selected educational Statistics, MHRD, 1999-2000). 16 Selected Educational Statistics, MHRD, GOI, various years.

Mapping Literacy in India
R. Govinda and K. Biswal April 20, 2005 9
contributed significantly to the reduction of illiteracy in the country. It may be noted that during the 1990s, several state specific basic education programmes like Uttar Pradesh Basic Education Programme, Bihar Education Programme, Andhra Pradesh Primary Education Programme, Lok Jumbish, and Education Guarantee Scheme were implemented in the educationally backward states. Besides, the District Primary Education Programme focused on the backward districts, mostly located in these states. The NLM also focused on these states while implementing adult literacy programmes. These interventions have perhaps contributed to the relative faster growth of literacy in educationally backward states. How much of this contribution can be attributed to basic education programmes and adult literacy programmes? One can have some idea about this only when census data on literacy by age group are available.
Even after the impressive progress in literacy during the last decade, still India is home to 300.14 million17 non-literates, which includes 191.93 million females (63.95%). Nearly 46.51% of illiterates are found in 4 states – Uttar Pradesh, Bihar, Andhra Pradesh and West Bengal. Around 65% of illiterates are found in 7 states -- Uttar Pradesh, Bihar, Andhra Pradesh, West Bengal, Maharashtra, Rajasthan and Madhya Pradesh (Chart 3). In absolute terms, nearly 194.52 million illiterates are found in these 7 states, and around 64% of them are females. The share of females in total illiterates of the state is very high in Uttaranchal (70.8%), Himachal Pradesh (69.2%), Kerala (69.2%), Rajasthan (68.6%) and Maharashtra (68.6%) (see Chart 5). However, in terms of female literacy rate in 2001, Kerala tops the list; Himachal Pradesh takes 10th rank, Maharashtra 11th rank, and Uttaranchal 18th rank. It implies that, even in educationally advanced states, most of the illiterates are females.
However, in 2001, the percentage change in the number of illiterate persons was negative in eight states/UTs namely, Dadra and Nagar Haveli, Daman and Diu, Manipur, Nagaland, Arunachal Pradesh, Bihar, Delhi and Chandigarh (see Table A5 and Chart A2 in Annexure I). Except Bihar, all other such states are located in the north-eastern part of the country, and the total population of these states is relatively small. The negative change in the number of illiterate persons in most of the above-mentioned union territories 17 Census of India, 2001 (Series 1, Provisional Population Totals (Paper 1 of 2001).
Chart 3: Share of illiterates (persons) in India 2001
19.24
11.64
8.557.086.325.975.94
Rest of India35%
Uttar Pradesh Bihar Andhra Pradesh
West Bengal Maharashtra Rajasthan
Madhya Pradesh rest of India
Chart 4: Share of female illiterates to total female illiterates in India 2001
19.02
11.03
8.326.96.796.416.17
35.36
Uttar Pradesh Bihar Andhra Pradesh
West Bengal Maharashtra Rajasthan
Madhya Pradesh Rest of India

Mapping Literacy in India
R. Govinda and K. Biswal April 20, 2005 10
is primarily because of rural-urban migration, especially casual labourers. More than 20% decrease in the number of illiterate persons during 1991-2001 was in two states -- Chhatisgarh (25.62%) and Himachal Pradesh (22.42%). Besides, during the same period, more than 15% decrease in the number of illiterate persons was in 8 other states – Rajasthan (16.95%), Tripura (18.58%), Madhya Pradesh (16.97%), Maharashtra (17.35%), Andhra Pradesh (17.28%), Goa (15.97%), Uttaranchal (19.13%) and Tamil Nadu (18.18%). More than 10% decrease in the number of illiterates was in 3 states – West Bengal (11.04%), Mizoram (13.35%), and Orissa (14.36%). At the all-India level, the percentage decrease in the number of illiterates was 9.74 during 1991-2001.
Towards reduction of the number of illiterates in the country, 7 states/UTs have contributed negatively. These are Delhi, Bihar, Arunachal Pradesh, Nagaland, Manipur, Chandigarh, and Dadra and Nagar Haveli. Highest contribution has come from Andhra Pradesh (16.79%) and the least from Bihar (-9.33%). Rajasthan, Uttar Pradesh, Madhya Pradesh, Maharashtra and Tamil Nadu have made more than 10% contribution in the reduction the number of illiterates at the national level. Three of the five such states are located in the Hindi-speaking belt of north, northwest and central India. Andhra Pradesh, Uttar Pradesh, Maharashtra, Rajasthan, Madhya Pradesh and Tamil Nadu contributed around 3/4th of the percentage decrease in the total number of illiterates in the country, whereas half of the country’s population lived in these states in 2001.
Uttar Pradesh contributed the maximum (19.46%) in the decadal (1991-2001) decrease of male illiterates in the country. Five other states also contributed significantly to the decadal decrease in the number of male illiterates – Andhra Pradesh (13.59%), Maharashtra (9.21%), Madhya Pradesh (11.37), West Bengal (7.03%), and Rajasthan (12.42%). Eight states, including Kerala (-0.01%), contributed negatively to the decadal decrease in the number of male illiterates. During the last decade, the maximum number of female illiterates decreased in Andhra Pradesh (2.45 million; 13.31%), followed by Maharashtra (2.01 million; 13.37%), Tamil Nadu (1.89 million; 16.19%), Madhya Pradesh (1.21 million; 9.29%) and West Bengal (1.13 million; 7.88%). The contribution of these 5 states taken together explains 82.69% of the total decline in female illiterates in the country. Bihar has made a huge negative contribution (-21.99%) in the decadal decline in female illiterates in the country. Other states/UTs, which have made significant negative contribution to decadal decline in female illiterates in the country, are Jharkhand (-2.85%), Gujarat (-1.31%), Delhi (-1.67%) and Nagaland (-0.93%).
In 1991, the Gender Parity Index (GPI) of literacy rate was 0.59 or less) in 12 state and UTs, namely Rajasthan, Bihar, Uttar Pradesh, Jharkhand, Chhatisgarh, Madhya, Pradesh, Dadra & Nagar Haveli, Orissa, Uttaranchal, Andhra Pradesh, Haryana, and Arunachal Pradesh. In 18 states and UTs, the GPI of literacy rate was equal to or more 0.69. In 2001, the GPI of literacy rate was equal to or less than 0.69 in 10 states and UTs – i.e. Andhra Pradesh, Madhya Pradesh, J&K, Uttar Pradesh, Orissa, Jharkhand, Chhatisgarh, Rajasthan, Bihar, and Dadra and Nagar Haveli.
Table 1: Relative position of major states in terms of gender disparity in literacy rates, 1991 and 2001
S. No. State Rank18 (GPI19, 1991) Rank (GPI, 2001)
1. Rajasthan 1 3
18 Higher the rank, wider is the gender disparity in the literacy rates in the state, i.e. smaller the size of the GPI in literacy. A state getting ‘Rank 1’ has the highest gender disparity and a state having ‘Rank 20’ has the lowest gender disparity in literacy. The ranking is not based on all states and UTs. The basic purpose is to show the progress of major states in bridging gender gap during 1991-2001. 19 GPI of Literacy = Female Literacy Rate/ Male Literacy Rate.

Mapping Literacy in India
R. Govinda and K. Biswal April 20, 2005 11
2. Bihar 2 1 3. Uttar Pradesh 3 4 4. Jharkhand 4 2 5. Chhatisgarh 5 8 6. Jammu and Kashmir NA20 5
7. Madhya Pradesh 6 6 8. Orissa 7 7 9. Uttaranchal 8 11 10. Andhra Pradesh 9 9 11. Haryana 10 10 12. Arunachal Pradesh 11 12 13. Karnataka 12 14 14. Manipur 13 15 15. Gujarat 14 13 16. Maharashtra 15 18 17. West Bengal 16 16 18. Himachal Pradesh 17 20 19. Assam 18 17 20. Tamil Nadu 19 19
Source: Estimated using data from the Census of India, 2001.
Source: GPI for major states estimated by authors on the basis of Census of India 2001 data.
The gender gap in literacy rate was highest in Bihar followed by Jharkhand, Rajasthan, Uttar Pradesh, Jammu and Kashmir, Madhya Pradesh, Orissa, Chhatisgarh and Andhra Pradesh (see Table 1; Chart 5; and Map 1). In 1991, gender gap in literacy was the highest in Rajasthan, which improved its position to the third place in 2001. Bihar, which had second position in 1991 in terms of gender disparity in literacy, moved to the first position in 2001, further widening the gender disparity. Relative performance of states like Jharkhand, Gujarat and Assam was not very encouraging in reducing the gender gap in literacy (see Table 2). The share of females in total illiterates continues to be high in major states (see Chart 6).
20 Census not held in the state.
Chart 3: GPI of literacy rates in major states, 1991 and 2001
0.61
0.56
0.69
0.78 0.78
0.58
0.65
0.44 0.43
0.58
0.69 0.68
0.37
0.5
0
0.1
0.2
0.3
0.4
0.5
0.6
0.7
0.8
0.9
Uttar P
rade
shBiha
r
Andhr
a Pra
desh
Wes
t Ben
gal
Mah
aras
htra
Rajasth
an
Mad
hya
Prade
sh
GPI 2001 GPI 1991
Map 1: Female literacy rate in India, 2001

Mapping Literacy in India
R. Govinda and K. Biswal April 20, 2005 12
Chart 6: Share of females in total illiterates, 2001
36.86 39.47 37.86 37.7631.38 31.36 33.71
63.14 60.53 62.14 62.2468.62 68.64 66.29
0%10%20%30%40%50%60%70%80%90%
100%
Uttar Pradesh Bihar Andhra Pradesh West Bengal Maharashtra Rajasthan Madhya Pradesh
Males Females
Regional variations in literacy rate become more pronounced when analysis is done at the district level. According to 2001 census, around one-fifth of 591 districts21 (i.e. 81 districts) have literacy rate equal to or less than 50%; 21.3% of the districts have literacy rate in the range of 50-60%; 29.3% of districts have literacy rate ranging between 60% and 70%; a little more than a quarter of the districts have literacy rate ranging between 70% and 80%; and only 10% of the districts have literacy rate more than 90%. Around 21% of the districts have female literacy rate equal to or less than 40%; 21.5% of districts have 40-50% female literacy rate; 23.4% of districts have female literacy rate ranging between 50-60%; one-fifth of the districts have 60-70% female literacy rate; and around 14% of districts have more than 80% of female literacy rate.
Most of the low literacy districts (26 districts having literacy rate less than 40%) are located in the educationally backward states such as Bihar (11 districts; 42.3%), Jharkhand (3 districts; 11.5%), Orissa (4 districts; 15.4%), and Uttar Pradesh (5 districts; 19.2%). Most of the high literacy districts (46 districts having literacy rate = 80-90%) are found in Kerala (6 districts; 13.0%), Maharashtra (9 districts; 19.6%), and Delhi (6 districts; 13.0%). Districts having more than 90% literacy rate are found in Kerala (8 districts; 61.5%), Mizoram (4 districts; 30.8%) and Pondichery (1 district; 7.7%).
In terms of absolute number of illiterates in 2001, the top 100 districts are found in 11 states -- Andhra Pradesh, Bihar, Gujarat, Jharkhand, Karnataka, Maharashtra, Orissa, Rajasthan, Tamil Nadu, Uttar Pradesh and West Bengal (see Chart 7). These districts are home to 120.03 million illiterates (around 40% of illiterates of the country). Among these 100 districts, female literacy rate is more than 70% (maximum 77.86%) in 12 districts in Bihar (7 districts) and Uttar Pradesh (5 districts) – Araria (Bihar), Bahraich (UP), Purnia (Bihar), Katihar (Bihar), Purba Champaran (Bihar), Budaun (UP), Paschim Champaran (Bihar), Sitamari (Bihar), Madhubani (Bihar), Gonda (UP), Rampur (UP), and Siddharthnagar (UP).
Sixty-seven districts in the country spread over 9 states are having million plus illiterates. These districts are home to 88.51 million illiterates, which is 29.5% of total illiterates in the country (see Map 2). These districts are located in Andhra Pradesh (14), Bihar (15), Gujarat (2), Karnataka (2), Maharashtra (3), Rajasthan (1), Tamil Nadu (1), Uttar Pradesh (20), and West Bengal (9). The top 10 districts in terms of absolute number of illiterates are found in 4 states – Bihar (3 districts), West Bengal (5 districts), Uttar Pradesh (1 district), and Andhra Pradesh (1 district). These are Murshidabad (WB), Medinapur (WB), Purba Champaran (Bihar), South 24 Parganas (WB), North 24 Parganas (WB), Bardhaman (WB), Madhubani (Bihar), Moradabad (Uttar Pradesh), Mahbubnagar
21 Census of India, 2001 has been conducted in 591 districts out of the total 593 districts.

Mapping Literacy in India
R. Govinda and K. Biswal April 20, 2005 13
(Andhra Pradesh), and Muzaffarpur (Bihar). These 10 districts have 17.85 million illiterates accounting for around 6% of illiterates in the country.
Chart 7: Distribution of top 100 districts (in terms of absolute number of illiterates),
2001
19
17
19135143
30
13
Andhra Pradesh Bihar Gujarat Jharkhand
Karnataka Maharashtra Orissa Rajasthan
Tamil Nadu Uttar Pradesh West Bengal
More than half of the population is illiterate in 81 districts located in 15 states (see Chart 8). Most of these districts are located in Bihar (around 28%) and Uttar Pradesh (around 22%). Around one-fifth of the illiterates (61 million; 20.32%) live in these 81 districts. Female illiteracy rate is more than 50% (maximum of 81.51%) in 253 districts mostly located in Andhra Pradesh, Arunachal Pradesh, Bihar, J and K, Jharkhand, Madhya Pradesh, Orissa, Rajasthan, and Uttar Pradesh (see Chart 14). These districts have 104.62 million female illiterates, which accounts for 54.51% of female illiterates in the country.
In 17 districts, more than 3/4th of the females are illiterates. These districts are located in Bihar (7), Chhatisgarh (1), Jharkhand (2), Orissa (4), and Uttar Pradesh (3). These districts are Kishanganj (Bihar), Shravasti (UP), Pakaur (Jharkhand, Dantewada (Chhatisgarh), Nabarangapur (Orissa), Supaul (Bihar), Malkangiri (Orissa), Balrampur (UP), Araria (Bihar), Madhepura (Bihar), Garhwa (Jharkhand), Bahraich (UP), Purnia (Bihar), Katihar (Bihar), Rayagada (Orissa), Purba Champaran (Bihar), and Koraput (Orissa).
Map 2: 67 districts with million plus illiterates
Source: Prepared using estimated data based on Census of India and the map based on Survey of India. NIEPA has the copy right of the map.

Mapping Literacy in India
R. Govinda and K. Biswal April 20, 2005 14
Chart 8: Distribution of 81 districts where more than half of the population are illiterates, 2001
0
5
10
15
20
25
Andhr
a Pra
desh
Aruna
chal
Assam
Bihar
chha
tisga
rh
Gujara
t
J and
K
Jhar
khan
d
Karna
taka
Mad
hya
Prade
sh
Nagala
nd
Orissa
Rajasth
an
Uttar P
rade
sh
Wes
t Ben
gal
Number of Districts
III. Literacy Rates by Age, Social Group and Household Type
Presently, data on literacy rates by age group are not available for the census year 2001. Literacy rates for population (age 15+) have been obtained by simple extrapolation. In 1991 census, the difference between the literacy rates of age groups 7+ and 15+ was 4 percentage points, which increased to 5 percentage points in 1997 (NSS 53rd Round)). As several basic education programmes have been implemented in the 1990s, particularly in the educationally backward states, it is expected that literacy level of children in 7-14 age group would have increased at a relatively faster rate. Therefore, it has been assumed that the difference between the literacy rates of age groups 7+ and 15+ is 6 percentage points in 2001 census. To get the literacy rate of 15+ age group population, 6 percentage points have been deducted from the literacy rate of 7+ age group population.
Over the years, the literacy rate of population in the age group 15+ has shown a linear increase. In 1961, the literacy rate of the population (age 15+) was just 27.8% (41.5% for males and 13.2% for females), which increased to an estimated 59.4%22 (71.1% for males and 47.1% for females) in 2001. According to the NFHS-2, 1998-99, the literacy rate of population (age 15+) is 58.6%. If we apply the estimates of the NSS 53rd Round, 1997 (i.e. 5 percentage point difference between the literacy rates of population in the age group 7+ and 15+) to the literacy rates as given in the census 2001 data, the literacy rate of population in 15+ age group comes to 60.4%.
22 Srivastava, ABL, 2002.
Table 2: Literacy rate of population (age 15+), India Year Males Females Total Gender
Gap 1961 41.5 13.2 27.8 28.3 1971 47.7 19.4 34.1 28.3 1981 54.9 25.8 40.9 29.1 1991 61.3 34.1 48.2 27.2
2001* - - 60.4 - 2001** 71.1 47.1 59.4 24.0 Sources: (i) Census of India, 1961,1971, 1981 and 1991. (ii) Applying the 5 percentage point difference in the
literacy rate between 7+ and 15+ age group population to 2001 census data on the basis of estimates of NSS 53rd Round 1997.
(iii) **Srivastava, ABL, 2002
Chart 9:Literacy rate of the population in the age group 15+, 1961-2001
41.547.7
54.961.3
71.1
13.219.4
25.834.1
47.1
27.834.1
40.948.2
59.4
0
10
20
30
40
50
60
70
80
1961 1971 1981 1991 2001
Male Female Total

Mapping Literacy in India
R. Govinda and K. Biswal April 20, 2005 15
According to 2001 census, total population (age 15+) in India is 666,999,816, which is 65.5% of the total population. In 2001, the country had 402.87 million23 literates (age 15+). If we consider a 6 percentage point difference in the literacy rate of population 7+ and 15+, the estimated number of literates (age 15+) comes to 396.198 million. This seems to be more likely because of progress in primary education during the last decade, increasing the size of the literates in the age group 7-14.
The gender gap in the literacy rate of population (age 15+) still continues to be as high as 24.0 percentage points24, whereas it was 21.7 percentage points for population (age 7+) in 2001. Since 1961, the gender gap in the literacy rate of population (age 15+) has been reduced by only 4 percentage points. In fact, the gender gap in the literacy rate of population (age 15+) did not decrease up to the census year 1991 (see Table 2 and Chart 9). However, if we consider the information from the NSS 53rd Round, the difference between the literacy rates of population in the age group 7+ and 15+ was 5 percentage points (3 percentage points for males and 7 percentage points for males) in 1997.
Table 3: Percentage distribution of population (age 6 and above) by literacy and primary level of education, India, 1998-99
Males Females Total Age group (In years)
Illiterate Literate <primary school complete
Primary school
graduate25
Illiterate Literate <primary school complete
Primary school graduate
Illiterate Literate <primary school complete
Primary school graduate
6-9 26.9 72.3 0.8 32.6 66.8 0.5 29.6 69.6 0.7 10-14 13.0 37.0 40.3 23.9 31.7 35.1 18.2 34.4 37.8 15-19 14.7 8.0 21.4 31.8 7.4 18.2 23.1 7.7 19.8 20-29 19.2 6.9 15.6 45.8 6.2 14.0 33.0 6.5 14.8 30-39 28.6 9.1 16.2 58.0 6.8 13.4 43.1 8.0 14.8 40-49 30.8 10.5 17.0 63.2 7.9 12.2 46.0 9.3 14.7 50+ 44.1 15.0 15.9 78.9 7.2 7.3 61.1 11.2 11.7
Total26 25.5 21.1 18.4 48.6 17.1 14.5 36.9 19.2 16.5
Source: International Institute for Population Sciences (2000), National Family Health Survey (NFHS-2), 1998-99, India. Mumbai.,
p. 28, Table 2.7.
Table 4: Estimated number of illiterates by age group and sex, India, 2001 (based on NFHS-2 estimates of illiteracy rate in 1998-99)
% of illiterates 1998-99 (NFHS-2)
Population, Census 2001 (In million)
Estimated number of illiterates, 2001 (In millions)
Age group
Male Female Total Male Female Total Male Female Total 10-14 13.0 23.9 18.2 65.633 59.214 124.847 8.53 14.15 22.68 15-19 14.7 31.8 23.1 53.941 46.276 100.217 7.93 14.72 22.65 20-29 19.2 45.8 33.0 87.879 85.308 173.187 16.87 39.07 55.94 30-39 28.6 58.0 43.1 73.401 71.447 144.848 20.99 41.44 62.43 40-49 30.8 63.2 46.0 54.747 48.401 103.148 16.86 30.59 47.45 Source: Estimated by authors using NFHS-2 and Census 2001 data. Note: The illiteracy rates by age group from NFHS-2 have been applied to estimate the number of illiterates in 2001. The estimated
figures may be slightly higher because of two years difference between the NFHS-2 and Census, 2001. In the Table 4, the number of illiterates have been estimated for only five age groups, whereas the NFHS-2, illiteracy rate is given for 3 other age groups, i.e. 6-9; 50+; and Total having no information on age, p.28, Table 2.7.
According to the NFHS-2 data, the literacy rates of the population in 15-19 and 20-29 age groups were 76.9% and 67% respectively in 1998-99. In 1991, the literacy rates of
23 When a 5 percentage point difference in the literacy rates of population 7+ and 15+ is considered. 24 On the basis of the estimated literacy rates as given in Table 2. 25 ‘Primary school complete’ means 5 to 7 completed years of schooling. 26 Includes persons with missing information on age, who are not shown separately.

Mapping Literacy in India
R. Govinda and K. Biswal April 20, 2005 16
children in the age groups 10-14 and 15-19 were 68.6% and 65.8% respectively. The increase in the literacy rates of these age groups may not be very substantial between 1998-2001. It implies that the illiteracy rate of young adults still continues to be high in the country. An estimated 22.65 million27 children (14.72 million girls) in the age group 15-19 were illiterate in 2001. As per the estimate, the number of illiterates in the age group 15-29 was 78.59 million (53.79 million females) (see Table 4). In 2001, the estimated number of illiterates in the age group 30-39 was 62.43 million (also see Chart 10). An estimated 22.68 million children in the age group 10-14 were illiterates in 2001. The estimated number of female illiterates in the age groups 20-29, 30-39, and 40-49 was almost double the number of male illiterates in 2001. It also implies that the number of illiterates in the older cohorts of the population still continues to be very high, which calls for designing and implementing large scale adult literacy programmes in the country. Besides, huge number of illiterate children in 2001 has serious implications for achieving the goal of EFA in the country by 201028.
The variation in the literacy rate across social groups and household type is high in India. In terms of social status, the population of India can be grouped into four categories – i.e. Scheduled Castes (SC), Scheduled Tribes (ST), Other Backward Class (OBC), and others. The SC and ST population are generally disadvantaged in most of the states in India. According to the 2001 Census, India has 16.2% and 8.2% of SC and ST population respectively. The greatest concentration of population of SCs is in Andhra Pradesh, Tamil Nadu, Bihar, West Bengal, Uttar Pradesh, Uttaranchal, Punjab, Rajasthan, Himachal Pradesh, Maharashtra, Karnataka, and Orissa (also see Chart A5 in Annexure I). Besides the northeastern states, STs are found in greater numbers in Orissa, Maharashtra, Madhya Pradesh, Jharkhand, Chhatisgarh, Gujarat and Rajasthan. It may be noted that the educational status of ST households is relatively better in majority of the northeastern states.
As per 1991 Census, the literacy rate of SCs and STs was 37.41% and 29.6% respectively, much lower than the literacy rate of the general population. The literacy rates of SC males and females were 49.91% and 23.79%, a gender gap of 26.15 percentage points. The ST male and female literacy rates were 40.65% and 18.19%, also a wide gender gap of 22.46 percentage points. The literacy rate was lowest for SCs in Bihar
27 The number of illiterates in different age groups have been estimated by the authors by applying the illiteracy rates of the respective age group population as estimated in the NFHS-2, 1998-99. 28 Under the Sarva Shiksha Abhiyan (Education for All Programme), India aims at achieving universal elementary education of 8 years of formal schooling or its alternatives for children in the age group 6-14 by 2010.
Chart 10: Percentage of illiterates by age group and sex, India, (NFHS-2), 1998-99
26.913 14.7 19.2
28.6 30.844.1
25.532.6
23.931.8
45.858 63.2
78.9
48.6
29.618.2 23.1
3343.1 46
61.1
36.9
0
20
40
60
80
100
6-9 10-14 15-19 20-29 30-39 40-49 50+ Total
Males Females Total
Source: Table 3.
Mapping Literacy in India
R. Govinda and K. Biswal April 20, 2005 17
(19.49%), and highest in Kerala (79.66%), and for STs, it was the lowest for Andhra Pradesh (17.16%) and highest in Mizoram (82.0%). Literacy rate of STs was more than SCs in Bihar, Meghalaya, Mizoram, Sikkim and Uttar Pradesh. In general, SCs were ahead of STs in the literacy rate, but in urban areas, the STs were ahead of STs. The literacy rate of SC females compared to general population was much lower in Bihar (7.07%), Rajasthan (8.31%) and Uttar Pradesh (10.69%). The literacy rate of ST females was extremely low in Rajasthan (4.4%). As the Census 2001 has not yet brought out the data on the literacy rate of SCs and STs, it is not possible to assess the progress during the last decade. However, literacy data by social group are available from the 55th Round of NSS (1999-2000), which was conducted just 7 months before the Census, 2001.
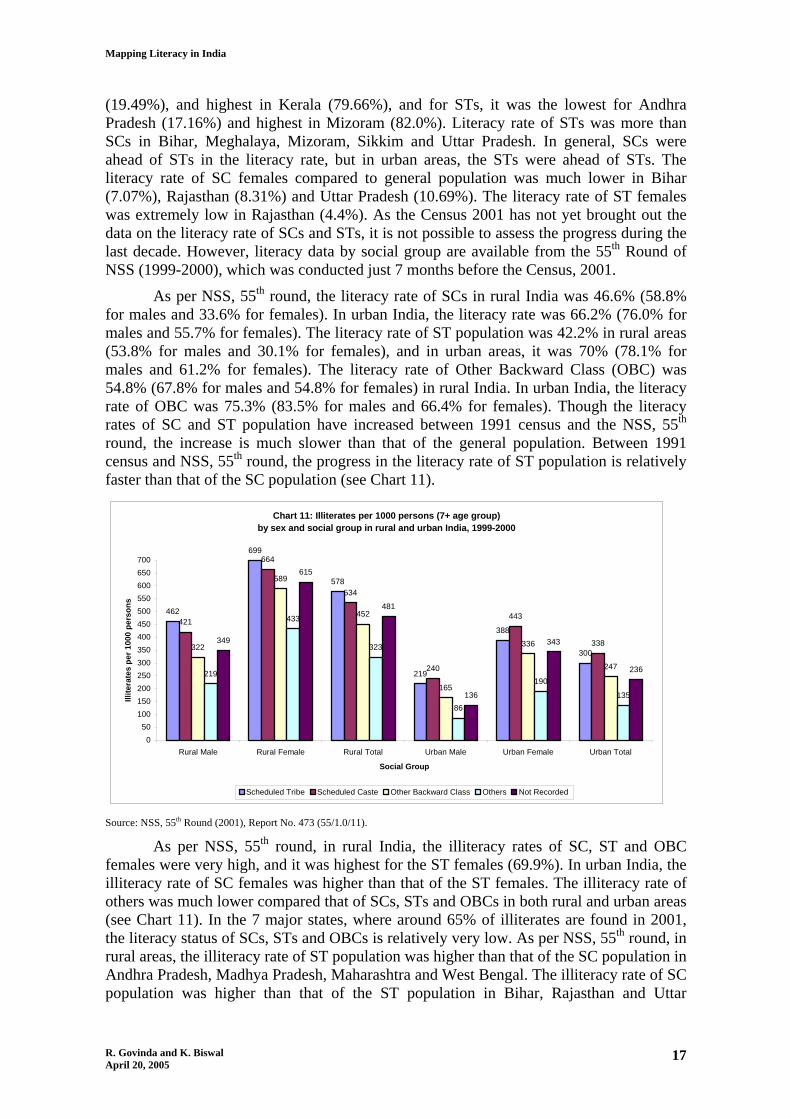
As per NSS, 55th round, the literacy rate of SCs in rural India was 46.6% (58.8% for males and 33.6% for females). In urban India, the literacy rate was 66.2% (76.0% for males and 55.7% for females). The literacy rate of ST population was 42.2% in rural areas (53.8% for males and 30.1% for females), and in urban areas, it was 70% (78.1% for males and 61.2% for females). The literacy rate of Other Backward Class (OBC) was 54.8% (67.8% for males and 54.8% for females) in rural India. In urban India, the literacy rate of OBC was 75.3% (83.5% for males and 66.4% for females). Though the literacy rates of SC and ST population have increased between 1991 census and the NSS, 55th round, the increase is much slower than that of the general population. Between 1991 census and NSS, 55th round, the progress in the literacy rate of ST population is relatively faster than that of the SC population (see Chart 11).
Chart 11: Illiterates per 1000 persons (7+ age group) by sex and social group in rural and urban India, 1999-2000
462
699
578
219
388
300
421
664
534
240
443
338322
589
452
165
336
247219
433
323
86
190
135
349
615
481
136
343
236
0
50
100
150
200
250
300
350
400
450
500
550
600
650
700
Rural Male Rural Female Rural Total Urban Male Urban Female Urban Total
Social Group
Illit
erat
es p
er 1
000
per
son
s
Scheduled Tribe Scheduled Caste Other Backward Class Others Not Recorded
Source: NSS, 55th Round (2001), Report No. 473 (55/1.0/11).
As per NSS, 55th round, in rural India, the illiteracy rates of SC, ST and OBC females were very high, and it was highest for the ST females (69.9%). In urban India, the illiteracy rate of SC females was higher than that of the ST females. The illiteracy rate of others was much lower compared that of SCs, STs and OBCs in both rural and urban areas (see Chart 11). In the 7 major states, where around 65% of illiterates are found in 2001, the literacy status of SCs, STs and OBCs is relatively very low. As per NSS, 55th round, in rural areas, the illiteracy rate of ST population was higher than that of the SC population in Andhra Pradesh, Madhya Pradesh, Maharashtra and West Bengal. The illiteracy rate of SC population was higher than that of the ST population in Bihar, Rajasthan and Uttar

Mapping Literacy in India
R. Govinda and K. Biswal April 20, 2005 18
Pradesh. The illiteracy rate of OBC was also very high in Rajasthan, Andhra Pradesh, Bihar and Uttar Pradesh (see Chart 12).
Chart 12: Iliterates per 1000 persons (7+ age group) in rural area by social grpup in 7 major states in India, 1999-2000
739
656
501
676
616
523
584606
743
365
540
633593
429
575 576
310
444
737
524
254
377408
278322
422
351 353
0
100
200
300
400
500
600
700
800
Andhra Pradesh Bihar Maharashtra Madhya Pradesh Rajasthan Uttar Pradesh West Bengal
Social Group
Illit
erat
es p
er 1
000
per
son
s
Scheduled Tribe Scheduled Caste Other Backward Class Others
Source: Ibid.
In urban areas in these 7 states, the illiteracy rate of SC population was more than 50% in Bihar, and more than 40% in Rajasthan and Uttar Pradesh. The illiteracy rate of ST population was more than 40% in Andhra Pradesh and Uttar Pradesh. Even the urban OBC are not better off in literacy in these states, particularly in Andhra Pradesh, Bihar, Rajasthan and Uttar Pradesh (see Chart 13). In general, the illiteracy rates of SC, ST and OBC population were much lower in urban areas compared to that of the rural areas. It may be noted that these states are not very urbanized, and therefore, most of the illiterates live in villages. As per 2001 Census, while 27.78% of population lives in urban area in India, the share of urban population is much lower in Rajasthan (23.38%), Uttar Pradesh (20.78%), Bihar (10.47%) and Madhya Pradesh (26.67%). Among the 7 states, Maharashtra has the largest share of urban population (42.4%), where around one-fifth of the urban SCs and STs are illiterate.
Chart 13: Illiterates per 1000 persons (7+ age group) by social group in urban areas in 7 major states in India, 1999-2000
425
303
206
402
309
215
368
327
525
199
360
440419
326312
364
170
265300
407
188178160
117 121156
203
138
0
100
200
300
400
500
600
Andhra Pradesh Bihar Maharashtra Madhya Pradesh Rajasthan Uttar Pradesh West Bengal
Social Group
Illit
erat
es p
er 1
000
Per
son
s
Scheduled Tribe Scheduled Caste Other Backward Class Others

Mapping Literacy in India
R. Govinda and K. Biswal April 20, 2005 19
Source: Ibid.
Analysis of NSS, 55th round data by household type reveals that the literacy rate of agricultural labourers is the lowest in rural areas. In urban areas, the literacy rate of the casual laborers is distinctly very low. In rural India, the illiteracy rate of agricultural labourers was 57.4% (46.5% for males and 68.8% for females) in 2000 (see Chart 14). In urban India, the illiteracy rate of casual laborers was 40.7% (31.8% for males and 50.5% for females) in the same year (see Chart 15). The female illiteracy rate was the highest agricultural labour households in rural areas, and casual labour households in urban areas. This implies that the economic status of the households is directly related to the literacy level in the country. Moreover, states where most of the illiterates are found have high illiteracy rates among agricultural labourers and casual labourers. As per NSS, 55th round, compared to other states, the illiteracy rate of agricultural labourers in rural areas was very high in Bihar (76.9), Andhra Pradesh (64.5%0, Madhya Pradesh (60.6%), Orissa (59.3%), Rajasthan (65.2%), West Bengal (53.6%), and Uttar Pradesh (67.4%) in 2000 (see Chart 16).
Chart 14: Illiterates per 1000 persons (7+ age group) by sex and household type in rural India 1999-2000
253
465
328
277
142
372
497
688
552 545
381
555
370
574
436406
263
466
0
50
100
150
200
250
300
350
400
450
500
550
600
650
700
Self-employed in non-agr
Agricultural labour Other labour Self-employed in agr others Not recorded
Household Type
Illit
erat
es p
er 1
000
per
son
s
Male Female Total
Source: Ibid.

Mapping Literacy in India
R. Govinda and K. Biswal April 20, 2005 20
Chart 15: Illiterates per 1000 persons (7+ age group) by sex and household type in urban India, 1999-2000
155
64
318
81
171
294
188
505
244
338
221
123
407
161
249
0
50
100
150
200
250
300
350
400
450
500
550
Self-employed Regularwage/salary
earnings
Casual labour Others Not recorded
Household Type
Illit
erat
es p
er 1
000
po
pu
lati
on
Male Female Total
Source: Ibid.

Mapping Literacy in India
R. Govinda and K. Biswal April 20, 2005 21
Chart 16: Illiterates per 1000 persons (7+ age group) by household type in rural areas in major states of India, 1999-2000
422
274
519
283
365
203
320
69
387
198
402
290
442
271
487
334
645
525
769
474
547
386
577
177
606
428
593
548
652
464
674
536
533
445
671
399
520
288
413
114
621
312
431
449
669
284
574
360
493
255
459
333
350
304
381
78
460
312
396
325
539
325
440
267
333
144
456
209
245
165
220
64
301
179
249
236
320
210
357
208
0 50 100 150 200 250 300 350 400 450 500 550 600 650 700 750 800
Andhra Pradesh
Assam
Bihar
Gujarat
Haryana
Himachal Pradesh
Karnataka
Kerala
Madhya Pradesh
Maharashtra
Orissa
Punjab
Rajasthan
Tamil Nadu
Uttar Pradesh
West Bengal
Illiterates per 1000 persons
Self-employed in non-agr Agricultural labour Other labour Self-emplyed in agr Others
IV. Who are the Illiterates?
Who are the illiterates? Illiterates are found across all regions and demographic groups in India. They are found in both rural and urban areas; relatively more in rural areas because of obvious reasons. They are mostly females and belong to socio-economically backward communities, particularly SCs and STs. Poverty happens to be the

Mapping Literacy in India
R. Govinda and K. Biswal April 20, 2005 22
single most important factor contributing to the high illiteracy rate in the country. Even without any empirical evidence, one can draw a conjecture between the high concentrations of agricultural labourers in districts having high illiteracy rate. Discussions in the preceding section also reveals that the 7 states having around 65% of illiterates have high concentration of SCs and STs, and the illiteracy rates of agricultural and casual labour households are relatively very high. Besides, in most of the sates, where female illiteracy rate is high, the percentage share of females in total agricultural labourers is also high (see Chart A3 in Annexure I). However, there are few states, high female illiteracy rate is accompanied by low share of female agricultural labourers, primarily because women are engaged in other household based paid activities or other commercial activities, particularly in Rajasthan and northeastern states.
District level analysis also shows that the correlation coefficients among the number of illiterates, SC and ST population and the number of agricultural labourers are extremely high, positive and significant (see Table 5). A correlation coefficient of 0.750 (significant at 0.01 level) supports the fact that irrespective of the social characteristics, low economic status of the households (agricultural labourers as a proxy variable) contributes to high illiteracy rate. This finding is further supported by the findings of the NSS, 55th round that the level of illiteracy and the Monthly Per Capita Consumer Expenditure (MPCE29) of households are inversely related to each other.
Table 5: Correlations among illiterates, SC and ST population, and agricultural labour in India, 2001 (based on district level records, N=591)
Number of illiterates (persons) 2001
SC population (persons) 2001
ST population (persons) 2001
Estimated number of agricultural labourers 01
Number of illiterates (persons) 2001
1.000 0.711** 0.142** 0.750**
SC population (persons) 2001
1.000 -0.097* 0.524**
ST population (persons) 2001
1.000 0.212**
Estimated number of agricultural labourers 01
1.000
** Correlation is significant at the 0.01 level (2-tailed).
* Correlation is significant at the 0.05 level (2-tailed).
As per NSS, 55th round, the educational attainment and economic status of households are directly related to each other. Illiteracy rate is relatively high among members of households having low MPCE, both in rural and urban areas (se Charts 17 and 18). Compared to urban areas, the literacy rate increases relatively at slower rate with the increase in the MPCE of rural households. On the other hand, the illiteracy rate deciles very sharply with the increase in the MPCE of the urban households. Compared to rural areas, the percentage share of secondary school graduates and above increases at a faster rate with the increased MPCE of the urban households. In other words, MPCE as a variable directly explains the economic characteristics of the household, and now, it is
29 MPCE is defined in NSS, 55th round as the per capital consumer expenditure in the last 30 days of the survey. MPCE = (Household’s last 30 days total consumer expenditure / Household size). In the NSS, 55th round, the MPCE classes have been assigned to households based on the data with reference period of “365 days” for items of education, medical expenses (institutional, clothing, footwear, and durable goods and of “last 30 days” for the rest of the items. NSSO, Report No. 473, p. 11, 2001.

Mapping Literacy in India
R. Govinda and K. Biswal April 20, 2005 23
evident that poverty is the most important factor explaining the low literacy level of rural households. Besides, cultural factors also contribute to the low literacy status of households, particularly in the Hindi heartland on India. It is also argued that, in this region of the country mainly covering Uttar Pradesh, Bihar, Rajasthan and Madhya Pradesh, much weaker process of emergence of sub-nationalism and a virtual failure to give rise to a middle class, which in most other parts of the country have spearheaded the social reforms, have created a value system perhaps that does not give adequate recognition to education as a critical individual endowment.30
Chart 17: Per 1000 distribution of 7+ population by educational level and MPEC class in rural India, 1999-2000
050
100150200250300350400450500550600650700750800
225 or less 225-255 255-300 300-340 340-380 380-420 420-470 470-525 525-615 615-775 775-950 950 andabove
MPCE Class (in Rs.)
Per
100
0 D
istr
ibu
tio
n o
f P
erso
ns
Illiterate Litearate Literate and Below Primary Primary Middle Secondary Higher Secondary Graduate and Above
Source: Table A1 in Annexure I.
Chart18 : Per 1000 distribution of 7+ age group population by level of education and MPCE class in urban India, 1999-2000
0
100
200
300
400
500
600
700
800
900
1000
300 or less 300-350 350-425 425-500 500-575 575-665 665-775 775-915 915-1120 1120-1500 1500-1925 1925 orabove
MPCE Class (in Rs.)
Per
100
0 D
istr
ibu
tio
n o
f P
erso
ns
Illiterate Litearate Literate and Below Primary Primary Middle Secondary Higher Secondary Graduate and Above
Source: Table A2 in Annexure I.
V. Concluding Remarks
The last two decades have shown enormous improvement in the literacy scene in the country as reflected by the average literacy figures. Yet, the country has more than 300
30 For a detailed discussion, see Gupta, Shaibal, 2000.

Mapping Literacy in India
R. Govinda and K. Biswal April 20, 2005 24
million illiterates (7+ age group). Where are they and who are they? Though illiteracy still remains to be wiped out in every state, the burden in terms of numbers seems to be carried by a few states, namely, Uttar Pradesh, Bihar, Andhra Pradesh, West Bengal, Maharashtra, Rajasthan and Madhya Pradesh. Not surprisingly, analysis shows that the gender disparity is also higher in these states. A positive feature is that some of these states like Madhya Pradesh and Andhra Pradesh have recorded very substantial increase in female literacy between 1991 and 2001 indicating the possibility of reducing gender disparity fairly quickly, if the trend continues. Though most of the so-called educationally backward states have contributed positively towards the decline in the number of illiterates in the country, Bihar remains a classic case of underdevelopment, where slow progress in literacy and high growth of population have made a huge addition to the pool of illiterates in the country.
It is important to note that educational development is not uniformly poor in all these states. For instance, Maharashtra is among the leading states in overall status of primary education as well as literacy. This points to the existence of intra-state disparities that are as important as inter-state disparities. In this context it is significant to note that in 20% districts, the average literacy rate is below 50%. When female literacy is considered, more than 40% districts are found to show less than 50% literacy rate. Around 65% of illiterates are found concentrated in 7 states, and 67 districts across 9 major states have million plus illiterates which together account for around 30% of the illiterates in 2001. In other words, it is these states and districts, which need special efforts for reducing illiteracy, whether through direct adult literacy programmes or through intensified programmes of primary education.
Examining the changing age profile of literates reveals that the literacy rate has increased steadily since 1961, in all age groups. In fact, the trajectory of change clearly indicates that the increase has come essentially due to increased primary school participation. Further, what is alarming is that an estimated 22.65 million children in the age group 15-19 were illiterates. Youth illiteracy (age group 15-29) appeared to be quite high with an estimated number of around 79 million illiterates. Analysis of the NSS, 55th round data shows that the literacy rates of socio-economically disadvantaged groups such as the Scheduled castes and Scheduled Tribes continue to be very low, particularly in the educationally backward states in the Hindi heartland and Andhra Pradesh and West Bengal. More revealing is the fact that the illiteracy rates of casual and agricultural labourers are relatively very high in these states.
Who are illiterates is a difficult proposition to examine, as many factors including their location in different states matter significantly. Illiterates are found across all demographic, socio-economic and age groups, showing that inefficiency in primary education continue to be a major factor for continuation of illiteracy. Illiterates are relatively more in rural areas because of obvious reasons and females are substantially higher with a differential of 24% found in 2001. An overarching observation is that irrespective of location, gender and religion, poverty continues to be the most important determining factor. Taking concentration of agricultural labourers as a proxy for poverty levels, it was found that presence of illiterates and agricultural labourers particularity among female population goes hand in hand in most of the states. As per NSS, 55th round, the illiteracy level and the Monthly Per Capita Consumer Expenditure (MPCE) and the illiteracy rate are inversely related to each other, both in rural and urban areas, thereby further supporting our argument that poverty is one of the critical factors determining literacy level of households in India.

Mapping Literacy in India
R. Govinda and K. Biswal April 20, 2005 25
The implication is clear. While progress in primary education accounts for overall progress in literacy rates, its reach and coverage continues to be inadequate with respect to socially and economically disadvantaged population. This may not be a new observation. But it is significant for identifying the districts and groups that should become the focus of intensified intervention in order to make faster progress in reducing illiteracy levels in the country.
-------------------------------
References
Basu, Kaushhik, Foster James E., and Subramanian, S. (2000), Isolated and Proximate Illiteracy and Why These Concepts Matter in Measuring Literacy and Designing Education Programmes. Working Paper No. 00-W02, Vanderbilt University, Nashville.
Census of India (2001), Provisional Population Totals, Series 1), India, Paper 1, 2001. Web edition, New Delhi.
Census of India (2001), Report and Tables on Age, Series 1, Volume 1, New Delhi.
Drez, Jean and Sen, Amartya (1995), India: Economic Development and Social Opportunity. Oxford University Press, Delhi.
Gupta, Shaibal (2000), Status of Literacy in India. Asian Development research Institute, Paper presented at the Summer Literacy Training Programme (SLTP), 2000, International literacy Institute, University of Philadelphia, July 5-28, 2000.
International Institute for Population Sciences (2000), National Family Health Survey, 1998-99, India, Mumbai.
Ministry of Human Resource Development (2001), Selected Educational Statistics, 1999-2000 and 2001-02. Government of India, New Delhi.
National Sample Survey Organisation (1998), Attending an Educational Institution in India: Its Level, Nature and Cost, NSS 52nd Round (1995-96). Ministry of Statistics and Programme Implementation, GOI, New Delhi.
National Sample Survey Organisation (2001), Literacy and Level of Education India, NSS, 55th Round (July-1999-June 2000). Report No. 473 (55/1.0/11), Ministry of Statistics and Programme Implementation, GOI, New Delhi.
National Literacy Mission (1994), Evaluation of Literacy Campaigns in India: Report of the Expert Group. NLM, Ministry of Human Resource Development, GOI, New Delhi.
Rao, I.V. Subba (2002), Literacy Assessment Practices (LAP) in Selected Developing Countries: India Case Study. Discussion Document prepared for ILI/UNESCO; LAP 2nd Experts’ Meeting, UNESCO, Paris, 7-8 March 2002.
Srivastava, ABL (2002), Some Significant Features of Literacy Data of the 2001 Census and Projection of Literacy Rate for the Population of age group 15+. Ed. CIL's TSG – DPEP, New Delhi, India.
UNDP (2004), Human Development Report, 2004. New York: Oxford University Press.

Mapping Literacy in India
R. Govinda and K. Biswal April 20, 2005 26
Annexure I Table A1: Per 1000 distribution of persons aged 7 and above by level of education and PMCE class in rural India in
1999-2000
MPCE Class (In
Rs.)
Illiterate Literate Literate and Below
Primary
Primary Middle Secondary Higher Secondary
Graduate and Above
All
225 or less 651 349 182 86 57 17 5 2 1000
225-255 604 369 198 104 64 19 9 3 1000
255-300 573 427 205 111 71 27 9 4 1000
300-340 529 471 210 114 93 36 12 5 1000
340-380 492 508 215 130 102 40 14 8 1000
380-420 468 532 212 131 114 48 19 8 1000
420-470 430 570 211 147 127 55 21 9 1000
470-525 405 595 197 150 141 67 28 12 1000
525-615 372 628 194 153 152 79 34 17 1000
615-775 322 678 171 160 171 100 47 29 1000
775-950 276 724 157 151 180 133 59 43 1000
950 and above
210 790 126 144 176 162 96 87 1000
Source: NSS, 55th Round, “Literacy and Levels of Education in India, 1999-2000.” Report No. 473 (55/1.0/11), 2001.
Table A2: Per 1000 distribution of persons aged 7 and above by level of education and PMCE class in urban India in 1999-2000
MPCE Class (In
Rs.)
Illiterate Literate Literate and
Below Primary
Primary Middle Secondary Higher Secondary
Graduate and Above
All
300 or less 485 515 200 133 114 42 21 6 1000
300-350 444 556 225 150 113 42 17 9 1000
350-425 360 640 227 157 141 68 27 21 1000
425-500 302 698 218 171 164 86 37 22 1000
500-575 262 738 195 169 180 110 51 31 1000
575-665 203 797 178 181 192 127 67 51 1000
665-775 157 843 163 165 205 154 85 71 1000
775-915 138 862 142 154 193 178 104 92 1000
915-1120 101 899 120 143 184 186 125 140 1000
1120-1500 71 929 103 111 159 203 149 204 1000
1500-1925 40 960 82 93 137 182 160 305 1000
1925 or above
31 969 68 71 97 152 156 425 1000
Source: Ibid.
Table A3: Per 1000 distribution of persons aged 7 and above by household type and level of education in rural and urban India, 1999-2000
Illiterate Literate Lit & Below primary
Primary Middle Secondary Hr. Secondary
Graduate & above
Household Type
R U R U R U R U R U R U R U R U
SC 578 300 422 700 181 189 106 133 83 153 32 90 14 66 7 70
ST 534 338 466 662 192 195 119 157 92 152 39 81 16 46 8 31
OBC 452 247 548 753 194 175 134 162 123 174 58 123 25 65 14 55
Others 232 135 677 865 198 142 155 136 155 165 97 159 43 107 30 156
Not Recorded
481 236 519 764 179 187 134 87 139 148 45 172 6 91 16 79
Note; R = Rural; U = Urban; SC = Scheduled caste; ST = Scheduled Tribe; OBC = Other Backward Class. Source: Ibid.

Mapping Literacy in India
R. Govinda and K. Biswal April 20, 2005 27
Table A4: State-wise percentage of literate persons (7+ age group) based on NSS 55th Round (1999-2000) and Census of India 2001, (rural+ urban)
Male Female Person State/UT
NSS 55th Round
Census 2001
NSS 55th Round
Census 2001
NSS 55th Round
Census 2001
Andhra Pradesh 64 71 45 51 54 61
Arunachal Pradesh
60 64 48 44 55 55
Assam 78 72 63 56 71 64
Bihar 59 60 31 34 46 48
Goa 91 89 77 76 84 82
Gujarat 80 81 57 59 69 70
Haryana 76 79 54 56 65 69
Himachal Pradesh 84 86 67 68 75 77
Jammu and Kashmir
79 66 53 42 66 54
Karnataka 73 76 53 57 63 67
Kerala 94 94 87 88 91 91
Madhya Pradesh 69 77 42 50 56 64
Maharashtra 84 86 64 68 74 77
Manipur 79 78 67 60 73 69
Meghalaya 82 66 75 60 78 63
Mizoram 95 91 93 86 94 88
Nagaland 92 72 79 62 86 67
Orissa 69 76 46 51 57 64
Punjab 74 76 61 64 68 70
Rajasthan 70 76 35 44 53 61
Sikkim 82 77 67 61 75 70
Tamil Nadu 80 82 62 65 71 73
Tripura 85 81 71 65 78 74
Uttar Pradesh 68 70 41 43 55 57
West Bengal 75 78 57 60 66 69
Andaman & Nicobar Islands
88 86 78 75 83 81
Chandigarh 87 86 77 77 82 82
Dadra & Nagar Haveli
73 73 47 43 62 60
Daman and Diu 91 88 74 70 84 81
Delhi 93 87 77 75 86 82
Lakshadweep 93 93 83 82 88 88
Pondichery 89 89 75 74 81 81
All India 73 76 51 54 62 65
Source: Ibid.

Mapping Literacy in India
R. Govinda and K. Biswal April 20, 2005 28
Chart A1: Per 1000 distribution of persons aged 7 and above by level of education and household type in rural and urban India, 1999-2000
578
300
422
700
181
189
106
133
83
153
32
90
14
66
7
70
534
338
466
662
192
195
119
157
92
152
39
81
16
46
8
31
452
247
548
753
194
175
134
162
123
174
58
123
25
65
14
55
232
135
677
865
198
142
155
136
155
165
97
159
43
107
30
156
481
236
519
764
179
187
134
87
139
148
45
172
6
91
16
79
0 50 100 150 200 250 300 350 400 450 500 550 600 650 700 750 800 850 900
Illiterate ( R)
Illiterate ( U)
Literate ( R)
Literate (U)
Lit & below primary ( R)
Lit & below primary (U)
Primary ( R)
Primary (U)
Middlr ( R)
Middle (U)
Seconday ( R)
Secondary (U)
Hr. Secondary ( R)
Hr. Secondary (U)
Graduate and above ( R)
Graduate and above (U)
Lev
el o
f E
du
cati
on
Per 1000 Distribution of Persons
SC ST OBC Others Not Recorded
Source: Table A3.

Mapping Literacy in India
R. Govinda and K. Biswal April 20, 2005 29
Table A5: State-wise number of illiterates in India, decadal decreases in illiterates and percentage contribution in decrease, 1991-2001
Number of illiterates S.
No. State/UT
1991 2001 Decadal decrease in the number of illiterates
Percentage change
Contribution in the decrease
1 2 3 4 5 6 7 1. Himachal Pradesh*** 1540150 1194777 345373 22.42 1.08 2. Punjab 7043608 6379994 663614 9.42 2.08 3. Chandigarh 121185 144413 -23228 -19.17 -0.07 4. Uttaranchal 2454593 1984993 469600 19.13 1.47 5. Haryana 5889463 5598873 290590 4.93 0.91 6. Delhi 1930951 2155932 -224981 -11.65 -0.70 7. Rajasthan 21597410 17935918 3661492 16.95 11.46 8. Uttar Pradesh 62313875 57810542 4503333 7.23 14.09 9. Bihar 31986516 34968650 -2982134 -9.32 -9.33 10. Sikkim 142870 140495 2375 1.66 0.01 11. Arunachal Pradesh 398323 403266 -4943 -1.24 -0.02 12. Nagaland 384323 561941 -177618 -46.22 -0.56 13. Manipur 613840 646287 -32447 -5.29 -0.10 14. Mizoram 99553 86259 13294 13.35 0.04 15. Tripura 894103 727997 166106 18.58 0.52 16. Meghalaya 702944 678184 24760 3.52 0.08 17. Assam 8476418 7960619 515799 6.09 1.61 18. West Bengal 23906271 21266590 2639681 11.04 8.26 19. Jharkhand 10220865 10143063 77802 0.76 0.24 20. Orissa 13396318 11472584 1923734 14.36 6.02 21. Chhatisgarh 8111922 6033286 2078636 25.62 6.50 22. Madhya Pradesh 21512377 17860686 3651691 16.97 11.43 23. Gujarat**** 12661634 12469293 192341 1.52 0.60 24. Daman and Diu 24712 26108 -1396 -5.65 0.00 25. Dadra and Nagar Haveli 65306 72448 -7142 -10.94 -0.02 26. Maharashtra 22985512 18998379 3987133 17.35 12.48 27. Andhra Pradesh 31056061 25689502 5366559 17.28 16.79 28. Karnataka 16486397 15132802 1353595 8.21 4.24 29. Goa 252881 212484 40397 15.97 0.13 30. Lakshadweep 7695 6454 1241 16.13 0.00 31. Kerala 2575157 2559343 15814 0.61 0.05 32. Tamil Nadu 18074652 14668772 3405880 18.84 10.66 33. Pondichery 176177 159372 16805 9.54 0.05 34. Andaman and Nicobar
Islands 63226 58646 4580 7.24 0.01
All India* ‘**’ 328167288 296208952 31958336 9.74 100.00 Notes: * For making the data comparable, the number of illiterates given in Column 4 against India excludes the figure for Jammu
and Kashmir for 2001, as this data is not available for the state for 1991 Census, since Census could not be conducted due to disturbed condition.
‘**’ To make the data comparable, the number of illiterates shown in Column 3 against India for 1991 excludes the
number of illiterates of entire Kachchh district, Morvi, Maliya- Miyana and Wankaner talukas of Rajkot district, Jodiya taluka of Jamnagar district of Gujarat state and entire Kinnaur district of Himachal Pradesh where population enumeration of Census of India 2001 could not be conducted due to natural calamity.
*** To make the data comparable, the number of illiterates shown against Himachal Pradesh in Column 3 for 1991
census excludes the figure of illiterates of entire Kinaur district where census of India 2001 could not be conducted due to natural calamity.
**** To make the data comparable, the number of illiterates shown against Gujarat in Column 3 for 1991 census
excludes the figures of illiterates of entire Kachchh district, Morvi, Maliya- Miyana and Wankaner talukas of Rajkot district, Jodiya taluka of Jamnagar district where census of India 2001 could not be conducted due to natural calamity.
Source: Census of India, 2001, State of Literacy (Chapter 7), Provisional Population Totals, Series 1, India, Paper 1 of 2001.

Mapping Literacy in India
R. Govinda and K. Biswal April 20, 2005 30
Chart A2: Contribution of states in the decrease of illiterates in India in 2001
-50 -45 -40 -35 -30 -25 -20 -15 -10 -5 0 5 10 15 20 25 30
Himachal Pradesh
Punjab
Chandigarh
Uttaranchal
Haryana
Delhi
Rajasthan
Uttar Pradesh
Bihar
Sikkim
Arunachal Pradesh
Nagaland
Manipur
Mizoram
Tripura
Meghalaya
Assam
West Bengal
Jharkhand
Orissa
Chhatisgarh
Madhya Pradesh
Gujarat
Daman and Diu
Dadra and Nagar Haveli
Maharashtra
Andhra Pradesh
Karnataka
Goa
Lakshadweep
Kerala
Tamil nadu
Pondichery
Andaman and Nicobar Islands
Sta
te/U
T
Percentage
% Change in the number of illiterates between 1991 and 2001 Percentage contribution in the decrease in illiterates in India
Source: Table A5.

Mapping Literacy in India
R. Govinda and K. Biswal April 20, 2005 31
Table A6: State-wise literacy rate by sex in India, 1991 and 2001.
Literacy Rate, 2001 Census (%) S.No. State/UT Person Male Female
Literacy rate 1991 Census (%)
Change in Literacy Rate (1991-2001)
1 Andaman & Nicobar Is.* 81.18 86.07 75.29 73.02 8.17 2 Andhra Pradesh 61.11 70.85 51.17 44.09 17.02 3 Arunachal Pradesh 54.74 64.07 44.24 41.59 13.15 4 Assam 64.28 71.93 56.03 52.89 11.52 5 Bihar 47.53 60.32 33.57 37.49 10.04 6 Chandigargh* 81.76 85.65 76.65 77.81 3.94 7 Chhatisgarh 65.18 77.86 52.40 42.91 22.27 8 Dadra & Nagar Haveli* 60.03 73.32 42.99 40.71 19.33 9 Daman & Diu* 81.09 88.40 70.37 71.20 9.89 10 Delhi* 81.82 87.37 75.00 75.29 6.53 11 Goa 82.32 88.88 75.51 75.51 6.81 12 Gujarat 69.97 80.50 58.60 61.29 8.68 13 Haryana 68.59 79.25 56.31 55.85 12.74 14 Himachal Pradesh 77.13 86.02 68.08 63.86 13.27 15 Jammu & Kashmir 54.46 65.75 41.82 NA NA 16 Jharkhand 54.13 67.94 39.38 41.39 12.74 17 Karnataka 67.04 76.29 57.45 56.04 11.00 18 Kerala 90.92 94.20 87.86 89.81 1.11 19 Lakshadweep * 87.52 93.15 81.56 81.78 5.74 20 Madhya Pradesh 64.11 76.80 50.28 44.67 19.41 21 Maharashtra 77.27 86.27 67.51 64.87 12.39 22 Manipur 68.87 77.87 59.70 59.89 8.97 23 Meghalaya 63.31 66.14 60.41 49.10 14.21 24 Mizoram 88.49 90.69 86.13 82.27 6.22 25 Nagaland 67.11 71.77 61.92 61.65 5.45 26 Orissa 63.61 75.95 50.97 49.09 14.52 27 Pondicherry* 81.49 88.89 74.13 74.74 6.74 28 Punjab 69.95 75.63 63.55 58.51 11.45 29 Rajasthan 61.03 76.46 44.34 38.55 22.48 30 Sikkim 69.68 76.73 61.46 56.94 12.61 31 Tamil Nadu 73.47 82.33 64.55 62.66 10.81 32 Tripura 73.66 81.47 65.41 60.44 13.22 33 Uttar Pradesh 57.36 70.23 42.98 40.71 16.65 34 Uttaranchal 72.28 84.01 60.26 57.75 14.53 35 West Bengal 69.22 77.58 60.22 57.70 11.52 India 1 65.38 75.96 54.28 51.63 13.75
Notes:
1. The population of India includes the estimated population of entire Kachchh district, Morvi, Maliya-Miyana and Wankaner talukas of Rajkot district, Jodiya taluka of Jamanagar district of Gujarat State and entire Kinnaur district of Himachal Pradesh where population enumeration of Census of India 2001 could not be conducted due to natural calamity.
2. Figures shown against Population in the age-group 0-6 and Literates do not include the figures of entire Kachchh district, Morvi, Maliya-Miyana and Wankaner talukas of Rajkot district, Jodiya taluka of Jamanagar district and entire Kinnaur district of Himachal Pradesh where population enumeration of Census of India 2001 could not be conducted due to natural calamity.
3. Figures shown against Himachal Pradesh have been arrived at after including the estimated figures of entire Kinnaur district of Himachal Pradesh where the population enumeration of Census of India 2001 could not be conducted due to natural calamity.
Source: Provisional Population Totals: India . Census of India 2001, Paper 1 of 2001.


Mapping Literacy in India
R. Govinda and K. Biswal April 20, 2005 33
Chart A3: Female literacy rate and % share of female agricultural labourers 2001
66.43
60.62
58.18
57.02
55.8
55.66
49.72
49.03
48.83
47.6
43.97
43.69
42.55
41.4
40.3
39.78
39.74
39.59
38.54
38.08
62.6
39.6
5.2
39.6
55.8
16.2
40.4
53.9
4.5
44.1
16.2
21.1
43.4
39.1
15.2
32.2
6.1
20.1
8
4.2
0 10 20 30 40 50 60 70
Bihar
Jharkhand
Jammu & Kashmir
Uttar Pradesh
Andhra Pradesh
Rajasthan
Madhya Pradesh
Orissa
Arunachal Pradesh
Chhatisgarh
Assam
Haryana
Karnataka
Gujarat
Manipur
West Bengal
Uttaranchal
Meghalaya
Sikkim
Nagaland
% share of female agri laboueres 2001
Female illiteracy rate 2001
Source: Ibid.

Mapping Literacy in India
R. Govinda and K. Biswal April 20, 2005 34
Chart A4: Number of illiterates (in millions) in major states, 2001
57.81
34.97
25.69
21.26
18.99
17.93
17.86
15.13
14.67
12.47
11.47
10.14
7.96
6.38
6.03
21.73
36.5
21.17
15.96
13.24
13.03
12.31
11.84
9.6
9.76
8.27
7.63
6.48
4.71
3.64
4.11
13.76
0 10 20 30 40 50 60 70
Uttar Pradesh
Bihar
Andhra Pradesh
West Bengal
Maharashtra
Rajasthan
Madhya Pradesh
Karnataka
Tamil Nadu
Gujarat
Orissa
Jharkhand
Assam
Punjab
Chhatisgarh
Rest of India
Number of female illiterates (in millions)2001
Number of illiterates (in millions) 2001
Source: Estimated by authors using Census of India, 2001 data.

Mapping Literacy in India
R. Govinda and K. Biswal April 20, 2005 35
Chart A5: Proportion of SC and ST population in Indian states, 2001
7.60
24.70
28.90
17.50
17.90
19.30
16.90
17.20
21.10
15.70
5.00
0.60
-
2.80
-
17.40
0.50
6.90
23.00
11.80
16.50
11.60
15.20
7.10
3.10
1.90
10.20
16.20
16.20
1.80
-
9.80
19.00
16.20
-
10.90
4.00
-
-
3.00
-
-
12.60
0.10
0.90
20.60
64.20
89.10
34.20
94.50
31.10
85.90
12.40
5.50
26.30
22.10
31.80
20.30
14.80
8.80
62.20
8.90
6.60
6.60
-
94.50
1.10
1.00
-
8.30
- 10.00 20.00 30.00 40.00 50.00 60.00 70.00 80.00 90.00 100.00
Jammu & Kashmir
Himachal Pradesh
Punjab
Chandigarh
Uttaranchal
Haryana
Delhi
Rajasthan
Uttar Pradesh
Bihar
Sikkim
Arunachal Pradesh
Nagaland
Manipur
Mizoram
Tripura
Meghalaya
Assam
West Bengal
Jharkhand
Orissa
Chhatisgarh
Madhya Pradesh
Gujarat
Daman & Diu
Dadra & Nagar Haveli
Maharashtra
Andhra Pradesh
Karnataka
Goa
Lakshadweep
Kerala
Tamil Nadu
Pondicherry
A and N Islands
%ST
% SC
Source: Census of India, 2001.