mapping food environments in lansing, michigan · mapping food environments in lansing, michigan...
TRANSCRIPT

Mapping Food Environments in Lansing, Michigan (Speakers: Kirk Goldsberry, PhD, MSU and Erica Waltz, MSU student, Summer intern
with MDCH Chronic Disease Epidemiology Section
Wednesday, September 9, 2009 2:00 – 3:30 p.m.
Washington Square Building 109 W. Michigan Ave.
Room 205
Meeting Objectives: • Participants will review approaches and findings from two comprehensive survey and mapping
exercises completed in Lansing, Michigan’s local food environments. • Participants will review methods, variables, and statistics applied during the Food Desert Project. • Participants will understand the tie between Dr. Goldsberry and Erica Waltz’s research including
mapping and validity. • Participants will review conclusions and “next steps” related to the Food Desert Project.
Time Description Speaker/ Facilitator
2:00 – 2:05 pm Welcome and Introductions Pamela Bacon, Public Health Consultant 2:05 – 2:30 p.m.
Geographic Information Systems enable us to visualize and reveal inequities within food environments. The combination of intensive data collection, geographic base data, and accessibility modeling reveals environmental disparities at fine-scales. This presentation summarizes a pilot investigation of Lansing’s food environment conducted at Michigan State University.
Kirk Goldsberry, Assistant Professor MSU Geography Department
2:30 – 3:00 pm
This presentation will review the purpose, methodology, and results of a mini Food Desert Project which was conducted in the Lansing area this summer. Discussions will include tables, graphs and maps of the “healthy” food and “fast food” in Lansing, as well as future steps for expanding this project across Michigan.
Erica Waltz, MSU student, summer intern with MDCH Chronic Disease Epidemiology section
3:00 – 3:20 pm Questions and Answers Kirk Goldsberry, Assistant Professor MSU Geography Department Erica Waltz, MSU student, MDCH summer intern
3:20 – 3:30 pm. Conclusion and Next Steps Pamela Bacon, Public Health Consultant
Michigan Department of Community Health, Division of Chronic Disease and Injury Control, Cardiovascular Health, Nutrition and Physical Activity Section
PRESENTATION WEBSITE AND AUDIO ACCESS INFORMATION Website Access: log in to http://breeze.mdch.train.org/cvh Audio Access: call 1-877-873-8017, enter access code 1086365 Pre-registration is required for this session. Please contact Karen Swiatkowski by email at [email protected] or call (517) 335-9595 no later than Wednesday, September 2, 2009. If you have any questions, please contact Pam Bacon at (517) 373-3021.


KIRK GOLDSBERRYDEPARTMENT OF GEOGRAPHYMICHIGAN STATE UNIVERSITY

WHAT’S THE PROBLEM?
Urban food environments are a public health issueSome people have insufficient access to healthy foodThese people are vulnerable to certain health outcomes

WHAT’S THE SOLUTION?
More precise sampling strategiesAdvanced GIS modelingCharacterization of nutritional terrain

CONTEXT
This research merges themes from:GIScienceAccessibility researchPublic HealthUrban GeographyVisualization

GOALS AND OBJECTIVES
Long-term goal: Establish methods that effectively characterize “nutritional terrain”
Enable health officials to identify at-risk zonesTest unproven hypotheses linking “food deserts” to diet-related health outcomes (e.g. obesity, type 2 diabetes)

RESEARCH QUESTIONS1. How can we employ GIScience to
more thoroughly, and more precisely characterize urban nutritional terrain?
2. How can we determine the availability of retail produce items in urban settings?
3. How can we determine who has access to retail produce in urban settings?

BACKGROUND
Recent research links healthy-food-access and public healthLimitations of this research include:
Sampling strategiesAccessibility estimates
5 RECURRING LIMITATIONS
1. Coarse spatial analysis
5 RECURRING LIMITATIONS
1. Coarse spatial analysis2. Simplified definitions of access

5 RECURRING LIMITATIONS
1. Coarse spatial analysis2. Simplified definitions of access3. Poor definitions of retail food sources

5 RECURRING LIMITATIONS
1. Coarse spatial analysis2. Simplified definitions of access3. Poor definitions of retail food sources4. Inadequate retailer identification

5 RECURRING LIMITATIONS
1. Coarse spatial analysis2. Simplified definitions of access3. Poor definitions of retail food sources4. Inadequate retailer identification5. Imprecise location data

METHODS
Study AreaData GIS Analysis

STUDY AREA: LANSING, MI
Total Area: 152 Square Miles
Population 2005: 251,056
White Population: 187,228
Black or African American: 34,184
Hispanic or Latino: 16,246
Asian: 10,714


DATAPrevious studies employ “canned” data
Determine suitable outlets from afarOften miss important outlets
A brand new grocery store (not in database)Often include false positives
A closed grocery store (still in database)Falsely coded stores
Some gas stations are coded as “grocery stores”Some “grocery stores” are liquor stores
DATAOur data goal: determine availability of every retail produce item in the study areaMeans: field sampling (the old-fashioned way)A realistic sample of what is available in LansingOutput: Retail produce geodatabase
(x,y) for every item

DATA STATSOur study area includes
94 produce outlets447 unique produce items

DATA STATSOur study area includes
94 produce outlets447 unique produce items

AVAILABILITY RESULTS
We compiled a thorough geodatabaseof produce availability in the study areaEnables better access measures…

ACCESS?
Who has access to what?1. Model access to individual produce items
1. Walksheds and drivesheds2. Overlay individual access surfaces to create
a realistic “container” measure of accessOutputs: 447 surfaces for pedestrians, 447 for
autos, 2 overlay grids with container measures

ACCESS?

CUMULATIVE PEDESTRIAN PRODUCE ACCESSIBILITY
How many produce items are available within a 10-minute walk?


CUMULATIVE AUTOMOBILE PRODUCE ACCESSIBILITY
How many produce items are available within a 10-minute drive?

CUMULATIVE PEDESTRAIN SOFT DRINK ACCESSIBILITY
How many soft drink items are available within a 10-minute walk?


CUMULATIVE AUTOMOBILE PRODUCE ACCESSIBILITY
How many soft drink items are available within a 10-minute drive?


Produce versus Soft Drinks
Comparing Apples to Orange Sodas

Number of Produce Items minus Number of Soft drink items
Positive numbers indicate a “Produce Dominant” food environmentNegative Numbers indicate a “Soft Drink Dominant” food environment


GENERAL FINDINGS
Food environments vary considerably within an urban area
Some zones are healthier than othersGIS is useful for visualizing food environments at the city-scale
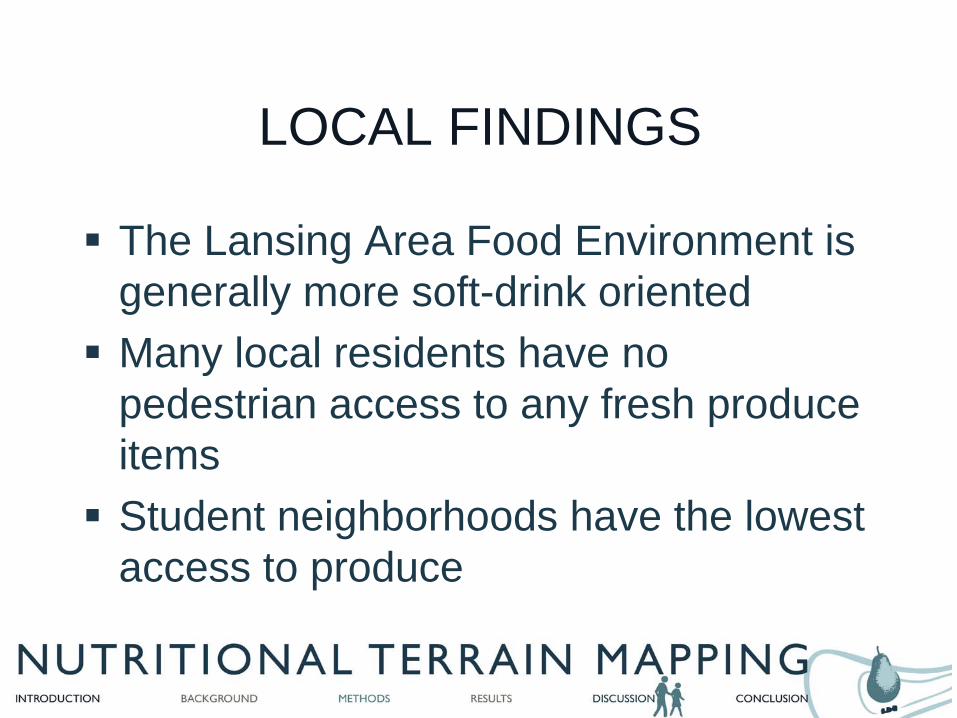
LOCAL FINDINGS
The Lansing Area Food Environment is generally more soft-drink orientedMany local residents have no pedestrian access to any fresh produce itemsStudent neighborhoods have the lowest access to produce

NEXT STEPS
What does this mean?Does it matter?
How can we expand our characterization of the food environment?
Restaurants, liquor stores…Correlate with Obesity Data


FOOD DESERTSIn Lansing, MI
Erica Waltz, MDCH
September 9, 2009

Outline
What is a food desert?Reasons for the projectMethods for both partsProject findings with retail locations
– Key findingsProject comparisonProject findings with restaurant locations
– Key findingsWeaknesses/Future StepsClosing

What is a “Food Desert?”
An area where there is little or no access to healthy foodsToo many unhealthy food choices nearby
ex: fast foodGrocery stores are further away

Why are we doing this?
Trying to fill a data gapTo better understand food environmentsEducate MDCH and its partners for future program planningPossible template for research in other areas across Michigan

Methods- Data Source
Used Michigan Department of Agriculture’s database for food licensing codes on food establishments such as grocery stores, convenience stores, restaurants etc.Gave us establishment name, location, phone number, etc.We used 2 codes:
– Retail Food Establishment (RFE)= party stores, produce markets, grocery stores
– Food Service Establishment (FSE)= restaurants, coffee shops, drive-in, bar, nightclub
Methods- Data Source
1st half: We’re going to cover Retail Food Establishments (RFE)2nd half: We’re going to cover Food Service Establishments (FSE)

Retail Locations

Methods- Survey/Variables for Retail Establishments
Does your establishment sell:-whole grains?-fresh fruit?-1+ type of fresh fruit?-fresh vegetables?-1+ type fresh vegetables?-low or non-fat dairy products?-lean protein?-fried foods?-sugar sweetened beverages?-non-sugar sweetened beverages? (excluding 100% fruit juices)

Definition of Variables
A comprehensive list was made of items that constitute as the variables
ex: “Sugar Sweetened Beverages” consist of Regular sodaDiet sodaSweetened teaSweetened coffeeFruit drinksSports drinks
Collaborated with other sections within MDCH to create approved list

Methods- Analyzing Data
Created grading scale from 0-8– Max of 8 variables because we left out the “Fried
foods” variable and the “Sugar sweetened beverages” variable
Breakdown:7-8= A (offering the most healthy options)5-6= B3-4= C1-2= D (offering the least healthy options)

Methods- Data Collection
Conducted internet searches firstPhone surveys
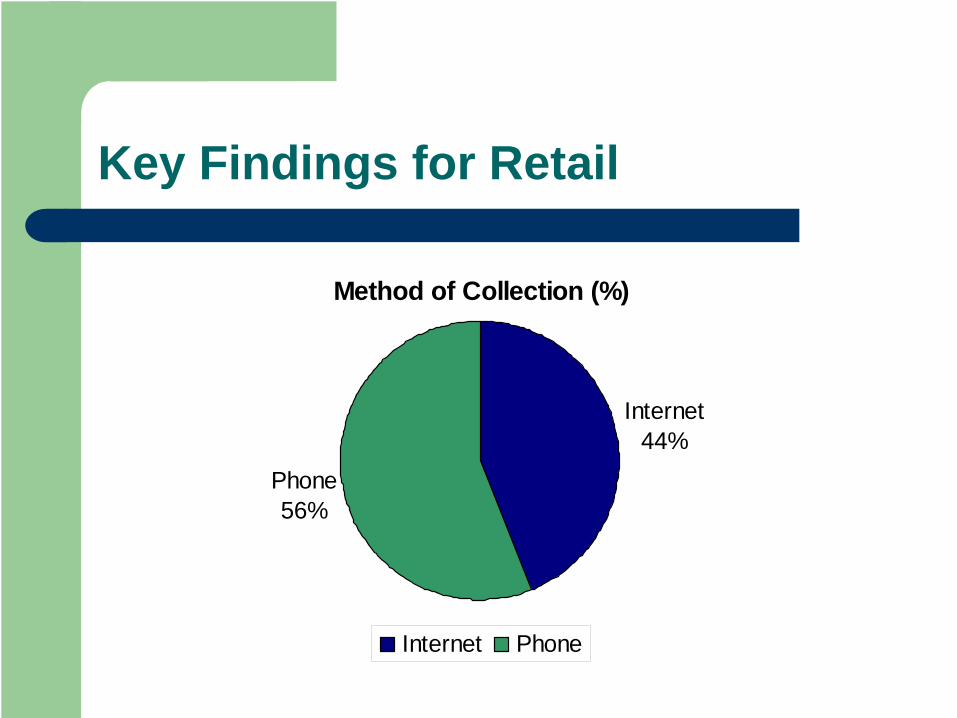
Key Findings for Retail
Method of Collection (%)
Internet44%
Phone56%
Internet Phone

Key Findings for Retail
Refusals by Phone (%)
55%
10%
8%
2%5%
8%
12%
Hard Refusal
Line not working/busy
Attempted 2 times but noanswerLanguage barrier
Line disconnected
Business closed
Not able to locate
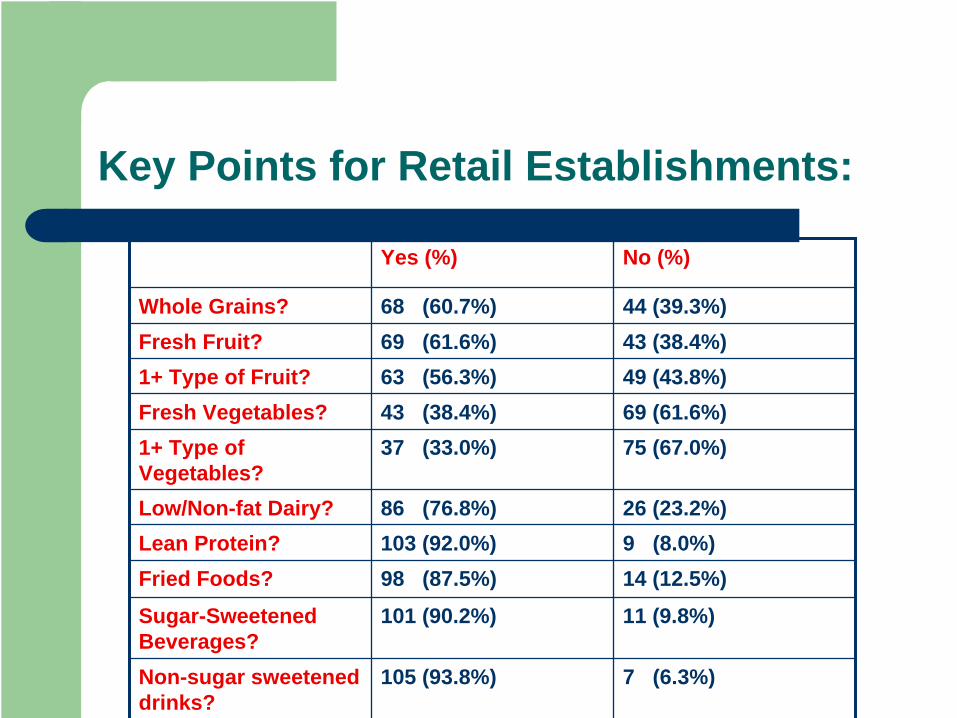
Key Points for Retail Establishments:
Yes (%) No (%)
Whole Grains? 68 (60.7%) 44 (39.3%)Fresh Fruit? 69 (61.6%) 43 (38.4%)1+ Type of Fruit? 63 (56.3%) 49 (43.8%)Fresh Vegetables? 43 (38.4%) 69 (61.6%)1+ Type of Vegetables?
37 (33.0%) 75 (67.0%)
Low/Non-fat Dairy? 86 (76.8%) 26 (23.2%)Lean Protein? 103 (92.0%) 9 (8.0%)Fried Foods? 98 (87.5%) 14 (12.5%)
Sugar-Sweetened Beverages?
101 (90.2%) 11 (9.8%)
Non-sugar sweetened drinks?
105 (93.8%) 7 (6.3%)

Distribution of Grades
Number of Locations by Grade
0
5
10
15
20
25
30
35
40
45
A B C DGrade
Number of Locations

Retail Locations
•The “grades” are color coded so green is good to red is bad
•The locations follow the main roads, MLK, Cedar St, Michigan Ave
•Discrepancies between Lansing city limits and location mailing addresses.
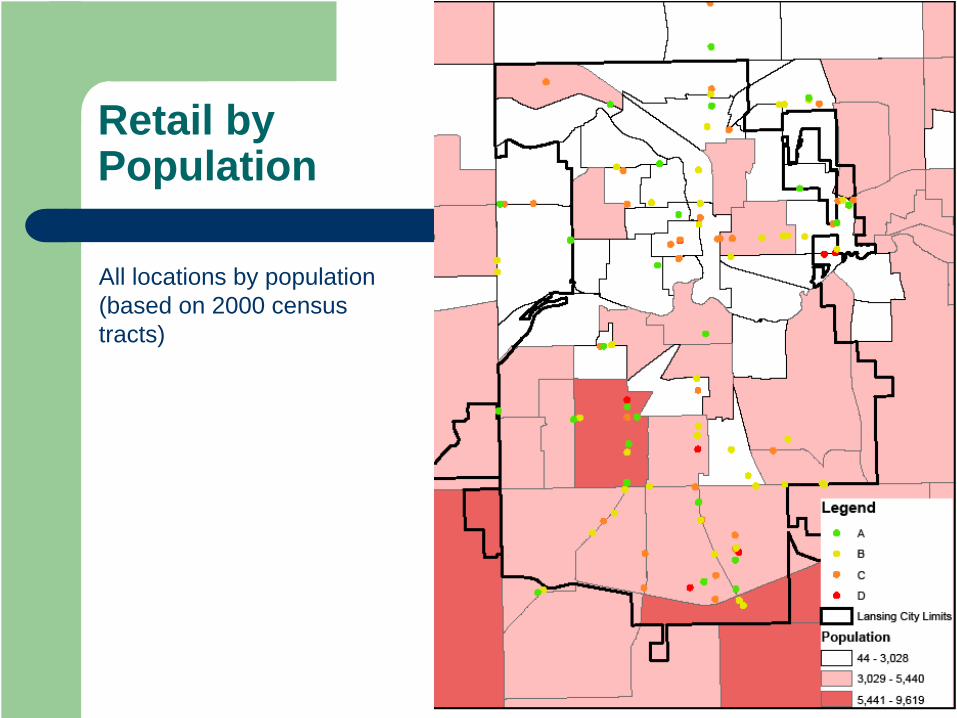
Retail by Population
All locations by population (based on 2000 census tracts)

Retail by % Black
All locations by prevalence of black population

Retail ‘A’ locations with buffer
•The A locations with a 0.5 mile buffer around them to give an idea of coverage.
•The census tract with the most people is fairly well covered.
•A lot of the other locations are where the fewest people live. It appears that the light pink areas are where “healthy food” locations are needed.

Retail ‘A’ and ‘B’ with Buffer
The A and B locations with a 0.5 mile buffer around them to give an idea of population coverage.
In Comparison to Professor Goldsberry’s Research
Cross comparison with locations that sold produce (fruit + vegetables)
– Kirk had 32 locations in Lansing– We had 72 locations in Lansing– We were unable to reach 5 of the locations on his list– Both projects had varying number of establishments and
locations for Meijer, Kroger, Quality Dairy, L & L, and Seven-11
He had one location for Speedway, we had 12We had L & L’s he did not

Restaurant Locations

Restaurants- Method of Collection
Using the MDA licensing codes, we conducted a web-based search on “fast food”type restaurantsLooked up menus onlineOriginally planned to conduct phone surveys as well– Lacked phone numbers from MDA

Methods- Survey/Variables for Restaurants
Does your establishment have a drive-thru/drive-in/delivery option?Do customers pay before they consume their food?
– If NO to both then exclude from data setDoes your establishment sell:
– Whole grains?– Fresh fruit?– 1+ fresh fruit?– Fresh vegetables?– 1+ fresh vegetables?– An entrée that includes a fruit/veg?– Low/non-fat dairy?– Lean protein?– Fried foods?– Sugar sweetened beverages? – Non-sugar sweetened beverages? (excluding 100% fruit juice)

Key Findings- Restaurants
56.5% of locations require that the customer pays before consuming the foodOver one third of the locations have a drive-thru or delivery option available– These are criteria that are generally present in
“fast food” type restaurants

Key Findings- RestaurantsYes (%) No (%)
Drive-thru? 77 (36.8%) 132 (63.2%)
Consumers pay before they consume? 118 (56.5%) 91 (43.5%)
Whole Grains? 41 (34.5%) 78 (65.5%)
Fresh Fruit? 40 (33.6%) 79 (66.4%)
1+ Type Fresh Fruit? 18 (15.1%) 101 (84.9%)
Fresh Vegetables? 34 (28.6) 85 (71.4%)
1+ Type Fresh Vegetables? 33 (27.7%) 86 (72.3%)
Entrée that includes fruit/veg? 118 (99.2%) 1 (0.8%)
Low/non-fat Dairy? 102 (85.7%) 17 (14.3%)
Lean protein? 81 (68.1%) 38 (31.9%)
Fried Foods? 104 (87.4%) 15 (12.6%)
Sugar-Sweetened Beverages? 119 (100%) 0 (0%)
Non-sugar Sweetened Beverages? 119 (100%) 0 (0%)

Methods- Analyzing Data
Created grading scale from 0-9– There were 9 variables after we removed the exclusion
criteria, and the “Fried Foods” as well as the “Sugar sweetened beverages” variable
Breakdown:– 8-9= A (most healthy food options)– 6-7= B– 4-5= C– 2-3= D (least healthy food options)– 0-1= F
Note: There were no locations with an “F” score

Key Findings- Restaurants
Number of Locations by Grade
05
101520253035404550
A B C DGrade
Num
ber o
f Loc
atio
ns
Note: The grade a location receives can be misleading due to the actual number of healthy options on a location’s menu
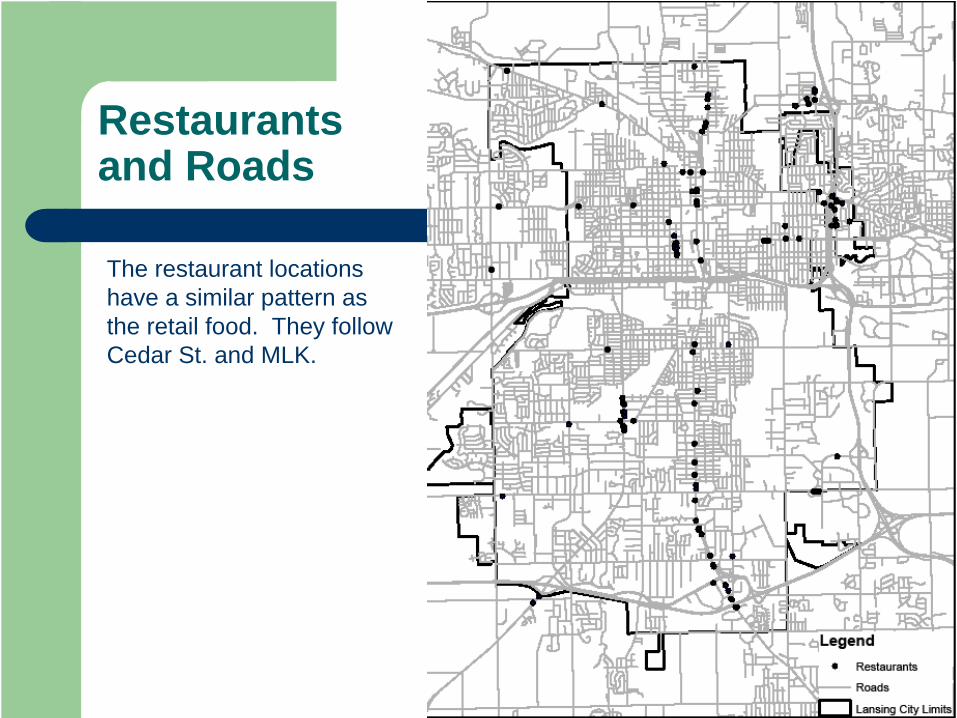
Restaurants and Roads
The restaurant locations have a similar pattern as the retail food. They follow Cedar St. and MLK.

Restaurant and ‘A’ buffers
I know it is messy!
Most of these locations cover the same areas. So if there is a fast food location close there is also a healthy food option.

‘A’ Retail and Restaurants

Weaknesses
Lacking phone surveys for restaurant type locations– We had planned on researching these like the retail locations, but
we lacked phone numbers from MDA
We were not able to reach all locationsCouldn’t search the stores in personHad to trust what the person on the phone was saying was what they actually soldWeb pages/menus could be incorrect or lacking informationEstablishments with multiple locations were represented by information researched on one location

Conclusions/Future Uses
Expand to other citiesProject was not perfect but it helped fill a data gap in the stateMake the technology available to other cities so they can perform their own food desert
