mapping dietary intake impact on consumer health · mapping dietary intake impact on consumer...
TRANSCRIPT

Expert Models for Decision Makers TM
G L O B A L
Mapping Dietary Intake Impact on Consumer Health
Cronan McNamara Founder & CEO, Creme Global
Dubai International Food Safety Conference 2014

Creme Global - Services
High Performance Cloud Software
Technical Services & Projects
Data Collection& Modeling
G L O B A L

Primary Data Generation (research,
labs, innovation)
Analysis of Data -> Information
(scenarios, risk)
Decisions (Policy, Regulation,
Investment)
Area of Interest
Complex Data, Large Volumes
Accurate and Trusted
Results
Better Decisionsand Confidence
Creme Global
G L O B A L

FOOD SAFETY
G L O B A L
M I C R O B I A L
N U T R I T I O N CARE & COSMETICS
CROP SCIENCES PA C K A G I N G
G L O B A L

Exposure Assessment & the Flaw of Averages
Image from www.flawofaverages.com
G L O B A L

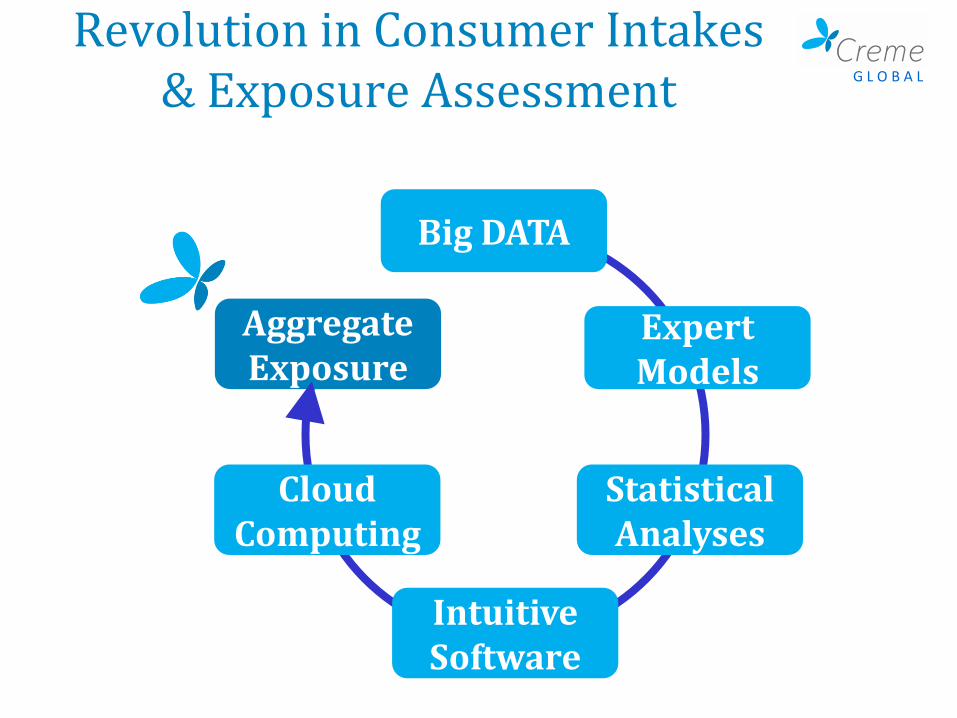
Revolution in Consumer Intakes & Exposure Assessment
Aggregate Exposure
Worst CaseScenario
G L O B A L

Revolution in Consumer Intakes & Exposure Assessment
Big DATA
Aggregate Exposure
G L O B A L

Revolution in Consumer Intakes & Exposure Assessment
Big DATA
Expert Models
Aggregate Exposure
G L O B A L

Revolution in Consumer Intakes & Exposure Assessment
Big DATA
Expert Models
Statistical Analyses
Aggregate Exposure
G L O B A L

Revolution in Consumer Intakes & Exposure Assessment
Big DATA
Expert Models
Statistical Analyses
Intuitive Software
Aggregate Exposure
G L O B A L
Revolution in Consumer Intakes & Exposure Assessment
Big DATA
Expert Models
Statistical Analyses
Intuitive Software
Cloud Computing
Aggregate Exposure
G L O B A L

Revolution in Consumer Intakes & Exposure Assessment
Big DATA
Statistical Analyses
Intuitive Software
Cloud Computing
Aggregate Exposure
Expert Models
G L O B A L

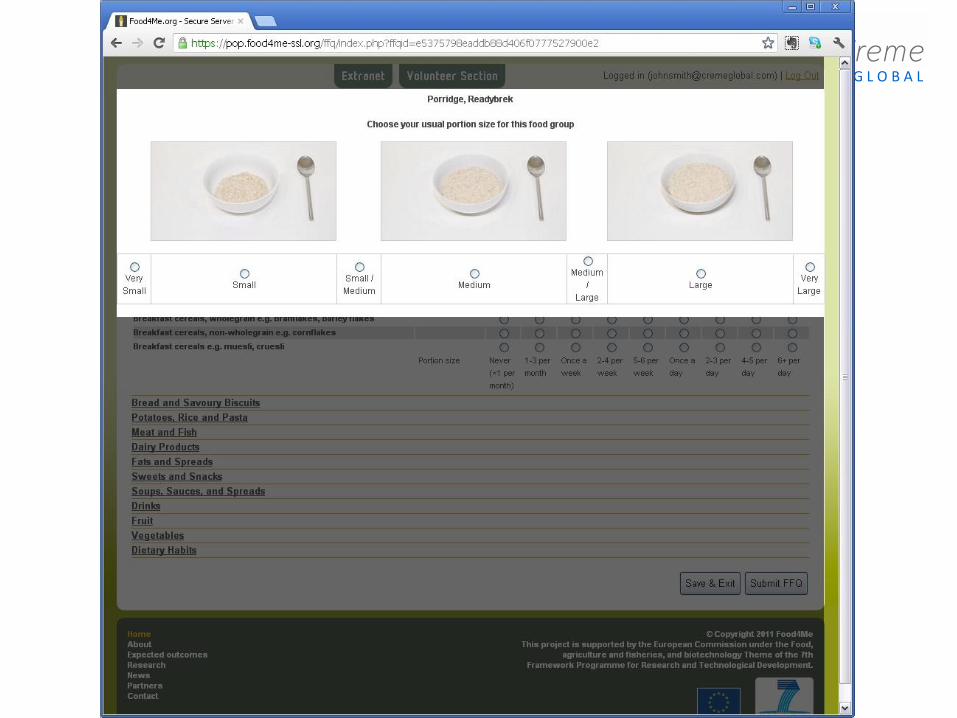
Food Consumption Data
G L O B A L

Food Consumption Surveys
Eating event level detail
Typical Information– Time, survey day, meal
– Food consumed and amount
– Classification of foods
– Anthropometrics
– Gender, Age
– Socio-demographics
– Biomarker data
– …
G L O B A L

Data Set OverviewCountry Survey Age Range Subject Count
United Kingdom National Diet and Nutrition Survey: Adults 2000-2001
19-64 1724
National Diet and Nutrition Survey: Year 1-3 of the Rolling Programme (2008-2011)
1-94 2126
National Diet, Nutrition and Dental Survey: Children (1992-1993)
1.5-4.5 1717
National Diet and Nutrition Survey: Young People (1997)
4-18 1701
National Diet and Nutrition Survey: People Aged 65 Years and Over (1994-1995)
65-104 1733
Low Income Diet and Nutrition Survey (2003-2005)
2-102 3728
Diet and Nutrition Survey of Infants and Young Children (2011)
4 -18 months 2683
Ireland North/South Ireland Food Consumption Survey (NSIFCS) Adults 1999
18-65 1379
National Children’s Food Survey 2004 5-12 594National Teens' Food Survey 2006 13-17 441
Europe* EFSA Comprehensive European Food Consumption Database
32 surveys from 22 EU member states
The NetherlandsDutch National Food Consumption Survey -Young adults 2003 (including nutrient composition data NEVO)
19-30 750
Dutch National Food Consumption Survey -Young Children 2006 (including nutrient composition data NEVO)
2-6 1279
Dutch National Food Consumption Survey 2007-2010 (including nutrient composition data NEVO)
7-69 3819
China China Health and Nutrition Survey (2004 and 2006)
0-100 ~26,000
Mexico ENSANUT: Mexican National Health and Nutrition Survey 2006
1.5-99 48304
United StatesNational Health And Nutrition Examination Survey (NHANES)/What We Eat In America 2002-2010
0+ 7000-10,000

G L O B A L

G L O B A L

G L O B A L

G L O B A L
G L O B A L

G L O B A L

AGGREGATE EXPOSURE MODEL
Probabilistic Dietary Exposure
G L O B A L

AGGREGATE EXPOSURE MODEL
Probabilistic Dietary Exposure
G L O B A L
FOOD SAFETY

Additive Exposure Algorithm
1. Choose Additive of interest
3. Find all consumption events in the Diary involving those foods
4. Determine the exposure to the additive at each eating event
5. Collate exposures from each consumption event to give the distribution of exposure to the additive in the population
2. Find all foods that contains that additive
G L O B A L


FACET Dietary Surveys
FACET Food
CodesIreland
UK
France
Hungary Italy
Poland
Finland
Portugal
G L O B A L

FACET Food Codes
System is tiered, e.g.
A.05: Chocolate products and confectionary
A.05.1: Cocoa and chocolate products
A05.1.2: Cocoa-based spreads
A.05.2: Confectionary including hard and soft candy
A.05.2.1: Glucose syrup-based confectionery
A.05.2.2: Sugar confectionary
More information specific to food can be included via additive flags:
– Nutritional information (e.g. Low fat, sugar reduced)
– Topping (e.g. Chocolate topping, whipped cream)
– Coating
– Filling
G L O B A L

Additive Exposure Algorithm
1. Choose Additive of interest
3. Find all consumption events in the Diary involving those foods
4. Determine the exposure to the additive at each eating event
5. Collate exposures from each consumption event to give the distribution of exposure to the additive in the population
2. Find all foods that contains that additive
G L O B A L

Determining Exposure To determine exposure at each event:
Food amount:– Deterministic, given by food consumption diary
Concentration:– Variable, and occurs with a certain probability
consumed quanta Food
]Additive ofion Concentrat[]Amount Food[Exposure
G L O B A L

Concentration in Food Sources
Regulatory data– Maximum Permitted Levels (MPLs)
Industry Data– Typical Min
– Typical Max
– Extreme Min
– Extreme Max
– Fitted distribution
Can be assessed with or without probability of occurrence
consumed quanta Food
Additive] ofion Concentrat[]Amount Food[Exposure
G L O B A L

Additive Occurrence Data
Can be interpreted as a presence probability for a particular substance in a food category
Statistically, can be interpreted as a Bernoulli distribution:
– Takes a value 1 with a probability p
– Takes a value 0 with a probability (1-p)
Used in Monte Carlo simulations to give more realistic exposure estimates
G L O B A L

Fre
quency
Distribution of Concentration
FACET Additive Concentration Distribution
P95P25 P5 P75
Ext
Min
Ext
Max
Typ
MinTyp
Max
Lognormal(a, b)
G L O B A L

Additive Exposure Algorithm
1. Choose Additive of interest
3. Find all consumption events in the Diary involving those foods
4. Determine the exposure to the additive at each eating event
5. Collate exposures from each consumption event to give the distribution of exposure to the additive in the population
2. Find all foods that contains that additive
G L O B A L


Fre
quency
Distribution of Subjects
Exposure (mg/kg/day)
Model Output G L O B A L

Fre
quency
Distribution of Subjects
Exposure (mg/kg/day)
Model Output
ADI
G L O B A L

Daily Average (vs ADI)Acute (vs ARfD)
Maximum DayExceeded ARfDNum Days over ARfDMaximum MealServing Size
Lifetime (vs ADI)Nusser Method
NCI Method
Selection of Calculation Types:G L O B A L
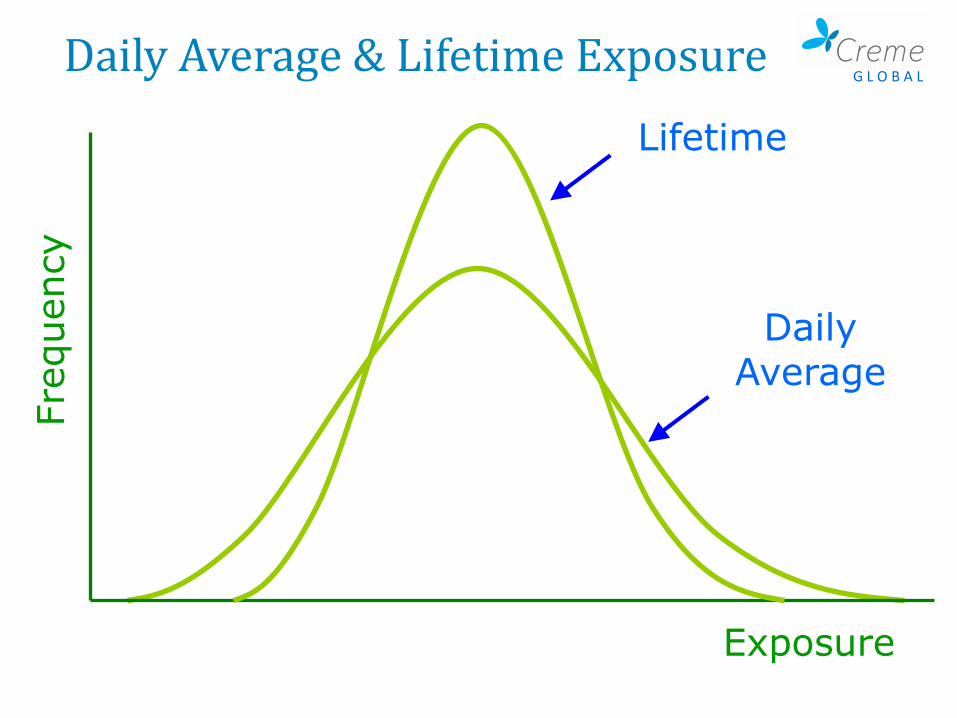
Fre
quency
Exposure
DailyAverage
Lifetime
Daily Average & Lifetime ExposureG L O B A L

AbsolutePer Unit Bodyweight
Selection of Output Types:
G L O B A L

Consumer TypeTotal Population
Product Consumers
Substance / Chemical Consumers
G L O B A L

Select Subject Percentiles:
P75P90P95P97.5P99
Extra Percentiles:
99.9, 99.99
G L O B A L


Limit Analysis
Analyse % Above and Below Requirements

Revolution in Consumer Intakes & Exposure Assessment
Aggregate Exposure
Worst CaseScenario
G L O B A L

Revolution in Consumer Intakes & Exposure Assessment
Big DATA
Aggregate Exposure
G L O B A L

Revolution in Consumer Intakes & Exposure Assessment
Big DATA
Statistical Analyses
Intuitive Software
Cloud Computing
Aggregate Exposure
Expert Models
G L O B A L

Thank you
Expert Models for Decision Makers TM
G L O B A L
Contact: Cronan McNamaraEmail: [email protected]
Web: www.cremeglobal.com
Answering Your Predictive IntakeModelling Questions

Thank you
Expert Models for Decision Makers TM
G L O B A L
Contact: Cronan McNamaraEmail: [email protected]
Web: www.cremeglobal.com
Answering Your Predictive IntakeModelling Questions

Thank you
Expert Models for Decision Makers TM
G L O B A L
Contact: Cronan McNamaraEmail: [email protected]
Web: www.cremeglobal.com
Answering Your Predictive IntakeModelling Questions