mapping business to system performance understanding the...
TRANSCRIPT

Mapping Business to System Performance Understanding the Intermodal
Challenge
Theodore Prince5th International Transportation Systems
Performance Measurement and Data ConferenceDenver, Colorado
June 1, 2015

Tiger Cool Express LLC• Asset-based provider of temperature-controlled intermodal
transportation
5/24/2015 10:22 AM 2Intermodal 101
• Established in 2013 • A privately held
company led by highly experienced management and private equity backing
Intermodal transportation
• Brand-new 53-foot refrigerated container fleet meets all CARB requirements
• Telematics enable real time track and trace and complete refrigeration control
State of the art assets
• Nationwide operating network offering intermodal benefits
• Centralized business model with single point of contact
Sustainable door-to-door value
Temperature-controlled intermodal for sustainable advantage

Intermodal Insanity• 49 U.S. Code § 5501
– National Intermodal Transportation System policy• (a) General.— It is the policy of the United States Government to develop
a National Intermodal Transportation System that is economically efficient and environmentally sound, provides the foundation for the United States to compete in the global economy, and will move individuals and property in an energy efficient way.
• Insanity: doing the same thing over and over again and expecting different results– Albert Einstein
5/24/2015 10:22 AM 3Intermodal 101
Intermodal Insanity
5/24/2015 10:22 AM 4Intermodal 101
•

Introduction to Intermodal Networks
Intermodal 101
Movement using multiple modes of transport
Movement using multiple modes of transportation --without any handling of the freight itself when changing modes
Mul
timod
al tr
ansp
ort
Intermodal transport
Co-modality “use of different modes on their own and in combination” in the aim
to obtain “an optimal and sustainable utilisation of resources.”
European Commission [2006]
5/24/2015 10:22 AM 5
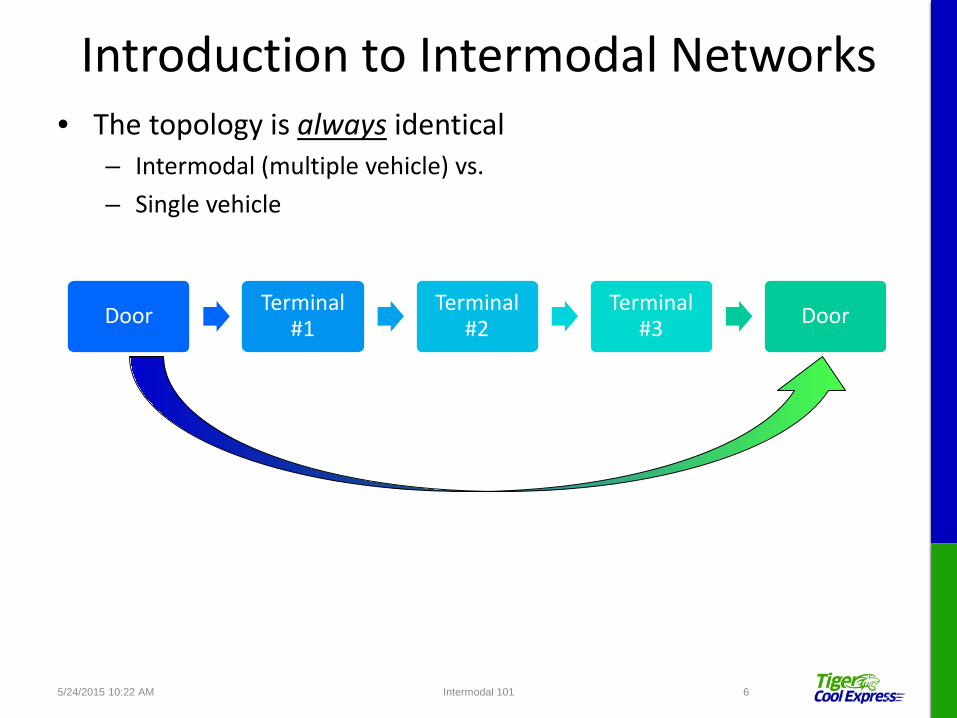
Introduction to Intermodal Networks• The topology is always identical
– Intermodal (multiple vehicle) vs.– Single vehicle
Door Terminal #1
Terminal #2
Terminal #3 Door
Intermodal 1015/24/2015 10:22 AM 6

Introduction to Intermodal Networks• Rail intermodal “takes a village”
Intermodal 101
SG&AITEquipment
Asset Intermodal Connectors
Rail network
Rail Terminal
Drayage Tractor Rail Flat Car Container Chassis
Value Priceless $Billions $100 million $125,000 $150,000 $55,000 $15,000
Investors Public sector 6 Majors Railroads Drayage Railroads
and TTXBimodals
and lessorsBimodals
and lessors
5/24/2015 10:22 AM 7

Intermodal Economics• Transportation is asset-based
Intermodal 101
Economics• Return on investment• Microeconomic substitution• Risk
Investment• Cost• Cash• Interest rates
Utilization• Velocity• Balance• Seasonality
5/24/2015 10:22 AM 8

Intermodal Economics• How does intermodal “beat” truck?
Intermodal 101
High fixed cost• Rail networks
High variable cost• Truck linehaul
Low fixed cost• Tractors
Low variable cost• Rail linehaul
Tradeoffs
5/24/2015 10:22 AM 9
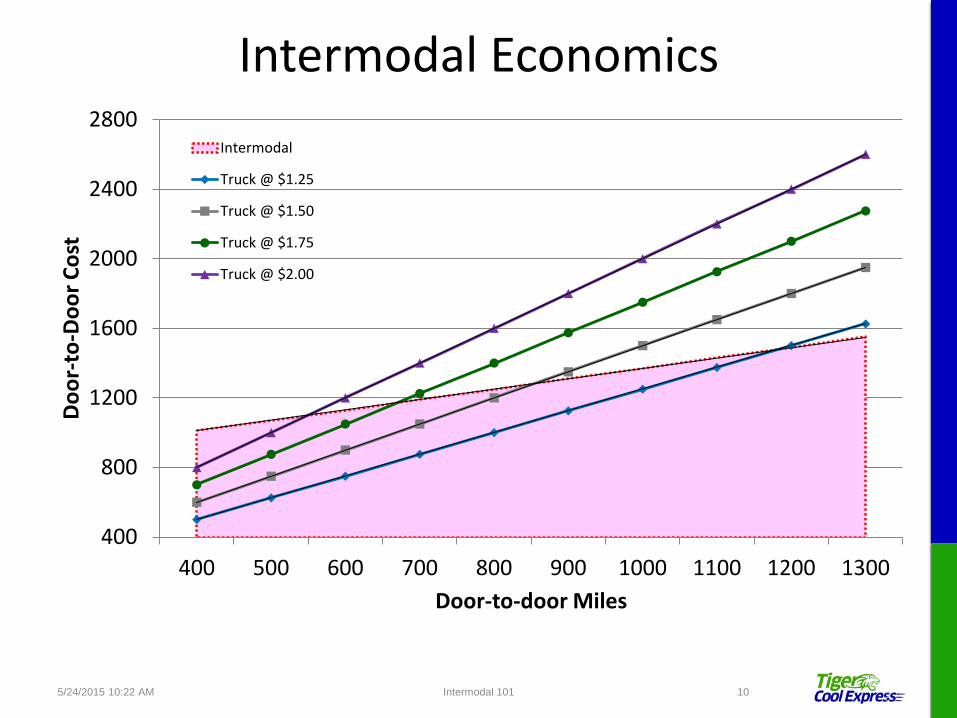
Intermodal Economics
400
800
1200
1600
2000
2400
2800
400 500 600 700 800 900 1000 1100 1200 1300
Doo
r-to
-Doo
r Cos
t
Door-to-door Miles
Intermodal
Truck @ $1.25
Truck @ $1.50
Truck @ $1.75
Truck @ $2.00
Intermodal 1015/24/2015 10:22 AM 10
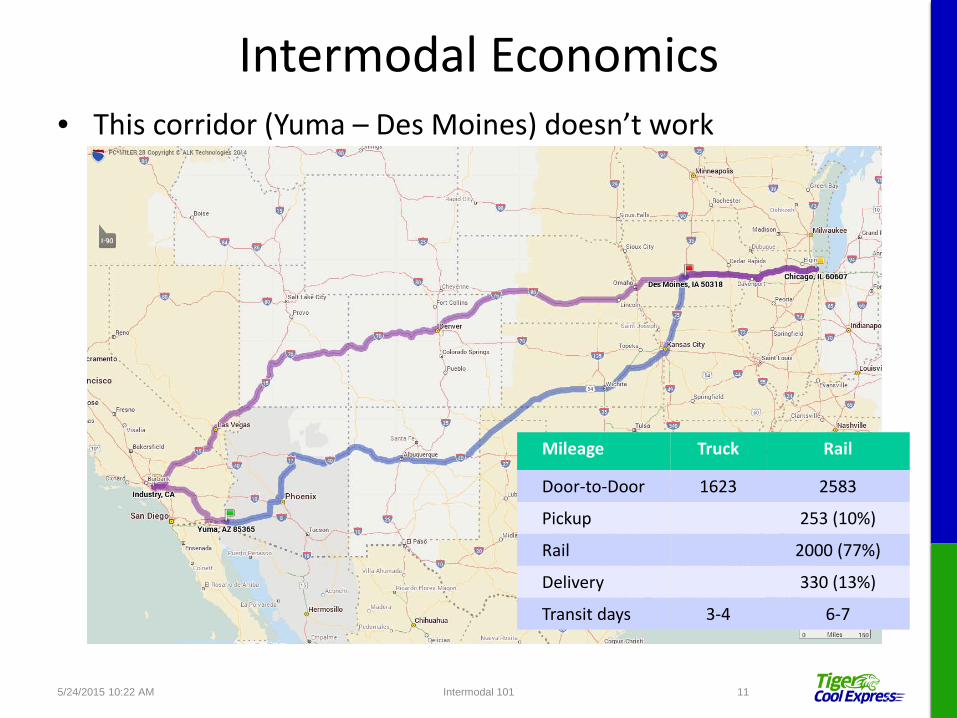
Intermodal Economics• This corridor (Yuma – Des Moines) doesn’t work
5/24/2015 10:22 AM 11Intermodal 101
Mileage Truck Rail
Door-to-Door 1623 2583
Pickup 253 (10%)
Rail 2000 (77%)
Delivery 330 (13%)
Transit days 3-4 6-7

Intermodal Economics• This corridor (Carlisle – Twin Cities) doesn’t work either
5/24/2015 10:22 AM 12Intermodal 101
Mileage Truck Rail
Door-to-Door 1071 1098
Pickup 23 (2%)
Rail 1051 (96%)
Delivery 24 (2%)
Transit (days) 2-3 6-7

The Intermodal Drayage DilemmaRailroads seek to maximize economies of scale
Drayage seeks to maximize economies of scope
5/24/2015 10:22 AM 13Intermodal 101

The Intermodal Dilemma• Opposing dynamics
5/24/2015 10:22 AM 14Intermodal 101
Railroad train
networks
Drayage availability
Point-to-point unit trains
Service between fewer ramp o/d pairs
Railr
oad
Desir
es
Intermodal Im
pact
Minimize distance between ramp and door
Longer distance increases cost and complexity
Dray
age
Desir
es
Intermodal Im
pact
Intermodal Constraints• Hours of service regulations were supposed to be a slam-dunk
for intermodal growth– They weren’t
• The same was true for fuel
5/24/2015 10:22 AM 15Intermodal 101
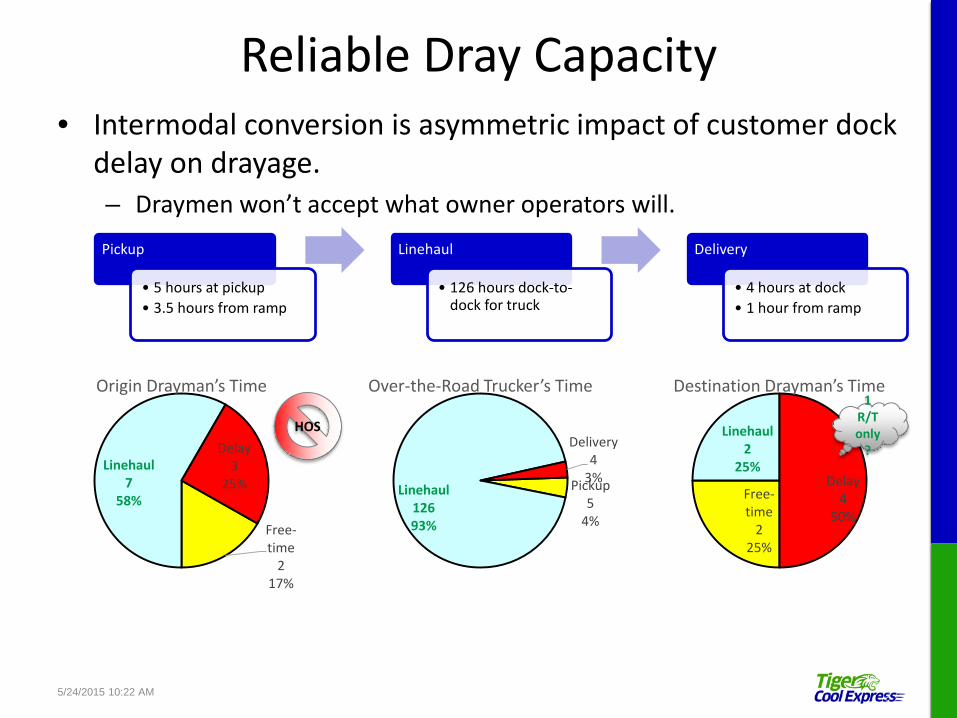
Reliable Dray Capacity• Intermodal conversion is asymmetric impact of customer dock
delay on drayage. – Draymen won’t accept what owner operators will.Pickup
• 5 hours at pickup• 3.5 hours from ramp
Linehaul
• 126 hours dock-to-dock for truck
Delivery
• 4 hours at dock• 1 hour from ramp
Pickup5
4%
Linehaul12693%
Delivery4
3%
Over-the-Road Trucker’s Time
Free-time
217%
Linehaul7
58%
Delay3
25%
Origin Drayman’s Time
Free-time
225%
Linehaul2
25%Delay
450%
Destination Drayman’s Time1
R/T only
?
HOS
5/24/2015 10:22 AM

Concluding Thoughts• Freight industry’s concern
– We’re speaking– Public sector isn’t listening
5/24/2015 10:22 AM 19Intermodal 101

Thought #1• What happened to the “E”?
5/24/2015 10:22 AM 20Intermodal 101
• E for Efficiency• The greater goodISTEA (1991)
• E for Equity• What’s ours is oursTEA21 (1998)
• E for Excess• What’s ours is mineSAFETEA (2005)
• E for Elusory• What do we do?MAP-21 (2012)
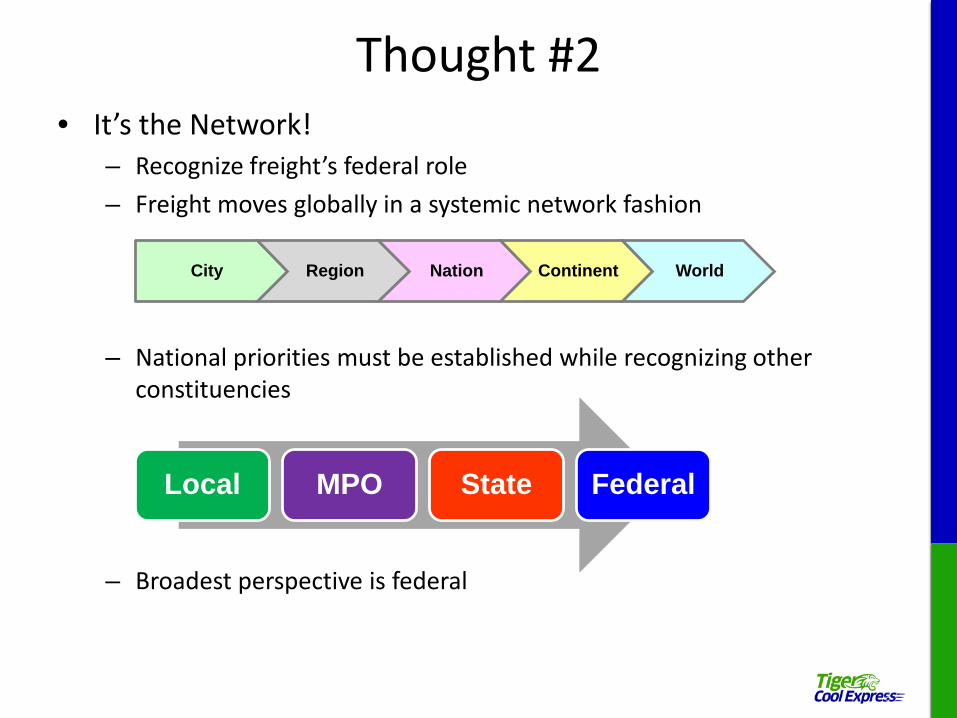
Thought #2• It’s the Network!
– Recognize freight’s federal role– Freight moves globally in a systemic network fashion
– National priorities must be established while recognizing other constituencies
– Broadest perspective is federal
City Region Nation Continent World
Local MPO State Federal
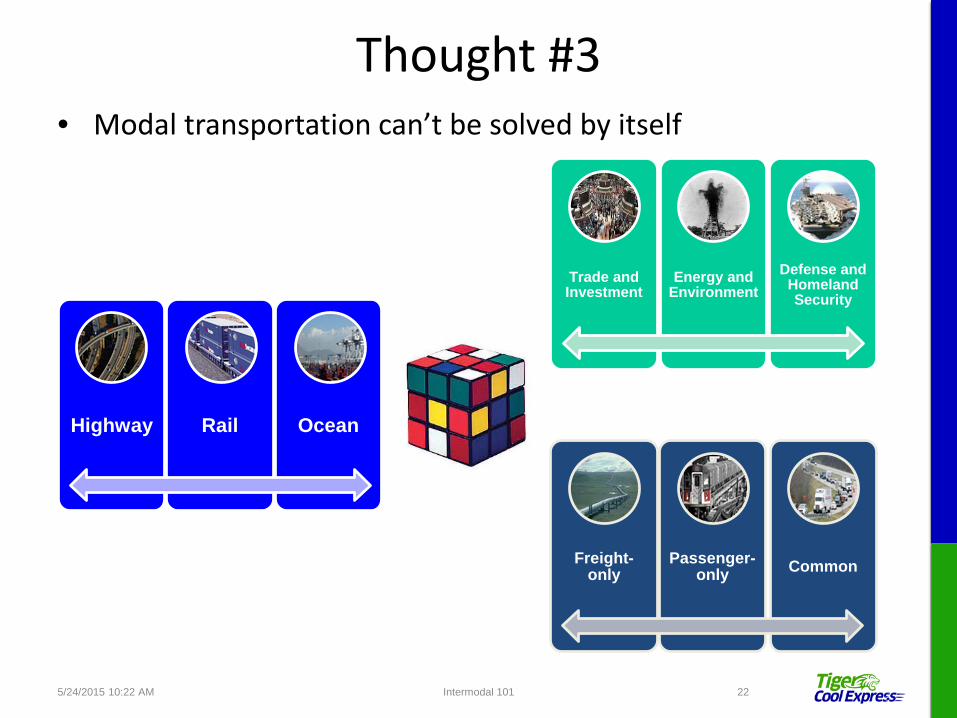
Thought #3• Modal transportation can’t be solved by itself
5/24/2015 10:22 AM 22Intermodal 101
Highway Rail Ocean
Trade and Investment
Energy and Environment
Defense and Homeland Security
Freight-only
Passenger-only Common
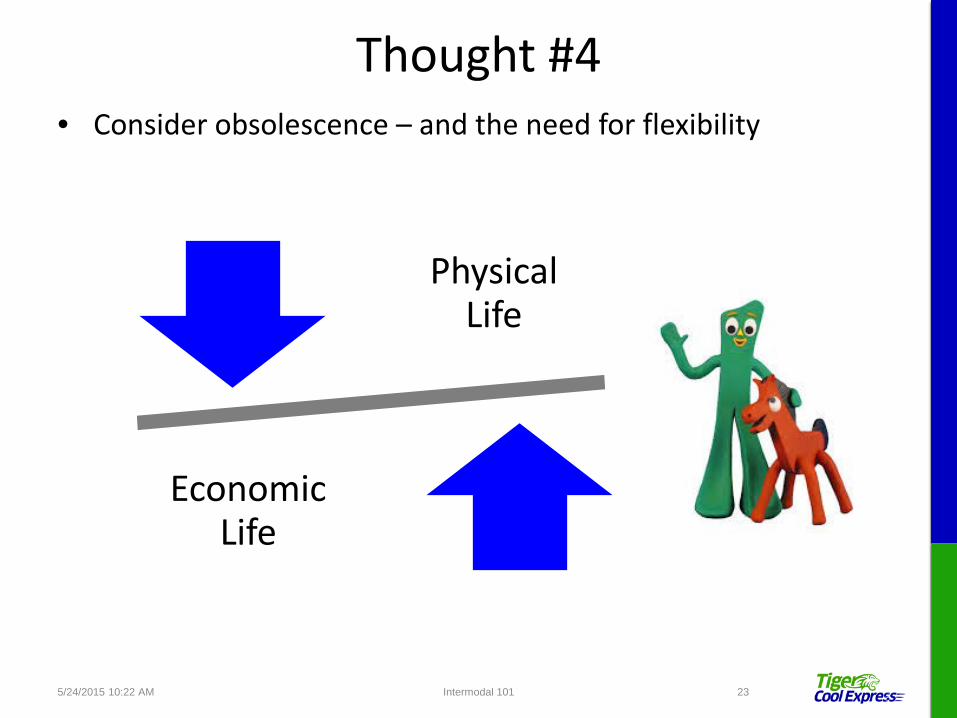
Thought #4• Consider obsolescence – and the need for flexibility
5/24/2015 10:22 AM 23Intermodal 101
Physical Life
Economic Life

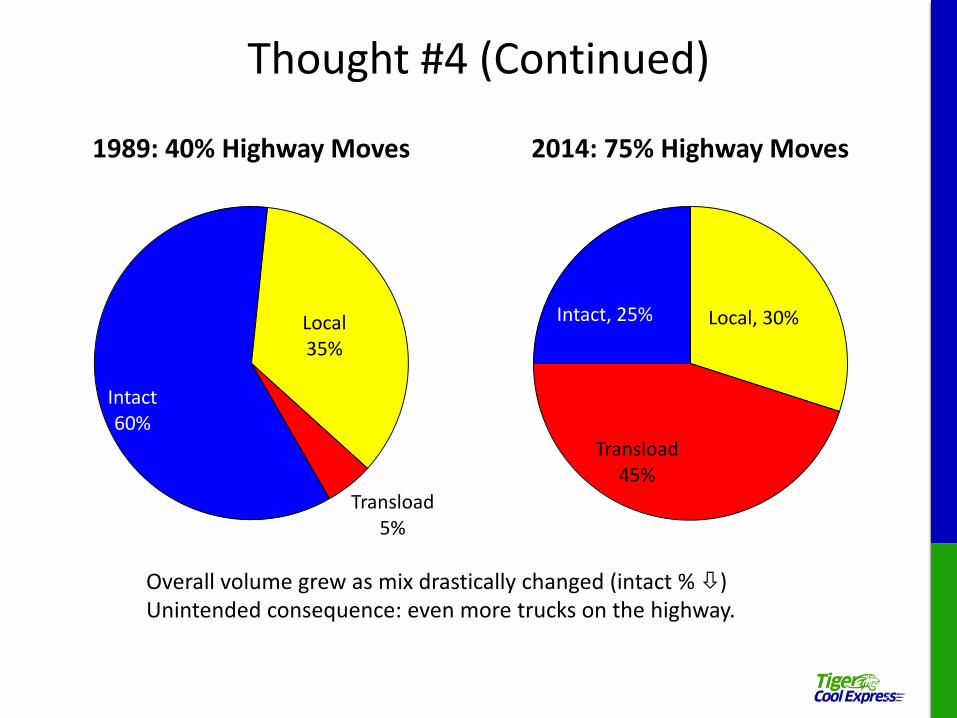
Thought #4 (Continued)
Alameda Corridor plannever considered that traffic mix might change.
What happens when thetraffic comes – but in a differentway?
Thought #4 (Continued)
Intact, 25% Local, 30%
Transload45%
2014: 75% Highway Moves
Overall volume grew as mix drastically changed (intact % )Unintended consequence: even more trucks on the highway.
Intact60%
Local35%
Transload5%
1989: 40% Highway Moves
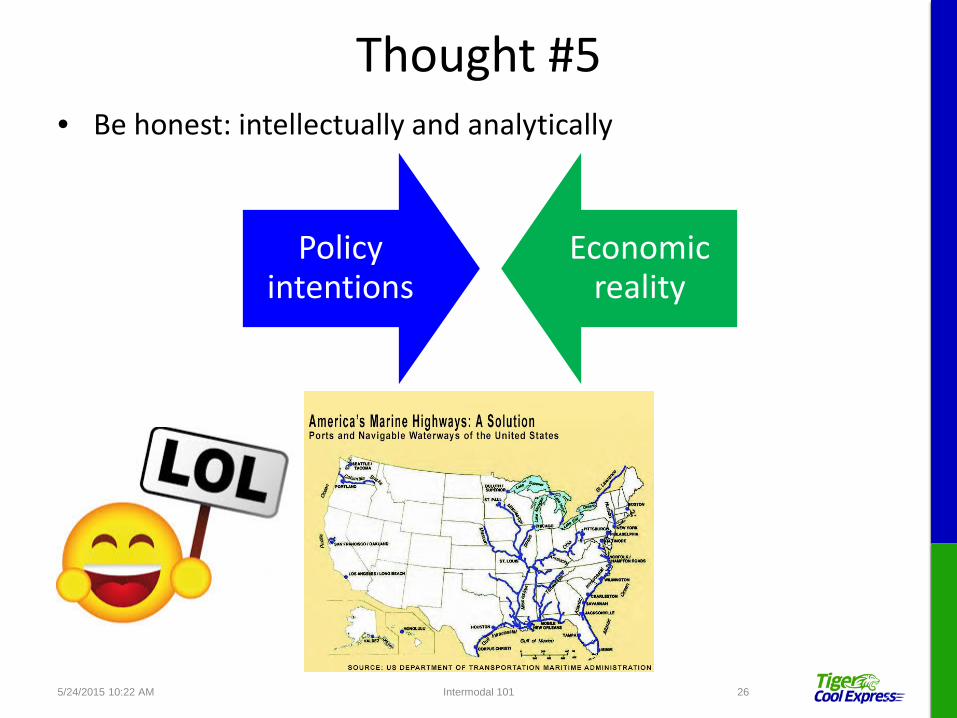
Thought #5• Be honest: intellectually and analytically
5/24/2015 10:22 AM 26Intermodal 101
Policy intentions
Economic reality

20%25%30%35%40%45%50%55%60%65%
2000 2001 2002 2003 2004 2005 2006 2007 2008 2009 2010 2011
USW
C Di
scha
rged
Car
go
tran
sloa
dedThought #5 (Continued)
• Different metrics yield different results
5/24/2015 10:22 AM 27Intermodal 101
0.00
0.25
0.50
0.75
1.00
1.25
1.50
1.75
2.00
2000 2001 2002 2003 2004 2005 2006 2007 2008 2009 2010 2011
TEU
s [20
00 =
1.0
0]
Midwest & South CentralNortheast & SoutheastTotal
Impact of all-water diversion
Impact of west coast transloading
EastCoastwins
WestCoastwins

A Final Thought• Vision without a plan is an hallucination