mapping assets vulnerable to sea level rise north ... · this atlas was developed as a pilot...
TRANSCRIPT

Mapping Assets Vulnerable to Sea Level RiseNorth Kingstown, RI
Prepared by:Rhode Island Sea Grant College Program
University of Rhode Island Environmental Data Center
Building Blocks for Climate Change Adaptation:Tools for Community Assessment and Planning
May 2011

1
Contents
Map Symbology……………………………………………………………………………………………………………………………………..1
Project Description ................................................................................................................................................................................2
Elevation Sources..................................................................................................................................................................................2
Methodology...........................................................................................................................................................................................2
Summary Tables ....................................................................................................................................................................................5
Real Property Maps ...............................................................................................................................................................................6
Facilities and Infrastructure Maps......................................................................................................................................................32
Road Index............................................................................................................................................................................................59
Flooded Parcels Index.........................................................................................................................................................................65

2
This atlas was developed as a pilot project for North Kingstown, and includes maps depicting sea level rise and the potential impacts to real property and infrastructure.
Project Description The Rhode Island Sea Grant College Program (RISG) program has a long term commitment to understanding climate change impacts related to sea level rise, flooding and erosion, and the resulting economic, social and environmental implications for our 21 coastal communities. Working with partners from the Rhode Island Coastal Resources Management Council (CRMC), the Statewide Planning Program, The Nature Conservancy (TNC), the Rhode Island Emergency Management Agency (RIEMA), the University of Rhode Island Environmental Data Center (URI-EDC), and other institutions, advancements have been made in science synthesis, policy development, and outreach on these issues. From this work, a need was identified for a more detailed analysis of vulnerable assets, adaptation strategies and implementation techniques that can be applied in Rhode Island’s coastal communities. The key obstacle has been the lack of digital elevation data for coastal Rhode Island and the lack of availability of this information to resource managers and decision makers.
This project consolidated the best available digital elevation data for coastal Rhode Island as of 2010, resulting in a series of map and data products that resource managers and decision makers can use to assess vulnerability to projected sea level rise. The high resolution topography and bathymetry data can be used for many other applications as well. This collaborative project included a participatory process with anticipated information users to ensure that the products are suited for state and municipal agencies and resource managers in Rhode Island. In addition to statewide products, a pilot project was implemented with the Town of North Kingstown to demonstrate the use of these tools for local planning and action to address sea level rise and increased inundation expected in the future.
With a foundation of high quality, statewide digital elevation data, managers can: 1) Begin to assess vulnerability and to prioritize risks to sea level rise and increased storminess; 2) Implement existing state sea level rise policy and programs which consider the impact of accelerated sea level rise on coastal permitting; 3) Develop new programs that incorporate sea level rise considerations into local comprehensive plans, hazard mitigation plans, and capital improvements; and 4) Address ecosystem-based adaptation options for wetlands and living shorelines. These tools will help Rhode Island build resilience to coastal hazards and climate change.
With the release of the Northeast Regional LiDAR (Light Detection and Ranging) data acquisition project coordinated by U.S. Geological Survey expected in late 2011, the participatory process, technical framework and products developed here provides a framework for incorporating new data for more timely utilization, once they become available.
Statewide data and North Kingstown maps can be accessed through electronicallyhttp://seagrant.gso.uri.edu/coast/slr_tools.html
State-Wide Elevation/Bathymetry Sources
Source: Year: Source: Year:
RI Digital Terrain Model 1997 RI Army National Guard Installation Mapping 2006
NGA City LiDAR Extraction 2004 South Kingstown Orthophotography Project 2006
MapCoast, Wickford 2005 US Army Corps of Engineers FUDS 2007
FEMA Flood Mapping 2006 NOS Soundings Various
Methodology
Since 2000 many portions of coastal Rhode Island have been surveyed using airborne LiDAR. While useful, these data were largely inaccessible by the scientific and planning communities due to unique file structures and large file sizes. In addition, data were collected at different specifications, and stored in multiple locations and formats. For coastal managers these problems were compounded by the challenges of working within the coastal fringe – that dynamic area of the coast where water transitions to land.
To alleviate these issues, this project sought to compile the best-available elevation and bathymetry data for Rhode Island, then construct a new, continuous topographic/bathymetric digital elevation model (DEM). These combined data would generate a much more useful picture of the coastal environment, allowing for better coastal hazards planning along with the more traditional upland uses. In addition to the DEM both a hillshade and 2-foot contour dataset were developed. These products are in high demand for effective visualization and analysis, and create a complete elevation product package for the state that can then be used for evaluating coastal hazards, among other uses.
The base data for this work were the 1997 elevation points developed as part of the RI 1:5,000 orthophotography project due to the state-wide coverage they provided. Multiple LiDAR datasets were then integrated to enhance these measurements where available. Before use, each dataset was reviewed and areas of overlap were removed, with newer, more accurate data taking precedence. All elevation data were input into an ESRI (Environmental Systems Research Institute) Terrain Database for processing. A terrain is a TIN-based storage and retrieval system that efficiently organizes and displays very large point datasets. This new terrain serves as the primary storage container for all of the state's LiDAR points and will allow for updates to the DEM as new elevation data are collected. Break-line features for roads, hydrographic features and the coast were added where available to aid in the interpolation.

3
(Day 2) (Day 1)
Coastal bathymetry was included along with available soundings from the National Ocean Service (NOS). All data were converted to a common coordinate system (RI Stateplane) and vertical datum (NAVD88) with elevations and depths measured in feet. The DEM that was generated has a 2-foot pixel size and conforms to National Map Accuracy Standards; 95% of points measured are within 0.5 feet of vertical accuracy in densely sampled areas. Accuracy was independently validated using a subset of the data (N=5000) not used to generate the model. Two foot contours were developed for the dataset and are included in the electronic files, although, the printed maps depict 5 foot contours for clarity. All data developed as part of this work are paired with Federal Geographic Data Committee (FGDC) compliant metadata.
Inundation scenarios: There are several coastal flooding hazards that impact communities today, and which are anticipated
to increase as sea levels continue to rise at an accelerated rate due to climate change. Coastal shorelines will experience increased elevations of daily high tides; an increased level of storm surge during extra-tropical storms (i.e. Nor’easters); and increased storm surge flooding. The following inundation scenarios depicted in the Statewide database and this North Kingstown atlas are described here.
Caution should be used for interpreting the inundation scenarios depicted in these maps. These scenarios represent conditions under average conditions at high tide as measured from the Newport, RI tide gage using tide data collected between 1983 and 2001 (National Tidal Datum Epoch). However, tide levels can vary by more than a foot above or below average conditions due to gravitational forces from the alignment of the earth, the moon, and the sun. In addition, water levels at high tide become increasingly higher as you travel north through Narragansett Bay. Mean Higher High Water (MHHW) at the Providence tide gage is about 7 inches higher than at the Newport tide gage. Newport tide data are a reasonable representation of tides in North Kingstown. The inundation zones do not include wave heights or consider obstructions to water flow such as dikes and culverts.
Mean Higher High Water (MHHW)
Mean higher high water (MHHW) is the mean elevation of the higher of the two daily high tides over a nineteen year period, in comparison to the mean high water (MHW), which is the average elevation of all high tides over the same period. MHHW is the chosen baseline for this study, since it reflects a realistic average tidal elevation that communities will experience regularly (See the figure below). MHHW should not be confused with spring high tide (sometimes referred to as moon tides), which are the higher than average tides and occur around the new and full moons. Spring high tides are often more than one foot higher than average tides as measured at the Newport tide gage.
MHW = average of all high tides over 19-year tidal epoch
MHHW = average of the highest daily tide over a 19-year tidal epoch
http://www.co-ops.nos.noaa.gov/data_menu.shtml
MHHW plus 1 foot sea level rise Historically, sea level has already risen about eight inches in the past 100 years at North Kingstown based on data from the Newport tide gage. With accelerated sea level rise already being observed in RI, models show that global sea levels are likely to rise one foot in the next twenty years to fifty years. MHHW plus 1' sea level rise scenario depict:
areas inundated at mean high tide levels with one foot of sea level rise, or areas inundated at spring high tide today.
MHHW plus 1 foot sea level rise and 3 foot storm surge Extra-tropical storms, often referred to as Nor'easters, typically have storm surges of three feet above the predicted tide height as experienced in Rhode Island. MHHW plus 1’ sea level rise and 3’ storm surge scenario depict: areas inundated during extra-tropical storms with a one foot sea level rise, or areas inundated during extra-tropical storms that strike at spring tide today.
Predicted Obs-Predicted × Observed
Tide Gage NOAA/NOS/CO-OPS
Water level vs. Predicted Plot Newport, RI
2011/02/23 - 2011/02/24

4
MHHW plus 5 foot sea level rise Models show that global sea levels may rise as much as five feet by 2100. MHHW plus 5' sea level rise scenario depicts:
areas inundated at mean high tide at 2100 or beyond, or areas inundated at during extra-tropical storms that strike at spring high tide with a one foot sea level rise
Hurricane 1938 Surge Height This inundation surface estimates flood elevations of the 1938 hurricane, as recorded at the Newport tide gage. Elevations do not include wave heights or run-up. It should be noted that inundation levels were higher in upper Bay coastal communities as the storm surge traveled north into Narragansett Bay.
The Planning Horizon:
There are several models that project accelerated rates of sea level rise. As you can see from the table below, the planning horizon will differ depending on the scenario and the specific scientific study. As pointed out above, however, we are able to see the increased levels of sea level today under circumstances include spring tides, nor’easters, storm surge and hurricanes. Therefore, communities can begin to take a “no regrets” approach to adapt to reduce impacts being experienced today, and which will occur more frequently in the future.
Sea Level Change Study 1 foot SLR 3 foot SLR 5 foot SLR Hurricane 1938 surge height
Vermeer and Rahmstorf, 2009
20 to 40 years 60 to 90+ years 80 to 90+ years
US Army Corps of Engineers, USACE Circular No. 1165-2-211, 2009
20 to 60 years 60 to 110+ years 90 to 110+ years
One percent chance of occurrence every year
Vulnerable Assets:
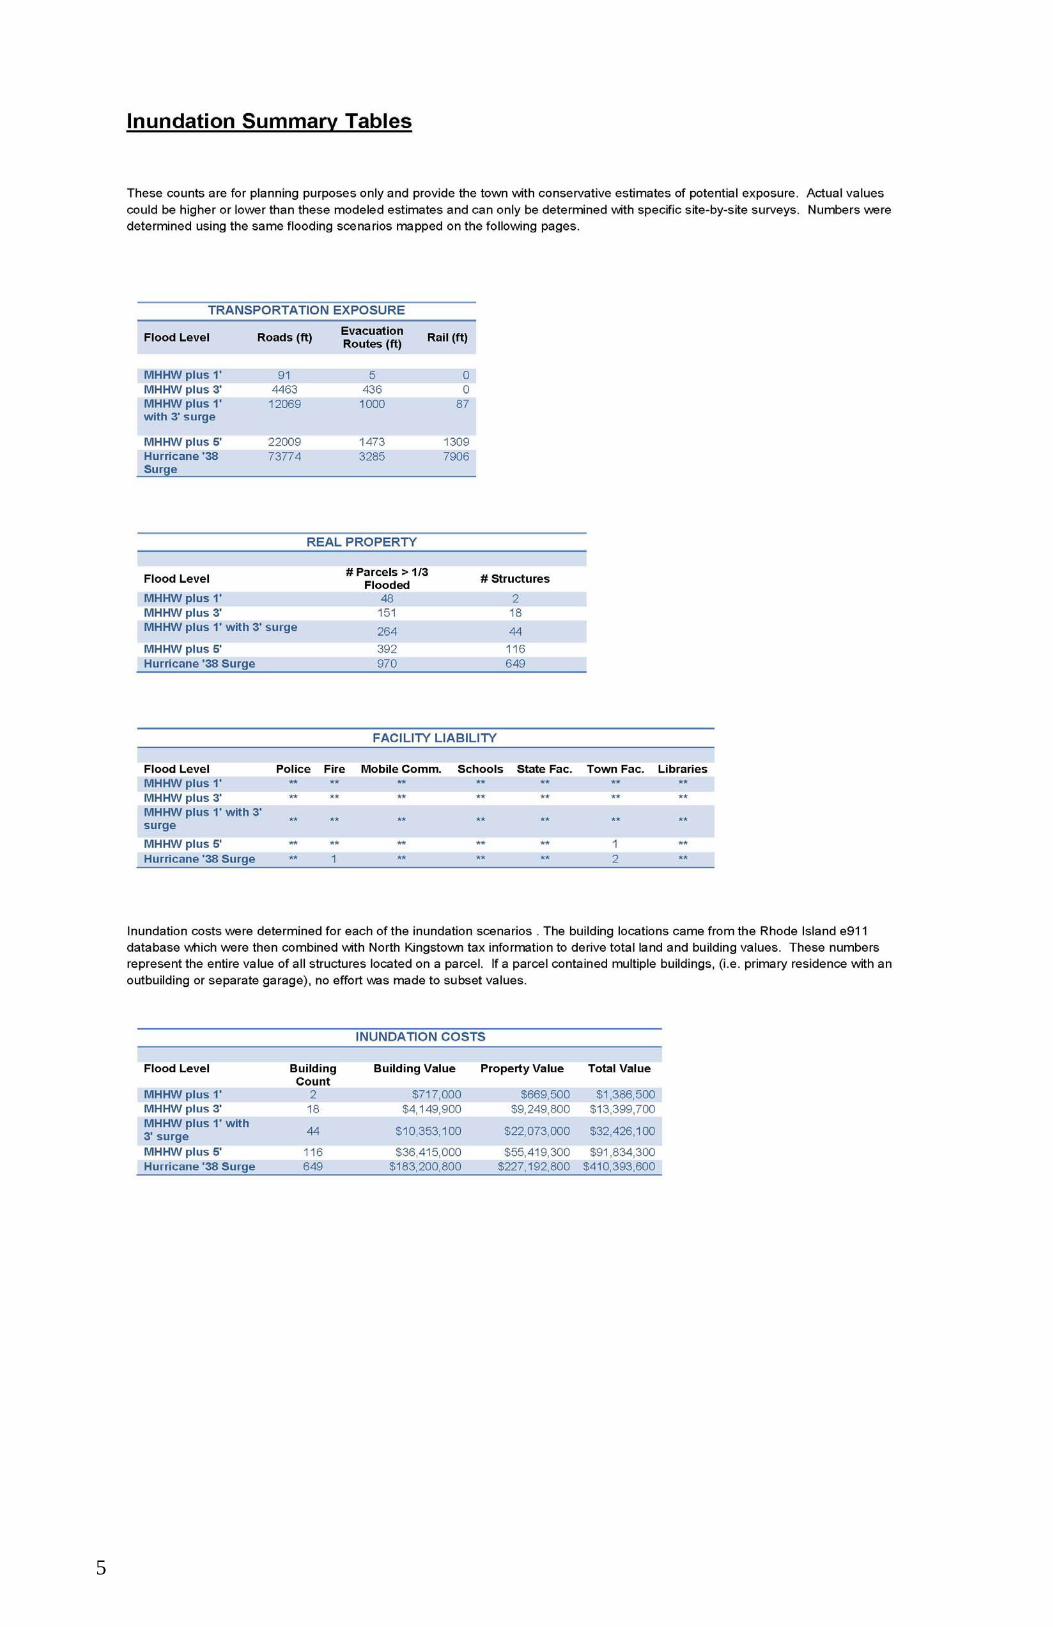
This atlas includes two sets of maps ─Real Property and Facilities/Infrastructure─ each depicting a set of related assets vulnerable to various inundation scenarios discussed above. Statewide GIS coverages were used primarily, with additional North Kingstown supplementary data to enrich the analysis (i.e. parcels, culverts). The Rhode Island E-911 database was used to provide both a count and location of structures within the study area. Structure locations were merged with town tax valuations to estimate financial exposure for each SLR scenario. No determination was made as to the actual water level at each building location, such as the degree of inundation (i.e. 3 inches or 3 feet); that analysis would need to be done separately. This same approach was also used for estimating infrastructure exposure, with features being either "wet" or "dry". The extent of road and bridge flooding can be determined with further analysis and the incorporation of additional information on road or deck height, approach heights, etc.
For planning purposes, we provide conservative estimates of potential exposure on Page 5 of this atlas, including linear footage of transportation infrastructure exposed, number of parcels and structures flooded, facilities impacted. A dollar value of the property and structures inundated is estimated as a “ballpark figure”, based on the best available information and the constraints of this study. A road index can be found on Page 59 and an index of flooded parcels begins on Page 65.
Caveats:
Inundation zones were created using single-value “bathtub” analyses, where the water level rises without detailed modeling or changes in topography. The flood elevations are based on the Newport tide gage, which will vary in different parts of the state. Inland hollows and other lowland areas may be seen as flooded, whereas they may not be connected to the sea and affected by the sea level rise. For greater accuracy, the information needs to be further ground truthed.
All flood surfaces and summary tables are for general planning purposes only. They are very useful for highlighting vulnerabilities, but could vary widely from the results of an actual event. It is expected that these maps will be used in conjunction with expert local knowledge to refine the exposure risks.
Statewide data and North Kingstown maps can be accessed electronically http://seagrant.gso.uri.edu/coast/slr_tools.html
For more information on this project, please contact Pam Rubinoff, URI Coastal Resources Center/ RI Sea Grant
5