mapping and analysis of agricultural trade liberalization ... · •the saes bound their...
TRANSCRIPT
Mapping and Analysis of Mapping and Analysis of Agricultural Trade Liberalization Agricultural Trade Liberalization
in South Asiain South Asia

Introduction•The SAEs represents 22% of world population but only 1.5 % of world GDP and just over 1% of world trade.
• In 2003 SAEs agricultural trade amounted to US$ 26 billion (Approximately 4% of world agricultural trade).
• During the 1970s, SAEs had highly protected trade regimes supported with high tariffs, Non-Tariff Barriers (NTBs) and stringent controls on exchange.
• During 1980s, the hitherto inward looking policies of SAE took a marked shift towards outward looking policies.
• During 1980s and 1990s, the tariff structures of these economies were made into simple and the number of tariff bands was reduced.

• During the first ten years (1995-2004) since the establishment of the WTO, the involvement of SAEs in regional trading arrangements has rapidly expanded. (Figure 1)
• The SAEs, similar to other developing countries, had been taxing agricultural activities directly through tax polices and indirectly through economy-wide policies.
• However, the changes in economic polices in 1980s and early 1990s did not totally change the direct protectionist policies and relatively higher tariff rates were applied on agricultural commodities.
• The institutional developments related to trade in the South Asian region have paved way to some liberalization of agricultural trade.
Next

Myanmar
Thailand Malaysia
Singapore
Indonesia
Brunei
Philippines
Vietnam
Cambodia
LaosChina
South Korea
Japan
Pakistan
Maldives Sri Lanka
IndiaNepal
BangladeshBhutan
South Africa
AustraliaNew Zealand
Kenya
Madagascar
Mozambique
MauritiusOman Yemen Tanzania
BTAs
SAPTA ASEAN
ASEAN + China
BA
IOR-ARC
BIMST-EC
(Source: Various sources)
US
ASEAN+China+Japan+Korea
Figure 1: BTAs, RTAs in Force and Potential RTAs in the Asia Pacific Region
RTAs in force
Back

Agricultural Trade in South Asia
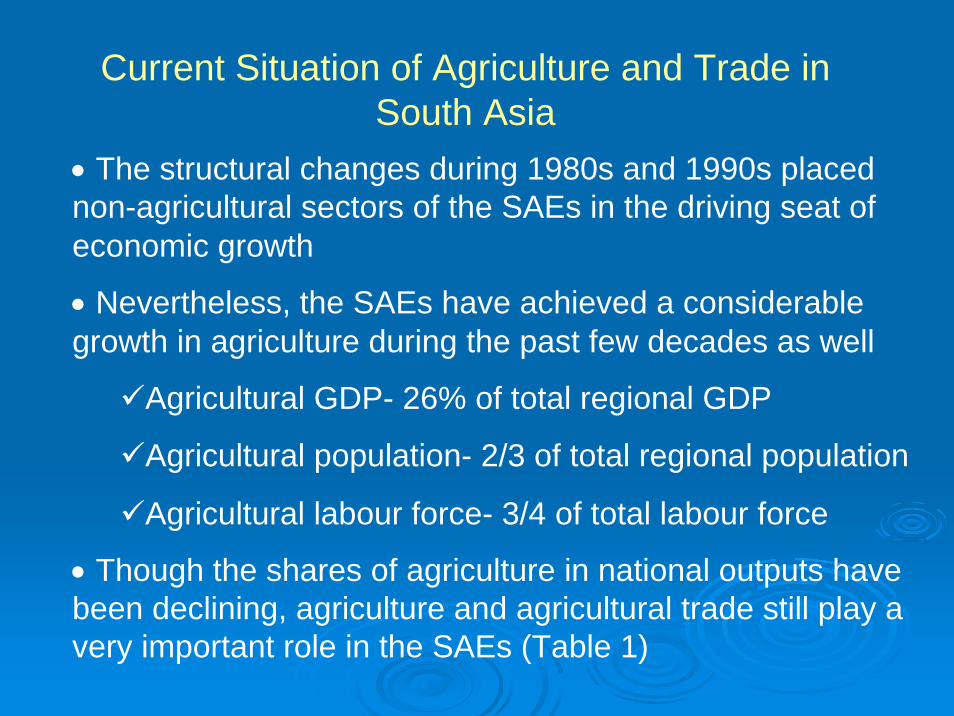
• The structural changes during 1980s and 1990s placed non-agricultural sectors of the SAEs in the driving seat of economic growth
• Nevertheless, the SAEs have achieved a considerable growth in agriculture during the past few decades as well
Agricultural GDP- 26% of total regional GDP
Agricultural population- 2/3 of total regional population
Agricultural labour force- 3/4 of total labour force
• Though the shares of agriculture in national outputs have been declining, agriculture and agricultural trade still play a very important role in the SAEs (Table 1)
Current Situation of Agriculture and Trade in South Asia
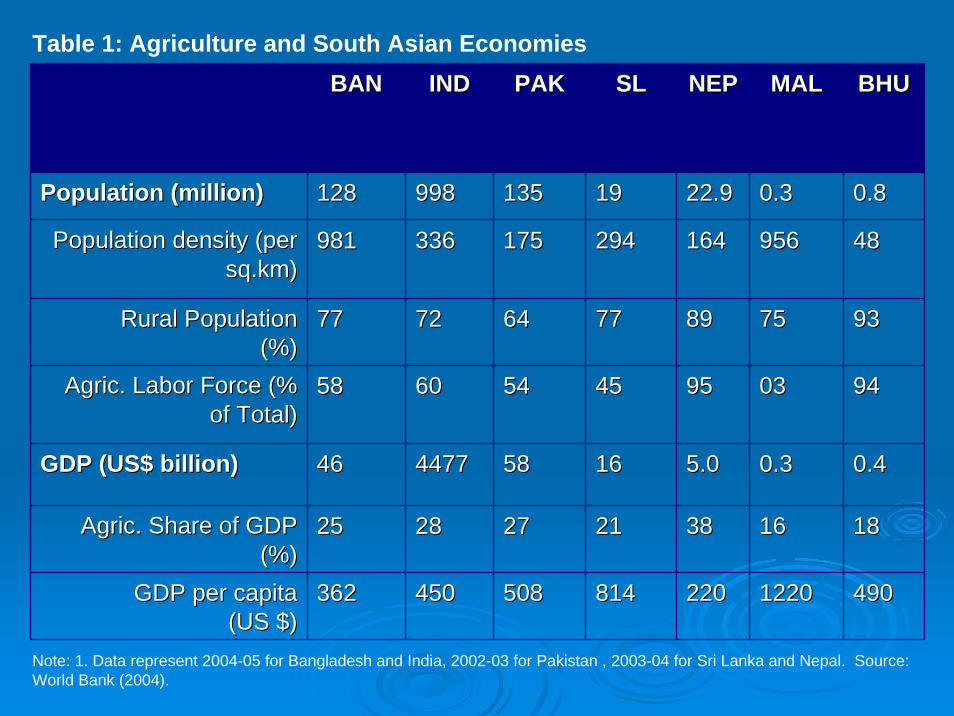
Table 1: Agriculture and South Asian Economies
Note: 1. Data represent 2004-05 for Bangladesh and India, 2002-03 for Pakistan , 2003-04 for Sri Lanka and Nepal. Source: World Bank (2004).
BANBAN INDIND PAKPAK SLSL NEPNEP MALMAL BHUBHU
Population (million) Population (million) 128128 998998 135135 1919 22.922.9 0.30.3 0.80.8
Population density (per Population density (per sq.km) sq.km)
981981 336336 175175 294294 164164 956956 4848
Rural Population Rural Population (%) (%)
7777 7272 6464 7777 8989 7575 9393
Agric. Labor Force (% Agric. Labor Force (% of Total)of Total)
5858 6060 5454 4545 9595 0303 9494
GDP (US$ billion) GDP (US$ billion) 4646 44774477 5858 1616 5.05.0 0.30.3 0.40.4
Agric. Share of GDP Agric. Share of GDP (%) (%)
2525 2828 2727 2121 3838 1616 1818
GDP per capita GDP per capita (US $) (US $)
362362 450450 508508 814814 220220 12201220 490490

Some Trade Related Indices for South Asia
0 0.1 0.2 0.3 0.4 0.5 0.6
Bangladesh
India
Pakistan
Sri Lanka
Nepal
Bhutan
0 0.05 0.1 0.15 0.2 0.25 0.3 0.35
Bangladesh
India
Pakistan
Sri Lanka
Nepal
-0.6 -0.4 -0.2 0 0.2 0.4
Banglades h
India
P akis tan
S ri Lanka
Figure 2: Agricultural Tradability Index (ATI)
Figure 4: Agricultural Net Export Index (ANEI)
Figure 3: Food Import capacity Index (FICI)

Export Specialization

Table 2: Export Indices of Revealed Comparative Advantage (RCA): Agricultural ProductsBangladesh India Maldives
1995 1998 2001 2004 1995 1998 2001 2004 1995 1998 2001 2004
Live animals 0 0 0 0 0 0 0 0 0 0 0 0
Meat 0 0 0 0 1 1 1 1 0 0 0 0
Fish and Crustaceans 10 7 8 12 3 0 4 3 78 87 74 74
Dairy products 0 0 0 0 0 0 0 0 0 0 0 0
coffee,Tea,Cocoa,Spices 2 1 1 1 5 6 5 3 0 0 0 0
Cut flowers and foliages 0 0 0 1 1 1 1 1 0 0 0 0
Vegetables and fruits 0 0 0 0 2 2 2 2 0 0 0 0
Cereals and cereal preparations 0 0 0 0 4 4 3 0 0 0 0 0
Oil seeds 0 0 0 0 2 1 2 2 0 0 0 0
Tobacco & tobacco manufactured 0 0 0 2 1 1 1 1 0 0 0 0
Sugar, sugar preparation & honey 0 0 0 0 1 0 3 2 0 0 0 0
Beverages 0 0 0 0 0 0 0 0 0 0 0 1
Nepal Pakistan Sri Lanka1995 1998 2001 2004 1995 1998 2001 2004 1995 1998 2001 2004
Live animals 2 1 0 2 0 0 0 0 0 0 0 0
Meat 0 0 0 0 0 0 0 0 0 0 0 0
Fish and Crustaceans 0 0 0 0 2 2 2 1 2 2 3 3
Dairy products 0 0 10 0 0 0 0 0 0 0 0 0
coffee,Tea,Cocoa,Spices 1 2 2 7 0 0 0 0 23 24 41 37
Cut flowers and foliages 0 0 0 0 0 0 1 0 2 1 1 2
Vegetables and fruits 1 3 2 3 0 1 1 1 2 2 1 1
Cereals and cereal preparations 0 1 1 0 5 7 8 7 0 0 0 0
Oil seeds 7 2 0 0 1 1 1 1 1 1 1 1
Tobacco & tobacco manufactured 0 0 0 0 0 0 0 0 2 2 2 4
Sugar, sugar preparation & honey 0 0 0 5 7 10 3 4 0 0 0 0
Beverages 0 0 0 0 0 0 0 0 0 0 0 0
Product
Product
Note: The value zero indicates no trade or lack of comparative advantage. Source: Estimated using data in COMTRADE data base

Policies and Reforms Related to Agricultural Trade
Changes in Agricultural Trade Policies
• The Pre-Uruguay round agricultural policies of the SAEs were characterized by direct public sector incentives for production such as research and development, extension services and input subsidies
• The structural adjustments of SAEs which started in 1980s, mainly focused on manufactured exports and trade reforms supporting this policy objective of liberalization
• But the agricultural sector policies of SAEs generally remained highly protected

Table 3: Status of Trade Liberalization Efforts in South AsiaBangladesh India Maldives Nepal Pakistan Sri Lanka
General
Exchange Rate UnifiedFree Float
UnifiedFree Float
UnifiedPegged to
US $
Pegged to Indian Rupee
Unified Free Float
Unified Free Float
Agric. Trade/GDP % 3 2 25 7 3 10
Import
QRs on Imports Yes Yes Yes Yes(minor) Yes Yes(minor)
Import Restrictions (Trade Reasons) –Import Licensing
Some Restrictions
No No No No Yes(very few)
State Import Monopolies
No Yes Yes No No No
Average Custom Duty Rate
16.3 22.2 20.8 13.7 17.3 11.3
Uses Anti-dumping No Yes No No Yes No
Exports
Some Export QRs Yes Yes No Yes Yes No
Some Export Taxes No Yes Yes Yes Yes No
Some Dirct Export Subsidies
Yes Yes No No No No
Percent Agric Tariff Lines Bound at WTO
100 100 100 100 89.6 100
Average Agric Bound Rate
188.3 115.7 30 42.3 101.6 50
Source: World Bank (2004), World Development Indicators (2001), TPR (2000), TPR-Nepal (2002)
Tariff Structure
• The SAEs bound their agricultural tariffs at prohibitively highlevels (100-300 percent) in the WTO agreement on agriculture
• However, the applied tariff rates of these economies are much less than the bound rates
• During the period of 2002-2003, a slight decrease in agricultural tariff rates could be observed in all SAEs, except in India (Figure 5)
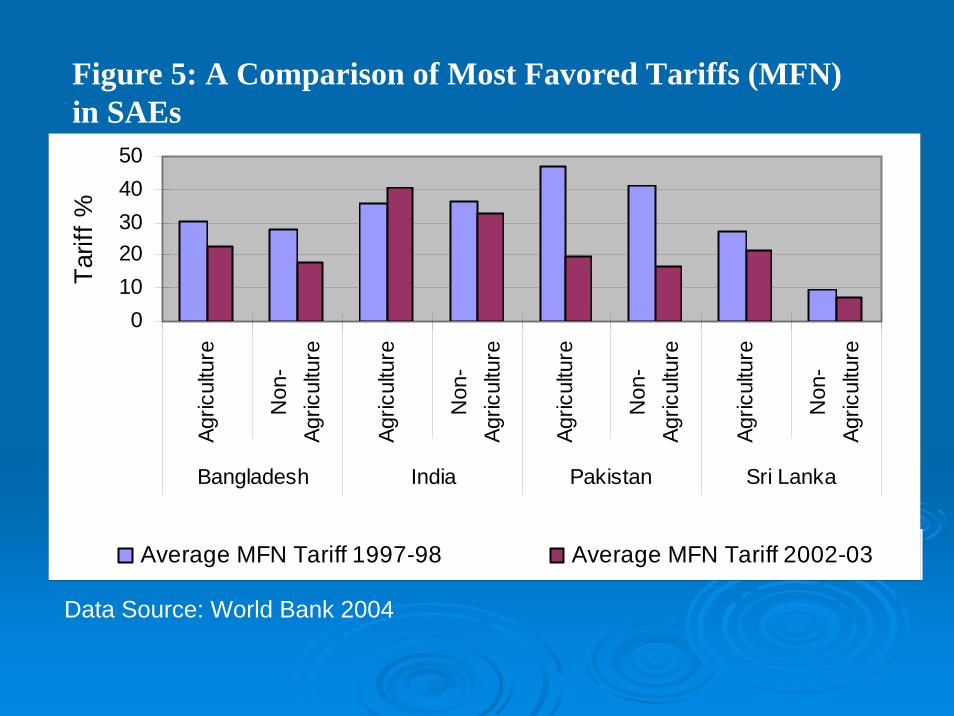
Figure 5: A Comparison of Most Favored Tariffs (MFN)in SAEs
Data Source: World Bank 2004
01020304050
Agr
icul
ture
Non
-A
gric
ultu
re
Agr
icul
ture
Non
-A
gric
ultu
re
Agr
icul
ture
Non
-A
gric
ultu
re
Agr
icul
ture
Non
-A
gric
ultu
re
Bangladesh India Pakistan Sri Lanka
Tarif
f %
Average MFN Tariff 1997-98 Average MFN Tariff 2002-03

Country Para Tariff
India Specific Duty (1996 to 1998)Surcharge (1999 to 2000)Special Additional Duty (1998 to 2004)All para-tariffs were abolished in January 2004
Pakistan Income Withholding TaxSales Tax
Sri Lanka Cess to fund the Export Development Board (Since 1981)Surcharge on Custom duties (Since 2001)Ports and Airport Levy (Since 2002)
Bangladesh Infrastructure Development SurchargeSupplementary DutyRegulatory DutyVAT Exemption for Specified Domestic Products
Nepal Local Development FeeSpecial FeeAgricultural Development Fee
19.7 3.7 8.7
40.1 0
19.6 3
24.6 3.5
13.5 6.1
0 10 20 30 40 50
Bangladesh
India
Pakistan
Sri Lanka
NepalCustom Duties
Other ProtectiveTaxes
Other Selective ImportTaxes
Average Custom Duties and other Protective Import Taxes-(%) of Agricultural Commodities
Use of Para-tariffs in South Asian Countries
Figure 6:
Figure 7:

Domestic Support•The domestic support for agricultural production could indirectly influence the agricultural trade in the region.
•India has sizeable agricultural subsidies compared to other countries in the region (Eg: subsidies on fertilizer, power, irrigation, credit and certified seeds)- 7.5%
•Sri Lanka’s agricultural producers are receiving domestic support in terms of a fertilizer subsidy, irrigation and replanting (for tree crops), but the level of subsidy has been very low (0.2-1.6%).
•However, regional trade agreements have not included the conditions on domestic support and many SAEs do not use anti-dumping regulations (Table 4).

Table 4: Restrictions/Incentives for Agricultural Exports in South Asian Economies
India Pakistan Bangladesh Sri Lanka Nepal
Export Restrictions
Export NTBs FertilizersAgric. Commodities
Yes (a few) Agricultural Livestock and Fisheries products
No Wool Carpets only
Export Control by STEs Maize, Niger seeds and Onion
No No Yes (a few)
Oil Crops
Restrictions on Imports for Re-exports
No No No(10% value addition charge on re-exports)
Yes(Tea and Spices)
No
Export Subsidies
Direct Export Subsidies YesWheat and Rice
No Yes15% cash subsidy(vegetables, dairy, poultry, fisheries)
No No
Transport and Marketing subsidy
Yes Yes25% Freight
YesLow air freight on National Carrier
No No
Indirect Export Subsidies
Yes YesSubsidy
YesLow interest loans
No No
Indirect export subsidy through polices affecting input policies
Yes Leather products
YesLeather products
YesBan on export of wet blue leather
No Yes
Production at Industry specific schemes
YesAgricultural Export Zones
No YesVegetables
No No

Trade in AgricultureAgricultural Trade Concentration
•Historically, SAEs trade similar types of agricultural products and the concentration of exports within limited agricultural products groups is a common phenomenon in many SAEs.
•The Hirschmann-Herfindahl Index (HHI) indicates that agricultural exports of Bangladesh, Maldives and Sri Lanka are concentrated on few products.
•The diversity of agricultural imports is high in Maldives and Sri Lanka.
•The most (least) diversified country in terms of agricultural exports (imports) is India. Figure 8

0 20 40 60 80 100
Bangladesh
India
Maldives
Nepal
Pakistan
Sri Lanka
Imports
Exports
Figure 8: Agricultural Trade Concentration in South Asia: The Hirschmann-Herfindahl Index

0% 20% 40% 60% 80% 100%
Bangladesh
India
Maldives
Nepal
Pakistan
Sri Lanka
Percentage share to total agricultural exports
Meat and Edible Meat Fish and Crustaceans Edible vegetablesEdible fruits and nuts Coffee, tea, spices CerealsOil seeds Fats and oils Preperations of meat/fishSugars Tobacco Others
Figure 9: Agricultural Export Concentrations

0% 20% 40% 60% 80% 100%
Bangladesh
India
Maldives
Nepal
Pakistan
Sri Lanka
Percentage share to total agricultural imports
Meat and Edible Meat Dairy Edible vegetables
Edible fruits and nuts Coffee, tea, spices Cereals
Oil seeds Fats and oils Sugars
Beverages, spirits and vinigar Tobacco Others
Figure 10: Agricultural Import Concentrations
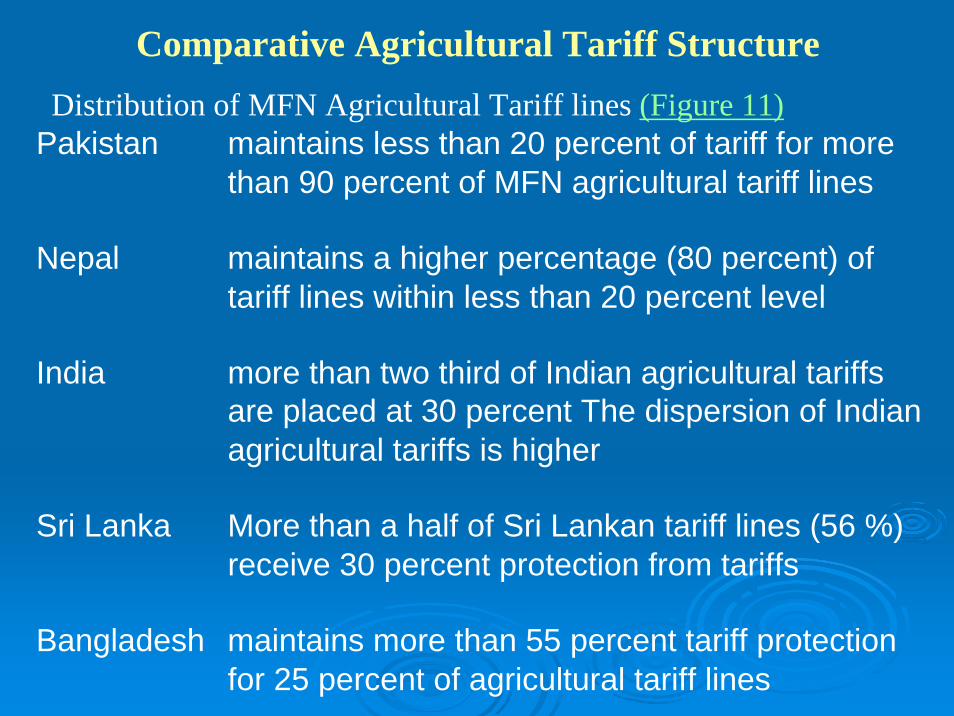
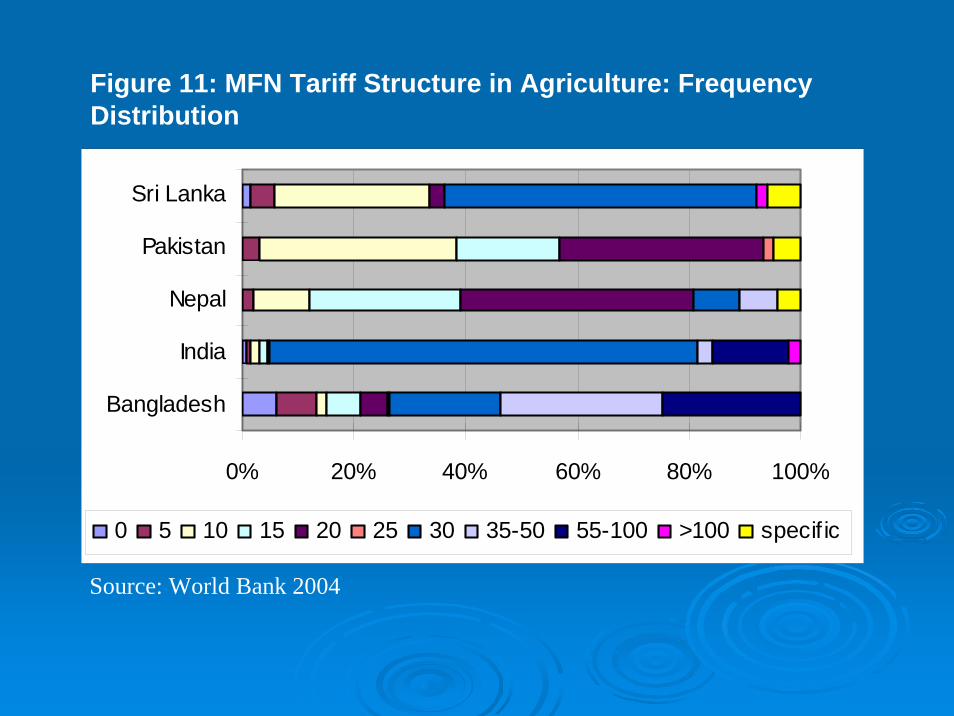
Pakistan maintains less than 20 percent of tariff for more than 90 percent of MFN agricultural tariff lines
Nepal maintains a higher percentage (80 percent) of tariff lines within less than 20 percent level
India more than two third of Indian agricultural tariffs are placed at 30 percent The dispersion of Indian agricultural tariffs is higher
Sri Lanka More than a half of Sri Lankan tariff lines (56 %) receive 30 percent protection from tariffs
Bangladesh maintains more than 55 percent tariff protection for 25 percent of agricultural tariff lines
Distribution of MFN Agricultural Tariff lines (Figure 11)
Comparative Agricultural Tariff Structure
0% 20% 40% 60% 80% 100%
Bangladesh
India
Nepal
Pakistan
Sri Lanka
0 5 10 15 20 25 30 35-50 55-100 >100 specif ic
Figure 11: MFN Tariff Structure in Agriculture: Frequency Distribution
Source: World Bank 2004

Protection for Agricultural TradeTable 5: Relative Tariff Ratio Indices for the South Asian Countries
RTR Bangladesh India Maldives Nepal Pakistan Sri Lanka
Bangladesh 0.60 0.03 0.22 0.25 0.12
India 1.66 0.09 0.17 0.37 0.16
Maldives 31.64 10.51 5.60 3.91 1.94
Nepal 4.52 5.71 0.17 1.41 1.28
Pakistan 3.95 2.63 0.25 0.70 0.37
Sri Lanka 8.23 6.17 0.51 0.77 2.69
Source: Estimated using data in COMTRADE, TRAIN data base (2005)
0123456
Bang
lade
sh
Indi
a
Mal
dive
s
Nep
al
Paki
stan
Sri L
anka
RES
T In
dex
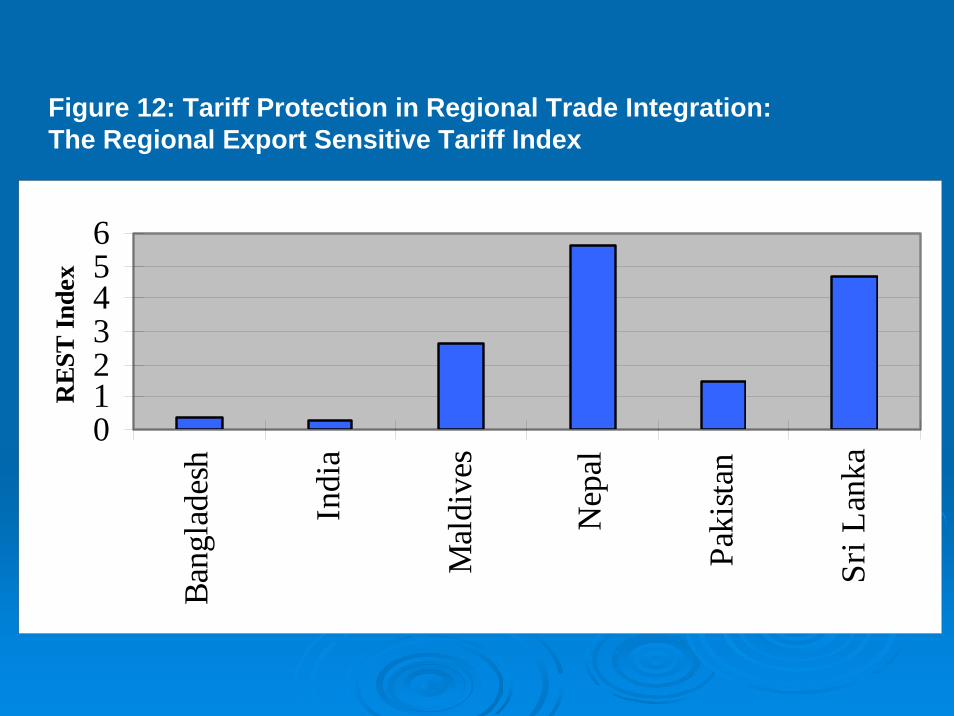
Figure 12: Tariff Protection in Regional Trade Integration: The Regional Export Sensitive Tariff Index

Preferential Trade Agreements
and
Agricultural Trade Liberalization
•Important features of Asia Pacific RTAs are,
•depth of tariff cuts offered are limited
•number of concessions and actual trade coverage are very low.
•most of the agricultural products are in the negative lists of the respective countries..
•Therefore, Agriculture remains the sector with lowest degree of liberalization.
•Thus, The SAEs possess conditions, such as presence of higher tariff, other protective taxes and NTBs and geographical closeness that provide potential for agricultural trade liberalization within the region.
Coverage of Agriculture in Preferential Trade Agreements

Table 6: Coverage of Agricultural Products in Intra- South Asian Regional Trade Arrangements
Agreement(Reference
Year)
Approach for Listing
Concessions
Agricultural tariff lines eligible for
concessions
Preferences as a % of MFN
tariff
Rules of Origin
Inclusion of NTBs Conditions on Domestic
Support/Export subsidies
Technical Cooperation
Inclusion of Services
SAPTA (1999)
Bilateral Negotiations (multilaterizedto all members)
866Bangladesh 229, Bhutan 61, India 223, Maldives 30, Nepal 141, Pakistan 107, Sri Lanka 85
5-20 (LDC 5-30) 40-50% of local content
YesSensitive List(Pakistan uses positive list for imports from India)
No Yes No
Indo-Lanka Free Trade Agreement(2000)
Negative list Approach
India: 53 Sri Lanka 23
25- 35% local content
YesTRQ and Designated entry pointsIndia: Tea
No Yes No
Pakistan Sri Lanka Free Trade Agreement (2005)
Negative List Approach
Pakistan 41Sri Lanka 21
Duty Free subjected to TRQ
25-35% local content
Yes TRQ: Sri Lanka: Rice, Potato. Pakistan:-Tea, Betel leaves
No Yes No
India-Nepal(2002)
Duty-free access to Indian Market Nepal: 10-20 %
tariff reductions form 10-110% tariff bands
30% minimum content of Nepalese or Indian products
TRQ-Quotas allocate to Indian State Trading Enterprises
No No
India-Bhutan: (2003)
Provisions for Bhutan to use NTB
No No
Bangladesh- Bhutan(2003)
Bangladesh: 58 23 % MOP (apple and apple juice)
No No

Table 7: Intra-regional Agricultural Trade: 1995-2004
Intra Regional Trade Flow
Value of Trade (US$ million)Value of Trade (US$ million) % % ChangeChange
19951995 19981998 20012001 20042004 19951995--20042004
BangladesBangladeshh
6.85 6.85 (77.5)(77.5)
10.3610.36(23.0)(23.0)
11.5211.52(18.4)(18.4)
21.8521.85(19.55)(19.55)
228228 Pakistan, IndiaPakistan, India
BhutanBhutan 15.2515.25 15.6815.68 NANA NANA India, Bangladesh India, Bangladesh
IndiaIndia 486486(28.3)(28.3)
642642(38.2)(38.2)
486486(23.7)(23.7)
872872(21.2)(21.2)
7979 Bangladesh, Sri Bangladesh, Sri Lanka, Lanka,
MaldivesMaldives 9.89.8(87)(87)
11.4411.44(88)(88)
13.9213.92(92)(92)
13.9713.97(77)(77)
4343 Sri LankaSri Lanka
NepalNepal 14.8114.81(31)(31)
26.0826.08(17)(17)
62.462.4(19)(19)
34.7934.79(10)(10)
135135 IndiaIndia
PakistanPakistan 87.9687.96(34)(34)
266.03266.03(63)(63)
74.9974.99(20)(20)
87.8587.85(17)(17)
--0.10.1 India, Sri Lanka, India, Sri Lanka,
Sri LankaSri Lanka 39.4239.42(45)(45)
53.4453.44(42)(42)
43.6243.62(28)(28)
51.3251.32(10)(10)
3030 India, Pakistan, India, Pakistan, MaldivesMaldives
Main Market(s)Main Market(s)(2004)(2004)CountryCountry

The Impact of Intra Regional Trade
(Gravity Model)
• The results of the analysis indicate that SAPTA has a significant agricultural trade creation effects in the South Asian region (The estimated coefficients on the log of product of GDP and distance are 1.15 and 0.32 respectively).
• ILFTA indicates a trade diversion effect to non-members (coefficient -0.15).
• The other regional trade agreements such as BIMSTEC show no significant effect on agricultural trade.
Summary of Major Findings & Conclusion•The dependence of higher proportion of population on agriculture, continuous declining of farm income, changes in terms of trade in agriculture and appreciation of RERs have led many SAEs to maintain relatively higher tariff rates for agricultural products than those for non-agricultural products.
• Trade barriers in agriculture are mostly based on ad-valoermtariffs but specific tariffs and TRQ have been used to protect sensitive (or high trade potential) agricultural commodities.
• The number of agricultural products covered in trade negotiations is very limited and the items negotiated have no significant trade interest to the contracting parties.

• Thus, the South Asia’s trade negotiations have yielded fewer preferences for agricultural trade and the SAEs remain the most protective region for agricultural trade.
•The development of agricultural trade and prevalence of higher tariffs protection indicate the potential for expansion of agricultural trade.
• India dominates the agricultural trade in the region and shows export specialization in a diverse group of agricultural products.
• But agricultural exports of the other SAEs are concentrated in a small basket of goods.
• Involvement of state trading monopolies, domestic supports for agricultural production and exports could highly influence the pattern of trade.

•Though these institutional developments to trade have included limited concession for agricultural products, SAEs have reported favourable economic growth and intra-regional trade expansion during the past decade.
• It is attributed to multilateral trade liberalization as well as regional and bilateral trade agreements.
• The development of the agricultural trade within the region during the past decade and prevalence of higher tariff protection indicate the potential for expansion of agricultural trade.
• The RTR and REST indices indicates that there is a potential for improving agricultural trade in the region and India and Bangladesh can provide more opportunities to promote agricultural trade in the region.

• The reduction in competitiveness of agricultural production is experienced by Bangladesh and Sri Lanka due to exchange rates appreciations.
• These countries have recourse to alternative methods, such as use high para tariffs, to provide additional protection to the domestic producers.
•Thus reduction of specific tariffs, removal of TRQs, improving market access for products with considerable export specialization and changing sensitive and negative lists of the SAEs have identified as key issues for regional and multilateraltrade negotiations.
• This will help to envisage a substantial trade development in the region.