mapping a blueprint to 2020
TRANSCRIPT

March, 2016
2015–2016 HR Systems Survey Results
18th Annual Edition, International Insights
Sierra-Cedar 2015–2016 HR Systems Survey Over 18 years of continuous data gathering
The most comprehensive survey in the industry: ● Strategy, Process, and Structure ● Administrative and Service Delivery Applications ● Workforce Management Applications ● Talent Management Applications ● BI/Analytics/Workforce Planning Applications ● Integration and Implementation ● Emerging Technologies and Innovations ● Vendor Landscape ● Workforce and HR Expenditures ● Workforce Usage and Perception
Participate in the 19th Annual Survey Download the 18th Annual White Paper
2

Sierra-Cedar 2015–2016 HR Systems Survey Demographics: All Respondents
3
Small <2,500
Medium 2,500–10,000
Large 10,000+
24%
49%
27%
``
Trans./Comm. Utilities
Manu- facturing
Higher Ed Finance Health Retail High Tech Ag. Mining. Const.
15% 14% 13% 13% 13% 10% 9% 7% 5%
Other
21 Million Employees/Contingents
Avg. number of Employees = 17,709 1,204
Organizations
Industries

Sierra-Cedar 2015–2016 HR Systems Survey Demographics: International and Global Organizations
80%
5% 12%
3%
Global 39%
Non-Global
61%
The average global organization has operations in over
27 different countries.
240 Organizations with HQ outside the US
460 Global Organizations
4
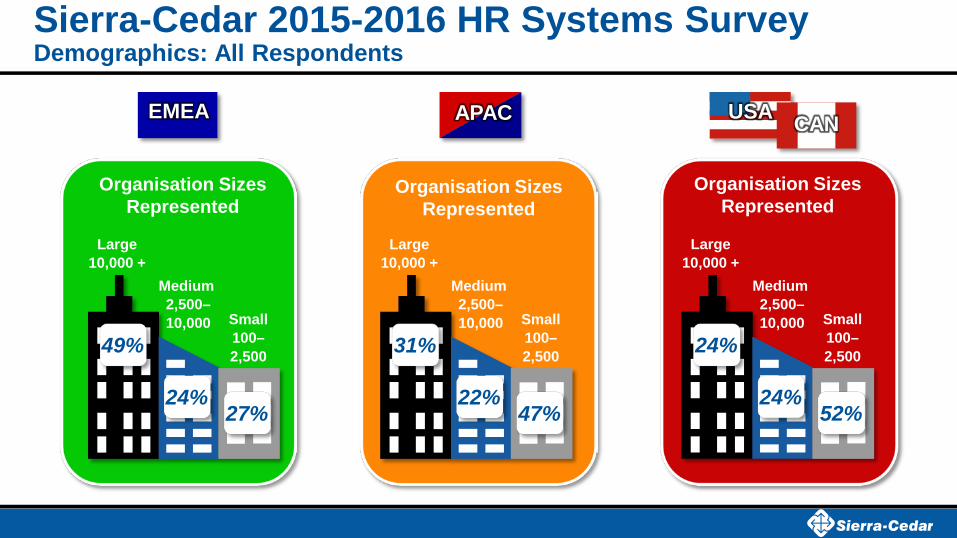
Sierra-Cedar 2015-2016 HR Systems Survey Demographics: All Respondents
Large 10,000 +
Medium 2,500– 10,000 Small
100– 2,500
Organisation Sizes Represented
49%
24% 27%
Large 10,000 +
Medium 2,500– 10,000 Small
100– 2,500
Organisation Sizes Represented
31%
22% 47%
Large 10,000 +
Medium 2,500– 10,000 Small
100– 2,500
Organisation Sizes Represented
24%
24% 52%
APAC EMEA USA CAN

Key Themes for 2015–2016 Survey Results Foundation Strategy and Culture Innovation
Enterprise HR Cloud
Back to Basics
HR Technology Strategy
Talent-Driven HR
Data-Driven HR
Service Delivery
Pathways Forward
Wearables Outcome-Focused HR
6
Backlog, Pipeline, Customer Satisfaction
General Ledger, Purchasing, Budgeting, T&E Vendor Management
Project Costing, Contracts, Grants Projects
FIN
CRM
VMS
Talent Management Excellence
Service Delivery Excellence Administrative Excellence
Workforce Management Excellence
Workforce Optimization Excellence
SOA, API, ETL
Enterprise Content Enterprise Workflow
Network Security
Enterprise Social
Mobile Access Integration Platform
Workforce Optimization Workforce Planning, Workforce Analytics,
Predictive Analytics
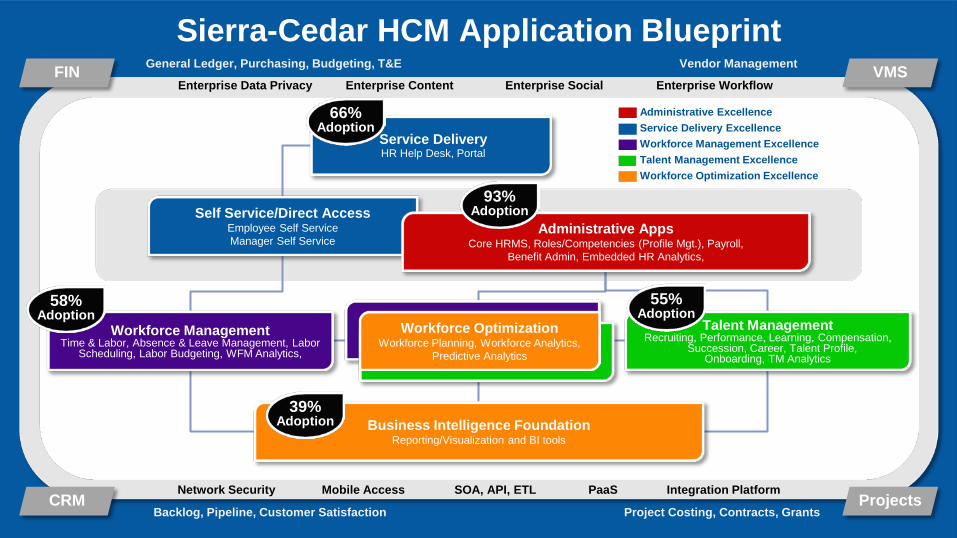
Service Delivery HR Help Desk, Portal
Self Service/Direct Access Employee Self Service Manager Self Service
Workforce Management Time & Labor, Absence & Leave Management, Labor
Scheduling, Labor Budgeting, WFM Analytics,
Talent Management Recruiting, Performance, Learning, Compensation,
Succession, Career, Talent Profile, Onboarding, TM Analytics
Business Intelligence Foundation Reporting/Visualization and BI tools
Administrative Apps Core HRMS, Roles/Competencies (Profile Mgt.), Payroll,
Benefit Admin, Embedded HR Analytics,
Sierra-Cedar HCM Application Blueprint
PaaS
Enterprise Data Privacy
66% Adoption
93% Adoption
58% Adoption
55% Adoption
39% Adoption

Application Adoption Levels by Region
86%
89%
92%
95%
93%
68%
66%
54%
67%
66%
65%
62%
50%
58%
58%
45%
56%
43%
56%
55%
35%
39%
27%
40%
39%
45%
60%
48%
48%
49%
WFM Service Delivery Admin Social BI/Analytics TM
8
Worldwide Average
USA
CAN
EMEA
APAC
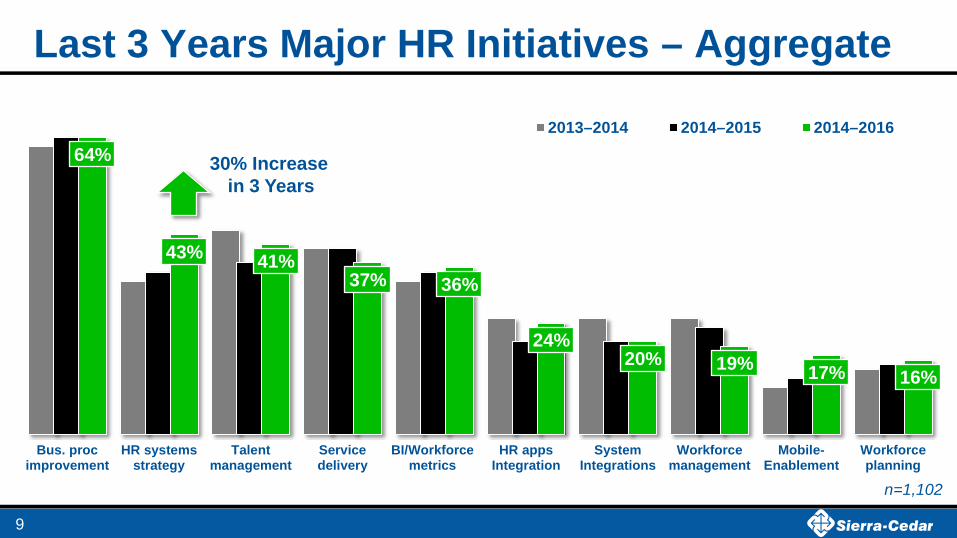
Last 3 Years Major HR Initiatives – Aggregate
64%
43% 41% 37% 36%
24% 20% 19% 17% 16%
Bus. procimprovement
HR systemsstrategy
Talentmanagement
Servicedelivery
BI/Workforcemetrics
HR appsIntegration
SystemIntegrations
Workforcemanagement
Mobile-Enablement
Workforceplanning
2013–2014 2014–2015 2014–2016
n=1,102
9
30% Increase in 3 Years

Last 3 Years Major HR Initiatives – EMEA
66%
52%
42% 40% 34%
29% 28% 20% 20%
Bus. proc.improvement
HR systemsstrategy
Talentmanagement
Servicedelivery
BI/Workforcemetrics
Globalconsolidation
SystemIntegration
Replacingcore HRMS
Social Media
2013–2014 2014–2015 2015–2016
* Global Organizations Only
49% Increase in 3 Years
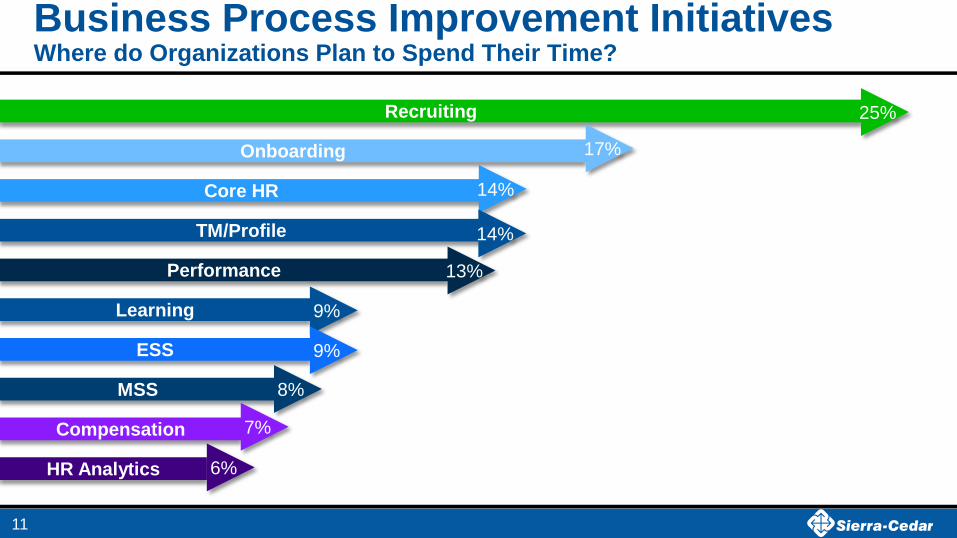
Recruiting
Onboarding
Core HR
TM/Profile
Performance
Learning
ESS
MSS
Compensation
HR Analytics
Business Process Improvement Initiatives Where do Organizations Plan to Spend Their Time?
11
6%
7%
25%
14%
13%
14%
9%
9%
17%
8%

The Year of the Enterprise HR Systems Strategy
36%
34%
14%
9% 7%
Regularly updated strategy
In development strategy
Rarely updated strategy
No strategy
Not aware
60% of Top Performing Organizations have an
Initiative to create or improve their Enterprise HR System Strategies
12
Percentage of Organizations With a Current Enterprise HR Systems Strategy
30%
26% 12%
20%
12%
Aggregate EMEA
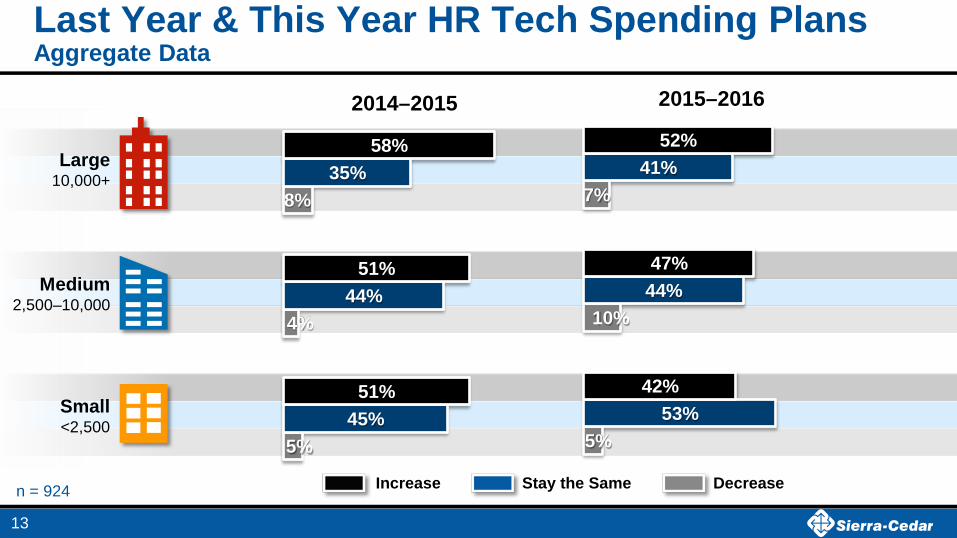
5%
10%
7%
53%
44%
41%
42%
47%
52%
2015–2016
Last Year & This Year HR Tech Spending Plans Aggregate Data
n = 924
13
5%
4%
8%
45%
44%
35%
51%
51%
58%
2014–2015
Small <2,500
Medium 2,500–10,000
Large 10,000+
Increase Decrease Stay the Same

4%
4%
5%
40%
48%
36%
55%
48%
58%
2015–2016
Last Year & This Year HR Tech Spending Plans EMEA Data
14
10%
7%
11%
24%
43%
32%
67%
50%
57%
2014–2015
Small <2,500
Medium 2,500–10,000
Large 10,000+
Increase Decrease Stay the Same
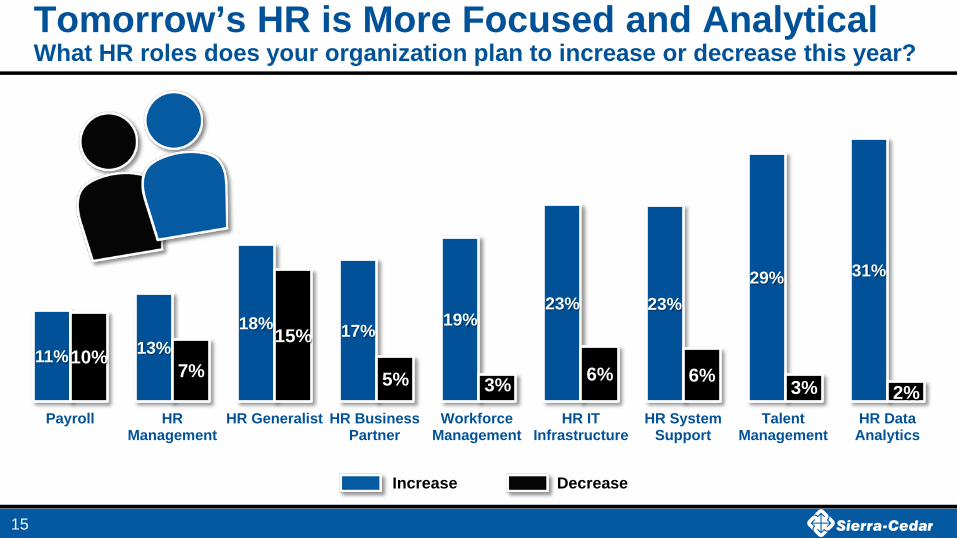
11% 13% 18% 17% 19%
23% 23% 29% 31%
10% 7%
15%
5% 3% 6% 6% 3% 2% Payroll HR
ManagementHR Generalist HR Business
PartnerWorkforce
ManagementHR IT
InfrastructureHR System
SupportTalent
ManagementHR Data
Analytics
Increase Decrease
Tomorrow’s HR is More Focused and Analytical What HR roles does your organization plan to increase or decrease this year?
15

62%
59%
58%
22%
55%
55%
51%
6%
WFM Licensed
PayrollLicensed
HRMSLicensed
TM Licensed
On-Premise Deployments
Today
12 Months
2015–2016 HCM Technology Deployment – Aggregate Movement to the Cloud is about transforming the User Experience
96%
57%
41%
46%
83%
50%
38%
37%
TM Cloud
HRMS Cloud
Payroll Cloud
WFM Cloud
SaaS/Cloud Deployments
Today
12 Months
16
3.5 Average User Experience Scores
3.0 Average User Experience Scores
Note these include combination and hosted environments

75%
69%
70%
22%
61%
64%
59%
13%
WFM Licensed
Payroll Licensed
HRMS Licensed
TM Licensed
On-Premise Deployments
Today
12 Months
2015–2016 HCM Technology Deployment – EMEA Movement to the Cloud is about transforming the User Experience
93%
50%
37%
33%
83%
39%
26%
19%
TM Cloud
HRMS Cloud
Payroll Cloud
WFM Cloud
SaaS/Cloud Deployments
Today
12 Months
17
3.5 Average User Experience Scores
3.0 Average User Experience Scores
Note these include combination and hosted environments

Multiple Pathways to an HR Tech Transformation There is no right or wrong way to move to the Cloud
Hybrids Move ONLY TM or WFM applications to the Cloud
Rip & Replace Move everything
all at once to the Cloud
Parallel/Patchwork Combination Licensed and Cloud Solutions
Hosting/Outsourced Single Tenant, but hosting with the vendor or another
organization
18
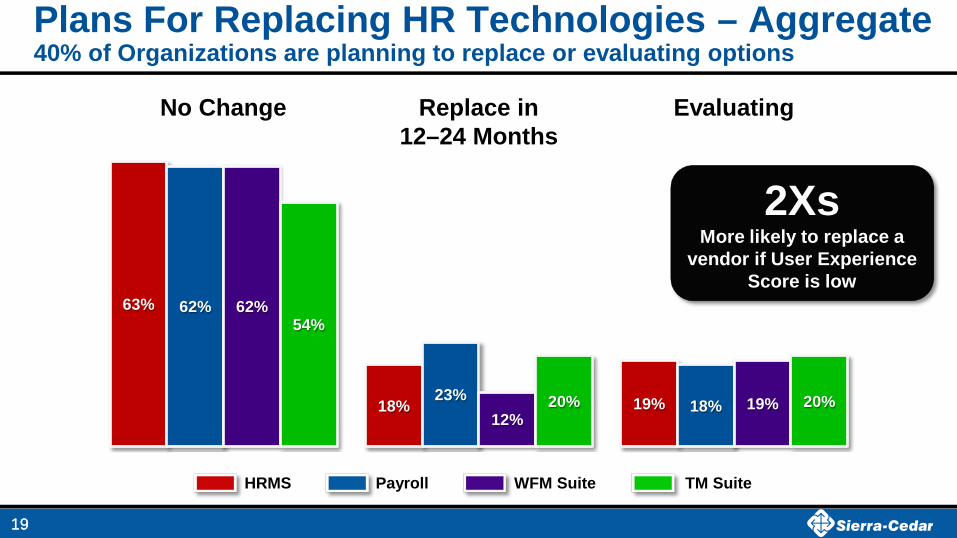
Plans For Replacing HR Technologies – Aggregate 40% of Organizations are planning to replace or evaluating options
19
63%
18% 19%
62%
23% 18%
62%
12% 19%
54%
20% 20%
2Xs More likely to replace a
vendor if User Experience Score is low
19
WFM Suite Payroll HRMS TM Suite
Replace in 12–24 Months
No Change Evaluating

Plans For Replacing HR Technologies – EMEA EMEA is more aggressively evaluating and/or planning to change solutions!
20
51%
18%
30%
55%
11%
29%
52%
22% 25%
50%
19% 28%
2Xs More likely to replace a
vendor if User Experience Score is low
20
WFM Suite Payroll HRMS TM Suite
Replace in 12–24 Months
No Change Evaluating
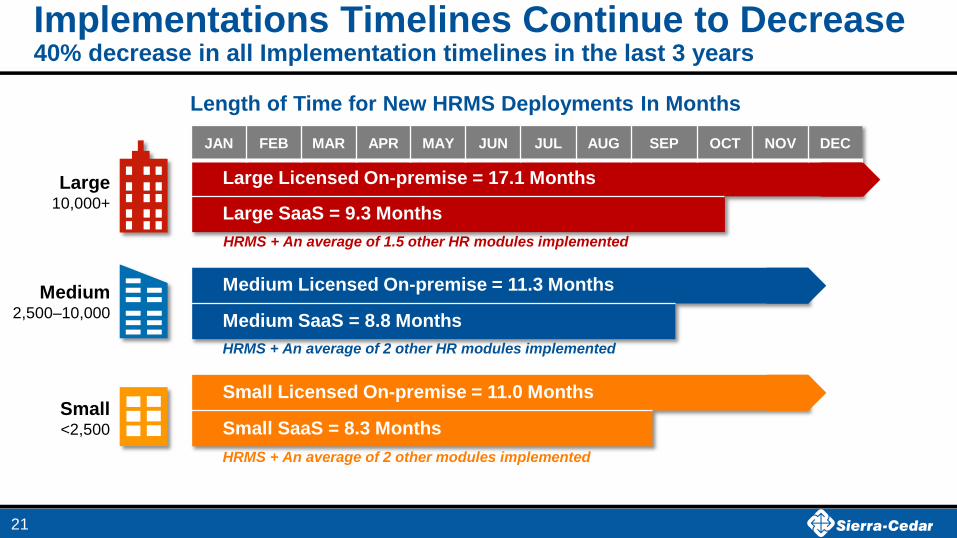
Implementations Timelines Continue to Decrease 40% decrease in all Implementation timelines in the last 3 years
Length of Time for New HRMS Deployments In Months
JAN FEB MAR APR MAY JUN JUL AUG SEP OCT NOV DEC
21
Large Licensed On-premise = 17.1 Months
Large SaaS = 9.3 Months
Medium Licensed On-premise = 11.3 Months
Medium SaaS = 8.8 Months
Small Licensed On-premise = 11.0 Months
Small SaaS = 8.3 Months Small <2,500
Medium 2,500–10,000
Large 10,000+
HRMS + An average of 1.5 other HR modules implemented
HRMS + An average of 2 other HR modules implemented
HRMS + An average of 2 other modules implemented

Updates (SaaS) and Upgrades (Licensed) SaaS HRMS Update Average # of Weeks
Week 1
Week 2
Week 3
Week 4
Week 5
Week 6
Week 7
Week 8
Large = 5.8 Weeks Medium = 3.1 Weeks
Small = 3.3 Weeks
JAN FEB MAR APR MAY JUN JUL AUG SEP OCT NOV DEC
Large = 9.3 Months
Medium = 7.0 Months
Small = 3.3 Months
Licensed HRMS Upgrade Average # of Months
22
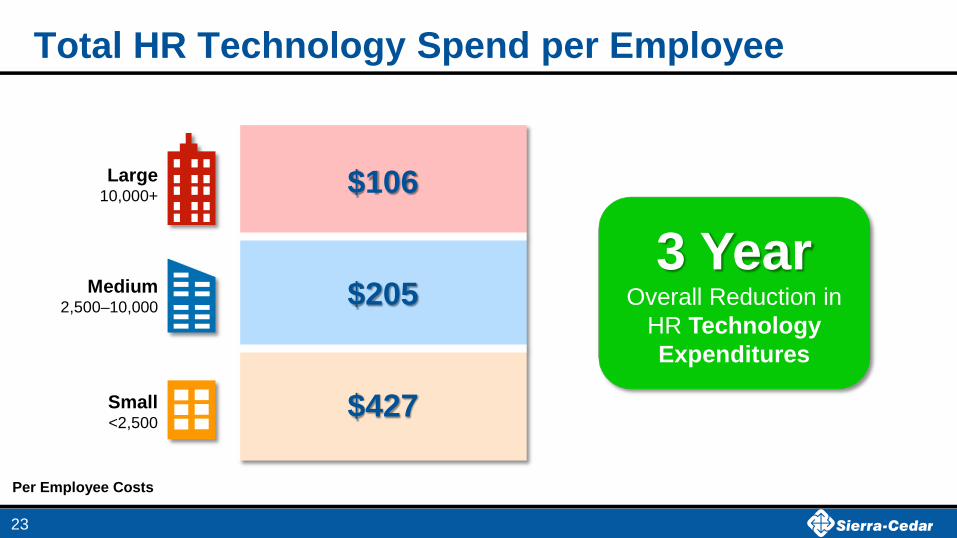
Total HR Technology Spend per Employee
23
Small <2,500
Medium 2,500–10,000
Large 10,000+ $106
$205
$427
3 Year Overall Reduction in
HR Technology Expenditures
Per Employee Costs

HR Technology Spend by Deployment Model
24
Small <2,500
Medium 2,500–10,000
Large 10,000+
SaaS Average HRMS Tech Costs
$116
$210
$394
HRMS + 7–8 Other HR Modules
SaaS vendor fees, or BPO fees
Licensed Average HRMS Tech Costs
$114
$199
$444
HRMS + 7–8 Other HR Modules
License plus maintenance, & annual hosting Per Employee Costs

Implementation & Support Costs Vary Greatly
25
Small <2,500
Medium 2,500–10,000
Large 10,000+
Implementation Costs Support
SaaS Avg. External
3rd Party
SaaS Avg. External
Vendor
SaaS Ongoing Support
$16 $8 $3
$23 $20 $21
$89 $30 $121
HRMS + 7–8 Other HR Modules HRMS + 7–8 Other HR Modules
Implementation Costs Support
Licensed Avg. External
3rd Party
Licensed Avg. External
Vendor
Licensed Ongoing Support
$37 $8 $15
$79 $36 $40
$102 $64 $153
Per Employee Costs

Change Management Practices
29%
36%
29%
6%
Aggregate
Consistent culture ofchange mangement
Key projects that meetcriteria
Sporadically, with nocriteria
Never
26
35%
43%
16% 6%
EMEA
EMEA Organizations Report a Greater Culture of Change Management
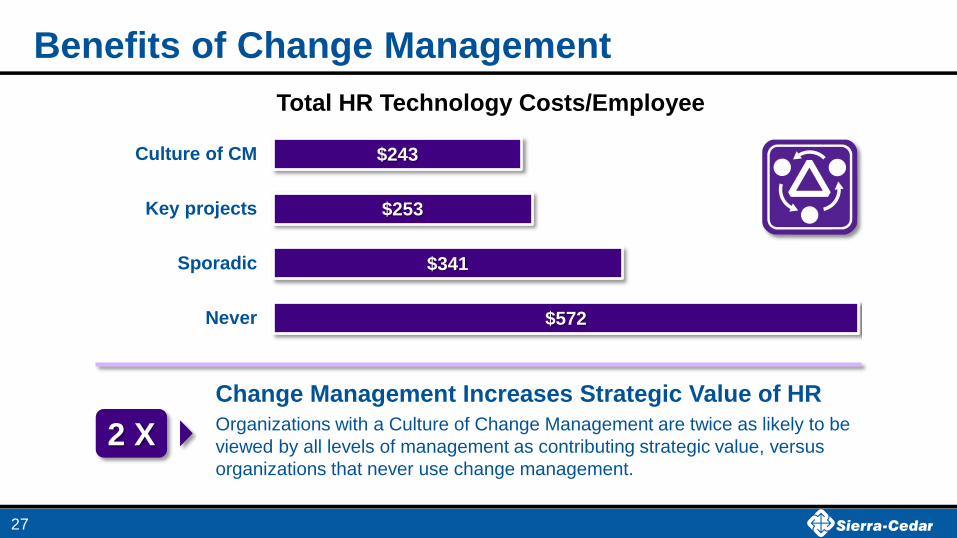
Benefits of Change Management
57%
Organizations with a Culture of Change Management are twice as likely to be viewed by all levels of management as contributing strategic value, versus organizations that never use change management.
Change Management Increases Strategic Value of HR
2 X
$572
$341
$253
$243
Never
Sporadic
Key projects
Culture of CM
Total HR Technology Costs/Employee
27

HRMS Adoption By Size – Aggregate
28
1%
2%
3%
3%
8%
8%
15%
6%
8%
5%
11%
13%
36%
1%
1%
1%
3%
6%
6%
8%
9%
10%
12%
13%
20%
43%
Epicor
ADP (WN)
Ceridian Dayforce
UltiPro
Oracle (HCM Cloud)
SuccessFactors (EC)
Workday
ADP (GV/V)
Infor/Lawson
Kronos
Oracle (EBS/JD)
SAP (HCM)
Oracle (PS)
Today 12 months
Large 10,000+
1%
4%
6%
8%
6%
8%
17%
6%
11%
11%
5%
8%
31%
1%
5%
5%
6%
4%
6%
11%
9%
10%
13%
6%
9%
33%
Today 12 months4%
13%
6%
17%
5%
4%
16%
7%
2%
7%
2%
3%
9%
4%
16%
4%
14%
1%
2%
14%
7%
2%
8%
3%
3%
9%
Today 12 months
Small <2,500
Medium 2,500–10,000

HRMS Adoption – EMEA
29
2%
4%
4%
2%
5%
10%
19%
5%
7%
20%
18%
24%
1%
4%
4%
2%
5%
6%
8%
8%
9%
18%
20%
34%
Epicor & Raet
Ceridian Dayforce
UltiPro
Meta4
Oracle (EBS/JD)
Oracle (HCM Cloud)
Workday
Kronos
ADP (WN)/GV/Vantage)
SuccessFactors (EC)
Oracle (PS)
SAP (HCM)
Today 12 months

Talent Suite Adoption By Size – Aggregate
30
1%
0%
2%
2%
4%
2%
5%
2%
6%
16%
13%
25%
17%
24%
9%
1%
1%
1%
3%
3%
3%
4%
5%
7%
7%
11%
19%
22%
25%
15%
ADP (WN)Ceridian Dayforce
ADP (Vantage)Halogen
UltiproInfor/Lawson
SabaSumTotal/Softscape
PeopleFluentKenexa/IBMSAP (HCM)
WorkdayCornerstone OnDemand
Oracle (HCM Cloud/Taleo)Oracle (PS/EBS)
SuccessFactors (EC)Other
Today 12 months1%
3%
1%
2%
5%
2%
1%
3%
0%
3%
2%
17%
11%
13%
17%
22%
12%
1%
1%
2%
2%
4%
0%
1%
6%
1%
3%
2%
11%
11%
12%
19%
22%
16%
Today 12 months13%
5%
4%
5%
18%
1%
0%
1%
1%
1%
2%
15%
9%
9%
6%
5%
18%
12%
2%
3%
4%
14%
1%
0%
2%
0%
1%
2%
9%
11%
5%
5%
4%
28%
Today 12 months
Large 10,000+
Small <2,500
Medium 2,500–10,000
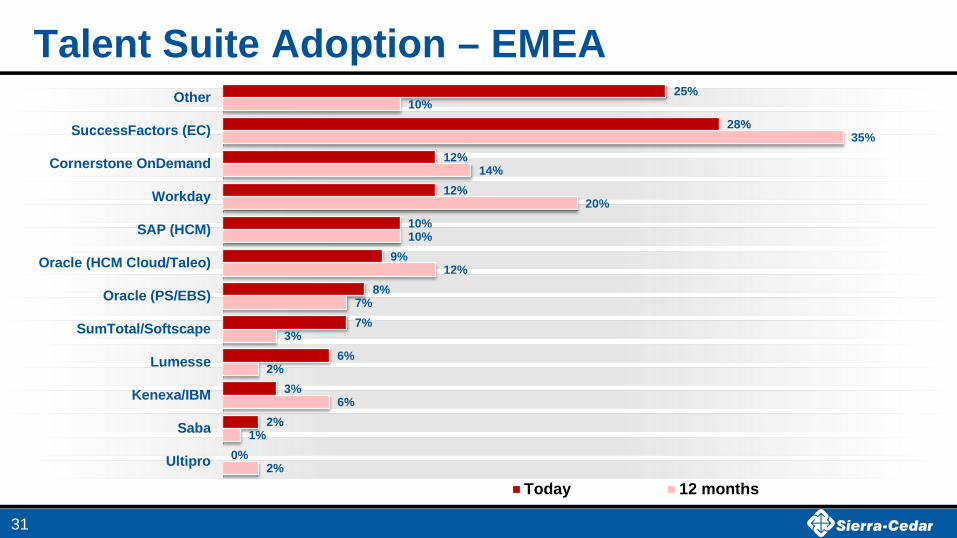
Talent Suite Adoption – EMEA
31
2%
1%
6%
2%
3%
7%
12%
10%
20%
14%
35%
10%
0%
2%
3%
6%
7%
8%
9%
10%
12%
12%
28%
25%
Ultipro
Saba
Kenexa/IBM
Lumesse
SumTotal/Softscape
Oracle (PS/EBS)
Oracle (HCM Cloud/Taleo)
SAP (HCM)
Workday
Cornerstone OnDemand
SuccessFactors (EC)
Other
Today 12 months

HRMS Vendor Satisfaction and User Experience Cloud Solutions Take the Lead, but No One Exceeds Expectations
32
Vend
or S
atis
fact
ion
User Experience
Workday
Ceridian DF
UltiPro
SuccessFactors (EC)
Oracle (HCM C)
SilkRoad
Kronos
Dissatisfied
Poor Good
Satisfied
Oracle PS
ADP (WN)
Infor/ Lawson
SAP (HCM)
Oracle EBS
Ceridian HR
ADP (Vantage)
ADP GV/E
Very Satisfied
Excellent

ITM Vendor Satisfaction and User Experience Talent Suites Achieve Highest Scores, but Overall TM Satisfaction is Lower
33
Vend
or S
atis
fact
ion
User Experience
Dissatisfied
Poor Good
Satisfied
Very Satisfied
Excellent
Workday
UltiPro SuccessFactors (EC)
Oracle Cloud
SilkRoad Oracle PS ADP (WN)
SAP (HCM)
Ceridian DF
ADP (Vantage)
N/A
PeopleFluent
CSOD
Kenexa/ IBM
Saba
Halogen

High and Low Vendor Satisfaction Drivers Out of 13 Choices the Same Issues Showed up on both Charts
34
27% 33% 35% 36% 37%
Ease ofUpgrade
GoodRelationship
UserExperience
Service &Support
Best PracticeFunctionality
Top Benefits Correlated with High Vendor Satisfaction
26% 27% 35% 36%
47%
High Costs Lack ofInnovation
Services &Support
PoorRelationship
Poor UserExperience
Top Challenges Correlated with Low Vendor Satisfaction

45%
14%
38%
8%
9%
41%
14%
41%
10%
9%
Licensed software – on premise
Licensed software – hosted
SaaS – subscription-based
Fully Outsourced
Co-Outsourced
Payroll Application Deployment Plans
Today12 Months
Payroll Deployment Models
35
n = 700+ * Note these include combination environments
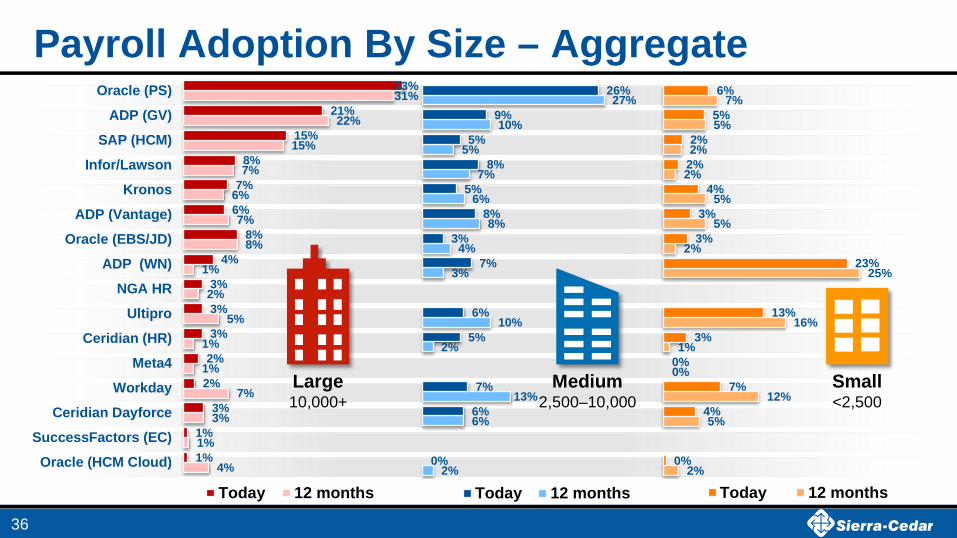
Payroll Adoption By Size – Aggregate
36
4%
1%
3%
7%
1%
1%
5%
2%
1%
8%
7%
6%
7%
15%
22%
31%
1%
1%
3%
2%
2%
3%
3%
3%
4%
8%
6%
7%
8%
15%
21%
33%
Oracle (HCM Cloud)
SuccessFactors (EC)
Ceridian Dayforce
Workday
Meta4
Ceridian (HR)
Ultipro
NGA HR
ADP (WN)
Oracle (EBS/JD)
ADP (Vantage)
Kronos
Infor/Lawson
SAP (HCM)
ADP (GV)
Oracle (PS)
Today 12 months2%
6%
13%
2%
10%
3%
4%
8%
6%
7%
5%
10%
27%
0%
6%
7%
5%
6%
7%
3%
8%
5%
8%
5%
9%
26%
Today 12 months2%
5%
12%
0%
1%
16%
25%
2%
5%
5%
2%
2%
5%
7%
0%
4%
7%
0%
3%
13%
23%
3%
3%
4%
2%
2%
5%
6%
Today 12 months
Large 10,000+
Small <2,500
Medium 2,500–10,000

Payroll Adoption – EMEA
37
8% 2% 2%
6% 2% 2%
3% 7%
2% 3%
4% 6% 6%
12% 9%
15% 26%
0% 1%
0% 1% 1%
2% 2%
8% 4% 4%
2% 6% 6%
9% 10%
16% 23%
Oracle (HCM Cloud)SuccessFactors (EC)
WorkdayCeridian Dayforce
Aggregators (Celegro,…Raet
Oracle (EBS/JD)CeridianHR
HR BPOMeta4
UltiproADP (Vantage)
NGA HRADP (WN)
Oracle (PS)ADP (GV)
SAP (HCM)
Today 12 months
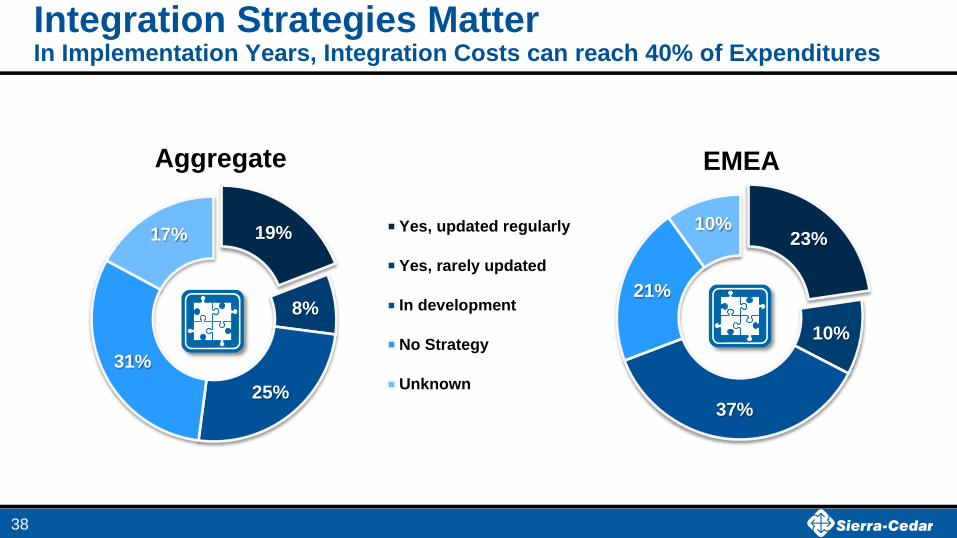
19%
8%
25% 31%
17%
Aggregate
Yes, updated regularly
Yes, rarely updated
In development
No Strategy
Unknown
Integration Strategies Matter In Implementation Years, Integration Costs can reach 40% of Expenditures
38
23%
10%
37%
21%
10%
EMEA

Current Approach to Integration
39
6%
4%
8%
17%
22%
43%
None
Other
Integrationplatform
Into TM Suite
Into core HR
Case by Case
Aggregate
45% Spend between 10% to
25% of their HR Technology budgets on
Integration
6%
4%
8%
17%
28%
41%
None
Other
Integrationplatform
Into TM Suite
Into core HR
Case by Case
EMEA
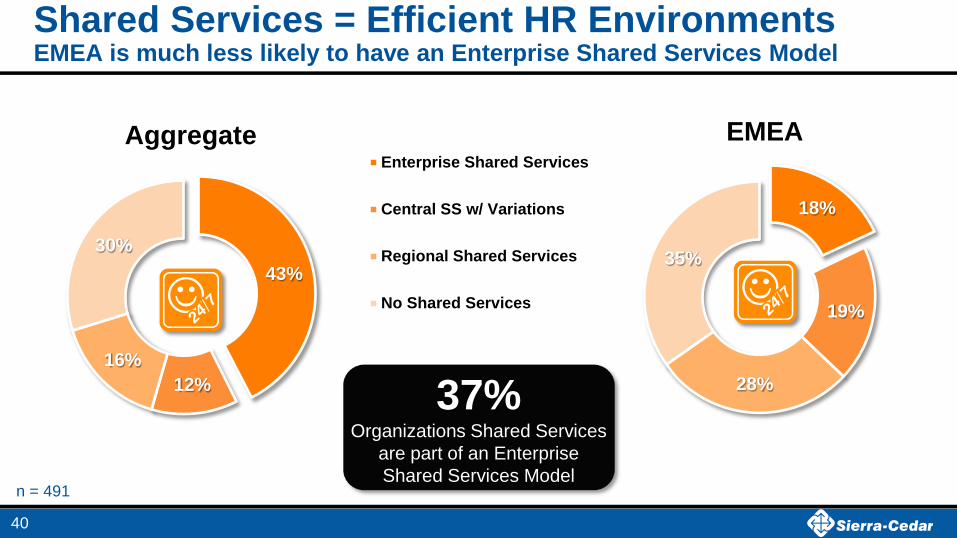
Shared Services = Efficient HR Environments EMEA is much less likely to have an Enterprise Shared Services Model
43%
12% 16%
30%
Aggregate Enterprise Shared Services
Central SS w/ Variations
Regional Shared Services
No Shared Services
40
n = 491
18%
19%
28%
35%
EMEA
37% Organizations Shared Services
are part of an Enterprise Shared Services Model

Functions Included in HR Shared Services
78%
83%
85%
Payroll
Benefits Admin
HR RecordsAdministrative Functions
18%
65%
66%
Labor Sched
Time &Attendance
Absence/LeaveWFM Functions
24%
26%
45%
55%
56%
61%
66%
Career Dev
Succession Plng
Learning
Performance Mgmt
Onboarding
Recruiting
Compensation
Talent Functions
17%
33%
46%
Workforce Plng
HR Analytics
Data privacyData and Intelligence Functions
41

Data Privacy & Protection Maturity
42
2%
36%
52%
7% 4%
EMEA
6%
40%
39%
11% 4%
Aggregate
Transformational
Effective
Efficient
No process/Manual
Don't know
EMEA Organizations Report Less Confidence in their Data Privacy Process

No or Low Tech
336
Value of Service Delivery Technologies
*With Self Service: Employee and manager self service applications serve 60% or more of employees and 50% or more of manager populations
18%
51%
Employees Served by HR Administrative Headcount
43
With Self Service*
396
With Mobile
With Self Service*, and Help Desk
507

Business Intelligence/HR Analytics
10% 23% 24% 27% 31%
43% 48%
98%
DedicatedHR/BI
Solutions
BIVisualization
Tools
StatisticalTools
Emb TMAnalytics
Emb WFMAnalytics
Emb HRMSAnalytics
Platform BISolution
MicrosoftExcel
If They have BI/HR Analytics Solution, What is in Use?
39% of Organizations are doing
some form of BI/HR Analytics with one of these tools
Embedded Solutions have Doubled in
Adoption from last year
n = 630
44

Mobile-enabled HR Process Adoption Mobile Adoption Grew 90% From Last Year, 65% Growth Planned Next Year
13% 23%
38%
Average workforce adoption across all mobile-enabled processes
Last Year Today In 12 Months
45
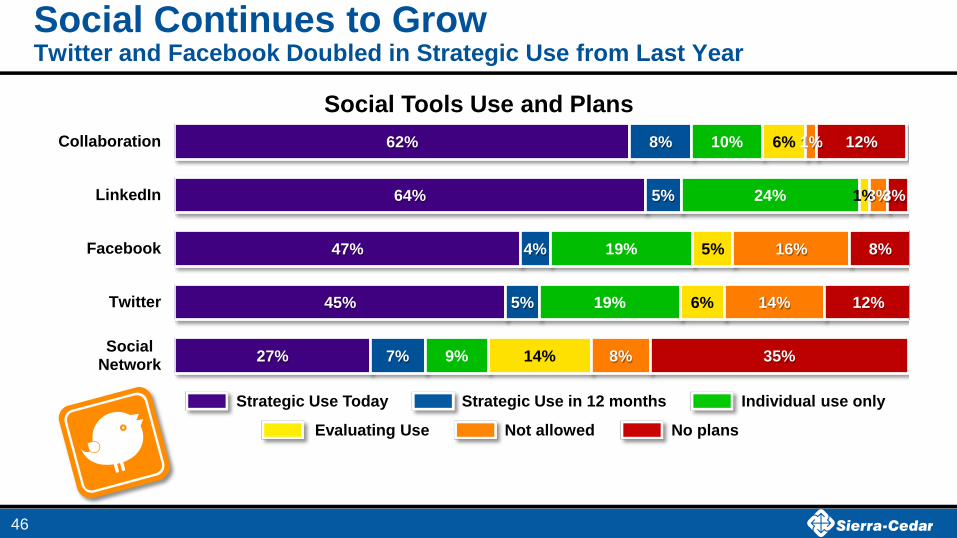
Social Continues to Grow Twitter and Facebook Doubled in Strategic Use from Last Year
27%
45%
47%
64%
62%
7%
5%
4%
5%
8%
9%
19%
19%
24%
10%
14%
6%
5%
1%
6%
8%
14%
16%
3%
1%
35%
12%
8%
3%
12%
SocialNetwork
Collaboration
Social Tools Use and Plans
Strategic Use in 12 months
No plans Not allowed Evaluating Use
Strategic Use Today Individual use only
46
47

Emerging Technologies Align with your HR Strategies and Desired Business Outcomes
Workforce Using
Today Evaluating No Plans
Employee Feedback applications 65% 11% 24%
Wearable technology 10% 6% 84%
Rewards & Recognition applications 25% 15% 60%
Wearables 55% of organizations using
wearables believe the benefit will be “increased workforce
productivity.”
48

Emerging Technology Exploring the Explosion of Talent Acquisition Tools
30%
38%
41%
43%
45%
45%
50%
31%
26%
31%
38%
24%
28%
24%
38%
36%
28%
19%
31%
26%
26%
Marketing campaign management tools
Video screening/interviewing
Social searching and matching tools
Candidate/Talent Pool tools
Behavior assessments
Branding tools/applications
Employee referral applications
No plans Evaluating In use today
49

Thank you!
50
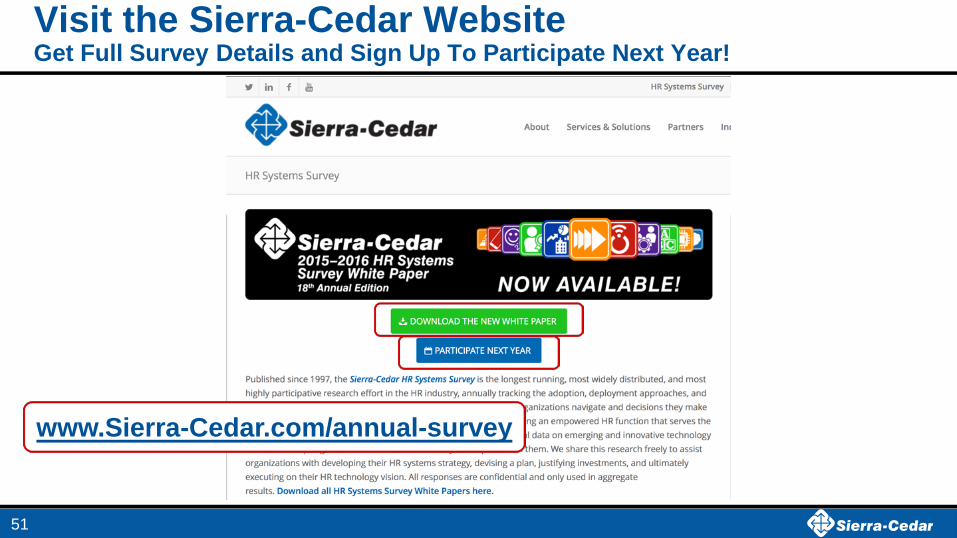
Visit the Sierra-Cedar Website Get Full Survey Details and Sign Up To Participate Next Year!
51
www.Sierra-Cedar.com/annual-survey