map the meal gap 2020 - feeding america
TRANSCRIPT

Map the Meal Gap 2020
A Report on County and Congressional District Food
Insecurity and County Food Cost in the United States in 2018

ForewordThis release of Map the Meal Gap represents the 10-year anniversary of our effort to understand food insecurity and food costs geographically. Our local estimates are based on the most recent available data from 2018 — a year with the lowest food insecurity rates in the U.S. since before the Great Recession of 2008. However, even in 2018, 37 million people lived in households without consistent access to adequate food.
In 2020, our nation faces a new crisis, the novel coronavirus (COVID-19) pandemic. We would be remiss if we did not acknowledge that this release comes during very trying times, as COVID-19 threatens lives and livelihoods globally. While public health measures have protected citizens’ health, they have adversely impacted many of our neighbors economically. Using the updated Map the Meal Gap model and projections of unemployment and poverty, we estimate that as many as 17 million more people may experience food insecurity due to COVID-19 in 2020. During this crisis, the charitable food system is even more critical to meeting the needs of families facing hunger.
The strength of Map the Meal Gap lies in its ability to initiate data-driven conversations, insights and actions across a broad spectrum of legislators, hunger-relief partners, academics and community organizations. The foundation it creates for evidence-based initiatives and strategies will be needed even more during the time of COVID-19 recovery. We will continue to develop, test, and expand creative hunger-relief initiatives to address domestic hunger.
Feeding America is deeply grateful to the Conagra Brands Foundation and Nielsen for supporting this study. On behalf of our network, hunger-relief partners and, most importantly, the neighbors we serve, thank you for your visionary leadership.
Tom SummerfeltVice President, ResearchFeeding America

Acknowledgements & Credits
Technical Advisory Group of Feeding AmericaCraig Gundersen University of Illinois at Champaign-Urbana
Alison Jacknowitz American University School of Public Affairs
Robert Santos The Urban Institute
Hilary Seligman University of California San Francisco
Elaine Waxman The Urban Institute
We appreciate the contributions of the following people for their work on Map the Meal Gap 2020.Craig Gundersen, Lead Researcher University of Illinois at Champaign-Urbana
Adam Dewey, Co-Investigator Feeding America
Emily Engelhard, Co-Investigator Feeding America
Mark Strayer, Co-Investigator Feeding America
Lauren Lapinski, Co-Investigator Feeding America
Brian Odeen Nielsen
Mitch Kriss Nielsen
Patricia Ratulangi Nielsen
Andrea Bertels Nielsen
Christina Hartman Nielsen
Feeding America National Office Staff Corey Malone-SmollaFrances PanganibanSarah PetittHanna SelekmanAsh SlupskiTom SummerfeltZuani VillarrealRenee VuillaumeKelli WalkerStephanie Zidek
Bria M. BergerTheresa DelVecchio Dys Lauren Draftz David DuguidScott FerryAngela GallagherKesha GreenMonica HakeJulie HilversMelissa IbanezMollie Koplin
Research for Map the Meal Gap 2020 was generously supported by the Conagra Brands Foundation and Nielsen. Feeding America would also like to thank Futureman Digital and Column Five for their technical assistance. For more information about Feeding America, please visit www.FeedingAmerica.org

Executive Summary
$3.09 is what a person who is food secure is likely to spend per meal. Meal costs are nearly twice this amount in some counties.
$19.5B needed by individuals at risk of hunger to purchase just enough food to meet their needs.
4-30% is the range of the population experiencing food insecurity across US counties. No county is free of food insecurity.
4-14%
15-19%
20-24%
25-29%
30%+
As of 2018, the prevalence of food insecurity in the United States finally declined to levels not seen since before the Great Recession began in 2007. However, millions of people continued to struggle. The USDA estimates that 37 million people, including more than 11 million children, in the United States were food insecure in 2018.1 That means 1 in 9 individuals (11.5%) and 1 in 7 children (15.2%) lived in households without consistent access to adequate food.
In 2020, the novel coronavirus (COVID-19) pandemic threatens the lives and livelihoods of people across the country. Closures and social distancing orders that limit the spread of the disease have impacted communities large and small. The economic ramifications are felt by individuals already at risk of hunger, such as those who have lost their jobs due to the pandemic. The pandemic will likely reverse the improvements to food insecurity that have occurred over the past decade.
For the tenth consecutive year, Feeding America conducted the Map the Meal Gap study to improve our understanding of how food insecurity and food costs vary at the local level. This year Map the Meal Gap uses an updated methodology and is released with a companion study on the potential impact of COVID-19 on food insecurity at the local level utilizing the underlying Map the Meal Gap model. To better assess the current and future state of local food insecurity, it is critical to understand the prevalence prior to the pandemic. By examining variations in local need as of 2018, communities can develop more targeted strategies to reach people at risk of hunger today.
Prevalence of Food Insecurity by County, 2018
2020
1/3 people who are food insecure may not qualify for federal food assistance.
Key Findings
High Food Insecurity counties are the counties with the top 10% of food insecurity rates.
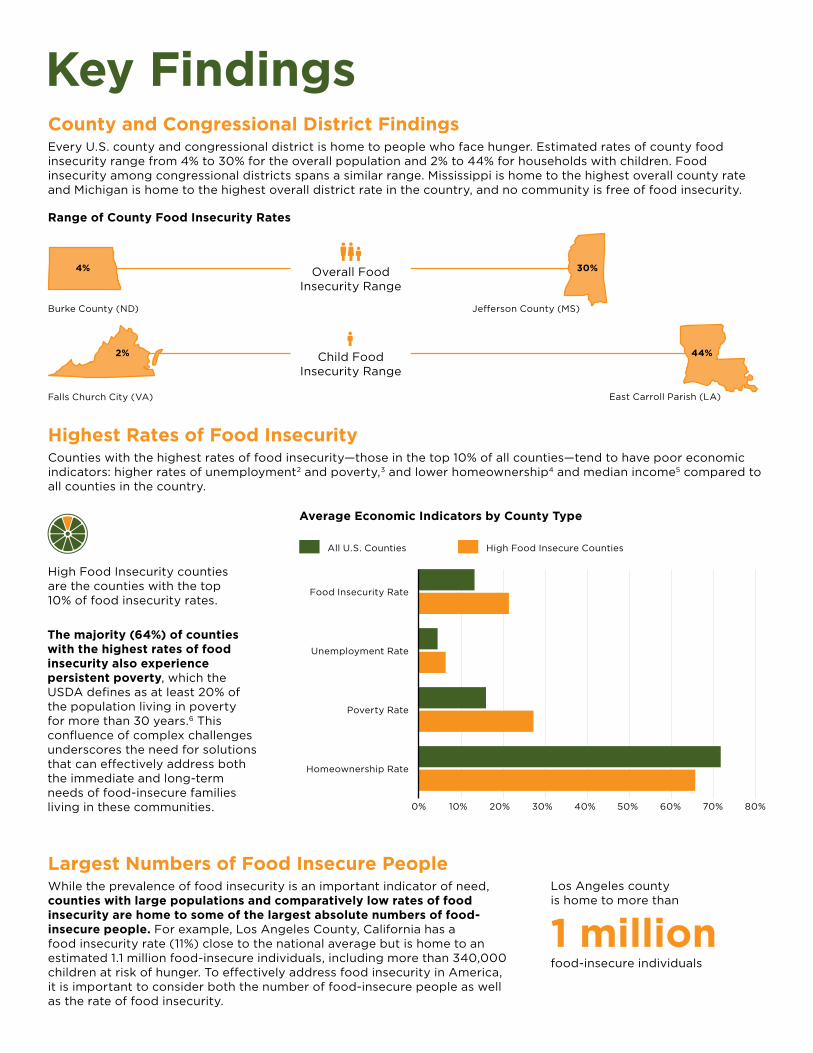
County and Congressional District FindingsEvery U.S. county and congressional district is home to people who face hunger. Estimated rates of county food insecurity range from 4% to 30% for the overall population and 2% to 44% for households with children. Food insecurity among congressional districts spans a similar range. Mississippi is home to the highest overall county rate and Michigan is home to the highest overall district rate in the country, and no community is free of food insecurity.
Range of County Food Insecurity Rates
Highest Rates of Food InsecurityCounties with the highest rates of food insecurity—those in the top 10% of all counties—tend to have poor economic indicators: higher rates of unemployment2 and poverty,3 and lower homeownership4 and median income5 compared to all counties in the country.
Largest Numbers of Food Insecure PeopleWhile the prevalence of food insecurity is an important indicator of need, counties with large populations and comparatively low rates of food insecurity are home to some of the largest absolute numbers of food-insecure people. For example, Los Angeles County, California has a food insecurity rate (11%) close to the national average but is home to an estimated 1.1 million food-insecure individuals, including more than 340,000 children at risk of hunger. To effectively address food insecurity in America, it is important to consider both the number of food-insecure people as well as the rate of food insecurity.
Burke County (ND) Jefferson County (MS)
Overall Food Insecurity Range
4% 30%
All U.S. Counties High Food Insecure Counties
Food Insecurity Rate
Unemployment Rate
Poverty Rate
Homeownership Rate
Average Economic Indicators by County Type
0% 10% 20% 30% 40% 50% 60% 70% 80%
The majority (64%) of counties with the highest rates of food insecurity also experience persistent poverty, which the USDA defines as at least 20% of the population living in poverty for more than 30 years.6 This confluence of complex challenges underscores the need for solutions that can effectively address both the immediate and long-term needs of food-insecure families living in these communities.
Los Angeles county is home to more than
1 millionfood-insecure individuals
Falls Church City (VA) East Carroll Parish (LA)
Child Food Insecurity Range
44%2%

However, with average meal costs nearly twice as high as the national average ($3.09) in some areas like New York County, the additional burden of high food prices can make it difficult for food-insecure householdsto make ends meet. This is especially true if they also struggle to afford housing, utilities, transportation and other basic necessities.
Rural South0% 0%
20% 20%
40% 40%
60% 60%
80% 80%
100% 100%
Urban Midwest West Northeast
Rural and Regional Demographics of Food Insecurity Rural (nonmetropolitan) counties make up 63% of all U.S. counties but 87% of counties with the highest rates of food insecurity. Regionally, the highest average rates of county food insecurity are found in the South, which represents 84% of counties with the highest rates of food insecurity and has the widest variation in county food insecurity. The lowest average food insecurity rates are in the Northeast.
Rural/Urban Region
87%rural
84%in the South
Highest Food–Insecure Counties are
Many Southern counties located outside major metropolitan areas are home to large communities of color living at elevated risk of food insecurity. These communities face persistently high rates of unemployment and poverty. For example, the population of Jefferson County, Mississippi, is 86% African American, faces an unemployment rate that is three times the national county average (13% versus 4%), and struggles with poverty at a rate that is almost three times that among all counties (50% versus 16%). As a result, the local rate of food insecurity is the highest in the nation (30%). County-level analysis also helps illuminate the obstacles faced by reservation communities,7,8 such as Apache County, Arizona, which includes parts of the Navajo Nation, Zuni and Fort Apache reservations. A persistent-poverty county with poverty (35%) more than twice the national county average and food insecurity (23%) nearly twice the national county average. These examples underscore the deep and pervasive nature of the systemic challenges that many communities of color face.
Food Budget Shortfall and Average Meal CostsIn total, food-insecure individuals across the United States needed an additional $19.5 billion (in 2018 dollars) to meet their food budget needs. This resource gap, or national food budget shortfall, is an annualized approximation of need as reported on the Current Population Survey (CPS) by people who are food insecure. It reflects the average additional amount of money per week that a food-insecure person is likely to spend on just enough food to meet their needs. After accounting for inflation, the weekly shortfall ($17.24) decreased for the third year in a row in 2018 after rising for four consecutive years.
$19.5BFood Budget Shortfall37 Million
Food Insecure Persons (USDA)
52 Weeks
7 Months (USDA)
$17.24 Weekly Food Budget Shortfall
(CPS)
$64.89 Spent Per Week
(CPS)
21 Meals (3 Meals Per Day, 7 Days Per Week)
$3.09Average Cost Per Meal
All U.S. Counties High Food Insecure Counties

Implications
Map the Meal Gap Methodology To accurately estimate the number of people experiencing food insecurity in every U.S. county and congressional district, Map the Meal Gap uses publicly available state and local data from the U.S. Census Bureau and Bureau of Labor Statistics on factors that research has shown to contribute to food insecurity. These factors include unemployment and poverty as well as other socioeconomic and demographic characteristics. Beginning in 2020, the estimates also account for disability status, one of the key risk factors for food insecurity. In addition to measuring how pervasive the need is, the study also estimates the cost of a meal and the additional amount of dollars needed among people who are food insecure using local data from Nielsen and national survey data from the Census Bureau. More information on methodology is available online in our technical brief. Findings from Map the Meal Gap are presented in a series of four standalone briefs including this executive summary, child food insecurity, food price variation, and an analysis of health, disability and food insecurity. Additionally, the interactive map allows for the exploration of food insecurity across geographies throughout the U.S.
SNAP
Government Programs like School Meal Programs and WIC
49%of individuals
Below 130% of Poverty Monthly income of $2,838 or less for a family of four
19%of individuals
130% to 185% of Poverty
Monthly income of $2,838 - $4,039 for a family of four
32%of individuals
At or Above 185% of Poverty
Monthly income of $4,039 or more for a family of four
Share of Food-Insecure Individuals by Income Thresholds10
Federal Assistance
Charitable Response
Map the Meal Gap focuses on equipping communities, service providers and policymakers with data and analytical tools to help them understand the prevalence and dynamics of food insecurity at the local level so they may better respond to the need. Federal nutrition assistance programs, such as the Supplemental Nutrition Assistance Program (SNAP), serve as the first line of defense against hunger. However, not everyone who is food insecure qualifies for these federal programs. As of 2018, one in three (32%) food-insecure individuals who reported income lived in households unlikely to qualify for most federal food assistance.9 Given the variation in food insecurity and income and asset limits for certain programs across states, data from Map the Meal Gap indicate that the share of food-insecure individuals not eligible for public food assistance is as high as 76% in some places, such as Daggett County, Utah. As a result, the charitable sector may be a critical source of food for many individuals and families who are food insecure but ineligible for these programs. These findings underscore the importance of protecting and strengthening the existing safety net of public food assistance while also investing in the charitable programs that help to fill the gap for those not eligible.
1/3 people who are food insecure may not qualify for federal food assistance.

50states and D.C. are home to food–insecure children.
86%of counties with high child food insecurity are rural.
660,000children may be food insecure in Los Angeles and New York City.
11.2 million-or-
Child Food Insecurity
Child Food Insecurity Among States and Congressional DistrictsIn all 50 states and Washington, D.C., the estimated rate of child food insecurity is higher than the rate of overall food insecurity. Child food insecurity ranges from 10% in North Dakota to 25% in Louisiana. Eighty percent of the counties with the highest rates of food insecurity are in the South, and 55% of Southern counties have child food insecurity rates greater than 21%. Among congressional districts, rates of child food insecurity span from 5% (more than 12,000 children) in affluent districts like Virginia’s 10th, bordering Washington, D.C., to a high of 31% (more than 45,000 children) in Alabama’s 7th, which encompasses parts of Birmingham, Montgomery and Tuscaloosa.
Key Findings
Food insecurity has the potential to be harmful to individuals of any age, but it can be especially devastating to children. The USDA estimates that more than 11 million children in the United States lived in food-insecure households 2018.1 That means that 1 in 7 children (15.2%) may not have consistent access to enough food for an active, healthy life.
For the tenth consecutive year, Feeding America conducted the Map the Meal Gap study to improve our understanding of how food insecurity and food costs vary at the local level. This year Map the Meal Gap uses an updated methodology and is released with a companion study on the potential impact of COVID-19 on child food insecurity at the local level utilizing the underlying Map the Meal Gap model. Included here are findings related to food insecurity among children, one of four related topics that make up the Map the Meal Gap 2020 report briefs.
<10%
10-13%
14-17%
18-21%
21%+
2020
1/7children are at risk of hunger.

Child Food Insecurity Rates by StatePercentage
(of Food-Insecure Children)Number
(of Food-Insecure Children)
LA
* USDA, 2019
24.6%
23.8%
23.1%
23.1%
23.0%
21.8%
21.6%
20.3%
19.5%
19.4%
19.3%
19.1%
19.1%
19.0%
19.0%
18.9%
18.9%
18.4%
18.4%
18.1%
17.8%
17.7%
17.5%
16.9%
16.7%
16.5%
16.2%
16.2%
16.1%
16.0%
16.0%
15.9%
15.9%
15.2%
15.2%
15.2%
15.1%
14.7%
14.7%
14.1%
13.9%
13.3%
12.7%
12.6%
12.5%
12.4%
12.2%
12.1%
11.3%
10.1%
9.6%
NM
AL
AR
MS
OK
TX
WV
NV
FL
NC
DC
ME
AZ
DE
KY
OH
HI
KS
AL
RI
TN
IN
NY
NE
SD
GA
SC
MD
CT
OR
MT
WY
CA
MO
VT
PA
MI
WA
WI
IA
NH
IL
ID
VA
MN
CO
UT
NJ
MA
ND
269,650
114,180
251,800
162,270
162,150
208,110
1,598,940
73,770
134,350
819,370
443,040
24,280
47,460
311,390
38,680
190,600
489,160
55,710
129,780
33,200
36,270
267,110
274,080
685,500
79,310
35,330
405,380
178,710
216,070
117,660
139,220
36,560
21,160
1,362,340
209,870
17,550
399,270
318,960
244,480
179,180
102,190
34,280
363,900
56,120
233,530
161,880
155,120
113,190
219,760
138,760
16,700
15.2% | 11,174,000
U.S.*

Child Food Insecurity Among CountiesJust as every state is home to food-insecure children, no county is free of child food insecurity. Rates range from 2% in Falls Church City, Virginia to 44% in East Carroll Parish, Louisiana. The variation in rates of child food insecurity shows that need is more pervasive in specific communities. Counties with the highest rates of child food insecurity have notably higher unemployment and poverty rates and lower median incomes.
Higher unemployment
29% of children are food insecure
Higher poverty
Lower median income
Although the child food insecurity rate is one important indicator of need, even counties with more modest rates may still be home to large numbers of children whose families are food insecure. For example, the counties encompassing Los Angeles and New York City have rates of child food insecurity (15% and 18%, respectively) close to the national county average (16%). However, there is high need in both areas: more than 342,000 food-insecure children live in Los Angeles County and more than 317,000 food-insecure children live in the counties encompassing the five boroughs of New York City. Both urban and rural counties face unique challenges with food insecurity.
Nu
mb
er o
f F
oo
d-I
nse
cure
Ch
ildre
n Percen
tage o
f Fo
od
-Insecu
re Ch
ildren
Counties with more than 100,000 Food-Insecure Children
342,250
15.2%
262,790
21.2%
179,720
17.2%
145,120
21.1%
138,410
11.9%
117,820
19.6%
107,160
19.8%
100,000
20.0%
400,000
300,000
200,000
100,000
0
100%
75%
50%
25%
0%
CA
, Lo
s A
ng
eles
TX
, Har
ris
(Ho
ust
on)
AZ
, Mar
ico
pa
(Ph
oen
ix)
TX
, Dal
las
IL, C
oo
k (C
hic
ago)
NY
, Kin
gs
Co
unt
y
TX
, Tar
rant
(F
t. W
ort
h)
TX
, Bex
ar (
San
Ant
on
io)
Falls Church City (VA) East Carroll Parish (LA)
High Child Food Insecurity counties are the counties with the top 10% of child food insecurity rates.
Child Food Insecurity Range
44%2%

Implications of Child Food Insecurity
Free and reduced-price lunch
17 million childrenSNAP23
22 million childrenNational School Lunch Program
12.5 million childrenSchool Breakfast Program
5.2 million infants and childrenWomen, Infants, and Children (WIC)
3.7 million childrenSummer Food Service Program
+ Seamless Summer Option
Map the Meal Gap Methodology To accurately estimate the number of people experiencing food insecurity in every U.S. county and congressional district, Map the Meal Gap uses publicly available state and local data from the U.S. Census Bureau and Bureau of Labor Statistics on factors that research has shown to contribute to food insecurity. These factors include unemployment and poverty as well as other socioeconomic and demographic characteristics. Beginning in 2020, the estimates also account for disability status, one of the key risk factors for food insecurity. In addition to measuring how pervasive the need is, the study also estimates the cost of a meal and the additional amount of dollars needed among people who are food insecure using local data from Nielsen and national survey data from the Census Bureau. More information on methodology is available online in our technical brief.
Map the Meal Gap 2020 also features report briefs on other topics, including an executive summary, an overview of food price variations, and an analysis of health, disability and food insecurity. Additionally, the interactive map allows for the exploration of food insecurity across geographies throughout the U.S.
Federal Nutrition Programs Federal School Nutrition Programs24
The consequences and costs of food insecurity for all ages make addressing the issue an economic and social imperative. In particular, inadequate nutrition can stunt children’s development, affecting their learning and social interaction.2
Health, Behavior and EducationThere is a broad base of literature illustrating links between food insecurity and poor child health and behavioral outcomes at every age. For example, food-insecure women are more likely to experience birth complications than food-secure women3 and have iron deficiencies.4 One indicator of child and maternal health is low birthweight among infants,5 which is more common among counties with the highest rates of child food insecurity than across all counties (10% versus 8%). Furthermore, children struggling with food insecurity may be at greater risk for stunted development,6 anemia and asthma,7,8 oral health problems,9 hospitalization,10 mental disorders,11 and lower nutrient intakes.12,13 Overall, food insecurity is linked with poorer physical quality of life, which may prevent children from fully engaging in daily activities.14 At school, food-insecure children are at increased risk of falling behind their food-secure peers both academically and socially; food insecurity is linked to lower grades15 and non-cognitive skills,16 and they may be more likely to exhibit behavioral problems,17,18 including anxiety,19 psychological distress20 and substance use21 and to experience bullying.22
Policy and ProgramsWhile charitable assistance plays a critical role in helping families meet their food needs, federal nutrition programs are the first line of defense against hunger.
Some families in need of public support, however, face challenges maintaining consistent enrollment while others may not even qualify for federal assistance. One in four food-insecure children lives in a home that is likely ineligible for these important programs, underscoring the critical role of both the public and private sector in addressing child food insecurity.25 Together, these programs weave a comprehensive nutritional safety net that reaches children where they live, learn and play. Through collaborative efforts between the Feeding America network of food banks and partner agencies, policymakers, business leaders, community activists, and concerned citizens, every child in America could receive the nutrition they need.
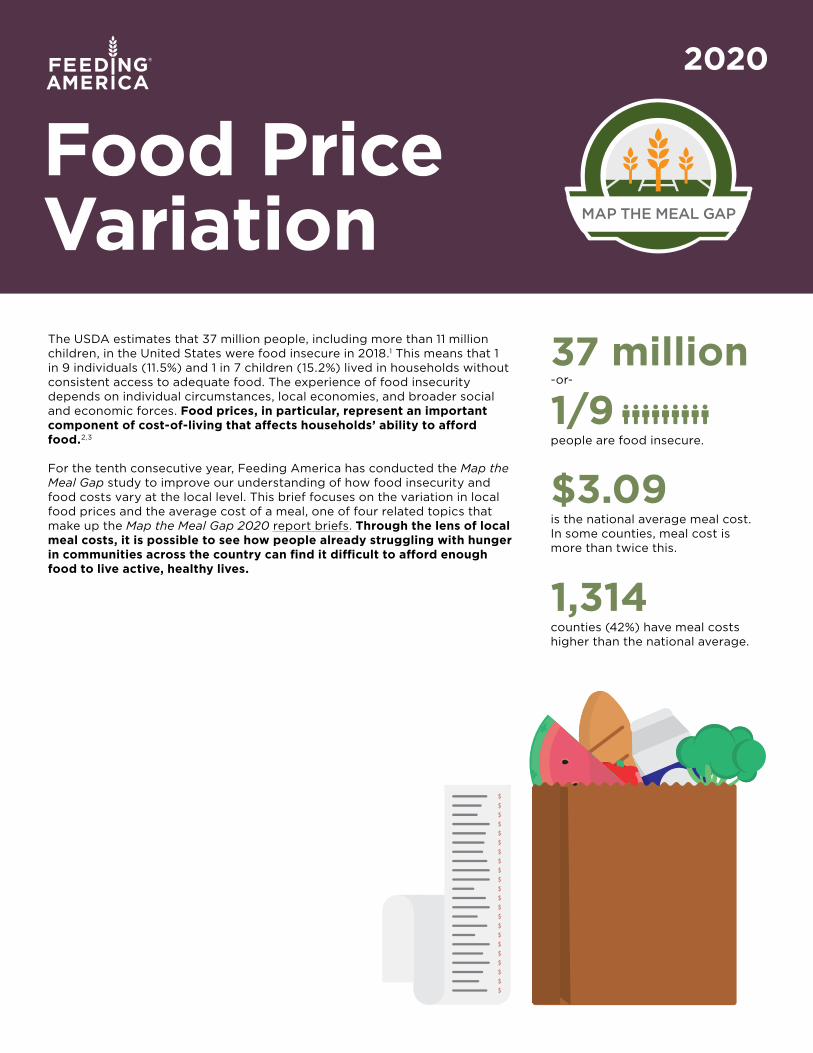
Food Price VariationThe USDA estimates that 37 million people, including more than 11 million children, in the United States were food insecure in 2018.1 This means that 1 in 9 individuals (11.5%) and 1 in 7 children (15.2%) lived in households without consistent access to adequate food. The experience of food insecurity depends on individual circumstances, local economies, and broader social and economic forces. Food prices, in particular, represent an important component of cost-of-living that affects households’ ability to afford food.2,3
For the tenth consecutive year, Feeding America has conducted the Map the Meal Gap study to improve our understanding of how food insecurity and food costs vary at the local level. This brief focuses on the variation in local food prices and the average cost of a meal, one of four related topics that make up the Map the Meal Gap 2020 report briefs. Through the lens of local meal costs, it is possible to see how people already struggling with hunger in communities across the country can find it difficult to afford enough food to live active, healthy lives.
1,314 counties (42%) have meal costs higher than the national average.
2020
$3.09 is the national average meal cost. In some counties, meal cost is more than twice this.
1/9people are food insecure.
37 million-or-

County-Level Food CostsIn 2018, people who were food secure reported spending an average of $3.09 per meal which, when accounting for inflation, is roughly equivalent to the average reported in 2017. At the local level, meal costs range from $2.14 in Llano County, Texas to more than twice the national average in places like New York County at $6.19. This means that $1 in Llano County purchases 44% more food than the national average and 189% more than in New York County.
At $3.09 per meal, a person who is food secure is estimated to spend $281 on food per month. In New York County that person is likely to pay $563 for the same amount of food, a grocery bill that would cover enough food for almost three months in Llano County. A family of four with two young children is estimated to spend $1,122 per month in New York County to buy the minimum amount of food for a nutritious diet.4 This is considerably more than the national average ($561) and what that same family would spend in Llano County ($387).
Key Findings
$563New York
Cost of Food per Month
$195Llano County
$281U.S. Average
$3.39 Average
Meal Cost
$3.41Average
Meal Cost
The Northeast and West regions represent:
21%of all counties
67%of counties with the highest cost per meal
Cost per Meal(Based on local food prices)
91Meals per Month
Most counties with the highest meal costs (58%) are part of populous metropolitan areas. Due in part to population density, urban counties with high meal costs are also home to large numbers of people who are food insecure. An estimated 8.7 million people are at risk of hunger in these high-cost urban communities.
In some cases, the meal cost may be high due in part to the expense of transporting food to a resort area or an island. For example, Nantucket County, Massachusetts is a popular island vacation destination, and the average cost of a meal is $3.80. Aspen in Pitkin County, Colorado and Napa County, California also have a significant tourist presence and higher than average meal costs ($3.66 and $4.38, respectively). While local families in such areas typically have higher-than-average median incomes, these communities are also home to households with lower incomes for whom higher food costs can be particularly challenging.
Counties with High Food CostsThe top 10% of counties with the highest food prices have an average meal cost 22% higher than the national average ($3.76 versus $3.09). While there are pockets of communities across the country with high meal costs, counties with the highest estimated costs are regionally concentrated. The Northeast ($3.41) and West ($3.39) have a disproportionately high share of these high-cost counties. These two regions account for just 21% of all counties, but 67% of counties with the highest cost per meal. The South and Midwest have lower than average meal costs ($3.02 and $2.99, respectively) and relatively fewer counties in the top 10%.

High Food Cost and High Food Insecurity For a family struggling to afford housing, utilities, transportation and other basic necessities, the additional burden of high food prices can have a significant impact on their household budget. Five counties fall into the top 10% for both food insecurity and meal cost. An average of one in every five individuals in these counties is food insecure, totaling more than 187,000 food-insecure people who live in areas with some of the highest meal costs. Although, these counties may not face the highest food prices in the nation, the average cost per meal of $3.55 is still 15% higher than the national average. Three of the five counties are in the South and four have persistent poverty.5 Four of the five counties have higher-than-average unemployment rates6 and below average homeownership rates,7 and all five have higher-than-average poverty rates.8
Top 10% of counties with highest food
insecurity
18%-30% food insecurity
Top 10% of counties with highest
food cost
$3.45-$6.96
Orleans, LA
Todd, SD
Baltimore, MD
0% 20% 40% 60% 80%
Homeownership RatePoverty RateUnemployment Rate
Top 10% of Counties by Meal Cost All Counties
Homeownership Rate0%
20%
40%
60%
80%
69% 71%
Households Experiencing Rental Burden
44%48%
High Food Cost and Housing High meal costs can force food-insecure households to make tradeoffs that in turn make it difficult to invest in their long-term economic success. They may even force families to choose between buying food and paying for housing. Compared to all counties, those with the highest meal costs tend to have lower rates of homeownership, higher rent, and a higher rental burden—which occurs when a household pays 30% or more of their income on rent.7
Holmes, FL
Mellette, SD

Gre
at R
eces
sio
n
Studying local food insecurity in the context of average meal costs illustrates just how much variation there is in both the prevalence of need and the price of food across the country. The cost per meal measure discussed here reflects the average amount of money that someone who is food secure is likely to spend on a single meal. It is also useful to consider reported need among people who are food insecure. An analysis of national survey data suggests that people at risk of hunger in 2018 report needing an additional $17.24 per week on average to buy just enough food to meet their needs. After adjusting for inflation, this food budget shortfall is slightly lower than the $16.99 reported in 2017 ($17.40 in 2018 dollars). When annualized across the 37 million people estimated to be food insecure, however, the national shortfall stands at nearly $19.5 billion as of 2018.
0%
4% $4
$0
8% $8
12% $12
16% $16
20% $20
Food Insecurity and Reported Need Since Great Recession
Individual Real Food Budget Shortfall Per Week ($)
Individual Food Insecurity Rate (%)
‘16‘15 ‘17 ‘18‘14‘13‘12‘11‘10‘09‘08‘07‘06‘05‘04‘03‘02
Map the Meal Gap Methodology To accurately estimate the number of people experiencing food insecurity in every U.S. county and congressional district, Map the Meal Gap uses publicly available state and local data from the U.S. Census Bureau and Bureau of Labor Statistics on factors that research has shown to contribute to food insecurity. These factors include unemployment and poverty as well as other socioeconomic and demographic characteristics. Beginning in 2020, the estimates also account for disability status, one of the key risk factors for food insecurity. In addition to measuring how pervasive the need is, the study also estimates the cost of a meal and the additional amount of dollars needed among people who are food insecure using local data from Nielsen and national survey data from the Census Bureau. More information on methodology is available online in our technical brief.
Map the Meal Gap 2020 also features report briefs on other topics, including an executive summary, an overview of child food insecurity, and an analysis of health, disability and food insecurity. Additionally, the interactive map allows for the exploration of food insecurity across geographies throughout the U.S.
$19.5Bnational annual food budget shortfall
When struggling to afford housing, utilities, transportation and other basic necessities, however, the additional burden of high food prices can have a significant impact on a family’s budget. For households at risk of hunger in certain parts of the country, high food prices can make it especially difficult to afford the food they need. This is a reality even for families who receive federal nutrition assistance benefits. The Supplemental Nutrition Assistance Program (SNAP), which served nearly 36 million people in 2019, is a key federal program that helps low-income households bolster their food budget10 and helps children and adults transition out of food insecurity.11 SNAP benefits, however, are not adjusted for higher cost of living except in Alaska and Hawaii, and even the maximum SNAP benefit falls short of covering the cost of a meal in 99% of U.S. counties.12 This resource gap can cause families in certain areas to experience higher rates of food insecurity. Recent research suggests that a weekly increase in SNAP benefits of $42 per household would lead to a 62% decline in national food insecurity rates.13
Implications

1/5people have a disability.
Health, Disability and Food InsecurityFood insecurity has been widely accepted as a key social determinant of health, recognizing that healthy bodies and minds require access to nutritious meals at every age. Inconsistent access to adequate amounts of nutritious food has a negative impact on the health of individuals at all ages. There is a growing body of literature that demonstrates that living with a disability is a key risk factor for food insecurity, adding another layer to our understanding of the dynamic relationship between food insecurity and health.1-8 The USDA estimates that as of 2018, 37 million people, including more than 11 million children, in the United States were food insecure.9 An analysis of county data on health indicators, disability prevalence, and food insecurity shows that communities with the highest rates of food insecurity face a higher prevalence for diseases and other measures that are tied to health. Additionally, communities with higher proportions of households with a member who is disabled often have higher rates of food insecurity. For the tenth consecutive year, Feeding America has conducted the Map the Meal Gap study to estimate the prevalence of food insecurity for every county and congressional district in the United States. The following focuses on the intersections between food insecurity, health outcomes and disability status at the local level and is one of four related topics that make up the Map the Meal Gap 2020 report briefs.
2020
37 million-or-
1/9people are food insecure.
1/7people have diabetes.
1/4report poor or fair health.
In counties with high food insecurity:

Food Insecurity and Disability Status by State, 2018
20%
15%
10%
5%
5% 10% 15% 20%
Fo
od
Inse
curi
ty P
reva
len
ce
(20
18 A
CS
ag
gre
gat
e o
f C
on
gre
ssio
nal
Dis
tric
ts)
Disability Prevalence(2018 American Community Survey [ACS])
The Impact of Disability on Food Insecurity In response to the growing body of research that demonstrates disability as a key risk factor for food insecurity, Map the Meal Gap estimates now account for disability status. This measure includes individuals that report any of the following disability types: hearing, visual, cognitive, ambulatory, self-care or independent living.10 States with a higher prevalence of individuals living with one or more disabilities also have higher rates of food insecurity.
The relationship between high rates of disability and high food insecurity is present in counties across the United States. The prevalence of individuals living with a disability ranges from less than 4% in Pitkin County, Colorado to nearly 34% in Breathitt County, Kentucky. In counties with the highest rates of disability, one in six individuals is food insecure, compared to the national average of one in nine individuals. These counties also have higher poverty and unemployment rates than the national average and median incomes 26% lower than the national average.
$60,000
25%
30%
$50,000
$40,00020%
$30,00015%
$10,000
$20,00010%
5%
$00%
All U.S. CountiesTop 10% Disability
Food Insecurity
Unemployment Rate
Poverty Rate
Median Income
18%
12%
5% 4%
21%
16%
$52K
$38K

The Cycle of Food Insecurity and HealthFood insecurity and poor health outcomes can create a vicious cycle.13 Food-insecure households are often forced to engage in coping strategies such as purchasing cheaper foods that are high in calories but low in nutritional value. Reliance on less healthy foods can lead to poor nutrition and chronic diet-related diseases such as diabetes.14 In turn, these chronic illnesses can worsen existing disabilities or other illnesses, resulting in higher health care costs15 and difficulty keeping a job or finding work.16 These challenges further restrict the household food budget, resulting in fewer resources being allocated to food.
Addressing food insecurity can lead to improved health outcomes for individuals residing in food-insecure households, and consequently lower health care costs throughout the country. Research using data from Map the Meal Gap finds that food insecurity is associated with higher health care costs across the United States and that these costs vary widely by geography.17 This suggests that policies and practices at the state and local level that improve food insecurity can also improve health and associated health care costs.
Food Insecurity and Health Implications at the County LevelA significant number of households served by the Feeding America network have members living with a chronic disease like diabetes (33% of households) or hypertension (58% of households) and are regularly confronted with these challenges to managing their health.11,12 Results from Map the Meal Gap show that counties with the highest rates of food insecurity also have a higher prevalence of diabetes and disability. Among counties whose estimated rate of food insecurity falls in the top 10% of all counties, one in seven individuals has a diabetes diagnosis, one in four report poor or fair health and one in five has some form of disability.
Key Findings
Health Indicators of Individuals in High Food Insecurity Counties Compared to All Counties
Food Insecurity
Diabetes
Report Poor or Fair Health
Disability19%
12% 17% 13%
18%
25%
13%
9% Average rates across all
counties
Food Insecurity
SpendingTradeoffs
Chronic Disease
Healthcare Expenditures
Difficulty Finding Work
Lower Household Income
Coping Strategies
High Food Insecurity counties are the counties with the top 10% of food insecurity rates.

Public and Charitable Food AssistanceThe Supplemental Nutrition Assistance Program (SNAP), the SNAP-Education (SNAP-Ed) and the Special Supplemental Nutrition Program for Women, Infants and Children (WIC) play a critical role in helping low-income families break out of the cycle of food insecurity and diet-related disease. Both SNAP and WIC augment households’ food budgets, allowing them to purchase more healthy foods; and WIC and SNAP-Ed provide nutrition education to participants as well. A 2013 review of SNAP-Ed found that it increased both consumption and willingness to consume fruits and vegetables among child participants.18 These programs, along with other federal nutrition programs that target specific populations, make up the front line of defense against food insecurity.
The charitable food system works to improve both food insecurity and health outcomes. The Feeding America network distributed 1.5 billion pounds of fresh fruits and vegetables in 2019. In addition to distributing nutritious food, food banks and food pantries have emerged as important partners in addressing diabetes outside of the healthcare setting. Building on a successful diabetes prevention pilot, Feeding America conducted a two-year randomized controlled trial to understand how food bank interventions can promote the health of food-insecure individuals living with diabetes. The trial demonstrated several positive results, including increased food security for participants. The intervention included diabetes appropriate food, nutrition education, blood sugar monitoring and referrals to primary care physicians.19 By joining together to help people struggling with hunger and diet-related disease, food banks and health care partners can have a greater impact on food insecurity and health in the United States.
Federal Food Assistance
Charitable Food Assistance
Healthy Choices
Improved Health Outcomes
Augmented Food Budget
Map the Meal Gap Methodology To accurately estimate the number of people experiencing food insecurity in every U.S. county and congressional district, Map the Meal Gap uses publicly available state and local data from the U.S. Census Bureau and Bureau of Labor Statistics on factors that research has shown to contribute to food insecurity. These factors include unemployment and poverty as well as other socioeconomic and demographic characteristics. Beginning in 2020, the estimates also account for disability status, one of the key risk factors for food insecurity. In addition to measuring how pervasive the need is, the study also estimates the cost of a meal and the additional amount of dollars needed among people who are food insecure using local data from Nielsen and national survey data from the Census Bureau. More information on methodology is available online in our technical brief.
Map the Meal Gap 2020 also features report briefs on other topics, including an executive summary, an overview of child food insecurity and an overview of food price variations. Additionally, the interactive map allows for the exploration of food insecurity across geographies throughout the U.S.

References
Executive Summary 1. United States Department of Agriculture, Economic Research Service. (2019). Household food security in the United States in 2018. Washington,
D.C.: Coleman-Jensen, A., Rabbitt, M. P., Gregory, C. A., & Singh, A.2. Bureau of Labor Statistics. (2019).3. United States Census Bureau. (2019). 2018 ACS 5-year estimates.4. United States Census Bureau. (2019). 2018 ACS 5-year estimates.5. United States Census Bureau. (2019). 2018 ACS 5-year estimates.6. United States Department of Agriculture, Economic Research Service. (2018).7. Mathematica Policy Research. (2012). Addressing child hunger and obesity in Indian Country: Report to Congress. Alexandria, VA: Gordon, A.,
& Oddo, V.8. Gundersen, C. (2008). Measuring the extent, depth, and severity of food insecurity: An application to American Indians in the United States.
Journal of Population Economics, 21(1), 191-215.9. United States Department of Agriculture, Economic Research Service. (2019). Statistical supplement to the household food security in the United
States in 2018. Washington, D.C.: Coleman-Jensen, A., Rabbitt, M. P., Gregory, C. A., & Singh, A.10. United States Department of Agriculture, Economic Research Service. (2019). Statistical supplement to the household food security in the United
States in 2018. Washington, D.C.: Coleman-Jensen, A., Rabbitt, M. P., Gregory, C. A., & Singh, A.
Child Food Insecurity1. United States Department of Agriculture, Economic Research Service. (2019). Household food security in the United States in 2018. Washington,
D.C.: Coleman-Jensen, A., Rabbitt, M. P., Gregory, C. A., & Singh, A.2. Jyoti, D.F., Frongillo, E.A., & Jones, S.J. (2005). Food insecurity affects school children’s academic performance, weight gain, and social skills.
Journal of Nutrition, 135(12), 2831-9.3. Laraia, B. A., Siega-Riz, A., & Gundersen, C. (2010). Household food insecurity is associated with self-reported pregravid weight status,
gestational weight gain and pregnancy complications. Journal of the American Dietetic Association, 110(5), 692-701.4. Park, C., & Eicher-Miller, H. (2014). Iron deficiency is associated with food insecurity in pregnant females in the United States: National Health and
Nutrition Examination Survey 1999-2010. Journal of the Academy of Nutrition and Dietetics, 114 (12), 1967-1973.5. University of Wisconsin Population Health Institute. (2019). County Health Rankings Key Findings 2018.6. Kirkpatrick, S. I., McIntyre, L., & Potestio, M. L. (2010). Child hunger and long-term adverse consequences for health. Archive of Pediatric
Adolescent Medicine, 164(8), 754-762.7. Eicher-Miller, H. A., Mason, A. C., Weaver, C. M., McCabe, G. P., & Boushey, C. J. (2009). Food insecurity is associated with iron deficiency anemia
in US adolescents. American Journal of Clinical Nutrition, 90(5), 1358-1371.8. Mangini, L., Hayward, M., Dong, Y., & Forman, M. (2015). Household food insecurity is associated with childhood asthma. Journal of Nutrition,
145 (12), 2756-2764.9. Chi, D., Masterson, E., Carle, A., Mancl, L., & Coldwell, S. (2014). Socioeconomic status, food security, and dental caries in US children: Mediation
analyses of data from the National Health and Nutrition Examination Survey, 2007-2008. American Journal of Public Health, 104 (5), 860-864.10. Cook, P. H., Frank, D. A., Leveson, S. M., Neault, N. B., Heeren, T. C., Black, M. M., Berkowitz, C., Casey, P. H., Meyers, A. F., Cutts, D. B., & Chilton,
M. (2006). Child food insecurity increases risks posed by household food insecurity to young children’s health. Journal of Nutrition, 136(4), 1073-1076.
11. Burke, M., Martini, L., Cayir, E., Hartline-Grafton, H., & Meade, R. (2016). Severity of household food insecurity is positively associated with mental disorders among children and adolescents in the United States. Journal of Nutrition, 146 (10), 2019-2026.
12. King, C. (2018). Food insecurity and child behavior problems in fragile families. Economics and Human Biology, 28, 14-22.13. Landry, M., van den Berg, A., Asigbee, F., Vandyousefi, S., Ghaddar, R., & Davis, J. (2019). Child-report of food insecurity is associated with diet
quality in children. Nutrients, 11 (7), 1574.14. Casey, P. H., Szeto, K. L., Robbins, J. M., Stuff, J. E., Connell, C., Gossett, J. M., & Simpson, P. M. (2005). Child health-related quality of life and
household food security. Archives Pediatric and Adolescent Medicine, 15, 51-56.15. Shanafelt, A., Hearst, M., Wang, Q., & Nanney, M. (2016). Food insecurity and rural adolescent personal health, home, and academic environments.
Journal of School Health, 86(6), 472-480.16. Howard, L. (2011). Does food insecurity at home affect non-cognitive performance at school? A longitudinal analysis of elementary student
classroom behavior. Economics of Education Review, 30(1), 157 – 176.17. Hobbs, S., & King, C. (2018). The unequal impact of food insecurity on cognitive and behavioral outcomes among 5-year-old urban children.
Journal of Nutrition Education and Behavior, 50 (7), 687-694.18. Whitsett, D., Sherman, M., & Kotchick, B. (2019). Household food insecurity in early adolescence and risk of subsequent behavior problems:
Does a connection persist over time? Journal of Pediatric Psychology, 44(4), 478-489.19. Whitaker, R. C., Phillips, S. M., & Orzol, S. (2006). Food insecurity and the risks of depression and anxiety in mothers and behavior problems in
their pre-school-aged children. Pediatrics, 118, e859–e868.20. Heflin, C., Kukla-Acevedo, S., & Darolia, R. (2019). Adolescent food insecurity and risky behaviors and mental health during the transition to
adulthood. Children and Youth Services Review, 105 104416.21. Baer, T., Scherer, E., Fleegler, E., & Hassan, A. (2015). Food insecurity and the burden of health-related social problems in an urban youth
population. Journal of Adolescent Health, 57 (6), 601-607.22. Edwards, O., & Taub, G. (2017). Children and youth perceptions of family food insecurity and bullying. School Mental Health, 9 (3), 263-272.23. U.S. Department of Agriculture, Food and Nutrition Service, Office of Policy Support. (2019). Characteristics of Supplemental Nutrition
Assistance Program Households: Fiscal Year 2018. Alexandria, V.A.: Kathryn Cronquist & Jenny Genser White.24. United States Department of Agriculture, Food and Nutrition Service (n.d.) Child Nutrition Tables. Retrieved from https://www.fns.usda.gov/pd/
child-nutrition-tables.25. United States Department of Agriculture, Economic Research Service. (2019). Household food security in the United States in 2018. Washington,
D.C.: Coleman-Jensen, A., Rabbitt, M. P., Gregory, C. A., & Singh, A.

Food Price Variation1. United States Department of Agriculture, Economic Research Service. (2019). Household food security in the United States in 2018. Washington,
D.C.: Coleman-Jensen, A., Rabbitt, M. P., Gregory, C. A., & Singh, A.2. Courtemanche C, Carden A, Zhou X, Ndirangu M. (2019). Do Walmart Supercenters improve food security? Applied Economic Perspectives and
Policy, 41(2):177-198.3. Gregory C, Coleman-Jensen A. (2013). Do high food prices increase food insecurity in the United States? Applied Economic Perspectives and
Policy, 35, 679–707.4. United States Department of Agriculture, Economic Research Service. (2018). Official USDA food plans: Cost of food at home at four levels, U.S.
average, June 2018.5. United States Department of Agriculture, Economic Research Service. (2018).6. Bureau of Labor Statistics. (2019).7. United States Census Bureau. (2019). 2018 ACS 5-year estimates.8. United States Census Bureau. (2019). 2018 ACS 5-year estimates.9. United States Department of Housing and Urban Development (2020). Affordable housing.10. United States Department of Agriculture Food and Nutrition Service. (2020). Supplemental Nutrition Assistance Program (SNAP) participation
and costs, 1969-2019.11. Gundersen, C., Kreider, B. & Pepper, J. V. (2017). Partial identification methods for evaluating food assistance programs: A case study of the
causal impact of SNAP on food insecurity. American Journal of Agricultural Economics, 99(1), 875–93.12. Waxman, E., Gundersen, C. & Thompson, M. (2018). “How Far Do SNAP Benefits Fall Short of Covering the Cost of a Meal?” Urban Institute,
February 23, 2018.13. Gundersen, C., Kreider, B. & Pepper, J. V. (2018). Reconstructing the Supplemental Nutrition Assistance Program to more effectively alleviate
food insecurity in the United States. Russell Sage Foundation Journal for Social Sciences, 4(2): 113–20.
Intersections of Health, Disability, and Food Insecurity1. Adams E, Hoffman L, Rosenberg K, Peters D, Pennise M. Increased food insecurity among mothers of 2 year olds with special health care needs.
Maternal and Child Health Journal 2015;19:2206-2214.2. Balistreri K. Food insufficiency and children with special healthcare needs. Public Health 2019;167:55-61.3. Brown P, Durham D, Tivis R, Stamper S, Waldren C, Toevs S, Gordon B, Robb T. Evaluation of food insecurity in adults and children with cystic
fibrosis: Community case study Frontiers in Public Health 2018;6:10.3389/fpubh.2018.00348.4. Brucker D. Food insecurity among young adults with disabilities in the United States: Findings from the National Health Interview Survey.
Disability and Health Journal 2016;9:298-305.5. Brucker D, Coleman-Jensen A. Food insecurity across the adult life span for persons with disabilities. Journal of Disability Policy Studies,
2017;28(2):109-118.6. Brucker D, Nord D. Food insecurity among young adults with intellectual and developmental disabilities in the United States: Evidence from the
National Health Interview Survey AJIDD-American Journal on Intellectual and Developmental Disabilities 2016;121(6):520-532.7. Noonan K, Corman H, Reichman N. Effects of maternal depression on family food insecurity Economics and Human Biology 2016;22:201-215.8. Sonik R, Parish S, Ghosh S, Igdalsky L. Food insecurity in US households that include children with disabilities. Exceptional Children
2016;83(1):42-57.9. United States Department of Agriculture, Economic Research Service. (2019). Household food security in the United States in 2018. Washington,
D.C.: Coleman-Jensen, A., Rabbitt, M. P., Gregory, C. A., & Singh, A.10. United States Census Bureau. (2017). How Disability Data are Collected from The American Community Survey.11. Hunger in America 2014 asked about diabetes in its survey of people receiving food assistance, but it did not specifically ask if the member of the
household had Type 1, Type 2, or some other kind.12. Feeding America. (2014). Hunger in America 2014: National report.13. Seligman, H. K. and Schillinger, D. (2010). Hunger and socioeconomic disparities in chronic disease. The New England Journal of Medicine,
363(1), 6-9.14. Seligman, H. K. Bindman, A. B., Vittinghoff, E., Kanaya, A. M., & Kushel, M. B. (2007). Food insecurity is associated with diabetes mellitus: Results
from the National Health Examination and Nutrition Examination Survey (NHANES) 1999–2002. Journal of General Internal Medicine, 22(7), 1018–1023.
15. Berkowitz, S. A. Basu S., Meigs, J.B., & Seligman, H. K. (2018). Food Insecurity and Health Care Expenditures in the United States, 2011- 2013. Health Services Research, 53(3), 1600-1620.
16. American Diabetes Association. (2013). Economic costs of diabetes in the U.S. in 2012. Diabetes Care, 36(4), 1033-46.17. Berkowitz SA, Basu S, Gundersen C& Seligman HK.(2019) State-Level and County-Level estimates of health care costs associated with food
insecurity. Preventative Chronic Disease,16,180549.18. U.S. Department of Agriculture, Food and Nutrition Service. (2013). Supplemental Nutrition Assistance Program education and evaluation study
(Wave II). Prepared by Altarum Institute.19. Seligman, H. K., Smith, M., Rosenmoss, S., Marshall, M. B., & Waxman, E. (2018). Comprehensive Diabetes Self-Management Support From Food
Banks: A Randomized Controlled Trial. American Journal of Public Health 108, 1227-1234.

©2020 Feeding America. All rights reserved.
Feeding America is a 501 (c)(3) non-profit recognized by the IRS.
Support Feeding America and help solve hunger.Donate. Volunteer. Advocate. Educate.
35 East Wacker Drive, Suite 2000Chicago, Illinois 60601
1.800.771.2303 | www.FeedingAmerica.org