map profile 2001 india states and union territories
TRANSCRIPT

CENSUS OF INDIA 2001
MAP PROFILE 2001
INDIA STATES AND UNION TERRITORIES
Technical Direction
Dr. R.P. Singh Deputy Registrar General (Map)
General Direction
REGISTRAR GENERAL & CENSUS COMMISSIONER, INDIA
Data Product Number
00-120-2001 (Map Profile)
The maps included in this publication are based upon Survey of India map with the permission of the Surveyor General of India.
The territorial waters of India extend into the sea to a distance of twelve nautical miles measured from the appropriate base line.
The interstate boundaries between Arunachal Pradesh, Assam and Meghalaya shown in this publication are as interpreted from the North-Eastern Areas (Reorganisation) Act, 1971 but have yet to be verified.
© Government of India, Copyright 2004
(ii)

PREFACE
There are a number of publications undertaken during the Census of India 2001, some of which are based on 'Census Tabulation Plan', whereas others are special monograph. The present
publication is one of the 'Map Product' undertaken during the C'e~'sus of I~dia 2001. The idea for
publication of such a volume was conceived while interacting with data users. Many of.them expressed the need of a reference census volume containing maps along with basic census data and administrative units information required for ready consultation purposes in one compendium. This work is an effort
in that direction.
The present volume covers the basic census data of the State and Union territories and associated maps for Census of India 2001. The first map shows India with the State and Union territories and subsequent maps relate with 35 States and Union territories depicting the boundaries at district and s.ub-district level. A brief analytical note is also provided for each map. The name of the district and its headquarters is depicted in the map. Sub-districts are shown by the code number
and the list of these code numbers is given separately in this volume. Besides administrative division maps, there are nine maps at India level with different themes showing decadal growth rate, density of population, level of urbanization, sex ratio, sex ratio in age 0-6, proportion of child population in
age group 0-6, literacy rate, female literacy rate and work participation rate. Many a time the data users desires to know the area, number of sub-districts and different component of population at district and sub-district level. To overcome this situation a key population characteristics data sheet
is included,
The completion of tnis volume was undertaken by the Map Division under supervision of Dr. R.P. Singh, Deputy Registrar General (Map). Ms. Sarita, Research Officer (Map) coordinated this
work efficiently at different stages of this project. A list of officials associated with this project is given separately. I feel extremely happy in recording my deep appreciation to all of them. Census Division also helped considerably in finalizing the key population data. Any publication cannot be made available
to the data users without the help of Data Dissemination Unit. My thanks to all those in the division who contributed in the publication of this volume.
I hope that this publication will overcome many problems of easy accessibility of the basic data to multitude of users and will serve them well. This is a handy and ready to use publication which can be referred to and consulted any time in meeting the basic population and administrative data requirements.
New Delhi
3rd August 2004
(ii i)
J.K. Banthia Registrar General and
Census Commissioner, India

ACKNOWLEDGEMENTS
Officers and staff associated with this project
Ms. Anuradha
Ms. Suman Gupta
Sh. Pooran Singh
Sh. N.R. Sisodia
Ms. M.B. Rama Devi
Sh. P.K. Ajmani
Sh. Anwar Hussain
Ms. Sahab Pyari
Sh. S.K. Verma
Sh. A.K. Azad
Ms. Subhra Talukdar
MAP DIVISION
SH. MAHESH RAM
Map Officer
SH. AU TAR SINGH
Research Officer (Map)
MS. SARITA
Research Officer (Map)
Map Analyst
Sr. Geographer
Sr. Geographer
Sr. Geographer
Geographer
Stenographer
Sr. Drawing Assistant
Sr. Drawing Assistant
Sr. Drawing Assistant
Sr. Draughtman
Sr. Draughtman
DATA DISSEMINATION UNIT
SH.C.CHAKRAVORTY
Joint Director
Sh. N.K. Jain
Printing Inspector
(v)


Preface
Acknowledgements
51. No. Title 1. India
2. Jammu and Kashmir
3. Himachal Pradesh
4. Punjab
5. Chandigarh
6. Uttaranchal
7. Haryana
8. N.C.T. of Delhi
9. Rajasthan
10. Uttar Pradesh
11. Bihar
12. Sikkim
13. Arunachal Pradesh
14. Nagaland
15. Manipur
16. Mizoram
17. Tripura
18. Meghalaya
19. Assam
20. West Bengal
21. Jharkhand
22. Orissa
23. Chhattisgarh
24. Madhya Pradesh
25. Gujarat
26. Daman and Diu
27. Dadra and Nagar Haveli
28. Maharashtra
29. Andhra Pradesh
30. Karnataka
31. Goa
32. Lakshadweep
33. Kerala
34. Tamil Nadu
35. Pondicherry
36. Andaman and Nicobar Islands
CONTENTS
(vii)
iii
v
Page
2-3 4-5 6-7 8-9
10-11 12-13 14-15 16-17 18-19 20-21 22-23 24-25 26-27 28-29 30-31 32-33 34-35 36-37 38-39 40-41 42-43 44-45 46-47 48-49 50-51 52-53 54-55 56-57 58-59 60-61 62-63 64-65 66-67 68-69 70-71
72-73

PART- If NAME 0' STATE, DISTRICT AND SUB .. I)ISJRICT ALoONGWITH THEIR CODES
51.No. Title Page
37. Jammu and Kashmir 77-77
38. Himachal Pradesh 77-79
39. Punjab 79-80
40. Chandigarh 80--80
41. Uttaranchal 80--80
42. Haryana 80--81
43. N.C.T. of Delhi . ~~. 81---82
44. Rajasthan 82---85
45. Uttar Pradesh 85---88
46. Bihar 88-94
47. Sikkim 94-94
48. Arunachal Pradesh 94-96
49. Nagaland 96--97
50. Manipur 97-97
51. Mizoram 97-98
52. Tripura 98-98
53. Meghalaya 98-99
54. Assam 9~100
55. West Bengal 100--104
56. Jharkhand 104-106
57. Orissa 106--111
58. Chhattisgarh 111-112
59. Madhya Pradesh 112-115
60. Guj~rat 115--118
61. Daman & Diu 118--118
62. Dadra & Nagar Haveli 118--119
63. Maharashtra 11~123
64. Andhra Pradesh 123-134
65. Karnataka 134-136
66. Goa 136--136
67. Lakshadweep 136--137
68. Kerala 137-137
69. Tamil Nadu 137-140
70. Pondicherry 140--140
71. Andaman & Nicobar Islands 140-140
(viii)

PART:. - 'III .. POPU'LAT:lON STAT:fSrICS
SI.No. T:itle
72. Map: Decadal Growth Rate 1991-2001.
73. Map: Density of Population 2001
74. Map: Level of Urbanisation 2001
75. Map : Sex Ratio 2001
76. Map: Sex Ratio in Age 0-6, 2001
77. Map: Proportion of Child Population in Age Group 0-6, 2001
78. Map: Literacy Rate 2001 ...
79. Map: Female Literacy Rate 2001
80. Map: Work Participation Rate 2001
81. India
82. Jammu and Kashmir
83. Himachal Pradesh
84. Punjab
85. Chandigarh
86. Uttaranchal
87. Haryana
88. N.C.T. of Delhi
89. Rajasthan
90. Uttar Pradesh
91. Bihar
92. Sikkim
93. Arunachal Pradesh
94. Nagaland
95. Manipur
96. Mizoram
97. Tripura
98. Meghalaya
99. Assam
100. West Bengal
101 . Jharkhand
102. Orissa
103. Chhattisgarh
104. Madhya Pradesh
105. Gujarat
106. Daman & Diu
(ix)
Page
143
144
145
146
147
148
149
150
151
152-153
152-153
152-153
152-155
154-155
154-155
156--157
156--157
156-159
158-163
162-165
166--167
166--167
166--167
166--169
168-169
168-169
168-169
168-171
170-173
172-173
172-175
174-177
176--179
178-181
180-181

51.No. Title Page
107. Dadra & Nagar Haveli 180-181
108. Maharashtra 180-183
109. Andhra Pradesh 182-185
110. Karnataka 184-187
111. Goa 186--187
112. Lakshadweep 186--187
113. Kerala 186--187
114. Tamil Nadu 186--189
115. Pondicherry 188-189
116. Andaman & Nicobar Islands 188-189 Errata 191-192
(x)
PART _I t
MAPS: INDIA, STATES AND UNION TERRITORIES
/'

INDIA
Indian Union is bounded by China, Nepal and Bhutan
in the north-, Afghanistan, Pakistan and Arabian Sea in the west, Sri Lanka and lndian O_cean in the south and Bay of Bengal, Bangladesh and Myanmar-{Bu!ma) in the east. The graticular extension of the Indian sub-continent lies in between 8° 4' 28" to 3r 17' 53" north latitudes and 68° 7' 53" to 9r 24' 47" east longitudes.
Physiographically India can be divided broadly into four regions, i.e., (i) the Northern Mountains, (ii) the
Great Plains, (iii) the Deccan Plateau and (iv) the Coastal Plains and Islands. The Northern Mountains cover the
Himalayan zone facing the northern frontier by the subcontinent comprise of Jammu & Kashmir, Himachal Pradesh, Uttaranchal, Sikkim, Northern West Bengal, Arunachal Pradesh, Nagaland, Manipur, Mizoram, Tripura, Meghalaya and part of Assam. The Great Plains is the
most populous and important region which spreads over from Rajasthan, Punjab, Haryana, Uttar Pradesh, Bihar, West Bengal to the eastern section of Brahmaputra . Valley. The Deccan Plateau forms the whole of South Indian tableland. In general, the elevation rises to over 1000 metres in the south while it hardly exceeds 500
metres in the northern side. The Coastal Plains represent almost the whole of Gujarat state, Western Coastal region of Karnataka, Maharashtra, Kerala, Mahe district of Pondicherry, Goa, Daman & Diu, the eastern coastal regions of Andhra Pradesh, Tamil Nadu, Andaman & Nicobar Islands in the Bay of Bengal and Lakshadweep in the Arabian Sea as Islands.
According to the Census of India 2001, India is
divided into 35 administrative units, i.e., 28 States and
7 Union territories. These administrative units are further
divided into 593 districts. The districts have been further
divided into sub-districts. The total number of sub
districts are 5,463. There are 5,161 towns. Out of these,
3,799 are statutory towns and 1,362 census towns. There
are 384 UA's during this period. There are 638,588
villages in the country. Out of these 593,732 villages
are inhabited and 44,856 uninhabited. The country covers
an area of 3,287,240 km2.* Among the states, Rajasthan
is the largest state occupying an area of 342,239 km2
followed by Madhya Pradesh (308,245 km2), Maharashtra
(307,713 km2) and Andhra Pradesh (275,045 km2) while
the smallest state Goa (3,702 km2) is preceded by Sikkim
(7,096) Tripura (10,486), Nagaland (16,579) and , Meghalaya (22,429) of North-Eastern region, Among the
Union territories Andaman & Nicobar Islands (8,249 km2)
ranks first while Lakshadweep (32 km2) is the smallest.
Among the states, Uttar Pradesh has the maximum
number of districts (70) followed by Madhya Pradesh
(45) and Bihar (37) while Goa has the lowest number of
districts (2 only). Among the Union territories Chandigarh,
Dadra & Nagar Haveli and Lakshadweep are uni-district
while Delhi has maximum number of nine districts.
According to the Census of India 2001, the
population of the country stands at 1,028,737,436.** Out
of which 532,223,090 are males and 496,514,346
females. Considering the population in the states, Uttar
Pradesh ranks first in the country having 166,197,921
persons followed by Maharashtra (96,878,627), Bihar
(82,998,509), West Bengal (80,176,197) and Andhra
Pradesh (76,210,007). Among the Union territories Delhi
ranks first with a total population of 13,850,507 while
Lakshadweep with the lowest population of 60,650 only
stands last.
• Excludes entire area of those portions of Jammu and Kashmir which are under illegal occupation of Pakistan and China.
** Including estimated population of Mao Maran, Paomata and Purul sUb-divisions of Senapati district in Manipur.
2

Oadra & Nagar
ARAB I AN SEA
<' ~
l' <l'
r" -:5 •. • 1- ~ o 0-
" "Z. . )? ~
J (\)
-0
Rajasthan
Maharashtra
P - Pondicherry
I N D I A N
EAST OF GREENWICH
c
INDIA
I MAP1 I
o 36
ADMINISTRATIVE DIVISIONS 2001
p
Boundary, International .. __ _ Boundary, StatelUT
I
KILOMETRES
1 0 50 0 100
I
8 E
New Moore I (I NDIA.)
N
BAY OF
BENGAL
T
o C E A N
3
o Coco /so o (MYANMAR) Y?n, . N,,,,,,,",,m I. V'! (INDIA)
~3 ~. : . &""",. I)) !# (INDIA)
? '1
~ ~ ANDAMAN SEA
o
INDIRA POINT tll

JAMMU AND KASHMIR
The state of Jammu & Kashmir is situated in extreme north of India and lies between 32°15' and 37"5'
north latitudes and 72°35' and 80°20' east longitudes. It is bounded by China in the north and east, Afghanistan in the north-west and Pakistan in the west Punjab and Himachal Pradesh states border it in the south.
The state of Jammu & Kashmir can be divided into three regions, i.e., (i) Ladakh, (ii) Kashmir Valley, and (iii) Jammu. In these divisions the relief presents remarkable variations. Sub-montane soil (Podsolic) is dominant in the Kashmir Valley and brown hill soil is seen in the southern part of Jammu & Kashmir. Ladakh region is fully predominated by mountain meadow soil as well as glaciers and eternal snow.
The state of Jammu & Kashmir which had earlier been under Hindu rulers and Muslim Sultans became part of the Mughal Empire under Akbar. It was annexed to the Sikh kingdom of the Punjab in 1819. British supremacy was recognised until the Indian Independence Act 1947. I n Census 1961, there were nine districts. One new district was added during 1961-71 and the number increased to ten districts. Further in 1971-81 four new districts were created and thus the total number of districts in Jammu and Kashmir reached to fourteen and remain the same during Census 2001. The total number of districts recorded in Census 2001 are fourteen. There are 59 sub-districts, 121 CD Block and 6,652 villages.
4
There are 75 towns. Out of these 72 are statutory towns
and 3 census towns. The state covers an area of 222,236
km2. Among all the fourteen districts of the state, Leh
(Ladakh) has the largest geographical area of 45,110
km2 whereas Badgam is the smallest in size with an
area of 1,371 km2.
According to the Census 2001, the total
population of Jammu & Kashmir state is 10,143,700
which is 0.99 per cent of the total population of the
country. Out of this population 5,360,926 are males and 4,782,774 females. The average population size of the
district in the state is 724,550. Among all the 14 districts,
Jammu district recorded the maximum population of
1,588,772 persons and minimum population of 117,232
persons by Leh (Ladakh). Sex ratio of the state works
out to be 892. The highest sex ratio in the state is recorded by Pulwama district with 945 and the lowest
by Leh (Ladakh) district with 823. Density of population
of the state is very low as 46 persons per km2. Srinagar district has the highest density of population (540 persons
per km2) whereas Leh (Ladakh) district has the lowest
density of population (3 persons per km2) among all the
district in the state. During 1991-2001, 29.98 per cent
increase is recorded in its total population. Among all
the districts Kupwara district has recorded the highest
growth rate of 40.84 per cent and Kathua district is last
in the list with 22.21 per cent.

»
-
I MAP2 I
JAMMU AND KASHMIR ADMINISTRATIVE DIVISIONS 2001
KILOMETRES 50 o 50
I
• KargH
IV
BOUNDARIES:
INTERNATIONAL ... _-----
STATE .... .. . . . ... ------DISTRICT ..... . ... ... _____ _
TAHSIL
D DATA NOT AVAILABLE
5
100
•
150
« Leh (Ladakh)
I
HEADQUARTERS:
STATE ...... ... "'k DISTRICT ... •
Where the district name differs from its headquarters name, the latter is given within brackets.

HIMACHAL PRADESH
Himachal Pradesh is situated in the extreme north
of India. It extends between 30° 22' 40" and
33° 12' 40" north latitudes and 75° 47' 55" and 79° 04'
22" east longitudes. It touches the international boundary
with China (Tibet) in the east. It is surrounded by Jammu
& Kashmir in the north, Uttar Pradesh, Uttaranchal
and Haryana in the south and Punjab in the west.
Physiographically the state is divided into four regions, i.e., (i) Northern Himachal Pradesh, (ii) Trans
Himalayan Zone, (iii) Central Himachal Pradesh and (iv)
Southern Himachal Pradesh. The altitude in Northern
Himachal Pradesh region ranges between 610 to 6,400
metres above the mean sea level. Ravi and Chandra
Bhaga or Chenab are the main rivers which drain in this
region. Trans-Himalayan Zone is rugged and highly
mountainous having snow clad high peaks, passes,
glaCiers and snow caves. Central Himachal region is
hemmed by the mountain ranges, i.e., Siwalik Foot Hills
in the south-west and Dhaula Dhar, Pir Panjal and Kullu Greater Himalaya in the north-east part. Most of areas
fall between 400 metres and 2,000 metres of elevations.
In 1872, Himachal Pradesh was part of the
Punjab province. Some of the districts which exist in
2001 like Kangra and Shimla were then under the British
control and Chamba, Mandi, Bilaspur and Sirmaur were
the Princely states. Since then, there had been
jurisdictional changes in the territorial limits of Punjab.
Finally in 1948, Himachal Pradesh was created as a
separate Union territory taking out the Chamba, Mandi,
and Sirmaur districts of Punjab province and Bashahr
Princely state which was renamed as Mahasu district.
Besides four districts, some of the territories of Princely
states of Suket, Nalagarh and Jubbal are also included
in Himachal Pradesh. According to Himachal Pradesh and Bilaspur (New State) Act, 1954, Bilaspur a Part C
state in 1951 was also merged in Himachal Pradesh in
July 1954 and became the 5th district. In 1960 yet another
district was created by grouping together Chini tahsil
and 14 villages of Rampur tahsil of Mahasu district. As
a result there were six districts in Himachal Pradesh
Union territory in 1961. It was given the status of
6
statehood in January 1971 and total number of districts
increased to ten by addition of Kangra, Shimla, Lahul &
Spiti from Punjab state and declaring Kullu tahsil of
Kangra district as separate district. Number of districts
increased to twelve in 1981. No further change is noticed
in Census 1991 and the same number remains in 2001
also. In Census 2001 Himachal Pradesh has recorded
12 districts, 109 sub-districts, 72 CD Blocks, 57 urban
areas (including fifty six urban agglomeration and one
census town) and 20,118 villages. The total area of the
state is 55,673 km2 . Among the districts in the state
Lahul & Spiti is the largest district with an area of 13,841
km2 while Hamirpur is the smallest district with 1,118
km 2.
According to the Census 2001, the total
population of the state is 6,077,900 which is 0.59 per
cent of the total population of India. Out of this population
3,087,940 are males and 2,989,960 females. Sex ratio
of the state workout to be 968. Hamirpur and Kangra
districts ranks first and second with sex ratio of 1,099
and 1,025 respectively. The lowest sex ratio is recorded
in Lahul & Spiti district with 802. Most of the population
of the state is confined to valleys and mountain slopes
which have fertile soils and irrigation facilities. The high
and rugged snow capped mountain ranges and forest
clad slopes are mostly empty. Density of population of
the state is 109 persons per km2 . At the district level
the highest density of population is recorded in Hamirpur
district where it is 369 persons per km2 and the lowest
of 2 persons per km2 in Lahul & Spiti though the district
is biggest in terms of area in the state but population
is sparsely distributed. In 1991 the state had 5,170,877
persons. The 17.54 per cent increase is recorded in its total population during 1991-2001. Average population size
of the district in the state is 506,492. Kangra district
has the maximum population of 1,339,030 persons and
the minimum population is recorded by Lahul & Spiti
district (33,224). Solan district has registered the highest
percentage decadal growth of population (30.94 per cent)
and Lahul & Spiti district is again the last in the list with
only 6.17 per cent growth rate of population.

'","" , 2 '.-, . 3 ... , ~ .-~,(" ... \ ~ .. -.- --\ .
,,,,,'.:' Chamba·'·"'·') 5', . ' _ . _~_. F"':_
BOUNDARIES:
INTERNATIONAL
HIMACHAL PRADESH ADMINISTRATIVE DIVISIONS 2001
KILOMETRES
20 o 20 40
A N D
I
(Kyelang) 2
• LahUI [~nd Spiti
3 (
5
MAP 3
(')
" 2
~ ' - -. -- '- .- - -.- .~- - ' -,
"'. \ Kinnaur j 4 ".. 3
;" ..-._.,. .
HEADQUARTERS: STATE
DISTRICT
...... ... ... . ,. ---- - --STATE ... ...... * ... ...... ... - - - ----
TAHSIUSUB-TAHSIL ... DISTRICT ... •
U.P. - UTIAR PRADESH
7
Where the district name differs from its headquarters name, the latter is given within brackets.
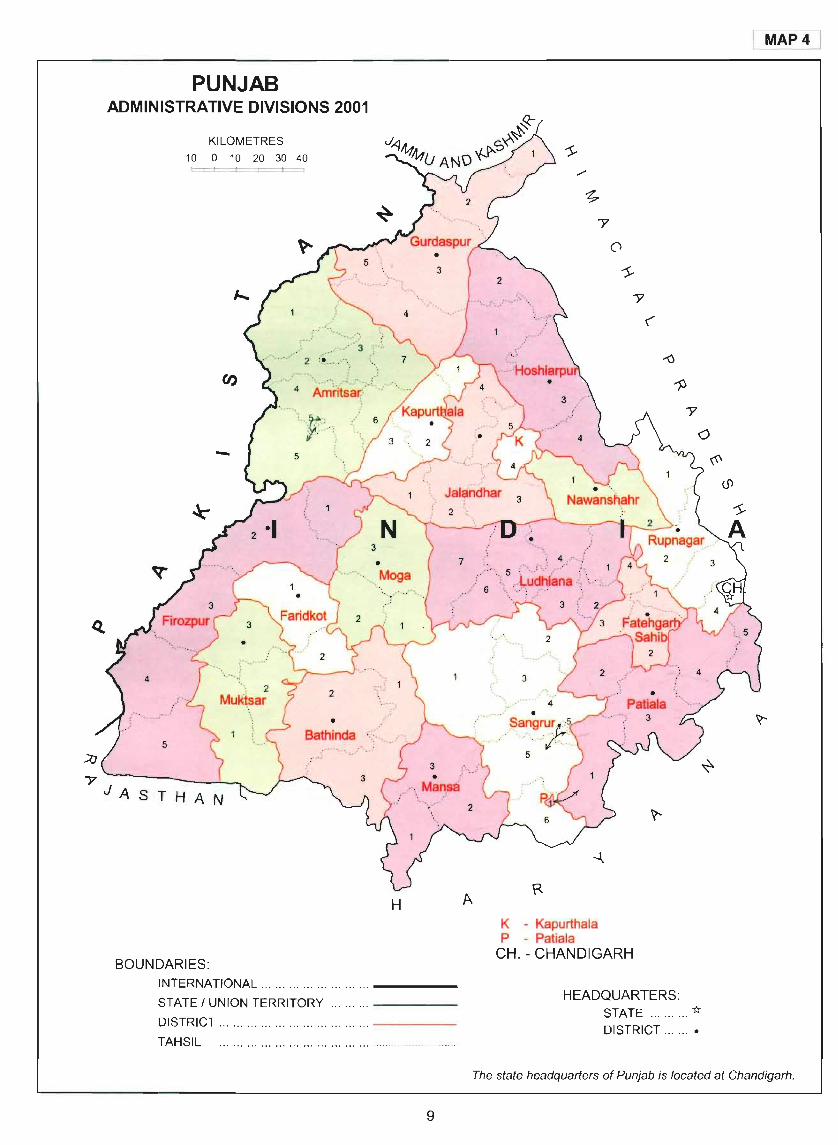
PUNJAB
Punjab state lies between 29° 33' and 32° 31' north latitudes and 73° 53' and 76° 56' east longitudes.
It is surrounded by the states of Jammu and Kashmir in the north, Himachal Pradesh and Union territory of
Chandigarh in the east, Haryana and Rajasthan in the
south. The western boundary is formed the International boundary between India and Pakistan.
Physiographically Punjab state can be divided into four regions, i.e., (i) Ravi-Beas Inter-Fluvial Plain
covers the north-western portion, (ii) HoshiarpurChandigarh sub-montane Plain covers north-eastern
portion with low hilly tracts of Siwalik, (iii) Beas-Satluj
Doab region covers north-central portion and (iv) Punjab
Malwa Plain covers the remaining portion of the state (61.03 per cent) forming a flat featureless plain. The
occurrence of sand dunes is quite common in the
southern parts of this region. The state is rich in
agriculture, having fertile soil of alluvial with variations
of 'Banger' and 'Khadar'. The word 'Punjab' has derived its name from two Persia words 'Punj' meaning five and
'Ab' means water and is commonly referred to as the
land of five rivers. Ravi, Beas, Chenab, Jhelum and
Satluj are the five important perennial rivers in the state.
Punjab was annexed to British India by Lord
Dalhousie in March, 1849. But the spirit of the Punjab remained unvanquished. Through the centuries, Punjab
became the sword arm of British India. It was constituted
a separate province of India in 1937. With the partition
of India, the Punjab was divided between India and
Pakistan as East Punjab and West Punjab. On November 1,1956 the Princely states adjoining Punjab were formally
absorbed into the Punjab state. On November 1,1966
Punjab was divided into three units- (i) Punjab comprising
8
the predominantly Punjabi speaking areas, (ii) Haryana made up of the Hindi speaking districts and (iii)
Chandigarh the capital. Hilly areas were transferred to Himachal Pradesh. During 1971-81 one new district was
added to increase the number to eleven. No change is noticed upto Census 1991. During 1991-2001 the number of districts increased to seventeen. In Census 2001, the
state has recorded 17 districts, 72 sub-districts and 138
CD Blocks and 12,673 villages. The state has 157 towns.
Out of which 139 are statutory towns and 18 census
towns. The total geographical area of the state is 50,362
km 2. Among the 17 districts in the state, the largest
area of 5,328 km2 is observed in Firozpur district and
the smallest area of 1,180 km2 in Fatehgarh Sahib district.
According to the Census 2001, the total
population of the Punjab state is 24,358,999 persons.
Out of this population 12,985,045 are males and
11,373,954 females. The average population size of the
district in the state is 1,432,882. Amritsar district has
the maximum population of 3,096,077 persons whereas
the minimum population of 538,041 is observed in
Fatehgarh Sahib district. Density of population of the
state as a whole is 484 persons per km2. At the district
level the highest density is recorded in Ludhiana district
with 848 persons per km2 and the lowest of 300 persons
per km2 in Muktsar district. Sex ratio of the state is 876.
Hoshiarpur district rank first with sex ratio of 935 whereas
the lowest is observed in Ludhiana district with sex ratio
of 824. The 20.10 per cent increase in population is recorded during 1991-2001. Ludhiana district has recorded
the highest decadal growth of population of 24.89 per
cent and Nawanshahr district is last in the list with only
10.58 per cent growth rate of population.
PUNJAB ADMINISTRATIVE DIVISIONS 2001
KILOMETRES 10 0 10 20 30 40
, ...... ,. ..,' '.~
· .. / 3
2 .~ ... _,.-'- '.
4 ·~~iit~~~ti...i'·'\""
"'_-y:~ .. :! (',-
-
2
• Bathinda
.... , .. : . -'
H
BOUNDARIES: INTERNATIONAL .... .. ...... ... ..... . ... ____ _
STATE I UNION TERRITORY ....... .. -----
DISTRICT ... '" .... .. .. . ...... ... ... .... .. -----
TAHSIL
9
A
K - Kapurthala P - Patiala
CH. - CHANDIGARH
HEADQUARTERS: STATE .... .... . * DISTRICT ... .. . .
I MAP4 I
The state headquarters of Punjab is located at Chandigarh.

CHANDIGARH
The first planned modern city of India is Chandigarh
designed by the French architect Le Corbusier. It
lies between 30° 40'05" and 30° 47' 45" north latitudes
and 76° 42'15" and 76° 51' OS" east longitudes. It is
bounded by Punjab on three sides and by Haryana in
the east.
Chandigarh Union territory is divided into two physiographic regions, i.e., (i) Chandigarh Siwalik and (ii) Chandigarh Plain. In the Chandigarh Siwalik region general elevation is from 350 to 400 metres which covers three villages in the north-eastern region. Chandigarh Plain region forming the entire Chandigarh Union territory is a fertile alluvial plain, gently sloping towards south
west (gradient 1 : 100) which is good for natural drainage.
10
Chandigarh as a Union territory since 1966. It is the capital of both Punjab and Haryana where the High Court and the University for both states are located.
The Union territory has one tahsil and one CD
Block with 24 villages and one statutory town. It covers
an area of 114 km2• The Union territory has 900,635
population. Out of which 506,938 are males and 393,697
females. The density of Chandigarh has recorded as
7,900 persons per km2 which ranks next to Delhi (9,340)
among all States/Union territories. The sex ratio of the
Union territory is 777 females per 1,000 males during
the Census 2001. The decadal growth rate of this Union
territory is 40.28 per cent during this decade.

I MAP5 I
CHANDIGARH ADMINISTRATIVE DIVISIONS 2001
BOUNDARIES: J
STATE / UNION TERRITORY ... __ _
TOWN / URBAN AREA .. ' .... .. _________ .
VILLAGE .. . ......... ... ... ... .. . ... - - -
WARD .. . .... .... .. .... . .
RIVER / CHOE ... .. . .. ... . .. , .. . ... ~
INTER SECTOR ROAD .... .. ... ---
RAILWAY LINE ... ... ...... ...... .........,-++-+~
RESERVED AREA ... .. ... . ... R
KILOMETRES o
p
2
lJ
HEADQUARTERS:
UNION TERRITORY ..... . *
Figures shown inside the map in black indicate sector number whereas figures in red indicate village code number.
11
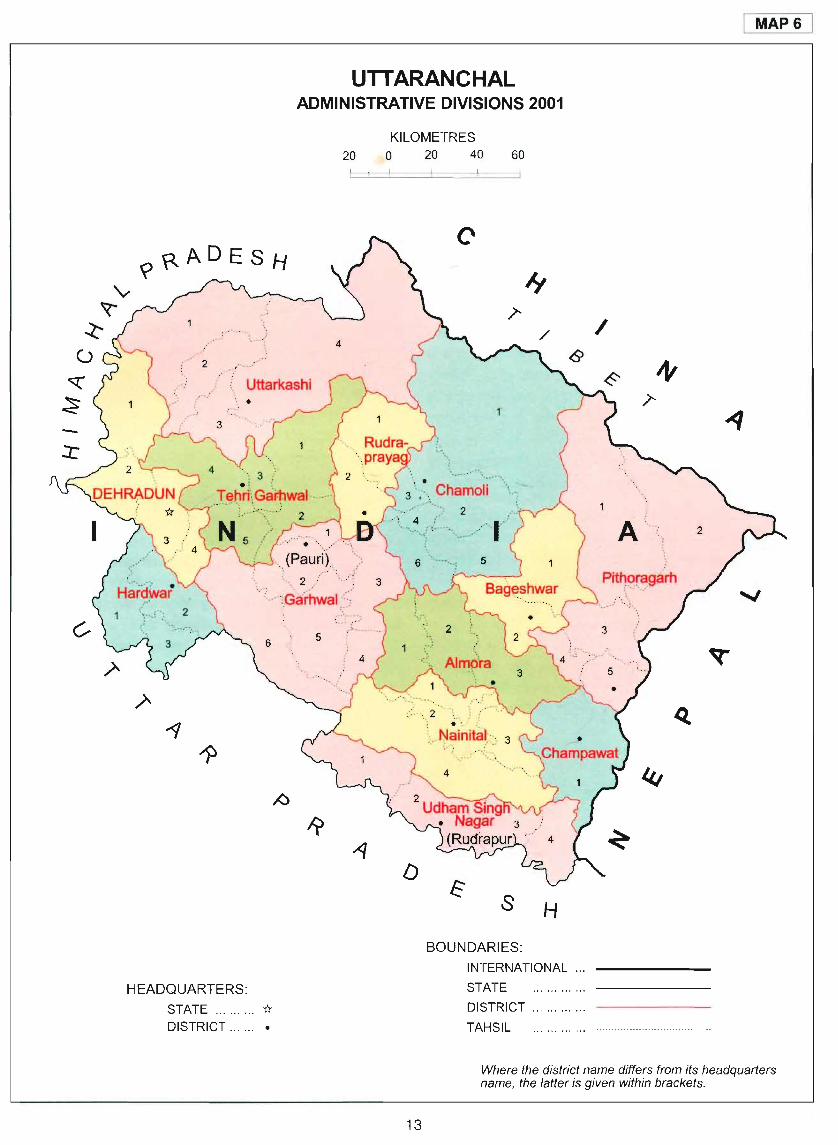
UTTARANCHAL
U ttaranchal, a newly formed state lies between
28 0 43' and 31 0 28' north latitudes and 770 32'
and 81 0 east longitudes. It is surrounded by Himachal
Pradesh in the west, Uttar Pradesh in the south, Nepal
in the east and China in the north.
The main physiographic characteristics of the
state are high mountains and known as Uttar Pradesh
Himalaya. The general slope is from north-west to south
east direction. The entire region is composed of folded
mountains which is highly dissected and rugged. The
northern most region falls under Greater Himalayan Zone
and the average height varies between 4,800 and 6,000
metres. The north-western region contains varying
geographic environments ranging from Doon Valleys and
Siwalik range to the snow covered Greater Himalaya.
The average height of the region varies between 750
and 2,700 metres. Towards the south-east, the region
displays different characteristics like hills, bhabar, tarai
and plain. The northern hilly area of this region has
several beautiful tanks, generally called 'ta/s'. Most part
of this region is covered with dense sal forests.
Uttaranchal has a very ancient history as it finds
mention in the Hindu scriptures as Kedarkhand,
Manaskhand and Himvant. It is often called the Land of
the Gods (Dev Bhoomi) because of its various holy
places and abundant shrines. The present state of
Uttaranchal was earlier part of Uttar Pradesh. But a
separate hill state carved out from Uttar Pradesh to
preserve the cultural, tribal and linguistic identities of
the people belonging to these regions. The Uttar Pradesh
12
State Reorganization Bill, 2000 was introduced and
enacted and thus Uttaranchal became the twenty seventh
State of the Indian Union. On November 9, 2000, the
Government of State took oath of Office in Dehradun
and the state came into formal existence. In Census
2001, the state of Uttaranchal recorded thirteen districts,
49 sub-districts, 86 towns (74 statutory and 12 census
towns) and 16,826 villages. It extends in 53,483 km 2 of
area. At the district level, Chamoli district is the largest
district with an area of 8,030 km2. The district with the
smallest geographical area is the Champawat (1,766 km2).
According to the Census 2001, the state has
registered a total population of 8,489,349 persons. Out
of which 4,325,924 are males and 4,163,425 females.
The density of population of the state is 159 persons
per km2 as against 133 of the 1991 Census. Hence, the
pressure of population in the state has increased by 26
persons per km2 during the decade. The highest density
of population has been observed in Hardwar district with
613 persons and the least density in Uttarkashi district
with only 37 persons. The sex ratio has usually been
quite high in the hill districts as compared to districts in
plains of erstwhile Uttar Pradesh. Among the districts in
the state, Almora is at the top of the ladder of sex ratio
of 1,146 and bottom end of the ladder is Hardwar district
with a sex ratio of 865. The decadal growth rate during
1991-2001 is 19.34 per cent in Uttaranchal. The highest
growth rate of 32.88 per cent is registered in Nainital
district whereas the lowest is recorded in Almora district
with only 3.16 per cent.
MAP6
UTTARANCHAL ADMINISTRATIVE DIVISIONS 2001
20
' __
, (Pauri) ,
-, <'" ~_// -. ", ::} : __ · "~.Garhwal ;>
" ,--';--
6 5
HEADQUARTERS:
STATE .. ....... "* DISTRICT ..... , •
KILOMETRES
o 20 40 60
/
Pitl1~fagarh : ~- '-.' - .
.:' .. , 2 .. ,
D
13
': . '--' :
\ .. NainitaJ>, 3 '" /
s H
BOUNDARIES:
INTERNATIONAL .. .
STATE
DISTRICT .. . ..... . .. .
TAHSIL
Where the district name differs from its headquarters name, the latter is given within brackets.

HARYANA
H aryana extends between 2]0 39' and 30° 55' 5" north latitudes and 740 27' 8" and 7r 36' 5" east
longitudes. It is bounded by Himachal Pradesh in the north, Rajasthan in south and south-west, Punjab and Chandigarh in the west and north-west and Uttar Pradesh
and Delhi in the east.
Haryana is a plain area except hills of the Siwalik system in the north and AravaJli in south. Eastern part of Haryana is known as the Kurukshetra plain. This plain has comparatively higher rainfall and water table and is
fertile. The south-western part of the state is dry, sandy and barren. The state has no perennial river. Ghaggar is the only river which passes through the northern fringe of the state. River Yamuna forms boundary between Haryana and Uttar Pradesh. The other seasonal rivers are Tangri, Markanda, Chantang, Sahibi and Dohan.
Haryana state came into existence in November,
1966. Out of the predominantly Hindi speaking areas from the erstwhile Punjab state according to the Punjab
Reorganization Act, 1966. This new state of Haryana was comprised of seven districts in 1971. In 1981 five
new districts were created and number of districts increased to twelve. In 1991 again four new districts were added in this state. In 2001 number of districts
increased to nineteen. These nineteen districts are comprised of 67 sub-districts with 116 CD Blocks and
14
6,955 villages. There are 106 towns, out of these 84 are statutory towns and 22 census towns. The total area of the state is 44,212 km2. Among the districts, Bhiwani is the largest district with an area of 4,778 km2 while Panchkula is the smallest district (898 km2).
According to the Census 2001, the population of Haryana is 21,144,564 consisting of 11,363,953 males and 9,780,611 females. In 1991 the total population of the state was 16,463,648. Hence, during 1991-2001, 28.43 per cent growth rate is recorded in this state. Average population size of the district in the state is 1,112,872. Faridabad district has the maximum population in the state (2,194,586) and last in the list is the Panchkula district where only 468,411 persons have been enumerated in Census 2001. The density of population in Haryana is 478 persons per km2. Faridabad is the most densely populated district of the state. It has a density of 1,020 persons per km2 whereas Sirsa district has the lowest density of 261 persons per km2. The sex ratio of the state is 861 females per 1,000 males during Census 2001. It is worth to be mention that sex ratio of Haryana has declined since 1981 and is the lowest since independence. Sex ratio in all the districts of Haryana is below the national average of 933. The highest sex ratio is recorded in Mahendragarh district (918) whereas it is the lowest in Panchkula (823) district during Census 2001.

HARYANA ADMINISTRATIVE DIVISIONS 2001
",
' . ,,:::.' .. ;,' 3
KILOMETRES 10 0 10 20 30 40 50 I I I I I =-=j
p u
.. ~'.~ : .
I
:_.. ".~
I MAP7 I
<0
\'>--I
j (j)
W
0
.,' ... ' « 0::::
a..
0::::
« I--
I--
A :::l
' '' ', ,--'
5 ./
BOUNDARI ES:
STATE/UNION TERRITORY .. . -----
DISTRICT ... .. . ..... . .. .. ... .. ... ... ____ _
TAHSIL
HEADQUARTERS:
STATE .. . ....... .... . ...... * DISTRICT .. ... . ........ . .. . .
. ~' - .. ' 6
A N
:r. (/) L.U o « a: a..
P - Panipat R - Rewari
The state headquarters of Haryana is located at Chandigarh.
Where the district name differs from its headquarters name, the latter is given within brackets.

NCT OF DELHI
Delhi is renamed as the National Capital Territory
of Delhi. The National Capital Territory of Delhi lies
between 28° 25' and 28" 53' north latitudes and 76° 50'
and 77" 22' east longitudes. National Capital of Delhi is
bounded on the north-west and south by Haryana and
in the east by Uttar Pradesh.
Physiographically the National Capital Territory
of Delhi can be divided into three regions, i.e., (i) The
Yamuna Flood and Piedmont Plain, (ii) The Ridge and
(iii) The Plain. The Yamuna Flood Plains are low-lying
and sandy and subject to recurrent floods. This area is
also called Khadar. The Ridge originates from the Aravalli
Hills of Rajasthan and enters this territory from the south,
extending towards north-eastern direction. It encircles
the city on the north-west and west. The low lying land
along with the river Yamuna called Khadar and the tract
lying to the north of the ridge and west of the Grand
Trunk Road, which separates it from the Khadar is a
levelled plain known as 8angar.
The city of Delhi was founded in the 11th Century
AD by Rajput Chieftain of the Tomar clan. The Chauhans
obtained possession of the city from the Tomars. Prithvi
Raj, the Chauhan ruler of Ajmer and Delhi made the city
of Delhi famous by his heroic valour and romantic
adventures. In 1192, Delhi thus passed into the hands
of Muslim rulers for the next six centuries. Under the
Mughal Emperors, Delhi became a world famous city. In
1857, following the mutiny of Indian troops, the British
ruler deposed the titular Emperor Bahadur Shah and
formally annexed Delhi with them. In 1912, the capital
of British India was transferred from Calcutta to Delhi.
A new city - New Delhi of imposing dimensions was
laid out by the side of the old city - Old Delhi by the
16
British Indian Government. Independent India has retained
this historic capital. Delhi Union territory a uni-district in
1991 now is divided into nine districts with 27 sub
districts and 165 villages. There are 62 towns as per
2001 census. Out of these, 3 are statutory towns and
59 census towns. It covers an area of 1,483 km2. Among
these nine districts North West district exists with the
largest area of 440 km2 and Central district exists with
the lowest of 25 km2 only.
Delhi has a total population of 13,850,507
persons according to the Census 2001. Out of which 7,607,234 are males and 6,243,273 females. The sex
ratio as per the 2001 Census has been recorded as 821.
Among these districts, the highest sex ratio is recorded in North West district with 849 and the lowest in South
West district with 784. Delhi has the density of 9,340
persons per km2. North East district has the highest
density of 29,468 persons per km2 whereas South West
district has the lowest density of 4,169 persons per km2.
The average population size of the district in Delhi is 1,538,945. Among these nine districts, North West has
recorded the maximum population of 2,860,869 persons and New Delhi has minimum population of 179,112
persons during Census 2001. Delhi has always been
depicting growth rate above all India growth rate being the capital of the country as it always attracting large
number of immigrants from other states/Union territories.
The decadal growth rate of Delhi for 1991-2001 is 47.02 per cent, which is lower by 4.43 per cent point than the
corresponding decadal growth rate for 1981-91 which was 51.45 per cent. The maximum decadal growth rate of
62.92 per cent is recorded in North East district and
Central district is the last in the list with a negative decadal growth rate of 1.55 per cent during this period.

NCTOF DELHI ADMINISTRATIVE DIVISIONS 2001
KILOMETRES
2 0 2 4 6
(Kanjhawala)
t:J:: •
I
R
BOUNDARIES:
STATE/UNION TERRITORY
DISTRICT. .. ... ... ... .. . ... .. . ..... . ____ _
TAHSIL .. . ' " ... .... , .. .. ... .. .. . , ............. .
RIVER / DRAIN ... ... ... ... ... ... ~
Where the district name differs from its headquarters name, the latter is given within brackets.
North West
2
2
. . )- - - -<~: .:.~:-. ~~.-" "
.--, i :_'''.
~" - -.' ~- ~.'
3
• (Kapashera)
17
I MAPa I
CJ
m
' \ -_._ - - .. :-'\
.. (Saket)
2
A
HEADQUARTERS:
NATIONAL CAPITAL TERRITORY "* DISTRICT .. . .. . .............. . .. .... ... ... •
The headquarters of West District is located at Rampura in North West District.

RAJASTHAN
Rajasthan state is situated in the north-western part
of India. It extends between 23° 3' and 30° 12'
north latitudes and 69° 30' and 78° 1 T east longitudes. The state borders with Pakistan in the west and north
west. It is bounded by Punjab in the north, Madhya
Pradesh in the south and south-east, Gujarat in the south-west, Uttar Pradesh in the east and Haryana in
the north-east.
Physiographically the state presents great
variations from one area to another. This state is divided into three regions, i.e., (i) Western arid region, (ii) Semi
arid region and (iii) the Aravalli region. Arid region is the
largest of the three, characterised by typical desert
conditions with less than 10 cms of rain. The semi-arid
region lies on the west of the Aravalli ranges. Rainfall
received in this region varies between 10 to 50 cms. Luni river waters the southern part. Salt 'lakes like
Sambhar, Dagana, Kuchnan and Didwana are important features. The Aravalli region is dominated by low
mountains of Aravalli ranges and other outlying hills.
Gurushikar (1,727 m) is the highest peak in Rajasthan which is situated in this region. Rainfall varies between
50 and 100 cms.
Rajasthan was formally known as Rajputana Agency. It has long historical background. Before the
independence, there were number of Princely states of
various size of area and social status. The move towards
renaming and consolidation of Rajasthan began soon
after independence in 1942. The significant territorial
changes took place. Some of the Princely states of Rajputana Agency lost their identity either due to merging
with newly formed districts or by acquiring new names.
By 1951 Rajasthan was divided into 25 districts. During
18
1951-61 Ajmer Province entirely merged in Rajasthan
state increasing number of districts to twenty six. Number
of districts increased to twenty seven in 1991, In Census
2001, Rajasthan has recorded 32 districts, 241 sub
districts, 222 towns (184 statutory and 38 census towns)
and 41,353 villages. The state has a total area of 342,239 km2. Jaisalmer district has the largest geographical area
of 38,401 km2 whereas the sm~IIest district is Dhaulpur
with an area of 3,033 km2.
According to the Census 2001 this state has
registered 56,507,188 persons, In 1991 the state had a
population of 44,005,990. Thus a growth rate of 28.41
per cent has been registered during 1991-2001. The male
female breakup of population is 29,420,011 and
27,087,177 in Census 2001. Sex ratio thus works outs
to be 921. Average population size of the district in the
state is 1,765,850. At the district level, Jaipur district
with a population of 5,251,071 persons is the most
populous district and Jaisalmer has got the least
population of 508,247 persons in the state. Interestingly,
Jaisalmer' has recorded the highest growth rate of
population (47.52 per cent) and Rajsamand district is at
the bottom of the ladder with 19.97 per cent decadal
growth rate during 1991-01. The density of population of
the state is 165 persons per km2 in 2001. Jaipur district
has registered the highest density of population of 471
persons per km2 whereas Jaisalmer district has the
lowest density of population of only 13 persons per km2.
Density of population reflects the population distribution
in the state. Density of population show a sharp decrease
westwards from Bagarland to the arid region of the state.
Within the arid region, the population is highly scattered
and clustered around water points.

Jaisalmer ,.
BOUNDARIES: INTERNATIONAL
RAJASTHAN ADMINISTRATIVE DIVISIONS 2001
KILOMETRES 40 0 40 80 120
..... _) 2 .'.../-:: """ Bikaner../'··""··'
, ,~_, ---~ r_"
4 /J·:;· •. 1
~,.-"''''-.. ' -- -
... ........ ... ..;:;. 2
.:: ( 3 5 JodQpur \..... .
: .. _-- --- ~ _.-. -_.
;'.~ ..... ~ ..... : < 7
A - Ajmer C - Chittaurgarh
STATE ... ........ . ... ----- HEADQUARTERS: DISTRICT .... .. .... .. ----- STATE .... .... . '* TAHSIL DISTRICT ...... •
19
I MAP9 I
Q

UTTAR PRADESH
The state of Uttar Pradesh lies between 23° 52' and 29° 45' north latitudes and 7r 4' and 84° 38' east
longitudes. The state is bounded by Uttaranchal and Nepal in the north, Madhya Pradesh and Chhattisgarh in the south, Bihar and Jharkhand in the east. Rajasthan,
Haryana, NCT of Delhi and Himachal Pradesh in the west.
Uttar Pradesh can be divided into three physiographic regions, i.e., (i) Upper Ganga Plain, (ii) Middle Ganga Plain and (iii) Uttar Pradesh Uplands. In general, vast area of northern region is a level alluvial
plain with a slope from north to south or south-east with
reference to the alignment of the major rivers and tributaries joining them. Likewise the Middle Ganga Plain is a level riverine plain characterised by fertile alluvial soils. The Uttar Pradesh Uplands is situated in the
southern part of the state. There are numerous rocky knobs of ancient hard rocks in the entire region but the general altitude rarely exceeds 300 metres. The surface is rugged and dissected which indicates influence of ancient geologic structure in the land development of
this region. The general slope is towards north-east
direction.
In the mediaeval period, Uttar Pradesh passed
under Muslim rule and led the way to a new synthesis of Hindu and Islamic cultures. Urdu language remains the perfect synthesis of Hindu and Muslim cultures. The British combined Agra and Oudh into one province called the United Provinces of Agra and Oudh. The name was
20
shortened to United Provinces in 1935. After independence, in January, 1950 the United Province was
renamed as Uttar Pradesh. The hill districts of Uttar Pradesh are bifurcated and a new state of Uttaranchal came into being in November, 2000. In the state, there
are 70 districts according to the Census 2001. These districts are comprised of 300 sub-districts with 809 CD Blocks and 107,452 villages. There are 704 towns in the state. Out of which, 638 are statutory towns and 66 census towns. The state is spread over an area of 240,928 km2. Among the districts, Kheri is the largest district with an area of 7,680 km2 while Sant Ravidas
Nagar is the smallest distric~ with 1,015 km2.
According to the Census 2001, the population
of the state is 166,197,921 consisting of 87,565,369
males and 78,632,552 females. The decadal growth rate
of the state is 25.91 per cent during 1991-2001.
Ghaziabad has recorded the highest decadal growth rate
of 47.52 per cent whereas Baghpat district with the
lowest of only 12.97 per cent. The density of population
in Uttar Pradesh is 690 persons per km2. Ghaziabad
again top the list and is the most densely populated
district in the state. It has a very high density of 2,866
persons per km2 whereas Lalitpur district has the lowest
density of only 194 persons per km2. The sex ratio of
the state is 898 females per 1,000 males at the Census
2001 as against 876 in 1991. The highest sex ratio in
the state is recorded by Azamgarh district (1,020) and
the lowest by Mathura (840) during Census 2001.

-<
BOUNDARIES:
INTERNATIONAL
STATE ............ ... .. .
DISTRICT ....... .. ... ' "
TAHSIL .... .. ...... '"
HEADQUARTERS:
STATE ... .. . * DISTRICT ., . •
UTIAR PRADESH ADMINISTRATIVE DIVISIONS 2001
KILOMETRES
20 0 20 40 60 80100
A o E
A Ambedkar Nagar G Gorakhpur S Siddharthnagar M Mau K Kaushambi
KN Kushinagar GBN Gautam Buddha Nagar JPN Jyotiba Phule Nagar SKN Sant Kabir Nagar SRN Sant Ravidas Nagar (Kh) Khalilabad H.P. HIMACHAL PRADESH
The district headquarters of Kanpur Nagar and Kanpur Dehat is located at Kanpur.
I MAP 10 I
Where the district name differs from its headquarters name, the latter is given within brackets.
21
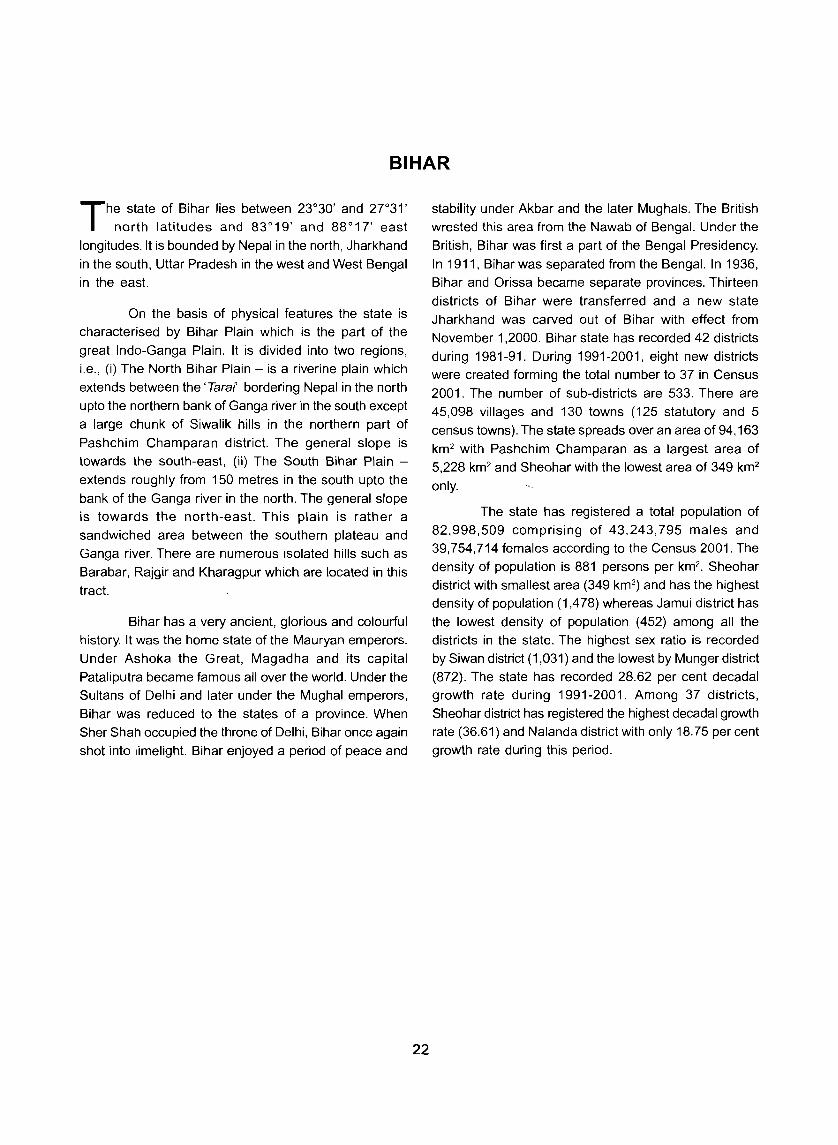
BIHAR
The state of Bihar lies between 23°30' and 2r31' north latitudes and 83° 19' and 88° 17' east
longitudes. It is bounded by Nepal in the north, Jharkhand
in the south, Uttar Pradesh in the west and West Bengal in the east.
On the basis of physical features the state is characterised by Bihar Plain which is the part of the
great Indo-Ganga Plain. It is divided into two regions, i.e., (i) The North Bihar Plain - is a riverine plain which
extends between the 'Tarai' bordering Nepal in the north
upto the northern bank of Ganga river in the south except a large chunk of Siwalik hills in the northern part of
Pashchim Champaran district. The general slope is towards the south-east, (ii) The South Bihar Plain -
extends roughly from 150 metres in the south upto the
bank of the Ganga river in the north. The general slope is towards the north-east. This plain is rather a
sandwiched area between the southern plateau and
Ganga river. There are numerous isolated hills such as
Barabar, Rajgir and Kharagpur which are located in this
tract.
Bihar has a very ancient, glorious and colourful history. It was the home state of the Mauryan emperors.
Under Ashoka the Great, Magadha and its capital
Pataliputra became famous allover the world. Under the Sultans of Delhi and later under the Mughal emperors,
Bihar was reduced to the states of a province. When Sher Shah occupied the throne of Delhi, Bihar once again
shot into limelight. Bihar enjoyed a period of peace and
22
stability under Akbar and the later Mughals. The British wrested this area from the Nawab of Bengal. Under the
British, Bihar was first a part of the Bengal Presidency.
In 1911, Bihar was separated from the Bengal. In 1936, Bihar and Orissa became separate provinces. Thirteen
districts of Bihar were transferred and a new state Jharkhand was carved out of Bihar with effect from
November 1,2000. Bihar state has recorded 42 districts
during 1981-91. During 1991-2001, eight new districts were created forming the total number to 37 in Census
2001. The number of sub-districts are 533. There are 45,098 villages and 130 towns (125 statutory and 5
census towns). The state spreads over an area of 94,163
km2 with Pashchim Champaran as a largest area of 5,228 km2 and Sheohar with the lowest area of 349 km2
only.
The state has registered a total population of
82,998,509 comprising of 43,243,795 males and 39,754,714 females according to the Census 2001. The density of population is 881 persons per km2. Sheohar
district with smallest area (349 km2) and has the highest density of population (1,478) whereas Jamui district has
the lowest density of population (452) among all the districts in the state. The highest sex ratio is recorded
by Siwan district (1,031) and the lowest by Munger district
(872). The state has recorded 28.62 per cent decadal growth rate during 1991-2001. Among 37 districts,
Sheohar district has registered the highest decadal growth rate (36.61) and Nalanda district with only 18.75 per cent
growth rate during this period.

c
Q
H A
BOUNDARIES:
INTERNATIONAL
STATE
DISTRICT
C.D. BLOCK
R
I MAP 11 1
BIHAR ADMINISTRATIVE DIVISIONS 2001
KILOMETRES
40 o 40
p
K H
23
80
A L
HEADQUARTERS:
STATE .. . ' " ... *:
DISTRICT ...•
Where the district name differs from its headquarters name, the latter is given within brackets.
__J
<C (9
2 IJ.J
CO
SIKKIM
S ikkim is a hilly state and situated in the northeastern region of India. It lies between 2r 04' 46"
and 28° 01' 48" north latitudes and 88° 58" and 88° 55' 25" east longitudes. It is bounded in north by
Tibet (China), in east by Tibet (China) and Bhutan, in
south by West Bengal and west by Nepal.
Physiographically the state of Sikkim falls in the region of North-Eastern Himalayas and known as
Sikkim Himalaya. The state consists of nearly two thirds of very high mountains covered with snow. The state,
being a part of inner mountain ranges of Himalayas, is
hilly having varied elevation ranging from 300 to 7,000
metres. The highest peak known as Kanchenjunga (8,595 m) formed in the north-west portion is also the
third highest peak in the world. The great Himalayas in
Sikkim run eastwards from Kanchenjunga to Kanchengyao (6,889 m). A number of glaciers descend
from the eastern slopes of Kanchenjunga into Sikkim where snowline is found normally above 5,300 metres in
Sikkim. The biggest of them is Zemu glacier. River Tista originates from this glacier.
Sikkim became a state of the Indian Union under the Constitution (Thirty eight Amendment) Act, 1975
which came into force with retrospective effect from 26th
April, 1975 when the amending bill was originally passed by both Houses of Parliament. Sikkim was declared a full fledged state to the 36th Constitutional Amendment
Act of 1975. It was an uni-district state which was divided
24
into four districts, i.e. North District, West District, South
District and East District during 1971-81. The district
boundaries in Sikkim state remained unaffected upto
Census 2001. Hence, the total number of district recorded
in Census 2001 are four. The number of sub-division in
the state is 9 with 452 villages. There are nine towns in
the state. Out of these 8 are statutory and 1 census town. The state covers an area of 7,096 km2
. Among
these districts, North district has the largest geographical
area of 4,226 km2 and South district has the smallest
area of 750 km2.
Sikkim has a total population of 540,851
according to the Census 2001. Out of which 288,484
are males and 252,367 females. Among the districts,
the maximum population is observed in East district with
245,040 persons and minimum in North district with
41,030 persons. The average population size of the
districts in Sikkim is 135,212. The state has the density
of 76 persons per km 2 . The highest density is observed
in East district with 257 persons per km2 whereas North
district with the lowest density of 10 persons per km2.
The highest sex ratio in the state is recorded by West
district (929) and the lowest by North district (752). The
state has recorded 33.06 per cent decadal growth rate
during 1991-2001. Among all the district in the state,
East district has recorded the highest growth rate of
37.31 per cent and West district is the lowest with 25.57
per cent decadal growth rate during this period.

SIKKIM ADMINISTRATIVE DIVISIONS 2001
KILOMETRES
5 0 5 10
\
I
West
2
2
South • -····-··· ... \,(GYaIShin~) _ ..
' •• ~" ... , •• ,~ _ ••• ' _ _ o_
o
• (Namchi) 2
s T 8 E
BOUNDARIES:
INTERNATIONAL .. .
STATE ...... ... .. .
DISTRICT .. . ... .. . .. .
SUB-DIVISION .. . .. .
. :'
1 MAP 12 1
North
z (Mangan)
•
25
I
»
: -2
.' _.--' 3
HEADQUARTERS:
STATE .. . .. . .. . * DISTRICT ... .
Where the district name differs from its headquarters name, the latter is given within brackets .
ARUNACHAL PRADESH
The hill state of Arunachal Pradesh lies between
26° 28' and 29 0 30' north latitudes and 91 0 3' and
97" 30' east longitudes on the eastern most corner of India. Arunachal Pradesh is surrounded by countries of
Bhutan, China and Myanmar in the west, north and east.
Assam and Nagaland states border it in the south.
Arunachal Pradesh falls in the Northern Mountain region of the country which can be divided into two
regions, i.e., (i) Western Arunachal Pradesh Himalaya and (ii) Eastern Arunachal Pradesh Himalaya. The chief
characteristics of the region is lofty range of about 5,000
metres with intermittent summits. Weather is damp and
cold and the forests are dense. Annual rainfall ranges
between 250 and 350 cms.
The British took possession of Assam in 1838. Originally known as the North East Frontier Agency
(NEFA), it was placed under the administration of the
Union Government in 1948. The Union territory of North
East Frontier Agency was renamed as Arunachal Pradesh
under the North-Eastern Areas (Reorganization) Act, 1971. There were 5 districts in 1971. During 1971-81
number of districts increased to 9. It became a full
fledged state on February 20,1987. Two new districts
were created in 1991 which increased the number of
district to 11 and further in 1991-2001 to 13. In Census 2001, Arunachal Pradesh has registered 13 districts, 149
26
sub-districts and 56 CD Blocks. There are 4,065 villages
and 17 towns, all these towns are census towns. The
state spread over an area of 83,743 km2. Among the districts, Dibang Valley has the largest geographical
area of 13,029 km2 and Tawang is the smallest area of 2,172 km2
•
Arunachal Pradesh state has a total population
of 1,097,968 as per Census 2001. Out of which
579,941 are males and 518,027 females. Arunachal
Pradesh is a thinly populated state due to hilly terrain.
The population density of the state is only 13 person
per km2 as against 10 in Census 1991. The highest
population density is recorded as 42 in Tirap district
whereas the lowest being 4 in Dibang Valley district.
Sex ratio in the state has considerably improved in
Census 2001 with 893 as against 859 in the Census
1991. The highest sex ratio is recorded in East
Kameng district with 985 females per 1,000 males and
the lowest sex ratio with 754 females per 1,000 males.
During the decade the 1981-1991 and 1991-2001 the
population of Arunachal Pradesh has decreased from
36.83 per cent in 1991 to 27.00 per cent in 2001.
Papum Pare district has registered the highest
percentage decadal growth of population (67.56 per cent)
and Upper Subansiri district the lowest with only 10.50
per cent growth rate.

z
-
o <0
o CO
rJ)
Wo Cl::'<t f-W :20 ON ....J
S2 o
o N
27
B
(f) 0::: w ~ « :J a o « w I
lt)
Wo::: ~I-I-(/) (/)0
lt)
0::: l(/)
o
w _J
t) 0::: t)

NAGALAND
N agaland state is a border region in the north-east
of the country. It lies between 25° 11 '55" and 2r 2'10" north latitudes and 93° 20' and 95° 17'10" east
longitudes. The state is bounded by Myanmar in the east,
Arunachal Pradesh in the north, Assam in the west and Manipur in the south.
From physiographical point of view, the state of
Nagaland can be divided into three regions, i.e., (i)
Western Low Range - all along the western border runs a low range with an altitudes between 150 to 610 metres
above the mean sea level, (ii) Middle Hilly Range - except
for Japvo area in Kohima district, a continuous hilly range
with altitude between 610 to 1,219 metres runs through the middle of the state from south-west to north and
north-east like a spinal column and (iii) Eastern
Mountainous Region - this region unlike the first two divisions does not maintain a continuous range but
composed of hills and mountains ranging between 610 and 2,438 metres. This region form the great watersheds
between Burma and the state.
Nagaland state comprises of the former Naga
Hills district of Assam and the former Tuensang Frontier
Division of the North East Frontier Agency. Till Census
1951, the districts of Naga Hills and Tuensang were known as Naga Tribal Areas of Assam state. This area
was declared Naga Hills - Tuensang Area of Assam as
an administrative unit as per the Naga Hill - Tuensang Area Act, 1957. This Union territory was given statehood
and renamed as Nagaland under the State of Nagaland Act, 1962. There were 3 districts in Census 1971. During
28
1971-81, 4 new districts were created which increased
to 7 districts and remained unchanged upto 1991. One
new district was added and increased the number of
districts to 8 in Census 2001. In Census 2001, Nagaland
has recorded 8 districts, 93 sub-districts and 52 CD
Blocks. There are 1,317 villages and 9 towns. Out of
these towns 8 are statutory towns and one census town.
The state covers an area of 16,579 km2. Among the
districts in the state, Tuensang district has the largest
geographical area of 4,228 km2 whereas Dimapur district
is the smallest in size with an area of 927 km2.
Nagaland has recorded a total population of
1,990,036 persons according to the Census 2001. Out
of which 1,047,141 are males and 942,895 females. The
average population size of the districts in Nagaland is
248,755. In 1991 Nagaland state earned the distinction
of being the most fecund state in the country with the
highest decadal growth rate of population during the
decade 1981-1991 among all the states/Union territories.
That distinction is being retained in Census 2001 also
with 64.53 per cent. Density of population in Nagaland
state has gone up from 73 persons per km2 in 1991 to
120 persons per km2 in 2001. The highest population
density is recorded as 333 persons per km 2 in the district
of Dimapur whereas the lowest being 73 persons per
km2 in the district of Phek among all the districts in the
state. The highest sex ratio in the state is recorded by
Zunheboto district with 947 and the lowest by Dimapur
(854) during Census 2001.

NAGALAND ADMINISTRATIVE DIVISIONS 2001
KILOMETRES 10 o 10 20 30
12
11
BOUNDARIES:
INTERNATIONAL
STATE .............. .
DISTRICT ., . ..... , .. .
CIRCLE
7
p
29
2 " 4
J.- . ' _____ ,
- - -', , "
{_~:r·J 6
5
" MOk~i<cJi'':jiig'''' -', 4
•
u
'_ ,//" " "'-:
5
... ,_:",.
2
' ,_ . , .ro,
5
Man •
\. 8 ,_-- --_'.-- -'------,;r/ f>.o
7
11 3
· ... 12 <,' .~ -. - . / -.
13
I 7
• Tuerisang ,~-. . --"'---,
HEADQUARTERS:
STATE ... ...... * DISTRICT ... ... •
I MAP 14 1

MANIPUR
M anipur is located in the north-eastern part of India and extends between 92° 58' and 94° 45'
east longitudes and 23° 50' and 25° 42' north latitudes. It is bounded by Nagaland in the north, Mizoram in the south and Assam in the west. It faces the International
boundary with Myanmar in the east.
Physiographically the state can be divided into two regions, i.e., (i) Manipur Hills and (ii) Imphal Valley. It is a landlocked isolated hilly state having a distinct geographical entity. It is almost rectangular in shape with
a valley encircled by mountain ranges. This hills forms an oval rim encircling the Imphal valley region. The
average elevation of the valley is 790 metres and spreads over an area of 1,843 km2. Loktak lake, the biggest fresh lake in the north-eastern India, lies in the southern part of this valley. The Manipur Hills are spread from the north to south direction with an average height ranging between 1,500 to 1,800 metres. Some of the hills on the northern parts of the state have a height around 3,000 metres.
In 1872, Manipur was a Province supervised by a political agent under the direct orders of the paramount power. In 1921 Manipur lost its status of a province and merged in Assam Province as a Princely state. This
Princely state was constituted as independent administrative unit in the Indian Union and declared as Union territory under the state (Reorganization) Act, 1956. Manipur was then uni-district. In 1971 Manipur was given statehood under the North-Eastern Areas (Reorganization) Act, 1971 and was bifurcated into five districts which
30
increased to six in 1981. The total number of districts increased to eight during 1981-91. During Census 2001
one more district is added in Manipur. Hence, this state has recorded 9 districts, 38 sub-districts, 33 towns (28 statutory towns and 5 census towns) and 2,391
villages. The total area of the state is 22,327 km2. The largest district of the state is Churachandpur which covers an area of 4,570 km2 whereas the smallest district
is Bishnupur which has recorded only 496 km2 of area.
According to the Census 2001 the population of Manipur stands at 2,293,896 persons including the estimated population of Mao Maram, Paomata and Purul sub-divisions of Senapati district. Out of these population there are 1,161,152 males and 1,131,944 females. In 1991 the population of the state was 1,837,149 persons showing a growth rate of 24.86 per cent during 1991-2001. Average population size of a districts in Manipur is 254,877.lmphal West has the maximum concentration of population (444,382 persons) and minimum population is registered in Tamenglong district (111,499 persons). Population density calculated for the state is 103 persons per km2. At the district level population density is the highest in fmphaf West district (856 persons per km2). The lowest density is recorded in Tamenglong which has recorded only 25 persons per km2. Manipur has registered a sex ratio of 974 females per 1,000 males. The highest sex ratio has been recorded in Imphal West district with 1,004 females per 1,000 males closely followed by Bishnupur district where 993 females per 1,000 males are recorded. The lowest sex ratio of 916 is noticed in the Ukhrul district.

MANIPUR ADMINISTRATIVE DIVISIONS 2001
KILOMETRES
10 o 10 20 30
//i····N······ ... /·······) ./ . - (/
// Tamenglong
3
{ ... > .................. ( ..... .
4
3
. . Churachandpur • 4
5
S - Senapati
BOUNDARIES:
INTERNATIONAL .. .
STATE
DISTRICT ..... . ... .. .
SUB-DIVISION .. . .. .
31
1 MAP 15 1
~ . ' .
,c_ • • _ •• ' •• • • ,
:: Senapati '\. 3
" , _ . Ukhrul •
2
....... ··A
3
4
• Chandel
3
HEADQUARTERS: STATE .... ... .. --/:{ DISTRICT ... •
Where the district name differs from its headquarters name, the latter is given within brackets.

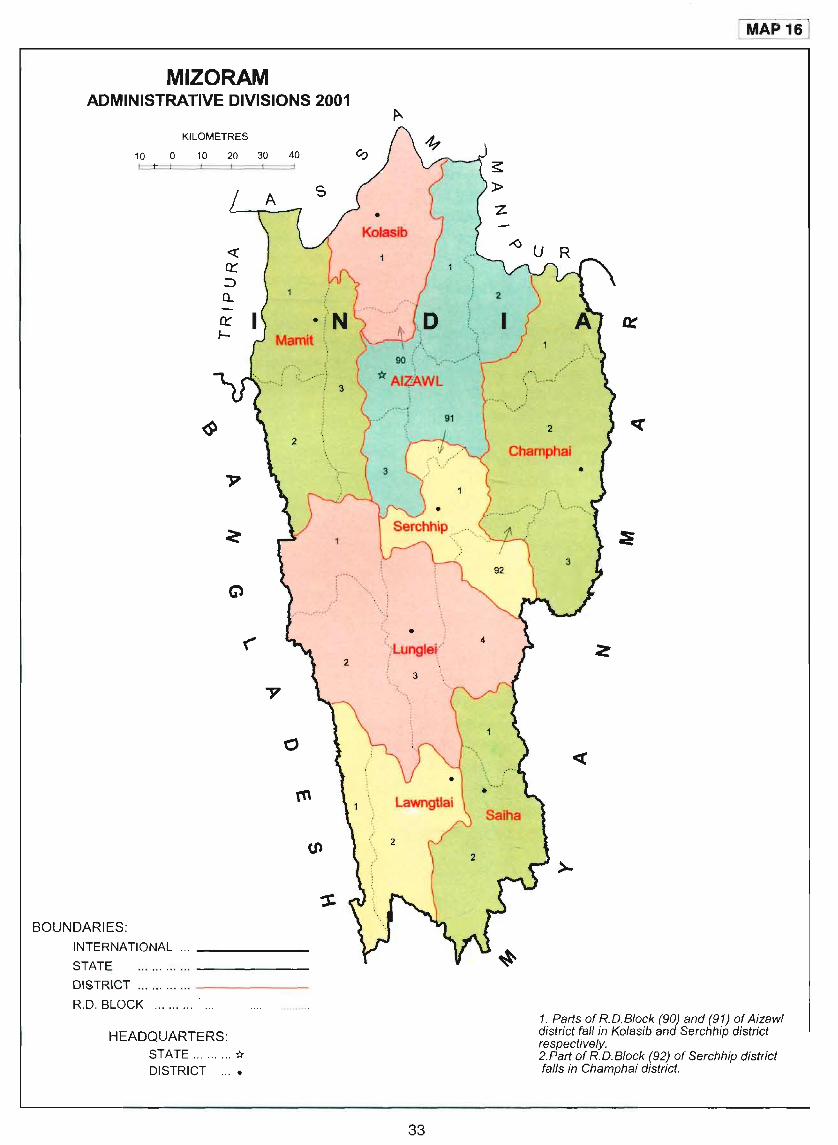
MIZORAM
M izoram is located in the north-eastern part of the country. It lies between 21 0 57' and
24 0 31' north latitudes and 92 0 15' and 93 0 22' east longitudes. It is bounded on the north by states of
Assam and Manipur. On the east and south by Myanmar and on the west by Bangladesh and the state of Tripura.
Mizoram state falls under the Eastern Hill zone and named as Mizo Hill Zone. It consists of ranges of hills running from north to south in parallel series
separated from one another by narrow valleys with only a very small portion lying on the plain. The average height of the ranges is about 900 metres. Some of the
peaks rise over 1,828 metres in height. In general, the hill ranges of the eastern parts of Mizoram are higher than those of the west. The hills on the southern part are generally smaller. The highest point being the Blue
Mountain (2,165 m). The most important rivers are Tlawng, Sonai and Tuivawl.
The Mizos belong to the Mongolian race. They seem to have settled at first in the Shan state of Burma. The tribes left Burma and moved westwards
into India. They occupied the Lushai Hills. During the British administration, the Mizos raided British territories. The British army occupied their territory in 1898, the entire Mizo territory was formed into the Lushai Hills District and made part of Assam. After
independence, Mizoram (Mizo Hills) become a district of Assam. Mizo Hills district of Assam was declared
32
Mizoram Union territory under the Assam Reorganization Act, 1969 and North-Eastern Areas
(Reorganization) Act, 1971. During 1981, uni-district Union territory was divided into 3 districts and remained unchanged upto Census 1991. During 1991-2001 number of districts increased to 8. In Census 2001, Mizoram has recorded eight districts, twenty two sub-districts, twenty two statutory towns and 817 villages. It covers an area of 21,081 km2. Among all the eight districts of the state, Lunglei has the largest geographical area of 4,536 km2 whereas Kolasib is
the smallest with an area of 1,382 km2.
The state has a total population of 888,573
according to the Census 2001. Out of which 459,109
are males and 429,464 females. The decadal growth rate is 28.82 per cent in the decade 1991-2001 which
is 10.88 per cent lower than the growth rate of decade
1981-91 (39.70 per cent). Among all the districts,
Kolasib has recorded the highest growth rate of 47.12
per cent whereas Mamit is last in the list with a negative growth of 2.77 per cent. The state has the
density of 42 persons per km2. The highest density of
population is recorded in Aizawl district with 91 persons
per km2 and lowest density is recorded in Mamit with
only 21 persons per km2. The highest sex ratio is
observed in Serchhip district (967) and the lowest by
Mamit (896). The sex ratio of the state as a whole is
935 during Census 2001.
MIZORAM ADMINISTRATIVE DIVISIONS 2001
KILOMETRES
10 0 10 20 30 40
2
BOUNDARIES: INTERNATIONAL ... _ _ _ _ _ _
STATE ............ -------DISTRICT ... .. , .. . ... -------
R.D. BLOCK ... ... . ..
HEADQUARTERS: STATE ... ...... "* DISTRICT ... .
\0 90
.. '.' ... \.... .' . . , ... ~~ .... .-
'(( AlzAWl
"~'.'!' , 91
• i'ilUngJe~)
3
33
I
..... -,
I MAP 16 1
., ... -
2
Champhai
1. Parts of R.D.Block (90) and (91) of A iza wI district fall in Kolasib and Serchhip district respectively. 2.Part of R.D.B/ock (92) of Serchhip district falls in Champhai district.
TRIPURA
The state of Tripura is situated in the north-eastern
part of Indian Union. The state lies between
22 0 56' and 24 0 32' north latitudes and 91 0 09' and 92 0
21' east longitudes. The state is bordered with Assam
and Mizoram in the east and Bangladesh mainly in the north, west and south as land locked in three directions.
Physiographically the state is divided into two regions, i.e., (i) Tripura Plain and (ii) Tripura Hills
characterised by the longitudinal hill ranges extending from north to south and intermittent low valleys which
are lying in between the hill ranges. Some smaller low
ranges may also be noted in the central part of West Tripura. The West and South Tripura have greater extend of valley areas. Most of the rivers originating from these hilly regions are flowing towards north-western parts of
the state and finally enters in Bangladesh. The plain
area of the state which is generally below 15 metres in height, often has intermitted hills. The Tripura Hills cover
the North Tripura and Dhalai districts. Tripura has no mountains but there are six major hill ranges in the
region. The highest peak is 939 metres found in TripuraMizoram boundary.
It may be stated that there are historically different opinions on the origin of Tripura. A more probably opinion is that the name was derived from the words
'Tui' and 'Pra'. In Tripuri language the 'Tui' means 'water'
and 'Pra' means 'near' i.e. the land was known as Tripura as significant as the land adjoining the waters. The
name Tuipra was subsequently corrupted into Tipra and
then Tippera to Tripura. Tripura was a Princely ruled
state till October 14, 1949. It was merged into Indian
Union on October 15, 1949 and became a part C state
34
under the Government of India. Under the North-Eastern Areas (Reorganisation) Act of 1971, Tripura became a
full-fledged state in India on January 21, 1972. The uni
district, Union territory of Tripura after attaining the statehood was divided into three districts during 1971
and remained unchanged. During 1991-2001, one new
district was created which increased the number to 4 districts. These districts are North Tripura, West Tripura, South Tripura and Dhalai (new). In the state there are
38 CD Blocks and 870 villages. There are 23 towns. Out of these, 13 are statutory towns and 10 census
towns as per the Census 2001. The total area of the state is 10,486 km2. Among these four districts, South
Tripura has the largest geographical area of 3,057 km2
whereas North Tripura is the smallest in size with an
area of 2,036 km2.
The state has a total population of 3,199,203
persons of which 1,642,225 are males and 1,556,978
females. Average population size of the district in the
state is 799,800 persons. West Tripura has the
maximum population of 1,532,982 persons and the
minimum population of 307,868 persons in new district
of Dhalai. The state indicates the decadal growth of
population of 441,998 persons (16.03 per cent) as
increasing from 2,757,205 in 1991 to 3,199,203 persons
in Census 2001. The density of population in the state
is 305 persons per km2 which is less than India's average of 313 persons per km2. The state has
recorded a sex ratio of 948 females for 1,000 males.
The highest sex ratio in the state is recorded by West
Tripura and North Tripura districts (951) and the lowest
by Dhalai (935).

1 MAP 17 1
TRIPURA ADMINISTRATIVE DIVISIONS 2001
KILOMETRES 10 o 10 20 30
6
. ". « '.._ -_.;. , ,
''!:--- .. N'. 5 ~\D 2 , '-',
I .-3
,t, .. ······- ... ',
* W~st-·-f~ipurn·":\:::····) 6 )'--.-:;'
-... ,,--- · .. ----...._l" Dhalai .j '.
A 0:.
o f\J
( .. ~
AGi(RTALA 8 i.····· .. ····-· (.'.::.-... :" ' . . , ,.-<. ... L., .. _---, ____ . :-"- ' .. -' _---, 7
-- .. _ 10 9 .. _"---""! '------
11
'--',
2 ..... .--/ .. _
/ --\. __ -. ~:-(Udalp~r) ,: South\Tripura
4 3 -_ .......... <__.. . ..--:_ ... :.".-._-
",,,/: 8
<C .. -'. 7
.... _'." _ .. ' -
/--------------) 9
10
B
HEADQUARTERS: STATE .. . ..... . * DISTRICT ... •
35
\ " 7
(Dalubari)'--:,:_- --" • -4
3
Q
BOUNDARIES: INTERNATIONAL
STATE
DISTRICT
............... .. . ------...... . .. .. _ ... ------
DEVELOPMENT BLOCK _ .. ........ -- ... -...... -- ---- ------- -
Where the district name differs from its headquarters name, the latter is given within brackets.

MEGHALAYA
Meghalaya is known as the abode of clouds and it is situated in the north':eastern part of the country.
It lies between 25° 2' and 26° 6' north latitudes and 89° 48' and 92° 50' east longitu-cles. The state is
surrounded by Assam state in the north and east and by Bangladesh in the south and west.
Meghalaya state is a part of Eastern Hill region
and can be divided into two regions, i.e., (i) The Eastern Meghalaya and (ii) The Western Meghalaya. The Eastern Meghalaya region is hilly except in some small areas in the northern part where the region faces the
Brahmaputra valley and the southern part where it merges with the plain of Bangladesh. The Shillong
plateau, which lies in the central part, is the most
remarkable feature of this region. The Shillong Peak is the highest at an altitude of 1,693 metres from mean sea level. The Western Meghalaya region is conspicuous with low hills and plains in the northern, western and southern parts. The highest peak is Nokrek Peak having 1,411 metres height in this region.
During British period, the Meghalaya was under
Bengal Province in Assam division. Garo Hills and Khasi & Jaintia Hills were under British districts whereas Khasia states under Princely states. During the decade
1961-71, Assam was reorganized and Meghalaya was declared an Autonomous state on 2nd April, 1970 under the Assam Reorganization (Meghalaya) Act, 1969 and North Eastern Areas (Reorganization) Act, 1971. In 1971,
the state was comprised of 2 districts. During 1971-81
36
number of districts increased to 5 and remained
unchanged during 1991. During 1991-2001, two new
districts, Ri Bhoi and South Garo Hills, are formed by
bifurcating the old districts of East Khasi Hills and
West Garo Hills. The number of districts in the state
increased from five in 1991 to seven in 2001. Besides
there are 32 sub-districts and 6,026 villages in the
state during Census 2001. There are sixteen towns. Out
of these, ten are statutory towns and six census towns.
The state covers an area of 22,429 km2. Among all
districts of the state, the smallest geographical area of
1,849 km2 is observed in South Garo Hills whereas the
highest area of 5,247 km2 in West Khasi Hills.
According to Census 2001, the total population
of the state is 2,318,822. Out of this figures 1,176,087 are males and 1,142,735 females. Sex ratio of the
state is 972. Ri Bhoi district rank last in sex ratio of
941 and Jaintia Hills rank the first with 996. Density of
population of the state is 103 persons per km2. At the
district level, highest density of population is recorded
in East Khasi Hills with 234 persons per km2 and the
lowest in South Garo Hills with only 55 persons per
km2. Average population size of the district in the state
is 331,260. East Khasi Hills has the maximum
population of 660,923 and the minimum population is
observed in South Garo Hills (100,980). Ri Bhoi district
has registered the highest decadal growth of 51.43 per
cent whereas East Khasi Hills district has lowest with
22.87 per cent during the decade.
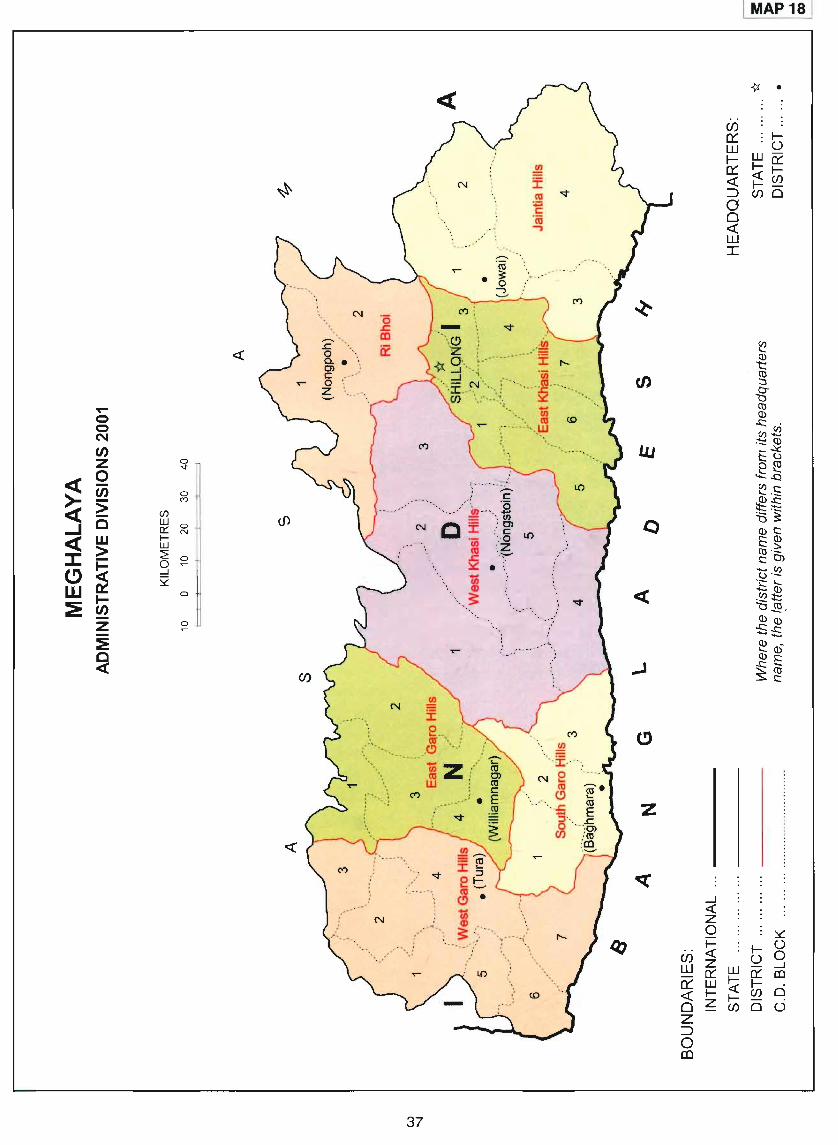
N '0 ..c::
~ co
..c:: ii: e::( 0 0... OJ C 0 Z '-'
~
0 0 N U) Z 0
"V
<C 0 U) 0
~ > C')
(/) cj) C w
0 0::: N
<C w f-W
::I: > ~ 0
~ 0
C) _l
SZ W I-
0
:E U)
z ;:> -::e ~
(/)
~
,,: c .... ,'/ 2: '--.. ~
N C :f ) g' ": 0 t.O
~ :,,~
37
.. . .... (i)
• <l> ..... s: -- ,
(/)
Q
, ,,,,"
" __ 1,:/
z
I MAP 18 1
.....J « z 0 ~
~ I-- ()
Cf) () 0 Z .....J W a::: w a::: en
0::: w ~ I--e::( I-- I--
CI) 0 0 Z CI) 0 ()
Z ::J 0 III

ASSAM
The state of Assam is located in the north-east corner of the India between 24° 13' and 28° north
latitudes and 89° 46' and 96° 4' east longitudes. It is
bounded by Bhutan and Arunachal Pradesh in the north and north-east, Mizoram in the south, Tripura,
Meghalaya, West Bengal and Bangladesh in the west
and south-west respectively. The states of Nagaland and Manipur is located in the east.
Assam state as a whole is composed of a
combination of both hills and plain and physiographically can be divided into two region, i.e., (i) Eastern Hill Zone - covering Cachar Plain and Karbi Anglong &
North Cachar Hills (ii) Brahmaputra Valley - covering western Brahmaputra Valley, Central Brahmaputra
Valley and Eastern Brahmaputra Valley. The state is
bounded by lofty hill ranges in all three sides except in the west with a small opening that links it to the great Ganga plain. The most dominating feature in the
topography of Assam is the course of the river Brahmaputra. It has carved out its own valley between
two parallel ranges, i.e., the Arunachal Himalayas in the north and the central Assam Range known as the
Shillong Plateau in the south. To the south-east of the Shillong Plateau, there lies another beautiful green patch of land, which is very fertile and known as the Bark
Valley.
In 1826 the Burmese vacated Assam. In 1832 Cachar was annexed to Assam. In 1835, the Jaintia
Hills were made part of Assam. In 1874 a separate
province of Assam was created with Shillong as capital. On the partition of Bengal in 1905, Assam was united
to the eastern districts of Bengal. On the partition of India, almost the whole of the predominantly Muslim
district of Sylhet was merged with East Bengal (present Bangladesh). In 1948 the North East Frontier Agency was separated from Assam. In 1963 Nagaland was
38
carved out of Assam. On 21st January, 1972 Meghalaya was bifurcated from Assam as a separate state and Mizoram became a Union territory in 1987. Assam lost a good deal of its former territory as a result of political changes from time to time. During 1961, there were 11
districts. It lost two districts and nine districts remained in 1971. In 1981, one district was added and there were ten districts. But in Census 1991, the boundaries of these districts were redrawn and increased the number
to twenty three districts and remained the same in
Census 2001. In Census 2001, Assam state has recorded 23 districts, 142 sub-districts, 219 CD Blocks and 125 towns. Out of these towns, 80 towns are
statutory and 45 census towns. There are 26,312 villages in the state. The state covers an area of 78,438 km2.
Among all the districts of the state, Karbi Anglong has
the largest geographical area of 10,434 km2 and Hailakandi is the smallest with an area of 1,327 km2.
Assam has a total population of 26,655,528 as per the Census 2001. Out of these 13,777,037 are males and 12,878,491 females. The state has recorded a density of 340 persons per km2. Dhubri has the highest density of population (585 persons per km2) whereas North Cachar Hills has the lowest density of population (38 persons per km2). The average population size of
the district in the state is 1,158,936. Kamrup district has recorded the maximum population of 2,522,324 persons and the minimum by North Cachar Hills (188,079). The sex ratio of the state is 935. Among the districts, the highest sex ratio is recorded by Goalpara district (956) and lowest by North Cachar Hills (884). The state has recorded 18.92 per cent decadal growth rate during 1991-2001. Among these districts, again Kamrup district has recorded the highest growth rate of 26.11 per cent and Kokrajhar district is last in the list with only 12.60 per cent decadal growth rate during the period.

I MAtl19 1
{r • S K
UJ CI) 0::: w l-
o I- U 0::: w-« l-et
«I-:::l I-~ a (J)O 0 « w
o I
..)
>
I)
1>-T"" 0 1-0 N rn -?
z 0 0 ex:.
Ci5 (0
:!: ~ (/)0 « W'<t
<C c e::: ~
en w wo
> ::?:N
~ 0
~ _J
:;;:::0
0 l- N
r::I / tv
rn -z -:E >-
~ «
z
~ «
I I-
w UJ _J _J
« (_) 2 0::::
m
0 u i= I-- UJ (J)«
W Z u :l
-0:::: UJ Q: Z O:::w ~
UJ I-- > «l- I--(J) UJ
0 2 (f) 0 0:::: Z ::J 0 m

WEST BENGAL
The state of West Bengal is located in the eastern most province and one of the bordering states of
the Indian sub-continent. It is situated between 21 ° 25' 02" and 27" 13' 15" north latitudes and 85° 49' 20" and 89° 53' 04" east longitudes. The state is bounded by the Kingdom of Bhutan and state of Sikkim in the north, Bihar, Orissa and Nepal in the west. The south is bounded by the Bay of Bengal and the east is by the neighbouring country of Bangladesh and Assam state.
The state of West Bengal can be divided into six physiographic regions, i.e., (i) Darjiling Himalayas, (ii) Barind Tract, (iii) Moriband Delta, (iv) Proper Delta, (v) Rarh Plain and (vi) Puruliya Uplands. The Oarjiling Himalaya region rises from the plains of North Bengal to attain great height. High terrain with steep slopes, prevailing heavy rains ranging from 3,000 to 3,500 mm is the main characteristics of the region. The Barind Tract is flat and alluvial soils composed of sand, clay and silt. The region slopes down towards the south-eastern direction along which the main rivers flows. The region of Moriband Delta is characterised by the pond like water bodies formed by the back water of rivers when over flows or flooded. The proper Delta region is gradually sloping towards southeast whereas the central part is a low lying area with swamps. The Rarh plain region, mainly the north-western part is characterised by the undulating upland which is formed by gradual descent from the Chotanagpur plateau. The Puruliya Upland is an extension of Chotanagpur plateau which comprises four prominent hills stretching in different directions, namely the Bagmundi Hills, Jaridih Sandstone Hills or Upper Kasai Basin, Panchet Hills and Manbazar Hills.
When Bengal was first constituted by the British as a province. It was a vast area including present day Bihar and Orissa and extended west wards upto Agra. In 1863, Agra was detached from Bengal but Assam was added to it. In 1874 Assam was formed into a separate province. In 1905, Lord Curzon divided Bengal into two provinces. A new province called Assam and East Bengal with its capital at Decca was carved out of old Bengal. The rest of the territory together with Bihar and part of Orissa formed Bengal. This event known as the partition of Bengal. After 1911, the new Bengal did not include Assam or Bihar. It was a compact area of over 200, 500
40
km2. When India became independent in 1947, Bengal was partitioned between India and Pakistan. While Pakistan's share came to be called East Pakistan, India's share was called West Bengal. In 1950 the Princely state of Cooch Behar was merged into West Bengal. The former French enclave of Chandranagore was added on October 2, 1954. Under the State Reorganization Act, some parts of Bihar were transferred to Bengal. It was then divided into sixteen districts and remains the same upto Census 1981. During 1981-91, one more district was added to the state. Again one more district was added in Census 2001 to increase the number to eighteen districts. In Census 2001, West Bengal state has recorded 18 districts, 341 sub-districts and 40,782 villages. There are 375 towns in the state. Out of which 123 are statutory towns and 252 census towns. It covers an area of 88,752 km2. The largest in term of area in the state is Medinipur district with 14,081 km2 whereas the smallest area is Kolkata with 185 km2.
The total population of the state is 80,176,197 persons during Census 2001. Populationwise West Bengal retains its position as the fourth largest state in I ndia as in 1991. The state has share of 7.79 per cent of the total population of the country but occupies only 2.70 per cent of the total land area. Out of the total population 41 ,465,985 are males and 38,710,212 females. West Bengal has the highest density of population among the states as 904 persons per km2
. The state also had the highest density at 767 heads per km2 in Census 1991. Kolkata with maximum density of 24,718 persons per km2 and Puruliya with minimum density (405 persons per km2). The decadal growth rate of the state has decreased from 24.73 per cent during 1981-1991 to 17.77 per cent during 1991-2001. Thus the decadal growth rate in the last decade has gone down by 6.96 per cent as compared to the previous decade. Likewise the maximum decadal growth rate is recorded in the district of Uttar Dinajpur with 28.72 per cent and the minimum with 3.93 per cent in Kolkata. Sex ratio in West Bengal has also improved substantially from 917 females per 1,000 males in 1991 to 934 females per 1,000 males in Census 2001. Districtwise the highest sex ratio of 955 is observed in Medinipur district whereas the lowest of 829 in Kolkata.

WEST BENGAL ADMINISTRATIVE DIVISIONS 2001
KILOMETRES 20 0 20 40 60
A KILOMETRES
5 0 5 10 15
',.\: ""
10 6 :'
"
·.···c:: },.'-'",,(Huglichinsurah). 1; . /::_;.· ·· · H~~ii·····'·'··;· · '
HEADQUARTERS: STATE ....... .. * DiSTRiCT .. . .. . .
BOUNDARIES: INTERNATIONAL .. .
STATE .... .. ... .... . . BAY DISTRICT
C.D. BLOCK ........ . ..... .
The district headquarters of South Twenty Four Parganas is located at Alipur.
41
Q.
IJJ
Q
..J
z
«
B - Birbhum K - Koch Bihar BO - Bangladesh
I MAP 20 I
Where the district name differs from its headquarters name, the latter is given within brackets,

JHARKHAND
The state of Jharkhand extends between 22° and 25° 50' north latitudes and 83° and 87" 75' east
longitudes. The state is bounded by Bihar in the north,
West Bengal in the east, Uttar Pradesh and Chhattisgarh in the west and Orissa in the south.
Physically Jharkhand is characterised by the
Chotanagpur Plateau which consists of a series of plateaux of different elevations. The most important are the Ranchi Plateau, the Ramgarh Plateau and the
Hazaribag Plateau. These regions are formed a rich mineral deposits. The average height of this plateau is
150 metres but there are many hillocks of 300 metres and even more. Dalma and Baghmudi are the main
ranges in this plateau. The region slopes towards the south-east direction.
Jharkhand is formed by carving out thirteen
districts from southern part of the former Bihar state on November 1, 2000. It is divided into 18 districts which is further sub-divided into 33 sub-divisions and 210 CD
Blocks. There are 152 towns in the state, out of which
44 are statutory towns and 108 census towns. It covers an area of 79,714 km 2
. The largest district is Pashchimi
Singhbhum with an area of 9,907 km 2 and the lowest district is Lohardaga with 1,491 km2 . The area which
42
comprises of Jharkhand state today contained only 25 per cent of the total population of the erstwhile Bihar at
the time of 1991 Census and possessed 46 per cent of the geographical area.
The state of Jharkhand has a population of
26,945,829 persons consisting of 13,885,037 males and
13,060,792 females. The population growth rate of the
state is 23.36 per cent, more than the all India average
of 21.34 per cent during 1991-2001. The population
density of the state is 338 which is higher than the
India's average (324) and much lesser than that of
Bihar state with 880. Among the districts, the maximum
density is notice in Dhanbad district with 1,147 persons
per km2 whereas the minimum with 148 persons per
km2 in Gumla district. The average population size of
the district in Jharkhand is 1,496,991. Among all the 18
districts, Ranchi district has recorded the maximum
population in the state (2,785,064) whereas Lohardaga district has the minimum population (364,521). Jharkhand
has recorded 23.36 per cent decadal growth rate during
1991-2001. Among all the districts, Pashchimi
Singhbhum has recorded the lowest growth rate of 16.49
per cent and Garhwa has recorded the highest growth
rate of 29.21 per cent during this period.
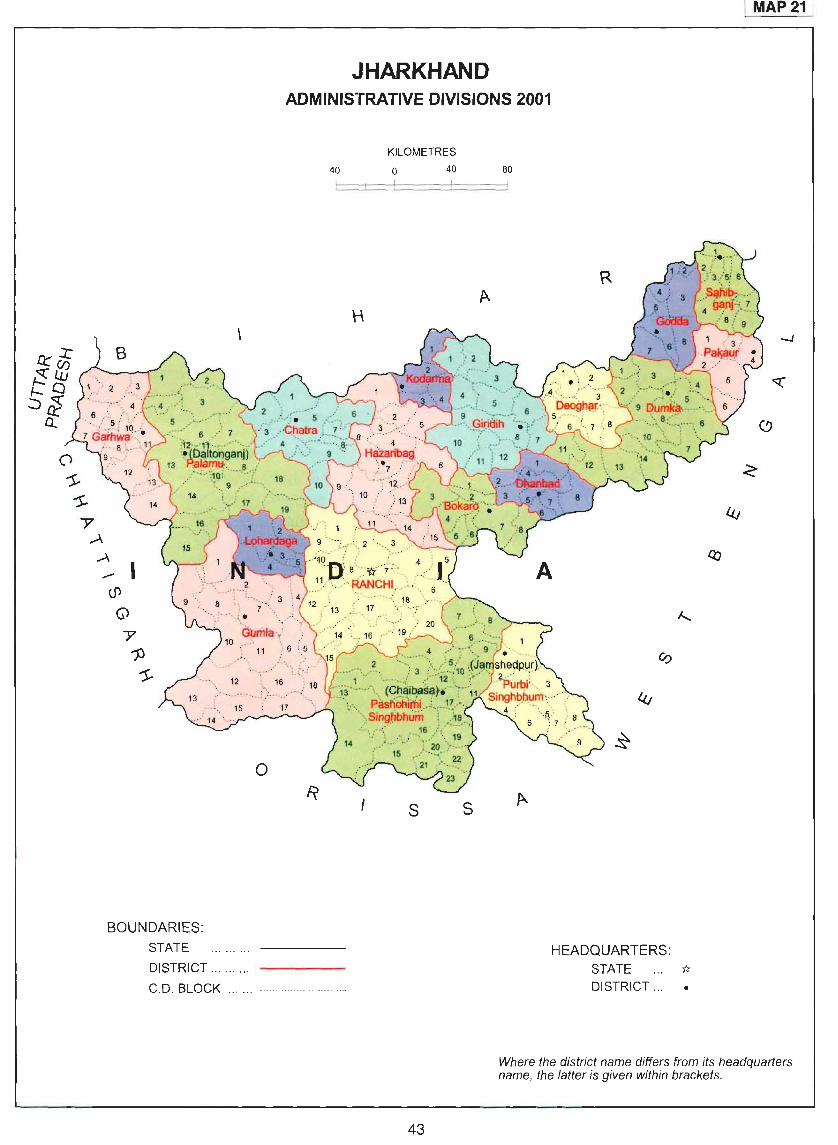
\
-
o
BOUNDARIES: STATE
DISTRICT ........ .
C.D. BLOCK ... .. _
MAP 21
JHARKHAND ADMINISTRATIVE DIVISIONS 2001
KILOMETRES
40 o 40
";10'/':.-' :' 4 : 5 -'0 ' 8 '---~,*'-'-7>: _j I .. 1.1/ 0> > ~~~~<~,: .. ~~ .C'~ '.
L . 17 ,._:'~' ··'T _.- -
R s
43
A
s
80
R
HEADQUARTERS:
STATE * DISTRICT ... •
Where the district name differs from its headquarters name, the latter is given within brackets.

ORISSA
Orissa is situated in the east coast of India. It lies between 1 r 48' and 22 0 34' north latitudes and
81 0 24' and 8r 29' east longitudes. It is bounded by Jharkhand in the north Chhattisgarh in the west, Andhra Pradesh in the south, West Bengal in the north-east and Bay of Bengal in the south-east.
Physiographically, Orissa is consisting of hill tracts and coastal belt. The large part of the state (78 per cent) is covered under hill tract. Remaining area is in Coastal belt. Even in these two physiographic regions, regional variations exist. Hilly tract of the
state may be divided into three district sub-regions, i.e., (i) the Northern Plateau, (ii) the Central Table
Land and (iii) the Eastern Ghats. The coastal tract of the state lies between the Eastern Ghats and the Bay
of Bengal. This too may be divided into three subregions differing widely in their physical characteristics, viz., the marshy woodland strip (Talahati area),
cultivated alluvial plain (Mughalbandi area) and the broken hills regions gradually ascending into the Central Table Land. Mahanadi, Brahmani and Baitarni are the
important rivers which drain the state. The biggest
and the most famous lake Chilka is found in this state.
Orissa state was part of the old Province of
Bihar and Orissa before 1936. As a result of the movement for the amalgamation of all Oriya speaking tracts into one state by the orders of the British
Government, Province of Orissa with 26 Princely states
44
and 6 British districts was separated from the Province of Bihar and Orissa and constituted as a separate
Province of Orissa in April, 1936. In 1947 British paramountcy over these Princely states lapsed and acceded to the Indian Union. During 1951 Census, 13 districts were recorded in this state and remained
unchanged upto 1991 which increased to 30 in Census 2001. The state has recorded 30 districts, 397 subdistricts, 314 CD Blocks, 51,349 villages and 138 towns. Out of these towns, 107 are statutory towns and 31
census towns. Mayurbhanj is the largest district with an area of 10,418 km2 closely followed by Sundergarh (9,712 km2). Smallest district in size is Jagatsinghapur
which has an area of only 1,668 km2.
According to the Census 2001, Orissa has
recorded 36,804,660 persons. In 1991 the state had
31,659,736 persons. Hence, during 1991-2001, 16.25
per cent growth rate is recorded. The state is one of the
less densely populated parts of India with a total
population of 36.80 million persons over an area of 155,707 km2
. The density of population works out at
236 persons per km2. Out of the total population recorded
in 2001, 18,660,570 are males and 18,144,090 females.
The sex ratio of the state is 972. Among the districts,
the highest sex ratio is observed in Gajapati with 1,031
and lowest in Khordha 901. At the district level, Ganjam
is the most populous district which has recorded 3,160,635 persons and Debagarh the lowest population
of 274,108 persons.

I-
c
.•...... Ma~k~~i~ ~ , -'r . .:'·<:;
A N
1 MAP 22 1
ORISSA ADMINISTRATIVE DIVISIONS 2001
BOUNDARIES: STATE
DISTRICT
POLICE STATION
20
KILOMETRES o 20 40 60
K H A
BAY OF BENGAL
HEADQUARTERS
45
STATE ... ... * DISTRICT .. .
Where the district name differs from its headquarters name, the latter is given within brackets.
CHHATTISGARH
The state of Chhattisgarh lies between 1 yo 46'
and 23 0 15' north latitudes and 80 0 30' and 84 0 23'
east longitudes. It is bounded by Uttar Pradesh and Jharkhand in the north, Orissa in the east, Andhra Pradesh in the south, Maharashtra and Madhya Pradesh
in the west.
Physiographically, the state is divided into two
regions, i.e., (i) Mahanadi basin and (ii) Chhattisgarh -Oandakaranya. Mahanadi basin is characterised by two major landforms i.e., the Chhattisgarh plain and the
undulating rim land. The height of plain ranges from 250 to 330 metres. It is bounded in the north by a series
of plateau and hills. The Maikal range runs in the northern part of Bilaspur and Durg districts and rises upto 900 metres. Chhattisgarh - Oandakaranya region comprises
of an undulating topography by well marked elevations and depressions. The region has forest clad hills and
plateaus but a few extensions of plain such as Godavari Sabari plain in the south. The elevation of plateau ranges
from 550 to 750 metres.
Madhya Pradesh was bifurcated to form Chhattisgarh as a new state on November 1, 2000.
Hence, Chhattisgarh is created by taking out seven
46
districts in the eastern part of the former Madhya
Pradesh. The total number of districts in the state recorded during Census 2001 are 16. There are 97 sub
districts, 146 CD Blocks and 20,308 villages. The state has 97 towns. Out of which 75 are statutory towns and
22 census towns. The state extended over an area of 135,191 km2. Among all the sixteen districts of the state, Dantewada has the largest geographical area of
17,634 km2 and Dhamtari is the smallest in size with an area of 3,385 km2
•
According to the Census 2001, the state has a
total population of 20,833,803 comprising of 10,474,218 males and 10,359,585 females. Sex ratio of the state
work out to be 989. The highest sex ratio is recorded
by Rajnandgaon district with 1,023 and the lowest by
Koriya district with 946. Density of population of the state is 154 persons per km2. Among these districts,
Janjgir Champa district has recorded the highest density of 342 persons per km2 whereas Dante-wada district has the lowest density of only 41. The decadal growth
rate in the state is 18.27 per cent during 1991-2001.
Among all the districts, Surguja has registered the
highest growth rate of 24.67 per cent and Mahasamund is last in the list with 8.73 per cent during the period.
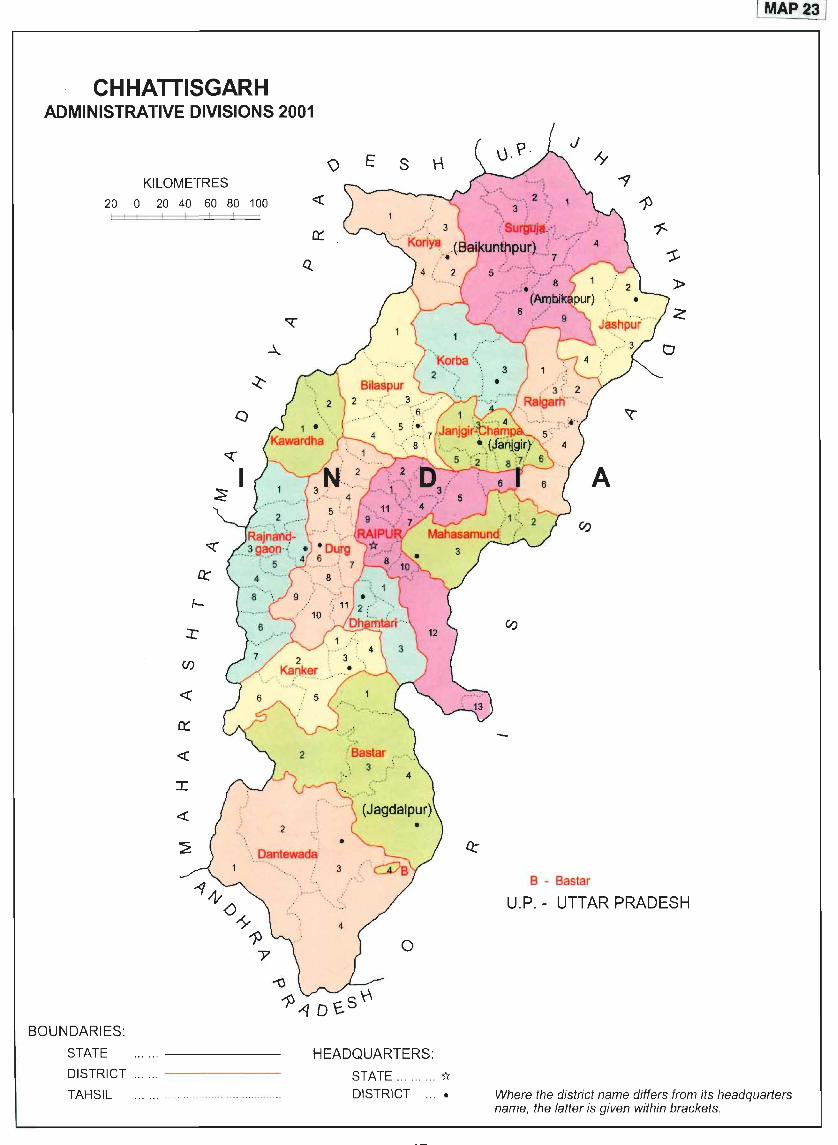
CHHATTISGARH ADMINISTRATIVE DIVISIONS 2001
20
BOUNDARIES:
STATE
DISTRICT
TAHSIL
0
KILOMETRES
20 40 60 80
Q
"{
I
~
,_ ::r:
Cf)
« 0::
« I
« , '2
\) E S \-\
100 «
0::
Q.
"(
.l...
.:z:.
'.- .. (Sastar ...... ,
_!> 3 r; .. -',--,",_,:':
o
HEADQUARTERS:
STATE ......... "* DISTRICT ... •
I MAP 23]
,y --<J
1J "1--
~
» z
A
B - Bastar
U.P. - UTTAR PRADESH
Where the district name differs from its headquarters name, the latter is given within brackets.

MADHYA PRADESH
The state of Madhya Pradesh lies between
1 r 46'55" and 25° 52'40" north latitudes and
74° 1 '55" and 82° 55' east longitudes approximately. The state is bounded by Uttar Pradesh in the north,
Chhattisgarh in the east, Maharashtra in the south and
Gujarat and Rajasthan in the west.
The state of Madhya Pradesh can be divided
into three physiographical regions, i.e., (i) Northern
Madhya Pradesh Uplands:- the general elevation is
between 300-600 metres with numerous hills which are
thickly forested. It is typically a ravine and derelict land
zone on account of erosion by the tributaries of Chambal
system, (ii) Central Madhya Pradesh Plateau:- in
general, Gneisses, Vindhyans and Gondwanas are fairly
represented here. Soils are primarily medium black to
deep black type and (iii) Southern Madhya Pradesh Uplands:- the region is generally represents black soils
and the whole region is densely forest. Annual rainfall
varies between 200-300 cm.
The state of Madhya Pradesh came into
existence on 1st November, 1956 by comprising entire
three states of Madhya Bharat, Vindhya Pradesh and
Bhopal. Sironj region of Rajasthan (sub-division in
Vidisha district) and Mahakoshal area, which was earlier
included in Central Province and Berar also added. On
1st November, 2000 and precisely in the midnight of
31 st October, Chhattisgarh which was earlier a part of
Mahakoshal area, had been taken away from Madhya
Pradesh state and form a new state of Chhattisgarh with an area of 135,191 km2• In 1961 the state was
48
comprised of 43 districts and remained same during
1971. During 1971-81, two new districts were added
which increased the number to 45. This number remained
unchanged upto Census 2001. In Census 2001, Madhya
Pradesh has recorded 45 districts, 259 sub-districts,
313 CD Blocks and 55,393 villages. There are 394
towns. Out of these 339 are statutory towns and 55
census towns. The state rank 2nd in terms of its
geographical spread and contributed 9.37 per cent to
the country's total area of 3,287,240 km2. Chhindwara
district has the largest geographical area of 11,815 km2
whereas Datia district is the smallest with an area of
2,691 km 2.
Madhya Pradesh stands at 7th largest state
according to population size. It has a total population
of 60,348,023 according to the Census 2001. Out of
this population 31,443,652 are males and 28,904,371
females. The sex ratio in the state has increased from
912 in 1991 to 919 in 2001 Census. Among the districts,
the highest sex ratio is recorded by Balaghat district
(9, 229) and lowest by Morena (822). The density of the
state is 196 persons per km2 which is less than the
country's density of 313. In the state, the highest density
of 665 is recorded in Bhopal district whereas the lowest
density of 78 in Dindori district. In the state, population
growth rate during Census 2001 has come down to
24.26 per cent from 26.75 per cent during 1991. Among
the districts, Indore district has recorded the highest
growth rate of 34.31 per cent and Balaghat district is
last in the list with only 9.67 per cent decadal growth
rate during this period.

~
'(-.
-<..
~
')
"'l.""
0:: I
-,
-<l
A R
BOUNDARIES:
STATE
DISTRICT.. ... .
TAHSIL .... . .
MADHYA PRADESH ADMINISTRATIVE DIVISIONS 2001
KILOMETRES
40 o 40 80 120
u
~ ~
» .-p
R A S H
D -- Datia
R A
A...
~
~ ~
HEADQUARTERS:
STATE ... ... "* DISTRICT .. . •
I MAP 24 I
oS
~ ~
~ (:)
c, ........
A...
Where the district name differs from its headquarters name, the latter is given within brackets.
49
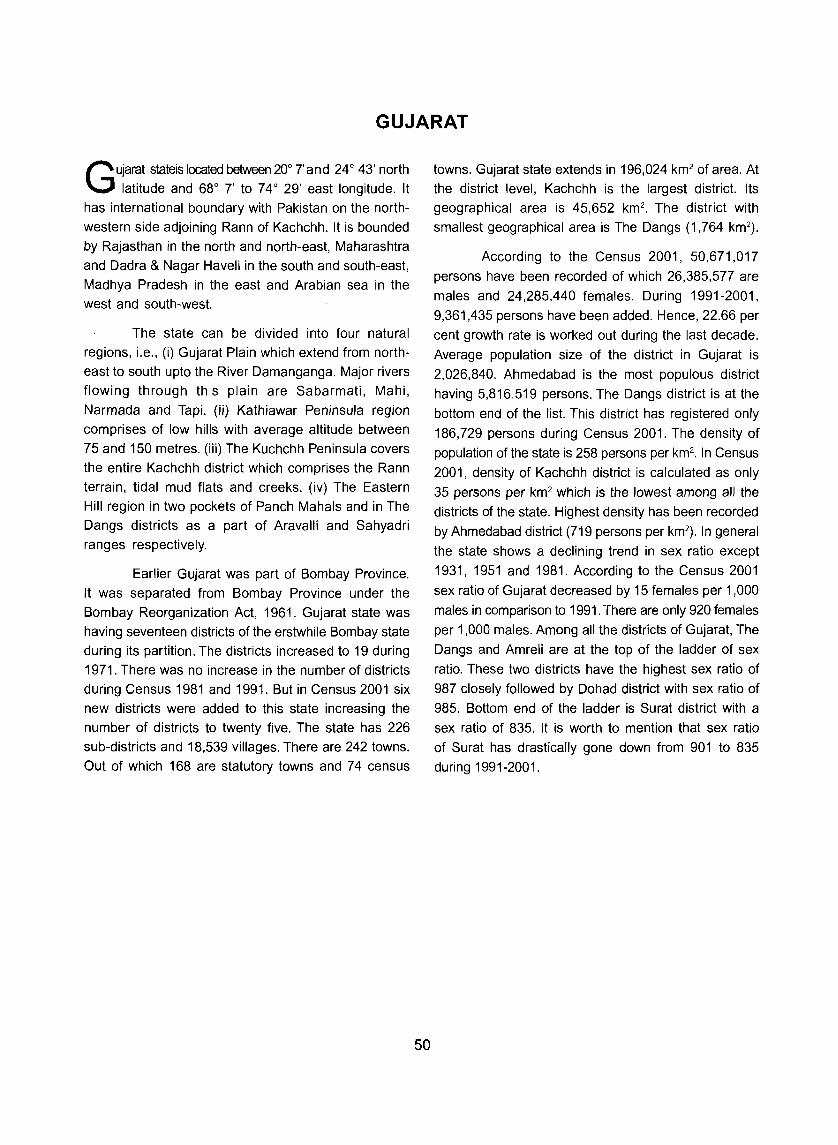
GUJARAT
GUjarat stateis located between 20° 7' and 24° 43' north
latitude and 68° T to 74° 29' east longitude. It
has international boundary with Pakistan on the north
western side adjoining Rann of Kachchh. It is bounded
by Rajasthan in the north and north-east, Maharashtra
and Dadra & Nagar Haveli in the south and south-east,
Madhya Pradesh in the east and Arabian sea in the
west and south-west.
The state can be divided into four natural
regions, i.e., (i) Gujarat Plain which extend from north
east to south upto the River Damanganga. Major rivers
flowing through this plain are Sabarmati, Mahi,
Narmada and Tapi. (ii) Kathiawar Peninsula region
comprises of low hills with average altitude between
75 and 150 metres. (iii) The Kuchchh Peninsula covers
the entire Kachchh district which comprises the Rann
terrain, tidal mud flats and creeks. (iv) The Eastern
Hill region in two pockets of Panch Mahals and in The
Dangs districts as a part of Aravalli and Sahyadri
ranges respectively.
Earlier Gujarat was part of Bombay Province.
It was separated from Bombay Province under the
Bombay Reorganization Act, 1961. Gujarat state was
having seventeen districts of the erstwhile Bombay state
during its partition. The districts increased to 19 during
1971. There was no increase in the number of districts
during Census 1981 and 1991. But in Census 2001 six
new districts were added to this state increasing the
number of districts to twenty five. The state has 226
sub-districts and 18,539 villages. There are 242 towns.
Out of which 168 are statutory towns and 74 census
50
towns. Gujarat state extends in 196,024 km2 of area. At
the district level, Kachchh is the largest district. Its
geographical area is 45,652 km2. The district with
smallest geographical area is The Dangs (1,764 km2).
According to the Census 2001, 50,671,017
persons have been recorded of which 26,385,577 are
males and 24,285,440 females. During 1991-2001,
9,361,435 persons have been added. Hence, 22.66 per
cent growth rate is worked out during the last decade.
Average population size of the district in Gujarat is
2,026,840. Ahmedabad is the most populous district
having 5,816,519 persons. The Dangs district is at the
bottom end of the list. This district has registered only
186,729 persons during Census 2001. The density of
population of the state is 258 persons per km2. In Census
2001, density of Kachchh district is calculated as only
35 persons per km2 which is the lowest among all the
districts of the state. Highest density has been recorded
by Ahmedabad district (719 persons per km2). In general
the state shows a declining trend in sex ratio except
1931,1951 and 1981. According to the Census 2001
sex ratio of Gujarat decreased by 15 females per 1,000
males in comparison to 1991. There are only 920 females
per 1,000 males. Among all the districts of Gujarat, The
Dangs and Amreli are at the top of the ladder of sex
ratio. These two districts have the highest sex ratio of
987 closely followed by Dohad district with sex ratio of
985. Bottom end of the ladder is Surat district with a
sex ratio of 835. It is worth to mention that sex ratio
of Surat has drastically gone down from 901 to 835
during 1991-2001.

p A. K
ARABIAN SEA
BOUNDARIES:
s T
GUJARAT ADMINISTRATIVE DIVISIONS 2001
30
N
KILOMETRES
o 30 60 90
R J
A
Daman ' (DAMAN AND DIU)
DNH - DADRA AND NAGAR HAVELI
INTERNATIONAL ......... ........ .
STATE/UNION TERRITORY ... .. .
DISTRICT
TALUKA
A \"'\
HEADQUARTERS: STATE ..... . * DISTRICT .. .•
1 MAP 25 1
""0
~ o m (/) :::r:
Where the district name differs from its headquarters name, the latter is given within brackets.
51

DAMAN AND DIU
Daman lies on the Gujarat Coast while Diu is an islet on the southern fringe of Kathiawar peninsula.
Daman is bounded on the north and south by the
Bhagwan and the Kalem river respectively, on the east
by Gujarat state and on the west by the Arabian sea.
Diu lies in the Gulf of Cambay near Veraval Port.
Diu was occupied by the Portuguese in 1534.
In 1559, Daman also was annexed by them. By the
57th amendment of the constitution, Daman and Diu were separated from Goa to become an independent
Union territory when Goa was accorded full statehood
in 1987. The Union territory further divided into two sub
districts, two towns and 23 villages. It covers an area of
112 km2. Out of which Daman district has larger geographical
area of 72 km2 and Diu district with only 40 km2.
The Union territory of Daman and Diu stands at
34 th rank among the States/Union territories of the
country in respect of population. In terms of percentage,
the Union territory accounts for 0.015 per cent of the
India's population. The population of Union territory has
become almost three times after independence during
1950-2001. In Census 1951, there were 48.6 thousand
persons in the Union territory whereas Census 2001,
52
this number rose to 158.2 thousands. Out of which
92,512 are males and 65,912 females. Daman district
has recorded a population of 113,989 and Diu district
with only 44,215 persons.
The density of population of the Union territory is 1,413 persons per km2. Daman district has recorded
the density of 1,583 persons per km2 whereas Diu district
has the density of 1,105 persons per km2• Union territory
was always having females more than males since
1900 but the ratio has fallen drastically in 2001 Census. It has accounted only 710 females over 1,000 males
which is really serious. This ratio is even less than the
country as a whole (933). District-wise ratio show that
Diu still have high sex ratio of 1,118 but Daman district have very less sex ratio accounted only 591 females
over 1,000 males. Percentage decadal growth of the Union territory has increased during 1991-2001 in comparison to 1981-1991. There was 28.62 per cent
growth during 1981-1991 decade which has become
55.73 per cent in the decade 1991-2001. Among the
districts Daman district is growing with faster rate.
Decadal growth rate of Daman district has accounted
83.55 per cent where as Diu district has only 11.98 per
cent.
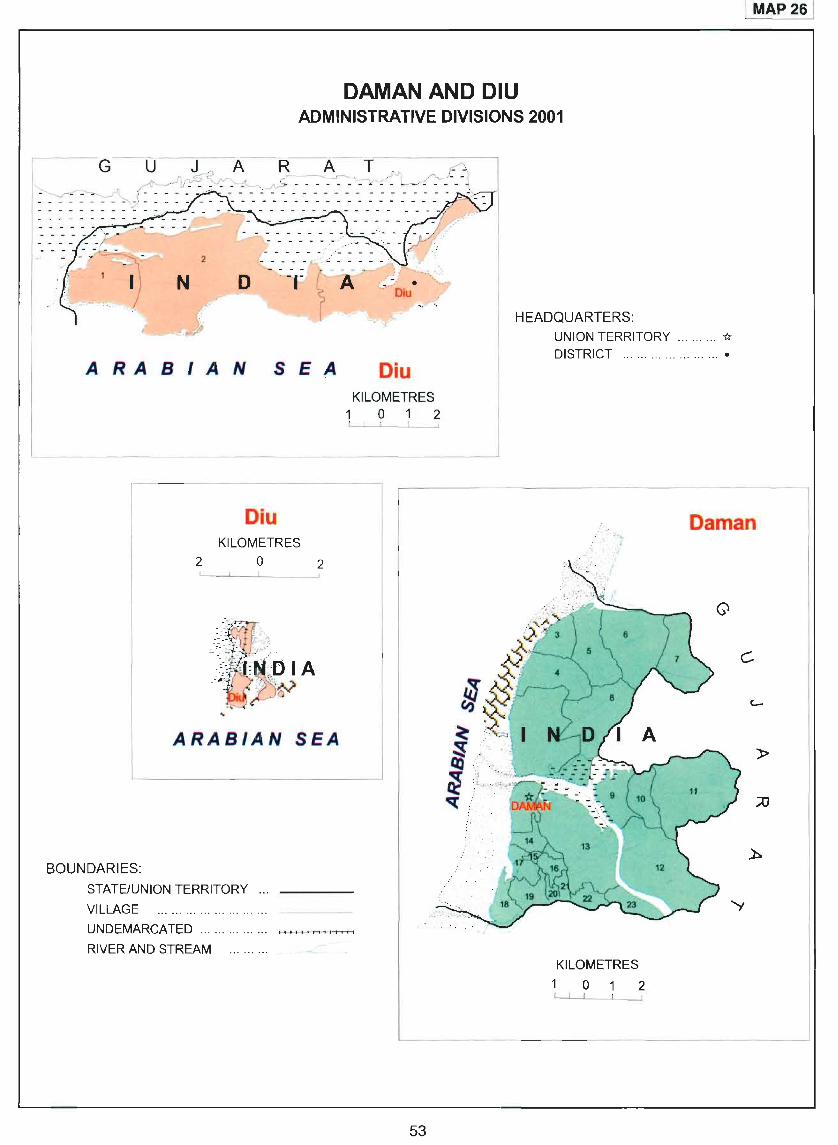
DAMAN AND DIU ADMINISTRATIVE DIVISIONS 2001
HEADQUARTERS: UNION TERRITORY .... _ .. .. * DISTRICT ... .. . _ ..... _ .... _ ... •
A R A B I A N SEA Diu KILOMETRES
1 0 1 2
I MAP 26 1
Diu Daman KILOMETRES
2 0 2
Q
ARABIAN SEA
BOUNDARIES:
STATE/UNION TERRITORY
VILLAGE ....... ....... . .. ... . .. .
UNDEMARCATED .. .... ... .... . .
RIVER AND STREAM ...... .. . KILOMETRES
o 1 2
53

DADRA AND NAGAR HAVELI
-me Union territory of Dadra and Nagar Haveli is
I situated on the western region of the country. The
territory is surrounded by the state of Gujarat in the
east, north and western part whereas Maharashtra state
in the south.
Geographically the Union territory is a hilly
terrain land feature significantly the north and north
east are surrounded by the Sahyadri ranges (Western
Ghat). This terrain is drained by the river Damanganga
with a number of tributaries which rise in the Western
Ghat about 64 km. stretching from the coast. The
Damanganga river flows into the Arabian Sea at the
port of Daman. The central region is almost plain and
has a rich fertile soils.
The territory of Dadra and Nagar Haveli was
originally assigned to the Portuguese by the Maratha government in 1779 for an aggregated revenue of
Rs. 12,000/- in return for their friendship. The Portuguese
ruled this territory till its liberation on August 2, 1954.
After liberation, the administration was carried on by
the Administrator chosen by the people themselves.
54
Probably this is the only part of the country which was
ruled by the people themselves for about 8 years (1954-
1961). On 11th August, 1961 the territory was integrated
into the Indian Union.
Union territory has one taluk and one CD Block
with two census towns and 70 villages during the Census
2001. Dadra and Nagar Haveli has an area of 491 km2•
Union territory stands at 33 rd rank among the states/
Union territories of India in respect of population size.
It has 2.20 lakhs population (220,490). Out of which
121,666 are males and 98,824 females. The decadal
growth rate of 1991-2001 has also increased in
comparison to 1981-1991 from 33.57 to 59.22 per cent
respectively. The density of Dadra and Nagar Haveli
was 282 persons per km2 in Census 1991 which rose
to 449 in ten years. Since the area of the Union territory
remains the same, changes in the density reflects the
effect of population growth during the decade. The sex
ratio of the Union territory is 812 females per 1 ,000
males during the Census 2001. But during 1991 Census
the sex ratio was 951 which reflect that there is a
drastic fall in the sex ratio.

BOUNDARIES:
DADRA AND NAGAR HAVELI ADMINISTRATIVE DIVISIONS 2001
KILOMETRES
10123456
H
STATE/UNION TERRITORY ... ------ HEADQUARTERS:
T
VILLAGE ... .. . ... .... .. .... .... . ... _ ___ _ _ UNION TERRITORY
55
I MAP 27 1

MAHARASHTRA
Maharashtra state is situated on the western coast of the country and lies between 15° 45' and 22°
north latitudes and 72° 45' and 80° 45' east longitudes.
The state is surrounded by Gujarat and Dadra & Nagar
Haveli in the north-west, Madhya Pradesh in the north and Chhattisgarh in the east. Andhra Pradesh, Karnataka
and Goa in the south and the Arabian Sea in the west.
The state can be divided physiographically into
two regions, i.e., (i) The Konkan low land and (ii) The
Deccan Plateau. The Konkan low land lies in the extreme
west of the state. It is a narrow strip of land situated
between the Arabian Sea in the west and the Sahyadri range in the east. Throughout the length, the Konkan
low land is dominated by the tremendous scraps of the ghats rising to a height of about 900 metres. The plateau
in general has an altitude ranging between 300 to 900
metres and extends over basalt. The maximum height
is observed near Kalubai (1,638 metres), which is the
highest point of Maharashtra.
Maharashtra was part of the Mauryan Empire.
A number of Hindu dynasties were in power for nearly
a thousand years, followed by a succession of Muslim
rulers. In 1761, Afghan ruler Ahmed Shah Abdali routed
the Maratha forces. In 1818, Maharashtra settled down
as part of the Bombay Presidency under the British administration. The state of Bombay was bifurcated
into Maharashtra and Gujarat on May 1, 1960 and
Maharashtra retaining the old capital Bombay. Thus,
the new Maharashtra state comprised of 26 districts of
the former Bombay state. This number remained
56
unchanged upto Census 1981. In 1991, 4 new districts
were added, increased the number to 30. Five new
districts were created during 1991-2001 in the state
to increased the number to 35 districts. In Census
2001, the state of Maharashtra has recorded 35
districts, 353 sub-districts, 43,711 villages and 378
towns. Out of these towns, 251 are statutory towns
and 127 census towns. The state spread over an
area of 307,713 km 2. Among the districts, Ahmadnagar has recorded the largest area of 17,048
km2 and Mumbai is smallest in size with an area of
157 km2 only.
The state has a total population of 96,878,627
rank 2nd highest state of India in terms of population
according to the Census 2001. Out of these 50,400,596
are males and 46,4 78,031 females. During 1991-2001
the decadal growth rate of the state has reduced by
0.16 per cent point only. There is reduction in the
decadal growth rate of state from 22.73 per cent to
22.57 per cent during the last decade. Among the
districts, Thane district has recorded the highest growth
rate of 54.92 per cent whereas Sindhudurg district is last in the list with only 4.41 per cent. The highest sex
ratio among the districts is observed in Ratnagiri district
with 1,136 and lowest in Mumbai with 777 only. The
state has the density of 315 persons per km2. Mumbai
is the smallest district in area (157 km2) and has the
highest density of 21,261 persons per km2 whereas
Gadchiroli district with the lowest density of 67 persons
per km2 among the districts of Maharashtra state.
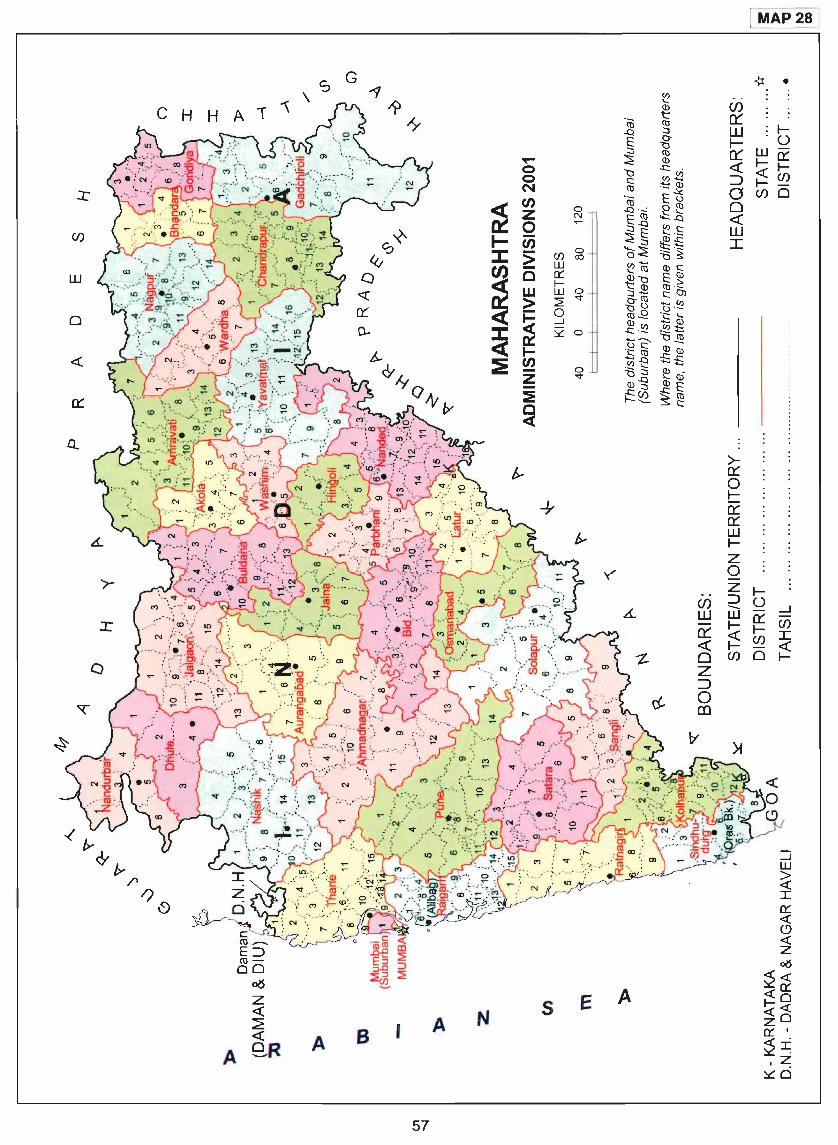
G {t • ~ ._ ~
(/)
<tl <tl .0 :::,
0:::
~ ~ .g LlJ l-
e <tl
f- 0
e (I) 0:::
N "0 ..r::
w-
e: (/).!2 « 1-0:::
~ f/)
<tl :t:::<1> ::J «I-
Z (\'j E;:t5
I-(/)
0 .0 . ....: e~
a (/)0
I-
E;:<tl 0
(i) :::,.0
-';;::.0
J: :E§ ~e:
«
:> (f) 0
~~ LlJ
~ 25
w 00 'O:E 'O~
I
0:: ~m
w I-
(l)e:
w 0 ~"O E;:(I)
> :2 "<t :::,~ <tl .2!
~ 0
.g~ e: Dl
~ ...J
<tl 0 t5 .~
~ 0
(1)-';:: .._
..r:: .~ -..(1)
I-
~t:
:E ~ :t5'2 .!2 £<0 (1)(1)
Z 0
.(/) -e :S..r:: "<t '0:::'
.....
:E
~ -(1).0 (1)(1)
~ ~J5 ~~ '-
>-f>, 0:::
0 l-
-¥ 0::: 0:::
f>.. w I-Z
'<' 0
iJj Z I-:J
LlJ -- 0 w _J
0::: I- 0::: C/)
~ I-
« (/) I
0 (/) 0 ~ Z ::J
0.- 0 co
V
M
C ro .--.. E:J
._ c: « ro -
tOrn
00 ..0.0 al E:; :::'!:
06 :J.D::l
Z
:::,!:::l :::'!: ~
« ~ «
N
A e.R A B A 5 E A
57

ANDHRA PRADESH
Andhra Pradesh is situated approximately between
12° 38' and 19° 55' north latitudes and 76° 45'
and 84° 45' east longitudes and is bounded by
Maharashtra, Chhattisgarh and Orissa states in the north, Tamil Nadu in the south, Karnataka in the west
and the Bay of Bengal in the east.
In general Andhra Pradesh has the structure of
the plateau which can be broadly divided into three physical regions, i.e., (i) The Coastal Plains, (ii) The
Eastern Ghats and (iii) The Plateau with intermittent peneplains. The Coastal Plains consists of a belt of
varying width between the Eastern Ghats and the Bay of Bengal. In the northern portion of the narrow Coastal
plains have an altitude between 75 and 150 metres whereas the northern parts of this region are dotted
with outliers of Eastern Ghats with altitudes between
300 and 600 metres. The Eastern Ghats are a series of
detached hills ranges, where the elevation varies from
750 to 900 metres. The Plateau region is composed of
a land having eroded flat and hillock structures.
Andhra Pradesh is the first state in India that
has been formed on a purely linguistic basis. When
India became independent, the Andhras, that is, the
Telugu speaking people were distributed in about 21 districts, 9 of them in the Nizam's Dominions and 12 in the Madras Presidency. Almost half of the northern
part of erstwhile Madras State were put together to form a new Andhra State with Kurnool as capital. On
November 1, 1956 in accordance with the recommendations of the State Reorganization
58
Commission, the Andhra State was enlarged by the
addition of nine districts formerly in the Nizam's
Dominion. Hyderabad the former capital of the Nizam
was made the capital of the enlarged Andhra State with
finally twenty districts in Census 1961. The number of
districts increased to twenty one in 1971, then twenty
three in 1981 and it remained unchanged upto Census
2001. The state of Andhra Pradesh has recorded 23
districts, 1,125 sub-districts and 28,123 villages and
210 towns during Census 2001. Out of these, 117 are
statutory towns and 93 census towns. The state covers
an area of 275,045 km2. Among these districts of the
state, Anantapur district has registered the largest
geographical area (19,130 km2) whereas Hyderabad with
the lowest of only 217 km2.
According to the Census 2001, the total
population of the state is 76,210,007 comprising of
38,527,413 males and 37,682,594 females. In absolute
terms during the last 10 years the population of the state
has gone up by 9,701,999. Hence, it recorded a decadal
growth rate of 14.59 per cent during the period 1991-2001
which is lower than the growth rate of 24.20 per cent
during 1981-1991. Sex ratio of the state works out to be
978. Among the districts, Nizamabad district rank first
with sex ratio of 1,017 and Hyderabad rank the last with
933. Density of population of the state is 277 persons
per km2. At the district level, highest density is observed
in Hyderabad where it is 17,649 persons per km 2 and the
lowest in Adilabad district with only 154 person per km2 .

,__
z
23
BOUNDARIES:
STATE/U.T .
DISTRICT
MANDAL
. '.~
HEADQUARTERS: STATE ...... *:
DISTRICT ... •
s H
ANDHRA PRADESH ADMINISTRATIVE DIVISIONS 2001
KILOMETRES 20 0 20 40 60 80 100
59
I MAP 29]
S A
\
The district headquarters of Rangareddi is located at Hyderabad.
Where the district name differs from its headquarters name, the latter is given within brackets.

KARNATAKA
Karnataka state is situated in the southern part of the country and extends between 11 0 35' and
180 30' north latitudes and 74 0 5' and 780 85' east longitudes. The state is bounded by Maharashtra state in the north, Tamil Nadu and Kerala in the south, Arabian sea in the west, Goa in the north-west and Andhra Pradesh in the east.
Physiographically Karnataka can be divided into Deccan plateau and the coastal plains regions. Physiographic characteristics of even the Deccan plateau region differ from north to south at the micro level. In Northern Karnataka plateau, general elevation is from 300 to 600 metres, in central Karnataka plateau 450 to 700 metres and southern Karnataka plateau from 600 to 900 metres. Krishna, Bhima, Ghataprabha, Malaprabha are important rivers in the northern part of Karnataka whereas Tungbhadhra is in the southern part. Coastal region extends between the Udupi in south to north Kannara district in north. Even in the coastal region two broad physical units can be noticed, viz., the plains and the western ghats.
The present state of Karnataka was formerly Mysore province. The earliest recorded history of Mysore goes back to Maurya age followed by numerous dynasties. In 1872, when the first census was conducted in the country, Mysore province was constituted with eight Princely states, viz., Shimoga, Chittal Droog, Cudoor, Hassan, Toomkoor, Colar, Bangalore and Mysore. In 1941, a new Princely state Mandya came into existence, created from portions of Mysore Princely state. Owing to the independence of the country in 1947, Mysore province was ceded to the Indian Union. This region then witnessed movement for the integration of all predominantly Kannada speaking areas and was given status of a state. In 1951, the only change which occurred was the renaming of the territory of Kadur to Chikmagalur. As per the recommendations of the State Reorganisation Act, 1956 four districts namely, Belgaum (except Chandgad taluk), Bijapur, Dharwad and North Kanara of Bombay state, three districts namely, Gulberga, Raichur and Bidar of Hyderabad state, portions of three districts namely, South Kanara (except Kasaragod taluk), Bellary (except Adoni, Abhor and
60
Rayadrug taluk) Kollegal taluk of Coimbatore district of Madras state and entire Coorg area were merged in Mysore state. Hence during 1951-61 number of districts increased to nineteen. Mysore state was renamed as Karnataka with effect from 1
st Nov. 1973 under the
Mysore state (Alteration of name) Act, 1973. There was no change in the district boundaries between 1961-71 and 1971-81. During 1981-91 one more district was added (Bangalore rural) increasing the total number of districts to twenty. During 1991-2001 seven new districts have been created. Hence, the total number of districts recorded in Census 2001 are twenty seven. The number of sub-districts in the state has however remained unchanged at 175 in 2001. There are 270 towns and 29,406 villages. Among these towns, 226 are statutory towns and 44 census towns. The total area of the state is 191,791 km2. Among all the 27 districts of the state, Gulbarga has the largest geographical area of 16,224 km2 whereas Bangalore is the smallest in size with an area of 2,190 km2.
Karnataka has a total population of 52,850,562 according to the Census 2001. Out of which 26,898,918 are males and 25,951,644 females. The highest sex ratio in the state is recorded by Udupi district (1,130) and the lowest by Bangalore (908). It is worth to mention that Udupi district ranks fourth in India having sex ratio of 1,130. The state has the density of 276 persons per km2. Bangalore is the smallest district in area (2,190 km2) and has the highest density of population (2,985 persons per km2) whereas Uttar Kannada has the lowest density of population (132 persons per km2) among all the districts in the state. The average population size of the district in Karnataka is 1,957,428. Among all the 27 districts, Bangalore has recorded the maximum population in the state (6,537,124) and ranks fourth in India whereas Kodagu district has recorded the minimum population (548,561). The Karnataka has recorded 17.51 per cent decadal growth rate during 1991-2001. Among all the districts Bangalore has recorded the highest growth rate of 35.09 per cent and Udupi is the last in the list with only 7.14 per cent decadal growth rate during this period.
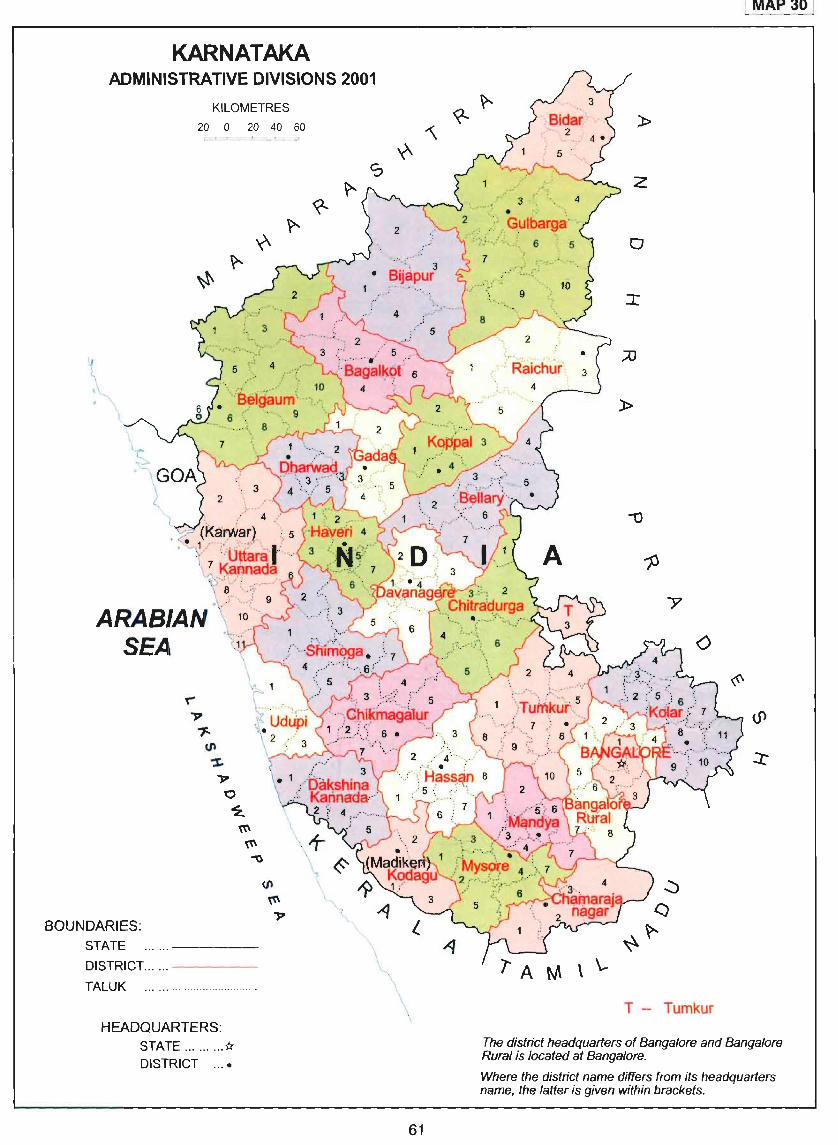
KARNATAKA ADMINISTRA liVE DIVISIONS 2001
KILOMETRES
20 0 20 40 60
BOUNDARIES: STATE
DISTRICT ...... -----
TALUK
HEADQUARTERS: STATE .. ....... * DISTRICT ...•
61
! MAP 30 I
»
z
o
»
<)
\ \..
T -- Tumkur
The district headquarters of Banga/ore and Banga/ore Rural is located at Bangalore.
Where the district name differs from its headquarters name, the fatter is given within brackets.

GOA
Goa lies on the western coast of Indian peninsula. It extends between 14° 53' 57" and 15° 47' 59"
north latitudes and 73° 40' 54" and 74° 21' 11" east longitudes. The state boundary is well defined by river Tiracol in the north which separates it from Maharashtra, on the east lies the western ghats and in west is the Arabian sea. It is surrounded by Karnataka state in the south.
Goa state is characterised by hilly terrain. Topographically, it can be divided into three regions, i.e., (i) Coastal Plains, (ii) the Intermediate sub-mountainous region where undulating uplands can be noticed and (iii) the Hilly region in the interior of the state. The state is drained by number of small rivers. Mandovi and Zuari are the important rivers.
Goa state was formerly a district of the Union territory of Goa, Daman & Diu. Goa, Daman & Diu was under the Portuguese control for about 450 years. On 19th December, 1961 it was liberated from the erstwhile Portuguese Regime and integrated with India vide the
Constitution's (Twelfth Amendment) Act, 1962 dated March 27, 1961. It was then divided into three districts, viz., Goa, Daman and Diu located at distinct places. In May 1987 Goa, Daman and Diu was split into two administrative divisions. Goa attained statehood and the other two parts remained a Union territory. According to the Census 2001, Goa state is divided into two districts namely, North Goa and South Goa districts.
62
The state has eleven talukas. North Goa district has six talukas while South Goa district has five talukas. Former district has four sub-divisions whereas later has
three sub-divisions. According to the Census 2001, there are 44 towns (14 statutory and 30 census) and 359 villages in the state. Out of these, 213 villages are in North Goa district and 146 villages in South Goa district. The total area of the state is 3,702 km2 divided into
1,966 km2 to South Goa and 1,736 km2 to North Goa.
Goa has recorded 1,347,668 population in
Census 2001. During the Census 1991 Goa's population
was 1,169,793 hence registering an increase of 15.21
per cent during 1991-2001. Among the districts, the
total population of North Goa district and South Goa
district is 758,573 and 589,095 respectively. The
population of these two districts at the time of Census
1991 was 664,804 and 504,989 respectively. Out of the total population 687,248 are males and 660,420 females.
The sex ratio thus works out to be 961. At the district
level North Goa has registered sex ratio as 953 whereas
South Goa's sex ratio is 972. Nearly 50 per cent of the
population of the state is confined to the coastal areas.
The density of population of Goa is 364 persons per km2. Density of population in North Goa district is
comparatively higher than the South Goa district. Former
district has recorded 437 persons per km2 whereas
later has recorded only 300 persons per km2 showing
pressure of population more in North Goa district.

" .. ,:~'
_ . .;'--- .
. ' ,:_---- 4
2
N
GOA ADMINISTRATIVE DIVISIONS 2001
KILOMETRES
5 o 5 10 15 20
5
,.-__ f'······\ , ,
o I
ARABIAN SEA
(Margao) 4
• "
" ' -~
........... \ \-
'_ .. ... -, _ ....
<: South Goa
3 .\,,: ...... " ......... '\
\, .. .. _ ... _-_ .. :
BOUNDARIES:
STATE .. , , .. ...... ... ... .. , ... , .. -----DISTRICT.. .... .. ... . .. . .. . .. . , .. , .. ____ _
TALUKA ........ .. .. ... ..... , .. ... .
HEADQUARTERS:
STATE .. . ... .. . * DISTRICT ... .
Where the district name differs from its headquarters name, the latter is given within brackets,
I,._ .....
'-~ . ---' . ," .... ",. _. __ ..... > .:"
',:
5
Anjadip Island (GOA) ~ "
63
.... ..:. ............ .
z
1 MAP 31 1

LAKSHADWEEP
The Union territory of Lakshadweep a group of Islands lies between 8 0 and 12 0 30' north latitudes
and 71 0 and 74 0 east longitudes approximately. The
islands of Lakshadweep were formed as a result of coral growth on the sub-marine platform. There are
number of sunken banks, open reefs and sand banks. The local relief are caused by the shapes of sand dunes. The islands vary in width from a few metres to
2 to 3 kms. None of the Islands measures more than six metres above the mean sea level.
Local traditions attribute the first settlement on these islands to the period of Cheraman Perumal, the
last king of Kerala. Legends say that small settlements started in the islands of Amini, Kavaratti, Andrott and Kalpeni first and later people from these islands moved
to other islands of Agatti, Kiltan, Chetlat and Kadmat.
The administration of the islands was passed on to the
Muslim house of Arakkal of Cannanore around the middle of the 16th Century. In 1854, the English took over all the islands. The Union territory was formed in 1956.
This Union territory was known as 'Laccadive, Minicoy
and Amindivi Islands' representing three groups of Islands till 15t November, 1973. Thereafter, the name of
the Union territory was changed into 'Lakshadweep'. The first Census was conducted in 1961. The islands
64
was a single district Union territory consisting of 11
inhabited and 16 uninhabited Islands. There are three major islands, viz., Amini, Kavaratti and Minicoy. The
Union territory is further divided into four sub-districts, 9 CD Blocks and 3 census towns. It covers an area of
32 km2.
The Lakshadweep Union territory has a total
population of 60,650 according to the Census 2001. Out of which 31,131 are males and 29,519 females. Lakshadweep is the smallest Union territory both in
area and in population in the Indian union. Its share to the Indian population is only 0.01 per cent.
Lakshadweep rank at the bottom position in population
ranking among states/Union territories in India. Among the states and Union territories, Lakshadweep stands in 4th position in density with 1,895 persons per km2,
the first and second being Delhi (9,340) and Chandigarh
(7,900) respectively. The decadal growth rate of Lakshadweep in Census 2001 is 17.30 per cent as against 28.47 per cent in the previous Census 1981-
1991. This shows that the growth rate of population has decreased by 11.17 point during the decade 1991-
2001. According to the Census 2001, the sex ratio of Lakshadweep is 948 females per 1,000 males as
against 943 in 1991.

, ' , '
: ': Cherbaniani Reef , , LAKSHADWEEP ADMINISTRATIVE DIVISIONS 2001
I-I <! • \ I • 0 l I~ I \ .... _' KILOMETRES
Byramgore Reef Chetlat Island
1 (J
20 o 20 40 60
Kiltan Island 2 0
Elikkalp~ni Bank r --,
'\J Peru mal par
1-- Parali Islands -v t. .. ' Tinnakara Island
1 -v Bangaram Island Agatti Islan~ ~ 'P
Kalpitti Island -v ~ . Pitti Island
~ 2 / Kavaratti Island
tJ' ~ ~ '* KAVARATTI ~
~()
/t. o
Andrott Island ° 1
I , \ , , \
\'" ... _.)
N / \$\
(.) Suheli Valiyakara /0
Suheli Cheriyakara 11' KOdithala~ Cheriyam Island
Pitti Islands Kalpeni Island Tilakkam Islan s 2
HEADQUARTERS:
UNION TERRITORY ... ... '*
MINICOY SUB·DIVISION
Viringill ISla~dwf Minicoy Island
A
I N D I A N 0 c E A
65
N
I MAP 32 I
CI)
iLl
iLl
Q
::r:
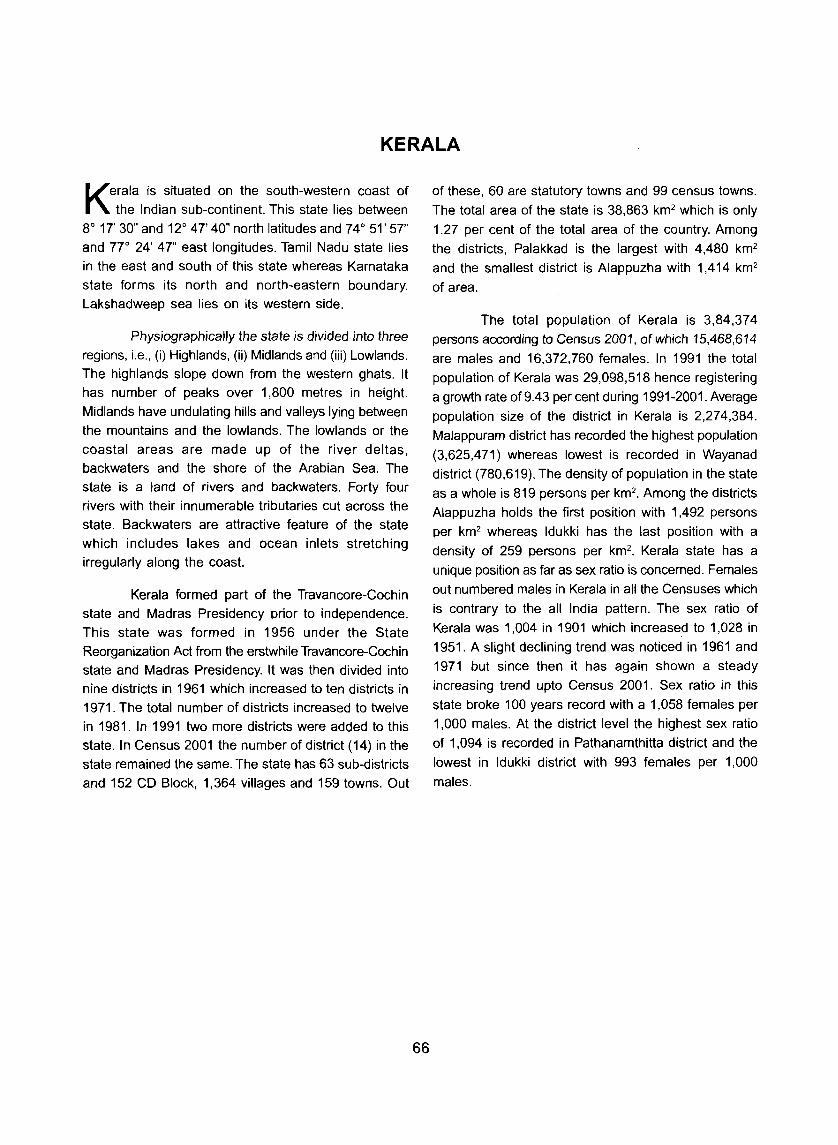
KERALA
Kerala is situated on the south-western coast of
the Indian sub-continent. This state lies between
8° 17' 30" and 12° 47' 40" north latitudes and 74° 51' 57"
and 77° 24' 47" east longitudes. Tamil Nadu state lies in the east and south of this state whereas Karnataka
state forms its north and north-eastern boundary.
Lakshadweep sea lies on its western side.
PhysiographicaUy the state is divided into three
regions, i.e., (i) Highlands, (ii) Midlands and (iii) Lowlands.
The highlands slope down from the western ghats. It has number of peaks over 1,800 metres in height.
Midlands have undulating hills and valleys lying between
the mountains and the lowlands. The lowlands or the
coastal areas are made up of the river deltas,
backwaters and the shore of the Arabian Sea. The state is a land of rivers and backwaters. Forty four
rivers with their innumerable tributaries cut across the
state. Backwaters are attractive feature of the state
which includes lakes and ocean inlets stretching irregularly along the coast.
Kerala formed part of the Travancore-Cochin state and Madras Presidency prior to independence.
This state was formed in 1956 under the State
Reorganization Act from the erstwhile Travancore-Cochin
state and Madras Presidency. It was then divided into nine districts in 1961 which increased to ten districts in
1971. The total number of districts increased to twelve
in 1981. In 1991 two more districts were added to this
state. In Census 2001 the number of district (14) in the
state remained the same. The state has 63 sub-districts
and 152 CD Block, 1,364 villages and 159 towns. Out
66
of these, 60 are statutory towns and 99 census towns.
The total area of the state is 38,863 km2 which is only
1.27 per cent of the total area of the country. Among
the districts, Palakkad is the largest with 4,480 km2
and the smallest district is Alappuzha with 1,414 km2
of area.
The total population of Kerala is 3,84,374
persons accordjng to Census 2001, of whjch 15,468,614
are males and 16,372,760 females. In 1991 the total
population of Kerala was 29,098,518 hence registering
a growth rate of 9.43 per cent during 1991-2001. Average
population size of the district in Kerala is 2,274,384.
Malappuram district has recorded the highest population
(3,625,471) whereas lowest is recorded in Wayanad
district (780,619). The density of population in the state
as a whole is 819 persons per km2. Among the districts
Alappuzha holds the first position with 1,492 persons
per km2 whereas Idukki has the last position with a
density of 259 persons per km2. Kerala state has a
unique position as far as sex ratio is concerned. Females
out numbered males in Kerala in all the Censuses which
is contrary to the all India pattern. The sex ratio of
Kerala was 1,004 in 1901 which increased to 1,028 in
1951. A slight declining trend was noticed in 1961 and
1971 but since then it has again shown a steady
increasing trend upto Census 2001. Sex ratio in this
state broke 100 years record with a 1,058 females per
1,000 males. At the district level the highest sex ratio
of 1,094 is recorded in Pathanamthitta district and the
lowest in Idukki district with 993 females per 1,000
males.

BOUNDARIES:
STATE I UNION TERRITORY
DISTRICT
TALUK
HEADQUARTERS:
STATE .. ... ... . * DISTRICT ...•
o
67
KERALA ADMINISTRATIVE DIVISIONS 2001
KILOMETRES 20 o 20 40 60
.....
z
o
I MAP33 i
Where the district name differs from its headquarters name, the latter is given within brackets.

TAMIL NADU
Tamil Nadu state lies between 8° 5' and 13° 35' north latitude and 76° 15' and 80° 20' east longitudes
in the southern end of Indian peninsula. It is surrounded by Andhra Pradesh and Karnataka in the north, Kerala
in the west, Bay of Bengal in the east and by the
Indian Ocean in the south. Pondicherry and Karaikal of
the Union territory of Pondicherry are in the sea coast
of this state.
Physiographically Tamil Nadu state is divided into Eastern Coastal Plain comprising of the Coromandal
plain and the Alluvial plain of the Cauvery delta and the
hilly region along the northern and western part of the
state. Western Ghats has average height of 1,220
metres above sea level all along the western part. The only break found in this mountain wall is by the Palghat
gap. In the south of this gap are the Anamalai (Elephant
Hills), in the east the Palani Hills where famous Kodaikanal Hill Station is situated. Dense evergreen
forests cover the slopes of the Western Ghats which
are the sources of Cauvery, Vaigai and Tamparani rivers. The Nilgiris are another famous hill groups.
Tamil Nadu was formerly the Madras Presidency
which is mainly spread over in Southern Peninsula. After the reorganization of the states on the linguistic
basis on 15t November 1956 unilingual Madras s~ate was created with Tamil spoken by majority of the people. On 14th January 1969 Madras state was renamed as
Tamil Nadu as per the Madras state (Alteration of Name) Act 1968. In 1971 the state was comprised of fourteen
districts. During 1971-81 number of districts increased
68
to sixteen and further in 1981-91 to twenty one. In
Census 2001, Tamil Nadu has recorded 30 districts,
201 sub districts, 386 CD Block, 16,317 villages and
832 towns. Out of these towns, 721 are statutory and
111 non-statutory towns. Tamil Nadu state covers an
area of 130,058 km 2. At the district level, Dharmapuri
is the largest distri'ct with 9,622 km 2. The lowest
geographical area district is Chennai with 174 km2.
During 2001 Census, 62,405,679 persons have
been enumerated in Tamil Nadu. Among these persons
31,400,909 are males and 31,004,770 females. The sex
ratio of the state is 987 in Census 2001. At the district
level the highest sex ratio is returned in Thoothukudi
district (1,050) and the lowest by Salem district (929).
The most populous district of the state is Coimbatore
which has recorded a population of 42.71 lakhs. The
average population of a district in the state is 2,080,189.
The total population of the state has increased by 11.72
per cent during 1991-2001. It is significant to record
that Thiruvallur district has reported the highest decennial
growth rate of 23.06 per cent during 1991-2001. Tamil
Nadu has a population density of 480 persons per km 2.
The highest density is recorded by Chennai district
with 24,963 persons per km2 whereas Ramanathapuram
district has returned the lowest density of 281 persons
per km2. Excepting the south Sahyadri hills and Nilgiris
the distribution of population is generally evenly
distributed. Plain of Tamil Nadu have comparatively
much higher density than the Tamil Nadu upland and
south Sahyadri.
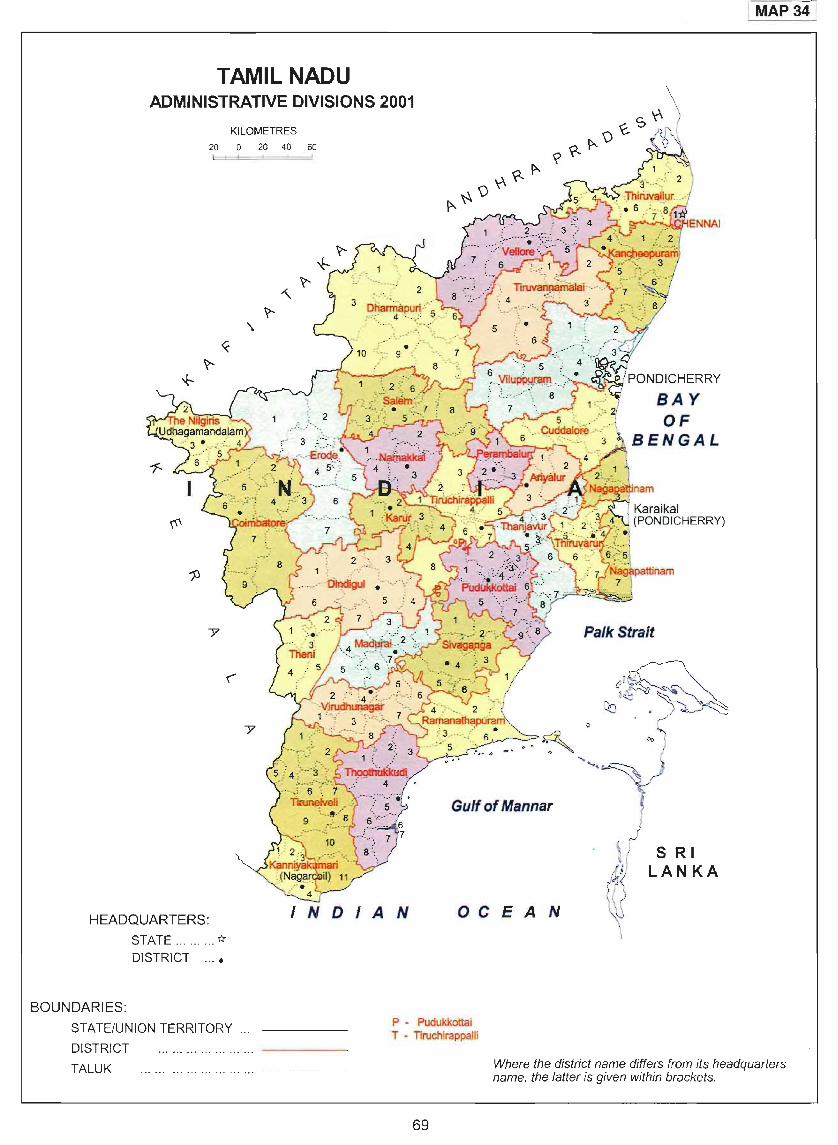
TAMIL NADU ADMINISTRATIVE DIVISIONS 2001
KILOMETRES
200204060
HEADQUARTERS: INDIAN
STATE ... ... "* DISTRICT ....
BOUNDARIES:
Gulf of Mannar
o C E A N
Palk Strait
S RI LANKA
MAP 34
STATE/UNION TERRITORY P - Pudukkottai T - Tiruchirappalli
DISTRICT
TALUK
69
Where the district name differs from its headquarters name, the latter is given within brackets.

PONDICHERRY
nondicherry Union territory comprising of four districts
r namely, Pondicherry, Karaikal, Mahe and Yanam lies in different localities of South India. Geographically
Pondicherry lies approximately between 11 ° 45' and 12° 0' north latitudes and 79° 37' and 79° 50' east
longitudes and surrounded by state of Tamil Nadu. Karaikal district between 10° 49' and 11 ° l' north latitudes and 79° 43' and 79° 51' east longitudes. Yanam district lies between 16° 41' and 16° 46' north latitudes and 82°
11' and 82° 19' east longitudes and encompassed by state of Andhra Pradesh. Mahe district falls between 11 ° 41' and 11 ° 46' north latitudes and 75° 31' and 75°
54' east longitudes and surrounded by the state of
Kerala.
Union territory of Pondicherry has been divided into three physiographic regions, i.e., (i) North Kerala
Coast, (ii) Coromandal Coast and (iii) Godavari Delta.
The territories thus handed over were constituted into
the Union territory of Pondicherry. The administrative set up of the Union territory of Pondicherry consists of four districts which are further divided into six
Municipalities and ten Commune Panchayats. The
breakup of Commune Panchayats at district level stand
at five Commune Panchayats and two Municipalities in Pondicherry with 63 villages. Karaikal has five
Commune Panchayats and one Municipality with 29
villages and Mahe with one Municipality consisting of four towns and Yanam being single Municipalities which are entirely urban. According to Census 2001, the Union
territory has recorded total geographical area of 479
km2. Out of these four districts in the Union territory, the largest area of 293 km2 is recorded in Pondicherry
district whereas the smallest area of only 9 km2 in
Mahe district.
Mahe district is situated in North Kerala Coastal region In Census 2001, the total population of the
with undulating terain of low elevation having an _ Union territory is 974,345 persons out of which 486,961
exception of the Chalukkara hill which is 60 metres are males and 487,384 females. The average population height. Pondicherry and Karaikal districts are in the Coromandal coast in flat low laying tract with a gentle
slope towards the sea. Yanam district falls in Godavari
Delta and lies in the region of low lying area with an
average height of 2 to 3 metres. It has no remarkable relief features except it is a flood plain.
The French converted the obscure little village
Pondicherry into a flourishing trading centre. The French were the last European power to come to India for trade. The Dutch and the English had already established themselves at various centres in India. The Dutch
captured Pondicherry in 1693 but returned it to French in 1699. The French Government handed over the Administration of their territories in India to the
Government of independent India in November 1954.
70
size of the district in the Union territory is 243,586.
Pondicherry district has the maximum population of
735,332 persons and the minimum population of 31 ,394
persons is observed in Yanam district. The population
density of the Union territory is 2,034 persons per km2.
The highest density of 4,092 person km2 is recorded in
Mahe district whereas the lowest in Karaikal district
(1,067). Sex ratio of the Union territory is 1,001. At
district level Mahe district recorded the highest sex
ratio of 1,147 and the lowest sex ratio is recorded at
Yanam (975). The decadal growth rate during 1991-2001
is 20.62 per cent in the Pondicherry Union territory. The
highest growth rate of 54.67 per cent is recorded in
Yanam district whereas the lowest is recorded in Mahe
(10.11 percent).
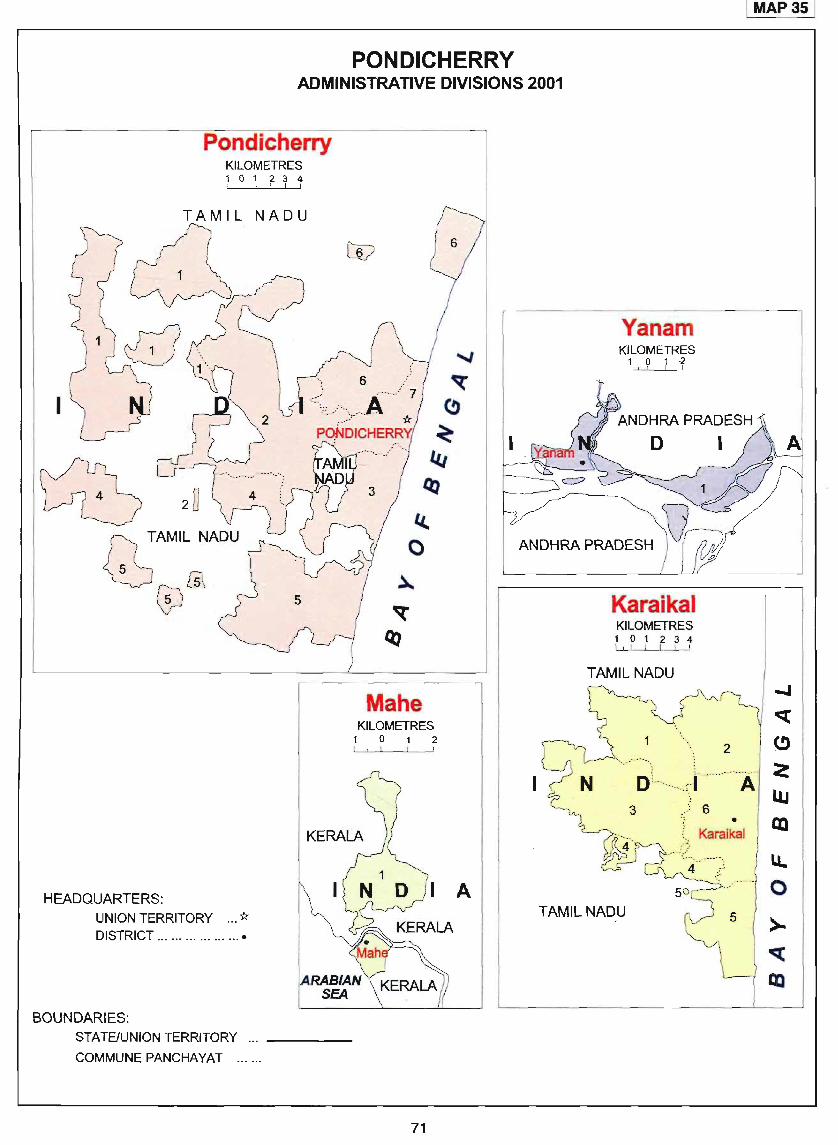
PONDICHERRY ADMINISTRATIVE DIVISIONS 2001
Pondicherry KILOMETRES 1 0 1 2 3 4 til I
NADU
1/ TAMIL NADU
~(p@
HEADQUARTERS:
_..:= 6 .-. -.- ----/7
--\: ---:::\_----A * PoNDICHERRYJ
~=~ / ~ o
.)...
~
~
Mahe KILOMETRES
o 2
A
I MAP3S j
Yanam KILOMETRES
1 , ? 1 -~
ANDHRA PRADESH
o I
Karaikal KILOMETRES 101234 I I I I I I I
TAMIL NADU
1 2 C>
0 '-- j ...... . A ~ 3 .- -' 6
LL..
o UNION TERRITORY '* TAMILNADU 5
DISTRICT ...... '" ...... '" •
BOUNDARIES: STATE/UNION TERRITORY ... ___ _
COMMUNE PANCHAYAT ... '" ______________ ___ ______ _
71
)..
~
III

ANDAMAN AND NICOBAR ISLANDS
The Union territory of Andaman and Nicobar
Islands is situated in the Bay of Bengal in north
south direction. Geographically Andaman and Nicobar
Islands lies between 6° to 14° north latitudes and 92°
to 94° east longitudes.
The Andaman and Nicobar Islands in the Bay
of Bengal are comprised of more than 300 named and
unnamed Islands. Geologically sand stone and shales
of Eocene period predominate. Due to hot and humid
climate, soils are lateritic and degenerated with luxuriant
growth of vegetation cover. Coral formation is the chief
characteristics of the Islands.
The first settlement was established in North
Andamans in the year 1789. Attempts at colonisation
were ultimately given up but the penal settlement
survived. The islands, as part of India became free on
August 15, 1947. On November 1, 1956 the Andaman
and Nicobar Islands were constituted into a Union
territory administered by the President of India. During
1971-81 the Union territory of Andaman and Nicobar
Islands was bifurcated into two districts, i.e., Andamans
and Nicobars and it remained unchanged upto Census
2001. There are 7 sub-districts. The Union territory has
3 towns and 547 villages during Census 2001. Out of
these towns, 1 is statutory town and 2 census towns.
72
Andaman and Nicobar Islands covers an area of 8,249
km2. Among these two districts, Andamans district has
the largest geographical area of 6,408 km2 whereas
Nicobars district has a geographical area of 1,841 km2
only.
Andaman and Nicobar Islands has a total
population of 356,152 persons according to Census
2001. Out of which 192,972 are males and 163,180
females against 280,661 population comprising of
154,369 males and 126,292 females at the 1991 Census.
Hence, during 1991-2001, the Union territory recorded
the decadal growth of 26.90 per cent, Andamans with
30.08 per cent and Nicobars with 7.29 per cent only.
The average population size of the district in Andaman
and Nicobar Islands is 178,076. But the district of
Andamans has recorded maximum population of 314,084
and Nicobars with 42,068 persons only. But high density
is observed in Andamans district with 49 persons per
km2 and in district of Nicobars with only 23 persons per
km2. Union territory as a whole has recorded 43 persons
per km2. Nicobars district of this Union territory shows
a marginal increase in sex ratio over that of Andamans
district. Hence, Nicobars district has recorded the high
sex ratio of 857 and Andamans with 844 whereas the
Union territory recorded sex ratio of 846.
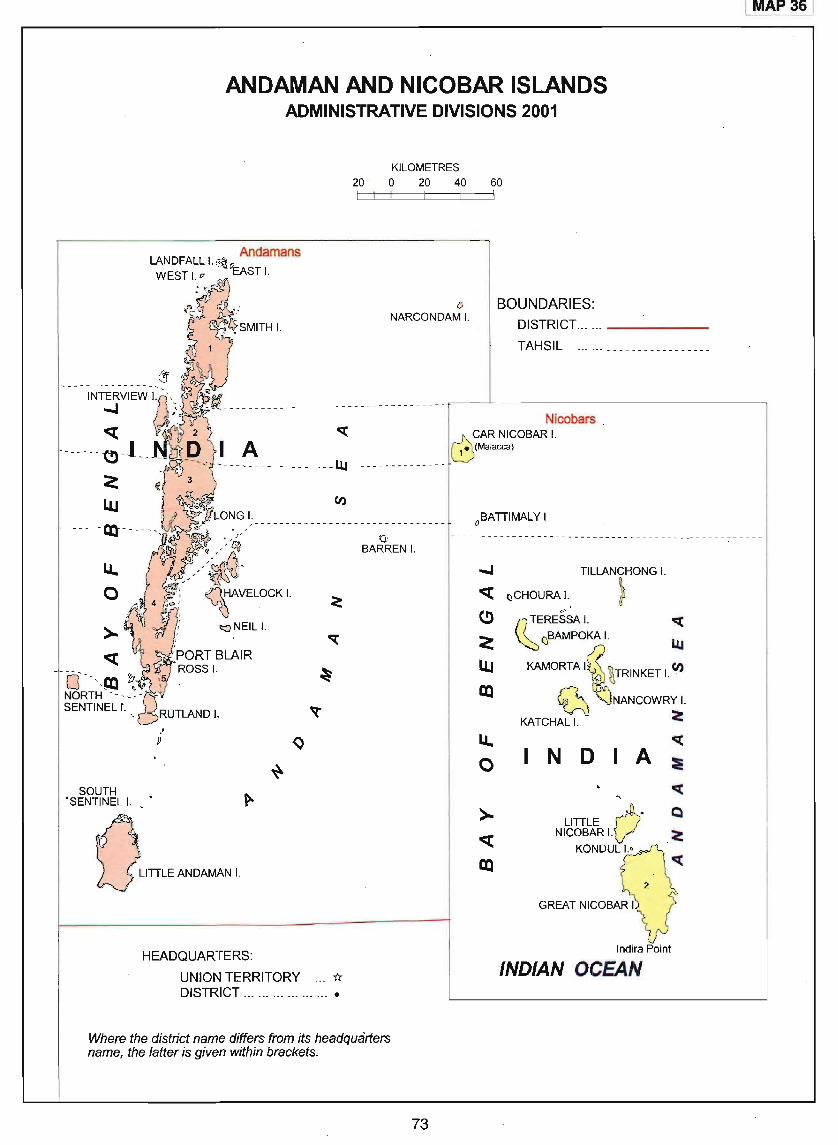
ANDAMAN AND NICOBAR ISLANDS ADMINISTRATIVE DIVISIONS 2001
KILOMETRES
20 0 20 40 60
LI.. o
SOUTH
Andamans LANDFALL I. ,,~ CI, WEST I. I? ~, EAST I.
.. fJ
.. ~. - /"~ . ,
'SENTINEL I. •
HEADQUARTERS:
UNION TERRITORY ... "* DISTRICT ... ......... ......•
o NARCONDAM I.
Q BARREN I.
Where the district name differs from its headqua'rters name, the latter is given within brackets.
73
BOUNDARIES: DISTRICT ... ... _____ _
TAHSIL
oBATTIMAL Y I
..,J TILLANCHONG I.
c::c QCHOURAI. ~ (!)
Q
~ERESSA I, 'II(
:;;: (lBAMPOKA I. LU
UJ KAMORTA I~ ~TRINKET L U)
III ~ ~NANCOWRY I. KATCHALI. ~
LI.. 'II(
0 N 0 A :e .,. 'II(
>- O· Q LITTLE
c::c NICOBAR I. ~
KONDUL I..
III
Indira Point
INDIAN OCEAN
I MAP 36 I


PART - II
NAME OF STATE, DISTRICT AND SUB-DISTRICT ALONGWITH THEIR CODES


NAME OF STATE, DISTRICT AND SUB-DISTRICT ALONGWITH THEIR CODES
1. JAMMU AND. KASHMIR 1 Thathri
1. KUPWARA 1 Bhalessa (Gandoh)
Kupwara 1 Bhaderwah
Handwara 2 10. UDHAMPUR
Karnah 3 Gool Gulab Garh
2. BARAMULA 2 Reasi
Gurez Udhampur
Bandipore 2 Chenani
Sonawari 3 Ramnagar
Sopore 4 11. PUNCH
Pattan 5 Haveli
Baramula 6 Mendhar
Uri 7 Surankote
Gulmarg 8 12. RAJAURI
3. SRINAGAR 3 Thanamandi
Kangan 1 Rajauri
Ganderbal 2 Budhal
Sri nagar 3 Kalakote
4. BADGAM 4 Nowshehra
Beerwah 1 Sunderbani
Badgam 2 13. JAMMU
Chadura 3 Akhnoor
5. PULWAMA 5 Jammu
Pampore 1 Ranbirsinghpora
Tral 2 Bishna
Pulwama 3 Samba
Shupiyan 4 14. KATHUA
6. ANANTNAG 6 Billawar
Pahalgam Bashohli
Bijbehara 2 Kathua
Anantnag 3 Hiranagar
Kulgam 4
Duru 5 2. HIMACHAL PRADESH
7. LEH (LADAKH) 7 1. CHAMBA
Leh 1 Pangi Chaurah
8. KARGIL 8 Saluni Kargil 1 Bhalai Zanskar 2 Dalhousie
9. DODA 9 Bhattiyat Banihal Sihunta Ramban 2 Chamba Doda 3 Holi Kishtwar 4 Brahmaur
77
5 6 7
10 1 2 3 4 5
11 1 2 3
12
2 3 4 5 6
13
2 3 4 5
14 1 2 3 4
2
1
2 3 4 5 6 7 8 9
10

StateIDistfictfSul:Ji.di$i:li~t, ... 'Code'%IQ,i . :"'1/1'
SI.No. ,Sr 'II;', ,,' 'jl%{/' " :)I~I"
... .'.\';. .~3)1·, ·t" (1) , ~) r ... ;;
2. KANGRA 2 Hamirpur 3 Nurpur Barsar 4 Indora 2 Dhatwal 5 Fatehpur 3 Bhoranj 6 Jawali 4 7. UNA 7 Harchakian 5 Bharwain 1 Shahpur 6 Amb 2 Dharmsala 7 Bangana 3 Kangra 8 Una 4 Baroh 9
Haroli 5 Dera Gopipur 10 Jaswan 11 8. BILASPUR 8
Rakkar 12 Ghumarwin 1
Khundian 13 Jhanduta 2
Thural 14 Naina Devi 3
Dhira 15 Bilaspur Sadar 4
Jaisinghpur 16 9. SOLAN 9 Palampur 17 Arki 1 Baijnath 18 Hamshahr 2 Multhan 19 Nalagarh 3
3. LAHUL AND SPITI 3 Krishangarh 4
Udaipur 1 Kasauli 5
Lahul 2 Solan 6
Spiti 3 Kandaghat 7
4. KULLU 4 10. SIRMAUR 10 Manali 1 Rajgarh 1 Kullu 2 Nohra 2 Sainj 3 Pachhad 3 Banjar 4 Renuka 4 Ani 5 Dadahu 5 Nermand 6 Nahan 6
5. MANDl 5 Paonta Sahib 7
Padhar Kamrau 8
Jogindarnagar 2 Shalai 9
Lad Bharol 3 Ronhat 10
Sandhol 4 11. SHIMLA 11 Dharmpur 5 Rampur 1 Kotli 6 Nankhari 2 Sarkaghat 7 Kumharsain 3 Baldwara 8 Seoni 4 Sundarnagar 9 Shimla Rural 5 Mandi 10 Shimla Urban 6 Aut 11 Junga 7 Bali Chowki 12 Theog 8 Thunag 13 Chaupal 9 Chachyot 14 Cheta 10 Nihri 15 Nerua 11 Karsog 16 Jubbal 12
6. HAMIRPUR 6 Kotkhai 13
Tira Sujanpur 1 Tikar 14
Nadaun 2 Rohru 15
78

Code No. SI.No. StateJDistrict/Sub-district Code No.
(tr' ,(3} , • (1) (2) (3)
Chirgaon 16 8. FATEHGARH SAHIB 8
Dodra Kwar 17 Sassi Pathana
12. KINNAUR 12 Fatehgarh Sahib 2
Hangrang Amloh 3
Poo 2 Khamanon 4
Morang 3 9. LUDHIANA 9
Kalpa 4 Samrala 1
Nichar 5 Khanna 2
Sangla 6 Payal 3
Ludhiana (East) 4 3. PUNJAB 3 Ludhiana (West) 5
1. GURDASPUR Raikot 6
Dhar Kalan Jagraon 7
Pathankot 2 10. MOGA 10
Gurdaspur 3 Nihal Singhwala 1
Satala 4 Sagha Purana 2
Dera Saba Nanak 5 Moga 3
2. AMRITSAR 2 11. FIROZPUR 11
Ajnala 1 Zira
Amritsar-I 2 Firozpur 2
Amritsar-II 3 Jalalabad 3
Tarn-Taran 4 Fazilka 4
Patti 5 Abohar 5
Khadur Sahib 6 12. MUKTSAR 12 Saba Sakala 7 Malout 1
3. KAPURTHALA 3 Giddarbaha 2
Shulath Muktsar '3
Kapurthala 2 13. FARIDKOT 13 Sultan pur Lodhi 3 Faridkot 1 Phagwara 4 Jaitu 2
4. JALANDHAR 4 14. BATHINDA 14 Shahkot Rampura Phul 1 Nakodar 2 Sathinda 2 Phillaur 3 Talwandi Sabo 3 Jalandhar-I 4 15. MANSA 15 Jalandhar-II 5 Sardulgarh
5. HOSHIARPUR 5 Sudhlada 2
Dasua Mansa 3 Mukerian 2 16. SANGRUR 16 Hoshiarpur 3 Sarnala Garhshankar 4 Malerkotla 2
6. NAWANSHAHR 6 Dhuri 3
Nawanshahr 1 Sangrur 4
Salachaur 2 Sunam 5
7. RUPNAGAR 7 Moonak 6
Anandpur Sahib 1 17. PATIALA 17
Rupnagar 2 Samana 1
Kharar 3 Nabha 2
SAS, Nagar (Mohali) 4 Patiala 3
79

s,.,.AoI_bi.tUb~'I.tri~ , ' , ,'''~ ,;' l"',
(2)
Rajpura 4 Tehri 4
Dera Bassi 5 Narendranagar· 5
5. DEHRADUN 5 4. CHANDIGARH* 4 Chakrata 1
1. CHANDIGARH 1 Vikasnagar 2
Kaimbwala Dehradun 3
Khuda Alisher 2 Rishikesh 4
Khuda Jassu 3 6. GARHWAL 6 Lahora 4 Srinagar 1 Sarangpur 5 Pauri 2 Dhanas 6 Thali Sain 3 Shahpur 7 Dhoomakot 4 Dadu Majra 8 Lansdowne 5 Maloya 9 Katdwara 6 Palsaura 10 Kujheri 11 7. PITHORAGARH 7
Nizampur Kumbra 12 Munsiari 1
Nizampur Burail 13 Dharchula 2
Jhumaroo 14 Didihat 3
Burail ® 15 Gangolihat 4
Bair Majra 16 Pithoragarh 5
Chahar-Tarf-Burail 17 8. BAGESHWAR 8
Behlana 18 Kapkot 1
Halla Majra 19 Bageshwar 2
Raipur Khurd 20 9. ALMORA 9 Raipur Kalan 21 Bhikia Sain 1 Mauli Jagran 22 Ranikhet 2 Daria 23 Almora 3 Mani Majra (R) 24
10. CHAMPAWAT 10
5. UTTARANCHAL 5 Champawat 1
1. UTTARKASHI 1 11. NAINITAL 11
Puraula 1 Kasya Kutauli 1
Rajgarhi 2 Nainital 2
Dunda 3 Dhari 3
Bhatwari 4 Haldwani 4
2. CHAMOLI 2 12. UDHAM SINGH NAGAR 12
Joshimath 1 Kashipur 1
Chamali 2 Kichha 2
Pokhari 3 Sitarganj 3
Karnaprayag 4 Khatima 4
Tharali 5 13. HARDWAR 13 Gair Sain 6 Raorkee 1
3. RUDRAPRAYAG 3 Hardwar 2
Ukhimath 1 Laksar 3
Rudraprayag 2
4. TEHRI GARHWAL 4 6. HARYANA 6
Ghansali 1 1. PANCHKULA 1
Devprayag 2 Kalka 1
Pratapnagar 3 Panchkula 2
* In Chandigarh the lower unit code represents village code.
80
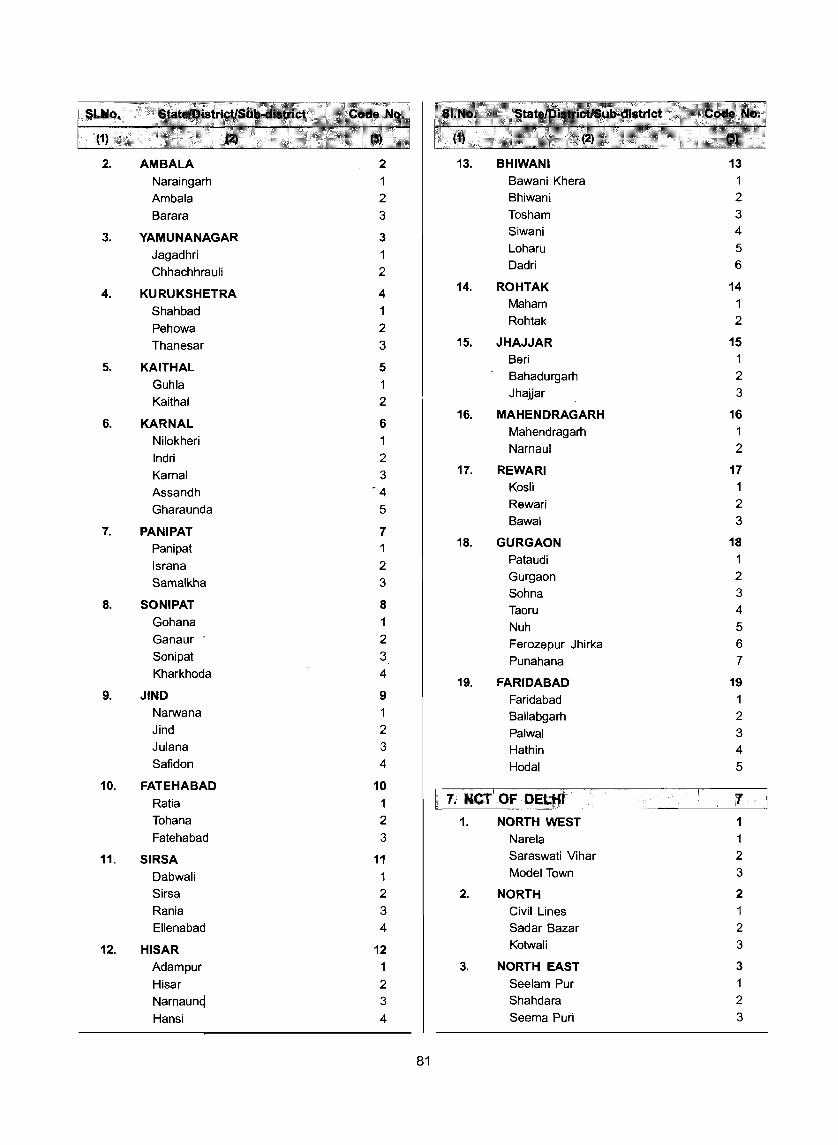
11 ••• ··
(1)····
2. AMBALA 2 13. BHIWANI 13
Naraingarh Bawani Khera 1
Ambala 2 Bhiwani 2
Barara 3 Tosham 3
3. YAMUNANAGAR 3 Siwani 4
Jagadhri 1 Loharu 5
Chhachhrauli 2 Dadri 6
4. KURUKSHETRA 4 14. ROHTAK 14
Shah bad 1 Maham 1
Pehowa 2 Rohtak 2
Thanesar 3 15. JHAJ.JAR 15
5. KAITHAL 5 Beri 1
Guhla 1 Bahadurgarh 2
Kaithal 2 Jhajjar 3
6. KARNAL 6 16. MAHENDRAGARH 16
Nilokheri Mahendragarh 1
1 Narnaul 2
Indri 2 Karnal 3 17. REWARI 17
Assandh -4 Kosli 1
Gharaunda 5 Rewari 2 Bawal 3
7. PAN I PAT 7 Panipat 1 18. GURGAON 18
Israna 2 Pataudi
Samalkha 3 Gurgaon 2 Sohna 3
8. SONIPAT 8 Taoru 4 Gohana 1 Nuh 5 Ganaur . 2 Ferozepur Jhirka 6 Sonipat 3 Punahana 7 Kharkhoda 4
19. FARIDABAD 19 9. JIND 9 Faridabad 1
Narwana 1 Ballabgarh 2 Jind 2 Palwal 3 Julana 3 Hathin 4 Safidon 4 Hodal 5
10. FATEHABAD 10 Ratia 1 7. NCT OF DELHI 7 ] Tohana 2 1. NORTH WEST 1 Fatehabad 3 Narela 1
11. SIRSA 11 Saraswati Vihar 2
Dabwali 1 Model Town 3
Sirsa 2 2. NORTH 2 Rania 3 Civil Lines 1 Ellenabad 4 Sadar Bazar 2
12. HISAR 12 Kotwali 3
Adampur 1 3. NORTH EAST 3
Hisar 2 See lam Pur
NarnauncJ 3 Shahdara 2
Hansi 4 Seema Puri 3
81
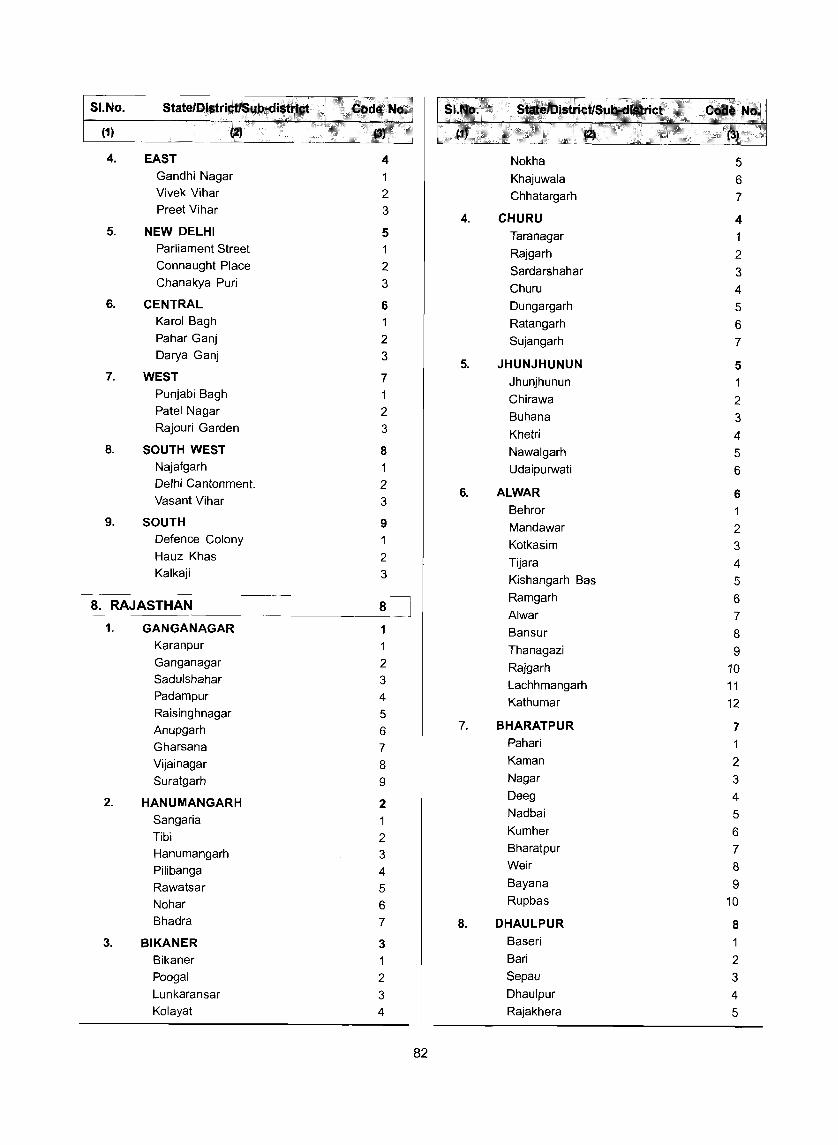
SI.No. State/Distric:;tlSub-dlstrlc:;t .,Code No; ~tat'/DIetr:i~tI'ub~diStr!~~ Code f.lu. ,,,{Ai'
(1) (2) (3) (2)
4. EAST 4 Nokha 5 Gandhi Nagar Khajuwala 6 Vivek Vihar 2 Chhatargarh 7 Preet Vihar 3
4. CHURU 4 5. NEW DELHI 5 Taranagar
Parliament Street 1 Rajgarh 2 Connaught Place 2 Sardarshahar 3 Chanakya Puri 3 Churu 4
6. CENTRAL 6 Dungargarh 5 Karol Bagh Ratangarh 6 Pahar Ganj 2 Sujangarh 7 Darya Ganj 3
5. JHUNJHUNUN 5 7. WEST 7 Jhunjhunun 1
Punjabi Bagh Chirawa 2 Patel Nagar 2 Buhana 3 Rajouri Garden 3 Khetri 4
8. SOUTH WEST 8 Nawalgarh 5 Najafgarh Udaipurwati 6 Delhi Cantonment. 2
6. ALWAR 6 Vasant Vihar 3 Behror 1
9. SOUTH 9 Mandawar 2 Defence Colony Kotkasim 3 Hauz Khas 2 Tijara 4 Kalkaji 3 Kishangarh Bas 5
[!: Ramgarh 6 RAJASTHAN 8 Alwar 7
1. GANGANAGAR 1 Bansur 8 Karanpur Thanagazi 9 Ganganagar 2 Rajgarh 10 Sadulshahar 3 Lachhmangarh 11 Padampur 4 Kathumar 12 Raisinghnagar 5 Anupgarh 6 7. BHARATPUR 7
Gharsana 7 Pahari 1
Vijainagar 8 Kaman 2 Suratgarh 9 Nagar 3
2. HANUMANGARH 2 Deeg 4 Nadbai 5 Sangaria 1 Kumher 6 Tibi 2
Hanumangarh 3 Bharatpur 7
Pilibanga 4 Weir 8
Rawatsar 5 Bayana 9
Nohar 6 Rupbas 10
Bhadra 7 8. DHAULPUR 8 3. BIKANER 3 Baseri 1
Bikaner Bari 2 Poogal 2 Sepau 3 Lunkaransar 3 Dhaulpur 4 Kolayat 4 Rajakhera 5
82

SI.No. State/DistrictlSub·~istrict Code No. SI.No. StatelDistrlctiSub-dlstrict C"~r"'~ (1) (2) (3) (1) (2)
",'
~\' ',:
9. KARAULI 9 Parbatsar 8 Todabhim Makrana 9 Nadoti 2 Nawa 10 Hindaun 3
15. JODHPUR 15 Karauli 4
Phalodi 1 Mandrail 5 Sapotra 6
Osian 2
Bhopalgarh 3 10. SAWAI MADHOPUR 10 Jodhpur 4
Gangapur 1 Shergarh 5 Bamanwas 2 Luni 6 Malarna Doongar 3 Bilara 7 Bonli 4 Chauth Ka Barwara 5 16. JAISALMER 16
Sawai Madhopur 6 Jaisalmer 1
Khandar 7 Pokaran 2
11. DAUSA 11 Fatehgarh 3
Baswa 1 17. BARMER 17
Mahwa 2 Shea 1
Sikrai 3 Bay too 2
Dausa 4 Pachpadra 3 Lalsot 5 Siwana 4
12. JAIPUR 12 Gudha Malani 5
Katputfi Barmer 6
Viratnagar 2 Ramsar 7
Shahpura 3 Chohtan 8
Chomu 4 18. JALOR 18 Phulera 5 Sayla 1 Dudu 6 Ahore 2 Phagi 7 Jalor 3 Sanganer 8 Bhinmal 4 Jaipur 9
Bagora 5 Amber 10
Sanchore 6 Jamwa Ramgarh 11
Raniwara 7 Bassi 12
Chaksu 13 19. SIROHI 19
13. SIKAR 13 Sheoganj 1
Fatehpur 1 Sirohi 2
Lachhmangarh 2 Pindwara 3
Sikar 3 Abu Road 4
Danta Ramgarh 4 Reodar 5
Sri Madhopur 5 20. PAll 20 Neem Ka Thana 6 Jaitaran 1
14. NAGAUR 14 Raipur 2
Ladnu 1 Sojat 3
Didwana 2 Rohat 4
Jayal 3 Pali 5
Nagaur 4 Marwar Junction 6
Kheenvsar 5 Desuri 7
Merta 6 Sumerpur 8
Degana 7 Bali 9
83

SI.No. State/DlstrictiSub-district Code No. SI.No. State/DisttictiSub-disttict Code No.
(1) (2) f3) {1) (2) (3)
21. AJMER 21 Girwa 5 Kishangarh 1 Vallabhnagar 6 Ajmer 2 Ohariawad 7 Peesangan 3 Salumbar 8 Beawar 4 Sarada 9
Masuda 5 Kherwara 10 Nasirabad 6 27. DUNGARPUR 27 Bhinay 7 Dungarpur 1 Sarwar 8 Aspur 2 Kekri 9 Sagwara 3
22. TONK 22 Simalwara 4 Malpura 1 28. BANSWARA 28 Peeplu 2 Ghatol 1 Niwai 3 Garhi 2 Tonk 4 Banswara 3 Todaraisingh 5 Bagidora 4 Deoli 6 Kushalgarh 5 Uniara 7
29. CHITTAURGARH 29 23. BUNDI 23 Rashmi 1
Hindoli Gangrar, 2 Nainwa 2 Begun 3 Indragarh 3 Rawatbhata 4 Keshoraipatan 4 Chittaurgarh 5 Bundi 5 Kapasan 6
24. BHILWARA 24 Dungla 7
Asind 1 Bhadesar 8
Hurda 2 Nimbahera 9
Shahpura 3 Chhoti Sadri 10
Banera 4 Bari Sadri 11
Mandai 5 Pratapgarh 12
Raipur 6 Arnod 13
Sahara 7 30. KOTA 30 Bhilwara 8 Pipalda 1 Kotri 9 Digod 2 Jahazpur 10 Ladpura 3 Mandalgarh 11 Ramganj Mandi 4 Beejoliya 12 Sangod 5
25. RAJSAMAND 25 31. BARAN 31 Bhim 1 Mangrol 1 Deogarh 2 Antah 2 Amet 3 Baran 3 Kumbhalgarh 4 Atru 4 Rajsamand 5 Kishanganj 5 Railmagra 6 Shahbad 6 Nathdwara 7 Chhabra 7
26. UDAIPUR 26 Chhipabarod 8
Mavli 32. JHALAWAR 32 Gogunda 2 Khanpur 1 Kotra 3 Jhalrapatan 2 Jhadol 4 Aklera 3
84

S!.No. Statell)lstrietlSub4lstrlet Code No. SI.No. State/DistrictiSult~j:tlstrict COde No.
(1) (2) (3) (1) (2) (3)
Manohar Thana 4 9. GHAZIABAD 9 Pachpahar 5 Modinagar
Pirawa 6 Ghaziabad 2
Gangdhar 7 Hapur 3 Garhmukteshwar 4
9. UTTAR PRADESH 9 10. GAUTAM BUDDHA NAGAR 10
1. SAHARAN PUR 1 Dadri
Behat Gautam Buddha Nagar 2
Saharanpur 2 Jewar 3
Nakur 3 11. BULANDSHAHR 11
Deoband 4 Sikandrabad 1
2. MUZAFFARNAGAR Bulandshahr 2
2 Siana 3
Kairana 1 Anupshahr 4 Shamli 2 Debai 5 Muzaffarnagar 3 Shikarpur 6 Budhana 4 Khurja 7 Jansath 5
12. ALiGARH 12 3. BIJNOR 3 Khair 1
Najibabad Gabhana 2 Bijnor 2 Atrauli 3 Nagina 3 Koil 4
Dhampur 4 Iglas 5
Chandpur 5 13. HATHRAS 13
4. MORADABAD 4 Sasni 1
Thakurdwara 1 Sikandra Rao 2
Moradabad 2 Hathras 3
Bilari 3 Sadabad 4
Sambhal 4 14. MATHURA 14
Chandausi 5 Chhata Mat 2
5. RAMPUR 5 Mathura 3 Suar 1
15. Bilaspur
AGRA 15 2
Etmadpur 1 Rampur 3 Agra 2 Shahabad 4 Kiraoli 3 Milak 5 Kheragarh 4
6. JYOTIBA PHULE NAGAR 6 Fatehabad 5
Dhanaura Bah 6
Amroha 2 16. FIROZABAD 16 Hasanpur 3 Tundla 1
7. MEERUT 7 Firozabad 2
Sardhana 1 Jasrana 3
Mawana 2 Shikohabad 4
Meerut 3 17. ETAH 17 Kasganj 1
8. BAG HPAT 8 Patiyali 2 Baraut 1 Aliganj 3 Baghpat 2 Etah 4 Khekada 3 Jalesar 5
85

SI.No. State/DlstrictlSub-dlstrict Code No. St.No. StatelDlstrictiSub-district Code No.
(1) (2) (3) (1) (2) (3)
18. MAINPURI 18 Unnao 3 Mainpuri 1 Purwa 4 Karhal 2 Bighapur 5 Bhogaon 3 27. LUCKNOW 27
19. BUDAUN 19 Malihabad 1 Gunnaur Bakshi Ka Talab 2
Bisauli 2 Lucknow 3 Bilsi 3 Mohanlalganj 4
Sahaswan 4 28. RAE BAREL! 28 Budaun 5 Maharajganj Dataganj 6 Tiloi 2
20. BAREILLY 20 Rae Bareli 3
Baheri 1 Lalganj 4
Meerganj 2 Dalmau 5
Aonla 3 Unchahar 6
Bareilly 4 Salon 7
Nawabganj 5 29. FARRUKHABAD 29 Faridpur 6 Kaimganj 1
21. PILlBHIT 21 Amritpur 2
Pilibhit Farrukhabad 3
Bisalpur 2 30. KANNAUJ 30 Puranpur 3 Chhibramau
22. SHAHJAHANPUR 22 Kannauj 2
Powayan 1 Tirwa 3
Tilhar 2 31. ETAWAH 31 Shahjahanpur 3 Jaswantnagar 1 Jalalabad 4 Saifai 2
23. KHERI 23 Etawah 3
Nighasan 1 Bharthana 4
Gola Gokaran Nath 2 Chakarnagar 5
Mohammdi 3 32. AURAIYA 32 Lakhimpur 4 Bidhuna 1 Dhaurahara 5 Auraiya 2
24. SITAPUR 24 33. KANPUR DEHAT 33 Misrikh 1 Rasulabad Sitapur 2 Derapur 2 Laharpur 3 Akbarpur 3 Biswan 4 Bhognipur 4 Mahmudabad 5 Sikandra 5 Sidhauli 6 34. KANPUR NAGAR 34
25. HARDOI 25 Bilhaur 1 Shahabad 1 Kanpur 2 Sawayajpur 2 Ghatampur 3 Hardoi 3 35. JALAUN 35 Bilgram 4 Madhogarh 1 Sandila 5 Jalaun 2
26. UNNAO 26 Kalpi 3 Safipur 1 Orai 4 Hasanganj 2 Konch 5
86
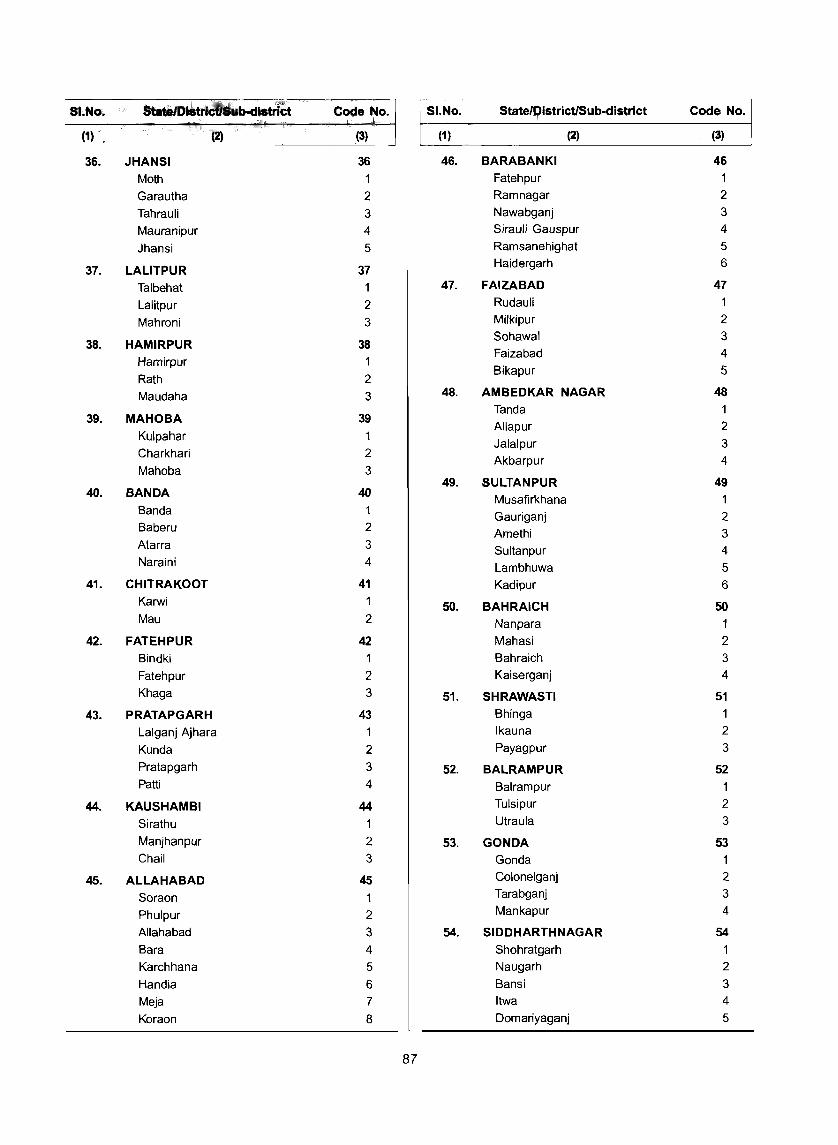
".No. StatelDiatriotlSub-dlstrit:t ~No·1 51.No. 5tate/Oistrict/5ub-district Code No.
(1) .' ,. (2) (1) (2) (3)
36. JHANSI 36 46. BARABANKI 46
Moth 1 Fatehpur 1
Garautha 2 Ramnagar 2
Tahrauli 3 Nawabganj 3
Mauranipur 4 Sirauli Gauspur 4
Jhansi 5 Ramsanehighat 5
37. LALITPUR 37 Haidergarh 6
Talbehat 1 47. FAIZABAD 47
Lalitpur 2 Rudauli 1
Mahroni 3 Milkipur 2
38. HAMIRPUR 38 Sohawal 3
Hamirpur 1 Faizabad 4
Rath 2 Bikapur 5
Maudaha 3 48. AMBEDKAR NAGAR 48
39. MAHOBA 39 Tanda 1 Allapur 2
Kulpahar 1 Jalalpur 3
Charkhari 2 Akbarpur 4
Mahoba 3 49. 5ULTANPUR 49
40. BANDA 40 Musafirkhana 1 Banda 1 Gauriganj 2 Baberu 2 Amethi 3 Atarra 3 Sultanpur 4 Naraini 4 Lambhuwa 5
41. CHITRAKOOT 41 Kadipur 6 Karwi 50. BAHRAICH 50 Mau 2 Nanpara 1
42. FATEHPUR 42 Mahasi 2 Bindki 1 Bahraich 3
Fatehpur 2 Kaiserganj 4
Khaga 3 51. SHRAWA5TI 51
43. PRATAPGARH 43 Bhinga
Lalganj Ajhara 1 Ikauna 2
Kunda 2 Payagpur 3
Pratapgarh 3 52. BALRAMPUR 52 Patti 4 Balrampur
44. KAUSHAMBI 44 Tulsipur 2
Sirathu 1 Utraula 3
Manjhanpur 2 53. GONDA 53 Chail 3 Gonda 1
45. ALLAHABAD 45 Colonelganj 2
Soraon 1 Tarabganj 3
Phulpur 2 Mankapur 4
Allahabad 3 54. SIDDHARTHNAGAR 54
Bara 4 Shohratgarh 1
Karchhana 5 Naugarh 2
Handia 6 Bansi 3
Meja 7 I twa 4
Koraon 8 Domariyaganj 5
87

SI;N(i; Code No.
(1) (3)
55. BAST I 55 Ballia 4
Bhanpur 1 Bansdih 5
Harraiya 2 Bairia 6
Basti 3 64. JAUNPUR 64
56. SANT KABIR NAGAR 56 Shahganj 1
Mehdawal Badlapur 2
Khalilabad 2 Machhlishahr 3
Ghanghata 3 Jaunpur 4
57. MAHARAJGANJ 57 Mariahu 5
Nautanwa 1 Kerakat 6
Nichlaul 2 65. GHAZIPUR 65
Pharenda 3 Jakhanian
Maharajganj 4 Saidpur 2
58. GORAKHPUR 58 Ghazipur 3
Campierganj 1 Mohammadabad 4
Sahjanwa 2 Zamania 5
Gorakhpur 3 66. CHANDAULI 66
Chauri Chaura 4 Sakaldiha 1
Bansgaon 5 Chandauli 2
Khajani 6 Chakia 3
Gola 7 67. VARANASI 67
59. KUSHINAGAR 59 Pindra 1
Padrauna 1 Varanasi 2
Hata 2 68. SANT RAVIDAS NAGAR 68 Kasya 3 Bhadohi 1 Tamkuhi Raj 4 Gyanpur 2
60. DEORIA 60 69. MIRZAPUR 69 Deoria 1 Mirzapur 1 Rudrapur 2 Lalganj 2 Barhaj 3 Marihan 3 Salempur 4 Chunar 4 Bhatpar Rani 5
70. SONBHADRA 70 61. AZAMGARH 61 Ghorawal 1
Burhanpur 1 Robertsganj 2 Sagri 2 Dudhi 3 Azamgarh 3
Nizamabad 4 110. BIHAR 10 Phulpur 5
1. PASHCHIM CHAMPARAN 1 Lalganj 6
Sidhaw Mehnagar 7
Ramnagar 2 62. MAU 62 Gaunaha 3
Ghosi 1 Mainatanr 4 Madhuban 2 Narkatiaganj 5 Maunath Bhanjan 3 Lauria 6 Muhammadabad Gohna 4 Bagaha 7
63. BALLIA 63 Piprasi 8
Belthara Road 1 Madhubani 9
Sikanderpur 2 Bhitaha 10
Rasra 3 Thakrahan 11
88
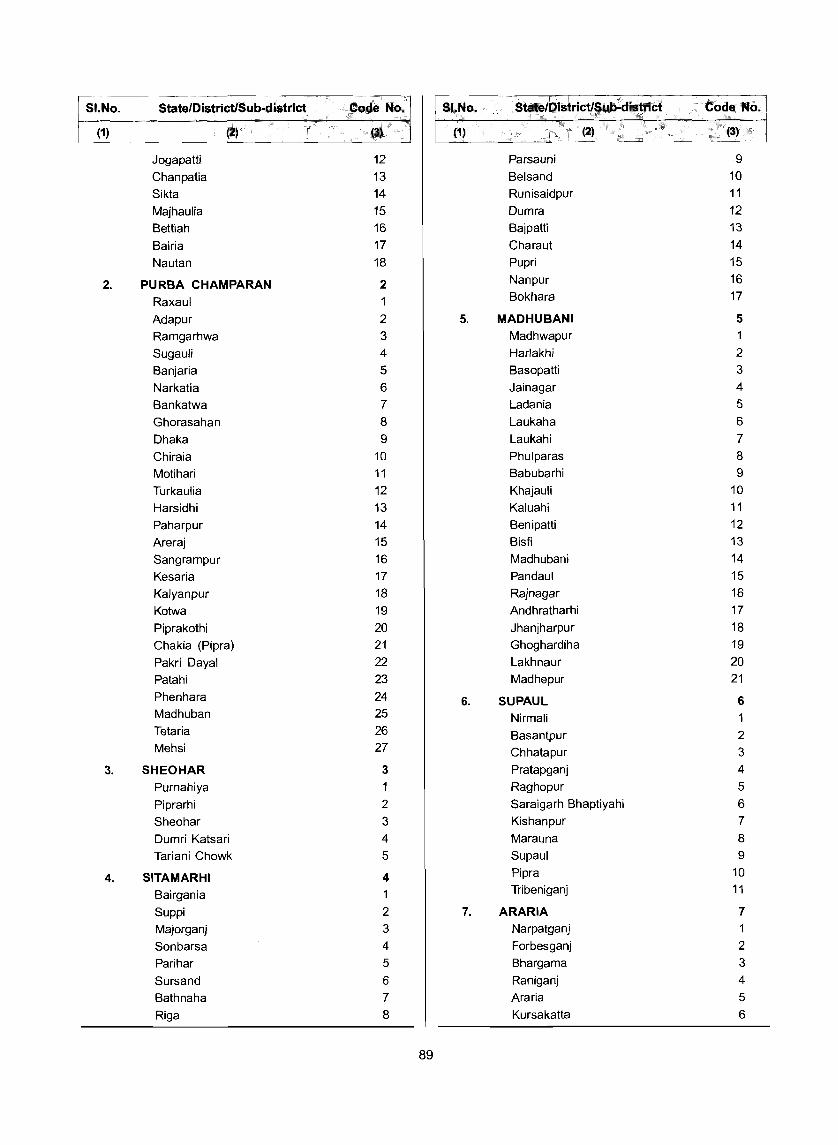
51.No. 5tate/DistrictlSub·district Code No. 51.No. 5tate/DistrictlSub·district Code No.
(1) (2) (3) (1) (2) {3)
Jogapatti 12 Parsauni 9 Chanpatia 13 Belsand 10 Sikta 14 Runisaidpur 11 Majhaulia 15 Dumra 12 Bettiah 16 Bajpatti 13 Bairia 17 Charaut 14 Nautan 18 Pupri 15
2. PURBA CHAMPARAN 2 Nanpur 16
Raxaul Bokhara 17
Adapur 2 5. MADHUBANI 5 Ramgarhwa 3 Madhwapur 1
Sugauli 4 Harlakhi 2 Banjaria 5 Basopatti 3
Narkatia 6 Jainagar 4 Bankatwa 7 Ladania 5 Ghorasahan 8 Laukaha 6 Dhaka 9 Laukahi 7 Chiraia 10 Phulparas 8
Motihari 11 Babubarhi 9 Turkaulia 12 Khajauli 10 Harsidhi 13 Kaluahi 11 Paharpur 14 Benipatti 12 Areraj 15 Bisfi 13 Sangrampur 16 Madhubani 14 Kesaria 17 Pandaul 15 Kalyanpur 18 Rajnagar 16 Kotwa 19 Andhratharhi 17 Piprakothi 20 Jhanjharpur 18 Chakia (Pipra) 21 Ghoghardiha 19 Pakri Dayal 22 Lakhnaur 20 Patahi 23 Madhepur 21 Phenhara 24 6. SUPAUL 6 Madhuban 25 Nirmali 1 Tetaria 26 Basantpur 2 Mehsi 27 Chhatapur 3
3. SHEOHAR 3 Pratapganj 4 Purnahiya Raghopur 5 Piprarhi 2 Saraigarh Bhaptiyahi 6 Sheohar 3 Kishanpur 7 Dumri Katsari 4 Marauna 8 Tariani Chowk 5 Supaul 9
4. SITAMARHI 4 Pipra 10
Bairgania Tribeniganj 11
Suppi 2 7. ARARIA 7
Majorganj 3 Narpatganj
Sonbarsa 4 Forbesganj 2 Parihar 5 Bhargama 3
Sursand 6 Raniganj 4 Bathnaha 7 Araria 5 Riga 8 Kursakatta 6
89
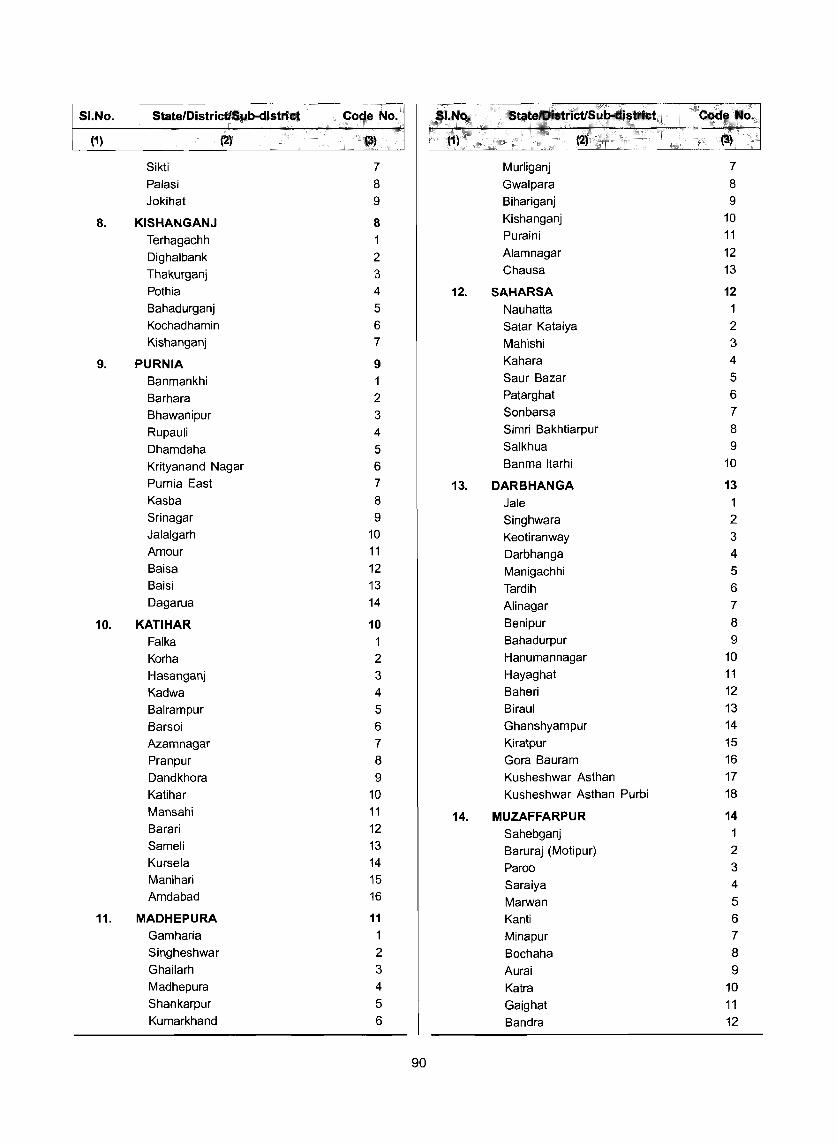
51.No. 5tate/DistrictlSub-distrjct Code No. SI.No, .. Stat~/pl$trictl$ub-di'trict Code No ••
(i} (2) (3) til (2) (3)
Sikti 7 Murliganj 7 Palasi 8 Gwalpara 8 Jokihat 9 Bihariganj 9
8. KISHANGANJ 8 Kishanganj 10
Terhagachh 1 Puraini 11
Dighalbank 2 Alamnagar 12
Thakurganj 3 Chausa 13
Pothia 4 12. SAHARSA 12 Bahadurganj 5 Nauhatta 1 Kochadhamin 6 Satar Kataiya 2 Kishanganj 7 Mahishi 3
9. PURNIA 9 Kahara 4
Banmankhi Saur Bazar 5
Barhara 2 Patarghat 6
Bhawanipur 3 Sonbarsa 7
Rupauli 4 Simri Bakhtiarpur 8
Dhamdaha 5 Salkhua 9
Krityanand Nagar 6 Banma Itarhi 10
Purnia East 7 13. DARBHANGA 13 Kasba 8 Jale 1 Sri nagar 9 Singhwara 2 Jalalgarh 10 Keotiranway 3 Amour 11 Darbhanga 4 Baisa 12 Manigachhi 5 Baisi 13 Tardih 6 Dagarua 14 Alinagar 7
10. KATIHAR 10 Benipur 8
Falka 1 Bahadurpur 9
Korha 2 Hanumannagar 10 Hasanganj 3 Hayaghat 11
Kadwa 4 Baheri 12 Balrampur 5 Biraul 13 Barsoi 6 Ghanshyampur 14 Azamnagar 7 Kiratpur 15 Pranpur 8 Gora Bauram 16
Dandkhora 9 Kusheshwar Asthan 17 Katihar 10 Kusheshwar Asthan Purbi 18 Mansahi 11 14. MUZAFFARPUR 14 Barari 12 Sahebganj Sameli 13 Baruraj (Motipur) 2 Kursela 14 Paroo 3 Manihari 15 Saraiya 4 Amdabad 16 Marwan 5
11. MADHEPURA 11 Kanti 6 Gamharia Minapur 7 Singheshwar 2 Bochaha 8 Ghailarh 3 Aurai 9 Madhepura 4 Katra 10 Shankarpur 5 Gaighat 11 Kumarkhand 6 Bandra 12
90

SI.No. State/DlstrictiSub-dlstrlct Code No. SIoNo. State/DistrictiSub-district Code No.
(t~ (2) ; (3) (1) (2) (3)
Dholi (Moraul) 13 Revelganj 10 Musahri 14 Chapra 11 Kurhani 15 Nagra 12 Sakra 16 Marhaura 13
15. GOPALGANJ 15 Amnour 14
Kataiya 1 Maker 15
Bijaipur 2 Parsa 16
Bhorey 3 Dariapur 17
Pachdeori 4 Garkha 18
Kuchaikote 5 Dighwara 19
Phulwaria 6 Sonepur 20
Hathua 7 18. VAISHALI 18 Uchkagaon 8 Vaishali 1 Thawe 9 Paterhi Belsar 2 Gopalganj 10 Lalganj 3 Manjha 11 Bhagwanpur 4 Barauli 12 Goraul 5 Sidhwalia 13 Chehra Kalan 6 Baikunthpur 14 Patepur 7
16. SIWAN 16 Mahua 8
Nautan 1 Jandaha 9
Siwan 2 Raja Pakar 10
Barharia 3 Hajipur 11
Goriakothi 4 Raghopur 12
Lakri Nabiganj 5 Bidupur 13
Basantpur 6 Desri 14
Bhagwanpur Hat 7 Sahdai Buzurg 15
Maharajganj 8 Mahnar 16
Pachrukhi 9 19. SAMASTIPUR 19 Hussainganj 10 Kalyanpur 1 Ziradei 11 Warisnagar 2 Mairwa 12 Shivaji Nagar 3 Guthani 13 Khanpur 4 Darauli 14 Samastipur 5 Andar 15 Pusa 6 Raghunathpur 16 Tajpur 7 Hasanpura 17 Morwa 8 Daraundha 18 Patori 9 Siswan 19 Mohanpur 10
17. SARAN 17 Mohiuddinagar 11 Mashrakh 1 Sarairanjan 12 Panapur 2 Vidyapati Nagar 13 Taraiya 3 Dalsinghsarai 14 Ishupur 4 Ujiarpur 15 Baniapur 5 Bibhutpur 16 Lahladpur 6 Rosera 17 Ekma 7 Singhia 18 Manjhi 8 Hasanpur 19 Jalalpur 9 Bithan 20
91

SI.No. State/DistrictiSub-district Code No. SI.No. StateiOistrlctlSub.district Code No.
(1) (2) (3) (1) (2) (3)
20. BEGUSARAI 20 Phulidumar 7 Khudabandpur Belhar 8 Chorahi 2 Chanan 9 Garhpura 3 Katoria 10 Cheria Bariarpur 4 Bausi 11 Bhagwanpur 5 24. MUNGER 24 Mansurchak 6 Munger 1 Bachhwara 7 Bariyarpur 2 Teghra 8 Jamalpur 3 Barauni 9
Dharhara 4 Birpur 10
Kharagpur 5 Begusarai 11
Asarganj 6 Naokothi 12
Tarapur 7 Bakhri 13
Tetia Bombar 8 Dandari 14 Sahebpur Kamal 15
Sangrampur 9
Balia 16 25. LAKHISARAI 25
Matihani 17 Barahiya 1
Shamho Akha Kurha 18 Pipariya 2
21. KHAGARIA 21 Surajgarha 3
Alauli Lakhisarai 4
Khagaria 2 Ramgarh Chowk 5
Mansi 3 Halsi 6
Chautham 4 26. SHEIKHPURA 26
Beldaur 5 Barbigha
Gogri 6 Shekhopur Sarai 2
Parbatta 7 Sheikhpura 3
22. BHAGALPUR 22 Ghat Kusumbha 4
Narayanpur Chewara 5
Bihpur 2 Ariari 6
Kharik 3 27. NALANDA 27 Naugachhia 4 Karai Parsurai Rangra Chowk 5 Nagar Nausa 2 Gopalpur 6 Harnaut 3 Pirpainti 7 Chandi 4 Colgong 8 Rahui 5 Ismailpur 9 Bind 6 Sabour 10 Sarmera 7 Nathnagar 11 Asthawan 8 Sultanganj 12 Bihar 9 Shahkund 13 Noorsarai 10 Goradih 14 Tharthari 11 Jagdishpur 15 Parbalpur 12 Sonhaula 16 Hilsa 13
23. BANKA 23 Ekangarsarai 14
Shambhuganj 1 Islampur 15
Amarpur 2 Ben 16
Rajaun 3 Rajgir 17
Dhuraiya 4 Silao 18
Barahat 5 Giriak 19
Banka 6 Katrisarai 20
92
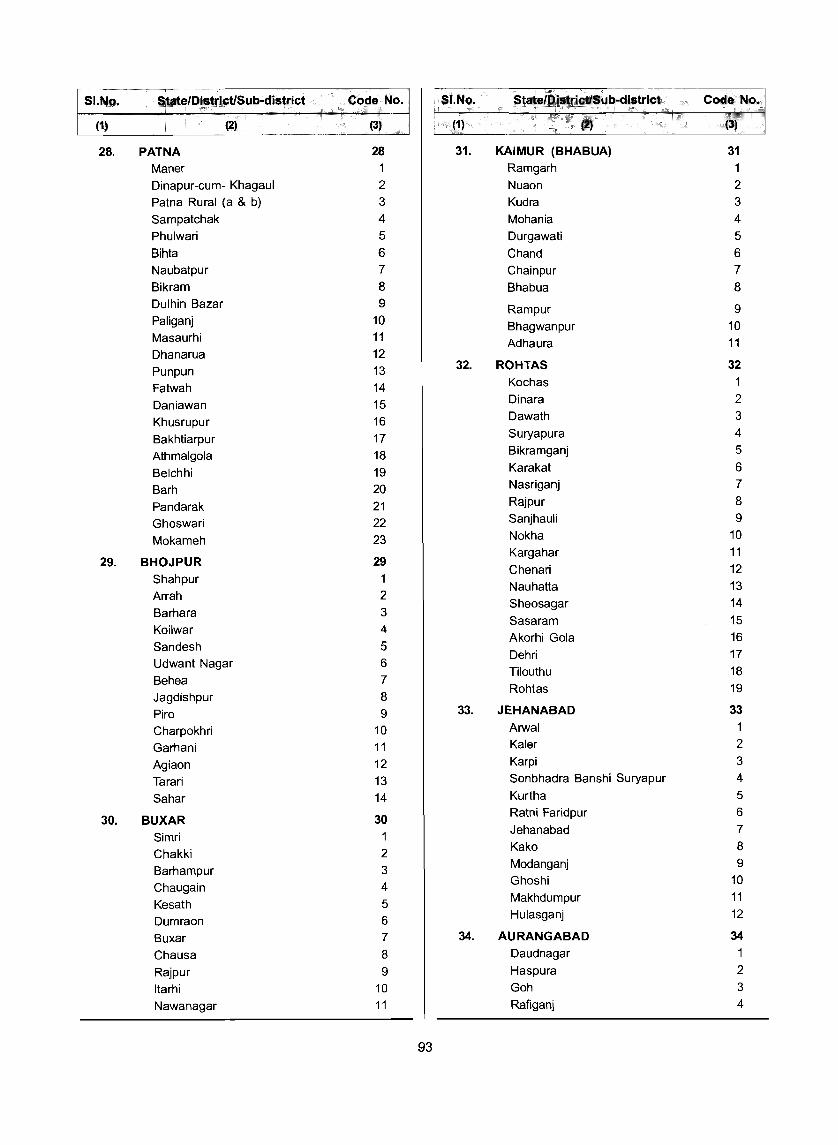
SI-No. State/Di'trlctlSub-district Code No. Sl.No. State/Dlstrictl~Ub-dl~trlct Code No.
(1) (2) (3) (1) (2) (3).
28. PATNA 28 31. KAIMUR (BHABUA) 31
Maner 1 Ramgarh 1 Dinapur-cum- Khagaul 2 Nuaon 2 Patna Rural (a & b) 3 Kudra 3 Sampatchak 4 Mohania 4 Phulwari 5 Durgawati 5 Bihta 6 Chand 6 Naubatpur 7 Chainpur 7 Bikram 8 Bhabua 8 Dulhin Bazar 9 Rampur 9 Paliganj 10 Bhagwanpur 10 Masaurhi 11 Adhaura 11 Dhanarua 12 Punpun 13 32. ROHTAS 32
Fatwah 14 Kochas
Daniawan 15 Dinara 2
Khusrupur 16 Dawath 3
Bakhtiarpur 17 Suryapura 4
Athmalgola 18 Bikramganj 5
Belchhi 19 Karakat 6
Barh 20 Nasriganj 7
Pandarak 21 Rajpur 8
Ghoswari 22 Sanjhauli 9
Mokameh 23 Nokha 10
29. BHOJPUR 29 Kargahar 11
Shahpur 1 Chenari 12
Arrah 2 Nauhatta 13
Barhara 3 Sheosagar 14
Koilwar 4 Sasaram 15
Sandesh 5 Akorhi Gola 16
Udwant Nagar 6 Dehri 17
Behea 7 Tilouthu 18
Jagdishpur 8 Rohtas 19
Piro 9 33. JEHANABAD 33
Charpokhri 10 Arwal 1
Garhani 11 Kaler 2
Agiaon 12 Karpi 3
Tarari 13 Sonbhadra Banshi Suryapur 4
Sahar 14 Kurtha 5
30. BUXAR 30 Ratni Faridpur 6
Simri Jehanabad 7
Chakki 2 Kako 8
Barhampur 3 Modanganj 9
Chauga in 4 Ghoshi 10
Kesath 5 Makhdumpur 11
Dumraon 6 Hulasganj 12
Buxar 7 34. AURANGABAD 34
Chausa 8 Daudnagar 1
Rajpur 9 Haspura 2 Itarhi 10 Goh 3 Nawanagar 11 Rafiganj 4
93

51.No. 5tate/OlstrlctJ'ub~ais~rict Code "0. Sl.No. ' Stat.IOII!tr1~,ulHJlsb;jct , ' 'L;'I\' ':0\ ' I,'
Code No.
(1) (2) (3) , (1)" i ' (2) '., '", .• ' , , (3) ,. , .. '
Obra 5 Jamui 3 Aurangabad 6 Barhat 4 Barun 7 Lakshmipur 5 Nabinagar 8 Jhajha 6 Kutumba 9 Gidhaur 7
Deo 10 Khaira 8
Madanpur 11 Sono 9
35. GAYA 35 Chakai 10
Konch 1 Tikari 2 111. SIKKIM 11
Belaganj 3 1. NORTH 1
Khizirsarai 4 Chungthang 1
Neem Chak Bathani 5 Mangan 2 Muhra 6 2. WEST 2 Atri 7 Gyalshing 1 Manpur 8 Soreng 2 Gaya Town 9
SOUTH Paraiya 10
3. 3 Namchi 1
Guraru 11 Ravong 2
Gurua 12 Amas 13 4. EAST 4
Banke Bazar 14 Gangtok 1
Imamganj 15 Pakyong 2
Dumaria 16 Rongli 3
Sherghati 17 Dobhi 18 112. ARUNACHAL PRADESH 12
Bodh Gaya 19 1. TAWANG 1
Tan Kuppa 20 Zemithang 1 Wazirganj 21 Lumia 2 Fatehpur 22 Dudunghar 3 Mohanpur 23 Tawang 4 Barachatti 24 Jang 5
36. NAWADA 36 Mukto 6
Nardiganj 1 Thingbu 7
Nawada 2 2. WEST KAMENG 2 Warisaliganj 3 Dirang 1
Kashi Chak 4 Nafra 2 Pakribarawan 5 Bomdila 3 Kawakol 6 Kalaktang 4 Roh 7 Rupa 5 Govindpur 8 Singchung 6 Akbarpur 9 Jamiri 7 Hisua 10 Thrizino 8 Narhat 11 Bhalukpong 9
Meskaur 12 Balemu 10 Sirdala 13 3. EAST KAMENG 3 Rajauli 14 Seijosa
37. JAMUl 37 Pakke Kessang 2 Islamnagar Aliganj 1 Richukrong 3 Sikandra 2 Seppa 4
94

SI.No. .,U.'_lst.lctiSUb-dlstrict, Code NQ. SI.No. State/DistrictlSub·district ~ode J';4Q •.
(1) (2) (3) (1) (2) '(3)"/ : Lada 5 Payum 4
Bameng 6 Tato 5 Pipu 7 Kaying 6 Khenewa 8 Darak 7 Chayangtajo 9 Kamba 8 Sawa 10 Rumgong 9
4. PAPUM PARE 4 Jomlo Mobuk 10
Balijan Liromoba 11
Itanagar 2 Yomcha 12
Naharlagun 3 Along 13
Doimukh 4 Tirbin 14
Toru 5 Basar 15
Sagalee 6 Daring 16
Leporiang 7 Gensi 17
Mengio 8 Likabali 18
Kimin 9 Kangku 19
5. LOWER SUBANSIRI 5 Bagra 20
Ziro 1 8. EAST SIANG 8
Yachuli 2 Boleng 1
Pistana 3 Riga 2
Palin 4 Pangin 3
Yangte 5 Rebo-Perging 4
Sangram 6 Koyu 5
Nyapin 7 Nari 6
Koloriang 8 New Seren 7
Chambang 9 Bilat 8
Sarli 10 Ruksin 9
Parsi-Parlo 11 Sille-Oyan 10
Damin 12 Pasighat 11
Longding Koling 13 Mebo 12
Tali 14 9. UPPER SIANG 9 Kamporijo 15 Tuting Dollungmukh 16 Migging 2 Raga 17 Palling 3
6. UPPER SUBANSIRI 6 Gelling 4
Taksing Singa 5
Limeking 2 Yingkiong 6
Nacho 3 Jengging 7
Siyum 4 Geku 8
Taliha 5 Mariyang 9
Payeng 6 Katan 10
Giba 7 10. DIBANG VALLEY 10 Daporijo 8 Mipi 1 Puchi Geko 9 Anini 2 Dumporijo 10 Etalin 3 Baririjo 11 Anelih 4
7. WEST SIANG 7 Kronli 5
Mechuka 1 Hunli 6
Monigong 2 Desali 7
Pidi 3 Roing 8
95
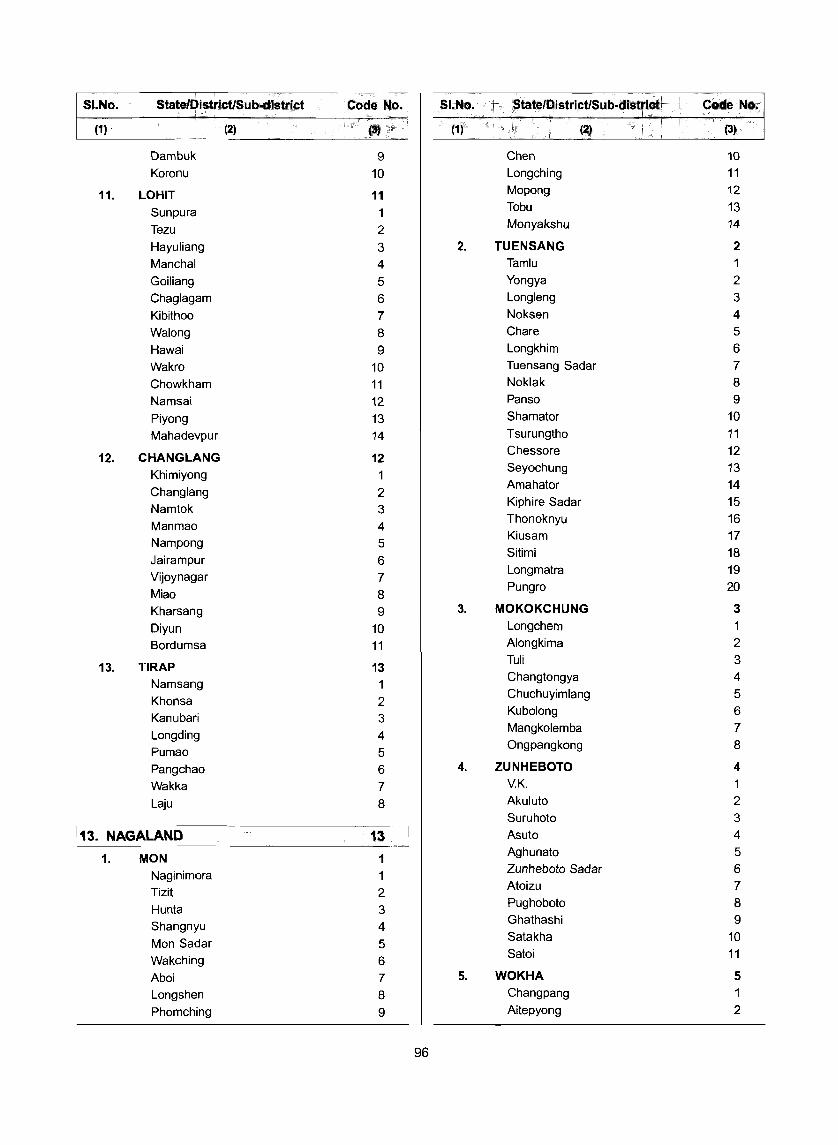
SI.No. State/District/SUb-dlstrict . Code No. SI.No • State/l,)lstrictiSub-district . Code No;
(1) . (2) (3) (1) (2) (3)
Dambuk 9 Chen 10 Koronu 10 Longching 11
11. LOHIT 11 Mopong 12
Sunpura 1 Tobu 13
Tezu 2 Monyakshu 14
Hayuliang 3 2. TUENSANG 2 Manchal 4 Tamlu 1 Goiliang 5 Yongya 2 Chaglagam 6 Longleng 3 Kibithoo 7 Noksen 4 Walong 8 Chare 5 Hawai 9 Longkhim 6
Wakro 10 Tuensang Sadar 7
Chowkham 11 Noklak 8 Namsai 12 Panso 9
Piyong 13 Shamator 10 Mahadevpur 14 Tsurungtho 11
12. CHANGLANG 12 Chessore 12
Khimiyong Seyochung 13
Changlang 2 Amahator 14
Namtok 3 Kiphire Sadar 15
Manmao 4 Thonoknyu 16
Nampong 5 Kiusam 17
Jairampur 6 Sitimi 18
Vijoynagar 7 Longmatra 19
Miao 8 Pungro 20
Kharsang 9 3. MOKOKCHUNG 3
Diyun 10 Longchem
Bordumsa 11 Alongkima 2
13. TIRAP 13 Tuli 3
Namsang 1 Changtongya 4
Khonsa 2 Chuchuyimlang 5
Kanubari 3 Kubolong 6
Longding 4 Mangkolemba 7
Pumao 5 Ongpangkong 8
Pangchao 6 4. ZUNHEBOTO 4 Wakka 7 v.K. 1
Laju 8 Akuluto 2 Suruhoto 3
113. NAGALAND 13 Asuto 4
1. MON 1 Aghunato 5
Naginimora 1 Zunheboto Sadar 6
Tizit 2 Atoizu 7
Hunta 3 Pughoboto 8
Shang nyu 4 Ghathashi 9
Mon Sadar 5 Satakha 10
Wakching 6 Satoi 11
Aboi 7 5. WOKHA 5 Longshen 8 Chang pang 1
Phomching 9 Aitepyong 2
96

SI.No. State/DistrictlSub-dlstrict Code No .• SI-No. State/DistrictlSub·dlstrict Code No.
(1) (2) (3) (1) (2) (3)
Bhandari 3 2. TAMENGlONG 2 Baghty 4 Tamenglong West Sub-Division 1
Sungro 5 Tamenglong North Sub-Division 2
San is 6 Tamenglong Sub-Division 3 Lotsu 7 Nungba Sub-Division 4 Ralan 8 3. CHURACHANDPUR 3 Wozhuro 9 Tipaimukh Sub-Division Wokha Sadar 10 Thanlon Sub-Division 2 Chukitong 11 Churachandpur North Sub-Division 3
6. DIMAPUR 6 Churachandpur Sub-Division 4 Niuland 1 Singngat Sub-Division 5 Kuhoboto 2 4. BISHNUPUR 4 Nihokhu 3 Nambol Sub-Division 1 Dimapur Sadar 4 Bishnupur Sub-Division 2 Chumukedima 5 Moirang Sub-Division 3 Dhansiripar 6
Medziphema 7 5. THOUBAL 5 Lilong Sub-Division 1
7. KOHIMA 7 Thoubal Sub-Division 2
Tseminyu 1 Kakching Sub-Division 3 Chiephobozou 2
Kezocha 3 6. IMPHAl WEST 6
Jakhama 4 Lamshang Sub-Division
Kohima Sadar 5 Patsoi Sub-Division 2
Sechu 6 Lamphelpat Sub-Division 3
Ngwalwa 7 Wangoi Sub-Division 4
Jalukie 8 7. IMPHAL EAST 7 Athibung 9 Jiribam Sub-Division 1 Nsong 10 Sawombung Sub-Division 2 Tening 11 Porompat Sub-Division 3 Peren 12 Keirao Bitra Sub-Division 4
8. PHEK 8 8. UKHRUL 8 Sekruzu Ukhrul North Sub-Division Phek Sadar 2 Ukhrul Central Sub-Division 2 Meluri 3 Kamjong - Chassad Sub-Division 3 Phokhungri 4 Phungyar - Phaisat Sub-Division 4 Chozuba 5 Ukhrul South Sub-Division 5 Chetheba 6
9. CHAN DEL 9 Sakraba 7
Machi Sub-Division Pfutsero 8
Tengnoupal Sub-Division Khezhakeno 9
2
Chizami 10 Chandel Sub-Division 3 Chakpikarong Sub-Division 4
114. MANIPUR 14 115. MIZORAM 15
1. SENAPATI 1 Mao-Maram Sub-Division 1
1. MAMIT 1
Paomata Sub-Division 2 Zawlnuam 1
Purul Sub-Division 3 West Phaileng 2
Sadar Hills West Sub-Division 4 Reiek 3
Saitu-Gamphazol Sub-Division 5 2. KOlASIB 2 Sadar Hills East Sub-Division 6 North Thingdawl
97

S!.No. State/DistrictlSub-distrlct Code No. SI.No. State/DlstrlctlSl,lb-dlstrict , 'I :",
Codt. No.
(1) (2) (3) (1) (2) (3)
3. AIZAWL 3 Hrishyamukh 6 Darlawn 1 Bagafa 7
Phullen 2 Karbuk 8 Aibawk 3
10 Rupaichhari 9
Tlangnuam 90 Satchand 10 Thingsulthliah 91 3. DHALAI 3
4. CHAMPHAI 4 Salema
Ngopa 1 Manu 2
Khawzawl 2 'S
Ambassa 3
Khawbung 3 Chhamanu 4
5. SERCHHIP 5 Dumburnagar 5
Serchhip 1 4. NORTH TRIPURA 4 East Lungdar 92 Gournagar
6. LUNGLEI 6 Kadamtala 2
West Bunghmun Panisagar 3
Lungsen 2 Damchhara 4
Lunglei 3 ~ Pencharthal 5
Hnahthial 4 Kumarghat 6
Dasda 7 7. LAWNGTLAI 7
Jampuii hills 8 Chawngte 1 Lawngtlai 2 117. MEGHALAYA 17
8. SAIHA 8 1. WEST GARO HILLS 1 Sangau 1 Selsella TUipang 2 Dadenggiri 2
116. TRIPURA 16 Tikrikilla 3
Rongram 4 1. WEST TRIPURA 1 Betasing 5
Mohanpur 1 Zikzak 6 Hezamara 2 Dalu 7 Pabmabil 3 2. EAST GARO HILLS 2 Khowai 4
Resubelpara Tulashikhar 5
Dambo Rongjeng 2 Kalyanpur 6
Songsak 3 Teliamura 7
Samanda 4 Mandai 8 Jirania 9 3. SOUTH GARO HILLS 3
Dukli 10 Chokpot
Jampuijala 11 Baghmara 2
Bishalgarh 12 Rongara 3
Boxanagar 13 4. WEST KHASI HILLS 4 Melaghar 14 Mawshynrut 1
Kathalia 15 Nongstoin 2
2. SOUTH TRIPURA 2 Mairang 3
Killa 1 Ranikor 4
Amarpur 2 Mawkyrwat 5
Matarbari 3 5. RI BHO. 5 Kakraban 4 Umling
Rajnagar 5 Umsning 2
98

SI.No. State/DistrictlSub~district Code No. SI.No~ State/DistrlctlSu~dlstricl
(1) (2) (3) (1) . (2)
6. EAST KHASI HILLS 6 Sarupeta 7 Mawphlang Jalah 8 Mylliem 2 6. KAMRUP 6 Mawryngkneng 3 Goreswar Mawkynrew 4 Rangia 2 Mawsynram 5 Kamalpur (Pt) 3 Sheila Bholaganj 6 Hajo 4 Pynursla 7 Chhaygaon 5
7. JAINTIA HILLS 7 Chamaria 6
Thadlaskein 1 Nagarbera 7
Laskein 2 Boko 8
Amlarem 3 Palasbari 9
Khliehriat 4 Guwahati 10
North Guwahati 11
118. ASSAM 18 Dispur 12
1. KOKRAJHAR 1 Sonapur 13
Gossaigaon Chandrapur 14
Bhowraguri 2 7. NALBARI 7
Dotoma 3 Baska 1
Kokrajhar 4 Barama 2
Sidli (Part-I) 90 Tihu 3
Pachim Nalbari 4 2. DHUBRI 2
Barkhetri 5 Agamoni 1
Barbhag 6 Golokganj 2
Nalbari 7 Dhubri 3 Ghograpar 8 Bagribari 4 Tamulpur 9 Bilasipara 5 Chapar 6 8. DARRANG 8
South Sal mara 7 Harisinga 1
Mankachar 8 Khoirabari 2 Pathorighat 3
3. GOALPARA 3 Sipajhar 4 Lakhipur Mangaldoi 5 Balijana 2 Kalajgaon 6 Matia 3 Dalgaon 7 Dudhnai 4 Udalguri 8 Rangjuli 5 Majbat 9
4. BONGAIGAON 4 9. MARIGAON 9 Bongaigaon Mayong 1 Boitamari 2 Bhuragaon 2 Srijangram 3 Laharighat 3 Bijni 4 Marigaon 4 Sidli (Part-II) 90 Mikirbheta 5
5. BARPETA 5 10. NAGAON 10 Barnagar 1 Kaliabor 1
Kalgachia 2 Samaguri 2 Baghbor 3 Rupahi 3
Barpeta 4 Dhing 4
Sarthebari 5 Nagaon 5
Bajali 6 Raha 6
99

SI.No. State/OistrictlSub·district Code No. SI.No. StatelOistrict/Sub-district Code No.
(1) (2) (3) (1) (2) (3)
Kampur 7 Teok 4
Hojai 8 Titabor 5
Lanka 9 18. GOLAGHAT 18
11. SONITPUR 11 Bokakhat
Dhekiajuli 1 Khumtai 2
Chariduar 2 Dergaon 3 Tezpur 3 Golaghat 4 Na-Duar 4 Sarupathar 5 Biswanath 5
19. KARBI ANGLONG 19 Helem 6 Gohpur 7
Donka 1
Diphu 2 12. LAKHIMPUR 12 Phuloni 3
Narayanpur 1 Silonijan 4 Bihpuria 2 Naobaicha 3
20. NORTH CACHAR HILLS 20
Kadam 4 Umrangso 1
North Lakhimpur 5 Haflong 2
Dhakuakhana (Part-I) 91 Mahur 3
Subansiri (Part-I) 92 Maibong 4
13. DHEMAJI 13 21. CACHAR 21
Dhemaji 1 Katigora
Sissibargaon 2 Silchar 2
Jonai 3 Udarbond 3
Dhakuakhana (Part-II) 91 Sonai 4
Subansiri (Part-II) 92 Lakhipur 5
14. TINSUKIA 14 22. KARIMGANJ 22
Sadiya 1 Karimganj 1
Doom Dooma 2 Badarpur 2
Tinsukia 3 Nilambazar 3
Margherita 4 Patharkandi 4
15. DIBRUGARH 15 Ramkrishna Nagar 5
Dibrugarh West 1 23. HAILAKANDI 23
Dibrugarh East 2 Aigapur
Chabua 3 Hailakandi 2
Tengakhat 4 Lala 3
Moran 5 Katlichara 4
Tingkhong 6
Naharkathiya 7 119. WEST BENGAL 19 ] 16. SIBSAGAR 16 1. DARJILING 1
Dimow 1 Darjeeling Pulbazar 1
Sibsagar 2 Rangli Rangliot 2
Amguri 3 Kalimpong-I 3
Nazira 4 Kalimpong-II 4
Sonari 5 Gorubathan 5
Mahmora 6 Jorebunglow Sukiapokhri 6
17. JORHAT 17 Mirik 7
Majuli 1 Kurseong 8
Jorhat West 2 Matigara 9
Jorhat East 3 Naxalbari 10
100

SI.No. StatelOistrlctlSub.djstrict Code. 1110. St!"'l0.~ ~tJl;teJPi$trlctlSub-district Code No.
(1) (2) (3) (1) (2) :
(3)
Phansidewa 11 Harishchandrapur-II 2 Kharibari 12 Chanchal-I 3
2. JALPAIGURI 2 Chanchal-II 4
Rajganj Ratua-I 5
Mal 2 Ratua-II 6
Matiali 3 Gazole 7
Nagrakata 4 Bamangola 8
Madarihat 5 Habibpur 9
Kalchini 6 Maldah (old) 10
Kumargram 7 English Bazar 11
Alipurduar-I 8 Manikchak 12
Alipurduar-II 9 Kaliachak-I 13
Falakata 10 Kaliachak-II 14
Dhupguri 11 Kaliachak-III 15
Maynaguri 12 7. MURSHIDABAO 7 Jalpaiguri 13 Farakka
3. KOCH BIHAR 3 Samserganj 2
Haldibari 1 Suti-I 3
Mekliganj 2 Suti-II 4
Mathabhanga-I 3 Raghunathganj-I 5
Mathabhanga-II 4 Raghunathganj-II 6
Cooch Behar-I 5 Lalgola 7
Cooch Behar-II 6 Sagardighi 8
Tufanganj-I 7 Bhagawangola-I 9
Tufanganj-II 8 Bhagawangola-II 10
Dinhata-I 9 Raninagar-II 11
Dinhata-II 10 Jalangi 12
Sitai 11 Domkal 13
Sitalkuchi 12 Raninagar-I 14 Murshidabad Jiaganj 15
4. UTTAR DINAJPUR 4 Nabagram 16 Chopra Khargram 17 Islampur 2 Kandi 18 Goalpokhar-I 3 Berhampore 19 Goalpokhar -II 4 Hariharpara 20 Karandighi 5 Nawda 21 Raiganj 6 Beldanga-I 22 Hemtabad 7 Beldanga-II 23 Kaliaganj 8 Bharatpur-II 24 Itahar 9 Bharatpur-I 25
5. DAKSHIN DINAJPUR 5 Burwan 26 Kushmundi 1 8. BIRBHUM 8 Gangarampur 2 Murarai-I 1 Kumarganj 3 Murarai-II 2 Hilli 4 Nalhati-I 3 Balurghat 5 Nalhati-II 4 Tapan 6 Rampurhat-I 5 Bansihari 7 Rampurhat-II 6 Harirampur 8 Mayureswar-I 7
6. MALDAH 6 Mayureswar-II 8 Harishchandrapur-I Mohammad Bazar 9
101

SI.No. State/DistricUSub-dlstrict Code No. SI.No. StatelOlstrict/$ub·district Code No. ,
(1) (2) (3) (1) , (a) ($)
Rajnagar 10 Chapra 7 Suri-I 11 Krishnagar-II 8 Suri-II 12 Nabadwip 9 Sainthia 13 Krishnagar-I 10 Labpur 14 Krishnaganj 11 Nanoor 15 Hanskhali 12 Bolpur Sriniketan 16 Santipur 13 Illambazar 17 Ranaghat-I 14 Dubrajpur 18 Ranaghat-II 15 Khoyrasol 19 Chakdah 16
9. BARDDHAMAN 9 Haringhata 17
Salanpur 11. NORTH TWENTY FOUR PARGANAS 11 Barabani 2 Bagda 1 Jamuria 3 Bongaon 2 Raniganj 4 Gaighata 3 Ondal 5 Swarupnagar 4 Pandabeswar 6 Habra-I 5 Faridpur Durgapur 7 Habra-II 6 Kanksa 8 Amdanga 7 Ausgram-II 9 Barrackpur-I 8 Ausgram-I 10 Barrackpur-II 9 Mangolkote 11 Barasat-I 10 Ketugram-I 12 Barasat-II 11 Ketugram-II 13 Deganga 12 Katwa-I 14 Baduria 13 Katwa-II 15 Basirhat-I 14 Purbasthali-I 16 Basirhat-II 15 Purbasthali-II 17 Haroa 16 Manteswar 18 Rajarhat 17 Bhatar 19 Minakhan 18 Galsi-I 20 Sandeskhali-I 19 Galsi-II 21 Sandeskhali-II 20 Burdwan-I 22 Hasnabad 21 Burdwan-II 23 Hingalganj 22 Memari-I 24 12. HUGLI 12 Memari-,.II 25 Goghat-I 1 Kalna-I 26 Goghat-II 2 Kalna-II 27 Arambag 3 Jamalpur 28 Pursura 4 Raina-I 29 Tarakeswar 5 Khandaghosh 30 Dhaniakhali 6 Raina-!I 31 Pandua 7 Asansol Urban Agglomeration 32 Balagarh 8
10. NADIA 10 Chinsurah-Magra 9 Karimpur-I 1 Polba-Dadpur 10 Karimpur-II 2 Haripal 11 Tehatta-I 3 Singur 12 TehaUa-1i 4 Serampur UUarpara 13 Kaliganj 5 Chanditala-I 14 Nakashipara 6 Chanditala-II 15
102

SUllO, .; . ~!teID,.trl~ub~~i!~tl"~*'i j ,1' .. I;Pd~ N~. (1)
(!) .. ; . . . '
1(3) ..• is) ..
Jangipara 16 Garbeta-I 4 Khanakul-I 17 Garbeta-1I1 5 Khanakul-II 18 Chandrakona-I 6
13. BANKURA 13 Chandrakona-II 7
Saltora 1 Ghatal 8
Mejhia 2 Daspur-I 9
Gangajalghati 3 Daspur-II 10
Chhatna 4 Keshpur 11
Indpur 5 Salbani 12
Bankura-I 6 Midnapore 13
Bankura-II 7 Jhargram 14
Barjora 8 Jamboni 15
Sonamukhi 9 Gopiballavpur-II 16 Patrasayer 10 Gopiballavpur-I 17 Indus 11 Nayagram 18 Kotulpur 12 Sankrail 19 Jaypur 13 Kharagpur-I 20 Vishnupur 14 Kharagpur-II 21 Onda 15 Debra 22 Taldangra 16 Panskura-I 23 Simlapal 17 Pariskura-II 24 Khatra 18 Tamluk 25 Hirbandh 19 Sahid Matangini 26 Ranibundh 20 Nanda Kumar 27 Raipur 21 Mahisadal 28 Sarenga 22 Moyna 29
14. PURULlYA 14 Pingla 30
Jaipur 1 Sa bang 31
Purulia-II 2 Narayangarh 32
Para 3 Keshiary 33 Raghunathpur-II 4 Dantan-I 34
Raghunathpur-I 5 Dantan-II 35 Neturia 6 Potashpur-I 36 Santuri 7 Potash pur-II 37 Kashipur 8 Bhagawanpur-II 38 Hura 9 Bhagawanpur-I 39 Purulia-I 10 Nandigram-III 40 Puncha 11 Sutahata-I 41 Arsha 12 Sutahata-II 42 Jhalda-I 13 Nandigram-I 43 Jhalda-II 14 Nandigram-II 44 Bagmundi 15 Khejuri-I 45 Balarampur 16 Khejuri-II 46 Barabazar 17 Contai-I 47 Manbazar-I 18 Contai-II 48 Manbazar-II 19 Contai-1I1 49 Bundwan 20 Egra-I 50
15. MEDINIPUR 15 Egra-II 51 Binpur-II Mohanpur 52 Binpur-I 2 Ramnagar-I 53 Garbeta-II 3 Ramnagar-II 54
103
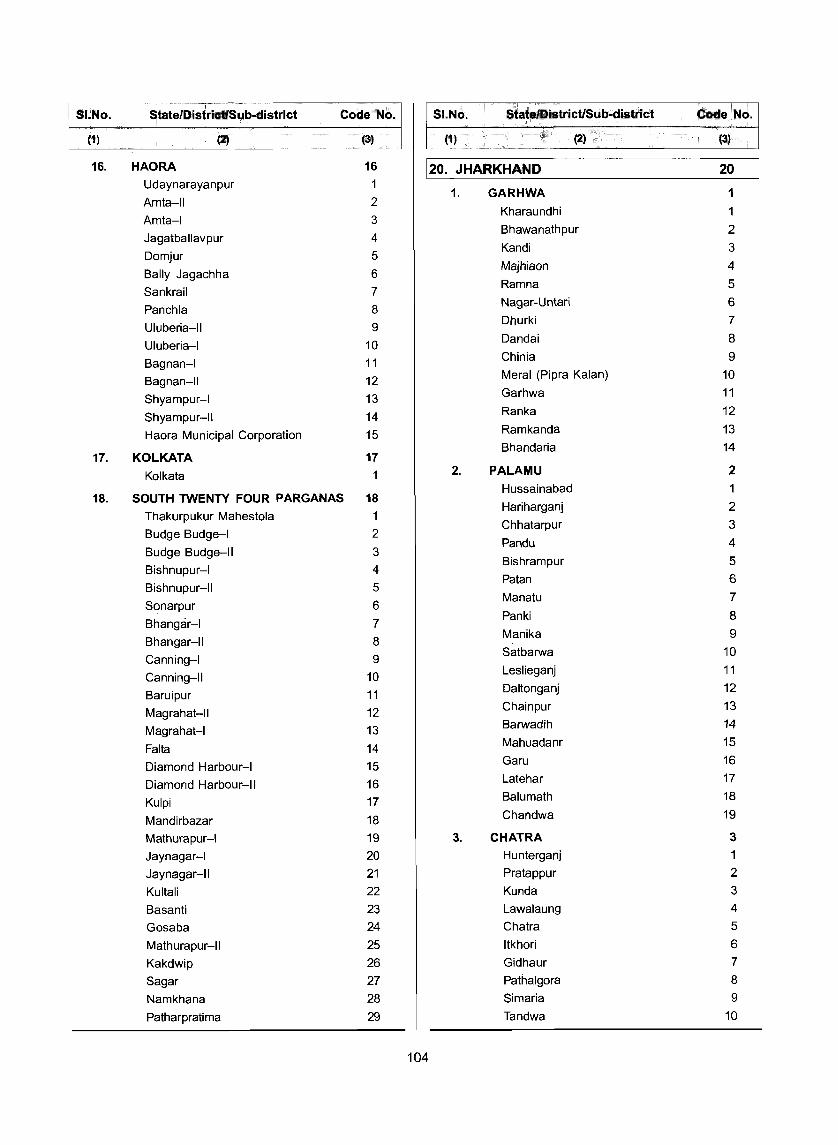
51.No. 5tate/DistrictlSub-dlstrict Code No. SI.No. 5tate/District/Sub-district Code No.
(1) (2) (3) (1) . (2) (3)
16. HAORA 16 120. JHARKHAND 20 Udaynarayanpur 1
1. GARHWA 1 Amta-II 2 Amta-I 3
Kharaundhi 1
Jagatballavpur 4 Bhawanathpur 2
Domjur 5 Kandi 3
Bally Jagachha 6 Majhiaon 4
Sankrail 7 Ramna 5
Panchla 8 Nagar-Untari 6
Uluberia-II 9 Dhurki 7
Uluberia-I 10 Dandai 8
Bagnan-I 11 Chinia 9
Bagnan-II 12 Meral (Pipra Kalan) 10
Shyampur-I 13 Garhwa 11
Shyampur-II 14 Ranka 12
Haora Municipal Corporation 15 Ramkanda 13 Bhandaria 14
17. KOLKATA 17
Kolkata 1 2. PALAMU 2 Hussainabad
18. SOUTH TWENTY FOUR PARGANAS 18 Hariharganj 2
Thakurpukur Mahestola 1 Budge Budge-I 2
Chhatarpur 3
Budge Budge-II 3 Pandu 4
Bishnupur-I 4 Bishrampur 5
Bishnupur-II 5 Patan 6
Sonarpur 6 Manatu 7
Bhangar-I 7 Panki 8
Bhangar-II 8 Manika 9
Canning-I 9 Satbarwa 10
Canning-II 10 Leslieganj 11
Baruipur 11 Daltonganj 12
Magrahat-II 12 Chain pur 13
Magrahat-I 13 Barwadih 14
Falta 14 Mahuadanr 15
Diamond Harbour-I 15 Garu 16
Diamond Harbour-II 16 Latehar 17
Kulpi 17 Balumath 18
Mandirbazar 18 Chandwa 19
Mathurapur-I 19 3. CHATRA 3
Jaynagar-I 20 Hunterganj 1
Jaynagar-II 21 Pratappur 2
Kultali 22 Kunda 3
Basanti 23 Lawalaung 4
Gosaba 24 Chatra 5
Mathurapur-II 25 Itkhori 6
Kakdwip 26 Gidhaur 7
Sagar 27 Pathalgora 8
Namkhana 28 Simaria 9
Patharpratima 29 Tandwa 10
104

SI.No. StatelD istrictlSub·district Code No. SI.No. State/DistrlctlSub-dlstrict Code No.
(1) (2) (3) (1) .,
(2) (3)
4. HAZARIBAG 4 Godda 6
Chauparan 1 Poreyahat 7
Barhi 2 Sundar Pahari 8
Padma 3 9. SAHIBGANJ 9 Ichak 4 Sahibganj Barkatha 5 Mandro 2 Bishungarh 6 Borio 3 Hazaribag 7 Barhait 4 Katkamsandi 8 Taljhari 5 Keredari 9 Rajmahal 6 Barkagaon 10 Udhwa 7 Patratu 11 Pathna 8 Churchu 12 Barharwa 9 Mandu 13
10. PAKAUR 10 Ramgarh 14
Litipara 1 Gola 15
Amrapara 2 5. KODARMA 5 Hiranpur 3
Satgawan 1 Pakaur 4 Kodarma 2 Maheshpur 5 Jainagar 3 Pakuria 6 Markacho 4 11. DUMKA 11
6. GIRIDIH 6 Saraiyahat Gawan 1 Jarmundi 2
Tisri 2 Ramgarh 3 Deori 3 Gopikandar 4
Dhanwar 4 Kathikund 5
Jamua 5 Shikaripara 6 Bengabad 6 Ranishwar 7
Gande 7 Dumka 8 Giridih 8 Jama 9
Birni 9 Masalia 10
Bagodar 10 Narayanpur 11
Dumri 11 Jamtara 12
Pirtanr 12 Nala 13
7. DEOGHAR 7 Kundahit 14
Deoghar 1 12. DHANBAD 12
Mohanpur 2 Tundi 1
Sarwan 3 Topchanchi 2
Devipur 4 Baghmara-cum-Katras 3
Madhupur 5 Gobindpur 4
Karon 6 Dhanbad-cum-Kenduadih-cum-Jagta 5
Sarath 7 Jharia-cum-Jorapokhar-cum-Sindri 6
Palojori 8 Baliapur 7
8. GODDA 8 Nirsa-Cum-Chirkunda 8
Meherma 1 13. BOKARO 13
Thakur Gangti 2 Nawadih
Boarijor 3 Bermo 2
Mahagama 4 Gumia 3
Pathargama 5 Pete rwa r 4
105
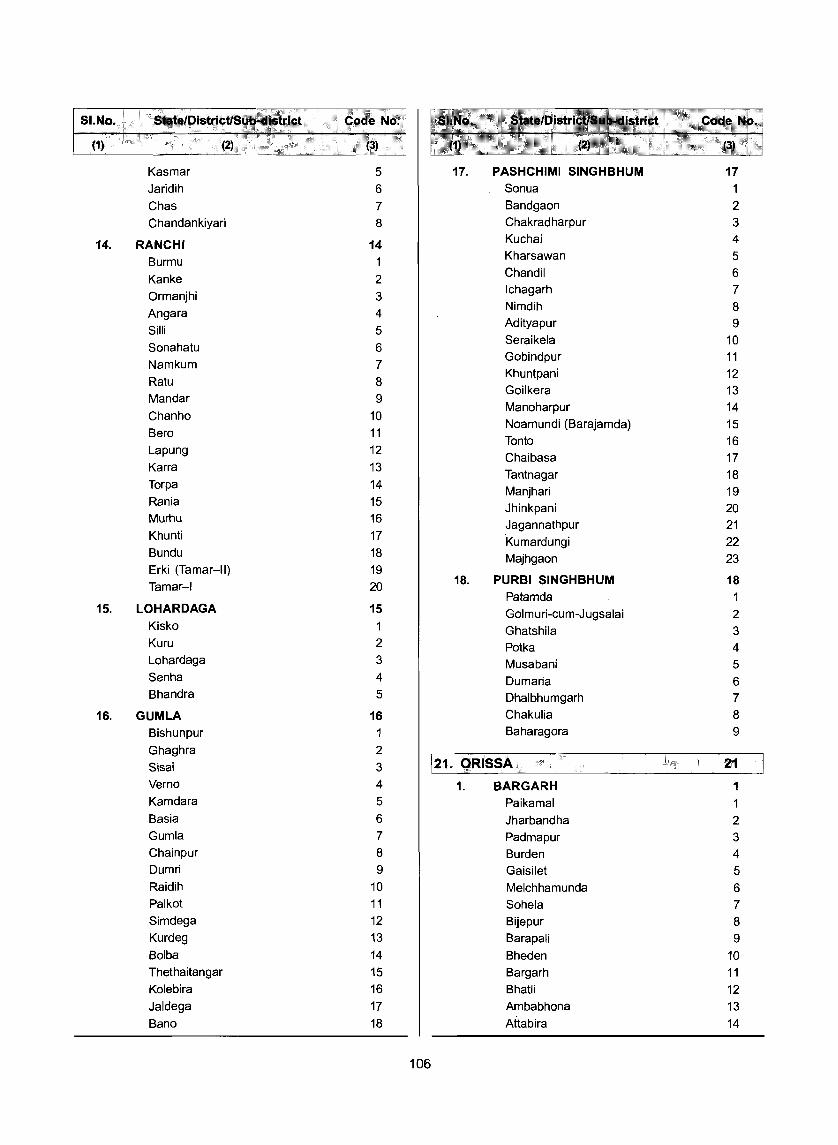
SI.No. State/DIstrlcWul:)..diistr:ICl . '''<Ii ·~d~Nd; 1'»11' "
(2) .,;V· , •• "'''i.''i 1\11 (1) ; .. , , ~t; ." ...
Kasmar 5 17. PASHCHIMI SINGHBHUM 17 Jaridih 6 Sonua 1 Chas 7 Bandgaon 2 Chandankiyari 8 Chakrad harpur 3
14. RANCHI 14 Kuchai 4
Burmu 1 Kharsawan 5
Kanke 2 Chandil 6
Ormanjhi 3 Ichagarh 7
Angara 4 Nimdih 8
Silli 5 Adityapur 9
Sonahatu 6 Seraikela 10
Namkum 7 Gobindpur 11 Khuntpani 12
Ratu 8 Goilkera 13
Mandar 9 Manoharpur 14
Chanho 10 Noamundi (Barajamda) 15
Bero 11 Tonto 16
Lapung 12 Chaibasa 17
Karra 13 Tantnagar 18
Torpa 14 Manjhari 19 Rania 15 Jhinkpani 20 Murhu 16 Jagannathpur 21 Khunti 17 Kumardungi 22 Bundu 18 Majhgaon 23 Erki (Tamar-II) 19 Tamar-I 20 18. PURBI SINGHBHUM 18
Patamda 1 15. LOHARDAGA 15 Gol m u ri-cu m-J ugsalai 2
Kisko Ghatshila 3 Kuru 2 Potka 4 Lohardaga 3 Musabani 5 Senha 4 Dumaria 6 Bhandra 5 Dhalbhumgarh 7
16. GUMLA 16 Chakulia 8 Bishunpur Baharagora 9 Ghaghra 2
121. QRISSA Sisai 3 21 Verno 4 1. BARGARH 1 Kamdara 5 Paikamal 1 Basia 6 Jharbandha 2 Gumla 7 Padmapur 3 Chainpur 8 Burden 4 Dumri 9 Gaisilet 5 Raidih 10 Melchhamunda 6 Palkot 11 Sohela 7 Simdega 12 Bijepur 8 Kurdeg 13 Barapali 9 Bolba 14 Bheden 10 Thethaitangar 15 Bargarh 11 Kolebira 16 BhaW 12 Jaldega 17 Ambabhona 13 Bano 18 Attabira 14
106

SI-No. StateiDistri~Sub.district Code No. SI.No. State/DistrictlSub-district Code No.
(1) (2) ,3) (1) (2) (3) .
2. JHARSUGUDA 2 Brahmani Tarang 16 Rengali Raghunathapali 17 Lakhanpur 2 Tangarapali 18 Belpahar 3 Lathikata 19 Banaharapali 4 Banki 20 Orient 5 Kamarposh Balang 21 Brajarajnagar 6 Koida 22 Jharsuguda 7 Lahunipara 23 Laikera 8 Gurundia 24 Kolabira 9 Tikaetpali 25
3. SAMBALPUR 3 Banei 26
Govindpur 1 Mahulpada 27
Mahulpalli 2 Raurkela 28
Kochinda 3 Raurkela Industrial Township 29
Jamankira 4 6. KENDUJHAR 6 Kisinda 5 Telkoi 1 Naktideul 6 Kanjipani 2 Rairakhol 7 Nayakote 3 Charamal 8 Barbil 4 Jujomura 9 Joda 5 Dhama 10 Champua 6 Burla 11 Baria 7 Hirakud 12 Turumunga 8 Ainthapali 13 Patana 9 Dhanupali 14 Ghatgaon 10 Sadar 15 Kendujhar Sadar 11 Sasan 16 Kendujhar Town 12 Katarbaga 17 Pandapara 13 Sambalpur 18 Harichandanpur 14
4. DEBAGARH 4 Daitari 15 Debagarh 1 Ghasipura 16 Barkot 2 Sainkul 17 Kundheigola 3 Nandipada 18 Reamal 4 Anandapur 19
5. SUNDARGARH 5 Soso 20
Hemgir 1 7. MAYURBHANJ 7
Lephripara 2 Tiringi
Bhasma 3 Bahalda 2 Sundargarh Town 4 Gorumahisani 3 Sundargarh 5 Rairangpur 4 Kinjirkela 6 Rairangpur Town 5 Talasara 7 Badampahar 6 Baragaon 8 Bisoi 7 Kutra 9 Bangiriposi 8 Rajagangapur 10 Jharpokharia 9
Raiboga 11 Chandua 10 Biramitrapur 12 Koliana 11 Hatibari 13 Baripada Sadar 12 Bisra 14 Baripada Town 13 Bondamunda 15 Suliapada 14
107

SI.No. State/DistrictiSub-district Code No. SI.No. StatelDistrictiSub-district Code No.
(1) (2) (3) (1) (2) (3)
Muruda 15 Kendrapara 4 Betanati 16 Patkura 5 Rasagobindapur 17 Mahakalapada 6 Baisinga 18 Rajnagar 7 Barsahi 19 11. JAGATSINGHAPUR 11 Khunta 20 Paradip Udala 21 Kujang 2 Kaptipada 22 Ersama 3 Sharata 23 Tirtol 4 Mahuldiha 24 Balikuda 5 Thakurmunda 25 Naugaon 6 Karanjia 26 Jagatsinghapur 7 Jashipur 27
12. CUTTACK 12 Raruan 28
Mahanga 1 Baripada 29
Salepur 2 8. BALESHWAR 8 Jagatpur 3
Raibania 1 Kishannagar 4 Jaleswar 2 Niali 5 Bhograi 3 Gobindpur 6 Baliapal 4 Cuttack Sadar 7 Singla 5 Tangi 8 Basta 6 Choudwar 9 Rupsa 7 Gurudijhatia 10 Baleshwar Sadar 8 Barang 11 Chandipur 9 Athagad 12 Remuna 10 Tigiria 13 Bampada 11 Banki 14 Nilagiri 12 Baidyeswar 15 Berhampur 13 Badamba 16 Oupada 14 Kanpur 17 Sora 15 Narasinghpur 18 Khaira 16 Cuttack 19 Similia 17 13. JAJAPUR 13 Baleshwar 18 Sukinda 1
9. BHADRAK 9 Duburi 2 Agarpada Jajapur Road 3 Bant 2 Korai 4 Bhadrak Rural 3 Jajapur 5 Bhandari Pokhari 4 Mangalpur 6 Dhamanagar 5 Binjharpur 7 Dhusuri 6 Balichandrapur 8 Tihidi 7 Badachana 9 Chandabali 8 Dharmasala 10 Bansada 9 14. DHENKANAL 14 Naikanidihi 10 Bhuban Basudebpur 11 Kamakshyanagar 2
10. KENDRAPARA 10 Parajang 3 Rajkanika Tumusingha 4 Aali 2 Motunga 5 Pattamundai 3 Balimi 6
108

SI.No. State/D\strictlSub~istrict Code·No. SI.No. State/DistrictlSub~istrict • Code No.
(1) (2) (3) (1) (2) (3,
Hindol 7 Banapur 14 Rasol 8 Bhubaneswar 15 Dhenkanal Sadar 9 18. PURl 18 Gandia 10 Delanga 1
15. ANUGUL 15 Pipili 2 Palalahada 1 Nimapada 3 Khamar 2 Gop 4 Rengali Damsite 3 Kakatpur 5 Kaniha 4 Konark 6 NTPC 5 Satyabadi 7 Samal Barrage 6 Chandan pur 8 Talcher Sadar 7 Sadar 9 Colliery 8 Brahmagiri 10 Bikrampur 9 Krushna Prasad 11 NALCO 10 Puri 12 Banarpal 11 19. GANJAM 19 Anugul 12 Tarasingi 1 Bantala 13 Buguda 2 Purunakot 14 Bhanjanagar 3 Jarapada 15 Gangapur 4 Chhendipada 16 Surada 5 Handapa 17 Badagada 6 Kishorenagar 18 Asika 7 Thakurgarh 19 Purusottampur 8 Athmallik 20 Kabisuryanagar 9
16. NAYAGARH 16 Kodala 10 Dasapalla 1 Khalikote 11 Gania 2 Rambha 12 Khandapada 3 Chhatrapur 13 Fategarh 4 Gopalpur 14 Nayagarh 5 Brahmapur Sadar 15 Nuagaon 6 Golanthara 16 Odagaon 7 Nuagaon 17 Sarankul 8 Digapahandi 18 Ranapur 9 Jarada 19
17. KHORDHA 17 Patapur 20
Bolagad Hinjili 21
Begunia 2 Brahmapur 22
Khordha 3 Ramagiri (P) 90
Chandaka 4 20. GAJAPATI 20
Khandagiri 5 Adva
Saheednagar 6 Mohana 2 Balianta 7 R. Udaygiri 3 Balipatana 8 Garabandha 4 Lingaraj 9 Parlakhemundi 5 Jatani 10 Kashinagara 6 Jankia 11 Serango 7 Tangi 12 Rayagada 8 Balugaon 13 Ramagiri (P) 90
109
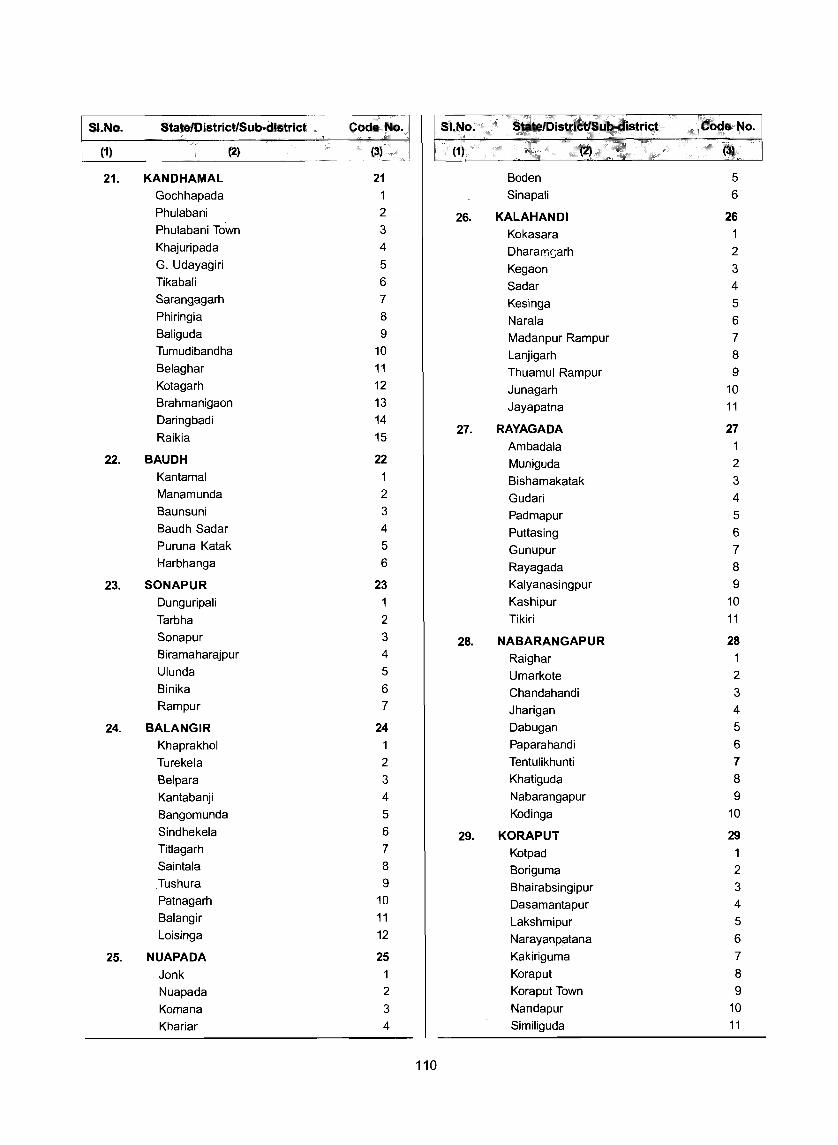
SI.No. State/DistrictfSub·distrlct Code No. SI.No. StatelDistr!ctlS;ub.dlstrlct Code No.
(1) (2) (3) (1) . .. (2) . (3)
21. KANDHAMAL 21 Boden 5
Gochhapada 1 Sinapali 6
Phulabani 2 26. KALAHANDI 26 Phulabani Town 3 Kokasara Khajuripada 4 Dharamsarh 2 G. Udayagiri 5 Kegaon 3 Tikabafi 6 Sadar 4 Sarangagarh 7 Kesinga 5 Phiringia 8 Narafa 6 Baliguda 9 Madanpur Rampur 7 Tumudibandha 10 Lanjigarh 8 Belaghar 11 Thuamuf Rampur 9 Kotagarh 12 Junagarh 10 Brahmanigaon 13 Jayapatna 11 Daringbadi 14
27 27. RAYAGADA Raikia 15
Ambadala 1 22. BAUDH 22 Muniguda 2
Kantamal Bishamakatak 3 Manamunda 2 Gudari 4 Baunsuni 3 Padmapur 5 Baudh Sadar 4 Puttasing 6 Puruna Katak 5 Gunupur 7 Harbhanga 6 Rayagada 8
23. SONAPUR 23 Kalyanasingpur 9
Dunguripali 1 Kashipur 10
Tarbha 2 Tikiri 11
Sonapur 3 28. NABARANGAPUR 28 Biramaharajpur 4 Raighar 1 Ulunda 5 Umarkote 2 Binika 6 Chandahandi 3 Rampur 7 Jharigan 4
24. BALANGIR 24 Dabugan 5
Khaprakhol Paparahandi 6
Turekela 2 Tentulikhunti 7
Belpara 3 Khatiguda 8
Kantabanji 4 Nabarangapur 9
Bangomunda 5 Kodinga 10
Sindhekela 6 29. KORAPUT 29 Titlagarh 7 Kotpad Saintala 8 Boriguma 2 Tushura 9 Bhairabsingipur 3 Patnagarh 10 Dasamantapur 4 Balangir 11 Lakshmipur 5 Loisinga 12 Narayanpatana 6
25. NUAPADA 25 Kakiriguma 7
Jonk 1 Koraput 8
Nuapada 2 Koraput Town 9
Komana 3 Nandapur 10
Khariar 4 Simifiguda 11
110
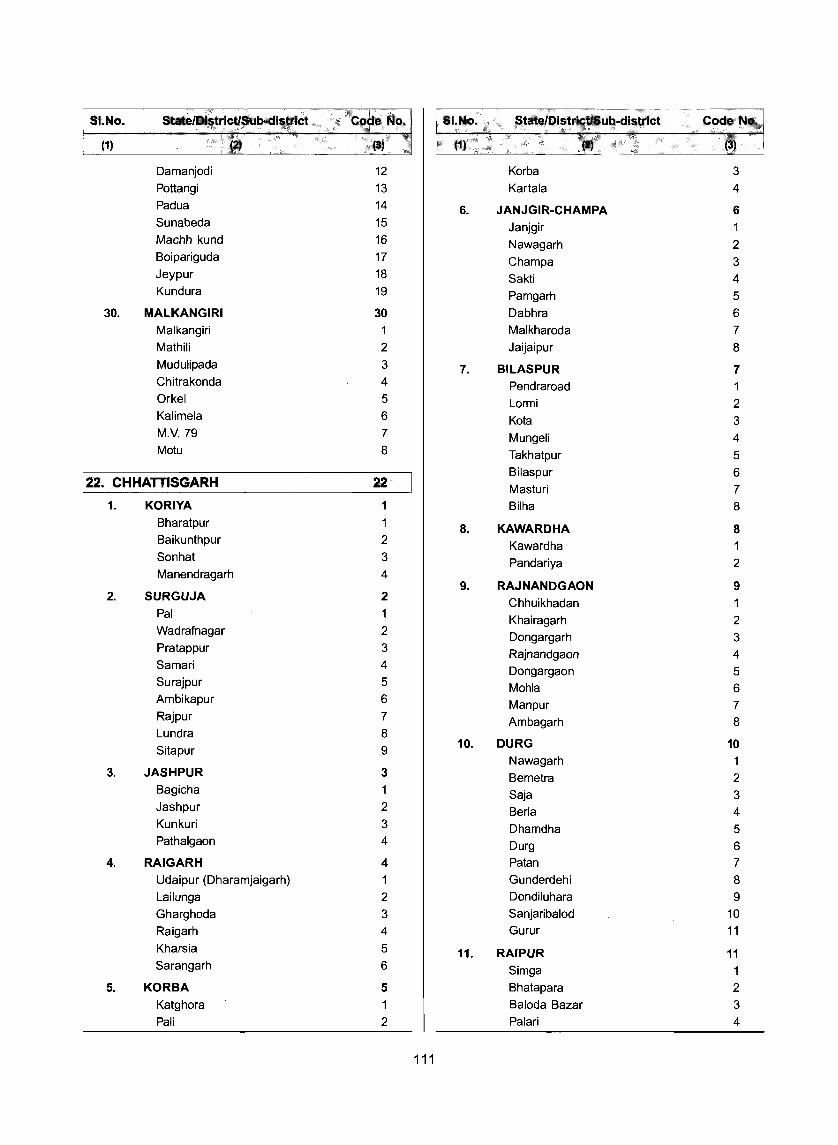
SI.No. statelDastrlctlsubillstrict. . Code No. SI.No. State/Distl'ict/Sub-district Code No.
(1) , (2) , (3) (1) (I). .: (3)
Damanjodi 12 Korba 3 Pottangi 13 Kartala 4
Padua 14 6. JANJGIR-CHAMPA 6 Sunabeda 15 Janjgir Machh kund 16 Nawagarh 2 Boipariguda 17 Champa 3 Jeypur 18 Sakti 4 Kundura 19 Pamgarh 5
30. MALKANGIRI 30 Dabhra 6
Malkangiri Malkharoda 7
Mathili 2 Jaijaipur 8
Mudulipada 3 7. BILASPUR 7 Chitrakonda 4 Pendraroad Orkel 5 Lormi 2 Kalimela 6 Kota 3 M.V. 79 7 Mungeli 4 Motu 8 Takhatpur 5
122.
Bilaspur 6 CHHATTISGARH 22 Masturi 7
1. KORIYA 1 Bilha 8 Bharatpur 1 8. KAWARDHA 8 Baikunthpur 2 Kawardha 1 Sonhat 3 Pandariya 2 Manendragarh 4
9. RAJNANDGAON 9 2. SURGUJA 2
Chhuikhadan Pal 1 Khairagarh 2 Wadrafnagar 2 Dongargarh 3 Pratappur 3 Rajnandgaon 4 Samari 4 Dongargaon 5 Surajpur 5 Mohla 6 Ambikapur 6 Manpur 7 Rajpur 7 Ambagarh 8 Lundra 8
Sitapur 9 10. DURG 10
Nawagarh 1 3. JASHPUR 3 Bemetra 2
Bagicha Saja 3 Jashpur 2 Berla 4 Kunkuri 3 Dhamdha 5 Pathalgaon 4 Durg 6
4. RAIGARH 4 Patan 7
Udaipur (Dharamjaigarh) 1 Gunderdehi 8
Lailunga 2 Dondiluhara 9
Gharghoda 3 Sanjaribalod 10
Raigarh 4 Gurur 11
Kharsia 5 11. RAIPUR 11 Sarangarh 6 Simga
5. KORBA 5 Bhatapara 2
Katghora 1 Baloda Bazar 3
Pali 2 Palari 4
111

SI.No. State/District/Sub-dlstrict Code No. SI.No. State/District/Sub·district Code No.
(i) (2) (3) (1) (2). (3)
Kasdol 5 3. BHIND 3 Bilaigarh 6 Ater 1
Arang 7 Bhind 2
Abhanpur 8 Mehgaon 3
Raipur 9 Gohad 4
Rajim 10 Ron 5
Tilda 11 Mihona 6
Bindranawagarh 12 Lahar 7
Deobhog 13 4. GWALIOR 4
12. MAHASAMUND 12 Gird 1
Basna Pichhore 2
Saraipali 2 Bhitarwar 3
Mahasamund 3 5. DATIA 5
13. DHAMTARI 13 Seondha 1
Kurud Datia 2
Dhamtari 2 Bhander 3
Nagri 3 6. SHIVPURI 6 14. KANKER 14 Pohari 1
Charama Shivpuri 2
Bhanupratappur 2 Narwar 3 Kanker 3 Karera 4 Narharpur 4 Kolaras 5 Antagarh 5 Pichhore 6 Pakhanjur 6 Khaniyadhana 7
15. BASTAR 15 7. GUNA 7 Keshkal Isagarh Narayanpur 2 Chanderi 2 Kondagaon 3 Guna 3 Jagdalpur 4 Ashoknagar 4
16. DANTEWADA 16 Raghogarh 5
Bhopalpattanam (Pal) Mungaoli 6
Bijapur 2 Kumbhraj 7
Dantewada 3 Aron 8
Konta 4 Chachaura 9
8. TIKAMGARH 8 123. MADHYA PRADESH 23 Niwari
1. SHEOPUR 1 Prithvipur 2
Vijaypur Jatara 3
Sheopur 2 Palera 4
Karahal 3 Baldeogarh 5
2. MORENA 2 Tikamgarh 6
Ambah 1 9. CHHATARPUR 9 Porsa 2 Gaurihar
Morena 3 Laundi 2
Joura 4 Nowgong 3
Kailaras 5 Chhatarpur 4 Sabalgarh 6 Rajnagar 5
112

SI.No. State/DistrictlSub·district Code No. SI.No. State/DlstrlctlSub.district Code No.
(1) (2) (3) (1) (2) (3)
Bada - Malhera 6 Jaitpur 4
Bijawar 7 Kotma 5
10. PANNA 10 Anuppur 6
Ajaygarh Jaithari 7
Panna 2 Pushparajgarh 8
Gunnor 3 17. SIDHI 17 Pawai 4 Rampur Naikin Shahnagar 5 Churhat 2
11. SAGAR 11 Gopadbanas 3
Bina Sihawal 4
Khurai 2 Chitrangi 5
Banda 3 Deosar 6
Rahatgarh 4 Majholi 7
Sagar 5 Kusmi 8
Garhakota 6 Singrauli 9
Rehli 7 18. NEEMUCH 18 Kesli 8 Jawad 1 Deori 9 Neemuch 2
12. DAMOH 12 Manasa 3 Hatta 1
19. MANDSAUR 19 Patera 2
Batiyagarh 3 Bhanpura 1
Patharia 4 Malhargarh 2
Damoh 5 Garoth 3
Jabera 6 Mandsaur 4
Tendukheda 7 Sitamau 5
13. SATNA 13 20. RAT LAM 20
Raghurajnagar Piploda 1
Nagod 2 Jaora 2
Unchahara 3 Alot 3
Rampur - Baghelan 4 Sailana 4
Amarpatan 5 Bajna 5
Ramnagar 6 Ratlam 6
Maihar 7 21. UJJAIN 21
14. REWA 14 Khacharod 1
Teonthar Nagda 2
Sirmaur 2 Mahidpur 3
Hanumana 3 Ghatiya 4
Mauganj 4 Tarana 5
Huzur 5 Ujjain 6
Raipur - Karchuliyan 6 Badnagar 7 Gurh 7 22. SHAJAPUR 22
15. UMARIA 15 Susner 1 Bandhogarh 1 Nalkheda 2
16. SHAH DOL 16 Badod 3
Beohari 1 Agar 4
Jaisinghnagar 2 Shajapur 5
Sohagpur 3 Moman Badodiya 6
113

SI.No. StateiOistrictlSul:)..distrlct Code No. St.No; 'I. StatelOistrlctlSul:)..dlstrlct Code No.
(1) (2) . (3) (1) {2) . (3)
Shujalpur 7 29. EAST NIMAR 29
Kalapipal 8 Harsud
23. DEWAS 23 Khandwa 2
Tonk Khurd 1 Pandhana 3
Sonkatch 2 Burhanpur 4
Dewas 3 Nepanagar 5
Kannod 4 30. RAJGARH 30
Bagli 5 Jirapur
Khategaon 6 Khilchipur 2
Rajgarh 3 24. JHABUA 24
Biaora 4 Thandla Sarangpur 5 Petlawad 2 Narsinghgarh 6 Meghnagar 3 Jhabua 4
31. VIDISHA 31
Bhavra 5 Lateri 1
Jobat Sironj 2
6 Kurwai 3
Alirajpur 7 Basoda 4
Ranapur 8 Nateran 5
25. DHAR 25 Gyaraspur 6 Badnawar 1 Vidisha 7 Sardarpur 2 32. BHOPAL 32 Dhar 3 Berasia 1 Gandhwani 4 Huzur 2 Kukshi 5
Manawar 6 33. SEHORE 33
Sehore 1 Dharampuri 7
2 Ashta 26. INDORE 26 Ichhawar 3
Depalpur 1 Nasrullaganj 4 Sawer 2 Budni 5 Indore 3
34. RAISEN 34 Mhow 4 Raisen
27. WEST NIMAR 27 Gairatganj 2 Barwaha 1 Begamganj 3 Maheshwar 2 Goharganj 4
Kasrawad 3 Bareli 5
Segaon 4 Silwani 6
Bhikangaon 5 Udaipura 7
Khargone 6 35. BETUL 35 Bhagwanpura 7 Bhainsdehi 1 Jhiranya 8 Betul 2
28. BARWANI 28 Shahpur 3
Barwani Multai 4
Thikri 2 Amla 5
Rajpur 3 36. HARDA 36 Pansemal 4 Khirkiya Niwali 5 Harda 2 Sendhwa 6 Timarni 3
114

SI.No. '''''1.10:·'' ,I $tate/DistrictlSub~district Code No.
(1) (1)i:: .:', ,
~J (3)
37. HOSHANGABAD 37 Barghat 5
Seoni - Malwa 1 Kurai 6
Itarsi 2 45. BALAGHAT 45 Hoshangabad 3 Katangi 1 Babai 4 Waraseoni 2 Sohagpur 5 Balaghat 3 Pipariya 6 Kirnapur 4 Bankhedi 7 Baihar 5
38. KATNI 38 Lanji 6
Murwara
Vijayraghavgarh 2 124. GUJARAT 24
Bahoriband 3 1. KACHCHH 1 Dhimar Kheda 4 Lakhpat 1
39. JABALPUR 39 Rapar 2
Sihora Bhachau 3
Patan 2 Anjar 4
Jabalpur 3 Bhuj 5
Kundam 4 Nakhatrana 6
Abdasa 7 40. NARSIMHAPUR 40
Mandvi 8 Gotegaon 1
Mundra 9 Gadarwara 2
Gandhidham 10 Narsimhapur 3 Kareli 4 2. BANAS KANTHA 2
Tendukheda 5 Vav 1
Tharad 2 41. DINDORI 41
Dhanera 3 Shahpura 1
Dantiwada 4 Dindori 2
Amirgadh 5 42. MANDLA 42 Danta 6
Niwas Vadgam 7 Mandla 2 Palanpur 8 Bichhiya 3 Deesa 9 Nainpur 4 Deodar 10
43. CHHINDWARA 43 Bhabhar 11
Tamia Kankrej 12
Amarwara 2 3. PATAN 3 Chaurai 3 Santalpur Jamai 4 Radhanpur 2 Parasia 5 Vagdod 3 Chhindwara 6 Sidhpur 4 Sausar 7 Patan 5 Bichhua 8 Harij 6 Pandhurna 9 Sami 7
44. SEONI 44 Chanasma 8
Lakhnadon 4. MAHESANA 4 Ghansaur 2 Satlasana 1 Keolari 3 Kheralu 2 Seoni 4 Unjha 3
115

SI.No. State/Di$triCitiSub-district Code No. SI.N.o. Statelt)i~trictlSu.b-dist,j~t CodeNo. . ..
(1) (:2) (3) (1) <I .. .. ::(1).: (3) .
Visnagar 4 9. RAJKOT 9 Vadnagar 5 Maliya 1
Vijapur 6 Morvi 2
Mahesana 7 Tankara 3 Becharaji 8 Wankaner 4 Kadi 9 Paddhari 5
5. SA BAR KANTHA 5 Rajkot 6
Khedbrahma 1 Lodhika 7
Vijaynagar 2 Kotda Sangani 8
Vadali 3 Jasdan 9
Idar 4 Gondal 10
Bhiloda 5 Jamkandorna 11
Meghraj 6 Upleta 12
Himatnagar 7 Dhoraji 13
Prantij 8 Jetpur 14
Talod 9 10. JAMNAGAR 10
Modasa 10 Okhamandal
Dhansura 11 Khambhalia 2 Malpur 12 Jamnagar 3 Bayad 13 Jodiya 4
6. GANDHINAGAR 6 Dhrol 5
Kalol 1 Kalavad 6
Mansa 2 Lalpur 7
Gandhinagar 3 Kalyanpur 8
Dehgam 4 Bhanvad 9
7. AHMADABAD 7 Jamjodhpur 10
Mandai 1 11. PORBANDAR 11
Detroj - Rampura 2 Porbandar 1
Viramgam 3 Ranavav 2
Sanand 4 Kutiyana 3
Ahmadabad City 5 12. JUNAGADH 12
Daskroi 6 Manavadar 1
Dholka 7 Vanthali 2
Bavla 8 Junagadh 3 Ranpur 9 Bhesan 4
Barwala 10 Visavadar 5
Dhandhuka 11 Mendarda 6
8. SURENDRANAGAR 8 Keshod 7
Halvad 1 Mangrol 8
Dhrangadhra 2 Malia 9
Dasada 3 Talala 10
Lakhtar 4 Patan - Veraval 11
Wadhwan 5 Sutrapada 12
Muli 6 odinar 13
Chotila 7 Una 14
Sayla 8 13. AMRELI 13
Chuda 9 Kunkavav Vadia 1
Limbdi 10 Babra 2
116

SI.No. State/Di.triet1Sub.:-dlstrlct Code No. SLNo •. S"telDl~_riet1S':'b4ist~lq Code NO.
(1) (a) (3) (~) (2) , l ..
. .... ' (3~
Lathi 3 Godhra 7 Lilia 4 Kalol 8 Amreli 5 Ghoghamba 9 8agasara 6 Halol 10 Ohari 7 Jambughoda 11 Sayar Kundla 8 18. DOHAD 18 Khambha 9 Fatepura 1 Jafrabad 10 Jhalod 2 Rajula 11 Limkheda 3
14. BHAVNAGAR 14 Oohad 4
Botad 1 Garbada 5
Vallabhipur 2 Oevgad-8aria 6
Gadhada 3 Dhanpur 7
Umrala 4 19. VADODARA 19 8havnagar 5 Savli 1 Ghogha 6 Vadodara 2 Sihor 7 Vaghodia 3 Gariadhar 8 Jetpur Pavi 4 Palitana 9 Chhota Udaipur 5 Talaja 10 Kavant 6 Mahuva 11 Nasvadi 7
15. ANAND 15 Sankheda 8
Tarapur 1 Dabhoi 9
Sojitra 2 Padra 10
Umreth 3 Karjan 11
Anand 4 Sinor 12
Petlad 5 20. NARMADA 20 Khambhat 6 Tilakwada Borsad 7 Nandod 2 Anklav 8 Oediapada 3
16. KHEDA 16 Sagbara 4
Kapadvanj 1 21. BHARUCH 21 Virpur 2 Jambusar 1 Balasinor 3 Amod 2 Kathlal 4 Vagra 3 Mehmedabad 5 Bharuch 4 Kheda 6 Jhagadia 5 Matar 7 Anklesvar 6 Nadiad 8 Hansot 7 Mahudha 9 Valia 8 Thasra 10 22. SURAT 22
17. PANCH MAHALS 17 Olpad Khanpur 1 Mangrol 2 Kadana 2 Umarpada 3 Santrampur 3 Nizar 4 Lunawada 4 Uchchhal 5 Shehera 5 Songadh 6 Morwa (Hadaf) 6 Mandvi 7
117
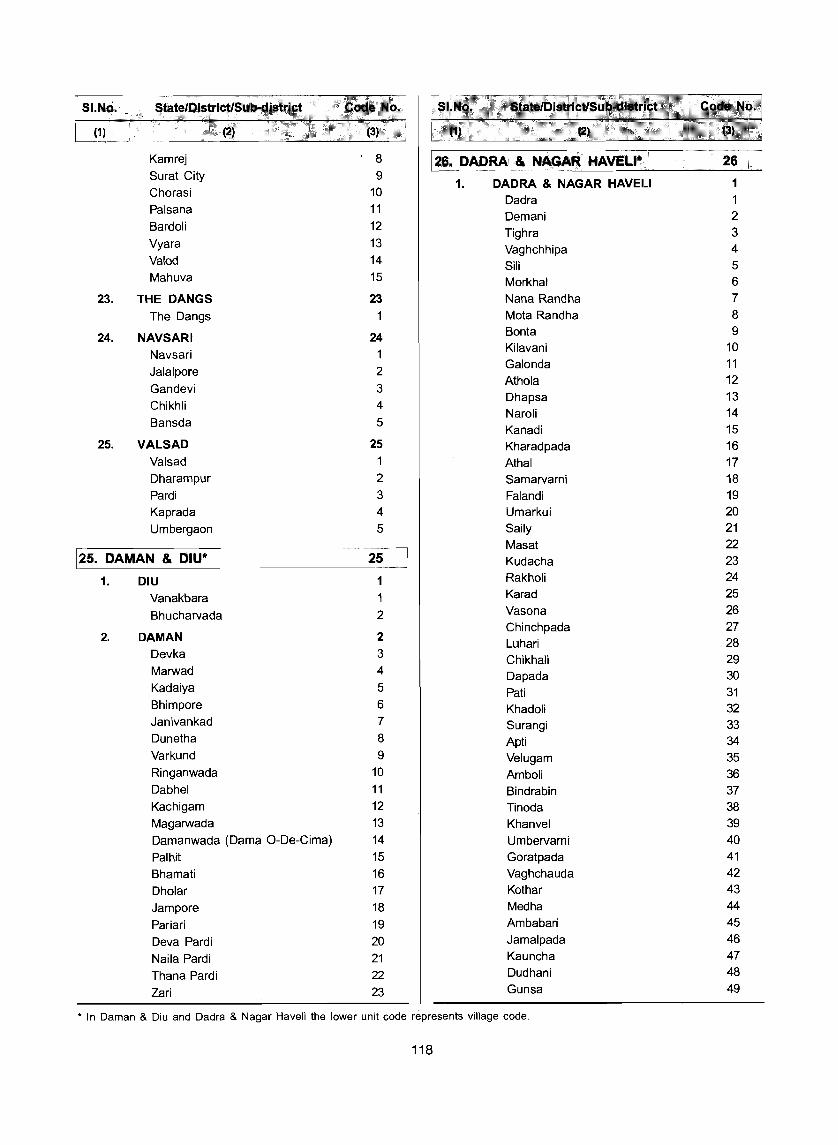
SI.No. State/l)is'rictlSub·d~st",ct .; Cod. No •
(1) .
(I) , (3r ....• 1(1) , .
Kamrej . 8 126. DADRA· & NAGAR HAVELI* 26 Surat City 9
1. DADRA & NAGAR HAVELI 1 Chorasi 10
Dadra Palsana 11
Demani 2 Bardoli 12
Tighra 3 Vyara 13 Vaghchhipa 4 Valod 14 Sili 5 Mahuva 15 Morkhal 6
23. THE DANGS 23 Nana Randha 7 The Dangs Mota Randha 8
24. NAVSARI 24 Bonta 9
Navsari 1 Kilavani 10
Jalalpore 2 Galonda 11
Gandevi 3 Athola 12
Chikhli 4 Dhapsa 13 Naroli 14
Bansda 5 Kanadi 15
25. VALSAD 25 Kharadpada 16 Valsad 1 Athal 17 Dharampur 2 Samarvarni 18 Pardi 3 Falandi 19 Kaprada 4 Umarkui 20 Umbergaon 5 Saily 21
Masat 22 125. DAMAN & DIU· 25 Kudacha 23
1. DIU 1 Rakholi 24
Vanakbara 1 Karad 25
Bhucharvada 2 Vasona 26 Chinchpada 27
2. DAMAN 2 Luhari 28
Devka 3 Chikhali 29 Marwad 4 Dapada 30 Kadaiya 5 Pati 31 Bhimpore 6 Khadoli 32 Janivankad 7 Surangi 33 Dunetha 8 Apti 34 Varkund 9 Velugam 35 Ringanwada 10 Amboli 36 Dabhel 11 Bindrabin 37 Kachigam 12 Tinoda 38 Magarwada 13 Khanvel 39 Damanwada (Dama O-De-Cima) 14 Umbervarni 40 Pa I hit 15 Goratpada 41 Bhamati 16 Vaghchauda 42 Dholar 17 Kothar 43 Jampore 18 Medha 44
Pariari 19 Ambabari 45
Deva Pardi 20 Jamalpada 46
Naila Pardi 21 Kauncha 47
Thana Pardi 22 Dudhani 48
Zari 23 Gunsa 49
* In Daman & Diu and Dadra & Nagar Haveli the lower unit code represents village code.
118
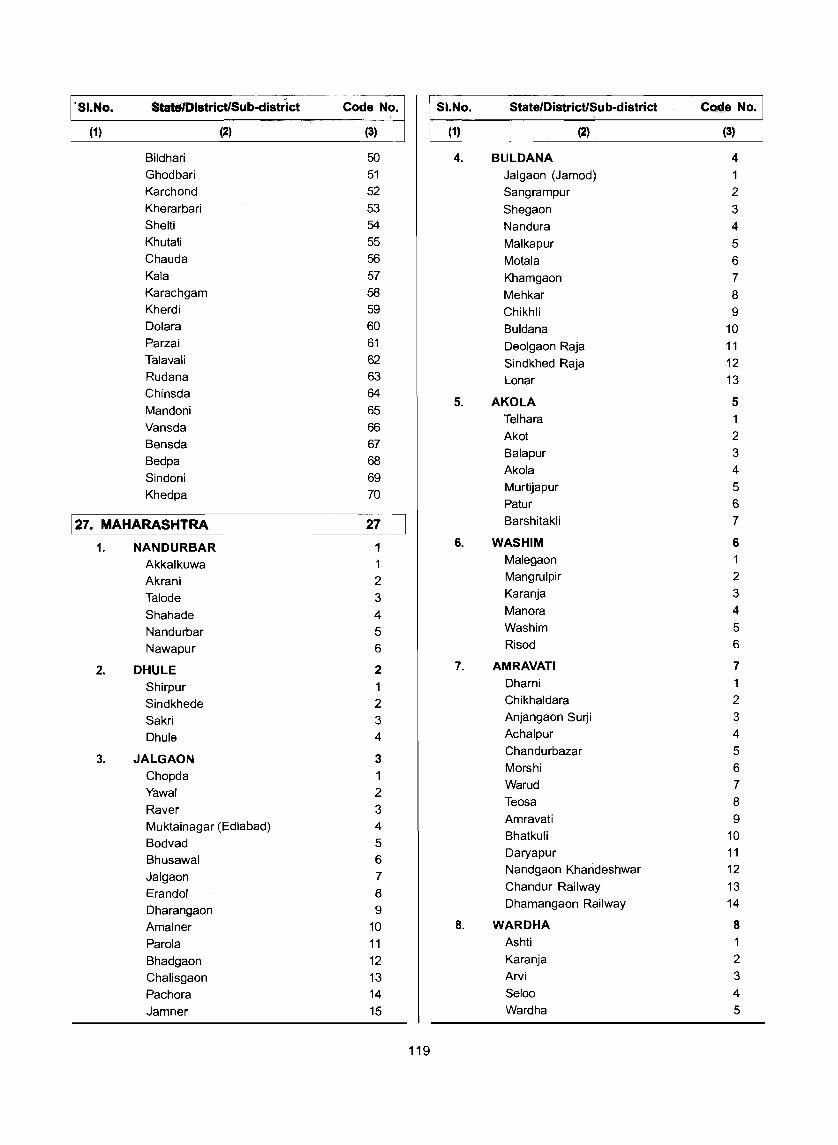
"SI.No. StateiDistrictlSub-district Code No. SI.No. StateiDistrict/Sub-district Code No.
(1) (2) (3) (1) (2) (3)
Bildhari 50 4. BULDANA 4 Ghodbari 51 Jalgaon (Jamod) Karchond 52 Sangrampur 2 Kherarbari 53 Shegaon 3 Shelti 54 Nandura 4 Khutali 55 Malkapur 5 Chauda 56 Motala 6 Kala 57 Khamgaon 7 Karachgam 58 Mehkar 8 Kherdi 59 Chikhli 9 Dolara 60 Buldana 10 Parzai 61 Deolgaon Raja 11 Talavali 62 Sindkhed Raja 12 Rudana 63 Lonar 13 Chinsda 64
5. AKOLA 5 Mandoni 65
Telhara 1 Vansda 66 Bensda 67
Akot 2
Bedpa 68 Balapur 3
Sindoni 69 Akola 4
Khedpa 70 Murtijapur 5 Patur 6
127. MAHARASHTRA 27 Barshitakli 7
1. NANDURBAR 1 6. WASHIM 6
Akkalkuwa 1 Malegaon
Akrani 2 Mangrulpir 2
Talode 3 Karanja 3
Shahade 4 Manora 4
Nandurbar 5 Washim 5
Nawapur 6 Risod 6
2. DHULE 2 7. AMRAVATI 7
Shirpur 1 Dharni 1
Sindkhede 2 Chikhaldara 2
Sakri 3 Anjangaon Surji 3
Dhule 4 Achalpur 4
3. JALGAON 3 Chandurbazar 5
Chopda 1 Morshi 6
Yawal 2 Warud 7
Raver 3 Teosa 8
Muktainagar (Edlabad) 4 Amravati 9
Bodvad 5 Bhatkuli 10
Bhusawal 6 Daryapur 11
Jalgaon 7 Nandgaon Khandeshwar 12
Erandol 8 Chandur Railway 13
Dharangaon 9 Dhamangaon Railway 14
Amalner 10 8. WARDHA 8
Parola 11 Ashti 1 Bhadgaon 12 Karanja 2 Chalisgaon 13 Arvi 3 Pachora 14 Seloo 4 Jamner 15 Wardha 5
119

SI.No. State/Distric;t/Sub-dlstrlc;t Code No. SI.No. StateJDistrlc;tlSub·distriet Code No.
(1) (2) (3) (1) (2) (3)
Deoli 6 13. CHANDRAPUR 13
Hinganghat 7 Warora
Samudrapur 8 Chimur 2
9. NAGPUR 9 Nagbhir 3
Narkhed 1 Brahmapuri 4
Katol 2 Sawali 5
Kalameshwar 3 Sindewahi 6
Sayner 4 Bhadravati 7
Parseoni 5 Chandrapur 8
Ramtek 6 Mul 9
Mauda 7 Pombhurna 10
Kamptee 8 Ballarpur 11
Nagpur (Rural) 9 Korpana 12
Nagpur (Urban) 10 Rajura 13 Gondpipri 14
Hingna 11 Umred 12 14. YAVATMAL 14
Kuhi 13 Ner
Bhiwapur 14 Babulgaon 2
Kalamb 3 10. BHANDARA 10
Yavatmal 4 Tumsar 1
Darwha 5 Mohadi 2 Digras 6 Bhandara 3 Pusad 7 Sakoli 4 Umarkhed 8 Lakhani 5 Mahagaon 9 Pauni 6 Arni 10 Lakhandur 7 Ghatanji 11
11. GONDIYA 11 Kelapur 12 Tirora Ralegaon 13 Goregaon 2 Maregaon 14
Gondiya 3 Zari-Jamani 15
Amgaon 4 Wani 16
Salekasa 5 15. NANDED 15 Sadak-Arjuni 6 Mahoor 1 Arjuni Morgaon 7 Kinwat 2 Deori 8 Himayatnagar 3
12. GADCHIROLI 12 Hadgaon 4
Desaiganj (Vadasa) 1 Ardhapur 5
Armori 2 Nanded 6
Kurkheda 3 Mudkhed 7
Korchi 4 Bhokar 8
Dhanora . 5 Umri 9
Gadchiroli 6 Dharmabad 10
Chamorshi 7 Biloli 11
Mulchera 8 Naigaon (Khairgaon) 12
Etapalli 9 Loha 13
Bhamragad 10 Kandhar 14
Aheri 11 Mukhed 15
Sironcha 12 Deglur 16
120

SI.No. State/DistrictlSuD-dlstrlct Code No. SI.No. State/DistrictlSub..clistrict Code No.
(1) (2) (3) (1) (2) (3)
16. HINGOLI 16 Niphad 14
Sengaon 1 Yevla 15
Hingoli 2 21. THANE 21 Aundha (Nagnath) 3 Talasari Kalamnuri 4 Dahanu 2 Basmath 5 Vikramgad 3
17. PARBHANI 17 Jawhar 4
Sailu 1 Mokhada 5
Jintur 2 Vada 6
Parbhani 3 Palghar 7 Manwath 4 Vasai 8 Pathri 5 Thane 9 Sonpeth 6 Bhiwandi 10
Gangakhed 7 Shahapur 11
Palam 8 Kalyan 12
Purna 9 Ulhasnagar 13
18. JALNA 18 Ambarnath 14
Bhokardan 1 Murbad 15
Jafferabad 2 22. MUMBAI (SUBURBAN) 22 Jalna 3 Mumbai (Suburban) Badnapur 4
23. MUMBAI 23 Ambad 5
Mumbai 1 Ghansawangi 6
Partur 7 24. RAIGARH 24
Mantha 8 Uran 1
19. AURANGABAD 19 Panvel 2
Kannad Karjat 3
Soegaon 2 Khalapur 4
Sillod 3 Pen 5
Phulambri 4 Alibag 6
Aurangabad 5 Murud 7
Khuldabad 6 Roha 8
Vaijapur 7 Sudhagad 9
Gangapur 8 Mangaon 10
Paithan 9 Tala 11
20. NASHIK 20 Shrivardhan 12
Surgana Mhasla 13
Kalwan 2 Mahad 14
Deola 3 Poladpur 15
Baglan 4 25. PUNE 25
Malegaon 5 Junnar
Nandgaon 6 Ambegaon 2
Chandvad 7 Shirur 3
Dindori 8 Khed 4
Peint 9 Mawal 5
Trimbakeshwar 10 Mulshi 6
Nashik 11 Haveli 7
Igatpuri 12 Pune City B
Sinnar 13 Daund 9
121

SI.No. StatelD istrlctlSub-distriQt Code No. .SI.No. StateIDistrlctlSub-dlstrict Code No.
(1) (2) ;
(3) (1) (2) (3)
Purandhar 10 Tuljapur 6 Velhe 11 Lohara 7
Bhor 12 Umarga 8
Baramati 13 30. SOLAPUR 30 Indapur 14 Karmala 1
26. AHMAD NAGAR 26 Madha 2 Akola 1 Barshi 3 Sangamner 2 Solapur North 4 Kopargaon 3 Mohol 5
Rahta 4 Pandharpur 6
Shrirampur 5 Malshiras 7
Nevasa 6 Sangole 8
Shevgaon 7 Mangalvedhe 9
Pathardi 8 Solapur South 10
Nagar 9 Akkalkot 11
Rahuri 10 31. SATARA 31 Parner 11 Mahabaleshwar Shrigonda 12 Wai 2 Karjat 13 Khandala 3 Jamkhed 14 Phaltan 4
27. BID 27 Man 5
Ashti 1 Khatav 6
Patoda 2 Koregaon 7
Shirur (Kasar) 3 Satara 8
Georai 4 Jaoli 9
Manjlegaon 5 Patan 10
Wadwani 6 Karad 11
Bid 7 32. RATNAGIRI 32 Kaij 8 Mandangad 1 Dharur 9 Dapoli 2 Parli 10 Khed 3 Ambejogai 11 Chiplun 4
28. LATUR 28 Guhagar 5
Latur 1 Ratnagiri 6
Renapur 2 . Sangameshwar 7
Ahmadpur 3 Lanja 8
Jalkot 4 Rajapur 9
Chakur 5 33. SINDHUDURG 33 Shirur-Anantpal 6 Devgad Ausa 7 Vaibhavvadi 2 Nilanga 8 Kankavli 3 Deoni 9 Malwan 4 Udgir 10 Vengurla 5
29. OSMANABAD 29 Kudal 6
Paranda 1 Sawantwadi 7
Bhum 2 Dodamarg 8
Washi 3 34. KOLHAPUR 34 Kalamb 4 Shahuwadi
Osmanabad 5 Panhala 2
122

SI.No. State/DistrictiSub-dlstrict Code No. 51.No. .. 5tate/DistrictiSub-district Code No.
(1) (2) (3) (1) ~) (3)
Hatkanangle 3 Tandur 28 Shirol 4 Tiryani 29 Karvir 5 Jannaram 30 Bavda 6 Kaddam (Peddur) 31 Radhanagari 7 Sarangapur 32 Kagal 8 Kuntala 33 Bhudargad 9 Kubeer 34
Ajra 10 Bhainsa 35 Gadhinglaj 11 Tanoor 36 Chand gad 12 Mudhole 37
35. SANGLI 35 Lokeswaram 38
Shirala Dilawarpur 39
Walwa 2 Nirmal 40
Palus 3 Laxmanchanda 41
Khanapur 4 Mamda 42
Atpadi 5 Khanapur 43
Tasgaon 6 Dandepalle 44
Miraj 7 Kasipet 45
Kavathemahankal 8 Bellampalle 46
Jat 9 Kotapalle 47 Mandamarri 48
~8. ANDHRA PRADESH 28 Luxettipet 49
1. ADILABAD 1 Mancherial 50
Tamsi 1 Jaipur 51
Adilabad 2 Chennur 52
Jainad 3 2. NIZAMABAD 2
Bela 4 Ranjal
Talamadugu 5 Navipet 2 Gudihathnoor 6 Nandipet 3 Inderavelly 7 Armur 4 Narnoor 8 Balkonda 5 Kerameri 9 Mortad 6 Wankidi 10 Kammarpalle 7 Sirpur (T) 11 Bheemgal 8 Kouthala 12 Velpur 9 Bejjur 13 Jakranpalle 10 Kaghaznagar 14 Makloor 11 Asifabad 15 Nizamabad 12 Jainoor 16 Yedpalle 13 Utnoor 17 Bodhan 14 Ichoda 18 Kotgiri 15 Bazarhath noor 19 Madnoor 16 Boath 20 Jukkal 17 Neradigonda 21 Bichkunda 18 Sirpur 22 Birkoor 19 Rebbana 23 Varni 20 Bhimini 24 Dichpalle 21 Dahegaon 25 Dharpalle 22 Vemanpalle 26 Sirkonda 23 Nennal 27 Machareddy 24
123

SI.No. State/DistrictlSub·district Code No. SI.No. State/DistrictlSub-district Code No.
(1) (2) (3) (1) (2) (3)
Sadasivanagar 25 Yellareddipet 39 Gandhari 26 Gambhiraopet 40 Banswada 27 Mustabad 41 Pitlam 28 Sirsilla 42 Nizamsagar 29 Ellanthakunta 43 Yellareddy 30 Bejjanki 44
Nagareddipet 31 Thimmapur (lMO Colony) 45 Lingampet 32 Veenavanka 46 Tadwai 33 Jammikunta 47 Kamareddy 34 Shankarapatnam 48 Bhiknoor 35 Chigurumamidi 49 Oomakonda 36 Koheda 50
3. KARIMNAGAR 3 Husnabad 51
Ibrahimpatnam 1 Saidapur 52
Mallapur 2 Huzurabad 53
Raikal 3 Kamalapur 54
Sarangapur 4 Bheemadevarpalle 55
Dharmapuri 5 Elkathurthy 56
Velgatoor 6 4. MEDAK 4
Ramagundam 7 Kangti 1 Kamanpur 8 Manoor 2 Manthani 9 Narayankhed 3 Kataram 10 Kalher 4 Mahadevpur 11 Shankarampet (A) 5 Mutharam (Mahadevpur) 12 Papannapet 6 Malharrao 13 Medak 7 Mutharam (Manthani) 14 Ramayampet 8
Srirampur 15 Dubbak 9 Peddapalle 16 Siddipet 10 Julapalle 17 Chinnakodur 11 Dharmaram 18 Nangnoor 12 Gollapalle 19 Kondapak 13 Mallial 20 Mirdoddi 14 Jagtial 21 Ooulthabad 15 Medipalle 22 Chegunta 16
Koratla 23 Shankarampet (R) 17 Metpalle 24 Kulcharam 18 Kathlapur 25 Tekmal 19 Chandurthi 26 Alladurg 20 Kodimial 27 Regode 21
Pegadapalle 28 Raikode 22 Gangadhara 29 Nyalkal 23 Ramadugu 30 Zahirabad 24 Choppadandi 31 Kohir 25 Sulthanabad 32 Jharasangam 26 Odela 33 Munipalle 27 Manakondur 34 Pulkal 28 Karimnagar 35 Andole 29 Boinpalle 36 Kowdipalle 30
Vemulawada 37 Yeldurthy 31 Konaraopeta 38 Tupran 32
124
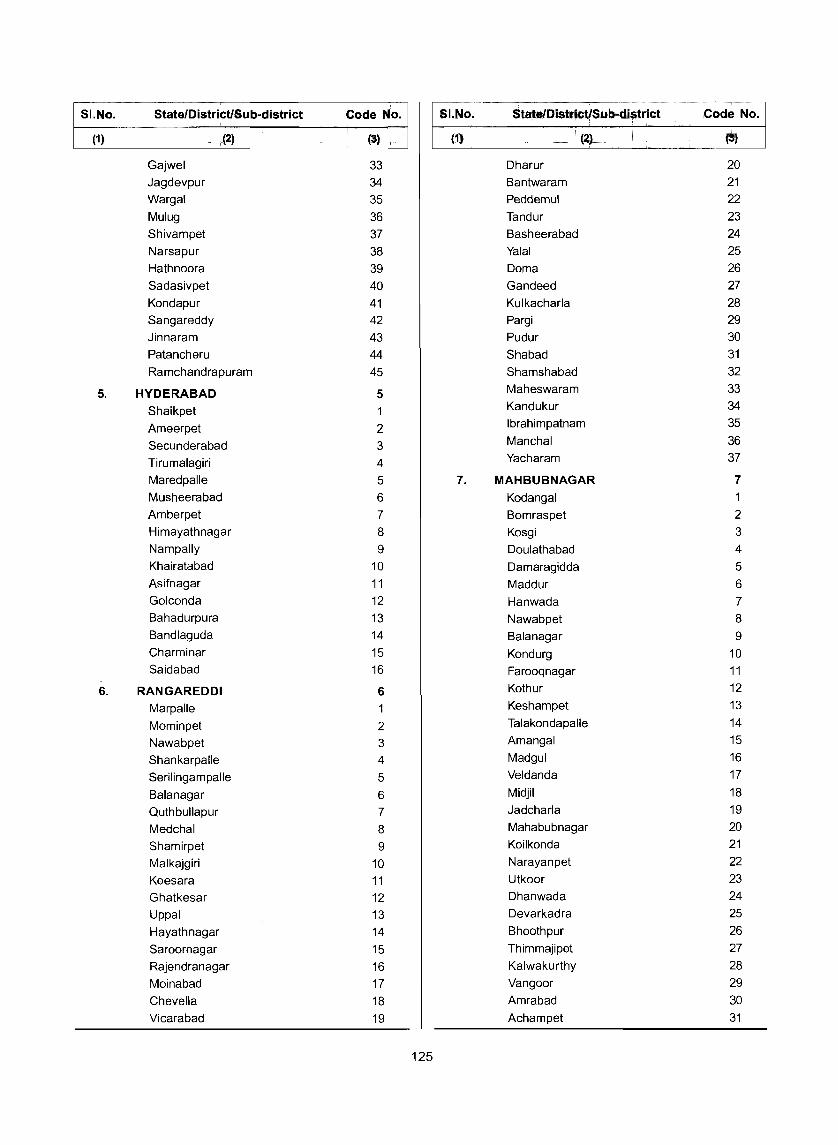
,---
SI.No. State/DistrictlSub-distri ct Code No. SI.No. State/DistrictlSub-district Code No.
(1) (2) (3) (1) (2) (3)
Gajwel 33 Dharur 20 Jagdevpur 34 Bantwaram 21 Wargal 35 Peddemul 22 Mulug 36 Tandur 23 Shivampet 37 Basheerabad 24 Narsapur 38 Yalal 25 Hathnoora 39 Doma 26 Sadasivpet 40 Gandeed 27 Kondapur 41 Kulkacharla 28 Sangareddy 42 Pargi 29 Jinnaram 43 Pudur 30 Patancheru 44 Shabad 31 Ramchandrapuram 45 Shamshabad 32
5. HYDERABAD 5 Maheswaram 33
Shaikpet 1 Kandukur 34
Ameerpet 2 Ibrahimpatnam 35
Secunderabad 3 Manchal 36
Tirumalagiri 4 Yacharam 37
Maredpalle 5 7. MAHBUBNAGAR 7 Musheerabad 6 Kodangal 1 Amberpet 7 Bomraspet 2 Himayathnagar 8 Kosgi 3 Nampally 9 Doulathabad 4 Khairatabad 10 Damaragidda 5 Asifnagar 11 Maddur 6 Golconda 12 Hanwada 7 Bahadurpura 13 Nawabpet 8 Bandlaguda 14 Balanagar 9 Charminar 15 Kondurg 10 Saidabad 16 Farooqnagar 11
6. RANGAREDDI 6 Kothur 12
Marpalle Keshampet 13
Mominpet 2 Talakondapalle 14
Nawabpet 3 Amangal 15
Shankarpalle 4 Madgul 16
Serilingampalle 5 Veldanda 17
Balanagar 6 Midjil 18
Quthbullapur 7 Jadcharla 19
Medchal 8 Mahabubnagar 20
Shamirpet 9 Koilkonda 21
Malkajgiri 10 Narayanpet 22
Keesara 11 Utkoor 23 Ghatkesar 12 Dhanwada 24
Uppal 13 Devarkadra 25 Hayathnagar 14 Bhoothpur 26 Saroornagar 15 Thimmajipet 27 Rajendranagar 16 Kalwakurthy 28 Moinabad 17 Vangoor 29 Chevella 18 Amrabad 30 Vicarabad 19 Achampet 31
125
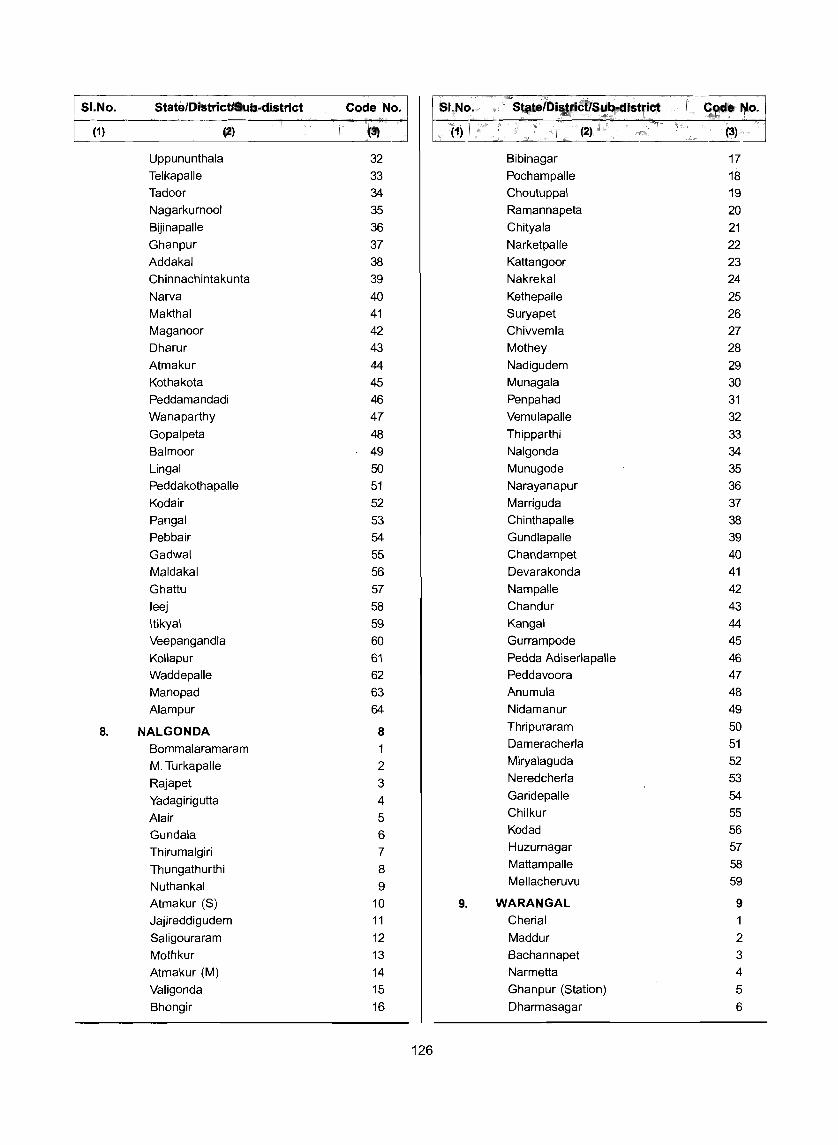
51.No. State/District/5ub·district Code No. 51.No. 5tate/Dist(ict/S ub-district Code No.
(1) (2) (3) (1) (2) (3)
Uppununthala 32 Bibinagar 17 Telkapalle 33 Pochampalle 18 Tadoor 34 Choutuppal 19 Nagarkurnool 35 Ramannapeta 20 Bijinapalle 36 Chityala 21 Ghanpur 37 Narketpalie 22 Addakal 38 Kattangoor 23 Chinnachintakunta 39 Nakrekal 24 Narva 40 Kethepalle 25 Makthal 41 Suryapet 26 Maganoor 42 Chivvemla 27 Dharur 43 Mothey 28 Atmakur 44 Nadigudem 29 Kothakota 45 Munagala 30 Peddamandadi 46 Penpahad 31 Wanaparthy 47 Vemulapalle 32 Gopalpeta 48 Thipparthi 33 Balmoor 49 Nalgonda 34
Lingal 50 Munugode 35 Peddakothapalle 51 Narayanapur 36 Kodair 52 Marriguda 37 Pangal 53 Chinthapalle 38
Pebbair 54 Gundlapalle 39 Gadwal 55 Chandampet 40 Maldakal 56 Devarakonda 41 Ghattu 57 Nampalle 42 leej 58 Chandur 43 Itikyal 59 Kangal 44
Veepangandla 60 Gurrampode 45 Kollapur 61 Pedda Adiserlapalle 46 Waddepalle 62 Peddavoora 47 Manopad 63 Anumula 48 Alampur 64 Nidamanur 49
8. NALGONDA 8 Thripuraram 50
Bommalaramaram Dameracherla 51
M. Turkapalle 2 Miryalaguda 52
Rajapet 3 Neredcherla 53
Yadagirigutta 4 Garidepalle 54
Alair 5 Chilkur 55
Gundala 6 Kodad 56
Thirumalgiri 7 Huzurnagar 57
Thungathurthi 8 Mattampalle 58
Nuthankal 9 Mellacheruvu 59
Atmakur (S) 10 9. WARANGAL 9 Jajjreddigudem 11 Cherial 1 Saligouraram 12 Maddur 2 Mothkur 13 Bachannapet 3 Atmakur (M) 14 Narmetta 4 Valigonda 15 Ghanpur (Station) 5 Bhongir 16 Dharmasagar 6
126

SI.No. State/DistrictlSub-district Code No. S!.No. StateJDistrictlSub-dlstrict Code No.
(1) (2) (3) (1) (2) (3)
Hasanparthy 7 Manuguru 5 Parkal 8 Aswapuram 6 Mogullapalle 9 Dummugudem 7 Chityal 10 Bhadrachalam 8 Bhupalpalie 11 Kunavaram 9 Ghanpur (Mulug) 12 Chintur 10 Venkatapur 13 Vararamachandrapuram 11 Eturnagaram 14 Velairpad 12 Mangapet 15 Kukunoor 13 Tadvai 16 Burgumpahad 14 Govindaraopet 17 Palwancha 15 Mulug 18 Kothagudem 16 Regonda 19 Tekulapalle 17 Shayampet 20 Yeliandu 18 Nallabelly 21 Gundala 19 Duggondi 22 Bayyaram 20 Atmakur 23 Garla 21 Hanamkonda 24 Singareni 22 Zaffergadh 25 Kamepalle 23 Palakurthi 26 Julurpadu 24 Raghunathpalle 27 Chandrugonda 25 Jangaon 28 Mulkalapalie 26 Lingalaghanpur 29 Aswaraopet 27 Devaruppula 30 Dammapet 28 Kodakandla 31 Sathupalie 29 Raiparthy 32 Penuballe 30 Wardhannapet 33 Enkuru 31 Sangam 34 Thirumalayapalem 32 Warangal 35 Kusumanchi 33 Geesugonda 36 Khammam (Rural) 34
Narsampet 37 Khammam (Urban) 35 Khanapur 38 Mudigonda 36 Kothagudem 39 Nelakondapalle 37 Gudur 40 Chinthakani 38 Chennaraopet 41 Konijerla 39 Nekkonda 42 Taliada 40 Parvathagiri 43 Kaliur 41 Thorrur 44 Wyra 42 Nellikudur 45 Bonakal 43 Kesamudram 46 Madhira 44
Mahabubabad 47 Yerrupalem 45 Narsimhulapet 48 Vemsoor 46 Maripeda 49 11. SRIKAKULAM 11 Kuravi 50 Veeraghattam 1 Dornakal 51 Seethampeta 2
10. KHAMMAM 10 Bhamini 3 Wazeed Kothuru 4 Venkatapuram 2 Pathapatnam 5 Pinapaka 3 Meliaputtu 6 Cherla 4 Palasa 7
127
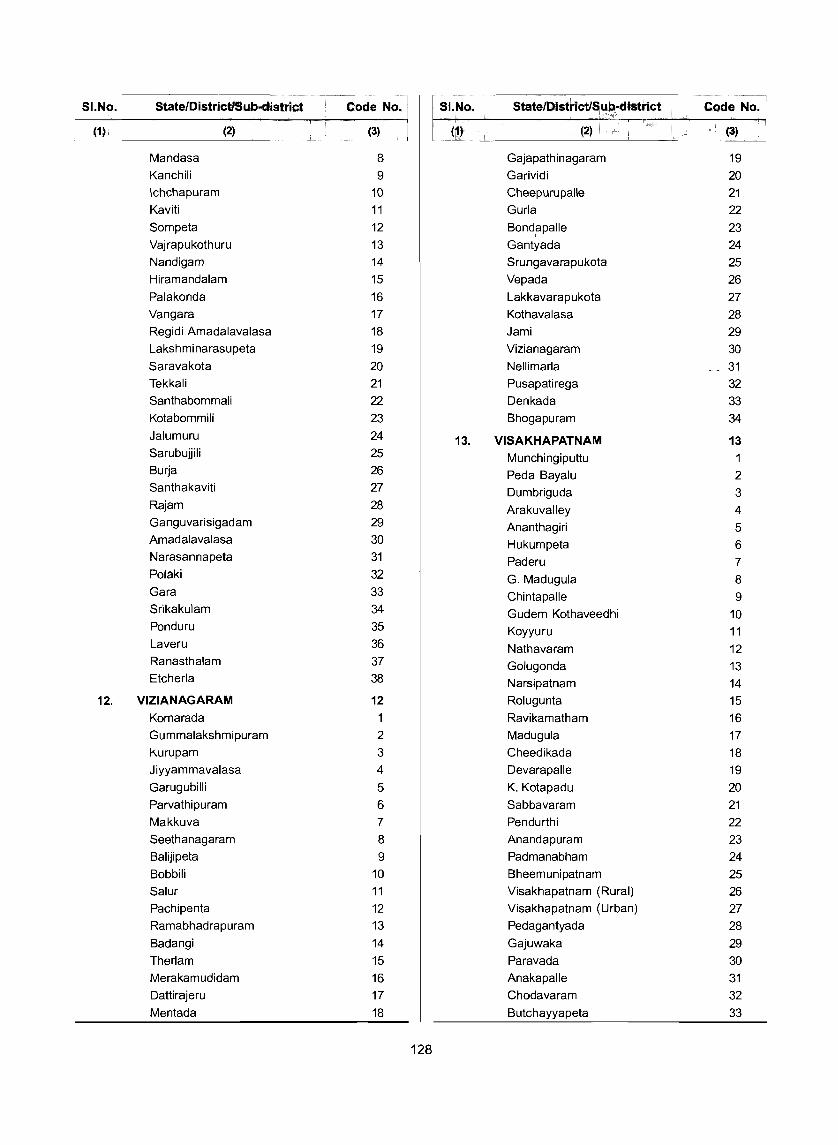
SI.No. State/DistrictlSub·district Code No. SI.No. State/DistrictlSub-distrlct Code No.
(1) (2) (3) (1) (2) (3)
Mandasa 8 Gajapathinagaram 19 Kanchili 9 Garividi 20 Ichchapuram 10 Cheepurupalle 21 Kaviti 11 Gurla 22 Sompeta 12 Bond,apalle 23 Vajrapukothuru 13 Gantyada 24 Nandigam 14 Srungavarapukota 25 Hiramandalam 15 Vepada 26 Palakonda 16 Lakkavarapukota 27 Vangara 17 Kothavalasa 28 Regidi Amadalavalasa 18 Jami 29 Lakshminarasupeta 19 Vizianagaram 30 Saravakota 20 Nellimarla __ 31
Tekkali 21 Pusapatirega 32 Santhabommali 22 Denkada 33 Kotabommili 23 Bhogapuram 34 Jalumuru 24 13. VISAKHAPATNAM 13 Sarubujjili 25 MunchingipuUu Burja 26 Peda Bayalu 2 Santhakaviti 27 Dumbriguda 3 Rajam 28 Arakuvalley 4 Ganguvarisigadam 29 Ananthagiri 5 Amadalavalasa 30 Hukumpeta 6 Narasannapeta 31 Paderu 7 Polaki 32 G. Madugula 8 Gara 33 Chintapalle 9 Srikakulam 34 Gudem Kothaveedhi 10 Ponduru 35 Koyyuru 11 Laveru 36 Nathavaram 12 Ranasthalam 37 Golugonda 13 Etcherla 38 Narsipatnam 14
12. VIZIANAGARAM 12 Rolugunta 15 Komarada 1 Ravikamatham 16 Gummalakshmipuram 2 Madugula 17 Kurupam 3 Cheedikada 18 Jiyyammavalasa 4 Devarapalle 19 Garugubilli 5 K. Kotapadu 20 Parvathipuram 6 Sabbavaram 21 Makkuva 7 Pendurthi 22 Seethanagaram 8 Anandapuram 23 Balijipeta 9 Padmanabham 24 Bobbili 10 Bheemunipatnam 25 Salur 11 Visakhapatnam (Rural) 26 Pachipenta 12 Visakhapatnam (Urban) 27 Ramabhadrapuram 13 Pedagantyada 28 Badangi 14 Gajuwaka 29 Therlam 15 Paravada 30 Merakamudidam 16 Anakapalle 31 Dattirajeru 17 Chodavaram 32 Mentada 18 Butchayyapeta 33
128

SI.No. State/OlstrictiSub-district Code No. SI.No. State/DistrictiSub-dlstrict Code No.
(1) (2) (3) (1) (2) (3)
Kotauratla 34 Ramachandrapuram 40 Makavarapalem 35 Alamuru 41 Kasimkota 36 Ravulapalem 42 Munagapaka 37 Kothapeta 43 Atchutapuram 38 Kapileswarapuram 44
Yelamanchili 39 Pamarru 45 Nakkapalle 40 Thallarevu 46 Payakaraopeta 41 l. Polavaram 47 S. Rayavaram 42 Mummidivaram 48 Rambilli 43 Ainavilli 49
14. EAST GODAVARI 14 P. Gannavaram 50
Maredumilli Ambajipeta 51
Devipatnam 2 Mamidikuduru 52
Y. Ramavaram 3 Razole 53
Addateegala 4 Malikipuram 54
Rajavommangi 5 Sakhinetipalle 55
Kotananduru 6 Allavaram 56
Tuni 7 Amalapuram 57
Sankhavaram 8 Uppalaguptam 58
Yeleswaram 9 Katrenikona 59
Gangavaram 10 15. WEST GODAVARI 15
Rampachodavaram 11 Chintalapudi 1 Seethanagaram 12 Lingapalem 2 Gokavaram 13 T. Narasapuram 3 Jaggampeta 14 Jeelugu milli 4 Kirlampudi 15 Buttayagudem 5 Prathipadu 16 Polavaram 6 Thondangi 17 Tallapudi 7 Gollaprolu 18 Gopalapuram 8 Peddapuram 19 Koyyalagudem 9 Gandepalle 20 Jangareddigudem 10 Korukonda 21 Kamavarapukota 11 Rajahmundry (Urban) 22 Dwarakatirumala 12 Rajahmundry (Rural) 23 Nallajerla 13 Rajanagaram 24 Devarapalle 14 Rangampeta 25 Kovvur 15 Samalkota 26 Chagallu 16 Pithapuram 27 Nidadavole 17 Kothapalle 28 Tadepalligudem 18 Kakinada (Rural) 29 Unguturu 19 Kakinada (Urban) 30 Bhimadole 20 Pedapudi 31 Pedavegi 21 Biccavolu 32 Pedapadu 22 Anaparthy 33 Eluru 23 Kadiam 34 Denduluru 24 Atreyapuram 35 Nidamarru 25 Mandapeta 36 Pentapadu 26 Rayavaram 37 Undrajavaram 27 Karapa 38 Peravali 28 Kajuluru 39 Tanuku 29
129

SI.No. State/DistrictlSub-dlstrict Code No. SI.No. State/DistrictlSub-distri ct Code No.
(1) (2) (3) (1) (2) (3)
Attili 30 Pedaparupudi 33
Ganapavaram 31 Kankipadu 34
Akividu 32 Penamaluru 35 Undi 33 Thotlavall u ru 36 Palacoderu 34 Pamidimukkala 37 Penumantra 35 Vuyyuru 38 Iragavaram 36 Pamarru 39 Penugonda 37 Gudlavalleru 40
Achanta 38 Pedana 41 Poduru 39 Guduru 42
Veeravasaram 40 Movva 43 Bhimavaram 41 Ghantasala 44
Kalla 42 Machilipatnam 45 Mogaltur 43 Challapalle 46
Narsapur 44 Mopidevi 47 Palacole 45 Avanigadda 48 Ylamanchili 46 Nagayalanka 49
16. KRISHNA 16 Koduru 50
Vatsavai 1 17. GUNTUR 17
Jaggayyapeta 2 Macherla 1 Penuganchiprolu 3 Veldurthy 2
Nandigama 4 Durgi 3 Veerullapadu 5 Rentachintala 4 Mylavaram 6 Gurazala 5 Gampalagudem 7 Dachepalle 6
Tiruvuru 8 Karempudi 7
A. Konduru 9 Piduguralla 8 Reddigudem 10 Machavaram 9 Vissannapet 11 Bellamkonda 10
Chatrai 12 Atchampet 11 Musunuru 13 Krosuru 12
Nuzvid 14 Amaravathi 13
Bapulapadu 15 Thullur 14
Agiripalle 16 Tadepalle 15
G. Konduru 17 Mangalagiri 16
Kanchikacherla 18 Tadikonda 17
Chandarlapadu 19 Pedakurapadu 18 Ibrahimpatnam 20 Sattenapalle 19
Vijayawada (Urban) 21 Rajupalem 20
Vijayawada (Rural) 22 Nekarikallu 21 Gannavaram 23 Bollapalle 22 Unguturu 24 Vinukonda 23 Nandivada 25 Nuzendla 24
Mandavalli 26 Savalyapuram (H/o Kanumarlapudi) 25 Kaikalur 27 Ipur 26
Kalidindi 28 Rompicherla 27
Kruthivennu 29 Narasaraopeta 28 Bantumilli 30 Muppalla 29
Mudinepalle 31 Nadendla 30
Gudivada 32 Chilakaluripet (H/o.Purushothapatnam) 31
130
SI.No. State/QistrictlSub-district . Code No. SI.No. S~t./D'strictlSub-distrlct Cade No.
(1) (2) (3) (~) . .
(3) .. ...... (2) ....... ..
Edlapadu 32 Podili 24 Phirangipuram 33 Thallur 25 Medikonduru 34 Korisapadu 26 Guntur 35 Chirala 27 Pedakakani 36 Vetapalem 28 Duggirala 37 Chinaganjam 29 Kollipara 38 Naguluppalapadu 30 Tenali 39 Maddipadu 31 Chebrolu 40 Chimakurthi 32 Vatticherukuru 41 Marripudi 33 Prathipadu 42 Hanumanthunipadu 34
Pedanandipadu 43 Bestavaripeta 35 . Kakumanu 44 Racherla 36 Ponnur 45 Giddalur 37 Tsundur 46 Komarolu 38 Amruthalur 47 Veligandla 39 Vemuru 48 Kanigiri 40 Kollur 49 Kondapi 41 Bhattiprolu 50 Santhanuthalapadu 42 Cherukupalle (H/o Arumbaka) 51 Ongole 43 Pittalavanipalem 52 Kothapatnam 44
Karlapalem 53 Tangutur 45 Bapatla 54 Zarugumilli 46 Nizampatnam 55 Ponnaluru 47 Nagaram 56 PedacherlopalJe 48 Repalle 57 Chandra Sekhara Puram 49
18. PRAKASAM 18 Pamur 50
Yerragondapalem Voletivaripalem 51
Pullalacheruvu 2 Kandukur 52
Tripuranthakam 3 Singarayakonda 53
Dornala 4 Lingasamudram 54
Pedda Araveedu 5 Gudlur 55
Donakonda 6 Ulavapadu 56
Kurichedu 7 19. NELLORE 19 Santhamaguluru 8 Seetharamapuram 1 Ballikurava 9 Udayagiri 2 Martur 10 Varikuntapadu 3 Yeddanapudi 11 Kondapuram 4 Parchur 12 Jaladanki 5 Karamchedu 13 Kavali 6 Inkollu 14 Bogole 7 Janakavarampanguluru 15 Kaligiri 8 Addanki 16 Vinjamur 9 Mundlamuru 17 Duttalur 10 Darsi 18 Marripadu 11 Markapur 19 Atmakur 12 Ardhaveedu 20 Anumasamudrampeta 13 Cumbum 21 Dagadarthi 14 Tarlupadu 22 Allur 15 Konakanamitla 23 Vidavalur 16
131

51.No. 5tate/Distri ctiSub-distriot Code No. SlrN.o. St~t~~Di~.rlctiSubrdistrict Code No.
(1) (2) ($) . .. (1) ·1
(I) . (3)
Kodavalur 17 Lingala 20 Buchireddipalem 18 Pulivendla 21 Sang am 19 Vemula 22 Chejerla 20 Thondur 23 Ananthasagaram 21 Veerapunayunipalle 24 Kaluvoya 22 Yerraguntla 25 Rapur 23 Kamalapuram 26 Podalakur 24 Vallur 27 Nellore 25 Chennur 28 Kovur 26 Atlur 29 Indukurpet 27 Vontimitta 30 Thotapalligudur 28 Sidhout 31 Muthukur 29 Cuddapah 32 Venkatachalam 30 Chinthakommadinne 33 Manubolu 31 Pendlimarri 34
Gudur 32 Vempalle 35 Sydapuram 33 Chakarayapet 36
Dakkili 34 Galiveedu 37 Venkatagiri 35 Chinnamandem 38 Balayapalle 36 Sambepalle 39 Ojili 37 T. Sundupalle 40 Chillakur 38 Rayachoti 41 Kota 39 Lakkireddipalle 42 Vakadu 40 Ramapuram 43 Chitlamur 41 Veeraballe 44
Naidupet 42 Nandalur 45 Pellakur 43 Penagalur 46 Doravarisatram 44 Chitvel 47 Sullurpeta 45 Rajampet 48 Tada 46 Pullampeta 49
20. CUDDAPAH 20 Obulavaripalle 50
Kondapuram 1 Kodur 51
Mylavaram 2 21. KURNOOL 21
Peddamudium 3 Mantralayam 1 Rajupalem 4 Kosigi 2 Duvvur 5 Kowthalam 3 S. Mydukur 6 Pedda Kadubur 4 Brahmamgarimattam 7 Yemmiganur 5 Sri Avadhuth Kasinayana 8 Nandavaram 6 KaJasapadu 9 C. Belagal 7 Porumamilla 10 Gudur 8 B. Kodur 11 Kallur 9 Badvel 12 Kurnool 10 Gopavaram 13 Nandikotkur 11 Khajipet 14 Pagidyala 12 Chapad 15 Jupadu Bungalow 13 Proddatur 16 Kothapalle 14 JammaJamadugu 17 Srisailam 15 Muddanur 18 Atmakur 16 Simhadripuram 19 PamuJapadu 17
132

SI.No. StateIDistrictlSUb.~n$trid , Cod, No. SI.No. State/DistrrctlSub-distri~t Code No . ..... ...... . ..... . : . .
. (1) (2" (3) (1) . (2) (~)
Midthur 18 Vajrakarur 13 Orvakal 19 Uravakonda 14 Kodumur 20 Beluguppa 15 Gonegandla 21 Gummagatta 16 Adoni 22 Brahmasamudram 17
Holagunda 23 Kalyandurg 18
Halaharvi 24 Atmakur 19
Alur 25 Kudair 20
Aspari 26 Garladinne 21
Devanakonda 27 Singanamala 22
Krishnagiri 28 Putlur 23
Veldurthi 29 Yellanur 24
Bethamcherla 30 Narpala 25
Panyam 31 Bukkarayasamudram 26
Gadivemula 32 Anantapur 27
Velgode 33 Raptadu 28
Bandi Atmakur 34 Settur 29
Nandyal 35 Kundurpi 30
Mahanandi 36 Kambadur 31
Sirvel 37 Kanaganapalle 32
Gospadu 38 Dharmavaram 33
Banaganapalle 39 Bathalapalle 34
Dhone 40 Tadimarri 35
Pattikonda 41 Mudigubba 36
Chippagiri 42 Talupula 37
Maddikera (East) 43 Nambulipulikunta 38
Tuggali 44 Gandlapenta 39
Peapally 45 Kadiri 40
Owk 46 Nallamada 41
Koilkuntla 47 Bukkapatnam 42
Rudravaram 48 Kothacheruvu 43
Allagadda 49 Chennekothapalle 44
Dornipadu 50 Ramagiri 45 Roddam 46
Sanjamala 51 Madakasira 47
Kolimigundla 52 Amarapuram 48
Uyyalawada 53 Gudibanda 49
Chagalamarri 54 Rolla 50
22. ANANTAPUR 22 Agali 51 D. Hirehal 1 Parigi 52 Rayadurg 2 Penukonda 53 Kanekal 3 Puttaparthi 54 Bommanahal 4 Obuladevaracheruvu 55 Vidapanakal 5 Nallacheruvu 56 Guntakal 6 Tanakal 57 Gooty 7 Amadagur 58
Peddavadugur 8 Gorantla 59 Yadiki 9 Somandepalle 60 Tadpatri 10 Hindupur 61
Peddapappur 11 Lepakshi 6L. Pamidi 12 Chilamathur 63
133

SI.No. State/DistrictlSub-dlstrict Code No. SI.No. , State/DistrlctiSlIb-qistrict , Code No.
(1) (2) (3) (1) t2J ,
(3)
23. CHITTOOR 23 Peddapanjani 50 Mulakalacheruvu 1 Gangavaram 51 Thamballapalle 2 Thavanampalle 52 Peddamandyam 3 Sri rangarajapuram 53 Gurramkonda 4 Gangadhara Nellore 54
Kalakada 5 Chittoor 55 Kambhamvaripalle 6 Palamaner 56 Rompicherla 7 Baireddipalle 57 Yerravaripalem 8 Venkatagi~ikota 58
Tirupathi (Rural) 9 Santhipuram 59 Renigunta 10 Gudupalle 60 Yerpedu 11 Kuppam 61 Srikalahasti 12 Ramakuppam 62 Thottambedu 13 Bangarupalem 63 Buchinaidu Khandriga 14 Yadamari 64 Varadaiahpalem 15 Gudipala 65 K.v.B. Puram 16 Palasamudram 66 Tirupathi (Urban) 17 Chandragiri 18 129. KARNATAKA 29 Chinnagottigallu 19 1. BELGAUM 1 Pileru 20 Chikodi 1 Kalikiri 21 Athni 2 Vayalpad 22 Raybag 3 Kurabalakota 23 Gokak 4 Peddathippa Samudram 24 Hukeri 5 B. Kothakota 25 Belgaum 6 Madanapalle 26 Khanapur 7 Nimmanapalle 27 Sampgaon 8 Sodam 28 Parasgad 9 Pulicherla 29 Ramdurg 10 Pakala 30
2. BAGALKOT 2 Vedurukuppam 31
Jamkhandi 1 Ramachandra Puram 32
Bilgi 2 Vadamalapeta 33
Mudhol 3 [\larayanavanam 34
Badami 4 Pitchatur 35
Bagalkot 5 Satyavedu 36
Hungund 6 Nagalapuram 37 Nindra 38 3. BIJAPUR 3
Vijayapuram 39 Bijapur
Nagari 40 Indi 2
Puttur 41 Sindgi 3
Karvetinagar 42 Basavana Bagevadi 4
Penumuru 43 Muddebihal 5
Puthalapattu 44 4. GULBARGA 4 Irala 45 Aland 1 Somala 46 Afzalpur 2 Chowdepalle 47 Gulbarga 3 Ramasamudram 48 Chincholi 4 Punganur 49 Sedam 5
134

SI.No. State/DistrictlSub-district Code No. SI.No. StateJDistrictlSub-district Code No.
(1) (2) (3) (1) (2) (3) '----
Chitapur 6 Savanur 2
Jevargi 7 Hangal 3
Sharapur 8 Haveri 4
Shahpur 9 Byadgi 5
Yadgir 10 Hirekerur 6
5. BIDAR 5 Ranibennur 7
Basavakalyan 1 12. BELLARY 12
Bhalki 2 Hadagalli
Aurad 3 Hagaribammanahalli 2
Bidar 4 Haspet 3
Hamnabad 5 Siruguppa 4
6. RAICHUR 6 Bellary 5
Lingsugur 1 Sandur 6
Oevadurga 2 Kudligi 7
Raichur 3 13. CHITRADURGA 13
Manvi 4 Malakalmuru 1
Sindhnur 5 Challakere 2
7. KOPPAL 7 Chitradurga 3
Yelbarga 1 Halalkere 4
Kushtagi 2 Hosdurga 5
Gangawati 3 Hiriyur 6
Kappal 4 14. DAVANAGERE 14
8. GADAG 8 Harihar 1
Nargund Harapanahalli 2
Ron 2 Jagalur 3
Gadag 3 Oavanagere 4
Shirhatli 4 Honnali 5
Mundargi 5 Channagiri 6
9. DHARWAD 9 15. SHIMOGA 15
Oharwad Sagar
Navalgund 2 Sorab 2
Hubli 3 Shikarpur 3
Kalghatgi 4 Hosanagara 4
Kundgol 5 Tirthahalli 5
10. UTTARA KANNADA 10 Shimaga 6
Karwar Bhadravati 7
Supa 2 16. UDUPI 16
Haliyal 3 Kundapura 1
Yellapur 4 Udupi 2
Mundgod 5 Karkal 3
Sirsi 6 17. CHIKMAGALUR 17 Ankala 7 Sringeri 1 Kumta 8 Kappa 2 Siddapur 9 Narasimharajapura 3 Hanavar 10 Tarikere 4 Bhatkal 11 Kadur 5
11. HAVERI 11 Chikmagalur 6
Shiggaon 1 Mudigere 7
135

.-- ---
SI.No. State/DistrictiSub-district Code No. SI.No. State/DistrictiSub-district Code No.
(1) (2) (3) (1) (2) (3)
18. TUMKUR 18 Arkalgud 6 Chiknayakanhalli 1 Hole Narsipur 7 Sira 2 Channarayapatna 8 Pavagada 3 24. DAKSHINA KANNADA 24 Madhugiri 4 Mangalore 1 Koratagere 5 Bantval 2 Tumkur 6 Beltangadi Gubbi
3 7 Puttur 4
Tiptur 8 Sulya 5 Turuvekere 9 Kunigal 10 25. KODAGU 25
Madikeri 1 19. KOLAR 19 Somvarpet
Gauribidanur 2
Chik Ballapur 2 Virajpet 3
Gudibanda 3 26. MYSORE 26
8agepalli 4 Piriyapatna
Sidlaghatta 5 Hunsur 2
Chintamani 6 Krishnarajanagara 3
Srinivaspur 7 Mysore 4
Kolar 8 Heggadadevan kote 5
Malur 9 Nanjangud 6
8angarapet 10 Tirumakudal Narsipur 7
Mulbagal 11 27. CHAMARAJANAGAR 27
20. BAN GALORE 20 Gundlupet 1
8angalore North 1 Chamarajanagar 2
Bangalore South 2 Yelandur 3
Anekal 3 Kollegal 4
21. BAN GALORE RURAL 21 130. GOA
Nelamangala 1 30
Dod Ballapur 2 1. NORTH GOA 1
Devanahalli 3 Pernem 1
Hosakote 4 Bardez 2
Magadi 5 Tiswadi 3
Ramanagaram 6 Bicholim 4
Channapatna 7 Satari 5
Kanakapura 8 Ponda 6
22. MANDYA 22 2. SOUTH GOA 2
Krishnarajpet 1 Mormugao
Nagamangala 2 Salcete 2
Pandavapura 3 Quepem 3
Shrirangapattana 4 Sanguem 4
Mandya 5 Canacona 5 Maddur 6 Malavalli 7 ia:t LAKSHADWEEP* 31
23. HASSAN 23 1. LAKSHADWEEP 1
Sakleshpur Amini Sub-Division
8elur 2 Chetiat
Arsikere 3 Kiltan 2
Hassan 4 Kadmat 3 Alur 5 Amini 4
• In Lakshadweep the lower unit code represents CD. Block code.
136
SI.No. State/DistrictlSub-district Code No. SI.No. State/DistrictlSub-di strict Code No.
(1) (2) (3) (1) (2) (3)
Andrott Sub-Division 2 Kanayannur 5 Andrott 1 Muvattupuzha 6 Kalpeni 2 Kothamangalam 7 Minicoy Sub-Division 3 9. IDUKKI 9 Minicoy 1 Devikulam Kavaratti Sub-Division 4 Udumbanchola 2 Agatti 1 Thodupuzha 3 Kavaratti 2 Peerumade 4
132. KERALA 32 10. KOTTAYAM 10 Meenachil
1. KASARAGOD 1 Vaikom 2 Kasaragod
Kottayam 3 Hosdurg 2
Changanassery 4 2. KANNUR 2 Kanjirappally 5
Taliparamba 1 11. AlAPPUZHA 11
Kannur 2 Cherthala 1
Thalassery 3 Ambalappuzha 2
3. WAYANAD 3 Kuttanad 3 Mananthavady 1 Karthikappally 4 Sulthanbathery 2 Chengannur 5 Vythiri 3 Mavelikkara 6
4. KOZHIKODE 4 12. PATHANAMTHITTA 12 Vadakara 1 Thiruvalla Quilandy 2 Mallappally 2 Kozhikode 3 Ranni 3
5. MALAPPURAM 5 Kozhenchery 4
Ernad Adoor 5
Nilambur 2 13. KOllAM 13 Perinthalmanna 3 Karunagappally 1 Tirur 4 Kunnathur 2 Tirurangadi 5 Pathanapuram 3 Ponnani 6 Kottarakkara 4
6. PALAKKAD 6 Kollam 5 Ottappalam 14. THIRUVANANTHAPURAM 14 Mannarkad 2 Chirayinkeezhu 1 Palakkad 3 Nedumangad 2 Chittur 4 Thiruvananthapuram 3 Alathur 5 Neyyattinkara 4
7. THRISSUR 7 Talappilly 1 133. TAMIL NADU 33 Chavakkad 2 1. TH'RUVAllUR 1 Thrissur 3 Gummidipoondi 1 Kodungallur 4 Ponneri 2 Mukundapuram 5 Uthukkottai 3
8. ERNAKUlAM 8 Tiruttani 4 Kunnathunad 1 Paliipattu 5 Aluva 2 Thiruvallur 6 Paravur 3 Poonamallee 7 Kochi 4 Ambattur 8
137

SI;No. State/District/Sub-distrlct Code No. SI.No. State/DistrictlSub-district Code No.
(1) (2) (3) (1) (2) (3)
2. CHENNAI 2 Edappadi 3 Chennai Sankari 4
3. KANCHEEPURAM 3 Salem 5
Sriperum budur Yercaud 6
Tambaram 2 Vazhapadi 7
Chengalpattu 3 Attur 8
Kancheepuram 4 Gangavalli 9
Uthiramerur 5 9. NAMAKKAL 9 Tirukalukundram 6 Tiruchengode 1
Maduranthakam 7 Rasipuram 2 Cheyyur 8 Nmakkal 3
4. VELLORE 4 Paramathi-Velur 4
Gudiyatham 1 10. ERODE 10 Katpadi 2 Sathyamangalam 1
Wallajah 3 Bhavani 2 Arakonam 4 Gobichettipalayam 3 Areot 5 Perundurai 4
Veil ore 6 Erode 5 Vaniyambadi 7 Kangeyam 6 Tirupathur 8 Dharapuram 7
5. DHARMAPURI 5 11. THE NILGIRIS 11 Hosur Panthalur
Krishnagiri 2 Gudalur 2 Denkanikottai 3 Udhagamandalam 3 Palakkodu 4 Kotagiri 4 Poehampalli 5 Coonoor 5 Uthangarai 6 Kundah 6 Harur 7 12. COIMBATORE 12 Pappireddipatti 8 Mettupalayam Dharmapuri 9 Avanashi 2 Pennagaram 10 Tiruppur 3
6. TIRUVANNAMALAI 6 Palladam 4 Arani Coimbatore North 5 Cheyyar 2 Coimbatore South 6 Vandavasi 3 Pollaehi 7 Polur 4 Udumalaipettai 8 Chengam 5 Valparai 9 Tiruvannamalai 6 13. DINDIGUL 13
7. VILUPPURAM 7 Palani
Gingee 1 Oddanehatram 2 Tindivanam 2 Vedasandur 3
Vanur 3 Natham 4 Viluppuram 4 Dindigul 5 Tirukkoyilur 5 Kodaikanal 6 Sankarapuram 6 Nilakkottai 7 Kallakkurichi 7 14. KARUR 14 Ulundurpettai 8 Aravakurichi
8. SALEM 8 Karur 2 Mettur Krishnarayapuram 3 Omalur 2 Kulithalai 4
138

SI.No. State/DistrictiSub-district Code ,No. SI.No. State/DistrictiSub-d istrict Code No.
(1) (2) (3) (1) (2) (3)
15. TIRUCHIRAPPALLI 15 22. PUDUKKOTTAI 22
Thottiyam 1 lIuppur 1
Musiri 2 Kulathur 2
Thuraiyur 3 Gandarvakkottai 3
Manachanallur 4 Pudukkottai 4 Lalgudi 5 Thirumayam 5 Srirangam 6 Alangudi 6 Tiruchirappalli 7 Aranthangi 7 Manapparai 8 Manamelkudi 8
16. PERAMBALUR 16 Avudayarkoil 9
Veppanthattai 1 23. SIVAGANGA 23 Perambalur 2 Tirupathur 1 Kunnam 3 Karaikkudi 2
17. ARIYALUR 17 Devakottai 3
Sendurai 1 Sivaganga 4
Udayarpalayam 2 Manamadurai 5 Ariyalur 3 lIayangudi 6
18. CUDDALORE 18 24. MADURAI 24 Panruti Melur 1 Cuddalore 2 Madurai North 2 Chidambaram 3 Vadipatti 3 Kattumannarkoil 4 Usilampatti 4 Virudhachalam 5 Peraiyur 5 Tittakudi 6 Thirumangalam 6
19. NAGAPATTINAM 19 Madurai South 7
Sirkali 25. THENI 25 Mayiladuthurai 2 Bodinayakanur 1 Tharangambadi 3 Periyakulam 2 Nagapattinam 4 Theni 3 Kilvelur 5 Uthamapalayam 4 Thirukkuvalai 6 Andipatti 5 Vedaranyam 7
26. VIRUDHUNAGAR 26 20. THIRUVARUR 20
Rajapalayam 1 Valangaiman 1
Srivilliputhur 2 Kodavasal 2
Sivakasi 3 Nannilam 3
4 Thiruvarur 4
Virudhunagar
Needamangalam 5 Kariapatti 5
Mannargudi 6 Tiruchuli 6
Thiruthuraipoondi 7 Aruppukkottai 7
Sattur 8 21. THANJAVUR 21
Thiruvidaimarudur 27. RAMANATHAPURAM 27
Kumbakonam 2 Tiruvadanai 1
Papanasam 3 Paramakudi 2
Thiruvaiyaru 4 Mudukulathur 3
Thanjavur 5 Kamuthi 4
Orathanadu 6 Kadaladi 5
Pattukkottai 7 Ramanathapuram 6
Peravurani 8 Rameswaram 7
139

SI.No. State/DistrictlSub-district Code No. SI.No. State/DistrictlSub-district Code No.
(1) (2) (3) (1) (2) (3)
28. THOOTHUKKUDI 28 2. PONDICHERRY 2 Kovilpatti 1 Mannadipet Commune Panchayat 1 Ettayapuram 2 Villianur Commune Panchayat 2 Vilathikulam 3 Ariankuppam Commune Panchayat 3 Ottapidaram 4 Nettapakkam Commune Panchayat 4 Thoothukkudi 5 Bahour Commune Panchayat 5 Srivaikuntam 6 Ozhukarai Municipality 6 Tiruchendur 7
Pondicherry Municipality 7 Sathankulam 8
29. TIRUNELVELI 29 3. MAHE 3
Sivagiri 1 Mahe Municipality
Sankarankoil 2 4. KARAIKAL 4
Veerakeralamputhur 3 Nedungadu Commune Panchayat Tenkasi 4 Kottucherry Commune Panchayat 2 Shenkottai 5 Thirunallar Commune Panchayat 3 Alangulam 6 Neravy Commune Panchayat 4 Tirunelveli 7 Thirumalairayan Patt. Comm. Panch. 5 Palayamkottai 8 Karaikal Municipality 6 Ambasamudram 9 Nanguneri 10 135. ANDAMAN & NICOBAR ISLANDS 35 ] Radhapuram 11
1. ANDAMANS 1 30. KANNIYAKUMARI 30
Diglipur 1 Vilavancode
Mayabunder 2 Kalkulam 2
Thovala 3 Rangat 3
Agastheeswaram 4 Ferrargunj 4
Port Blair 5
134. PONDICHERRY 34 2. NICOBARS 2
1. YANAM 1 Car Nicobar
Yanam Municipality Nancowry 2
140
PART - III
POPULATION STATISTICS


A RABIA N SE A
A
D.N A - Data Not Available
I N D I A N
c
INDIA DECADAL GROWTH RATE 1991-2001
Boundary, International _ Boundary, State/U_T
--- Boundary, District .. .
KILOMETRES 100 50 0 100 200 300 400 500
I
8
GROWTH RATE GAIN
E3 10.00 AND BELOW 10.01 - 20.00
N
E
New AIoor& I. (INOlA)
BAY OF
BENGAL
;l-
MYANMAR (BURMA)
• Coco /s. _ -(MYANMAR)
. ~,.
(INDIA)
o 20.01 - 30.00 _ 30.01 ·40.00 _ 40.01 AND ABOVE
I . 8omln 1
_ (~ (INOlA)
LOSS ...A, ANDAMAN S E A "
0 -2.8 . -1 .5
o C E A N
143

ARABIAN SE A
A
D.NA . Data Not Available
I N D I A N
c
INDIA DENSITY OF POPULATION 2001 Boundary, lntemational . .. Boundary, StateJU.T .
--- Boundary, District .
KILOMETRES 100 50 0 100 200 300 400 500
I N
B E T
New~ f_ (INOlA)
PERSONS PER Km~ 100 AND BELOW 101 ·250 251·500 501-1000 1001 AND ABOVE DATA NOT AVAIlABLE
BAY OF
BENGAL
o C E A N
144
MYANMAR (BURMA)
._ L (NJIA)
""""" '. (INDIA)
-..... ; AN O AMAN SE A
_. INOlRA POINT

A RA B IA N SEA
( .
D.N.A. - Data Not Available
I N D I A N
c
INDIA LEVEL OF URBANISATION 2001
B I Boundary, SlatelU_T - - ----
oundary, Intemationa - - ---- Boundary, District __ .
KILOMETRES 100 50 0 100 200 300 400 500
I
8
N
E
NewMo.:-.re l. (INDIA)
T
BAY OF
BENGAL
PERCENTAGE OF URBAN POPULATION TO TOTAL POPULATION
15.00 AND BELOW 15.01 - 30.00 30.01 - 45.00 45.01 - 60.00 60.01 - 75.00 75.01 AND ABOVE ENTIRELY RURAL
o C E A N
145
MYANMAR (BURMA)
, Coro/s • (""""MAR)
~ ~f"COl"Idam l. (INOlA)
. & rren l.
£~' (INDIA)
-:- :6~ ANOAMAN SE A
INDIRA pOINT
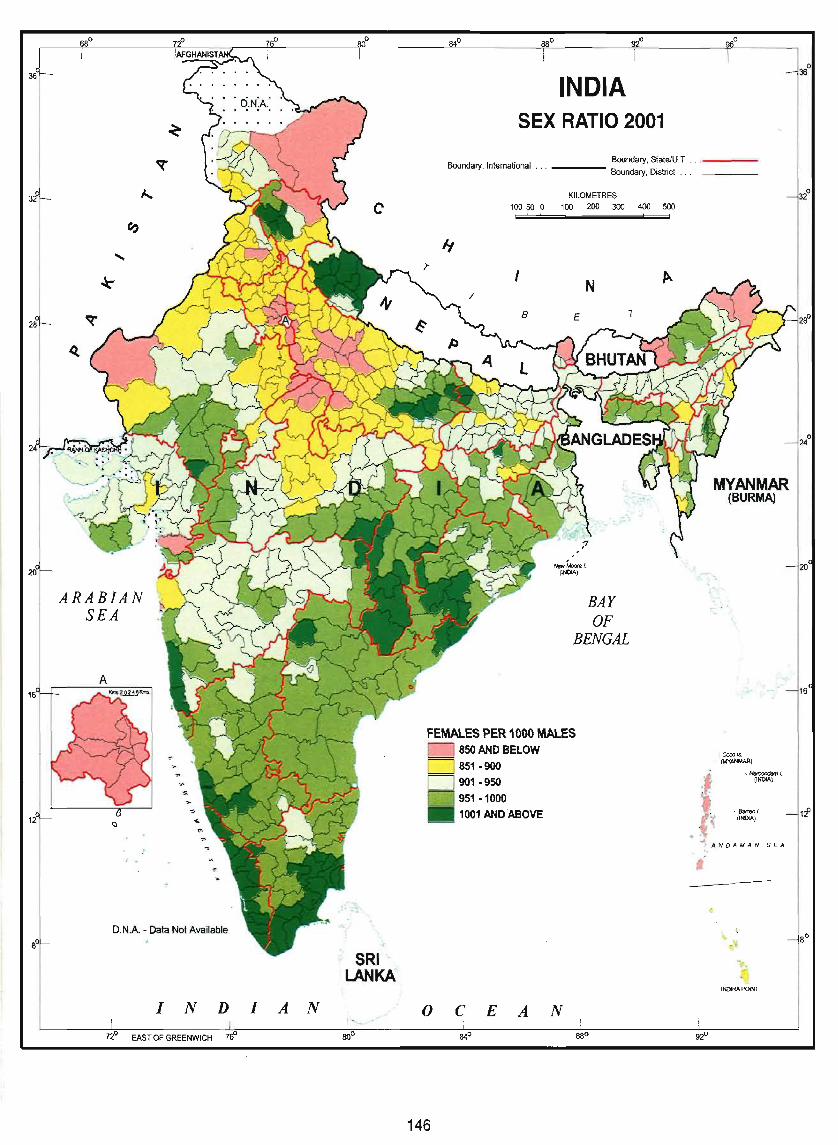
ARABIAN SEA
D.NA - Data Not Available
I N D I A N
c
;~ SRI LANKA
INDIA SEX RATIO 2001
Boundary, State/U.T . Boundary, International . . . --- Boundary, District .
KILOMETRES 100 50 0 100 200 300 400 500
I
8
N
E
, NewMooref.
(INOlA)
T
BAY OF
BENGAL
FEMALES PER 1000 MALES 850 AND BELOW
851 -900
901 -950
951 -1000
1001 AND ABOVE
o C E A N
146
.
MYANMAR (BURMA)
.. Na-oondwn I. ~NDIA)
~-,:. I! ._ 1. {
: _ ~NOiA) '\
'''' ANDAAlAN SEA
Q.
, \
.... 'ti
... INDIRA POiNT

J 20 i i A R A BI AN
I SEA
I 16°
o 12 -
. .
D.N.A. - Data Not Available
I N D I A N
c
INDIA SEX RATIO IN AGE GROUP 0-6
2001 Boundary, International ... Boundary, State/U.T .
--- Boundary, District.
KILOMETRES 100 50 0 100 200 300 400 500
I
8
N
E
NitwMoo..e L (INDIA)
T
BAY OF
BENGAL
FEMALES PER 1000 MALES IN AGE GROUP 0-6 _ 800 AND BELOW
W 801·850 851 ·900
I ! 901 ·950 0 951 . 1000 _ 1001 AND ABOVE
MYANMAR (BURMA)
Coco"-. (MYANMAR)
.""'_1. (INDIA)
, Barren I. (INOlA)
<I' ~ ANDAMAN SE A -.
\ . ,,'5
.~-
tJ INDIRA POINT
o C E A N
147

ARABIAN SEA
, .
D.N.A - Data Not Available
I N D I A N
c
<.;
t SRI 'J ' LANKA :
MAP 42 I
INDIA PROPORTION OF CHILD POPULATION
IN AGE GROUP 0-6 2001 Boundary, State/U. T .
Boundary, International .. . --- Boundary. District . ..
KILOMETRES
100 50 0 100 200 300 400 500
I
8
N
E
NewM0:x9 f. (INDIA)
T
BAY OF
BENGAL
PERCENTAGE OF CHILD POPULATION IN AGE GROUP 0-6 TO TOTAl POPULATION o 12.00 AND BELOW 0 12.01 -14.00
14.01 -16.00 16.01 -18.00 18.01 - 20.00
MYANMAR (BURMA)
, ,
t~?r/~> -~;f"'
.- COcoLs. (MYANMAR)
11 Nam:Jndam ,. (INDIA)
~. , 8arToo ,. p~ {INOLl.)
~ .
,. ',':-
• 20.01 AND ABOVE ~ " .. ", .~ AND A U A NSf A
o C E A N
148

36
32°
20
l
68° I
J.....
C'IJ
.....
~
~
A R A BIAN SEA
A
~
~
D.NA - Data Not Available
I N D I I
72° EAST OF GREENWICH rff
A N
0 80
C
: SRI \ LANKA"
./
)""
84° 68° 92°
INDIA LITERACY RATE 2001
Boundary, International . . .
100 50 0
I'f
I
8
Boundary, StatelU. T Boundary, District ..
KILOMETRES
100 200 300
N
E T
New Moore I. (INDIA)
BAY OF
BENGAL
400 500
~
PERCENTAGE OF LITERATES TO TOTAL POPULATION
, SO.OO AND BELOW
D 50.01 ·60.00 D 60.01 ·70.00 L___J 70.01 • 80.00
80.01 AND ABOVE
o C E 1
A N
84° 88°
149
J
96°
MYANMAR (BURMA)
, Coco /s . • • (MYANMAR)
• Naroondam 1. (U\'DIA.)
. 8at'rerlI.
• {~ (INOlA)
~~ ANDAMAN SEA
"
INDIRA pOINT
° 36
32°
20

A R A BIAN S EA
..
D.N.A. - Data Not Available
I N D I A N
c
INDIA FEMALE LITERACY RATE 2001
Boundary, International . Boundary, StatelU.T .
--- Boundary, District .. .
KILOMETRES 100 50 0 100 200 300 400 500
I
B
N
E
NfJW~f. (INDIA)
T
BAY OF
BENGAL
PERCENTAGE OF FEMALE LITERATES TO TOTAL FEMALE POPULATION _ 30.00 AND BELOW D 30.01 - 40.00 D 40.01 - SO.OO o SO.01 - SO.OO o 60.01 - 70.00
e '
MYANMAR (BURMA)
~. ' ..- • .,._J
. . /.:.- ; ~.\
c CocoJs. • (MYANMAR)
• Nan:cn:iam I. (IK>OA)
""""" (INDIA) o 70.01 AND ABOVE ..,_ :{ ANDAMAN SEA
; ;:
iNDIRA POINT
o C E A N
150

A R A B IAN SE A
A
, .
D.NA . Data Not Available
I N D I A N
c
INDIA WORK PARTICIPATION RATE 2001
Boundary, International .. ' ___ Boundary, State/U.T .. . --Boundary, District .
KILOMETRES 100 50 0 100 200 300 400 500
I N
B E T
N9w~/. (INDIA)
PERCENTAGE OF WORKERS TO TOTAL POPULATION D 35.00 AND BELOW D 35.01 • Ml.OO
Ml.01 - 45.00 o 45.01 · 50.00 _ 50.01 AND ABOVE
o C E A N
151
BAY OF
BENGAL
~ ...
MYANMAR (SURMA)
{' Coc::o/s. • (MYANlAAR)
" NatCCJt1d;;im I. (INDIA)
... 8aaent (INDIA)
-~ ANDAMAN SEA '. ,
"
•
INDIRA POINT

Name of Statel Union Territory/District
2
Ar~ in km2
3 4 5
~ g iii d cj
'0 d Z
6 7 8
Population in '000
Person Male Female
9 .10 11
POPULATION ;
Popu'a~on age group Min '000
Person Male Female
12 13 14
INDIA '3287240.0 313 5,463 6,374 5,161 638,588 '·1,028,737 532,223 496,514 163,820 84,999 78,820
JAMMU AND KASHMIR·
KUPWARA
2 BARAMULA
3 SRINAGAR
4 BADGAM
5 PULWAMA
6 ANANTNAG
7 LEH (LADAKH)
8 KARGIL
9 DODA
10 UDHAMPUR
11 PUNCH
12 RAJAURI
13 JAMMU
14 KATHUA
2 HIMACHAL PRADESH
CHAMBA
2 KANGRA
3 LAHUL AND SPITI
4 KULLU
5 MANDl
6 HAMIRPUR
7 UNA
8 BILASPUR
9 SOLAN
10 SIRMAUR
11 SHIMLA
12 KINNAUR
3 PUNJAB
GURDASPUR
222236.0
2379.0
4588.0
2228.0
1371.0
1398.0
3984.0
45110.0
14036.0
11691.0
4550.0
1674.0
2630.0
3097.0
2651.0
55673.0
6522.0
5739.0
13841.0
5503.0
3950.0
1118.0
1540.0
1167.0
1936.0
2825.0
5131.0
6401.0
50362.0
3551.0
46
273
255
540
459
467
294
3
9
59
163
223
184
513
208
109
71
233
2
69
228
369
291
292
259
162
141
12
484
593
59
3
8
3
3
4
5
2
7
5
3
6
5
4
109
10
19
3
6
16
6
5
4
7
10
17
6
72
5
121
9
14
4
8
6
10
6
7
14
12
5
7
11
8
72
7
13
2
5
10
5
4
3
5
6
9
3
138
14
75
2
9
3
5
6
9
6
8
6,652
370
652
170
483
551
620
113
129
661
602
179
4 385
14 1,162
6 575
57 20,118
5 1,591
9 3,868
o 521
4 172
5 3,338
4 1,672
5 814
4 1,061
8 2,536
3 971
10 2,914
o 660
157 12,673
14 1,617
10,144
650
1,170
1,202
629
653
1,172
117
119
692
744
373
483
1,589
550
6,078
461
1,339
33
382
901
413
448
341
501
459
723
78
24,359
2,104
5,361
341
615
649
326
336
610
64
65
364
400
194
4,783
309
555
553
303
317
562
53
54
328
178
257 226
850 738
289 261
3,088 2,990
235 226
661 678
18 15
198 184
448 453
197 216
225 224
171 170
270 230
241 217
381 342
42 36
12,985 11,374
1,113 991
'Excludes entire area of those protion of Jammu and Kashmir which are under illegal occupation of Pakistan and China
.. Including estimated population of Mao Maran, Paomata & Purul Sub-divisions of Senapati district of Manipur.
152
1,486
113
185
129
98
85
177
13
19
119
121
67
79
199
81
793
70
165
4
53
120
51
60
43
66
68
85
9
3,172
280
765
56
94
66
49
42
89
7
10
61
63
34
42
109
44
418
36
90
2
27
63
27
33
23
35
35
44
5
1,764
157
720
57
91
63
49
43
88
6
10
58
59
33
38
89
37
375
34
75
2
26
57
23
27
2(l
31
33
41
5
1,408
124

STATISTICS 2001 ~ c:
0 '= '= .,
.lll ~ ::l
Q.
c:& (ij& ~~
.... _ ::l ..
0::: 0 _-o~ 00
Urban population in '000 Rural population in '000 Ql- Ql- Literacy rate Work participation rate Cl)C: Cl)C:
~i ~~ ~~ ~i
Person Male Female Person Male Female l& 0..& Person Male Female Person Male Female
15 16 17 18 11) 20 21 22 23 24 25 26 27 28
286,120 150,554 135,566 742,618 381,669 360,949 27.82 72.18 64.80 75.30 53.70 39.10 51.70 25.60
2,517 1,383 1,133 7,627 3,978 3,649 24.83 75.20 55.50 66.60 43.00 37.00 50.00 22.50
25 15 10 625 326 299 3.85 96.15 43.24 56.10 28.68 32.67 45.34 18.69
196 106 91 973 509 464 16.75 83.16 45.41 57.11 32.28 31,76 46.83 15.06
946 516 431 256 134 122 78.70 21.30 59.75 69.57 48.07 31.99 50.14 10.68
71 38 33 559 288 271 11.29 88.87 42.53 53.50 30.57 35.91 48.53 22.34
69 36 32 584 299 285 10.57 89.43 49.60 60.66 37.73 32.58 46.95 17.36
168 91 n 1,004 519 485 14.33 85.67 46.54 57.58 34.42 33.69 45.95 20.39
29 18 11 89 47 42 24.79 76.07 65.34 75.55 52.70 49.58 58.32 38.97
11 7 4 109 58 51 9.24 91.60 60.85 75.83 42.38 46.64 50.08 42.53
48 28 20 644 336 308 6.94 93.06 47.90 63.99 29.85 46.00 52.72 38.56
117 69 47 627 330 296 15.73 84.27 55.21 67.07 41.20 49.28 57.83 39.35
24 14 10 349 180 168 6.43 93.57 51.19 65.04 35.96 53.97 57.68 49.93
34 19 14 450 238 212 7.04 93.17 57.99 69.76 44.51 45.15 52.15 37.19
701 384 318 888 467 421 44.12 55.88 77.02 84.45 68.55 33.25 50.56 13.32
79 43 36 471 246 225 14.36 85.64 65.57 75.71 54.44 37.34 50.64 22.58
596 332 264 5,482 2,756 2,726 9.79 90.15 76.50 85.30 67.40 49.20 54.60 43.70
35 19 16 426 217 210 7.59 92.41 62.91 76.41 48.85 50.00 53.87 45.97
72 38 34 1,267 623 643 5.38 94.62 80.08 87.54 73.01 43.99 50.73 37.41
o 0 0 33 18 15 0.00 100.00 73.10 82.82 60.70 63.47 68.35 57.39
30 17 13 351 181 170 7.85 91.88 72.90 83.98 60.88 56.74 60.30 52.91
61 32 29 840 416 425 6.77 93.23 75.24 85.94 64.82 50.40 52.64 48.19
30 16 14 382 180 202 7.26 92.49 82.46 90.15 75.70 49.77 50.90 48.74
39 21 19 409 204 205 8.71 91.29 80.37 87.73 73.18 44.99 52.90 37.05
22 12 10 319 159 159 6.45 93.55 77.76 86.04 69.55 48.90 52.22 45.56
91 56 35 409 214 195 18.16 81.64 76.57 84.75 66.89 52.63 61.15 42.63
48 26 22 411 216 195 10.46 89.54 70.39 79.36 60.37 49.25 56.37 41.35
167 96 72 555 285 270 23.10 76.76 79.12 87.19 70.07 51.24 57.52 44.24
o 0 0 78 42 36 0.00 100.00 75.20 84.30 64.40 61.03 66.49 54.67
8,263 4,468 3,794 16,096 8,517 7,580 33.93 66.08 69.70 75.20 63.40 37.50 53.60 19.10
535 286 249 1,569 827 742 25.43 74.57 73.77 79.78 67.15 33.30 51.29 1308
153

Name of Statel Union Territory/District
2
2 AMRITSAR
3 KAPURTHALA
4 JALANDHAR
5 HOSHIARPUR
6 NAWANSHAHR
7 RUPNAGAR
8 FATEHGARH SAHIB
9 LUDHIANA
10 MOGA
11 FIROZPUR
12 MUKTSAR
13 FARIDKOT
14 BATHINDA
15 MANSA
16 SANGRUR
17 PATIALA
4 CHANOIGARH
1 CHANDIGARH
5 UTTARANCHAL.
1 UTIARKASHI
2 CHAMOLI
3 RUDRAPRAYAG
4 TEHRI GARHWAL
5 DEHRADUN
6 GARHWAL
7 PITHORAGARH
8 BAGESHWAR
9 ALMORA
10 CHAMPAWAT
11 NAINITAL
12 UDHAM SINGH NAGAR
13 HARDWAR
Area in kw
3
5088.0
1633.0
2624.0
3386.0
1282.0
2113.0
1180.0
3578.0
2235.0
5328.0
2593.0
1458.0
3353.0
2198.0
5108.0
3654.0
4
609
462
748
437
458
528
456
848
400
328
306
378
353
313
392
505
114.0 7.900
114.0 7,900
53483.0
8016.0
8030.0
1984.0
3642.0
3088.0
5329.0
7090.0
2246.0
3139.0
1766.0
4251.0
2542.0
2360.0
159
37
46
115
166
415
131
65
111
201
127
179
486
613
5
7
4
5
4
2
4
4
7
3
5
3
2
3
3
6
5
49
4
6
2
5
4
6
5
2
3
4
4
3
6
16
5
10
10
5
7
5
11
5
10
4
2
7
5
13
9
95
6
9
3
9
6
15
8
5
9
4
8
7
6
7
13
7
14
12
4
11
5
12
4
9
4
3
9
5
17
14
8
1,233
690
950
1,417
471
889
444
915
329
1,004
234
171
284
240
101
1,084
24
24
86 16,826
3 699
6 1,244
2 691
7 1,867
14 759
6 3,483
4 1,672
4
4
8
17
10
957
2,274
717
1148
688
627
154
Population in '000
Person
9
3,096
755
1,963
1,481
587
1,116
538
3,033
895
1,746
777
551
1,183
689
2,000
1,845
901
901
8,489
295
370
227
605
1,282
691
462
249
631
225
763
1,236
1,447
Male Female
10
1,651
400
1,040
765
307
597
290
1,663
474
926
411
293
633
366
1,069
987
507
507
4.326
152
184
108
295
680
331
228
119
294
111
400
649
776
11
1,445
355
923
716
281
520
248
1,370
421
820
366
258
550
322
931
858
394
394
4,163
143
187
120
310
603
366
235
131
337
113
363
586
671
POPULATION
Population age group 0-6 in '000
Person Male Female
12
429
95
230
184
71
143
66
371
116
258
105
74
149
96
264
240
116
116
1.360
50
56
36
99
172
101
72
41
97
40
114
219
263
13
240
53
127
102
39
79
38
204
64
141
58
41
84
54
148
135
63
63
713
26
29
18
51
91
52
38
21
50
21
59
115
141
14
189
42
103
83
32
63
29
167
52
116
47
33
66
42
116
105
53
53
647
24
21
18
47
81
49
34
20
47
19
54
105
122

STATISTICS 2001
Urban population in '000
Person
15
1,223
247
932
292
81
362
151
1,694
179
451
199
194
352
142
585
645
809
809
2,179
23
51
3
60
679
90
60
8
55
34
269
403
446
Male
16
657
134
501
154
42
193
82
950
95
242
105
104
189
76
313
345
450
450
1,181
13
30
2
37
364
49
33
4
31
18
143
215
242
Female
17
566
113
431
138
39
169
69
744
84
208
93
90
163
67
272
300
358
358
998
10
21
23
314
41
27
3
24
16
126
188
204
Rural population in '000
Person
18
1,873
508
1,031
1,189
506
754
387
1,339
716
1,295
579
357
832
546
1,415
1,200
92
92
6,310
272
320
225
545
603
607
402
242
576
191
494
833
1.001
Male
19
994
266
539
611
265
403
208
713
379
684
306
189
444
291
757
643
57
57
3,145
139
154
106
258
315
282
195
114
263
93
257
435
534
Female
20 21
879 39.50
242 32.72
492 47.48
578 19.72
242 13.80
351 32.44
179 28.07
627 55.85
337 20.00
612 25.83
273 25.61
168 35.21
387 29.75
256 20.61
659 29.25
558 34.96
35 89.77
35 89.77
3,166 25.69
133 7.80
165 13.78
119 1.32
287 9.92
288 52.96
325 12.91
208 12.99
127 3.13
313 8.72
98 15.04
237 35.26
398 32.61
467 30.82
155
22
60.50
67.28
52.52
80.28
86.20
67.56
71.93
44.15
80.00
74.17
74.52
64.79
70.33
79.25
70.75
65.04
10.23
10.23
74.34
92.20
86.49
99.12
90.08
47.04
87.09
87.01
96.87
91.28
84.96
64.74
67.39
69.18
Literacy rate
Person Male Female
23
67.27
73.93
78.04
81.02
76.43
78.08
73.65
76.50
63.52
60.69
58.20
61.95
61.18
52.41
59.98
69.78
81.94
81.94
71.60
65.71
75.43
73.65
66.73
78.98
77.49
75.95
71.29
73.64
70.39
78.36
64.86
63.75
24
12.61
79.02
82.49
86.45
82.86
83.97
78.27
80.25
68.01
68.73
65.39
68.15
67.78
58.90
65.81
75.88
86.14
86.14
83.30
83.60
89.66
89.81
85.33
85.87
90.91
90.06
87.65
89.20
87.27
86.32
75.22
73.83
25
61.26
68.29
73.08
75.32
69.52
71.40
68.31
71.95
58.52
51.72
50.25
55.03
53.70
45.18
53.38
62.86
76.47
76.47
59.60
46.69
61.63
59.57
49.42
71.20
65.70
62.59
56.98
60.56
54.18
69.55
53.35
52.10
Work participation rate
Person
28
35.92
34.82
34.48
34.67
44.89
39.18
38.31
37.91
40.09
37.15
39.82
38.08
42.31
40.87
40.70
36.96
37.80
37.80
36.90
46.07
44.48
44.86
Male Female
27 28
52.76 16.69
52.82 14.56
53.69 12.83
50.63 17.61
55.54 33.23
52.59 23.80
54.93 18.86
55.55 16.49
53.93 24.49
53.27 18.94
54.96 22.81
53.52 20.58
55.19 27.51
54.31 25.59
54.73 24.59
53.58 17.83
58.11 14.22
56.11 14.22
46.10 27.30
48.28 43.71
44.90 44.60
42.32 47.15
43.77 45.06 42.54
31.23 47.78 12.57
38.71 40.79 36.84
42.98 43.40 42.58
47.64 45.14 49.90
46.34 44.52 47.92
40.17 43.49 36.93
36.56 48.06 23.88
31.74 . 48.03 13.68
29.39 47.20 8.79
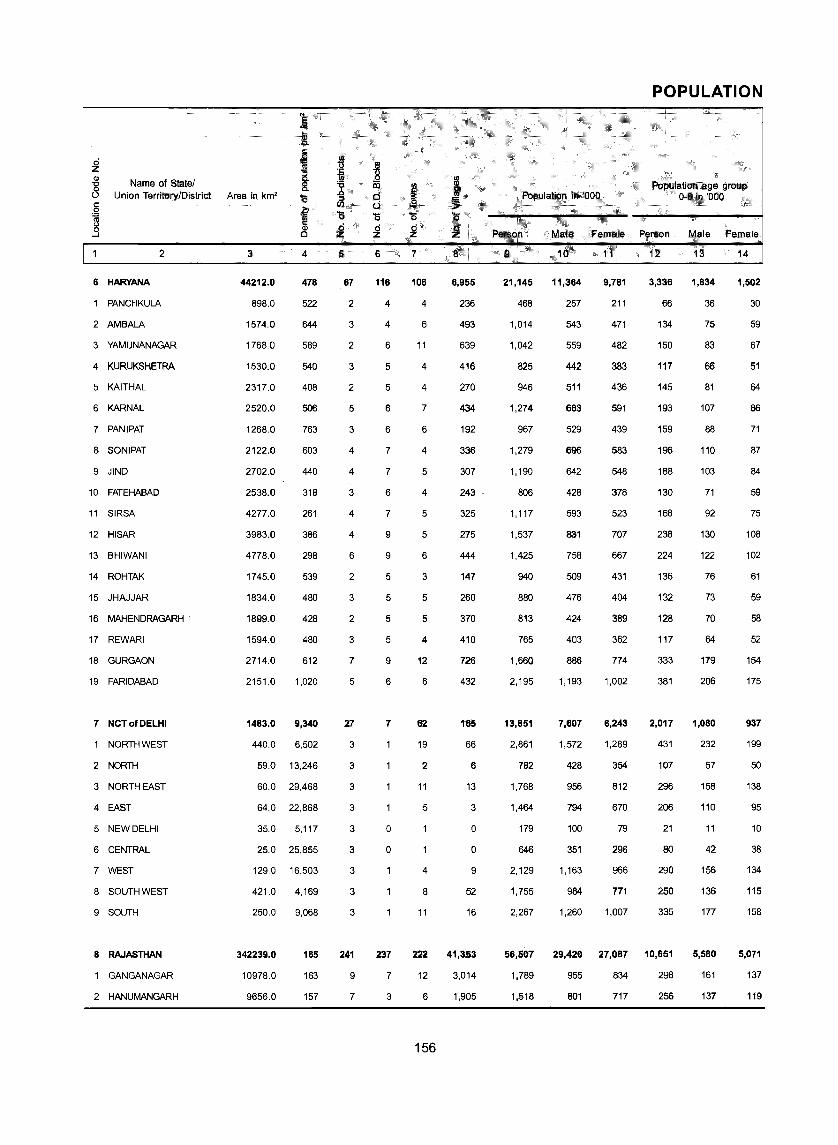
Name of Stater Union Territory/District
2
6 HARYANA
1 PANCHKULA
2 AMBALA
3 YAMUNANAGAR
4 KURUKSHETRA
5 KAITHAL
6 KARNAL
7 PANIPAT
8 SONIPAT
9 JIND
10 FATEHABAD
11 SIRSA
12 HISAR
13 BHIWANI
14 ROHTAK
15 JHAJJAR
16 MAHENDRAGARH
17 REWARI
18 GURGAON
19 FARIDABAD
7 NeT of DELHI
1 NORTHWEST
2 NORTH
3 NORTHEAST
4 EAST
5 NEW DELHI
6 CENTRAL
7 WEST
8 SOUTHWEST
9 SOUTH
8 RAJASTHAN
1 GANGANAGAR
2 HANUMANGARH
Area in km2
3 4
44212.0 478
898.0 522
1574.0 644
1768.0 589
1530.0 540
2317.0 408
2520.0 506
1268.0 763
2122.0 603
2702.0 440
2538.0 318
4277.0 261
3983.0 386
4778.0 298
1745.0 539
1834.0 480
1899.0 428
1594.0 480
2714.0 612
2151.0 1,020
1483.0 9,340
440.0 6,502
59.0 13,246
60.0 29,468
64.0 22,868
35.0 5,117
25.0 25,855
129.0 16,503
421.0 4,169
250.0 9,068
342239.0 165
10978.0 163
9656.0 157
5
67
2
3
2
3
2
5
3
4
4
3
4
4
6
2
3
2
3
7
5
27
3
3
3
3
3
3
3
3
3
241
9
7
I d c..:i '0 d z
6 7
116 106
4 4
4 6
6 11
5 4
5 4
6 7
6 6
7 4
7 5
6 4
7 5
9 5
9 6
5 3
5 5
5 5
5 4
9 12
6 6
7 62
o
o
19
2
11
5
4
8
11
Population ill '000
Person Male Female
S 9 10
6,955 21,145 11,364
236 468 257
493 1,014 543
639 1,042 559
416 825 442
270 946 511
434 1,274 683
192 967 529
336 1,279 696
307 1,190 642
243 ' 806 428
325 1,117 593
275 1,537 831
444 1,425 758
147 940 509
260 880 476
370 813 424
410 765 403
726 1,660 886
432 2,195 1,193
165 13,851 7,607
66
6
13
3
o
o
9
52
16
2,861
782
1,768
1,464
179
646
2,129
1,755
2,267
1,572
428
956
794
100
351
1,163
984
1,260
11
9,781
211
471
482
383
436
591
439
583
548
378
523
707
667
431
404
389
362
774
1,002
6,243
1,289
354
812
670
79
296
966
771
1,007
POPULATION
Population age grollp 0-6 in '000
Person Male Female
12 13
3,336 1,834
66 36
134 75
150 83
117 66
145 81
193 107
159 88
196 110
188 103
130 71
168 92
238 130
224 122
136 76
132 73
128 70
117 64
333 179
381 206
2,017 1,080
431
107
296
206
21
80
290
250
335
232
57
158
110
11
42
156
136
177
14
1,502
30
59
67
51
64
86
71
87
84
59
75
108
102
61
59
58
52
154
175
937
199
50
138
95
10
38
134
115
158
237 222 41,353 56,5G7 29,42G 27,087 1G,651 5,580 5,071
137
119
7 12 3,014 1,789 955 834 298 161
3 6 1,905 1,518 801 717 256 137
156

STATISTICS 2001
Urban population in '000
Person
15
6,115
208
357
393
216
183
338
392
321
242
142
293
398
270
330
195
110
136
369
1,221
12,906
2,596
735
1,627
1,445
179
646
2,042
1,530
2,106
13,214
453
304
Male
16
3,311
112
193
212
117
99
181
216
174
130
76
156
216
145
177
107
58
74
198
669
7,085
1,425
402
880
784
100
351
1,114
860
1,170
6,993
246
162
Female
17
2,804
96
164
181
99
85
156
176
147
112
67
137
182
125
153
88
51
63
171
552
5,821
1,171
333
747
661
79
296
928
669
937
6,221
208
142
Rural population In '000
Person
18
15,029
260
657
649
610
763
936
575
958
948
664
823
1,139
1,155
611
685
703
629
1,291
973
945
265
47
142
18
87
225
161
43,293
1,336
1,214
Male
19
8,053
145
350
348
326
412
502
313
522
512
352
437
615
613
332
369
365
329
688
524
522
147
26
77
10
49
123
90
22,427
710
640
Female
20 21 22
6,976 28.92 71.080
115 44.44 55.56
307 35.21 64.79
301 37.72 62.28
284 26.18 73.94
351 19.34 80.66
434 26.53 73.47
262 40.54 59.46
436 25.10 74.90
436 20.34 79.66
312 17.62 82.38
386 26.23 73.68
524 25.89 74.11
542 18.95 81.05
278 35.11 65.00
316 22.16 77.84
338 13.53 86.47
300 17.78 82.22
603 22.23 77.77
450 55.63 44.33
423 93.18 6.82
119 90.74 9.26
21 93.99 6.01
65 92.02 8.03
8 98.70 1.23
- 100.00
- 100,00
37 95.91
102 87.18
70 92.90
20,866 23.39
626 25.32
575 20.03
157
0.00
0.00
4.09
12.82
7.10
76.61
74.68
79.97
Literacy rate Work participation rate
Person Male Female Person Male Fem!ile
23
67.90
74.00
75.31
71.63
69.88
59.02
67.74
69.17
72.79
62.12
57.98
60.55
64,83
67.45
73.72
72.38
69.89
75.25
62.91
70.03
81.70
80.57
80.10
77.53
84,91
83.24
79.69
83.39
83.61
81.96
60.40
64.74
63.05
24 25
78.50 55.70
80.87 65.65
82.31 67.39
78.82 63.39
78.06 60.61
69.15 47.31
76.29 57.97
78.50 57.97
83.06 60.68
73.82 48.51
68.22 46.53
70.05 49.93
76.57 51.08
80.26 53.00
83.23 62.59
83.27 59.65
84.72 54.08
88.45 60.83
76.17 47.78
81.52 56.31
87.30 740.70
86.67 73.08
84.64 74.54
84.78 68.94
89.65 79,26
88.62 76.33
82.73 76.05
87.85 77.99
89.86 75.55
88.26 73.94
75.70 43.90
75.53 52.44
75.18 49.56
26
39.60
38.14
31.99
32.31
37.36
39.32
35.74
39.57
40.89
43.87
45.03
42.59
43.30
42.76
39.47
44.17
43.31
43.59
37.92
35.80
32.80
32.14
32.83
28.30
32.48
37.74
34.63
33.86
34.33
34.34
42.10
40.22
41.39
27 28
SO.30 27.20
54.54 18.22
50.95 10.16
50.10 11.66
51.19 21.40
50.87 25.79
50.18 19.05
51.03 25.75
49.65 30.44
51.56 34.85
54.42 34.40
53.05 30.73
51.87 33.22
49.24 35.38
49.33 27.83
51.38 35.66
48.00 38.20
49.72 36.77
46.84 27.72
48.32 20.90
52.10 9.40
51.21 8.89
53.23 8.16
47.70 5.46
5;2.08 9.22
55.25 15.62
55.89 9.40
53.05 10.76
52.97 10.57
53.07 10.91
50.00 33.50
53.55 24.96
51.67 29.89

ci z
~ i ....I
Name of StateJ Union Territory/District
2
3 BIKANER
4 CHURU
5 JHUNJHUNUN
6 ALWAR
7 BHARATPUR
8 DHAULPUR
9 KARAULI
10 SAWAI MADHOPUR
11 DAUSA
12 JAIPUR
13 SIKAR
14 NAGAUR
15 JODHPUR
16 JAISALMER
17 BARMER
18 JALOR
19 SIROHI
20 PAll
21 AJMER
22 TONK
23 BUNDI
24 BHILWARA
25 RAJSAMAND
26 UDAIPUR
27 DUNGARPUR
28 BANSWARA
29 CHlTIAURGARH
30 KOTA
31 BARAN
32 JHALAWAR
9 UTIARPRADESH
SAHARANPUR
2 MUZAFFARNAGAR
3 BIJNOR
Area in km"
3
27244.0
16830.0
5928.0
8380.0
5066.0
3033.0
5524.0
4498.0
3432.0
11143.0
7732.0
17718.0
22850.0
38401.0
28387.0
10640.0
5136.0
12387.0
8481.0
7194.0
5776.0
10455.0
3860.0
13419.0
3770.0
5037.0
10856.0
5217.0
6992.0
6219.0
240928.0
3689.0
4008.0
4561.0
4
61
114
323
357
415
324
219
248
384
471
296
157
126
13
69
136
166
147
257
168
167
193
256
196
294
298
166
301
146
190
690
785
884
687
5 6
7 4
7 7
6 8
12 14
10 9
5 4
6 5
7 5
5 5
13 13
6 8
10 11
7 9
3 3
8 8
7 7
5 5
9 10
9 8
7 6
5 4
12 11
7 7
10 11
4 5
5 8
13 14
5 5
8 7
7 6
300 809
4 11
5 14
5 11
.~ F '0 ci z
7 8
3 778
11 979
13 859
9 1,994
9 1,472
3 802
3 798
4 794
5 1,058
11 2,131
9 992
12 1,500
4 1,063
2 637
2 1,941
3 706
5 462
11 949
9 1,038
7 1,093
7 849
8 1,745
5 987
10 2,351
3 858
3 1,504
8 2,395
11 892
6 1,207
8 1,600
704 107,452
13 1,606
21 1,025
21 2,989
158
Population in '000
Person Male Female
POPULATION
Population age group 0-6 in '000
Person Male Female
9 10 11 12 13 14
1,674 886 788 327 170 156
1,924 988 936 384 201 183
1,914 984 930 335 180 155
2,993 1,587 1,406 582 308 274
2,101 1,133 968 428 228 200
983 538 445 220 118 102
1,210 652 558 249 133 116
1,117 591 526 207 109 98
1,317 693 624 265 139 126
5,251 2,768 2,483 919 484 435
2,266 1,173 1,115 419 222 197
2,775 1,425 1,350 527 275 252
2,887 1,514 1,373 557 290 267
508 279 229 112 60 52
1,965 1,038 927 436 227 209
1,449 738 711 311 162 149
851 438 413 169 88 81
1,820 919 901 338 176 162
2,182 1,130 1,052 374 194 179
1,212 626 585 224 116 108
963 505 458 175 91 83
2,014 1,027 987 360 185 175
987 493 494 180 93 87
2,633 1,336 1,297 492 252 239
1,108 548 560 232 118 113
1,502 761 741 315 161 155
1,804 918 885 311 161 150
1,569 827 741 251 131 120
1,022 535 487 190 99 91
1,180 613 568 209 108 101
166,198 87,565 78,633 31,625 16,509 15,116
2,897 1,553 1,344 538 288 251
3,543 1,894 1,650 678 365 313
3,132 1,652 1,480 616 323 293

STATISTICS 2001
Urban population in '000
Person
15
595
536
395
435
409
177
172
213
136
2,592
473
477
977
76
145
110
151
391
875
253
180
415
129
490
81
107
289
839
172
168
34,540
748
904
761
Mate
16
317
277
208
237
219
95
92
113
72
1,379
246
249
520
43
78
58
81
204
460
130
94
219
67
258
42
56
151
445
90
88
18,408
400
480
400
Female
17
278
259
187
198
190
82
80
100
64
1,213
227
228
457
34
67
52
70
187
415
123
85
196
62
233
39
52
139
394
82
80
16,132
348
424
361
c:
t c:;~ (U
08-:>~ ..,.-0,9
Rural population In '000 (l)c: J,g
Person
18
1,079
1,388
1,519
2,558
1,692
807
1,038
904
1,181
2,659
1815
2,298
1,909
432
1,819
1,339
700
1,429
1,307
959
783
1,599
858
2,143
1,027
1,394
1,514
730
850
1,012
131,658
2,149
2,639
2,370
Male
19
569
711
776
1,350
914
443
560
479
622
1,389
927
1,176
994
236
960
680
357
715
670
496
410
808
427
1,078
506
705
768
382
445
524
69,157
1,153
1,414
1,252
C:..!l! ~5.
Female &:8-20 21
510 35.54
677 27.86
743 20.64
1,208 14.53
778 19.47
364 18.01
477 14.21
426 19.07
560 10.33
1,270 49.36
888 20.67
1,122 17.19
915 33.84
196 14.96
860 7.38
659 7.59
343 17.74
715 21.48
637 40.10
462 20.87
373 18.69
791 20.61
432 13.07
1,065 18.61
521 7.31
689 7.12
747 16.02
347 53.47
404 16.83
488 14.24
62,501 20.78
996 25.82
1,225 25.52
1,118 24.30
159
c:;
~ 5. 0 !o.
:l'ai 0:::15 ........ 00
Ii c:'ai ~"[ If 8-
22
64.46
72.14
79.36
85.47
80.53
82.10
85.79
80.93
89.67
50.64
79.33
82.81
66.12
85.04
92.57
92.41
82.26
78.52
59.90
79.13
81.31
79.39
86.93
81.39
92.69
92.81
83.92
46.53
83.17
85.76
79.22
74.18
74.48
75.67
Person
23
56.91
66.81
73.04
61.74
63.57
60.13
63.38
56.67
61.84
69.90
70.47
57.28
56.67
50.97
58.99
46.49
53.94
54.39
64.65
51.97
55.57
50.74
55.65
58.62
48.57
44.63
54.09
73.53
59.50
57.32
56.30
61.22
60.67
58.08
Literacy rate
Male
24
70.05
79.69
86.09
78.09
80.54
75.09
79.54
75.74
79.35
82.80
84.34
74.10
72.96
66.26
72.76
64.72
69.89
72.20
79.37
70.52
71.68
67.39
73.99
73.62
66.04
60.45
71.30
85.23
75.78
73.31
68.80
70.91
71.91
68.78
Female
25
42.03
53.35
59.51
43.28
43.56
41.84
44.39
35.17
42.32
55.52
56.11
39.67
38.64
32.05
43.45
27.80
37.15
36.48
48.86
32.15
37.79
33.48
37.59
43.26
31.77
28.43
36.39
60.43
41.55
40.02
42.20
50.00
47.81
46.10
Work partlcrpation rate
Person
26
39.51
44.38
39.76
48.74
40.59
43.66
39.94
42.00
41.19
35.50
38.81
40.70
38.28
41.65
46.81
50.19
40.41
39.82
39.27
43.96
47.47
46.67
40.71
41.81
47.97
47.24
51.58
34.51
42.71
47.00
32.50
28.22
33.11
28.24
Male Female
27 28
50.17 27.52
50.01 38.44
46.53 32.61
53.05 43.88
47.08 32.99
51.68 33.97
44.83 34.22
47.73 35.55
45.76 36.12
47.36 22.28
45.81 31.45
48.07 32.93
48.43 27.09
51.73 29.37
51.30 41.78
54.14 46.09
50.12 30.11
48.53 30.94
49.79 27.97
49.28 38.27
53.78 40.51
54.42 38.61
51.41 30.02
51.49 31.83
51.35 44.67
50.49 43.92
56.75 46.23
48.05 19.41
49.18 35.60
53.90 39.55
46.80 16.50
47.14 6.34
49.00 14.86
46.45 7.92
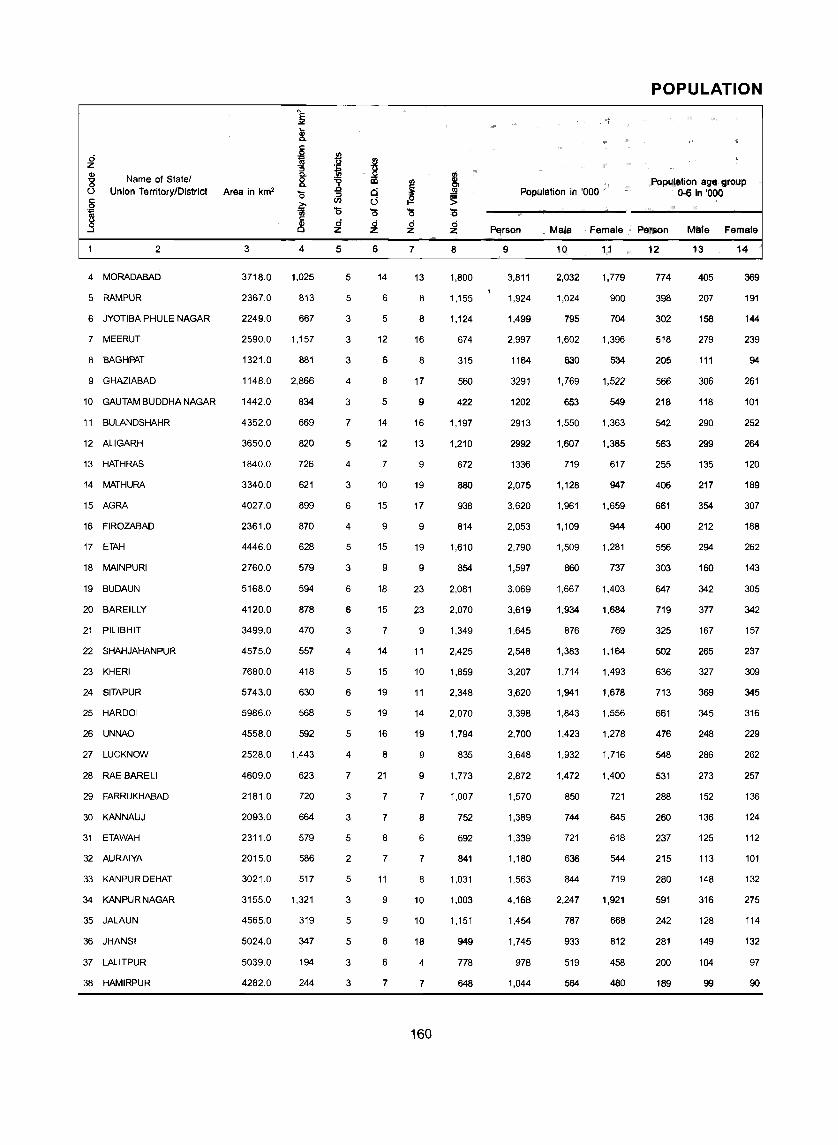
Name of Statel Union TerritorylDistrict
2
4 MORADABAD
5 RAMPUR
6 JYOTIBA PHULE NAGAR
7 MEERUT
8 BAGHPAT
9 GHAZIABAD
10 GAUTAM BUDDHA NAGAR
11 BULANDSHAHR
12 ALiGARH
13 HATHRAS
14 MATHURA
15 AGRA
16 FIROZABAD
17 ETAH
18 MAINPURI
19 BUDAUN
20 BAREILLY
21 PILlBHIT
22 SHAHJAHANPUR
23 KHERI
24 SITAPUR
25 HARDOI
26 UNNAO
27 LUCKNOW
28 RAE BARELI
29 FARRUKHABAD
30 KANNAUJ
31 ETAWAH
32 AURAIYA
33 KANPUR DEHAT
34 KANPUR NAGAR
35 JALAUN
36 JHANSI
37 LALiTPUR
38 HAMIRPUR
Area in km2
3 4
3718.0 1,025
2367.0 813
2249.0 667
2590.0 1,157
1321.0 881
1148.0 2,866
1442.0 834
4352.0 669
3650.0 820
1840.0 726
3340.0 621
4027.0 899
2361.0 870
4446.0 628
2760.0 579
5168.0 594
4120.0 878
3499.0 470
4575.0 557
7680.0 418
5743.0 630
5986.0 568
4558.0 592
2528.0 1,443
4609.0 623
2181.0 720
2093.0 664
2311.0 579
2015.0 586
3021.0 517
3155.0 1,321
4565.0 319
5024.0 347
5039.0 194
4282.0 244
5
5
5
3
3
3
4
3
7
5
4
3
6
4
5
3
6
6
3
4
5
6
5
5
4
7
3
3
5
2
5
3
5
5
3
3
6
14
6
5
12
6
8
5
14
12
7
10
15
9
15
9
18
15
7
14
15
19
19
16
8
21
7
7
8
7
11
9
9
8
6
7
'" ! '0 o z
7
13
8
8
16
8
17
9
16
13
9
19
17
9
19
9
23
23
9
11
10
11
14
19
9
9
7
8
6
7
8
10
10
18
4
7
160
8
1,800
1,155
1,124
674
315
560
422
1,197
1.210
672
880
938
814
1,610
854
2,081
2,070
1,349
2,425
1,859
2,348
2,070
1,794
835
1,773
1,007
752
692
841
1,031
1,003
1,151
949
778
648
Population In '000
Person
9
3,811
1,924
1,499
2,997
1164
3291
1202
2913
2992
1336
2,075
3,620
2.053
2,790
1,597
3,069
3,619
1,645
2,548
3,207
3,620
3,398
2,700
3,648
2,872
1,570
1,389
1,339
1,180
1,563
4.168
1,454
1,745
978
1,044
Male Female
10
2,032
1,024
795
1,602
630
1,769
653
1,550
1,607
719
1,128
1,961
1,109
1,509
860
1,667
1,934
876
1,383
1,714
1,941
1,843
1,423
1,932
1,472
850
744
721
636
844
2,247
787
933
519
564
11
1,779
900
704
1,396
534
1,522
549
1,363
1.385
617
947
1.659
944
1.281
737
1,403
1,684
769
1,164
1,493
1.678
1,556
1,278
1.716
1,400
721
645
618
544
719
1,921
668
812
458
480
POPULATION
Population age group 0-6 in '000
Parson Mate Female
12
774
398
302
518
205
566
218
542
563
255
406
661
400
556
303
647
719
325
502
636
713
661
476
548
531
288
260
237
215
280
591
242
281
200
189
13
405
207
158
279
111
306
118
290
299
135
217
354
212
294
160
342
377
167
265
327
369
345
248
286
273
152
136
125
113
148
316
128
149
104
99
14
369
191
144
239
94
261
101
252
264
120
189
307
188
262
143
305
342
157
237
309
345
316
229
262
257
136
124
112
101
132
275
114
132
97
90

STATISTICS 2001
Urban population In '000
Person
15
1,164
480
368
1,452
229
1,816
449
674
865
264
587
1,568
623
484
233
557
1,191
294
526
346
433
407
412
2,321
274
342
232
308
169
108
2,798
341
712
142
174
Male
16
617
253
194
775
123
976
247
357
461
141
318
847
332
256
123
295
631
156
282
184
227
216
217
1,229
143
182
122
163
90
58
1,509
182
380
75
94
Female
17
547
228
174
677
107
841
203
317
404
124
269
721
291
227
110
262
561
138
244
161
206
191
195
1,092
131
159
110
145
79
50
1,288
158
331
67
80
c:
i "5 Q.
1:8.
~~ '15-.s
Rural population In '000 t~ Person
18
2,647
1,443
1,131
1,545
935
1,474
753
2,239
2,128
1,072
1,487
2,053
1,430
2,307
1,364
2,512
2,427
1,351
2,022
2,862
3,187
2,991
2,289
1,327
2,598
1,229
1,157
1,031
1,011
1,456
1,370
1,114
1,033
836
870
Male
19
1,415
771
601
827
507
793
406
1,193
1,146
578
810
1,114
777
1,253
737
1,372
1,304
720
1,101
1,530
1,714
1,626
1,206
703
1,329
668
622
557
546
787
738
604
552
445
470
;::0:1 Q)"5 2Q.
Female &8.
20 21
1,232 30.54
672 24.95
530 24.55
718 48.45
427 19.67
681 55.18
346 37.35
1,046 23.14
981 28.91
493 19.76
678 28.29
939 43.31
653 30.35
1,054 17.35
627 14.59
1,140 18.15
1,124 32.91
631 17.87
921 20.64
1,332 10.79
1,473 11.96
1,365 11.98
1,083 15.26
624 63.62
1,269 9.54
561 21.78
535 16.70
473 23.00
465 14.32
669 6.91
632 67.13
510 23.45
481 40.80
391 14.52
400 16.67
161
c:
i "5 Q.
-8. el_ If~ ........ 00
8,~ ~i ~~ cf& 22
69.46
75.00
75.45
51.55
80.33
44.79
62.65
76.86
71.12
80.24
71.66
56.71
69.65
82.69
85.41
81.85
67.06
82.13
79.36
89.24
88.04
88.02
84.78
36.38
90.46
78.28
83.30
77.00
85.68
93.15
32.87
76.62
59.20
85.48
83.33
Person
23
44.75
38.76
49.47
64.79
64.24
69.74
68.69
59.39
58.48
62.49
61.46
62.60
64.48
54.63
65.09
38.17
47.84
49.81
49.09
48.39
48.32
51.88
54.64
68.71
53.79
60.89
61.88
69.57
70.50
66.44
74.37
64.52
65.47
49.46
57.38
Literacy rate
Male
24
54.91
48.20
62.57
75.00
76.99
79.84
81.26
74.31
71.71
76.28
76.47
74.60
75.89
67.52
76.70
48.96
58.73
62.49
59.73
59.50
59.97
64.39
66.28
75.98
67.61
71.14
72.76
79.92
80.14
76.39
80.25
77.39
78.76
63.81
71.87
Female
25
33.01
27.89
34.56
53.12
49.17
58.01
53.70
42.48
43.03
46.31
43.43
48.35
50.95
39.26
51.41
25.14
35.22
35.11
36.25
35.38
34.59
36.77
41.59
60.47
39.30
48.65
49.16
57.38
59.13
54.64
67.46
49.21
50.16
32.97
40.14
Work participation rate
Person
26
31.02
28.30
31.89
29.89
32.67
28.51
30.27
40.29
30.62
29.34
37.16
27.19
27.23
28.76
27.51
30.04
30.26
28.04
28.63
31.45
31.09
32.30
34.30
29.78
35.63
29.47
32.95
27.53
32.90
32.83
29.94
35.95
37.02
43.20
39.16
Male Female
27 28
47.94 11.67
47.11 6.90
47.61 14.13
46.58 10.73
47.53 15.14
45.63 8.62
46.56 10.90
50.88 28.25
45.53 13.31
45.92 10.03
47.83 24.46
44.06 7.24
44.56 6.88
46.47 7.90
45.68 6.30
48.94 7.59
48.62 9.18
47.76 5.56
48.81 4.66
51.10 8.88
50.61 8.51
51.12 10.01
50.04 16.79
46.95 10.44
47.93 22.71
47.98 7.65
48.82 14.62
45.72 6.32
48.43 14.77
48.27 14.69
47.23 9.71
49.22 20.32
49.13 23.12
50.44 34.99
49.19 27.38

POPULATION
Name of Statel Union TerritoryfDistrict Area in km2
j Ci U
t Population in '000 Population age group
0-6 in '000
'0 '0 o z ~ . Person Male Female Person Male Female
2 3 45678 9 .10 11 12 13 14
39 MAHOBA 2884.0 246 3 4 5 500 708 380 329 135 71 64
40 BANDA 4460.0 345 4 8 8 718 1,537 827 711 303 158 145
41 CHITRAKOOT 3164.0 242 2 5 3 630 766 409 357 162 84 78
42 FATEHPUR 4152.0 556 3 13 6 1,522 2,308 1,220 1,089 421 219 203
43 PRATAPGARH 3717.0 735 4 16 7 2,219 2,731 1,363 1,368 512 265 248
44 KAUSHAMBI 1780.0 726 3 9 7 868 1,293 682 611 266 136 129
45 ALLAHABAD 5482.0 900 8 19 13 3,064 4,936 2,626 2,310 900 469 430
46 BARABANKI 4402.0 607 6 16 12 1,842 2,674 1,417 1,257 515 265 250
47 FAIZABAD 2341.0 892 5 10 7 1,272 2,089 1,077 1,011 382 197 186
48 AMBEDKAR NAGAR 2350.0 863 4 9 7 1,780 2,027 1,025 1,002 393 202 191
49 SULTANPUR 4436.0 725 6 22 7 2,531 3,215 1,624 1,591 617 318 299
50 BAHRAICH 4420.0 539 4 12 4 1,226 2,381 1,275 1,106 487 247 240
51 SHRAWASTI 2458.0 479 3 7 2 704 1,176 632 544 235 121 114
52 BALRAMPUR 3349.0 502 3 9 4 1,021 1,682 888 794 339 173 166
53 GONDA 4003.0 691 4 16 7 1,821 2,766 1,451 1,314 537 275 262
54 SIDDHARTHNAGAR 2895.0 705 5 13 4 2,532 2,040 1,047 993 435 221 214
55 BASTI 2688.0 776 3 13 2 3.351 2,085 1,076 1,009 407 210 197
56 SANTKABIRNAGAR 1646.0 863 3 7 5 1,727 1,420 719 701 293 151 142
57 MAHARAJGANJ 2952.0 736 4 13 6 1,258 2,174 1,124 1,050 458 234 224
58 GORAKHPUR 3321.0 1,135 7 18 9 3,327 3,769 1,923 1,846 694 359 335
59 KUSHINAGAR 2906.0 996 4 16 7 1.641 2,893 1,474 1,420 586 300 286
60 DEORIA 2538.0 1,069 5 13 10 2,161 2,713 1,355 1,358 516 265 251
61 AZAMGARH 4054.0 972 7 22 15 4,106 3,940 1,950 1,990 796 409 388
62 MAU 1713.0 1,082 4 9 9 1,622 1,854 934 920 374 192 182
63 BALLIA 2981.0 926 6 17 9 2,360 2,762 1,414 1,348 517 266 251
64 JAUNPUR 4038.0 969 6 21 9 3,386 3,912 1,942 1,970 784 406 378
65 GHAZIPUR 3377.0 899 5 16 8 3,364 3,038 1,537 1,500 611 316 295
66 CHANDAULI 2541.0 647 3 9 6 1,638 1,643 855 788 328 170 159
67 VARANASI 1535.0 2,045 2 8 11 1.327 3,139 1,649 1,489 576 300 276
68 SANT RAVIDAS NAGAR 1015.0 1,334 2 5 7 1,224 1,354 706 648 274 143 131
69 MIRZAPUR 4521.0 468 4 12 6 1,985 2,116 1,115 1,001 425 221 205
70 SONBHADRA 6788.0 216 3 8 14 1,424 1,464 771 693 303 155 148
10 BIHAR 94163.0 881 533 533 130 45,098 82,999 43,244 39,755 16,806 8,653 8,153
PASHCHIM CHAMPARAN 5228.0 582 18 18 5 1,486 3,043 1,601 1,443 648 332 316
162

STATISTICS 2001
Urban population in '000
Person
15
155
244
77
238
145
92
1,207
249
281
181
152
238
33
136
194
78
116
101
111
739
133
268
297
360
270
289
233
174
1,261
173
287
275
8,682
310
Male
16
82
132
41
125
75
48
664
131
152
94
80
126
18
71
105
41
61
53
58
390
70
140
154
186
142
151
122
92
673
92
153
151
4,649
164
Female
17
72
112
36
112
69
44
543
118
129
87
72
112
16
64
89
37
55
48
53
348
63
129
143
174
128
138
111
82
587
81
134
125
4,033
145
<=
~ :; 0.
:68. -e-;:)-5 _-o 0
Rural population in '000 Gl-;;
~,g
Person
18
554
1.293
690
2,071
2,587
1,201
3,729
2,425
1,808
1,846
3,063
2,143
1,143
1,547
2,571
1,962
1,969
1,320
2,063
3,031
2,761
2,444
3,643
1,494
2,492
3,622
2,804
1,470
1,878
1,180
1,830
1,188
74,317
2,734
Male
19
297
695
368
1,094
1,288
634
1,962
1,286
925
931
1,543
1,149
614
817
1,346
1,006
1,014
667
1,066
1,533
1,404
1,215
1,797
748
1,272
1,791
1,415
763
976
614
963
620
38,595
1,437
?!~ ... 0.
Female 8:8. 20 21
256 21.89
598 15.88
321 10.05
976 10.31
1,299 5.31
567 7.12
1,767 <!4.45
1,139 9.31
882 13.45
915 8.93
1,519 4.73
994 10.00
529 2.81
730 8.09
1,225 7.01
956 3.82
955 5.56
653 7.11
997 5.11
1,498 19.61
1,357 4.60
1,229 9.88
1,846 7.54
746 19.42
1,220 9.78
1,832 7.39
1,389 7.67
707 10.59
902 40.17
566 12.78
867 13.56
568 18.78
35,722 10.46
1,297 10.19
163
c::
~ 1
-8. E! If~ _-o 0
8,';;' J9.Q <=1ii ~:;
~~ 22
78.25
84.12
90.08
89.73
94.73
92.88
75.55
90.69
86.55
91.07
95.27
90.00
97.19
91.97
92.95
96.18
94.44
92.96
94.89
80.42
95.44
90.08
92.46
80.58
90.22
92.59
92.30
89.47
59.83
87.15
86.48
81.15
89.54
89.85
Person
23
53.28
54.38
65.04
56.30
57.60
46.88
62.11
47.39
56.28
58.43
55.75
35.16
33.82
34.60
42.59
42.30
52.49
50.88
46.61
58.49
46.94
58.64
56.95
62.16
57.86
59.84
59.55
59.72
66.12
57.90
55.31
49.22
47.00
38.93
Literacy rate
Male
24
67.74
69.28
77.69
69.01
73.99
61.96
75.61
58.85
69.42
71.37
70.49
45.58
46.67
45.84
56.39
56.66
67.10
66.57
63.92
73.57
63.64
75.01
71.04
75.60
71.91
76.18
74.87
74.04
77.87
75.76
69.59
62.95
59.70
51.08
Female
25
36.41
36.78
50.30
41.93
41.54
29.79
46.38
34.29
42.26
45.30
40.86
22.78
18.58
21.79
27.17
27.08
36.92
34.92
27.93
42.88
29.64
42.51
43.40
48.66
43.16
44.07
44.03
44.13
53.05
38.44
39.26
33.70
33.10
25.23
Work participation rate
Person
26
42.31
40.29
42.28
37.67
33.53
39.19
33.86
36.80
39.43
33.45
32.12
35.46
41.35
42.44
33.96
38.06
35.26
34.44
39.12
30.14
34.22
28.53
30.45
32.33
28.77
31.07
31.39
32.11
31.29
28.71
33.78
36.76
33.70
32.66
Male Female
27 28
50.64 32.70
48.92 30.26
47.71 36.06
48.55 25.48
42.89 24.21
47.35 30.07
43.37 23.05
51.72 19.96
50.30 27.85
44.81 21.83
44.65 19.33
52.21 16.13
54.62 25.95
52.49 31.22
50.43 15.77
47.65 27.95
46.77 23.00
44.95 23.65
47.71 29.92
42.71 17.06
45.49 22.52
40.49 16.59
40.90 20.22
42.00 22.52
41.48 15.44
40.40 21.88
41.73 20.80
44.26 18.93
44.68 16.47
41.26 15.03
45.58 20.62
47.29 25.03
47.40 18.80
48.78 14.69

Name of Statel Union TerritorylDistrM
2
2 PURBA CHAMPARAN
3 SHEOHAR
4 SITAMARHI
5 MADHUBANI
6 SUPAUL
7 ARARIA
8 KISHANGANJ
9 PURNIA
10 KATIHAR
11 MADHEPURA
12 SAHARSA
13 DARBHANGA
14 MUZAFFARPUR
15 GOPALGANJ
16 SIWAN
17 SARAN
18 VAISHALI
19 SAMASTIPUR
20 BEGUSARAI
21 KHAGARIA
22 BHAGALPUR
23 BANKA
24 MUNGER
25 LAKHISARAI
26 SHEIKHPURA
27 NALANDA
28 PATNA
29 BHOJPUR
30 BUXAR
31 KAIMUR (BHABUA)
32 ROHTAS
33 JEHANABAD
34 AURANGABAD
35 GAYA
36 NAWADA
37 JAMUl
Area in km"
3 4
3968.0 993
349.0 1,478
2294.0 1,169
3501.0 1,021
2425.0 714
2830.0 763
1884.0 688
3229.0 788
3057.0 783
1788.0 854
1687.0 894
2279.0 1,446
3172.0 1,181
2033.0 1,059
2219.0 1,223
2641.0 1,230
2036.0 1,335
2904.0 1,169
1918.0 1,225
1486.0 862
2569.0 943
3020.0 533
1419.0 802
1228.0 653
689.0 763
2355 1,007
3202.0 1,474
2395.0 937
1703.0 823
3362.0
3851.0
1569.0
3305.0
4976.0
2494.0
3098.0
383
636
965
609
698
726
452
27
5
17
21
11
9
7
14
16
13
10
18
16
14
19
20
16
20
18
7
16
11
9
6
6
20
23
14
11
11
19
12
11
24
14
10
27
5
17
21
11
9
7
14
16
13
10
18
16
14
19
20
16
20
18
7
16
11
9
6
6
20
23
14
11
11
19
12
11
24
14
10
7
5
4
3
3
3
3
3
2
3
4
3
5
3
4
2
2
5
2
4
2
2
5
12
6
2
5
2
5
5
3
2
164
1,317
203
834
1,110
742
771
1,281
1,542
437
466
1,268
1,795
1,535
1,530
1,766
1,569
1,248
1,211
301
1.519
2,110
861
472
321
1,055
1,421
1,217
1,134
1,712
2,062
918
1,848
2,887
1,091
1,506
3,940
516
2.683
3,575
1,733
2,159
1,296
2,544
2,393
1,527
1.508
3,296
3,747
2,153
2,714
3,249
2,718
3,395
2,349
1,280
2,423
1,609
1.138
802
526
2,371
4,719
2,243
1,402
1,289
2,451
1,514
2,013
3,473
1,810
1,399
2,077
274
1,418
1,841
902
1,128
670
1,328
1,247
797
789
1,722
1,951
1,076
1,336
1,653
1,416
1,761
1,229
679
1,292
843
608
418
274
1,239
2,520
1,180
738
678
1,283
785
1,041
1,792
930
729
1,863
242
1,265
1,734
830
1,031
627
1,216
1,146
729
719
1,574
1,795
1,077
1,378
1,596
1,303
1,634
1,120
601
1,132
765
530
385
252
1,132
2.199
1,064
664
611
1,167
729
972
1,681
880
670
POPULATION
838
106
557
726
367
474
288
550
525
330
317
662
742
434
550
647
543
711
481
279
472
328
206
169
110
461
819
423
272
270
484
294
399
687
359
276
433
56
289
374
191
242
148
279
267
171
166
346
385
221
284
332
280
367
247
144
240
167
107
87
56
238
426
218
141
139
248
154
205
349
182
141
405
51
267
352
177
233
140
270
258
159
151
316
357
213
265
315
263
344
234
134
232
161
98
83
54
224
393
205
131
131
236
141
193
338
178
136

STATISTICS 2001
Urban populatiQll j!l '000
Person Male
15
251
21
153
125
88
132
129
222
218
68
125
267
348
131
149
299
187
123
108
76
452
56
318
118
81
354
1,962
312
129
42
327
112
170
476
138
103
16
135
11
82
66
47
71
69
120
117
37
68
142
187
68
79
158
99
66
58
41
243
30
170
63
43
187
1,064
170
69
23
173
59
90
253
73
55
116
10
71
59
41
61
60
102
102
31
57
125
162
63
71
141
88
58
50
35
210
26
147
55
167
898
143
60
19
153
52
81
223
65
48
3,689
495
2,529
3,451
1,644
2,026
1,167
2,322
2,174
1,459
1,383
3,028
3,398
2,022
2,565
2,950
2,532
3,271
2,242
1,204
1,971
1,552
820
684
444
2,017
2,757
1,931
1,273
1,247
2,124
1,403
1,843
2,997
1,671
1,296
1,942
262
1,335
1,775
855
1,057
600
1,208
1,130
760
722
1,580
1,765
1,008
1,258
1,495
1,317
1,695
1,171
638
1,049
813
437
355
231
1,052
1,456
1,010
669
655
1,110
726
951
1,539
857
674
21
1,747 6.37
232 4.07
1,194 5.70
1,676 3.50
789 5.08
969 6.11
567 9.95
1,113 8.73
1,044 9.11
698 4.45
681 8.29
1,449 8.10
1,634 9.29
1,014 6.08
1,307 5.49
1,455 9.20
1,215 6.88
1,576 3.62
1,070 4.60
566 5.94
922 18.65
739 3.48
383 27.94
329 14.71
213 15.40
965 14.93
1,301 41.58
921 13.91
604 9.20
592 3.26
1,014 13.34
677 7.40
892 8.45
1,459 13.71
814 7.62
621 7.36
165
93.63
95.93
94.26
96.53
94.86
93.84
90.05
91.27
90.85
95.55
91.71
91.87
90.69
93.92
94.51
90.80
93.16
96.35
95.44
94.06
81.35
96.46
72.06
85.29
84.41
85.07
5M2
86.09
90.80
96.74
86.66
92.67
91.55
86.29
92.32
92.64
literacy rate
~rson Male Female
23
37.54
35.27
38.46
41.97
37.28
35.01
31.09
35.10
35.09
36.07
39.08
44.33
47.95
47.48
51.65
51.80
50.49
45.13
47.98
41.35
49.50
42.73
59.47
47.96
48.60
53.19
62.92
58.96
56.80
55.12
61.29
55.26
57.03
50.45
46.83
42.43
24
49.31
45.28
49.36
56.79
52.42
46.38
42.71
45.63
45.31
48.80
51.66
56.72
59.10
62.96
67.26
67.30
63.23
57.59
59.13
51.82
59.22
55.29
69.89
60.74
61.94
66.44
73.34
74.29
71.92
69.67
75.31
70.07
71.13
63.27
60.58
57.06
24.27
23.86
26.13
26.25
20.81
22.37
18.63
23.42
23.80
22.11
25.27
30.78
35.81
32.16
36.88
35.82
36.58
31.67
35.64
29.35
38.13
28.67
47.40
33.96
33.92
38.58
50.83
41.80
39.88
38.83
45.71
39.37
41.90
36.66
32.17
26.32
Work partIcipation rate
Person Male Female
2tl
31.25
31.88
34.34
42.03
39.54
32.18
37.76
37.55
44.80
39.08
31.21
30,42
29.81
26.91
26.50
28.79
31.58
31.76
36.49
35.30
39.57
29.13
36.48
36.99
38.10
30.21
29.15
29.11
34.36
30.37
38.36
33.33
36.78
37.26
42.65
42.65
27 28
50.26 9.77
50.33 11.20
47.75 20.10
50.35 32.99
52.06 25.82
52.72 10.24
50.98 23.32
50.86 23.06
51.70 37.26
48.85 28.35
46.12 14.88
46.72 12.71
44.58 15.05
41.48 12.78
42.08 10.37
45.25 10.91
46.84 15.13
46.19 15.93
48.50 22.93
47.43· 21.45
49.93 28.16
42.87 13.38
48.63 23.28
48.02 24.98
48.26 26.98
44.94 13.33
44.09 12.57
44.59 11.89
46.64 20.74
45.68 13.52
48.07 27.91
45.64 20.15
47.40 25.47
48.14 25.77
49.88 34.78
49.88 34.78

Name of Statel Union Territory/District
2
11 SIKKIM
1 NORTH
2 WEST
3 SOUTH
4 EAST
12 ARUNACHAL PRADESH
1 TAWANG
2 WEST KAMENG
3 EAST KAMENG
4 PAPUMPARE
5 LOWER SUBANSIRI
6 UPPER SUBANSIRI
7 WESTSIANG
8 EASTSIANG
9 UPPER SIANG
10 DIBANG VALLEY
11 LOHIT
12 CHANGLANG
13 TIRAP
13 NAGALAND
1 fv10N
2 TUENSANG
3 MOKOKCHUNG
4 ZUNHEBOTO
5 WOKHA
6 DIMAPUR
7 KOHIMA
8 PHEK
14 MANlPUR
SENAPATI
2 TAMENGlONG
3 CHURACHANDPUR
Area in km2
3
7096.0
4226.0
1166.0
750.0
954.0
83743.0
2172.0
7422.0
4134.0
3462.0
9548.0
7032.0
8325.0
3603.0
6590.0
13029.0
11402.0
4662.0
2362.0
16579.0
1786.0
4228.0
1615.0
1255.0
1628.0
927.0
3114.0
2026.0
22327.0
3271.0
4391.0
4570.0
4
76
10
106
175
257
13
18
10
14
35
10
8
12
24
5
4
13
27
42
120
146
98
144
123
99
333
100
73
103
87
25
50
5
9
2
2
2
3
149
7
to
10
9
17
11
20
12
10
10
14
11
8
93
14
20
8
11
11
7
12
10
38
6
4
5
6
9
2
2
2
3
56
3
3
4
2
9
5
7
4
4
3
5
4
3
52
6
13
6
6
5
4
7
5
38
6
4
5
7
9
2
2
4
17
2
2
o
2
2
2
9
2
33
o
o o
166
8
452
53
121
145
133
4,065
189
220
326
283
704
415
407
145
99
246
522
342
167
1,317
111
256
105
191
129
219
202
104
2,391
625
171
546
POPULATION
Population age group Population in '000 0-6 in '000
Person Male Female Person Male Female
9
541
41
123
132
245
1,098
39
75
57
122
98
55
104
87
33
58
144
125
100
1.990
261
415
232
154
161
309
310
148
2,294
284
111
228
10
288
23
64
68
133
580
22
43
29
64
50
28
54
45
18
31
77
68
53
1,041
139
219
121
64
167
162
77
1,162
147
58
117
11
252
18
59
63
112
518
17
32
28
58
49
27
50
42
15
26
66
60
48
943
122
196
111
75
78
142
148
71
1,132
137
53
111
12
78
6
20
21
31
206
7
13
12
21
18
11
18
16
6
10
29
25
20
290
39
59
24
25
22
47
47
27
309
22
16
31
13
40
3
10
11
16
105
3
6
6
11
9
5
9
8
3
5
15
13
10
148
20
30
12
13
11
24
24
14
158
11
8
16
14
38
3
10
10
15
101
3
6
6
10
9
5
9
8
3
5
14
12
10
142
19
29
12
12
11
23
23
13
151
11
8
15
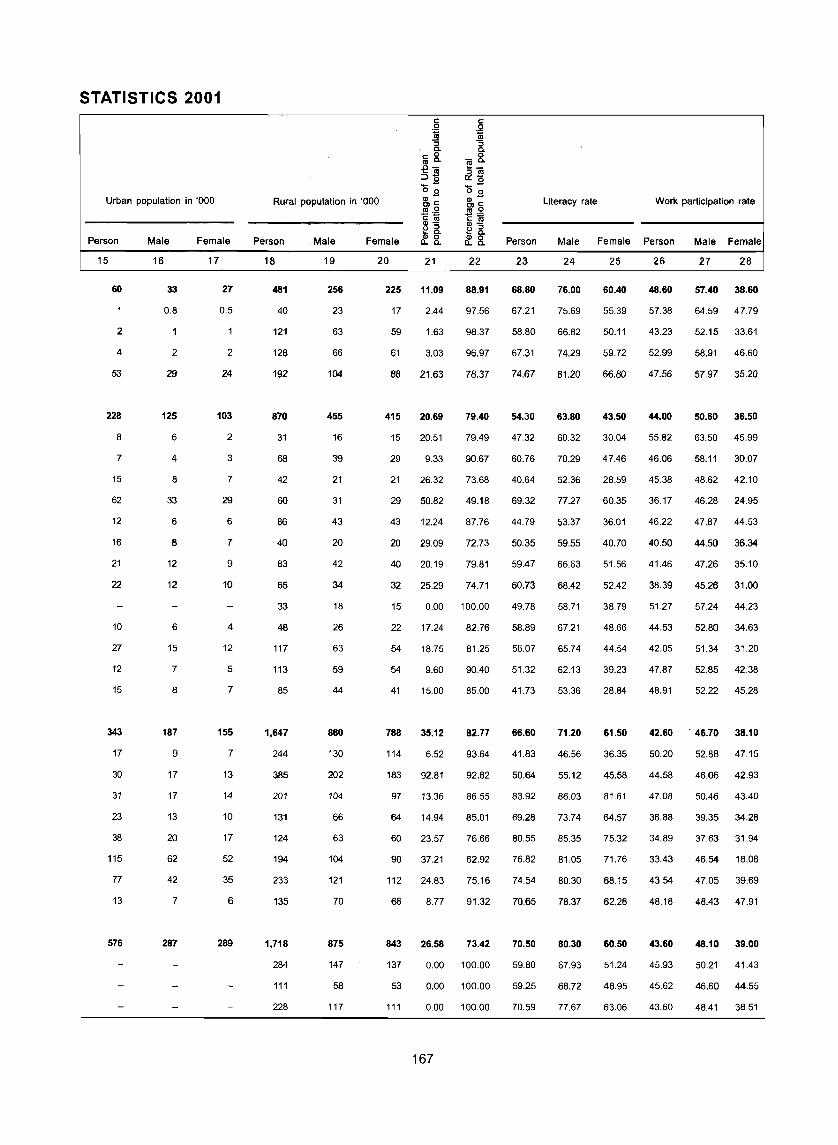
STATISTICS 2001
Urban population in '000
Person
15
60
2
4
53
228
8
7
15
62
12
16
21
22
10
27
12
15
343
17
30
31
23
38
115
77
13
576
Male
16
33
0.8
2
29
125
6
4
8
33
6
8
12
12
6
15
7
8
187
9
17
17
13
20
62
42
7
287
Female
17
27
0.5
2
24
103
2
3
7
29
6
7
9
10
4
12
5
7
155
7
13
14
10
17
52
35
6
289
c: c: .2 ,g 1ii m :; :; 0. 0.
~&. (ij&. .0-
... _ - m :::l m ::J'O 0::'0 _- .... -o 0 o 0
Rural population in '000 (Il- (Il-CDC: CDC:
~~
Person
18
481
40
121
128
192
870
31
68
42
60
86
40
83
65
33
48
117
113
85
1,647
244
385
201
131
124
194
233
135
1,718
284
111
228
Male
19
256
23
63
66
104
455
16
39
21
31
43
20
42
34
18
26
63
59
44
860
130
202
104
66
63
104
121
70
875
147
58
117
Gl-" :::l _ 0.
Female If&. 20 21
225 11.09
17 2.44
59 1.63
61 3.03
88 21.63
415 20.69
15 20.51
29 9.33
21 26.32
29 50.82
43 12.24
20 29.09
40 20.19
32 25.29
~~ (1)-~a If&. 22
88.91
97.56
98.37
96.97
78.37
79.40
79.49
90.67
73.68
49.18
87.76
72.73
79.81
74.71
15 0.00 100.00
22 17.24
54 18.75
54 9.60
41 15.00
788 35.12
114 6.52
183 92.81
97 13.36
64 14.94
60 23.57
90 37.21
112 24.83
66 8.77
843 26.58
82.76
81.25
90.40
85.00
82.77
93.64
92.82
86.55
85.01
76.66
62.92
75.16
91.32
73.42
137 0.00 100.00
53 0.00 100.00
111 0.00 100.00
167
Person
23
68.80
67.21
58.80
67.31
74.67
54.30
47.32
60.76
40.64
69.32
44.79
50.35
59.47
60.73
49.78
58.89
56.07
51.32
41.73
66.60
41.83
50.64
83.92
69.28
80.55
76.82
74.54
70.65
70.50
59.80
59.25
70.59
Literacy rate
Male
24
76.00
75.69
66.82
74.29
81.20
63.80
60.32
70.29
52.36
77.27
53.37
59.55
66.63
68.42
58.71
67.21
65.74
62.13
53.36
71.20
46.56
55.12
86.03
73.74
85.35
81.05
80.30
78.37
80.30
67.93
68.72
77.67
Female
25
60.40
55.39
50.11
59.72
66.80
43.50
30.04
47.46
28.59
60.35
36.01
40.70
51.56
52.42
38.79
48.66
44.54
39.23
28.84
61.50
36.35
45.58
81.61
64.57
75.32
71.76
68.15
62.26
60.50
51.24
48.95
63.06
Work participation rate
Person Male Female
26 27 28
48.60 57.40 38.60
57.38 64.59 47.79
43.23 52.15 33.61
52.99 58.91 46.60
47.56 57.97 35.20
44.00 50.60 36.50
55.82 63.50 45.99
46.06 58.11 30.07
45.38 48.62 42.10
36.17 46.28 24.95
46.22 47.87 44.53
40.50 44.50 36.34
41.46 47.26 35.10
38.39 45.26 31.00
51.27 57.24 44.23
4~53 52BO 34B3
42.05 51.34 31.20
47.87 52.85 42.38
48.91 52.22 45.28
42.60 . 46.70 38.10
50.20 52.88 47.15
44.58 46.06 42.93
47.08 50.46 43.40
36.88 39.35 34.28
34.89 37.63 31.94
33.43 46.54 18.08
43.54 47.05 39.69
48.18 48.43 47.91
43.60 48.10 39.00
45.93 50.21 41.43
45.62 46.60 44.55
43.60 48.41 38.51

Name of Statel Union Territory/District
2
4 SISHNUPUR
5 THOUSAL
6 IMPHAL WEST
7 IMP HAL EAST
8 UKHRUL
9 CHAN DEL
15 MIZORAM
MAMIT
2 KOLASIS
3 AIZAWL
4 CHAMPHAI
5 SERCHHIP
6 LUNGLEI
7 LAWNGTLAI
8 SAIHA
16 TRiPURA
WESTTRIPURA
2 SOUTH TRIPURA
3 DHALAI
4 NORTH TRIPURA
17 MEGHALAYA
WEST GARO HILLS
2 EAST GARO HILLS
3 SOUTH GARO HILLS
4 WEST KHASI HILLS
5 RI SHOI
6 EAST KHASI HILLS
7 JAINTIA HILLS
18 ASSAM
KOKRAJHAR
2 DHUSRI
Area in km2
3
496.0
514.0
519.0
709.0
4544.0
3313.0
21081.0
3025.0
1382.0
3576.0
3185.0
1421.0
4536.0
2557.0
1399.0
10486.0
2993.0
3057.0
2400.0
2036.0
22429.0
3715.0
2603.0
1849.0
5247.0
2376.0
2820.0
3819.0
78438.0
3538.0
2798.0
4
420
708
856
557
31
36
42
21
48
91
34
38
30
29
44
305
512
251
128
290
103
140
96
55
56
81
234
78
340
256
585
5
3
3
4
4
5
4
22
3
2
4
3
2
4
2
2
38
15
10
5
8
32
7
4
3
5
2
7
4
142
5
8
~ OJ
Ci (j
'0 d Z
6
3
3
4
4
5
4
22
3
2
4
3
2
4
2
2
38
15
10
5
8
32
7
4
3
5
2
7
4
219
6
14
7
6
10
9
7
o
22
3
4
4
4
3
3
o
23
13
4
3
3
16
2
2
8
j 5: '0
8
49
103
134
204
198
361
817
123
49
103
91
39
191
146
75
870
275
277
151
167
6,026
1,537
888
627
943
570
962
499
125 26,312
4 975
8 1.333
168
POPULATION
Population age group Population in '000 0-6 in '000
Person Male Female Person Male Female
9
208
364
444
395
141
118
889
63
66
326
108
54
137
74
61
3,199
1,533
767
308
591
2,319
518
251
101
296
193
661
299
10
105
182
222
198
73
60
459
33
35
167
56
27
71
39
31
1,642
786
395
159
303
1,176
263
127
52
150
99
334
150
11
104
182
223
197
67
59
429
30
31
159
53
26
66
35
30
1,557
747
373
149
288
1,143
255
123
49
146
93
327
149
26,656 13,777 12,878
906 466 440
1,637 841 796
12
31
60
56
56
21
16
144
11
11
46
18
9
23
14
11
436
193
110
48
86
468
101
51
21
69
43
115
67
13
16
30
29
28
11
8
73
6
5
23
9
5
12
7
6
222
98
56
24
43
237
52
26
11
35
22
58
34
4,498 2,289
163 84
340 173
14
15
29
27
27
10
8
71
5
5
23
9
5
11
7
5
214
95
54
24
42
231
49
25
10
34
21
57
34
2,209
79
167

STATISTICS 2001
Urban population in '000
Person
15
75
131
247
108
15
441
11
36
248
42
26
58
20
546
410
54
19
63
454
59
36
9
35
13
278
25
3,439
64
192
Male
16
38
66
123
54
8
226
6
19
127
22
13
30
10
279
208
28
10
32
229
30
18
5
17
7
139
12
1,837
34
99
Female
17
37
66
124
55
7
215
5
17
122
20
13
28
10
267
202
26
9
31
225
29
18
4
17
6
138
13
1,602
30
93
'" '" 0 B ~ .!!! :J :J 0. 0.
'" 0 0 mo. 1ii0. .e1ii '-_
:J m ::)(:; 0::'0 o~
_-o 0
Rural population in '000 4)- 4)-0)'" 0)'"
~B
Person
18
134
233
198
287
141
103
448
52
29
78
66
28
79
74
41
2,653
1,123
713
289
528
1,865
459
215
92
261
180
383
274
23,216
842
1,445
Male
19
67
117
99
145
73
52
233
28
16
40
34
14
41
39
21
1,364
577
366
149
271
947
233
109
47
133
93
194
138
11,940
432
742
Q).!!! <> :J ... 0.
Female ~g_
20 21
67 36.06
116 35.99
98 55.63
142 27.34
67 0.00
51 12.71
215 49.61
25 17.46
14 54.55
37 76.07
33 38.89
14 48.15
38 42.34
.:g.Q ijj12 ~ a ~g_
22
64.42
64.01
44.59
72.66
31.97
87.29
50.28
82.54
43.94
23.93
61.11
51.85
57.66
35 0.00 100,00
20 32.79
1,290 17.07
546 26.74
347 7.04
140 6.17
257 10.66
918 19.62
226 11.39
106 14.34
45 8.91
128 11.82
87 6.74
189 42.06
136 8.36
11,276 12.89
409 7.06
703 11.73
169
67.21
82.93
73.26
92.96
93.83
89.34
80.38
88.61
85.66
91.09
88.18
93.26
57.94
91.64
87.10
92.94
88.27
Person
23
67.63
66.41
80.22
75.45
73.12
56.23
88.80
79.14
91.34
96.51
91.19
95.15
84.17
64.74
82.19
73.20
77.26
69.90
60.93
72.99
62.60
50.67
60.62
55.00
65.10
65.73
76.07
51.87
63.30
51.63
48.21
Literacy rate
Male
24
79.61
80.43
89.22
85.50
80.13
64.34
90.70
82.98
92.34
96.75
93.15
96.18
87.44
70.90
86.11
81.00
84.58
78.91
70.17
79.99
65.40
57.03
66.15
61.52
66.49
68.81
77.28
50.08
71.30
60.32
55.91
Work participation rate
Female
25
55.66
52.46
71.33
65.35
65.41
Person
26
43.05
48.70
40.08
39.73
47.25
47.98 . 46.10
86.70 52.60
74.81 56.01
90.22 53.84
96.26 50.04
89.10 62.86
94.08 60.38
80.60 52.32
57.81
78.07
64.90
69.55
60.33
50.99
65,60
59.60
44.12
54,89
48.02
63.65
62.43
74.84
53.67
54.60
42.40
40.04
46.31
44.19
36.20
34.86
39.57
41.17
32.96
41.80
40.19
44.69
47.38
43.61
46.38
38.82
42.42
35.80
36.97
28.73
Male Female
27 28
48.09 37.97
51.03 46.36
46.29 33.89
46.44 32.96
48.83 45.53
48.88 43.26
57.30 47.50
58.60 53.12
58.63 48.56
56.62 43.12
64.91 60.68
62.47 58.23
57.29 46.92
50.90 41.20
47.76 40.45
50.60 21.10
50.55 18.37
52.14 26.27
52.32 29.25
47.95 17.19
48.30 35.10
47.80 32.34
47.97 41.30
50.94 43.61
46.36 40.76
51.79 40.62
48.54 28.92
47.95 36.86
49.90 20.70
48.03 25.24
48.23 8.12

Name of State/ Union Territory/District
2
3 GOALPARA
4 BONGAIGAON
5 BARPETA
6 KAMRUP
7 NALBARI
8 DARRANG
9 MARIGAON
10 NAGAON
11 SONITPUR
12 LAKHIMPUR
13 DHEMAJI
14 TINSUKIA
15 DIBRUGARH
16 SIBSAGAR
17 JORHAT
18 GOLAGHAT
19 KARBI ANGLONG
20 NORTH CACHAR HILLS
21 CACHAR
22 KARIMGANJ
23 HAILAKANDI
19 WEST BENGAl
DARJILING
2 JALPAIGURI
3 KOCH BIHAR
4 UTTAR DINAJPUR
5 DAKSHIN DINAJPUR
6 MALDAH
7 MURSHIDABAD
8 BIRBHUM
9 BARDDHAMAN
10 NADIA
11 NORTH 24-PARGANAS
12 HUGLI
Area in km2
3
1824.0
2152.0
3245.0
4345.0
2257.0
3481.0
1551.0
3973.0
5324.0
2277.0
3237.0
3790.0
3381.0
2668.0
2851.0
3502.0
10434.0
4888.0
3786.0
1809.0
1327.0
88752.0
3149.0
6227.0
3387.0
3140.0
2219.0
3733.0
5324.0
4545.0
7024.0
3927.0
4094.0
3149.0
4
451
420
508
581
509
432
500
583
316
390
177
303
351
394
350
270
78
38
382
557
409
903
511
546
732
778
677
881
1,102
663
982
1,173
2,182
1,601
tl '1:
.~
~ ::::J
C/)
'0 ci z
5
5
4
8
14
9
9
5
9
7
6
4
4
7
6
5
5
4
4
5
5
4
341
12
13
12
9
8
15
26
19
31
17
22
18
6
8
6
12
17
12
11
6
17
14
9
5
7
7
9
8
8
11
5
15
7
5
341
12
13
12
9
8
15
26
19
31
17
22
18
7 8
3 837
5 917
7 1,073
9 1,393
2 827
4 1,341
2 636
10 1,420
6 1,870
2 1,170
3 1,315
10 1,146
9 1,345
5 878
7 853
6 1,089
6 2,931
4 645
7 1,047
3 940
3 331
375 40,782
9 708
16 756
10 1,202
6 1,504
2 1,638
5 1,798
29 2,210
6 2,473
66 2,529
25 1,346
48 1,581
40 1,915
170
POPULATION
Population in '000 Population age group
0-6 in '000
Person Male Female Person Male Female
9 10 11 12 13
822 420 402 159 81
905 465 440 163 83
1,647 849 799 309 158
2,522 1,327 1,195 354 181
1,149 592 556 170 87
1,504 774 730 269 136
776 399 377 149 76
2,315 1,191 1,124 426 216
1,682 872 810 274 139
889 456 433 150 76
572 295 277 100 51
1,150 601 549 185 94
1,185 614 572 173 88
1,052 545 506 149 76
999 517 482 134 68
946 490 456 143 73
813 422 391 150 76
188 100 88 31 16
1,445 743 702 229 117
1,008 518 490 177 90
543 281 262 101 52
80,176 41,466 38,710 11,414 5,824
1,609 831 779 205 104
3,401 1,751 1,650 521 265
2,479 1,272 1,207 387 197
2,442 1,260 1,182 513 261
1,503 770 733 246 125
3,290 1,689 1,601 640 326
5,867 3,005 2,862 1,045 530
3,015 1,547 1,469 488 249
6,896 3,588 3,307 903 462
4,605 2,367 2,238 606 308
8,934 4,639 4,296 1,054 539
5,042 2,590 2,452 603 309
14
79
81
151
173
83
133
73
210
135
74
49
90
85
73
66
70
74
15
112
87
49
5,590
100
257
190
252
121
314
515
240
442
299
516
294
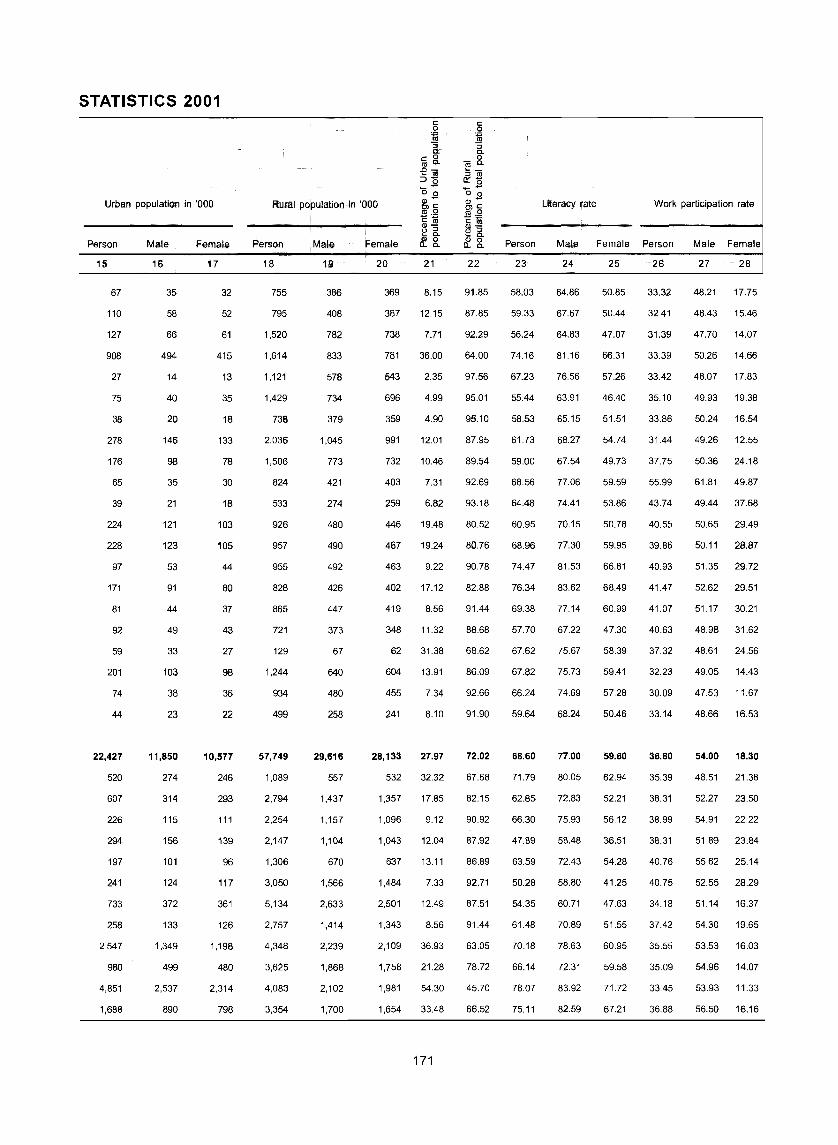
STATISTICS 2001
Urban population in '000
Person
15
67
110
127
908
27
75
38
278
176
65
39
224
228
97
171
81
92
59
201
74
44
22,427
520
607
226
294
197
241
733
258
2,547
980
4,851
1,688
Male
16
35
58
66
494
14
40
20
146
98
35
21
121
123
53
91
44
49
33
103
38
23
11,850
274
314
115
156
101
124
372
133
1,349
499
2,537
890
Female
17
32
52
61
415
13
35
18
133
78
30
18
103
105
44
80
37
43
27
98
36
22
10,577
246
293
111
139
96
117
361
126
1,198
480
2,314
798
c: 0 :; "S 0.
c: 0 coo. .1:>-... co =>(5 .... -o 0
Rural population in '000 <Il-;:; jg
Person
18
755
795
1,520
1,614
1,121
1,429
738
2,036
1,506
824
533
926
957
955
828
865
721
129
1,244
934
499
57,749
1,089
2,794
2,254
2,147
1,306
3,050
5,134
2,757
4,348
3,625
4,083
3,354
Male
19
386
408
782
833
578
734
379
1,045
773
421
274
480
490
492
426
447
373
67
640
480
258
29,616
557
1,437
1,157
1,104
670
1,566
2,633
1,414
2,239
1,868
2,102
1,700
c: co <Il-~ a
Female ~8.
20 21
369 8.15
387 12.15
738 7.71
781 36.00
543 2.35
696 4.99
359 4.90
991 12.01
732 10.46
403 7.31
259 6.82
446 19.48
467 19.24
463 9.22
402 17.12
419 8.56
348 11.32
62 31.38
604 13.91
455 7.34
241 8.10
28,133 27.97
532 32.32
1,357 17.85
1,096 9.12
1,043 12.04
637 13.11
1,484 7.33
2,501 12.49
1,343 8.56
2,109 36.93
1,758 21.28
1,981 54.30
1,654 33.48
171
c:
~ "S 0.
1ii8. ... -"'.lll 0: 0 .... -o 0 <Il-Ole:
~g d).lll (.) '" ... 0.
~8.
22
91.85
87.85
92.29
64.00
97.56
95.01
95.10
87.95
89.54
92.69
93.18
80.52
80.76
90.78
82.88
91.44
88.68
68.62
86.09
92.66
91.90
72.02
67.68
82.15
90.92
87.92
86.89
92.71
87.51
91.44
63.05
78.72
45.70
66.52
Person
23
58.03
59.33
56.24
74.16
67.23
55.44
58.53
61.73
59.00
68.56
64.48
60.95
68.96
74.47
76.34
69.38
57.70
67.62
67.82
66.24
59.64
68.60
71.79
62.85
66.30
47.89
63.59
50.28
54.35
61.48
70.18
66.14
78.07
75.11
Literacy rate
Male
24
64.86
67.67
64.83
81.16
76.56
63.91
65.15
68.27
67.54
77.06
74.41
70.15
77.30
81.53
83.62
77.14
67.22
75.67
75.73
74.69
68.24
77.00
80.05
72.83
75.93
58.48
72.43
58.80
60.71
70.89
78.63
72.31
83.92
82.59
Female
25
50.85
50.44
47.07
66.31
57.26
46.40
51.51
54.74
49.73
59.59
53.86
50.78
59.95
66.81
68.49
60.99
47.30
58.39
59.41
57.28
50.46
59.60
62.94
52.21
56.12
36.51
54.28
41.25
47.63
51.55
60.95
59.58
71.72
67.21
Work participation rate
Person
26
33.32
32.41
31.39
33.39
33.42
35.10
33.86
31.44
37.75
55.99
43.74
40.55
39.86
40.93
41.47
41.07
40.63
37.32
32.23
30.09
33.14
36.80
35.39
38.31
38.99
38.31
40.76
40.75
34.18
37.42
35.55
35.09
33.45
36.88
Male Female
27 28
48.21 17.75
48.43 15.46
47.70 14.07
50.26 14.66
48.07 17.83
49.93 19.38
50.24 16.54
49.26 12.55
50.36 24.18
61.81 49.87
49.44 37.68
50.65 29.49
50.11 28.87
51.35 29.72
52.62 29.51
51.17 30.21
48.98 31.62
48.61 24.56
49.05 14.43
47.53 11.67
48.66 16.53
54.00 18.30
48.51 21.38
52.27 23.50
54.91 22.22
51.89 23.84
55.62 25.14
52.55 28.29
51.14 16.37
54.30 19.65
53.53 16.03
54.96 14.07
53.93 11.33
56.50 16.16

o z '" ;3 c: o
~
Name of State/ Union Territory/District
2
13 BANKURA
14 PURULlYA
15 MEDINIPUR
16 HAORA
17 KOLKATA
18 SOUTH 24- PARGANAS
20 JHARKHAND
GARHWA
2 PALAMU
3 CHATRA
4 HAZARIBAG
5 KODARMA
6 GIRIDIH
7 DEOGHAR
8 GODDA
9 SAHIBGANJ
10 PAKAUR
11 DUMKA
12 DHANBAD
13 BOKARO
14 RANCH I
15 LOHARDAGA
16 GUMLA
17 PASHCHIMI SINGHBHUM
18 PURSI SINGHBHUM
21 ORISSA
1 BARGARH
2 JHARSUGUDA
3 SAMBALPUR
4 DEBAGARH
5 SUNDARGARH
6 KENDUJHAR
7 MAYURBHANJ
Area in km'
3 4
6882.0 464
6259.0 405
14081.0 683
1467.0 2,913
185.0 24,718
9960.0
19114.0
4044.0
8705.0
3706.0
5965.0
1494.0
4919.0
2479.0
2110.0
1599.0
1806.0
6212.0
2089.0
2880.0
7698.0
1491.0
9077.0
9907.0
3533.0
155707.0
5837.0
2081.0
6657.0
2940.0
9712.0
8303.0
10418.0
693
338
256
241
214
382
334
387
470
497
580
389
283
1,147
617
362
244
148
210
561
236
231
245
141
93
188
188
213
5
22
20
54
14
o 29
210
14
19
10
15
4
12
8
8
9
6
14
8
8
20
5
18
23
9
391
14
9
18
4
29
20
29
~ iIi c:i c5 '0 o z
6
22
20
54
14
o 29
210
14
19
10
15
4
12
8
8
9
6
14
8
8
20
5
18
23
9
314
12
5
9
3
17
13
26
rJl c:
~ '0 o z
7 8
5
12
21
3,830
2,683
11,736
734 53
o 21 2,139
152 32,615
2 906
5 2,676
23
2
4
3
2
4
47
16
8
1,464
1,702
649
2,756
2,706
2,304
1,819
1,250
4,090
1,213
646
2,076
353
2 1,398
17 2,857
13 1,750
138 51,349
4 1,207
3 348
5 1,322
11
9
4
172
875
1,764
2,122
3,950
Population in '000
Person Male Female
9
3,193
2,537
9,611
4,273
4,573
10
1,636
1,298
4,916
2,242
2,500
11
1,557
1,238
4,694
2,031
2,073
6,907 3,565 3,342
26,946 13,885 13,061
1,035 535 500
2,098 1,084 1,014
791
2,277
499
1,904
1,165
1,048
928
702
1,760
2,397
1,778
2,785
365
1,347
2,083
1,983
36,805
1,346
510
936
274
1,831
1,562
2,223
404
1,168
250
961
609
544
478
359
897
1,279
938
1,437
185
387
1,110
250
944
557
504
450
343
862
1,118
839
1,348
180
676 671
1,055 1,028
1,027 956
18,661 18,144
682 665
262 248
475 460
138
936
790
1,123
136
895
772
1,100
POPULATION
Population age group 0-6 in '000
Person Male Female
12
459
409
1,380
513
390
13
235
208
708
262
203
1,050 535
4,951 2,522
227 116
429 218
166
424
102
405
228
204
194
144
318
384
291
461
72
84
216
52
205
115
103
99
73
161
197
149
235
37
249 126
374 190
283 146
5,359 2,745
174 89
67 34
125 64
42
265
244
365
22
135
124
186
14
224
201
673
251
188
515
2,435
111
211
82
209
50
200
112
101
96
71
157
187
142
226
35
123
184
137
2,614
85
33
61
21
130
119
178

STATISTICS 2001
Urban population in '000
Person
15
235
255
984
2,152
4,573
1,086
5,994
43
125
42
529
87
122
160
37
98
36
115
1,255
805
978
46
74
351
1,091
5,517
104
186
254
20
629
213
156
Male
16
121
133
508
1,158
2,500
568
3,205
23
66
22
289
46
64
87
20
52
19
61
681
434
521
24
38
185
574
2,912
54
98
132
11
333
112
82
Female
17
115
122
475
994
2,073
518
2,788
20
59
20
240
41
58
73
17
46
17
54
574
371
457
22
36
166
518
2,606
50
8B
122
10
296
101
74
cz 0
"" ~ Q.
5jK -em ::::l'!:S '0-;
Rural population in '000 ~-.l9:8
Person
16
2,957
2,281
8,627
2,121
Male
19
1,515
1,165
4,408
1,083
5,820 2,997
20,952 10,680
993 512
1,973 1,018
749 382
1,748 879
413 204
1,782 896
1,006 522
1,011 524
830 425
666 340
1,645 836
1,142 598
973 505
1,807 916
318 161
1,273 638
1,732 869
892 454
31,287 15,749
1,243 628
324 164
682 343
254 128
1,201 603
1,349 678
2,068 . 1,041
I: «I ~"3 ~Q.
Female &8. 20 21
1.442 7.36
1,116 10.05
4,219 10.24
1,038 50.36
100.00
2,823 15.72
10,272 22.25
480 4.15
955 5.96
368 5.31
869 23.23
209 17.43
886 6.41
483 13.73
487 3.53
404 10.56
326 5.13
808 6.53
544 52.36
468 45.28
891 35.12
158 12.60
635 5.49
862 16.85
438 55.02
15,538 49.30
615 49.41
160 48.63
339 49.15
126 49.64
599 48.88
671 49.42
1,027 49.48
173
I: 0
"" ~ &. 0
-0. e!_ ~.l9 g '0 0 (1)-CDC .l9.~ 1:1
r~· o..!t 22
92.61
89.91
89.76
49.64
0.00
84.26
77.76
95.94
94.04
94.69
76.77
82.77
93.59
86.35
96.47
89.44
94.87
93.47
47.64
54.72
64.88
87.12
94.51
83.15
44.98
85.01
92.35
63.53
72.86
92.70
65.59
86.36
93.03
Person
23
63.44
55.57
74.90
77.01
80.86
69.45
53.60
39.21
44.95
43.24
57.74
52.20
44.50
50.09
43.13
37.61
30.65
47.94
67.00
62.10
64.57
53.58
51.74
50.17
68.79
63.10
63.99
70.65
67.25
60.36
64.86
59.24
51.91
Literacy rate
Male Female
24 25
76.76' 49.43
73.72 36.50
84.91 64.42
83.22 70.11
83.79
79.19
67.30
54.36
58.91
55.64
71.81
70.94
62.09
66.38
57.52
47.93
40.23
62.86
79.54
76.04
76.56
67.28
63.50
65.60
79.44
75.30
77.41
82.16
78.99
73.33
75.34
71.99
65.76
77.30
59.01
38.90
22.87
29.88
30.24
42.87
33.61
26.62
31.99
27.39
26.56
20.61
32.35
52.43
46.33
51.72
39.64
39.95
34.37
57.32
50.50
50.26
58.48
55.16
47.18
53.88
46.22
37.84
Work participation rate
Person
26
44.70
44.45
39.03
33.67
37.56
32.47
37.50
38.91
37.82
37.79
34.69
35.04
33.85
37.13
40.26
41.83
44.12
44.24
27.70
28.65
38.67
42.08
48.93
44.06
34.93
38.80
44.08
37.20
45.03
46.06
40.36
39.77
46.23
Male Female
27 28
56.75 32.04
52.31 36.21
54.50 22.82
55.85 9.19
58.06 12.84
51.82 11.83
48.00 26.40
47.24 30.00
47.16 27.84
47.01 28.18
45.36 23.46
45.27 24.83
45.64 21.85
49.31 23.80
50.87 28.81
51.17 31.91
52.23 35.65
53.41 34.69
43.64 9.47
43.69 11.84
47.60 29.14
47.38 36.64
52.89 44.93
51.18 36.77
48.65 20.18
52.50 24.70
56.59 31.26
50.96 22.64
54.13 35.65
53.40 38.58
51.33 28.88
51.22 28.05
52.44 39.89

Name of Statel Union Territory/District
2
8 BALESHWAR
9 BHADRAK
10 KENDRAPARA
11 JAGATSINGHAPUR
12 CUTTACK
13 JAJAPUR
14 DHENKANAL
15 ANUGUL
16 NAYAGARH
17 KHORDHA
18 PURl
19 GANJAM
20 GAJAPATI
21 KANDHAMAL
22 BAUDH
23 SONAPUR
24 BALANGIR
25 NUAPADA
26 KALAHANDI
27 RAYAGADA
28 NABARANGAPUR
29 KORAPUT
30 MALKANGIRI
22 CHHAmSGARH
KORIYA
2 SURGUJA
3 JASHPUR
4 RAIGARH
5 KORBA
6 JANJGIR-CHAMPA
7 BILASPUR
8 KAWARDHA
9 RAJNANDGAON
10 DURG
Area in km2
3
3806.0
2505.0
2644.0
1668.0
3932.0
2899.0
4452.0
6375.0
3890.0
2813.0
3479.0
8206.0
4325.0
8021.0
3098.0
2337.0
6575.0
3852.0
7920.0
7073.0
5291.0
8807.0
5791.0
135191.0
6604.0
15731.0
5838.0
7086.0
6599.0
3852.0
8270.0
4223.0
8068.0
8549.0
4
532
532
492
634
595
560
240
179
222
667
432
385
120
81
121
232
203
138
169
118
194
134
87
154
89
125
127
179
153
342
242
138
159
329
5
18
11
7
7
19
10
10
20
9
15
12
22
9
15
6
7
12
6
11
11
10
19
8
97
4
9
4
6
4
8
8
2
8
11
6
12
7
9
8
14
10
8
8
8
10
11
22
7
12
3
6
14
5
13
11
10
14
7
146
5
19
8
9
5
9
10
4
9
12
7
5
3
2
2
8
2
3
9
4
7
4
19
2
2
8
2,952
1,311
1,540
1,288
1,950
1,778
1,215
1,910
1,695
1,551
1,715
3,212
1,619
2,546
1,186
3 959
4 1,794
2 663
4 2,236
5 2,667
3 901
5 2,028
2 1,045
97 20,308
6 661
7 1,774
2 765
5 1,477
4 719
8 900
14 1,612
2 1,009
7 1,659
12 1,790
174
Population in '000
Person
9
2,025
1,334
1,302
1,058
2,341
1,624
1,067
1,140
865
1,877
1,503
3,161
519
648
373
542
1,337
531
1,335
831
1,026
1,181
504
20,834
586
1,972
743
1,266
1,012
1,317
1,998
585
1,283
2,810
Male Female
10
1,037
676
646
539
1,208
824
544
587
446
987
763
1,582
255
323
188
11
988
658
656
519
1,133
801
523
553
418
891
739
1,579
263
325
185
276 266
674 663
264 266
668 668
410 421
515 511
591 590
253 252
10,474 10,360
301 285
1,000 972
372 371
635 631
515 497
659 658
1,014 984
292 293
634 649
1,418 1,393
POPULATION
Populatlon age group 0-6 in '000
Person
12
296
193
175
125
287
218
146
164
113
230
189
475
93
117
61
77
192
85
218
145
187
201
90
3,555
100
378
123
202
172
225
348
111
217
Male Female
13
152
99
90
65
148
113
76
85
59
120
98
245
47
60
31
39
97
43
110
73
94
101
45
1,800
51
191
62
103
87
114
177
56
110
223
14
144
93
85
60
139
106
70
79
54
111
91
230
45
58
30
38
94
42
108
72
93
100
44
1,755
49
187
61
99
85
110
171
55
108
215
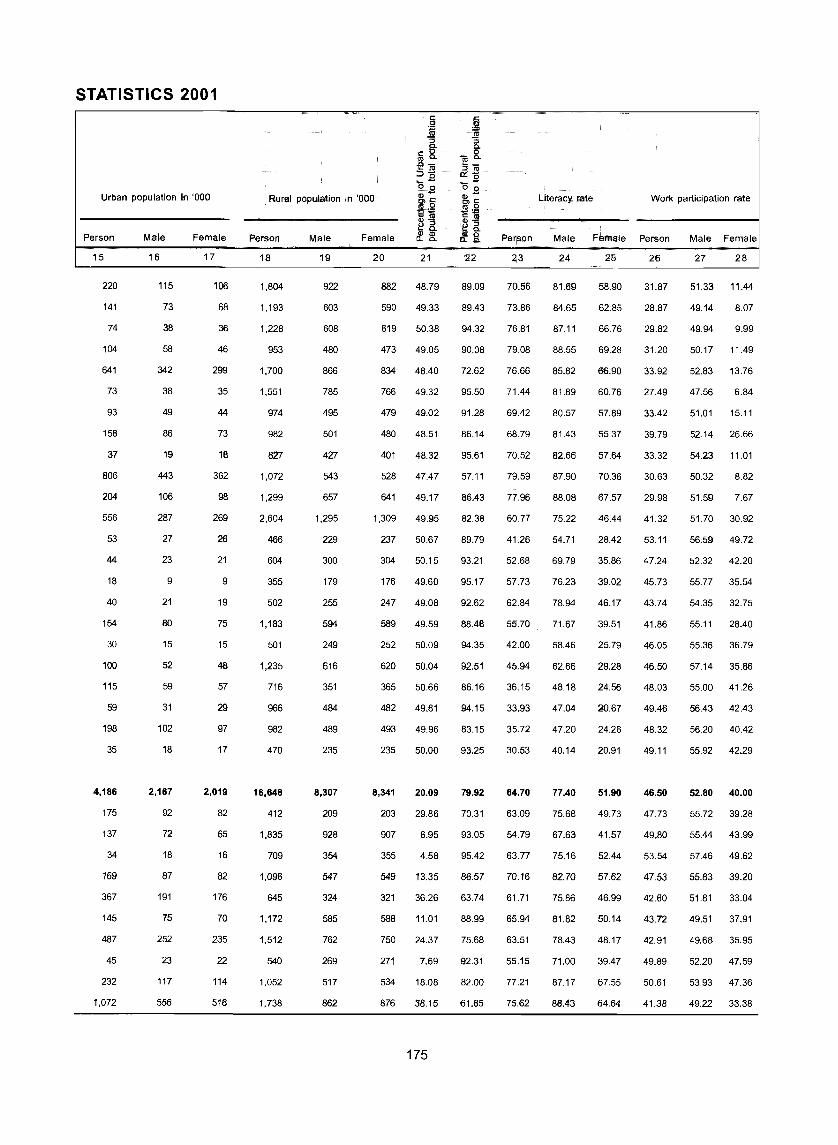
STATISTICS 2001
Urban population in '000
Person
15
220
141
74
104
641
73
93
158
37
806
204
556
53
44
18
40
154
30
100
115
59
198
35
4,186
175
137
34
169
367
145
487
45
232
1,072
Male
16
115
73
38
58
342
38
49
86
19
443
106
287
27
23
9
21
80
15
52
59
31
102
18
2,167
92
72
18
87
191
75
252
23
117
556
Female
17
106
68
36
46
299
35
44
73
18
362
98
269
26
21
9
19
75
15
48
57
2.9
97
17
2,019
82
65
16
82
176
70
235
22
114
516
C 0
~ 0.
cR .e-:>~ .... -o 0
Rural population in '000 QJ-OlC
~i
Person
18
1,804
1,193
1,228
953
1,700
1,551
974
982
827
1,072
1,299
2,604
466
604
355
502
1,183
501
1,235
716
966
982
470
16,648
412
1,835
709
1,096
645
1,172
1,512
540
1,052
1,738
Male
19
922
603
608
480
866
785
495
501
427
543
657
1,295
229
300
179
255
594
249
616
351
484
489
235
8,307
209
928
354
547
324
585
762
269
517
862
~-g_ Female ~R
20 21
882 48.79
590 49.33
619 50.38
473 49.05
834 48.40
766 49.32
479 49.02
480 48.51
401 48.32
528 47.47
641 49.17
1,309 49.95
237 50.67
304 50.15
176 49.60
247 49.08
589 49.59
252 50.09
620 50.04
365 50.66
482 49.81
493 49.96
235 50.00
8,341 20.09
203 29.86
907 6.95
355 4.58
549 13.35
321 36.26
588 11.01
750 24.37
271 7.69
534 18.08
876 38.15
175
C g .!!< ::> 0.
aiR ~~ _-.0.s
&§ 3·_ iji!2 (.) ::> .... 0. QJ 0 0..0-
22
89.09
89.43
94.32
90.08
72.62
95.50
91.28
86.14
95.61
57.11
86.43
82.38
89.79
93.21
95.17
92.62
88.48
94.35
92.51
86.16
94.15
83.15
93.25
79.92
70.31
93.05
95.42
86.57
63.74
88.99
75.68
92.31
82.00
61.85
Person
23
70.56
73.86
76.81
79.08
76.66
71.44
69.42
68.79
70.52
79.59
77.96
60.77
41.26
52.68
57.73
62.84
55.70
42.00
45.94
36.15
33.93
35.72
30.53
64.70
63.09
54.79
63.77
70.16
61.71
65.94
63.51
55.15
77.21
75.62
Literacy rate
Male
24
81.69
84.65
87.11
88.55
85.82
81.89
80.57
81.43
82.66
87.90
88.08
75.22
54.71
69.79
76.23
78.94
71.67
58.46
62.66
48.18
47.04
47.20
40.14
77.40
75.68
67.63
75.16
82.70
75.86
81.82
78.43
71.00
87.17
86.43
Female
25
58.90
62.85
66.76
69.28
66.90
60.76
57.89
55.37
57.64
70.36
67.57
46.44
28.42
35.86
39.02
46.17
39.51
25.79
29.28
24.56
20.67
24.26
20.91
51.90
49.73
41.57
52.44
57.62
46.99
50.14
48.17
39.47
67.55
64.64
Work participation rate
Person
26
31.87
28.87
29.82
31.20
33.92
27.49
33.42
39.79
33.32
30.63
29.98
41.32
53.11
47.24
45.73
43.74
41.86
46.05
46.50
48.03
49.46
48.32
49.11
46.50
47.73
49.80
53.54
47.53
42.60
43.72
42.91
49.89
50.61
41.38
Male Female
27 28
51.33 11.44
49.14 8.07
49.94 9.99
50.17 11.49
52.83 13.76
47.56 6.84
51.01 15.11
52.14 26.66
54.23 11.01
50.32 8.82
51.59 7.67
51.70 30.92
56.59 49.72
52.32 42.20
55.77 35.54
54.35 32.75
55.11 28.40
55.36 36.79
57.14 35.86
55.00 41.26
56.43 42.43
56.20 40.42
55.92 42.29
52.80 40.00
55.72 39.28
55.44 43.99
57.46 49.62
55.83 39.20
51.81 33.04
49.51 37.91
49.68 35.95
52.20 47.59
53.93 47.36
49.22 33.38

ci z
~ Name of Statel u Un ion Territory/District c:
~ 2
11 RAIPUR
12 MAHASAMUND
13 DHAMTARI
14 KANKER
15 BASTAR
16 DANTEWADA
23 MADHYA PRADESH
1 SHEOPUR
2 MORENA
3 BHIND
4 GWALIOR
5 DATIA
6 SHIVPURI
7 GUNA
8 TIKAMGARH
9 CHHATARPUR
10 PANNA
11 SAGAR
12 DAMOH
13 SATNA
14 REWA
15 UMARIA
16 SHAH DOL
17 SIDHI
18 NEEMUCH
19 MANDSAUR
20 RATLAM
21 UJJAIN
22 SHAJAPUR
23 DEWAS
24 JHABUA
25 DHAR
26 INDORE
27 WEST NIMAR
Area in km2
3
13083.0
4789.0
3385.0
6506.0
14974.0
17634.0
308245.0
6606.0
4989.0
4459.0
4560.0
2691.0
10277.0
11064.0
5048.0
8687.0
7135.0
10252.0
7306.0
7502.0
6314.0
4076.0
9952.0
10526.0
4256.0
5535.0
4861.0
6091.0
6195.0
7020.0
6778.0
8153.0
3898.0
8030.0
4
231
180
209
100
5
13
3
3
6
6
15
5
4
7
7
14
5
2
8
2,191
1,147
659
1,073
87 4 14 4 1,510
41 4 11 4 1,362
196 259 313 394 55.393
85 3 3 3 607
319 6 7 8 814
320 7 6 11 935
358 3 4 8 652
233 3 3 4 602
140 7 8 7 1,462
151 9 9 9 2,235
238 6 6 13 963
170 7 8 15 1,188
120 5 5 6 1,015
197 9 11 17 2,076
148 7 7 6 1,213
249 7 8 11 2,052
313 7 9 12 2,725
127
158
174
171
214
250
281
208
186
206
213
633
190
8
9
3
5
6
7
8
6
8
7
4
8
3
9
8
3
5
6
6
8
6
12
13
4
9
4
20
5
8
9
9
8
12
11
8
11
13
7
176
660
1,438
1,808
806
943
1,072
1,107
1,117
1,125
1,357
1,552
640
1,420
Population in '000
Person Male Female
9 ... 10
3,017 1,524
860 426
707 353
651 325
11
1,493
434
354
326
POPULATION
Population age group 0-6 in '000
Person Male Female
12
516
137
117
107
13
262
69
59
54
14
253
68
58
53
1,307 650 657 232 116 117
719 357 363 133 66 67
60.348 31.444 28.904 10.782 5,580 5.202
559 295 264 112 58 54
1,593 874 719 299 162 136
1,429 781 648 255 139 116
1,632 883 749 255 138 117
628 338 290 108 58 51
1,442 776 666 282 148 134
1,667 884 783 327 169 157
1,203 638 565 229 120 110
1,475 789 686 289 151 138
857 451 406 171 89 83
2,022 1,073 949 370 191 178
1,084 570 514 196 101 95
1,870 971 899 346 179 167
1,973 1,017 957 375 194 180
516
1,575
1,831
726
1,184
1.215
1,711
1,291
1,308
1,395
1,740
2,466
1,530
265 251
805 770
948 883
372 354
605 579
621 595
883 828
670 621
678 630
702 693
890 850
1,289 1,176
785 745
98
268
377
116
197
214
279
235
231
320
339
370
291
50
136
193
60
101
109
144
121
120
162
174
194
148
48
132
184
56
96
105
135
113
111
158
164
176
143

STATISTICS 2001
Urban population In '000
Person
15
918
98
94
31
130
52
15,967
89
343
339
983
138
240
355
213
324
108
591
204
386
321
83
398
261
203
221
368
663
239
358
121
288
1.730
235
Male
16
476
50
47
16
66
27
8,413
47
186
184
529
74
128
187
112
173
57
312
108
205
171
43
210
141
105
114
190
344
125
187
63
154
910
122
Female
17
441
48
47
15
64
25
7,555
41
157
155
454
64
112
168
101
151
51
279
97
181
150
40
188
120
98
107
179
319
115
172
58
134
821
113
e
.1 .0-
:s~ ...... 00 Cb-
Rural population in '000 Ole ~,g
Person
18
2.099
763
613
620
1.177
667
44,381
471
1.249
1,090
649
491
1.202
1.312
990
1,150
748
1,431
880
1,485
1.653
433
1.177
1.570
523
963
847
1.048
1,051
950
1,274
1,452
735
1,294
Male
19
1,048
376
306
309
583
330
23,031
248
688
597
354
265
648
697
526
616
393
761
463
767
646
222
595
807
267
491
431
539
545
491
639
737
380
662
Cb.ll! (j ::J ~c.
Female Cb 0 (1;.0.
20 21
l,os2 30.43
386 11.40
307 13.30
311 4.76
593 9.95
338 7.23
21,350 26.46
223 15.92
562 21.53
493 23.72
295 60.23
226 21.97
554 16.64
615 21.30
464 17.71
535 21.97
355 12.60
670 29.23
417 18.82
718 20.64
807 16.27
211 16.09
582 25.27
763 14.25
256 27.96
472 18.67
416 30.29
510 38.75
506 18.51
459 27.37
634 8.67
715 16.55
356 70.15
632 15.36
177
e
~ ::l C. 0
E~ ::l '" lXo .... .. 0,9 Cb § j.-e'lij
~~ cfg
22
69.57
88.72
86.70
95.24
90.05
92.77
73.54
84.26
78.41
76.28
39.77
78.18
83.36
78.70
82.29
77.97
87.28
70.77
81.18
79.41
83.78
83.91
74.73
85.75
72.04
81.33
69.71
61.25
81.41
72.63
91.33
83.45
29.81
84.58
Person
23
68.51
67.01
74.89
72.93
43.91
30.17
63.70
46.40
64.74
70.52
69.38
71.83
58.86
59.55
55.73
53.26
61.36
67.73
61.75
64.61
62.01
59.13
58.71
52.27
66.16
70.31
67.17
70.86
70.86
60.94
36.89
52.45
75.15
63.05
Literacy rate
Male
24
81.97
81.08
86.51
82.72
56.32
39.75
76.10
61.76
79.89
83.19
80.36
84.29
74.11
74.13
68.68
65.28
73.33
79.41
74.67
77.14
75.65
72.89
71.80
67.36
82.53
85.24
79.52
83.05
83.29
75.74
47.97
65.75
84.60
74.79
Female
25
54.81
53.30
63.39
63.25
31.64
20.75
50.30
29.07
46.24
55.23
56.40
57.23
40.84
42.88
40.99
39.26
47.97
54.35
47.30
51.05
47.58
44.54
44.99
35.98
48.99
54.73
54.28
57.87
57.42
45.03
25.70
38.57
64.81
50.64
Work participation rate
Person
26
41.92
47.86
50.13
54.05
52.61
52.85
42.70
40.98
37.08
36.78
32.51
50.30
45.24
40.98
47.06
40.18
43.62
41.53
44.88
39.85
43.73
42.16
43.29
41.37
47.97
48.18
45.08
44.14
48.80
44.37
52.51
46.62
36.24
46.05
Male Female
27 28
50.18 33.49
55.25 40.61
54.05 46.23
56.96 51.17
57.30 47.97
57.26 48.51
51.50 33.20
49.43 31.53
48.04 23.75
48.31 22.87
47.65 14.66
56.37 43.23
52.05 37.30
51.44 29.15
52.20 41.27
49.28 29.70
51.26 35.14
51.38 30.40
53.06 35.80
48.41 30.60
49.39 37.72
50.51 33.34
52.17 34.01
48.02 34.24
55.39 40.14
55.64 40.38
53.57 36.21
53.77 33.88
55.08 42.01
51.76 36.42
54.30 50.69
52.48 40.49
51.84 19.14
52.29 39.49

Name of Statel Union Territory/District
2
28 BARWANI
29 EAST NIMAR
30 RAJGARH
31 VIDISHA
32 BHOPAL
33 SEHORE
34 RAISEN
35 BETUL
36 HARDA
37 HOSHANGABAD
38 KATNI
39 JABALPUR
40 NARSIMHAPUR
41 DINDORI
42 MANDLA
43 CHHINDWARA
44 SEONI
45 BALAGHAT
24 GUJARAT
KACHCHH
2 BANAS KANTHA
3 PATAN
4 MAHESANA
5 SABAR KANTHA
6 GANDHINAGAR
7 AHMADABAD
8 SURENDRANAGAR
9 RAJKOT
10 JAM NAGAR
11 PORBANDAR
12 JUNAGADH
13 AMRELI
14 BHAVNAGAR
15 ANAND
Area in km"
3
5422.0
10776.0
6153.0
7371.0
2772.0
6578.0
8466.0
10043.0
3330.0
6707.0
4950.0
5211.0
5133.0
7470.0
5800.0
11815.0
8758.0
9229.0
196024,0
45652.0
10757.0
5740.0
4371.0
7390.0
2166.0
8087.0
10489.0
11203.0
14125.0
2298.0
8846.0
7397.0
9981.0
2941.0
4
199
159
204
165
665
164
133
139
142
162
215
413
187
78
154
157
133
162
258
35
233
206
420
282
616
719
144
283
135
234
277
188
247
631
5
6
5
6
7
2
5
7
5
3
7
4
4
5
2
4
9
6
6
226
10
12
8
9
13
4
11
10
14
10
3
14
11
11
8
6
7
9
6
7
2
5
7
10
3
7
6
7
6
7
9
11
8
10
226
10
12
8
9
13
4
11
10
14
10
3
14
11
11
8
I 5: '0 o z
7 8
6 746
8 1,062
12 1,729
5 1,616
2 538
7 1,076
10 1,501
7 1,407
3 567
10 976
4 953
17 1,441
5 1,079
2 924
4 1,231
24 1,975
4 1,598
9 1,390
242 18,539
8 950
6 1,249
5 517
8 603
8 1,389
10 291
25 547
7 654
10 846
16 756
5 182
12 1,038
8 617
13 798
12 350
178
Population in '000
Person Male Female
9 10 11
1,081 549 533
1,713 885 828
1,254 649 605
1,215 648 567
1,844 973 871
1,079 565 514
1,125 598 527
1,395 710 685
474 247 227
1,084 572 512
1,064 548 516
2,151 1,127 1,024
958 502 456
581 292 289
894 448 446
1,849 947 902
1,167 589 578
1,498 741 757
50,671 26,386 24,285
1,583 815 768
2,504 1,297 1,207
1,183 612 571
1,838 954 884
2,083 1,070 1,013
1,334 698 636
5,817 3,075 2,742
1,515 788 727
3,170 1,642 1,528
1,904 981 923
537 276 261
2,448 1,252 1,196
1,394 702 692
2,470 1,275 1,195
1,857 972 885
POPULATION
Population age group 0-6 in '000
Parson Male Female
12 13
238 121
310 159
232 120
231 119
289 150
205 107
212 110
235 119
87 45
176 91
191 98
307 159
154 80
98 49
144 73
298 152
197 100
231 117
7,532 4,000
254 132
468 246
190 102
258 143
325 173
186 102
770 419
247 131
427 230
274 144
76 40
370 194
199 105
402 214
255 138
14
117
150
112
112
139
99
103
116
42
85
93
148
74
48
72
146
97
11'4
3,532
122
223
88
115
152
83
350
116
197
130
36
175
94
188
117

STATISTICS 2001
Urban population in '000
Person
15
158
460
217
260
1.483
194
207
259
101
334
225
1,227
153
27
92
452
121
194
18,930
475
276
238
412
225
467
4,664
402
1,626
836
261
712
313
935
508
Male
16
81
238
113
138
781
102
111
135
53
176
118
648
80
14
47
235
62
98
10,068
248
145
125
217
117
248
2,473
211
849
436
135
367
161
493
265
Female
17
77
222
104
122
701
92
96
124
48
158
107
580
73
13
45
217
58
96
8,862
227
131
114
195
108
220
2,190
191
777
400
127
345
152
442
243
c .Q 'iii :; 0.
allS. .Q -... 0:> ::J'5 _-o 0
Rural population in '000 ~~ s:8
Person
18
923
1,253
1,037
954
361
885
918
1,136
373
750
839
924
805
554
802
1,397
1,046
1,304
31,741
1,108
2,229
944
1,426
1,857
867
1,153
1,113
1,544
1,068
275
1,737
1,081
1,535
1,349
Male
19
467
647
536
510
191
463
487
575
194
395
430
480
421
278
401
712
526
642
16,318
567
1,153
487
737
952
450
601
577
793
545
141
885
540
782
707
as~ Q:::l ... 0.
Female &8. 20 21
456 14,62
606 26.85
501 17.30
445 21.40
169 80.42
422 17.98
431 18.40
561 18.57
179 21.31
355 30.81
409 21.15
444 57.04
383 15.97
276 4.65
402 10.29
685 24,45
520 10.37
662 12.95
15,423 37.36
541 30.01
1,076 11.02
457 20.12
689 22,42
905 10.80
417 35.01
552 80.18
536 26.53
751 51.29
523 43.91
134 48.60
851 29.08
541 22,45
752 37.85
642 27.36
179
c
~ :I 0. 0
"!~ :::l '" 0::-_.9 o 0 (1)-
"'c: .!:B ~.!!1 ~ 5. ~8.
22
85.38
73.15
82.70
78.52
19.58
82.02
81.60
81,43
78.69
69.19
78.85
42.96
84.03
95.35
89.71
75.55
89.63
87.05
62.64
69.99
89.02
79.80
77.58
89.15
64.99
19.82
73.47
48.71
56.09
51.21
70.96
77.55
62.15
72.64
Person
23
41.53
61.76
53.70
61.83
74.61
63.07
72.16
66.38
66.51
70.00
63.56
75.69
77.73
54.17
59.61
65.81
65.61
68.72
69.10
59.79
50.97
60.36
75.22
66.65
76.59
79.50
61.61
74.16
66,48
68.62
67.78
66.09
66.20
74.51
Literacy rate
Male
24
50.96
73.73
69.14
74.23
81.94
77.28
81.58
76.81
77.94
80.83
77.94
84.56
86.13
69.95
73.72
76,45
77.18
80.63
79.70
70.39
66.47
73.63
86.20
80.42
87.74
87.31
74.19
82.61
76.25
78.36
78.74
76.44
78.02
86.09
Female
25
31.82
48.95
37.10
47.40
66.37
47.36
61.30
55.58
54.06
57.83
48.24
65.88
68,47
38.24
45,49
54.63
53.82
57.18
57.80
48.59
34,40
46.33
63.65
52.30
64.58
70.83
48.10
65.20
56.18
58,42
56,43
55.78
53.73
61.94
Work participation rate
Person
26
48.43
43.94
49.88
37.19
32.08
41.84
36.59
44.15
44.94
35.70
41.69
37.17
42.13
56.98
51.93
42.15
48.78
50.31
41.90
38.25
43.61
45.07
45.08
45.16
41.54
34.55
42.74
39.27
38.56
40.07
40.88
43.10
38.25
42.26
Male Female
27 28
53.01 43.71
52.83 34.43
54.57 44.84
51.15 21.23
47.43 14.94
48.85 34.14
49.55 21.88
51.01 37.05
52.77 36.43
49.30 20.53
51.47 31.30
50.34 22.67
53.95 29.13
58.92 55.03
55.55 48.31
50.85 33.02
53.98 43.48
54.35 46.35
54.90 27.90
53.63 21.93
51.20 35,46
53.23 36.32
53.73 35.75
52.28 37.63
53.07 28.89
53.09 13.75
54.02 30.53
55.94 21.36
54.68 21,43
55.83 23,42
54.59 26.52
55.02 31.02
53.42 22.05
55.09 28.17

Name of State/ Union Territory/District
2
16 KHEDA
17 PANCH MAHALS
18 DOHAD
19 VADODARA
20 NARMADA
21 BHARUCH
22 SURAT
23 THEDANGS
24 NAVSARI
25 VALSAD
25 DAMAN AND DIU
DIU
2 DAMAN
26 DADRA & NAGAR HAVEL!
DADRA & NAGAR HAVELI
27 MAHARASHTRA
NANDURBAR
2 DHULE
3 JALGAON
4 BULDANA
5 AKOLA
6 WASHIM
7 AMRAVATI
8 WARDHA
9 NAGPUR
10 BHANDARA
11 GONDIYA
12 GADCHIROLI
13 CHANDRAPUR
14 YAVATMAL
15 NANDED
16 HINGOLI
Area in km2
3
4219.0
5210.0
3655.0
7550.0
2755.0
6527.0
7657.0
1764.0
2209.0
3035.0
112.0
40.0
72.0
491.0
491.0
307713.0
5955.0
7195.0
11765.0
9661.0
5676.0
4898.0
12210.0
6309.0
9892.0
4087.0
5234.0
14412.0
11443.0
13582.0
10528.0
4827.0
4
480
389
448
482
187
210
652
106
557
465
1,413
1,105
1,583
449
449
315
220
237
313
231
287
208
214
196
411
278
229
67
181
181
273
205
5
10
11
7
12
4
8
15
5
5
2
353
6
4
15
13
7
6
14
8
14
7
8
12
14
16
16
5
i ci d '0 d z
6
10
11
7
12
4
8
15
5
5
2
353
6
4
15
13
7
6
14
8
14
7
8
12
14
16
16
5
7
8
6
4
16
3
8
18
o
9
17
2
2
2
378
5
3
15
11
8
4
11
7
29
6
2
2
14
13
13
4
180
8
615
1,215
693
1,553
612
663
1,264
311
374
452
23
2
21
70
70
43,711
947
681
1,519
1,433
986
789
2,002
1,382
1,869
870
950
1,679
1,791
2,130
1,609
710
POPULATION
Population in '000 Population age group
0-6 in '000
Person Male Female Person Male Female
9
2,024
2,025
1,636
3,642
514
1,371
4,995
187
1,229
1,411
158
44
114
220
220
96,879
1,312
1,708
3,683
2,232
1,630
1,020
2,607
1,237
4,068
1,136
1,201
970
2,071
2,458
2,876
987
10
1,053
1,045
824
1,897
264
714
2,723
94
629
735
93
21
72
122
122
11
971
980
812
1,744
250
657
2,273
93
6DO
676
66
23
42
99
99
12
296
341
334
493
81
194
700
37
149
206
21
8
13
40
40
13
158
176
170
262
42
101
374
19
78
106
11
4
7
20
20
50,401 46,478 13,671 7,146
664 648 230 117
878 830 255 134
1,905 1,777 526 280
1,147 1,085 340 178
841 789 236 122
526 494 160 84
1,346 1,262 358 184
639 598 156 81
2,105 1,962 526 271
573 563 154 79
599 602 171 87
491 479 155 79
1,063 1,008 279 144
1,266 1,193 369 191
1,481 1,395 477 247
505 482 167 87
14
138
165
164
232
39
93
326
18
71
99
10
4
6
20
20
6,525
113
121
246
162
114
77
174
75
255
75
84
76
135
178
230
80

STATISTICS 2001
Urban population in '000
Person
15
406
253
156
1,646
52
353
2,996
336
381
57
22
36
50
50
41,101
203
446
1,053
473
627
178
900
325
2,614
176
143
67
665
457
689
154
Male
16
211
132
80
863
27
185
1,696
176
208
29
10
19
30
30
21,942
105
232
548
245
324
92
465
168
1,354
90
73
34
347
236
358
80
Female
17
195
121
76
783
25
168
1,300
161
173
28
12
17
21
21
19,159
98
214
504
228
304
86
434
157
1,260
86
71
33
319
221
331
74
c: c:
i I :; a. Q.
c: 0 -8. eGa. €m f!_
::JS ::::J- 0::0 .s 0,9
_-o 0
Rural population in '000 ~g Q)-;; 010
Person
18
1,618
1,772
1,480
1,996
462
1,018
1,999
187
893
1029
101
23
78
170
170
55,778
1,109
1,262
2,630
1,759
1,003
842
1,708
912
1,454
960
1,057
903
1,406
2,001
2,187
833
Male
19
841
913
744
1,034
237
529
1,027
94
453
526
64
11
53
92
92
28,459
559
646
1,357
902
517
434
880
471
752
484
526
457
716
1,030
1,123
426
~= Q).!l ~a
Female ~8.
20 21
776 20.06
859 12.49
736 9.54
961 45.19
226 10.12
489 25.75
973 59.98
~~ ~~ ~8.
22
79.94
87.51
90.46
54.81
89.88
74.25
40.02
93 0.00 100.00
440 27.34
503 27.00
37 36.25
12 48.80
26 31.38
78 22.89
78 22.89
27,319 42.42
551 15.47
616 26.11
1,273 28.59
857 21.19
485 38.47
408 17.45
827 34.52
441 26.27
702 64.26
477 15.49
531 11.91
446 6.91
690 32.11
972 18.59
1,064 23.96
407 15.60
181
72.66
72.93
31.88
51.20
68.62
77.11
77.11
57.57
84.53
73.89
71.41
78.81
61.53
82.55
65.52
73.73
35.74
84.51
88.01
93.09
67.89
81.41
76.04
84.40
Person
23
71.96
60.92
45.15
70.76
59.86
74.41
74.65
59.65
75.83
69.15
78.20
71.38
80.65
57.63
57.63
76.90
55.78
71.65
75.43
75.78
81.41
73.37
82.54
80.06
84.03
78.47
78.52
60.10
73.17
73.62
67.77
66.25
Literacy rate
Male
24
85.99
75.91
58.88
80.04
72.44
82.98
81.51
70.68
82.77
77.90
86.80
84.39
87.38
71.18
71.18
86.00
66.16
81.40
85.91
86.93
88.91
85.44
88.91
87.18
90.18
88.97
89.61
71.86
82.94
84.09
80.44
80.71
Female
25
56.90
44.94
31.28
60.73
46.61
65.11
66.36
48.51
68.61
59.62
65.60
60.09
68.60
40.23
40.23
67.00
45.18
61.39
64.30
64.07
73.43
60.57
75.73
72.45
77.42
67.82
67.58
48.07
62.89
62.52
54.35
51.17
Work participation rate
Person
26
44.87
48.23
49.78
41.71
50.37
41.64
43.69
49.80
Male Female
27 28
55.07 33.80
53.40 42.72
51.66 47.87
55.86 26.31
56.47 43.95
56.56 25.42
60.68 23.34
52.36 47.21
44.35 56.53 31.58
46.10 57.39 33.82
46.00 65.50 18.60
31.35 44.90 19.23
51.70 71.47 18.26
51.76 62.33 38.74
51.76 62.33 38.74
42.50 53.30 30.80
46.51 51.91 40.97
43.21 51.71 34.20
42.47 51.27 33.03
45.51 52.00 38.65
39.76 51.80 26.93
44.63 50.89 37.96
42.02 53.81 29.46
44.50 54.56 33.75
37.82 51.85 22.77
47.25 52.84 41.56
48.27 53.27 43.29
51.23 55.47 46.89
44.94 53.40 36.03
45.52 53.32 37.23
41.79 48.73 34.42
46.60 51.34 41.62

Name of State/ Union Territory/District
2
17 PARBHANI
18 JALNA
19 AURANGABAD
20 NASHIK
21 THANE
22 MUMBAI (SUBURBAN)
23 MUMBAI
24 RAIGARH
25 PUNE
26 AHMADNAGAR
27 BID
28 LATUR
29 OSMANABAD
30 SOLAPUR
31 SATARA
32 RATNAGIRI
33 SINDHUDURG
34 KOLHAPUR
35 SANGLI
28 ANDHRAPRADESH
ADILABAD
2 NIZAMABAD
3 KARIMNAGAR
4 MEDAK
5 HYDERABAD
6 RANGAREDDI
7 MAHBUBNAGAR
8 NALGONDA
9 WARANGAL
10 KHAMMAM
11 SRIKAKULAM
12 VIZIANAGARAM
13 VISAKHAPATNAM
14 EAST GODAVARI
Area in km2
3 4 5 6
6214.0 246 9 9
7718.0 209 8 8
10107.0 287 9 9
15530.0 322 15 15
9558.0 851 15 15
446.0 19,373 o o
157.0 21,261 o o
7152.0 309 15 15
15643.0 462 14 14
17048.0 237 14 14
10693.0 202 11 11
7157.0 291 10 10
7569.0 196 8 8
14895.0 258 11 11
10480.0 268 11 11
8208.0 207 9 9
5207.0 167 8 8
7685.0 458 12 12
8572.0 301 9 9
275045.0 277 1,125 1,125
16105.0 154 52 52
7956.0 295 36 36
11823.0 295 56 56
9700.0 275 45 45
217.0 17,649 16 16
7493.0 477 37 37
18432.0 191 64 64
14240.0 228 59 59
12846.0 253 51 51
16029.0 161 46 46
5837.0 435 38 38
6539.0 344 34 34
11161.0 343 43 43
10807.0 454 59 59
7
8
4
9
18
37
o
26
25
18
6
5
8
10
15
10
5
18
8
210
15
3
7
11
3
16
7
9
2
9
6
12
9
14
182
rJJ
j > '0
8
841
971
1,344
1,929
1,748
o
o
1~919
1,866
1,587
1,365
944
734
1,150
1,739
1.543
743
1,217
724
28,123
1.729
918
1,092
1,254
o
923
1,550
1,148
1,071
1,229
1,814
1,524
3.294
1,379
POPULATION
Population in '000 Population age group
0-6 in '000
Person
9
1,528
1,613
2,897
4,994
8,132
8,640
3,338
2,208
7,233
4,041
2,161
2,080
1,487
3,850
2,809
1,697
869
3,523
2,584
76,210
2,488
2,346
3,492
2,670
3,830
3,575
3,514
3,248
3,246
2,579
2,538
2,249
3,832
4,901
Male Female
10
780
827
1,505
2,591
4,378
4,742
1,878
11
748
786
1,392
2,403
3,754
3,899
1,460
Person
12
252
261
468
789
1,145
1,025
340
1,118 1,090 315
3,769 3,463 969
2,083 1,958 590
1,116 1,045 335
1,075 1,005 327
769 717 223
1,990 1,860 570
1,408 1,401 369
794 902 237
418 451 106
1,807 1,716 450
1,320 1,263 342
38,527 37,683 10,172
1,251 1,237 377
1,163 1,183 337
1,748 1,744 466
1,352 1,318 403
1,981 1,849 486
1,839 1,736 500
1,782 1,732 548
1,652 1,596 456
1,645 1,601 453
1,306 1,273 350
1,260 1,278 336
1,120 1,130 296
1,930 1,902 493
2;>460 2,442 613
Male Female
13
131
137
248
411
593
533
177
162
509
313
177
170
118
301
196
121
54
245
185
5,187
192
172
238
205
250
255
281
234
232
178
171
149
250
310
14
121
124
220
378
552
492
163
152
459
277
158
156
105
269
172
115
51
205
157
4,985
185
165
228
198
236
245
267
222
221
172
165
146
244
303

STATISTICS 2001
Urban population in '000
Person
15
485
308
1,087
1,938
5,902
8,640
3,338
535
4,201
804
387
490
233
1,225
398
192
82
1,050
633
20,809
660
425
679
384
3,830
1,938
371
433
623
511
279
412
1,531
1,152
. Male
16
250
159
571
1,020
3,230
4,742
1,878
284
2,212
421
201
256
121
626
207
99
42
547
326
10,590
336
215
346
197
1,981
1,005
190
223
316
258
139
205
780
575
Female
17
235
148
517
918
2,673
3,899
1,460
251
1,989
382
186
234
112
599
192
93
41
503
307
10,219
324
210
333
186
1,849
933
181
210
307
253
140
208
751
577
c:
t c:8. ~1 ~i
Rural population in '000 Ig ~i
Person
18
, 1,043
1,305
1,810
3,056
2,229
1,673
3,032
3,237
1,774
1,590
1,253
2,624
2,411
1,505
787
2,473
1,950
55,401
1,828
1,921
2,813
2,287
1,637
3,143
2,815
2,623
2,068
2,259
1,837
2,301
3,750
Male
19
530
667
935
1,571
1,148
834
1,557
1,662
915
819
648
1,363
1,202
696
376
1,260
994
27,937
915
948
1,402
1,155
835
1,592
1,429
1,329
1,047
1,121
915
1,150
1,885
Femafe Ji 20 21
513 31.74
638 19.09
875 37.52
1,485 38.81
1,081 72.58
- 100.00
- 100.00
839 24.23
1,474 58.08
1,575 19.90
859 17.91
771 23.56
605 15.67
1,261 31.82
1,209 14.17
809 11.31
410 9.44
1,213 29.80
956 24.50
27,464 27.31
913 26.53
973 18.12
1,411 19.44
1,131 14.38
- 100.00
803 54.21
1,550 10.56
1,386 13.33
1,294 19.19
1,021 19.81
1,138 10.99
922 18.32
1,152 39.95
1,864 23.51
183
.§ :;
J! o:;il! ... .9 00
ji .. i £c. 22
68.26
80.91
62.48
61.19
27.41
0.00
0.00
75.77
41.92
80.10
82.09
76.44
64.26
68.16
85.83
88.69
90.56
70.20
75.46
72.70
73.47
81.88
80.56
85.66
0.00
45.79
89.44
86.67
80.81
80.19
89.01
81.68
60.05
76.51
literacy rale
Pers~!1
23
66.07.
64.40
72.94
74.36
80.66
86.89
86.40
77.03
80.45
75.30
67.99
71.54
69.02
71.25
78.22
75.05
80.30
76.93
76.62
60.50
52.68
52.02
54.90
51.65
78.80
66.16
44.41
57.15
57.13
56.89
55.31
51.07
59.96
65.48
Male
24
79.63
79.14
84.89
83.65
87.06
91.56
90.23
86.15
88.34
85.70
80.70
82.94
80.42
81.99
88.20
85.89
90.26
87.47
86.26
70.30
64.98
64.91
67.09
64.33
83.74
75.26
56.63
69.23
68.88
66.11
67.19
62.37
69.68
70.00
Female
.• 25
52.02
49.04
60.09
64.35
73.10
81.12
81.38
67.75
71.89
64.35
54.52
59.40
56.89
59.84
68.38
65.77
71.23
66.02
66.73
50.40
40.30
39.48
42.75
38.66
73.50
56.49
31.89
44.68
45.09
47.44
43.68
39.91
50.12
60.94
..
Work partiCipation rate
Person
2$
42.20
44.45
4D.62
43.77
39.11
36.49
39.30
41.40
40.85
45.96
44.31
40.40
43.96
45.28
46.41
44.99
46.61
46.92
47.17
45.80
45.15
49.44
49.02
48.45
29.24
40.21
51.89
49.10
48.25
48.25
47.36
52.20
41.82
39.58
Male Female
27. 28
49.27 34.83
50.20 38.39
49.41 31.12
52.79 34.03
55.81 19.62
55.95 12.81
59.17 13.72
52.70 29.81
53.49 27.10
52.59 38.90
49.08 39.21
48.87 31.35
50.72 36.71
53.08 36.93
53.67 39.11
51.20 39.52
54.65 39.17
56.60 36.72
56.09 37.85
56.20 35,10
52.80 37.41
54.36 44.59
54.75 43.27
55.34 41.38
47.28 9.90
53.35 26.29
56.24 47.41
54.94 43.05
54.35 41.98
56.70 39.59
56.44 38.41
59.84 44.63
55.41 28.03
58.41 20.62

Name of Slate/ Union Territory/District
2
15 WEST GODAVARI
16 KRISHNA
17 GUNTUR
18 PRAKASAM
19 NELLORE
20 CUDDAPAH
21 KURNOOL
22 ANANTAPUR
23 CHmOOR
29 KARNATAKA
1 BELGAUM
2 BAGALKOT
3 BIJAPUR
4 GULBARGA
5 BIDAR
6 RAICHUR
7 KOPPAL
8 GADAG
9 DHARWAD
10 UTIARAKANNADA
11 HAVERI
12 BELLARY
13 CHITRADURGA
14 DAVANAGERE
15 SHIMOGA
16 UDUPI
17 CHIKMAGALUR
18 TUMKUR
19 KOLAR
20 BAN GALORE
21 BANGALORE RURAL
22 MANDYA
23 HASSAN
24 DAKSHINA KANNADA
Area in km'
3 456 7 8
7742.0 491 46 46 8 883
8727.0 480 50 50 7 986
11391.0 392 57 57 11 717
17626.0 174 56 56 8 1,083
13076.0 204 46 46 5 1,192
15359.0 169 51 51 12 954
17658.0 200 54 54 10 913
19130.0 190 63 63 11 952
15151.0 247 66 66 15 1,518
191791.0 276 175 175 270 29,406
13415.0 314 10 10 22 1,270
6575.0 251 6 6 12 627
10494.0 172 5 5 6 677
16224.0 193 10 10 17 1,437
5448.0 276 5 5 6 621
6827.0 245 5 5 9 883
7189.0 166 4 4 5 629
4656.0 209 5 5 9 337
4260.0 377 5 5 6 379
10291.0 132 11 11 13 1,289
4823.0 298 7 7 9 698
8450.0 240 7 7 11 554
8440.0 180 6 6 6 1,059
5924.0 302 6 6 6 923
8477.0 194 7 7 9 1,530
3880.0 287 3 3 6 248
7201.0 158 7 7 9 1,117
10597.0 244 10 10 11 2,708
8223.0 308 11 11 12 3,311
2190.0 2,985 3 3 19 699
5815.0 324 8 8 10 1,873
4961.0 356 7 7 8 1,479
6814.0 253 8 8 9 2,559
4560.0 416 5 5 20 354
184
Population in '000
Person Male Female
9 10 11
3,804 1,910 1,893
4,188 2,117 2,070
4,465 2,250 2,215
3,059 1,552 1,507
2,669 1,345 1,324
2,602 1,318 1,284
3,529 1,796 1,733
3,640 1,860 1,781
3,746 1,890 1,856
52,851 26,899 25,952
4,215 2,150 2,064
1,652 834 818
1,807 926 880
3.131 1,593 1,538
1,502 771 731
1 ,670 842 828
1,196 603 593
972 494 478
1 ,604 823 781
1,354 687 667
1 ,439 740 699
2,027 1,030 997
1,518 776 742
1,791 918 873
1,643 831 812
1,112 522 590
1,141 575 566
2,585 1,314 1,271
2,536 1,286 1,250
6,537 3,427 3,111
1,882 962 919
1,764 888 876
1,722 859 863
1,898 938 959
POPULATION
Population age group 0-6 in '000
Person Male Female
12 13
460 233
499 254
538 275
389 199
328 168
341 175
538 275
480 245
486 248
7,182 3,691
624 325
265 137
287 149
536 277
242 124
283 144
208 106
138 71
218 112
174 89
204 104
319 164
200 103
240 123
208 106
115 59
139 71
308 158
336 172
773 398
226 116
205 106
200 102
228 117
14
226
245
264
190
160
166
263
235
237
3,491
299
128
138
260
117
139
102
67
106
84
100
155
97
117
102
56
68
150
165
375
109
99
98
111

STATISTICS 2001
Urban population in '000
Person
15
151
1,343
1,286
467
599
588
817
920
811
11,962
1,013
479
396
853
345
421
198
342
882
388
299
707
274
543
571
206
223
507
626
5,760
407
283
305
729
Male
16
372
678
646
236
302
297
416
468
412
9,250
519
243
203
440
179
215
101
174
452
197
154
361
141
280
290
101
114
262
318
3,020
210
144
155
364
Female
11
319
665
640
232
297
291
402
452
399
8,712
493
236
193
412
166
206
98
168
430
191
145
346
133
263
281
105
109
246
308
2,740
197
139
150
366
e 0 ;, .\'!!
'" 0. cO mo.
~I ... -o 0
Rural population in '000 (1)-Ole: .!ll:S
PerSon
18
3,Q53
2,844
3,179
2,592
2,070
2,014
2,712
2,721
2,935
34,889
3,202
1,173
1,411
2,278
1,157
1,249
998
630
722
966
1.140
1,320
1,244
1,248
1,072
906
918
2,078
1,911
777
1,474
1,481
1,417
1,168
Male
19
1,538
1,439
1,605
1,316
1,043
1,021
1,381
1,392
1,478
17,649
1,631
591
723
1,152
592
627
503
320
371
490
587
669
635
638
540
421
461
1,052
968
406
752
744
704
575
!Ii.\'!! <.) '" ... 0.
Female &[ 20 21
1,515 19.14
1,405 32.07
1,575 28.80
1,276 15.27
1,026 22.44
993 22.60
1,331 23.15
1,329 25.27
1,457 21.65
17,240 33.98
1,571 24.03
582 29.00
688 21.91
1,126 27.24
566 22.97
622 25.21
495 16.56
310 35.19
351 54.99
476 28.66
553 20.78
652 34.88
608 18.05
610 30.32
531 34.75
485 18.53
457 19.54
1,025 19.61
942 24.68
371 88.11
722 21.63
737 16.04
713 17.71
594 38.41
185
e :S til
1$ 0.
-[ ilL &2 .s 00 <il-Olc
~~ ~i &[ 22
80.26
67.91
71.20
84.73
77.56
77.40
76.85
74.75
78.35
66.01
75.97
71.00
78.09
72.76
77.03
74.79
83.44
64.81
45.01
71.34
79.22
65.12
81.95
69.68
65.25
81.47
80.46
80.39
75.35
11.89
78.32
83.96
82.29
61.54
Person
23
73.53
68.85
62.54
51.38
65.08
62.83
53.22
56.13
66.77
66.60
64.21
57.30
57.01
50.01
60.94
48.81
54.10
66.11
71.61
76.60
67.79
57.40
64.45
67.43
74.52
81.25
72.20
67.01
62.84
82.96
64.70
61.05
68.63
83.35
Literacy rate
Male
24
78.05
74.39
71.24
69.35
73.67
75.83
65.96
68.38
77.62
76.10
75.70
70.88
69.94
61.77
72.46
61.52
68.42
79.32
80.82
84.53
77.61
69.20
74.66
76.37
82.01
88.23
80.29
76.78
73.17
87.92
73.99
70.50
78.37
89.70
Female
25
68.99
63.19
53.74
45.08
56.38
49.54
40.03
43.34
55.78
56.90
52.32
43.56
43.47
37.90
48.81
35.93
39.61
52.52
61.92
68,47
57.37
45.28
53.78
58.04
66.88
75.19
64.01
56.94
52.23
77,48
54.99
51.53
59.00
77.21
Work participation rate
Person
26
44.13
43.97
49.05
50.26
45.41
44.80
49.45
48.83
46.80
44.50
44.56
43.57
39.75
43.12
37.11
43.88
46.36
47.11
42.67
42.94
46.33
45,42
47.55
43.76
43.51
43.89
45.29
50.95
48.70
39.27
47.44
47.65
50.23
49.87
Male Female
27 28
59.95 28.16
58.16 29.47
59.09 38.85
57.65 42.64
58.31 32.29
56.57 32.71
56.29 42.36
57.83 39.42
58.03 35.37
56.60 32.00
55.90 32.74
53.68 33.25
50.48 28.46
51.06 34.90
47.50 26.17
52.89 34.72
53.66 38.93
56.22 31.71
56.02 28.60
57.63 21.81
58.24 33.71
54.61 35.94
57.00 37.68
56.74 30.13
58.68 28.00
55.14 33.94
59.43 30.92
60.24 41.35
58.10 39.02
57.91 18.67
59.61 34.70
61.21 33.90
60.79 39.70
58.23 41.70

Name of Statel Union Territory/District
2
25 KODAGU
26 MYSORE
27 CHAMARAJANAGAR
30 GOA
NORTH GOA
2 SOUTH GOA
31 LAKSHADWEEP
LAKSHADWEEP
32 KERALA
KASARAGOD
2 KANNUR
3 WAYANAD
4 KOZHIKODE
5 MALAPPURAM
6 PALAKKAD
7 THRISSUR
8 ERNAKULAM
9 IDUKKI
10 KOTIAYAM
11 ALAPPUZHA
12 PATHANAMTHITIA
13 KOLLAM
14 THIRUVANANTHAPURAM
33 TAMIL NADU
THIRUVALLUR
2 CHENNAI
3 KANCHEEPURAM
4 VELLORE
5 DHARMAPURI
6 TIRUVANNAMALAI
7 VILUPPURAM
Area in km2
3
4102.0
6854.0
5101.0
3702.0
1736.0
1966.0
32.0
32.0
38863.0
1992.0
2966.0
2131.0
2344.0
3550.0
4480.0
3032.0
3068.0
4358.0
2208.0
1414.0
2637.0
2491.0
2192.0
130058.0
3550.0
4
134
385
189
364
437
300
1,895
1,895
819
604
812
366
1,228
1,021
584
981
1,012
259
885
1,492
468
1,038
1,476
480
776
174.0 24,963
4307.0
6077.0
9622.0
6190.0
7190.0
668
572
297
353
412
5
3
7
4
11
6
5
4
4
63
2
3
3
3
6
5
5
7
4
5
6
5
5
4
201
8
o
8
8
10
6
8
3
7
4
11
6
5
9
9
152
4
9
3
12
14
13
17
15
8
11
12
9
13
12
386
14
o
13
20
18
18
22
7,
5
11
4
44
27
17
3
3
159
7
45
13
5
5
28
25
2
6
11
3
3
5
832
32
56
49
21
16
18
186
8
296
1,340
509
359
213
146
24
24
1364
112
78
48
87
122
144
204
90
89
64
77
65
93
91
16,317
648
o
1,091
883
1,151
1,102
1,489
POPULATION
Population age group Population in 'ODD 0-6 in '000
Person Male Female Person Male Female
549
2,641
965
1,348
759
589
61
61
31,841
1,204
2,409
781
2,879
3,625
2,617
2,974
3,106
1,129
1,954
2,109
1,234
2,585
3,234
62,406
2,755
4,344
2,877
3,477
2,856
2,186
2,960
10 11
275 274
1,345 1,296
490 476
687 660
389 370
299 290
31 30
31 30
15,469 16,373
588 616
1,153 1,256
391 389
1,399 1,480
1,755 1,871
1,267 1,350
1,422 1,552
1,538 1,567
567 563
965 989
1,015 1,095
589 645
1,250 1,336
1,570 1,664
31,401 31,005
1,397 1,357
2,220
1,457
1,741
1,474
1,096
1,492
2,124
1,420
1,736
1,383
1,090
1,468
12 13
70 35
324 165
115 59
146 75
80 41
66 34
9 5
9 5
3,793 1,935
159 81
280 143
104
347
552
319
332
339
134
213
226
127
293
369
7,235
330
433
337
432
387
261
373
53
177
281
162
170
173
68
108
116
65
149
188
3,726
168
220
172
222
207
134
190
14
34
159
71
39
32
4
4
1,858
78
137
51
170
270
156
163
166
66
104
111
62
143
181
3,510
161
214
165
210
180
127
183
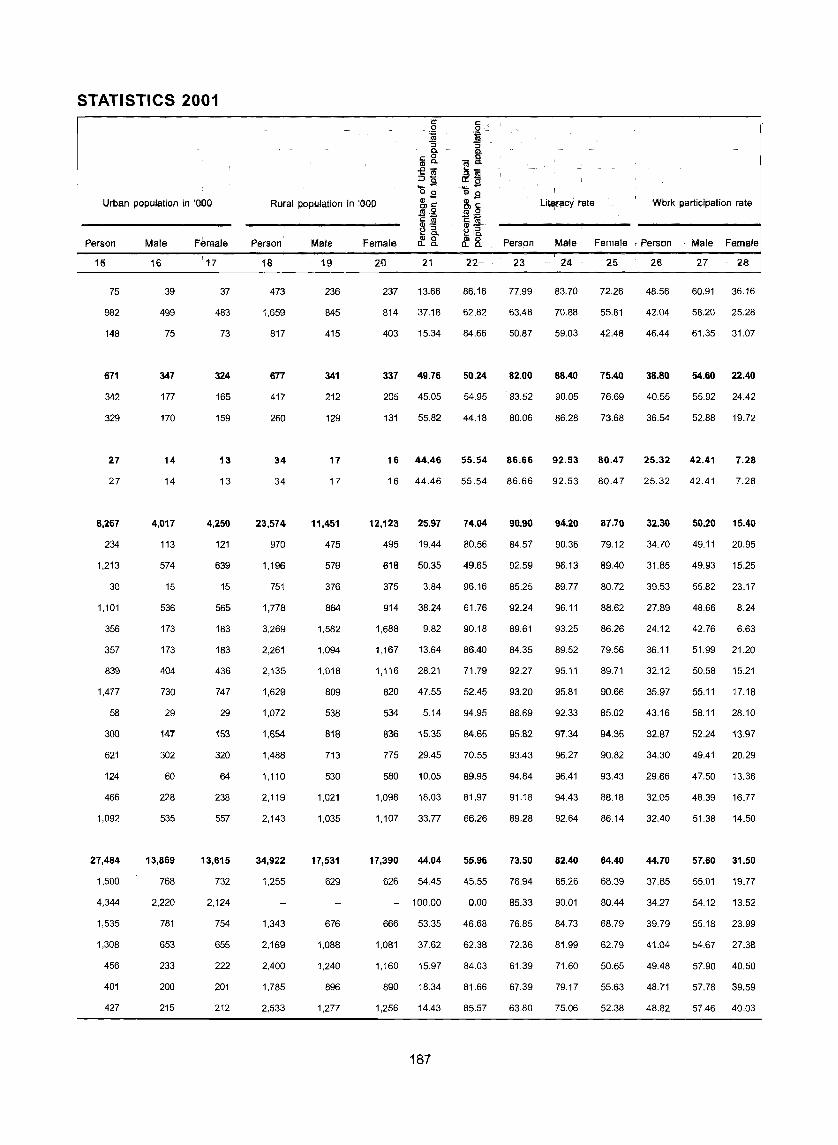
STATISTICS 2001
Urban population in '000
Person
15
75
982
148
671
342
329
27
27
8,267
234
1,213
30
1,101
356
357
839
1,477
58
300
621
124
466
1,092
27,484
1,500
4,344
1,535
1,308
456
401
427
Male
16
39
499
75
347
177
170
14
14
4,017
113
574
15
536
173
173
404
730
29
147
302
60
228
535
13,869
768
2,220
781
653
233
200
215
Female
17
37
483
73
324
165
159
13
13
4,250
121
639
15
565
183
183
436
747
29
1!»
320
64
238
557
13,615
732
2,124
754
655
222
201
212
e I: 0
~ ~ g. R 0 ic. "!~ .e-
::>~ :::l ., 0::(5 _- .... -00 o 0
Rural population in '000 &~ 13>- Literacy rate Work participation rate Ol§ ~~
Person
18
473
1,659
817
677
417
260
34
34
23,574
970
1,196
751
1,778
3,269
2,261
2,135
1,629
1,072
1,654
1,488
1,110
2,119
2,143
34,922
1,255
1,343
2,169
2,400
1,785
2,533
Male
19
236
845
415
341
212
129
17
17
11,451
475
579
376
864
1,582
1,094
1,018
809
538
818
713
530
1,021
1,035
17,531
629
676
1,088
1,240
896
1,277
~:;; ~"5 13>.!ll ~ c. ~R
Female &8. 0.8. Person Male Female Person Male Female
20 21 22 23 24 25 26 27 28
237 13.66 86.16 77.99 83.70 72.26 48.56 60.91 36.16
814 37.18 62.82 63.48 70.88 55.81 42.04 58.20 25.28
403 15.34 84.66 50.87 59.03 42.48 46.44 61.35 31.07
337 49.76 50.24 82.00 88.40 75.40 38.80 54.60 22.40
205 45.05 54.95 83.52 90.05 76.69 40.55 55.92 24.42
131 55.82 44.18 80.06 86.28 73.68 36.54 52.88 19.72
16 44.46 55.54 86.66 92.53 80.47 25.32 42.41 7.28
16 44.46 55.54 86.66 92.53 80.47 25.32 42.41 7.28
12,123 25.97 74.04 90.90 94.20 87.70 32.30 50.20 15.40
495 19.44 80.56 84.57 90.36 79.12 34.70 49.11 20.95
618 50.35 49.65 92.59 96.13 89.40 31.85 49.93 15.25
375 3.84 96.16 85.25 89.77 80.72 39.53 55.82 23.17
914 38.24 61.76 92.24 96.11 88.62 27.89 48.66 8.24
1,688 9.82 90.18 89.61 93.25 86.26 24.12 42.76 6.63
1,167 13.64 86.40 84.35 89.52 79.56 36.11 51.99 21.20
1,116 28.21 71.79 92.27 95.11 89.71 32.12 50.58 15.21
820 47.55 52.45 93.20 95.81 90.66 35.97 55.11 17.18
534 5.14 94.95 88.69 92.33 85.02 43.16 58.11 28.10
836 15.35 84.65 95.82 97.34 94.35 32.87 52.24 13.97
775 29.45 70.55 93.43 96.27 90.82 34.30 49.41 20.29
580 10.05 89.95 94.84 96.41 93.43 29.66 47.50 13.36
1,098 18.03 81.97 91.18 94.43 88.18 32.05 48.39 16.77
1,107 33.77 66.26 89.28 92.64 86.14 32.40 51.38 14.50
17,390 44.04 55.96 73.50 82.40 64.40 44.70 57.60 31.50
626 54.45 45.55 76.94 85.26 68.39 37.65 55.01 19.77
- 100.00 0.00 85.33
666 53.35 46.68 76.85
1,081 37.62 62.38 72.36
1,160 15.97 84.03 61.39
890 18.34 81.66 67.39
1,256 14.43 85.57 63.80
187
90.01 80.44
84.73 68.79
81.99 62.79
71.60 50.65
79.17 55.63
75.06 52.38
34.27
39.79
41.04
49.48
48.71
48.82
54.12 13.52
55.18 23.99
54.67 27.38
57.90 40.50
57.78 39.59
57.46 40.03
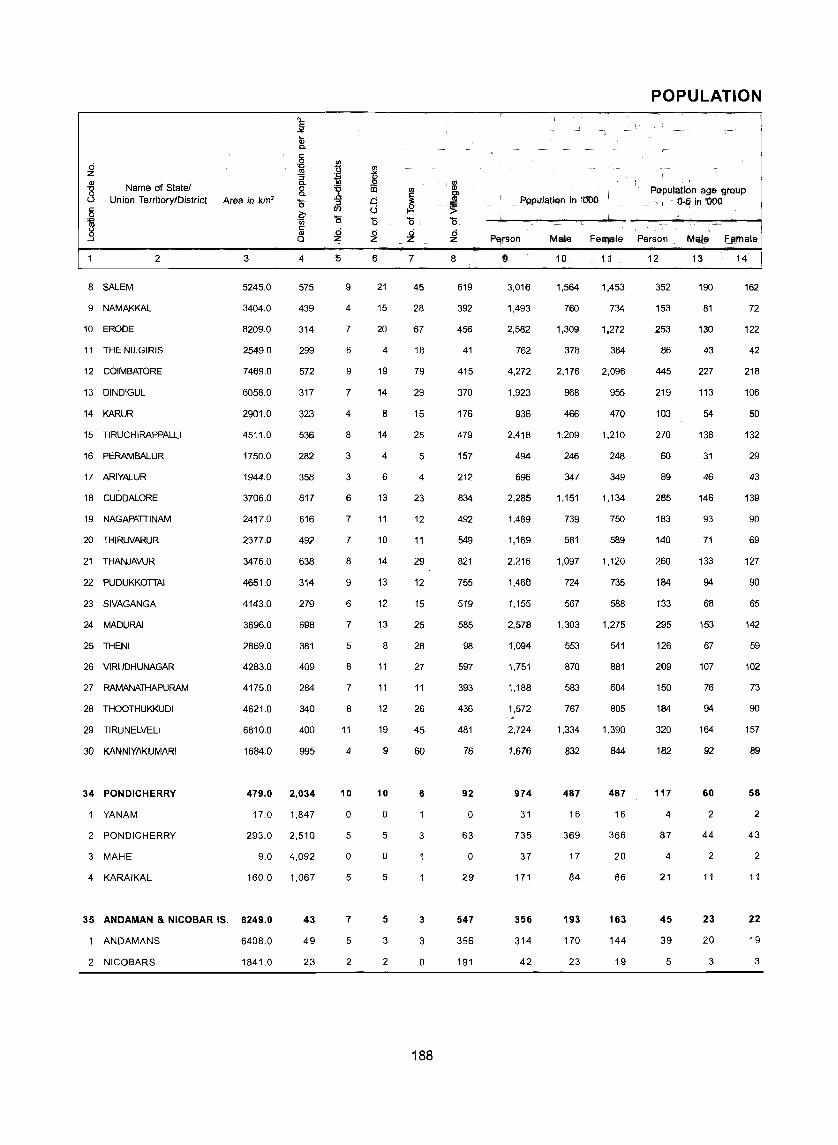
Name of Statel Union Territory/District
2
8 SALEM
9 NAMAKKAL
10 ERODE
11 THE NILGIRIS
12 COIMBATORE
13 DINDIGUL
14 KARUR
15 TIRUCHlRAPPALLI
16 PERAMBALUR
17 ARIYALUR
18 CUDDALORE
19 NAGAPATTINAM
20 THIRUVARUR
21 THANJAVUR
22 PUDUKKOTTAI
23 SIVAGANGA
24 MADURA!
25 THENI
26 VIRUDHUNAGAR
27 RAMANATHAPURAM
28 THOOTHUKKUDI
29 TIRUNELVELI
30 KANNIYAKUMARI
34 PONDICHERRY
YANAM
2 PONDICHERRY
3 MAHE
4 KARAIKAL
Area in km'
3 4
5245.0 575
3404.0 439
8209.0 314
2549.0 299
7469.0 572
6058.0 317
2901.0 323
4511.0 536
1750.0 282
1944.0 358
3706.0 617
2417.0 616
2377.0 492
3476.0 638
4651.0 314
4143.0 279
3696.0 698
2869.0 381
4283.0 409
4175.0 284
4621.0 340
6810.0 400
1684.0 995
479.0 2,034
17.0 1,847
293.0 2,510
9.0 4,092
160.0 1,067
35 ANDAMAN & NICOBAR IS. 8249.0 43
ANDAMANS 6408.0 49
2 NICOBARS 1841.0 23
5
9
4
7
6
9
7
4
8
3
3
6
7
7
8
9
6
7
5
8
7
8
11
4
10
o
5
o
5
7
5
2
6
21
15
20
4
19
14
8
14
4
6
13
11
10
14
13
12
13
8
11
11
12
19
9
10
o
5
o
5
5
3
2
7
45
28
67
18
79
29
15
25
5
4
23
12
11
29
12
15
25
28
27
11
26
45
60
6
3
3
3
o
188
8
619
392
456
41
415
370
176
479
157
212
834
492
549
821
755
519
585
98
597
393
436
481
76
92
o
63
o
29
547
356
191
Population in '000
Person Male Female
9
3.016
1,493
2.582
762
4,272
1,923
936
2,418
494
696
2,285
1,489
1,169
2,216
1,460
1,155
2,578
1,094
1,751
1,188
1,572
2,724
1,676
974
31
735
37
171
356
314
42
10
1,564
760
1.309
378
2,176
968
466
1,209
246
347
1,151
739
581
1,097
724
567
1,303
553
870
583
767
1,334
832
487
16
369
17
84
193
170
23
11
1,453
734
1,272
384
2,096
955
470
1,210
248
349
1,134
750
589
1,120
735
588
1,275
541
881
604
805
1,390
844
487
16
366
20
86
163
144
19
POPULATION
Populatkm age group 0-6 in '000
Person Male Female
12
352
153
253
86
445
219
103
270
60
89
285
183
140
260
184
133
295
126
209
150
184
320
182
117
4
87
4
21
45
39
5
13
190
81
130
43
227
113
54
138
31
46
146
93
71
133
94
68
153
67
107
76
94
164
92
60
2
44
2
11
23
20
3
14
162
72
122
42
218
106
50
132
29
43
139
90
69
127
90
65
142
59
102
73
90
157
89
58
2
43
2
11
22
19
3

STATISTICS 2001
Urban population in '000
Person
15
1,390
545
1,194
455
2,820
673
311
1,139
79
79
754
330
237
749
248
326
1,444
592
777
302
665
1,308
1,094
649
31
506
37
74
116
116
Male
16
711
277
604
226
1,441
339
155
570
39
39
379
163
117
370
124
162
730
298
388
150
328
645
543
323
16
253
17
37
64
64
Female
17
679
268
590
228
1,379
334
157
569
40
40
375
167
120
378
125
164
714
294
390
152
337
663
551
325
16
253
20
38
52
52
c c
i 0 '~
1. 1. .15 g_ -& £1ii il!_
:::9 &~ ",,-
0.9 o 0
Rural population in '000 (I) c l6'0
(I}-;; E.Q
Person
18
1,626
948
1,388
308
1,452
1,250
624
1,279
414
617
1,531
1,159
932
1,468
1,211
829
1,134
502
974
885
908
1,416
582
326
229
96
240
198
42
Male
19
852
482
705
152
735
629
311
639
207
308
772
576
464
726
601
405
573
255
483
433
439
689
290
164
116
48
129
106
23
-= c '" ~'3 ~g.
Female 0..0.
20 21
774 46.09
466 36.50
682 46.24
156 59.71
717 66.01
621 35.00
314 33.23
641 47.11
208 15.99
309 11.35
759 33.00
583 22.16
469 20.27
741 33.80
611 16.99
424 28.23
561 56.01
247 54.11
491 44.37
452 25.42
468 42.30
727 48.02
293 65.27
162 66.53
100.00
113 68.84
100.00
49 43.27
111 32.63
92 37.00
cCii
~1. ~[
22
53.91
63.50
53.76
40.42
33.99
65.00
66.67
52.89
83.81
88.65
67.00
77.84
79.73
66.25
82.95
71.77
43.99
45.89
55.63
74.49
57.76
51.98
34.73
33.37
0.00
31.16
0.00
56.14
67,37
63.00
19 0.00 100.00
189
Person
23
65.09
67.41
65.36
80.01
76.97
69.35
68.08
77.90
66.07
64.08
71.01
76.34
76.58
75.45
71.12
72.18
77.82
71.58
73.70
72.96
81.52
76.09
87.55
81.20
73.71
80.65
95.66
81.93
81,30
82.49
72.35
Literacy rate
Male
24
74.39
77.56
75.32
88.54
84.59
79.76
79.63
86.55
77.89
77.19
81.64
84.89
85.43
84.47
82.55
83.14
86.17
81.88
83.96
83.01
88.32
85.21
90.37
88.60
78.82
88.43
97.64
89.39
86.30
87.36
78.55
Female
25
55.20
57.00
55.15
71.64
69.06
58.87
56.76
69.31
54.43
51.15
60.27
67.96
67.90
66.70
59.97
61.74
69.35
61.19
63.64
63.36
75.13
67.43
84.79
73.90
68.48
72.83
93.98
74.68
75.20
76.62
65.01
Work participation rate
Person
26
48.23
56.42
55.56
45.06
46.29
50.61
53.06
44.02
53.83
49.73
42.58
39.41
41.98
40.48
46.47
44.45
42.22
47.56
50.35
43.83
43.17
47.03
32.70
35.20
31.54
36.13
25.23
33.67
38.30
37.13
46.65
Male Female
27 28
60.30 35.22
64.38 48.19
66.49 44.32
54.86 35.39
63.22 28.72
60.44 40.65
63.06 43.15
56.91 31.14
57.95 49.72
58.02 41.49
55.34 29.63
55.49 23.55
57.08 27.09
56.40 24.89
57.62 35.49
55.81 33.49
56.51 27.61
57.56 37.34
59.48 41.33
54.97 33.08
56.31 30.67
55.32 39.08
52.95 12.72
53.10 17.20
52.29 10.28
53.60 18.49
44.73 8.23
52.58 15.15
56.60 16.60
55.99 14.79
60.92 29.99

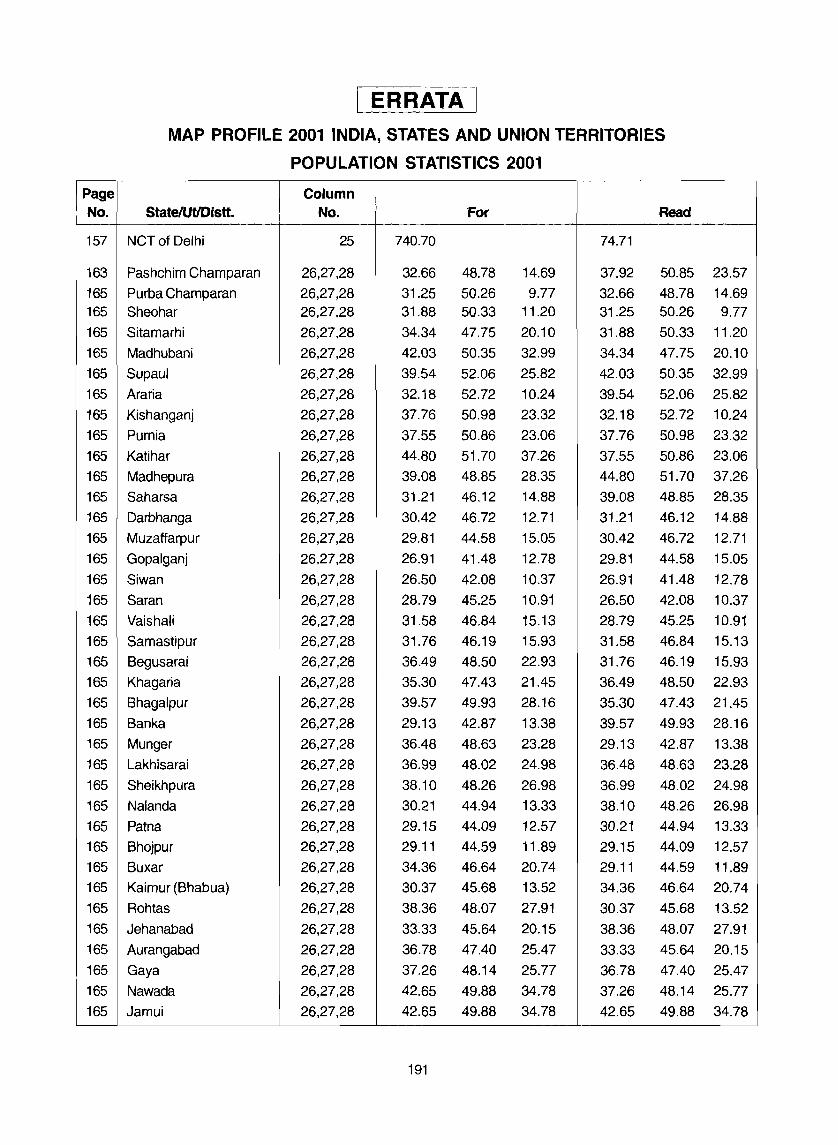
Page No.
157
163
165 165
165
165
165
165
165
165
165
165
165
165
165
165
165
165
165
165
165
165
165
165
165
165
165
165
165
165
165
165
165
165
165
165
165
165
I ERRATA I MAP PROFILE 2001 INDIA, STATES AND UNION TERRITORIES
POPULATION STATISTICS 2001
Column StatelUt/Distt. No. For Read
NCTof Delhi 25 740.70 74.71
Pashchim Champaran 26,27,28 32.66 48.78 14.69 37.92 50.85
Purba Champa ran 26,27,28 31.25 50.26 9.77 32.66 48.78 Sheohar 26,27,28 31.88 50.33 11.20 31.25 50.26
Sitamarhi 26,27,28 34.34 47.75 20.10 31.88 50.33
Madhubani 26,27,28 42.03 50.35 32.99 34.34 47.75
Supaul 26,27,28 39.54 52.06 25.82 42.03 50.35
Araria 26,27,28 32.18 52.72 10.24 39.54 52.06
Kishanganj 26,27,28 37.76 50.98 23.32 32.18 52.72
Purnia 26,27,28 37.55 50.86 23.06 37.76 50.98
Katihar 26,27,28 44.80 51.70 37.26 37.55 50.86
Madhepura 26,27,28 39.08 48.85 28.35 44.80 51.70
Saharsa 26,27,28 31.21 46.12 14.88 39.08 48.85
Darbhanga 26,27,28 30.42 46.72 12.71 31.21 46.12
Muzaffarpur 26,27,28 29.81 44.58 15.05 30.42 46.72
Gopalganj 26,27,28 26.91 41.48 12.78 29.81 44.58
Siwan 26,27,28 26.50 42.08 10.37 26.91 41.48
Saran 26,27,28 28.79 45.25 10.91 26.50 42.08
Vaishali 26,27,28 31.58 46.84 15.13 28.79 45.25
Samastipur 26,27,28 31.76 46.19 15.93 31.58 46.84
Begusarai 26,27,28 36.49 48.50 22.93 31.76 46.19
Khagaria 26,27,28 35.30 47.43 21.45 36.49 48.50
Bhagalpur 26,27,28 39·57 49.93 28.16 35.30 47.43
Banka 26,27,28 29.13 42.87 13.38 39.57 49.93
Munger 26,27,28 36.48 48.63 23.28 29.13 42.87
Lakhisarai 26,27,28 36.99 48.02 24.98 36.48 48.63
Sheikhpura 26,27,28 38.10 48.26 26.98 36.99 48.02
Nalanda 26,27,28 30.21 44.94 13.33 38.10 48.26
Patna 26,27,28 29.15 44.09 12.57 30.21 44.94
Bhojpur 26,27,28 29.11 44.59 11.89 29.15 44.09
Buxar 26,27,28 34.36 46.64 20.74 29.11 44.59
Kaimur (Bhabua) 26,27,28 30.37 45.68 13.52 34.36 46.64
Rohtas 26,27,28 38.36 48.07 27.91 30.37 45.68
Jehanabad 26,27,28 33.33 45.64 20.15 38.36 48.07
Aurangabad 26,27,28 36.78 47.40 25.47 33.33 45.64
Gaya 26,27,28 37.26 48.14 25.77 36.78 47.40
Nawada 26,27,28 42.65 49.88 34.78 37.26 48.14
Jamui 26,27,28 42.65 49.88 34.78 42.65 49.88
191
23.57
14.69 9.77
11.20
20.10
32.99
25.82
10.24
23.32
23.06
37.26
28.35
14.88
12.71
15.05
12.78
10.37
10.91
15.13
15.93
22.93
21.45
28.16
13.38
23.28
24.98
26.98
13.33
12.57
11.89
20.74
13.52
27.91
20.15
25.47
25.77
34.78

POPULATION STATISTICS 2001
Page Column No. StatelUtiDisti. No. For Read
167 Nagaland 21 35.12 17.23
167 Tuensang 21 92.81 7.18
169 Ukhrul 22 31.97 100.00
173 Orissa 21 49.30 14.99
173 Bargarh 21 49.41 7.69
173 Jharsuguda 21 48.63 36.47
173 Sambalpur 21 49.15 27.12
173 Debagarh 21 49.64 7.33
173 Sundargarh 21 48.88 34.37
173 Kendujhar 21 49.42 13.64
173 Mayurbhanj 21 49.48 7.00
175 Baleshwar 21 48.79 10.89
175 Bhadrak 21 49.33 10.58
175 Kendrapara 21 50.38 5.69
175 Jagatsinghapur 21 49.05 9.88
175 Cuttack 21 48.40 27.39
175 Jajapur 21 49.32 4.49
175 Dhenkanal 21 49.02 8.71
175 Anugul 21 48.51 13.90
175 Nayagarh 21 48.32 4.29
175 Khordha 21 47.47 42.92
175 Puri 21 49.17 13.58
175 Ganjam 21 49.95 17.60
175 Gajapati 21 50.67 10.19
175 Kandhamal 21 50.15 6.80
175 Baudh 21 49.60 4.83
175 Sonapur 21 49.08 7.39
175 Balangir 21 49.59 11.54
175 Nuapada 21 50.09 5.66
175 Kalahandi 21 50.04 7.50
175 Rayagada 21 50.66 13.89
175 Nabarangapur 21 49.81 5.78
175 Koraput 21 49.96 16.81
175 Malkangiri 21 50.00 6.87
181 Daman&Diu 22 31.88 63.75
192