map 7.5 sources of wood for charcoal in selected districts ... · energy consumed came from...
TRANSCRIPT

In Chapter 7CONTENTS
u Overall Distribution of Woody Biomass ................................. 96Forests and Tree Cover 97
Plantations and Woodlots 98
u Key Supply Areas for Firewood and Charcoal ................................... 100Firewood Collection and
Charcoal Making 100
Growth of Biomass and Potential Harvest 103
LIST OF MAPSMap 7.1 Forest Areas, 2000Map 7.2 Tree Cover, 2001Map 7.3 Central and Western Kenya: Woodlots on Croplands, 1997,
and Plantations, 2000Map 7.4 Cash Income from Firewood Collection and Charcoal Making, 2003-05Map 7.5 Sources of Wood for Charcoal in Selected Districts, 2004Map 7.6 Annual Growth of Biomass Outside of CroplandsMap 7.7 Theoretically Harvestable Biomass Yield Outside of CroplandsMap 7.8 Woodlots on Croplands in Five Provinces, 1997
AUTHORS AND CONTRIBUTORSNorbert Henninger (WRI)Stephen Mutimba (ESDA)Evans Kituyi (University of Nairobi)Linda Cotton (consultant)Janet Nackoney (WRI)Florence Landsberg (WRI)Daniel Prager (WRI)Greg Mock (consultant)Dan Tunstall (WRI)Hyacinth Billings (WRI)Carolina de Rosas (WRI)
WHAT THIS CHAPTER SHOWSThis chapter gives a brief overview of the ecosystems that provide Kenya with wood and how Kenyans use this wood. The first section discusses the location of
wood supply areas, each reflecting different levels of tree cover or woody biomass supply. The maps show the location of different types of forests, the percent-
age of tree cover in a landscape, the location of plantations, and areas where farmers are planting woodlots on their farmland. The second section focuses on
the two most significant uses of wood in Kenya—as firewood and for making charcoal. The maps distinguish the areas that are most likely supplying firewood
and charcoal from those used for other activities. The section also highlights the economic importance of charcoal production and shows where charcoal making
and firewood collection contribute significantly to cash income. Finally, the section presents maps of annual biomass growth (outside of croplands) in order to
estimate sustainable harvest levels for biomass energy.

Kenya’s tree-covered landscapes fall under vari-ous classes such as forests, woodlands, bushlands, and wooded grasslands—each reflecting different tree densities and vegetation communities. They also include agroecosystems, where farmers grow both agricultural crops and trees. Forested areas are the source of an array of ecosystem services, providing soil and water conservation, a home for indigenous peoples (e.g., the Ogiek people), a grazing refuge during drought, or a site for cultural and religious ceremonies.
Trees are linked to hydrological and other water-related services, as tree cover influences runoff and water infiltration patterns. The remnants of mul-tilayered forest habitats also contribute to Kenya’s biodiversity, inasmuch as they provide a home for some of the country’s rare bird species (African Bird Club 2006). The various tree-covered landscapes are also a source of products such as medicines, honey, meat, fruits, vegetables, fiber, nuts, and tubers. The wood from these ecosystems is used for firewood, charcoal, timber, posts, and poles, and is vital to Kenya’s economy and the livelihoods of its people.
From an economic point of view, the forest sec-tor officially contributes about Ksh 9.9 billion (US$ 141 million) to the national economy per year—about 1.3 percent of Kenya’s gross domestic product (CBS 2004). However, this number does not fully reflect the forest sector’s economic contribution. It omits some significant contributions, such as the value of energy produced from wood, and the value of various nontimber forest products.
For example, 60,000 full-time wood carvers use about 15,000 cubic meters of wood per year (Choge et al. 2002). Although wood sculptures consume less than 1 percent of Kenya’s annual wood har-vest (FAO 2005), they generate export earnings of around Ksh 1.6 billion (US$ 23 million) per year and financially support an estimated 400,000 depen-dents. Nonetheless, this revenue is not included in economic analyses of the forest sector.
Revenues from the charcoal market are at least ten times greater than those from wood carvings, and charcoal production is a voracious consumer of Kenya’s trees. Yet, it is also not counted in the official forest sector statistics. Estimates of the eco-
nomic value of Kenya’s charcoal production range from Ksh 17.5 to Ksh 32 billion per year (depend-ing on volume and price)—about US$ 250 to US$ 457 million (MoE 2002; ESDA 2005a).
Most Kenyans rely on wooded ecosystems to provide them with either firewood or charcoal. As Table 7.1 indicates, biomass (firewood, wood for charcoal, industrial wood, wood wastes, and farm residues) is Kenya’s dominant fuel, accounting for over 80 percent of total energy consumption in 2000. In comparison, only 1.4 percent of the total energy consumed came from electricity, primar-ily used by commerce and industry and by urban households. Imported petroleum’s share in Kenya’s total energy consumption is about 18 percent, used mostly for commerce, industry, and transport (MoE 2002). Of all the wood supplied by the nation’s ecosystems, Kenyans use some 80–90 percent for energy purposes (1995 estimate from 1994 Kenya Forestry Master Plan cited in Holding Anyonge and Roshetko 2003; FAO 2005). They use the remaining 10 to 20 percent for timber, posts, and poles.
Wood
7
p
q
W O O D t u95
SHARE IN KENYA’S TOTAL ENERGY CONSUMPTION (percent)
Firewood Charcoal
IndustrialWood
WoodWastes
FarmResidue
SUBTOTALBIOMASS Electricity Petroleum
TOTALENERGY
Households: Rural 32.5 17.6 0.0 0.3 5.3 55.7 0.0 1.0 56.7
Households: Urban 0.8 13.9 0.0 0.2 0.0 14.9 0.4 1.0 16.3
Cottage Industry 3.0 6.6 0.0 0.0 0.0 9.6 0.2 0.1 9.9
Agriculture 0.0 0.0 0.0 0.0 0.0 0.0 0.0 0.6 0.6
Transportation 0.0 0.0 0.0 0.0 0.0 0.0 0.0 6.6 6.6
Commerce and Industry 0.0 0.0 0.3 0.0 0.0 0.3 0.8 8.8 9.9
TOTAL 36.3 38.1 0.3 0.5 5.3 80.5 1.4 18.1 100.0
Source: MoE 2002.
Table 7.1 Kenya’s Total Energy Consumption by Sector and Fuel Type, 2000

N A T U R E ’ S B E N E F I T S I N K E N Y A : A N A T L A S O F E C O S Y S T E M S A N D H U M A N W E L L - B E I N G
p
q
t u96
OVERALL DISTRIBUTION OF WOODY BIOMASS
Maps 7.1 to 7.3 delineate forests, tree cover, plan-tations, and areas where farmers have planted wood-lots on farmland. Areas where the vegetation consists of densely spaced trees are generally designated as forests. Most of Kenya’s closed forests (those where tree crowns cover a high proportion of land surface) fall under government jurisdiction (i.e., as gazetted forest reserves). Extraction of forest products from these reserves is highly regulated or illegal.
The inventory of the Kenya Indigenous Forest Conservation Programme (Wass 1995) estimated Kenya’s 1995 closed forest cover to be 1.4 million hectares (about 2.5 percent of the total land area). It included 1.24 million hectares of indigenous closed canopy forest (1.06 million hectares in gazetted forests and 0.18 million hectares outside these forest reserves) and 0.16 million hectares in plantations. Other natural woody vegetation covers approximately 37.3 million hectares with 2.1 mil-lion hectares of woodlands, 24.6 million hectares of bushlands, and 10.6 million hectares of wooded grasslands (MoE 2002).
A different assessment of Kenya’s forests—one that relied on satellite imagery and used a differ-ent definition for closed forests—estimated Kenya’s 1995 closed forest area to be 984,000 hectares, rep-resenting 1.7 percent of the country’s total land area (UNEP 2001). Media reports and local observations indicate tremendous pressure on Kenya’s closed for-est estate and suggest that the amount of closed for-est area is now lower than indicated in the last forest inventory. Both legal conversion (e.g., the excision of land parcels from the gazetted forest reserve in the 1990s (Matiru 1999)) and illegal conversion of forests (extraction of timber, production of charcoal, growing of crops or marijuana) have contributed to this decline in forest area.
More recently, high-resolution aerial surveys of selected forests in the Aberdare Range, Mount Kenya, Mount Elgon, and the Mau Escarpment confirm that some of these trends are taking place on a more local scale, pinpointing significant unplanned forest exploitation and degradation
Sources: Administrative boundaries (CBS 2003), cities (SoK and ILRI 2000) and water bodies and forest types (FAO 2000).
Most of Kenya’s closed canopy forests are concen-trated in the highlands, surrounded by areas with high population densities and intensive agricultural production. Within rangeland areas, closed forests grow primarily in mountain ranges and along permanent and seasonal rivers. The largest closed natural forest areas are west of Nakuru (on the slopes of the Mau Escarpment), north of Nairobi (Aberdare Range), and Mount Kenya. The Districts between Garissa and the Indian Ocean coast include large tracts of open forest types. Significant gallery forests fol-low permanent rivers, for example southwest of Lake Tur-kana (Turkwell River) and south of Garissa (Tana River). Large tree-covered seasonal wetlands are prominent in the southeastern rangelands.
FOREST TYPES
Closed trees
Multilayered trees (broadleaved evergreen)
Open trees (65-40% crown cover)
Very open trees (40-15% crown cover)
Closed trees on temporarily flooded land
Mangrove treesOTHER FEATURES
District boundaries
Water bodies
Map 7.1 Forest Areas, 2000

7
p
q
W O O D t u97
(Gathaara 1999; Lambrechts et al. 2003; Akotsi and Gachanja 2004). On the positive side, however, these surveys have led to a change in policies and institutional responsibilities for the forests of Mount Kenya, resulting in a slowdown of forest decline (Vanleeuwe et al. 2003; Akotsi and Gachanja 2004).
Kenyan authorities have not recently carried out a detailed national assessment on the changes in woodland and bushland. Significant land use changes are occurring, however, in Kenya’s range-lands, such as in Narok and Trans Mara Districts (Serneels and Lambin 2001; Lamprey and Reid 2004; and Norton-Griffiths et al. in press). In many areas, landowners have found it profitable to have charcoal burners clear all the trees and then sell off or lease the land for crop production.
Forests and Tree CoverIn classifying different vegetation communities,
experts consider the density of tree cover; the occur-rence of different types of woody vegetation such as bushes, shrubs, and trees; and the presence of plants growing below the woody vegetation as ground-cover, such as grass. This section explores two different approaches to mapping woody vegetation.
Map 7.1 identifies vegetation communities that are classified as forests using Africover categories on a national scale for the year 2000 (FAO 2000). Forests, by definition, have the greatest density of trees and the highest volume of wood per square kilometer (i.e., forests must exceed a certain threshold in tree cover and a minimum height in the woody vegetation). The map highlights natural and seminatural forested landscapes such as closed canopy forests and other forest types with more open crown cover; it does not include forest plantations or trees on cultivated landscapes.
Map 7.2 displays tree cover density on a continuous scale from 0 to 100 percent. It is derived from satellite imagery estimating woody vegetation within grid cells of 500 meters by 500 meters. In these grid cells, a tree is defined as mature vegetation greater than five meters in height. Such an approach
Sources: Administrative boundaries (CBS 2003), cities (SoK and ILRI 2000), water bodies (FAO 2000), and percent tree cover (Hansen et al. 2003)
Higher density tree coverage occurs in the high rainfall zones: in mountain ranges such as Mount Kenya, Aberdares, Mount Elgon, and Mau Escarpment in the country’s interior, and areas close to the coast. Because of their relatively large area, lands classified as woodlands, bushlands, and wooded grasslands (see Map 1.3) together contain most of Kenya’s woody biomass, albeit at much lower tree density and volume per area than the small remnants of closed forests. Agricultural land can have a high percentage of tree cover as reflected in the varying tree density in high-rainfall croplands, for example in Central Province.
TREE COVER
(percent)
> 50
30 - 50
20 - 30
10 - 20
0 - 10
No tree cover
OTHER FEATURES
District boundaries
Water bodies
Map 7.2 Tree Cover, 2001
N A T U R E ’ S B E N E F I T S I N K E N Y A : A N A T L A S O F E C O S Y S T E M S A N D H U M A N W E L L - B E I N G
p
q
t u98
avoids the problem presented by the traditional classification scheme in Map 7.1 (i.e., closed versus open canopy forest), which set a threshold of tree cover for each forest class. Map 7.2 can therefore highlight the importance of trees that fall below the minimum tree or canopy cover thresholds (i.e., trees outside forests). It includes both trees on cultivated and managed landscapes (croplands) but also on natural and seminatural landscapes (i.e., woodlands, bushlands, and wooded grasslands). This approach is, therefore, a more detailed and accurate represen-tation of vegetation cover for our purposes.
Generally, most of the closed and open for-est areas of Map 7.1 coincide with higher tree densities in Map 7.2. The coarse resolution of the satellite data used for Map 7.2 results in a map with fewer small features (e.g., trees in wetlands) or linear features (e.g., forests along riverbanks). Only Map 7.2, however, can reflect the varying tree density in high-rainfall croplands, such as the highlands. Considered together, the maps indicate that, surprisingly, closed canopy forests do not contain most of Kenya’s woody biomass; woodlands, bushlands, and wooded grasslands together have a higher total volume of woody biomass, due to their vast size. Selected studies and anecdotal evidence suggest that closed canopy forests are only a minor contributor of woodfuel at a national level (MoE 2002; ESDA 2005a). However, it should be noted that forest reserves or patches of dense forest can be quite significant sources of woodfuel on a local scale (for example, when a government forest reserve is degazetted), and that illegal logging and charcoal production is taking place within forest reserves.
Plantations and Woodlots Reliable statistics on the exact sources of Kenya’s
wood supply for energy and other uses are not rou-tinely available. However, the Kenya Forestry Master Plan estimated that of the 1995 national wood supply, 9 percent came from indigenous forests, 49 percent from woodlands and bushlands, 33 percent from farmlands and settlements, and 9 percent from forest plantations (1994 Kenya Forestry Master Plan cited in Holding Anyonge and Roshetko 2003). It predicted that by 2020, the supply from farmlands and settlements would more than double, increasing its share to 54 percent.
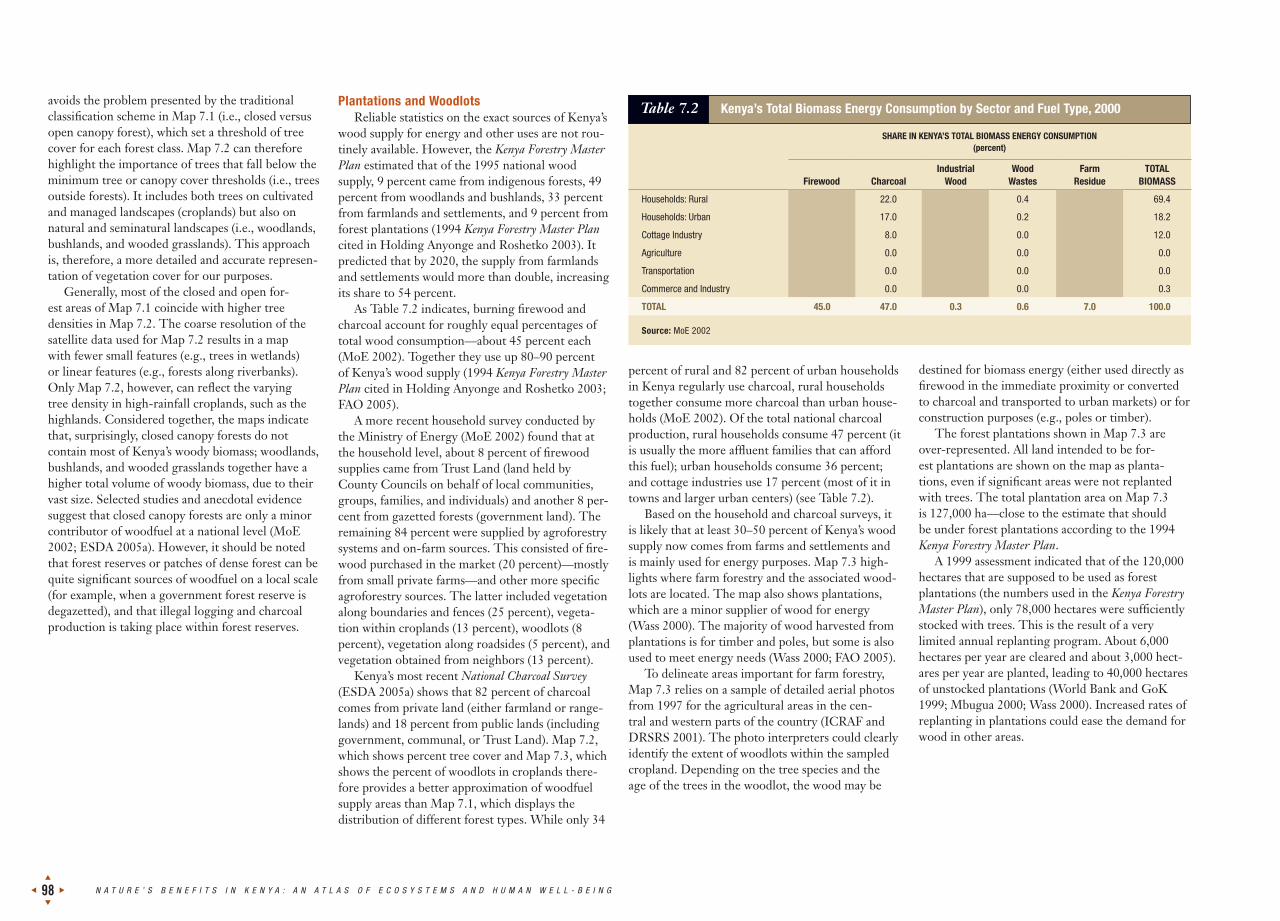
As Table 7.2 indicates, burning firewood and charcoal account for roughly equal percentages of total wood consumption—about 45 percent each (MoE 2002). Together they use up 80–90 percent of Kenya’s wood supply (1994 Kenya Forestry Master Plan cited in Holding Anyonge and Roshetko 2003; FAO 2005).
A more recent household survey conducted by the Ministry of Energy (MoE 2002) found that at the household level, about 8 percent of firewood supplies came from Trust Land (land held by County Councils on behalf of local communities, groups, families, and individuals) and another 8 per-cent from gazetted forests (government land). The remaining 84 percent were supplied by agroforestry systems and on-farm sources. This consisted of fire-wood purchased in the market (20 percent)—mostly from small private farms—and other more specific agroforestry sources. The latter included vegetation along boundaries and fences (25 percent), vegeta-tion within croplands (13 percent), woodlots (8 percent), vegetation along roadsides (5 percent), and vegetation obtained from neighbors (13 percent).
Kenya’s most recent National Charcoal Survey (ESDA 2005a) shows that 82 percent of charcoal comes from private land (either farmland or range-lands) and 18 percent from public lands (including government, communal, or Trust Land). Map 7.2, which shows percent tree cover and Map 7.3, which shows the percent of woodlots in croplands there-fore provides a better approximation of woodfuel supply areas than Map 7.1, which displays the distribution of different forest types. While only 34
percent of rural and 82 percent of urban households in Kenya regularly use charcoal, rural households together consume more charcoal than urban house-holds (MoE 2002). Of the total national charcoal production, rural households consume 47 percent (it is usually the more affluent families that can afford this fuel); urban households consume 36 percent; and cottage industries use 17 percent (most of it in towns and larger urban centers) (see Table 7.2).
Based on the household and charcoal surveys, it is likely that at least 30–50 percent of Kenya’s wood supply now comes from farms and settlements and is mainly used for energy purposes. Map 7.3 high-lights where farm forestry and the associated wood-lots are located. The map also shows plantations, which are a minor supplier of wood for energy (Wass 2000). The majority of wood harvested from plantations is for timber and poles, but some is also used to meet energy needs (Wass 2000; FAO 2005).
To delineate areas important for farm forestry, Map 7.3 relies on a sample of detailed aerial photos from 1997 for the agricultural areas in the cen-tral and western parts of the country (ICRAF and DRSRS 2001). The photo interpreters could clearly identify the extent of woodlots within the sampled cropland. Depending on the tree species and the age of the trees in the woodlot, the wood may be
destined for biomass energy (either used directly as firewood in the immediate proximity or converted to charcoal and transported to urban markets) or for construction purposes (e.g., poles or timber).
The forest plantations shown in Map 7.3 are over-represented. All land intended to be for-est plantations are shown on the map as planta-tions, even if significant areas were not replanted with trees. The total plantation area on Map 7.3 is 127,000 ha—close to the estimate that should be under forest plantations according to the 1994 Kenya Forestry Master Plan.
A 1999 assessment indicated that of the 120,000 hectares that are supposed to be used as forest plantations (the numbers used in the Kenya Forestry Master Plan), only 78,000 hectares were sufficiently stocked with trees. This is the result of a very limited annual replanting program. About 6,000 hectares per year are cleared and about 3,000 hect-ares per year are planted, leading to 40,000 hectares of unstocked plantations (World Bank and GoK 1999; Mbugua 2000; Wass 2000). Increased rates of replanting in plantations could ease the demand for wood in other areas.
SHARE IN KENYA’S TOTAL BIOMASS ENERGY CONSUMPTION(percent)
Firewood
Charcoal
IndustrialWood
WoodWastes
FarmResidue
TOTAL BIOMASS
Households: Rural 40.0 22.0 0.0 0.4 7.0 69.4
Households: Urban 1.0 17.0 0.0 0.2 0.0 18.2
Cottage Industry 4.0 8.0 0.0 0.0 0.0 12.0
Agriculture 0.0 0.0 0.0 0.0 0.0 0.0
Transportation 0.0 0.0 0.0 0.0 0.0 0.0
Commerce and Industry 0.0 0.0 0.3 0.0 0.0 0.3
TOTAL 45.0 47.0 0.3 0.6 7.0 100.0
Source: MoE 2002
Table 7.2 Kenya’s Total Biomass Energy Consumption by Sector and Fuel Type, 2000

7
p
q
W O O D t u99
Tree plantations
WOODLOTS IN CROPLAND
(percent of sampled cropland)
> 12
6 - 12
4 - 6
2 - 4
0 - 2
No woodlots in sampled cropland
Cropland not sampled
OTHER FEATURES
District boundaries
Major national parks and reserves (over 5,000 ha)
Water bodies
Sources: Administrative boundaries (CBS 2003), water bodies and cropland areas (FAO 2000), parks and reserves (IUCN and UNEP/WCMC 2006), and share of woodlots in croplands (WRI calculation based on ICRAF and DRSRS 2001).
Farms and settlements produce at least 30-50 percent of Kenya’s wood supply, mainly for energy purposes. Agroforestry is the primary source of firewood. Private lands, either farmland or rangeland, are the major source of wood for charcoal.
This map shows the proportion of croplands covered by woodlots. Areas with higher percentages of woodlots cluster more extensively in the foothills of the Aberdare Range and Mount Kenya, and in most communities of Central Kisii, Nyamira, and Buret Districts. A relatively large area of the upper parts of Maragua and Muranga Districts is covered by cropland where woodlots cover more than 12 percent of the land. Close proximity to densely settled rural and urban areas, as well as other centers of high wood demand (for example, tea production) are among the factors behind these spatial patterns.
The share of woodlots is much lower in the western parts of the country. Farmers also do not plant woodlots in the more marginal cropping areas with lower rainfall, such as Makueni, Kitui, Mbeere, or Tharaka Districts. Note that these farmers may still plant trees for other purposes (see Map 7.2) and that woodlots are only one of many sources for firewood (other sources include vegetation used to demarcate boundaries, or vegetation on cropland).
Plantations (shown in dark green) cover only a very small percentage of the map area. The majority of them are govern-ment owned and most of the wood is used for timber. Major plantations are in the Rift Valley (e.g., Uasin Gishu, Keiyo, Koibatek and Nakuru Districts) and in the central part of the country (e.g., where Thika, Kiambu, and Nyandarua Districts border each other).
Note: The map combines detailed crop information (including the presence of woodlots) from 5,747 aerial photos for a growing season in 1997, each providing a sample point of detailed crop information. These samples are averaged to spatial units (polygons) of croplands from Kenya’s most recent land cover map (FAO 2000).
Map 7.3 Central and Western Kenya: Woodlots on Croplands, 1997, and Plantations, 2000

N A T U R E ’ S B E N E F I T S I N K E N Y A : A N A T L A S O F E C O S Y S T E M S A N D H U M A N W E L L - B E I N G
p
q
t u100
Sources: ESDA 2005b, CBS 2006.
Note: The economic value of agricultural products only reflects the quantities that were officially recorded in the market of 2004 (using average prices). The statistics do not count production for self-consumption or quantities traded informally. For example, millions of smallholder farms produce some maize for home consumption, but maize that reaches the commercial market comes mostly from large-scale farms (Jayne et al. 2000).
Sources: ESDA 2005b, CBS 2006.
KEY SUPPLY AREAS FOR FIREWOOD AND CHARCOAL
Woodfuel supply areas are difficult to map because of the ubiquitous use of the resource, the local scale of the firewood supply chain, and the limited availability of spatially disaggregated production data. Charcoal—an important fuel for urban households—is a special challenge because a 1986 Presidential directive banned the produc-tion and transport of charcoal (although it did not prohibit selling, buying, or using charcoal), and forced the charcoal market underground (Matiru and Mutimba 2002).
Firewood Collection and Charcoal Making Data from recent studies make it possible to map
several important variables related to firewood and charcoal in Kenya, including where firewood and charcoal appear to be important sources of income (Map 7.4), and which sources of wood are used for charcoal production (Map 7.5) (MoE 2002; ESDA 2005a; ALRMP et al. 2006). While the underlying data and the resulting maps still have significant gaps in coverage, together they provide an initial picture of the spatial patterns of charcoal and fire-wood production in Kenya.
Firewood is the dominant energy source for rural households, with 89 percent of rural Kenyans rely-ing on firewood for their energy needs (MoE 2002). Typically, the firewood is used close to the source of extraction. More than 80 percent of households obtain their firewood within a 5-kilometer radius of their home (MoE 2002). The average length of time spent on collection is about two hours per day (MoE 2002)—a task that falls disproportionately on women and girls and takes time away from other productive activities.
About 82 percent of urban households and 34 percent of rural households (MoE 2002) use charcoal. Traders transport charcoal over great dis-tances, primarily to urban markets. Since the 1980s, the proportion of rural households relying on this source of energy has slowly increased (MoE 2002).
Kenya’s National Charcoal Survey estimates that 200,000 people produce charcoal, half of whom work full-time and half part-time (ESDA 2005a). About 300,000 people are involved in transporta-tion and vending. These 500,000 people support approximately two million dependents. As Figure 7.1 shows, charcoal production provides significant employment, comparable to other important sectors in the economy (ESDA 2005b).
The National Charcoal Survey estimates gross revenue from charcoal production at Ksh 32 billion per year (US$ 457 million) (ESDA 2005a). A separate study (MoE 2002) provides a lower, but still significant, estimate of Ksh 17.5 billion per year (US$ 250 million). Charcoal revenues are calculated to be significantly higher than the returns from sugarcane, coffee, maize, and other cereals. Depending on the average retail price for charcoal and the estimated volume of national production, the gross revenue from charcoal lies between that of horticulture exports and that of livestock and related products (Figure 7.2).
Unlike other commodities, the government does not receive any tax revenues from the charcoal sector due to the 1986 Presidential directive that made the production and transport of charcoal illegal. Assuming a valued-added tax of 16 percent, the annual loss in tax revenues could be as high as Ksh 5.1 billion (US$ 72.9 million) per year (ESDA 2005b). While the aggregated revenues from the charcoal industry represent a significant amount, charcoal production remains a poorly remunerated occupation. The average monthly income is Ksh 4,496 (US$ 64) for a producer, Ksh 7,503 (US$ 107) for a vendor, and Ksh 11,298 (US$ 161) for a transporter (ESDA 2005a).
Thou
sand
per
sons
320.6
242.0 234.5
200.0168.0
100.8 83.7
20.9 5.50
50
100
150
200
250
300
350
Min
ing
and
Quar
ying
Elec
trici
tyan
d W
ater
Fina
nce,
Insu
ranc
e,Re
al E
stat
e, a
ndBu
sine
ss S
ervi
ces
Tran
spor
t and
Com
mun
icat
ions
Trad
e, R
esta
uran
ts,
and
Hote
ls
Char
coal
Prod
ucer
s
Publ
ic S
ecto
rTe
ache
rs S
ervi
ceCo
mm
issi
on
Man
ufac
turin
g
Agric
ultu
rean
d Fo
rest
Mill
ion
Keny
an S
hilli
ngs
41.2
32.6 32.0
20.8
8.47.3 6.9
6.9
Othe
rCe
real
s
Mai
ze
Coffe
e
Suga
rcan
e
Live
stoc
k a
nd R
elat
edPr
oduc
ts
Char
coal
Horti
cultu
re(F
resh
Exp
orts
Onl
y)
Tea
0
5
10
15
20
25
30
35
40
45
Figure 7.2 Gross Revenue from Charcoal Compared to Marketed Production of Agricultural Products, 2004
Figure 7.1 Employment by the Charcoal Industry Compared to Other Formal Sectors, 2004

7
p
q
W O O D t u101
Sources: Administrative boundaries (CBS 2003), cities (SoK and ILRI 2000), water bodies (FAO 2000), and share of cash income from firewood collection and charcoal making (ALRMP et al. 2006).
Charcoal production and firewood collection is an important economic activity in Kenya. The sector contributes to income in most areas, except the more remote locations that have very little woody vegetation (e.g., parts of Marsabit District). These activities are also not a significant source of income in selected communities in the central part of the country and directly along the Indian Ocean (although households may still collect firewood or produce charcoal for their own use).
The majority of households in communities located about 50 kilometers inland from Mombasa (in Kwale District) obtain more than 20 percent of their cash from firewood and charcoal. Income from firewood and charcoal ranges between 10 and 20 percent of total income in the coastal hinterlands close to Malindi. Communities in the west (slightly inland from Lake Victoria) and along the Tana River (close to Garissa) show similarly high percentages. Charcoal from mathenge (Prosopis juliflora, also known as mesquite), an invasive shrub that is cleared from the land to save pasture, is the main source for this cash in Garissa District.
Note: Data are based on questionnaires sent to key food security experts in all Districts (generally about 6-10 people) to obtain information on predominant livelihood charac-teristics important for food security planning. In some cases where further clarification was necessary, questionnaires were sent to experts below District level (Division). This group of experts classified each of Kenya’s 6,632 Sublocations by their predominant livelihood strategy and other livelihood characteristics including different sources of cash income.
CASH INCOME FROM FIREWOOD AND CHARCOAL
(percent of total income)
> 20
10 - 20
5 - 10
0 - 5
No cash income from charcoal and firewood
OTHER FEATURES
District boundaries
Major national parks and reserves (over 5,000 ha)
Water bodies
Map 7.4 Cash Income From Firewood Collection and Charcoal Making, 2003-05

N A T U R E ’ S B E N E F I T S I N K E N Y A : A N A T L A S O F E C O S Y S T E M S A N D H U M A N W E L L - B E I N G
p
q
t u102
SOURCES OF WOOD FOR CHARCOAL
OTHER FEATURES
District boundaries
‘Public’: County Council and communal land
Public: Government
Private: Land not owned by charcoal producer
Private: Land owned by charcoal producer
Water bodies
No data
Sources: Administrative boundaries (CBS 2003), water bodies (FAO 2000), and sources of wood for charcoal (ESDA 2005a).
Eighty-two percent of Kenya’s charcoal comes from private land (either farmland or rangelands) as high-lighted by the dominance of blue shading in the stacked bars representing the relative share of the four principal wood sources. In eight of the 22 surveyed Districts, more than half of the wood for charcoal comes from land owned by the charcoal producers (West Pokot, Machakos, Makueni, Mbeere, Mount Elgon, Mwingi, Bungoma, and Meru North). These producers often grow trees for other purposes (e.g., fruit, shade, boundary demarcation, or construction material) and may regularly harvest branches or rely on tree remnants for their charcoal. In Migori, Kajiado, Maragua, Uasin Gishu, and Gucha Districts more than half of the wood for charcoal comes from private land that is not owned by the charcoal producers. In many parts of these Districts, private landowners hire labor to remove vegetation on their land for charcoal.
Only 18 percent of Kenya’s charcoal comes from public lands (shown in red and orange), which include govern-ment land (e.g., national parks, game reserves, and forest reserves) and other land either owned communally or by a County Council. Charcoal producers in Nakuru, Nyeri, and Trans Nzoia Districts report the largest proportion of wood from government land. Removal of wood from government land for charcoal production is illegal. Among the sampled Districts, Garissa, Kilifi, and Taita Taveta provide the highest share of wood from other public lands (communal and County Council lands). County Council land is the source of 45 percent of the wood in Garissa District, and communal land is the source of 32 and 33 percent of wood in Kilifi and Taita Taveta Districts, respectively.
Note: Land in Kenya can be owned by government, County Councils, groups, and individuals (Kameri-Mbote 2005).
Map 7.5 Sources of Wood for Charcoal in Selected Districts, 2004

Growth of Biomass and Potential Harvest Wood for charcoal and firewood can come from
less modified ecosystems such as forests, woodlands, bushlands, and wooded grasslands. It can also come from managed landscapes such as fuelwood planta-tions, woodlots growing native and exotic trees on farmland, or trees and shrubs growing along the boundaries of cropland or roads. With care, wood can be harvested in a sustainable manner, with the harvest rate no higher than the annual biomass growth. Examples include removing only dead branches and any annual regrowth, or planting new trees to replace those that have been cut. Of course, wood can also be harvested in an unsustainable manner, leading to a decline in the stock of woody biomass. This results from harvesting more wood than grows back every year or clearing the land completely of all vegetation, either because of very high local energy demand or demand for land for new settlements, pasture, or croplands.
Assessments of supply and demand for fuelwood typically rely on studies estimating the annual growth of biomass. This growth rate depends on many factors, including rainfall, soil type, and the age of the vegetation community. The following maps draw upon detailed data from Kenya’s most recent study examining energy supply and demand (MoE 2002). These maps represent the first attempt at a spatial representation of these data.
Map 7.6 is the result of applying the mean an-nual woody productivity rates of different types of vegetation in various agroecological zones to Kenya’s most recent and detailed land cover maps (FAO 2000). It reflects the amount of wood that, in theory, could be sustainably harvested annually from vegetation outside croplands without depleting the biomass stock.
Sources: Cities (SoK and ILRI 2000), water bodies (FAO 2000), permanent rivers (NIMA 1997), and annual growth of biomass for vegetation outside of croplands (WRI calculation based on MoE 2002, FAO 2000).
The map depicts, in three broad categories, a rough estimate of the amount of wood that could be sustainably harvested, that is, the annual growth of wood biomass per year from vegetation outside of croplands that could be harvested without depleting the stock. Closed forests in the mountain ranges, and forests and dense woodlands along the coast are the most productive. Areas that are generally classified as bushlands or woodlands on national maps fall in the mid-range of productivity. The areas in the lowest growth category either are a mix of cropland and natural landscapes (with little remaining natural vegetation) or have few trees, for example, grasslands.
Note: All areas classified as ‘natural and semi-natural’ in the Africover map (FAO 2000) were grouped into five broad vegetation classes (closed forest, woodland, bushland, wooded grassland, and grassland) based on their vegetation charac-teristics (38 different Africover codes). Each of the five broad vegetation classes was assigned the same average annual woody biomass growth rates as used in the Ministry of Energy (2002) study to estimate Kenya’s biomass supply. Africover spatial units (polygons) with mixed vegetation classes (e.g., cropland interspersed with ‘natural and semi-natural vegetation’) were weighed by the respective area contribution. For the final map, total woody biomass growth (from standing natural biomass sources) for each Africover polygon was divided by its total polygon area to obtain growth of biomass in cubic meters per square kilometer per year.
ANNUAL GROWTH OF BIOMASS OUTSIDE CROPLANDS
(cubic meters per sq. km per year)
> 85
35 - 85
<= 35
Not applicable (intensive cropping and urban areas)WATER BODIES AND RIVERS
Permanent rivers
Water bodies
7
p
q
W O O D t u103
Map 7.6 Annual Growth of Biomass Outside of Croplands

N A T U R E ’ S B E N E F I T S I N K E N Y A : A N A T L A S O F E C O S Y S T E M S A N D H U M A N W E L L - B E I N G
p
q
t u104
Sources: Cities (SoK and ILRI 2000), water bodies (FAO 2000), permanent rivers (NIMA 1997), parks and reserves (IUCN and UNEP/WCMC 2006), primary and secondary roads (SoK and ILRI 1997), and theoretically harvestable biomass yield outside of croplands (WRI calculation based on Map 7.6, MoE 2002, FAO 2000).
According to Map 7.7, the high-yield areas of theoretically harvestable biomass growth from natural vegetation closest to Nairobi would be the rangelands south of the city (in Narok and Kajiado Districts), but also in the southeast (in parts of Machakos District). For Mombasa, the closest areas would be the woodlands about 50 kilometers from the coast (in Kwale and Kilifi Districts), but also the tempting supplies within protected areas (Tsavo East and West National Parks). Areas close to Garissa and farther east near the Somalia border have similar high yields, but are disadvantaged by long transport distances (increasing costs), poorer roads, and a more limited supply of labor.
While Map 7.7 may provide a correct relative picture of potential woodfuel supply areas (as-suming sustainable harvest levels), the map may still underrepresent the actual quantity of wood removed for energy purposes. In some areas, local energy needs may be much higher than harvestable regrowth, leading to depletion of trees and other woody vegetation. In other areas, land clearing for new farms or new cropland can result in higher, albeit short-term, supplies of wood. For example, the removal of mathenge (Prosopis juliflora, also known as mesquite) in Garissa District results in much greater local wood supplies.
THEORETICALLY HARVESTABLE BIOMASS YIELD OUTSIDE CROPLANDS
(cubic meters per sq. km per year)
> 10
5 - 10
<= 5
Not applicable (intensive cropping and urban areas)
OTHER FEATURES
Primary roads
Secondary roads
National parks and reservesWATER BODIES AND RIVERS
Permanent rivers
Water bodies
However, because of legal issues (including laws governing protected areas), the distance between demand and supply centers, lack of roads, and other factors, not all the wood that theoretically grows every year is available for energy use. Map 7.7 incorporates ‘accessibility’ factors from the national energy study (MoE 2002). The experts behind the study assumed that only a portion of different veg-etation types are available for energy use:u 5 percent of potential growth in closed forests
(a result of controlled access by the Forest Department).
u 30 percent of the growth in woodlands, bushlands, and wooded grasslands (a result of more open access, combined with smaller tree diameters).
u 10 percent of the vegetation in wooded grass-lands (primarily in proximity to settlements).
Map 7.7 is a closer approximation of the theo-retically harvestable biomass growth outside of croplands because it is the result of multiplying the annual growth rate (Map 7.6) with these ‘accessibil-ity’ factors. By outlining the boundaries of protected areas, which prohibit but do not always manage to exclude woodfuel removal, and by indicating major roads and cities, the map can be used to delineate potential supply areas of ‘sustainably harvested’ charcoal, which is typically transported over long distances from rural to urban demand centers.
Map 7.7 Theoretically Harvestable Biomass Yield Outside of Croplands

7
p
q
W O O D t u105
The most recent National Charcoal Survey demonstrat-ed the economic significance of the charcoal industry in terms of employment and gross revenues. Over 2.5 million Kenyans are supported by the industry. Charcoal produc-tion or trade is carried out in almost all of Kenya’s Districts. Charcoal producers capture only a small percentage of the revenues because the price at the point of production is sig-nificantly lower (Ksh 200 per bag) than the retail price (Ksh 700 per bag). Charcoal transporters have justified their high markup by citing the significant costs linked to the still ille-gal transport of the commodity. The study estimates that the government is foregoing Ksh 5.1 billion (US$ 72.9 million) in annual revenues by upholding the ban on production and transport of charcoal rather than taxing and regulating the industry (ESDA 2005a).
Charcoal, together with firewood, is still the dominant fuel in Kenya. About 82 percent of urban and 34 percent of rural households use charcoal as their main energy source. Demand will continue its growth in the near future (MoE 2002).
Policymakers are now acknowledging more openly that the charcoal industry is a significant contributor to rural live-lihoods and that poverty and the need to generate income has been driving certain types of production patterns. They are beginning to understand that a blanket ban on production and transport has promoted inefficient production technolo-gies, lowered producer prices, sacrificed government rev-enues, and led to unsustainable wood extraction in certain areas (ESDA 2005a). They also accept that, based on current economic conditions and the existing energy infrastructure, charcoal will remain an important energy source in the short to medium term. It is therefore paramount to establish a more sustainable and environmentally benign charcoal in-dustry (ESDA 2005a).
The National Charcoal Survey therefore explored the po-tential for a more sustainable charcoal industry. It proposes specific policy and institutional changes that would put char-coal making on a more sustainable path and contribute to improved livelihoods for people involved in the industry. The Survey suggests reforming the regulatory framework, which would include specific production standards and certification processes. It recommends making the charcoal industry legal and fully integrating it into the national economy, thus mak-ing it a source of government revenue and creating better conditions for charcoal producers. The Survey also proposes establishing institutions that would oversee and audit the in-dustry. Other important recommendations include pilot proj-ect zones of sustainable charcoal production, where different technologies and production approaches could be tested and improved, and a woodfuel fund (perhaps based on a trans-port levy) that could be invested in new, more sustainable production technology or support disadvantaged producers (ESDA 2005a).
Combining maps and spatial indicators of biomass energy production, energy use, other ecosystem services, and pov-erty can become a valuable tool for decision-makers to im-plement some of the main recommendations in the National Charcoal Survey. Below are some specific examples that link recommendations from the Survey to possible map overlays, as a first step for more detailed follow-up studies.
Support fuelwood and charcoal producers on private land. Most of Kenya’s charcoal comes from private land, and a significant proportion of that supply comes from farmland owned by the charcoal producers themselves. These produc-ers plant trees and selectively cut and prune them for charcoal (ESDA 2005a). Many of them could benefit from tree nurser-ies providing better-suited varieties (which, for example, yield more biomass or require less water) and knowledge of sustain-able agroforestry practices. Maps can highlight where these producers are located: most of them are in higher rainfall and high potential agroecological zones. Such a production map can then be combined with maps showing which tree species are currently planted, whether households have sufficient re-sources to make additional investments in new species or set aside land for trees, and whether farmers have been trained
in more sustainable agroforestry practices. Analyses of these relationships will provide more insight on promising locations for tree nurseries, their potential supply areas, and their demo-graphic and poverty characteristics. Other analyses can show where to conduct agroforestry training or initiate tree-planting activities.
Improve efficiency of charcoal production. The most common technique used for charcoal production is the earth kiln. Such kilns have a very low recovery rate, requiring 100 kg of wood to produce 10–15 kg of charcoal. Changing the type of kiln, improving the stacking of wood in the kiln, and modifying the burning process, all can boost the charcoal recovery rate up to 30 kg of charcoal per 100 kg of wood (ESDA 2005a). The same set of maps listed above can assist in selecting promising sites for model community kilns and targeting training efforts.
Allocate land for sustainable charcoal production. Kenya’s 2004 National Energy Policy proposes that the gov-ernment dedicate 25 percent of forest land to bio-energy production (ESDA 2005a). Private landowners have also ex-pressed interest in supplying wood for charcoal once the industry becomes fully legalized and more transparently managed (ESDA 2005a). Maps can show the locations of plantations and government lands (see Map 7.3) and can provide estimates of their current stocking levels and an-nual regeneration rates (as shown in Map 7.8). These maps of current supply can be combined with others of potential future supply. Such maps would delineate optimal areas for tree species well-suited for charcoal making, for example species that are endemic (and thus better adapted) and that have a very high regeneration rate (thus allowing faster ro-tations and recovery of investments). Combining these dif-ferent layers with demographic and poverty maps, maps of energy demand and markets, and transport infrastructure, would be useful inputs to delineate the most promising areas and assist in the planning of pilot projects.
Create buffer zones for sustainable charcoal produc-tion in areas bordering protected areas. The National Charcoal Survey suggests creating buffer zones where char-coal production is specifically encouraged to reduce pres-sure on protected areas and build better livelihoods (ESDA 2005a). Maps highlighting where government land is still a major source for illegal wood, and where high local demand is outpacing local supplies, could be the first map layers used to select such buffer zones.
Establish better regulations and guidance on land use, especially when changes in land use are taking place. In the past, major land use changes—for example, from gazett-ed forests to croplands, or from rangelands to croplands—have led to short-term, unsustainable charcoal production because of the complete removal of all woody vegetation. Maps can highlight zones where such wood removal would have highly negative impacts on other ecosystem services (such as biodiversity or hydrology) and should not be permit-ted. Maps, coupled with more detailed hydrological models, can also highlight areas where massive planting of exotic tree species would greatly impact water balances, and where it would have little impact within a watershed. Such map-based analyses can become the foundation for improved land use planning and zoning in the country.
Box 7.1 Links to National Decision-Making: Using Maps of Ecosystem Services to Establish a More Sustainable Charcoal Industry

N A T U R E ’ S B E N E F I T S I N K E N Y A : A N A T L A S O F E C O S Y S T E M S A N D H U M A N W E L L - B E I N G
p
q
t u106
Map 7.8 Woodlots on Croplands in Five Provinces, 1997
The decision to maintain woodlots on croplands illustrates the relative value that farmers assign to wood or crops. Combining poverty maps with maps that show the degree to which farmers have dedicated their cropland to woodlots can provide insights into possible relationships between wood supplies, agroforestry investments, and poverty.
Table 7.3, based on Map 7.8, classifies the land area of each Province into eight classes reflecting the degree to which croplands are covered with woodlots. Since the underlying data are in GIS format, the total population and population
density for each of the eight classes can be estimated, as well as the number of poor people and the average poverty rate.
What Do the Map and Poverty Profile Show?u The table shows that very few farmers have set aside
more than 12 percent of their cropland for woodlots. In all Provinces, the class with the highest woodlot share covers the smallest area and is inhabited by fewer peo-ple compared to the other classes. Areas with shares of 2–4 percent or 4–6 percent are more extensive and include a greater number of people in most Provinces.
u The relationship between poverty rate and the share of woodlots in cropland is less straightforward. The differ-ences in poverty rates between the five Provinces are much greater than the differences between the eight classes within each Province. At this level of aggrega-tion, there is not a clear correlation between the per-centage of cropland taken up by woodlots and the aver-age poverty rate.
u Nonetheless, the table does reveal some noteworthy patterns. For example, areas with croplands covered by more than 12 percent woodlots are below the Provincial average poverty rate (with one exception, Western Prov-ince). In addition, some Provinces (Central and Nyanza Provinces) show a declining poverty rate from the ‘no-woodlot’ class to the highest woodlot class. These pat-terns need to be further examined at a more detailed scale. Combined with additional location-specific infor-mation (e.g., level of wood demand, presence of tree nurseries, household capital, and labor availability), this could provide insights on whether reduced poverty is the result or cause of an increased share of cropland devoted to woodlots.
Similar profiles can be constructed overlaying other woody biomass-related indicators from this chapter with poverty in-dicators from Chapter 2. For example, identifying all commu-nities with high poverty rates bordering closed forest areas, and combining that information with maps on charcoal sup-ply sources and agroforestry practices could pinpoint prom-ising areas where tree planting and agroforestry training may reduce pressure to illegally remove wood from government reserves.
PROVINCE
AREAS WITHOUT CROPLAND AND SHARE OF WOODLOTS IN SAMPLED CROPLAND AREAS
AREA (SQ. KM)
NUMBER OF PEOPLE
(000)
AVERAGE POPULATION
DENSITY (PERSONS
PER SQ. KM)
NUMBER OF POOR
(000)
AVERAGE POVERTY RATE (%)
KSH NEEDED PER MONTH TO REACH POVERTY
LINE1 (MILLION)
EASTERN
No Cropland 118,134 670 6 359 54 93.2
Cropland Not Sampled 13,184 650 49 391 60 112.1
No Woodlots 14,394 1,128 78 702 62 213.8
Woodlots 0.1–2% 4,322 563 130 357 63 109.7
Woodlots 2–4% 1,082 294 272 166 56 44.5
Woodlots 4–6% 2,179 277 127 154 56 39.8
Woodlots 6–12% 2,726 540 198 290 54 72.8
Woodlots >12% 1,474 45 31 26 57 7.1
TOTAL 9 Districts 157,495 4,166 26 2,445 59 693.1
CENTRAL
No Cropland 3,675 351 96 110 31 16.3
Cropland Not Sampled 1,819 366 201 111 30 17.2
No Woodlots 1,564 282 180 102 36 18.0
Woodlots 0.1–2% 1,518 366 241 123 34 17.8
Woodlots 2–4% 1,359 439 323 145 33 19.3
Woodlots 4–6% 1,959 854 436 263 31 32.6
Woodlots 6–12% 942 429 455 127 29 14.5
Woodlots >12% 388 144 371 43 30 4.5
TOTAL 6 Districts 13,224 3,231 244 1,024 32 140.3
RIFT VALLEY
No Cropland 145,696 1,969 14 968 49 245.6
Cropland Not Sampled 14,656 1,024 70 457 45 101.1
No Woodlots 7,708 799 104 361 45 87.4
Woodlots 0.1–2% 3,702 638 172 288 45 65.5
Woodlots 2–4% 3,829 700 183 342 49 76.7
Woodlots 4–6% 3,843 557 145 294 53 87.9
Woodlots 6–12% 3,036 265 87 135 51 29.6
Woodlots >12% 2,155 70 32 32 46 6.6
TOTAL 6 Districts 184,625 6,022 33 2,877 48 700.4
Table 7.3 People, Poverty, and Woodlots in Croplands
Continued
DNALPORC NI STOLDOOW
)dnalporc delpmas fo tnecrep(
21 >
21 - 6
6 - 4
4 - 2
2 - 0
dnalporc delpmas ni stoldoow oN
delpmas ton dnalporC
Box 7.2 Creating a Poverty and Demographic Profile for Croplands With Different Proportions of Woodlots

PROVINCE
AREAS WITHOUT CROPLAND AND SHARE OF WOODLOTS IN SAMPLED CROPLAND AREAS
AREA (SQ. KM)
NUMBER OF PEOPLE
(000)
AVERAGE POPULATION
DENSITY (PERSONS
PER SQ. KM)
NUMBER OF POOR
(000)
AVERAGE POVERTY RATE (%)
KSH NEEDED PER MONTH TO REACH POVERTY
LINE1 (MILLION)
NYANZA
No Cropland 806 208 258 134 65 65.9
Cropland Not Sampled 713 182 256 120 66 43.3
No Woodlots 1,943 385 198 256 67 88.3
Woodlots 0.1–2% 4,849 1,189 245 755 64 253.0
Woodlots 2–4% 1,343 417 311 259 62 79.5
Woodlots 4–6% 1,763 869 493 542 62 161.8
Woodlots 6–12% 1,064 603 567 392 65 124.6
Woodlots >12% 63 12 190 7 58 2.0
TOTAL 12 Districts 12,544 3,865 308 2,466 64 818.3
WESTERN
No Cropland 1,061 126 119 78 62 23.0
Cropland Not Sampled 314 86 274 49 57 13.2
No Woodlots 531 138 260 75 54 18.6
Woodlots 0.1–2% 1,232 385 312 226 59 61.3
Woodlots 2–4% 4,318 1,900 440 1,133 60 325.9
Woodlots 4–6% 766 296 386 176 59 48.6
Woodlots 6–12% 179 58 324 35 60 9.9
Woodlots >12% 56 17 305 10 59 2.7
TOTAL 6 Districts 8,457 3,006 355 1,782 59 503.3
TOTAL 39 Districts 376,345 20,290 54 10,594 52 2,855.4 2
Sources: Poverty and demographic estimates (1999) are WRI/ILRI calculation based on CBS 2002 and CBS 2003. Area without cropland, cropland not sampled, and area estimate for each woodlot percentage class are WRI calculation based on data for Maps 7.3 and 7.10 (ICRAF and DRSRS 2001; FAO 2000).
Note: 1 The poverty gap measures the average expenditure shortfall (gap) for the poor in a given administrative area relative to the poverty line. It is a crude estimate of the minimum amount of resources needed to eradicate poverty (see Chapter 2).2 The total amount to close the poverty gap for one month in the 39 Districts (Ksh 2.9 billion) equals about US$ 40.8 million (at US$ 1 = Ksh 70).
SUMMING UP
u While Kenya’s forests, woodlands, bushlands, wooded grasslands, and agroecosystems supply a wide array of ecosystem services, one of their major contributions is supplying wood. Kenyans use 80–90 percent of the wood from these ecosystems for energy purposes (fire-wood and charcoal), and the remaining 10–20 percent for timber, posts, and poles.
u Biomass is Kenya’s dominant fuel, accounting for over 80 percent of total energy consumption in 2000. Burning firewood and charcoal account for roughly equal per-centages of total wood consumption.
u Estimates put Kenya’s 1995 closed forest area at 984,000 hectares (1.7 percent of the land area). Other natural woody vegetation includes 2.1 million hectares of woodlands, 24.6 million hectares of bushlands, and 10.6 million hectares of wooded grasslands. Agricultural land can have a high percentage of tree cover as re-flected in the high tree density in the croplands of Cen-tral Province, for example. Woodlands, bushlands, and wooded grasslands contain most of Kenya’s woody bio-mass, albeit at much lower tree density and volume per area than the small remnants of closed forests. Closed canopy forests are only a minor contributor of woodfuel at a national level.
u The majority of wood harvested from plantations is for timber and poles. Of the 120,000 hectares designated as forest plantations, only 78,000 hectares were suffi-ciently stocked with trees in 1999.
u About 89 percent of rural Kenyans rely on firewood for their energy needs. More than 80 percent of households obtain firewood within a 5-kilometer radius of their home. The average length of time spent on collection is about two hours per day—a task that falls dispropor-tionately on women and girls.
u About 8 percent of firewood supplies came from Trust Land, and another 8 percent from gazetted forests. The remaining 84 percent were supplied by agrofor-estry systems and on-farm sources. This consisted of firewood purchased in the market (20 percent)—most being supplied by small private farms—and other more specific agroforestry sources. The latter included vege-tation along boundaries and fences (25 percent), vegeta-tion within croplands (13 percent), woodlots (8 percent), vegetation along roadsides (5 percent), and vegetation obtained from neighbors (13 percent).
u Farmers have responded to the high demand for wood by planting woodlots in their cropland. Croplands with higher percentages of woodlots cluster more extensively in the foothills of the Aberdare Range and Mount Kenya, and in most communities of Central Kisii, Nyamira, and Buret Districts. The share of woodlots is much lower in the western parts of the country and in the more mar-ginal cropping areas with lower rainfall.
u About 82 percent of urban households and 34 percent of rural households use charcoal regularly. Of the total national charcoal production, rural households together consume 47 percent; all urban households consume 36 percent; and cottage industries use 17 percent.
u About 82 percent of charcoal comes from private land (either farmland or rangelands) and 18 percent from public lands (including government, communal, or Trust Land). Charcoal producers in Nakuru, Nyeri, and Trans Nzoia Districts report the largest proportion of wood from government land.
u About 200,000 people produce charcoal and another 300,000 transport and vend charcoal. Gross revenues from charcoal production are estimated at Ksh 17.5–32 billion per year (about US$ 250–457 million). This puts charcoal revenues somewhere between that of horticulture exports and that of livestock. Because the charcoal industry is not fully legalized, the government is foregoing tax revenues as high as Ksh 5.1 billion (US$ 72.9 million) per year.
u Charcoal production and firewood collection is carried out in all Kenyan Districts and contributes to income in most areas. Charcoal production remains a poorly re-munerated occupation with an average monthly income of Ksh 4,496 (US$ 64) for a producer. In communities of Kwale District, households obtain on average more than 20 percent of their cash from charcoal production and firewood collection—the highest in the country. The proportion of income from charcoal and firewood ranges between 10 and 20 percent in the coastal hinterlands of Malindi District and parts of Garissa District.
u The high-yield areas of theoretically harvestable biomass growth from natural vegetation closest to Nairobi would be the rangelands south of the city (in Narok and Kajiado Districts), but also in the southeast (in parts of Machakos District). For Mombasa, the closest areas would be the woodlands of Kwale and Kilifi Districts. These areas may be well suited for sustainable charcoal production once the industry becomes fully legalized and more transpar-ently managed.
7
p
q
t u107
Table 7.3 People, Poverty, and Woodlots in Croplands — continued