many non-scientists have a preconception about scientists
TRANSCRIPT

Universitätsklinikum Schleswig-Holstein ©2012 1
Many non-scientists have a preconception about scientists that resembles the image of Jerry Lewis starring as the "Nutty Professor". It reflects the lay man's view that exciting scientific knowledge is mainly generated through "strokes of genius", involving explorative work which does not require any motivation other than the scientist's own curiosity. This stereotype may make nice Hollywood movies but it has little if anything to do with reality. Scientific research is hard work, mostly driven by hypotheses that arise from the critical synopsis of existing knowledge rather than divine inspiration.
In medicine, the major goal of scientific research is to broaden the knowledge base for the diagnosis, prevention, management and therapy of diseases. Therefore, the methods used in medical research, and the quality criteria applied to guarantee their proper implementation, should be of the utmost relevance to anybody working in medicine. This is because the ability of a doctor to make appropriate judgements and well-informed decisions in practice is critical for the well-being, and eventually the life, of his or her patients.
Universitätsklinikum Schleswig-Holstein ©2012 2
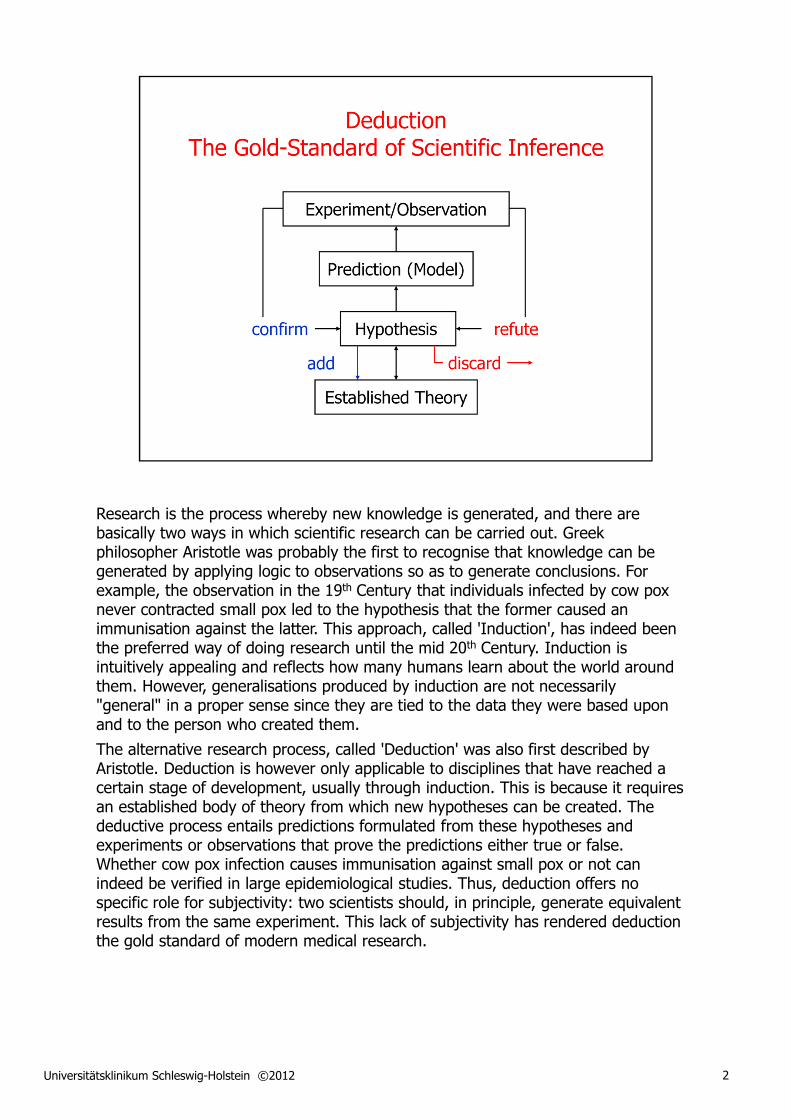
Research is the process whereby new knowledge is generated, and there are basically two ways in which scientific research can be carried out. Greek philosopher Aristotle was probably the first to recognise that knowledge can be generated by applying logic to observations so as to generate conclusions. For example, the observation in the 19th Century that individuals infected by cow pox never contracted small pox led to the hypothesis that the former caused an immunisation against the latter. This approach, called 'Induction', has indeed been the preferred way of doing research until the mid 20th Century. Induction is intuitively appealing and reflects how many humans learn about the world around them. However, generalisations produced by induction are not necessarily "general" in a proper sense since they are tied to the data they were based upon and to the person who created them.
The alternative research process, called 'Deduction' was also first described by Aristotle. Deduction is however only applicable to disciplines that have reached a certain stage of development, usually through induction. This is because it requires an established body of theory from which new hypotheses can be created. The deductive process entails predictions formulated from these hypotheses and experiments or observations that prove the predictions either true or false. Whether cow pox infection causes immunisation against small pox or not can indeed be verified in large epidemiological studies. Thus, deduction offers no specific role for subjectivity: two scientists should, in principle, generate equivalent results from the same experiment. This lack of subjectivity has rendered deduction the gold standard of modern medical research.
Universitätsklinikum Schleswig-Holstein ©2012 3
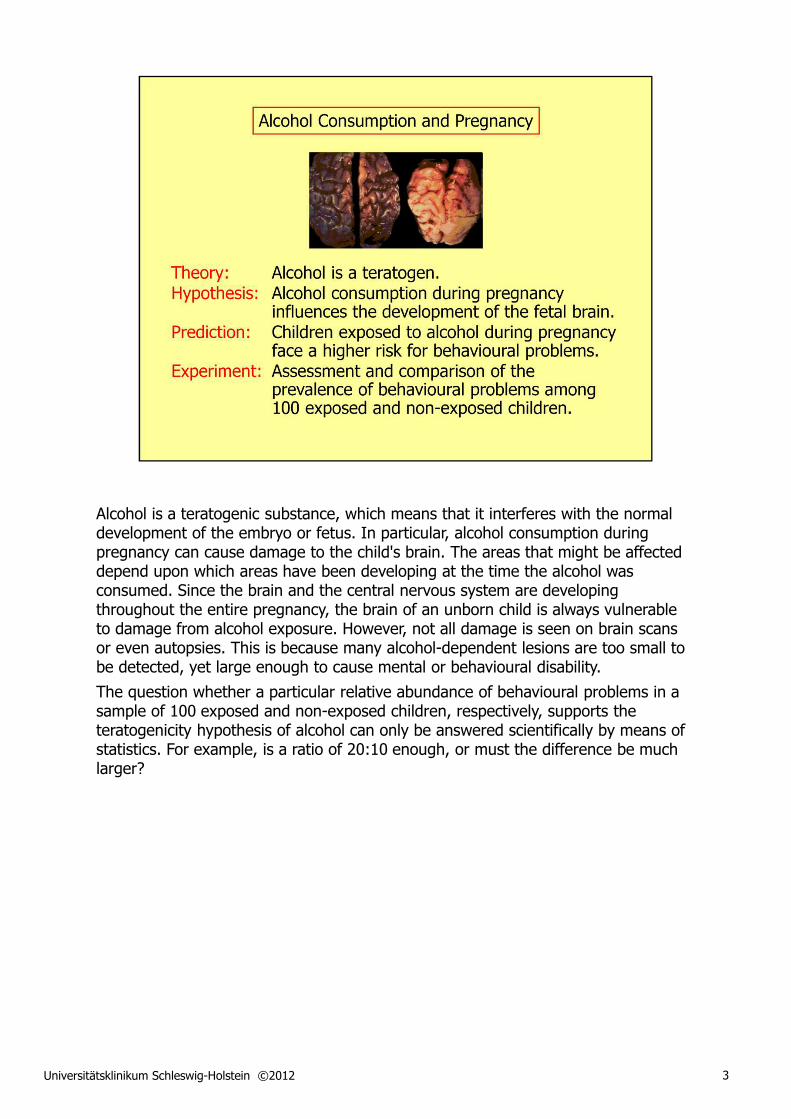
Alcohol is a teratogenic substance, which means that it interferes with the normal development of the embryo or fetus. In particular, alcohol consumption during pregnancy can cause damage to the child's brain. The areas that might be affected depend upon which areas have been developing at the time the alcohol was consumed. Since the brain and the central nervous system are developing throughout the entire pregnancy, the brain of an unborn child is always vulnerable to damage from alcohol exposure. However, not all damage is seen on brain scans or even autopsies. This is because many alcohol-dependent lesions are too small to be detected, yet large enough to cause mental or behavioural disability.
The question whether a particular relative abundance of behavioural problems in a sample of 100 exposed and non-exposed children, respectively, supports the teratogenicity hypothesis of alcohol can only be answered scientifically by means of statistics. For example, is a ratio of 20:10 enough, or must the difference be much larger?
Universitätsklinikum Schleswig-Holstein ©2012 4
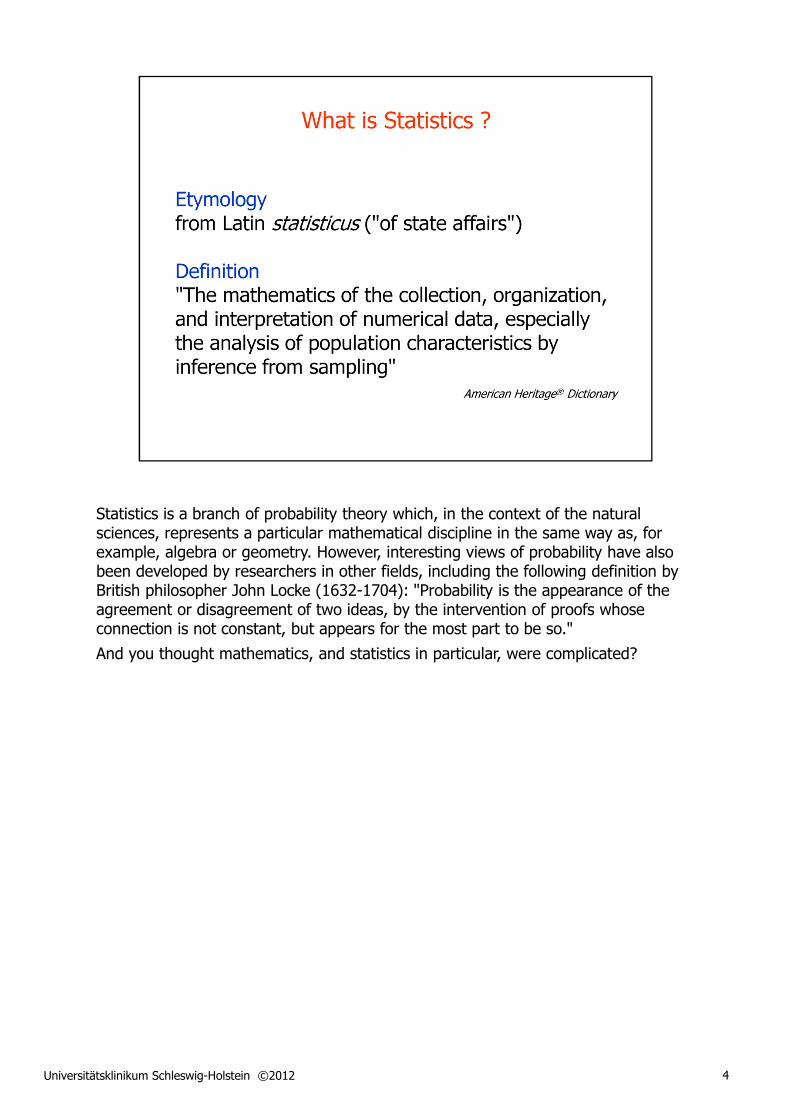
Statistics is a branch of probability theory which, in the context of the natural sciences, represents a particular mathematical discipline in the same way as, for example, algebra or geometry. However, interesting views of probability have also been developed by researchers in other fields, including the following definition by British philosopher John Locke (1632-1704): "Probability is the appearance of the agreement or disagreement of two ideas, by the intervention of proofs whose connection is not constant, but appears for the most part to be so."
And you thought mathematics, and statistics in particular, were complicated?
Universitätsklinikum Schleswig-Holstein ©2012 5
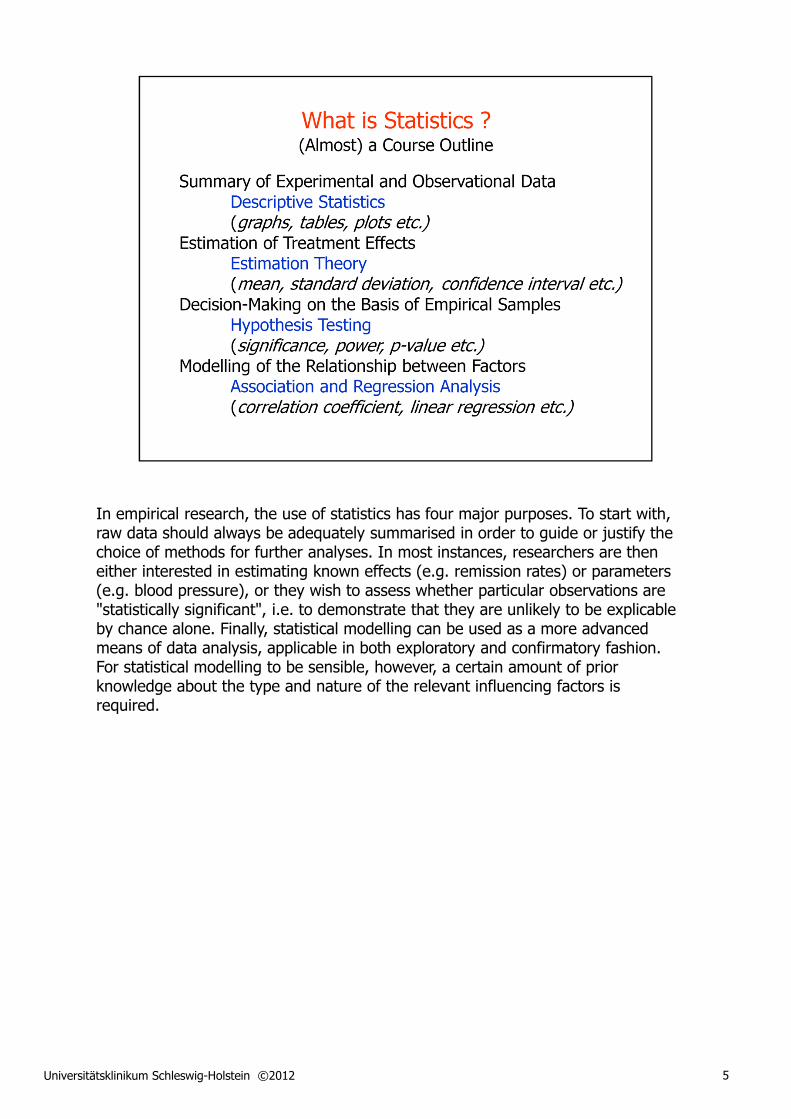
In empirical research, the use of statistics has four major purposes. To start with, raw data should always be adequately summarised in order to guide or justify the choice of methods for further analyses. In most instances, researchers are then either interested in estimating known effects (e.g. remission rates) or parameters (e.g. blood pressure), or they wish to assess whether particular observations are "statistically significant", i.e. to demonstrate that they are unlikely to be explicable by chance alone. Finally, statistical modelling can be used as a more advanced means of data analysis, applicable in both exploratory and confirmatory fashion. For statistical modelling to be sensible, however, a certain amount of prior knowledge about the type and nature of the relevant influencing factors is required.
Universitätsklinikum Schleswig-Holstein ©2012 6
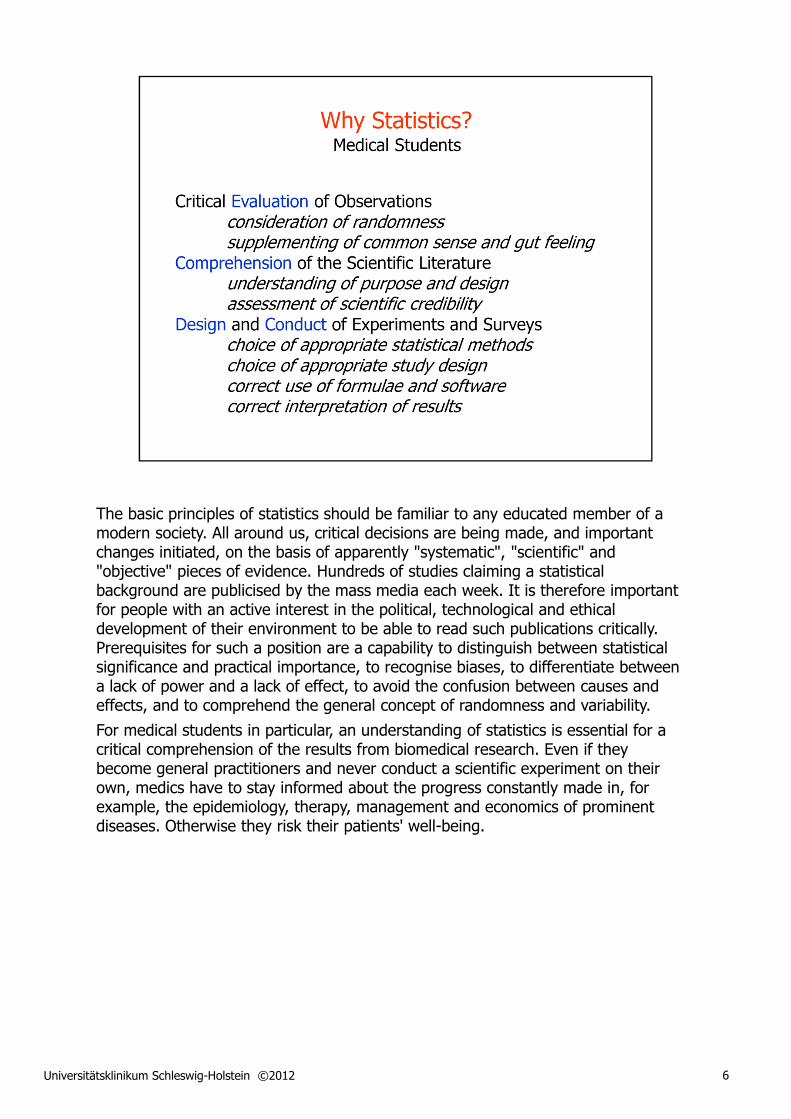
The basic principles of statistics should be familiar to any educated member of a modern society. All around us, critical decisions are being made, and important changes initiated, on the basis of apparently "systematic", "scientific" and "objective" pieces of evidence. Hundreds of studies claiming a statistical background are publicised by the mass media each week. It is therefore important for people with an active interest in the political, technological and ethical development of their environment to be able to read such publications critically. Prerequisites for such a position are a capability to distinguish between statistical significance and practical importance, to recognise biases, to differentiate between a lack of power and a lack of effect, to avoid the confusion between causes and effects, and to comprehend the general concept of randomness and variability.
For medical students in particular, an understanding of statistics is essential for a critical comprehension of the results from biomedical research. Even if they become general practitioners and never conduct a scientific experiment on their own, medics have to stay informed about the progress constantly made in, for example, the epidemiology, therapy, management and economics of prominent diseases. Otherwise they risk their patients' well-being.
Universitätsklinikum Schleswig-Holstein ©2012 7
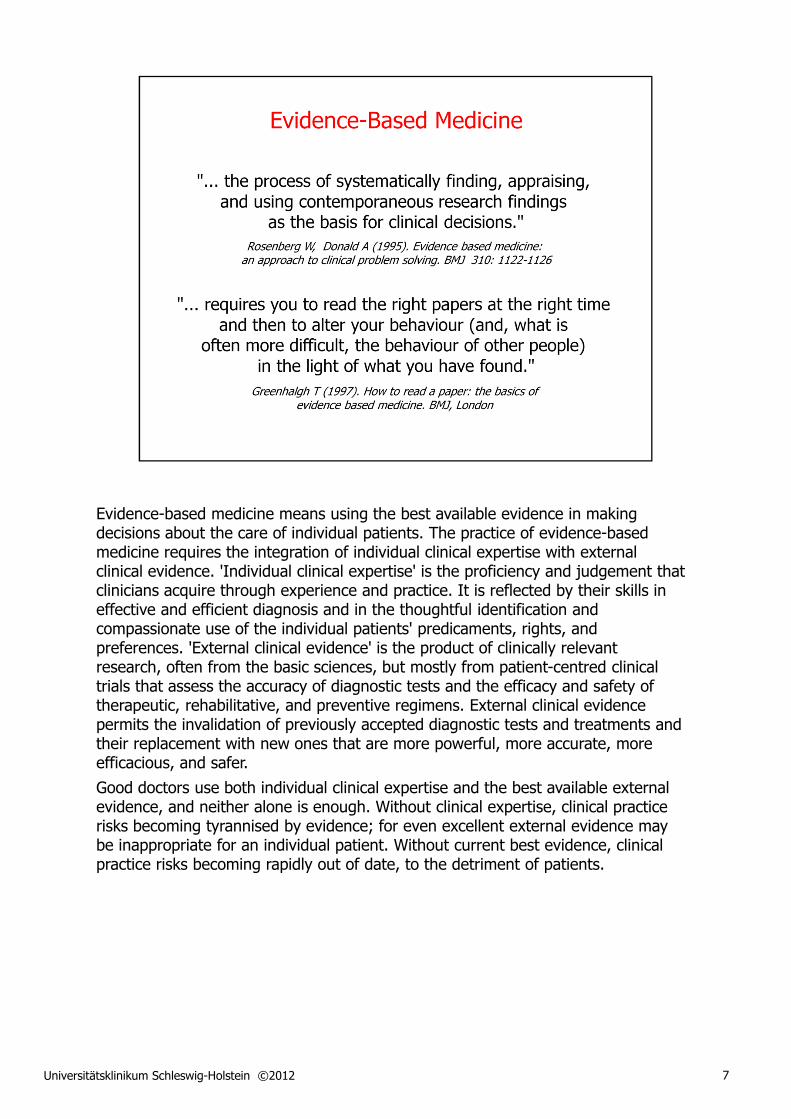
Evidence-based medicine means using the best available evidence in making decisions about the care of individual patients. The practice of evidence-based medicine requires the integration of individual clinical expertise with external clinical evidence. 'Individual clinical expertise' is the proficiency and judgement that clinicians acquire through experience and practice. It is reflected by their skills in effective and efficient diagnosis and in the thoughtful identification and compassionate use of the individual patients' predicaments, rights, and preferences. 'External clinical evidence' is the product of clinically relevant research, often from the basic sciences, but mostly from patient-centred clinical trials that assess the accuracy of diagnostic tests and the efficacy and safety of therapeutic, rehabilitative, and preventive regimens. External clinical evidence permits the invalidation of previously accepted diagnostic tests and treatments and their replacement with new ones that are more powerful, more accurate, more efficacious, and safer.
Good doctors use both individual clinical expertise and the best available external evidence, and neither alone is enough. Without clinical expertise, clinical practice risks becoming tyrannised by evidence; for even excellent external evidence may be inappropriate for an individual patient. Without current best evidence, clinical practice risks becoming rapidly out of date, to the detriment of patients.

Universitätsklinikum Schleswig-Holstein ©2012 8
The amount of practically relevant literature published in the medical sciences is steadily increasing. Between 1975 and 2015, the annual output of articles appearing in peer-reviewed biomedical journals has increased by a factor of five, and there is currently no flattening of the curve in sight. Most of this information is available in electronic format and is easily searchable via knowledge servers such as PubMed, maintained by the US National Library of Medicine. Nevertheless, the sheer pace and scope of the knowledge generation process implies that the informational burden imposed upon doctors by the evidence-based medicine paradigm is bound to become unbearable soon.
Fortunately, the situation is eased considerably by the general availability of systematic reviews. For example, the performance and publication of clinical studies is constantly monitored by the so-called 'Cochrane Collaboration', an international non-profit organisation dedicated to making up-to-date, accurate information about the effects of healthcare readily available. The Cochrane Collaboration was founded in 1993 and has since produced and disseminated approximately 5300 systematic reviews on healthcare interventions. It also provides a large number of economic evaluations and health technology assessments.
Universitätsklinikum Schleswig-Holstein ©2012 9
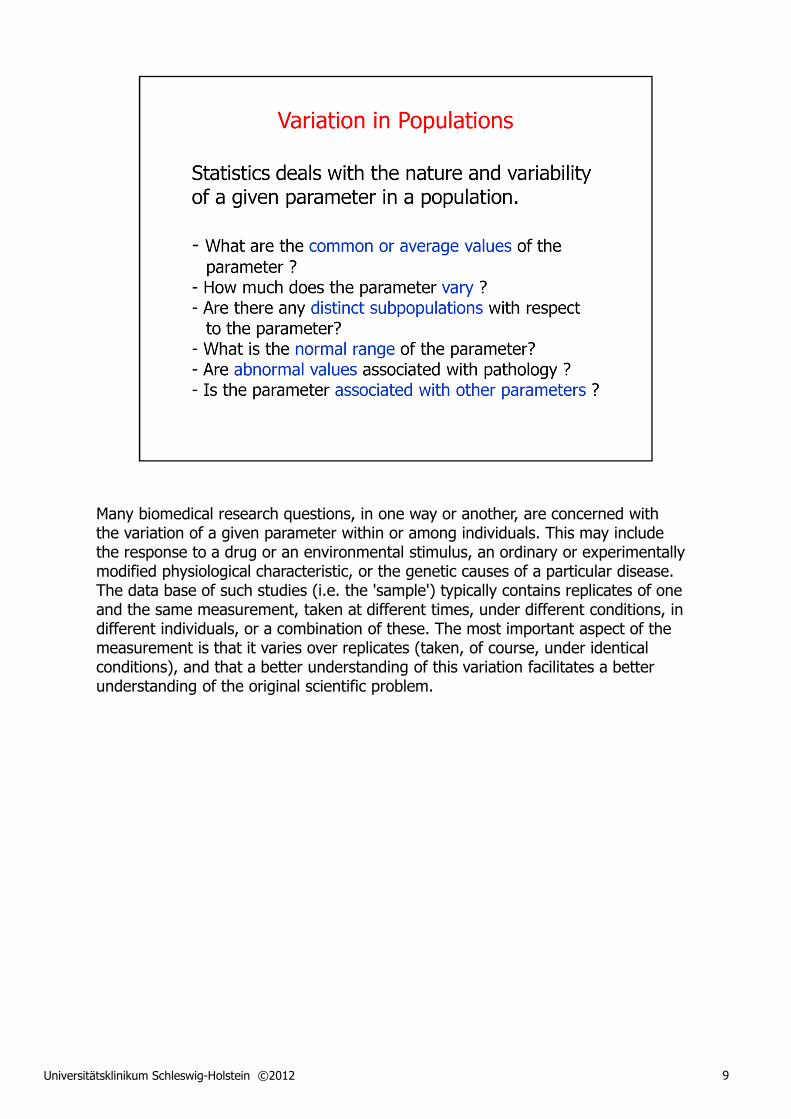
Many biomedical research questions, in one way or another, are concerned with the variation of a given parameter within or among individuals. This may include the response to a drug or an environmental stimulus, an ordinary or experimentally modified physiological characteristic, or the genetic causes of a particular disease. The data base of such studies (i.e. the 'sample') typically contains replicates of one and the same measurement, taken at different times, under different conditions, in different individuals, or a combination of these. The most important aspect of the measurement is that it varies over replicates (taken, of course, under identical conditions), and that a better understanding of this variation facilitates a better understanding of the original scientific problem.
Universitätsklinikum Schleswig-Holstein ©2012 10
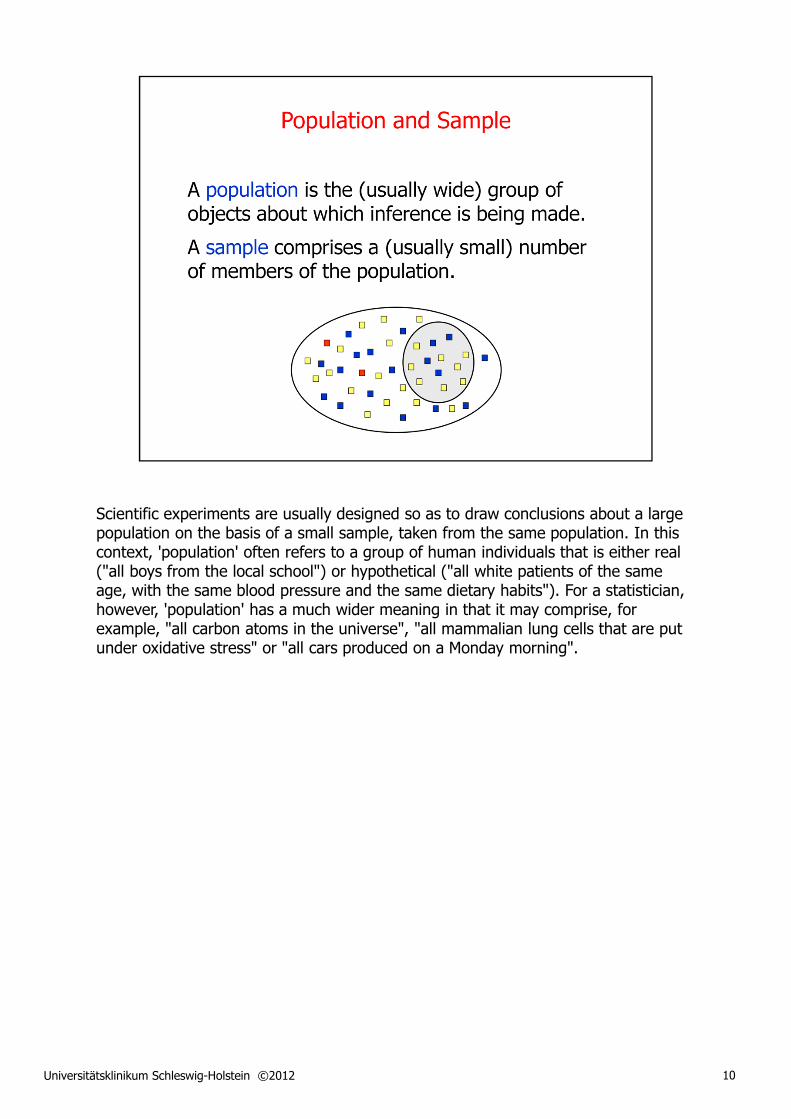
Scientific experiments are usually designed so as to draw conclusions about a large population on the basis of a small sample, taken from the same population. In this context, 'population' often refers to a group of human individuals that is either real ("all boys from the local school") or hypothetical ("all white patients of the same age, with the same blood pressure and the same dietary habits"). For a statistician, however, 'population' has a much wider meaning in that it may comprise, for example, "all carbon atoms in the universe", "all mammalian lung cells that are put under oxidative stress" or "all cars produced on a Monday morning".
Universitätsklinikum Schleswig-Holstein ©2012 11
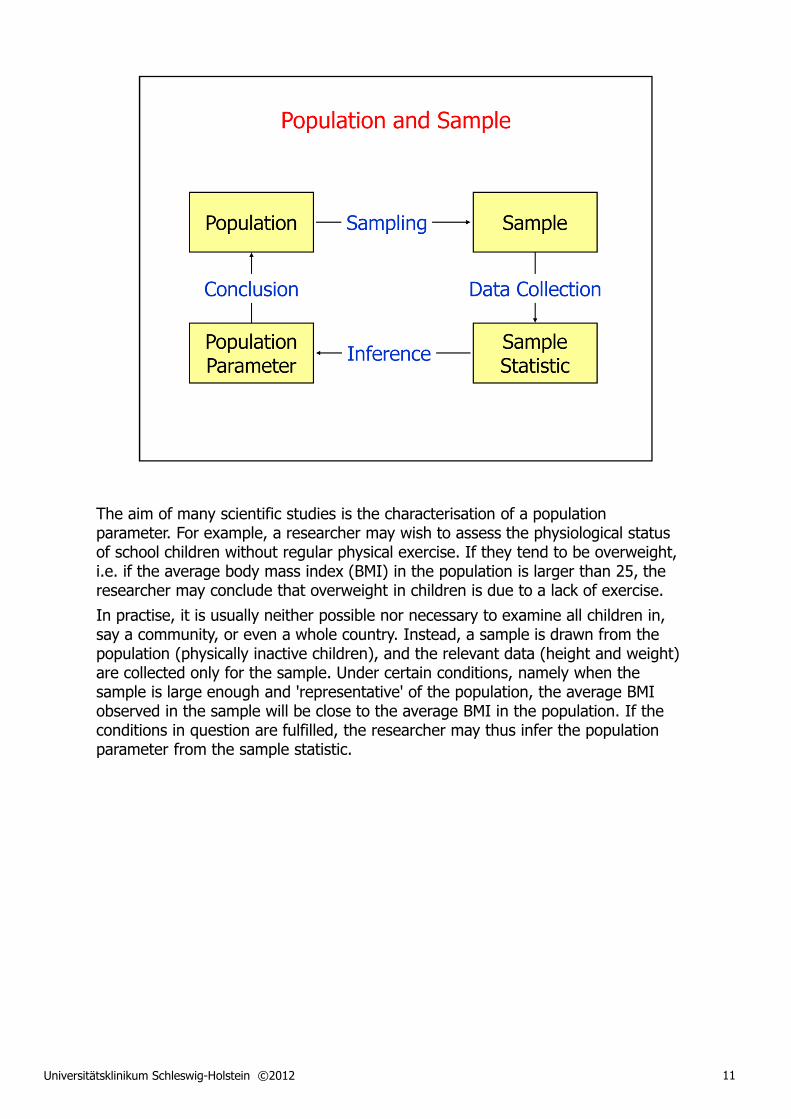
The aim of many scientific studies is the characterisation of a population parameter. For example, a researcher may wish to assess the physiological status of school children without regular physical exercise. If they tend to be overweight, i.e. if the average body mass index (BMI) in the population is larger than 25, the researcher may conclude that overweight in children is due to a lack of exercise.
In practise, it is usually neither possible nor necessary to examine all children in, say a community, or even a whole country. Instead, a sample is drawn from the population (physically inactive children), and the relevant data (height and weight) are collected only for the sample. Under certain conditions, namely when the sample is large enough and 'representative' of the population, the average BMI observed in the sample will be close to the average BMI in the population. If the conditions in question are fulfilled, the researcher may thus infer the population parameter from the sample statistic.

Universitätsklinikum Schleswig-Holstein ©2012 12
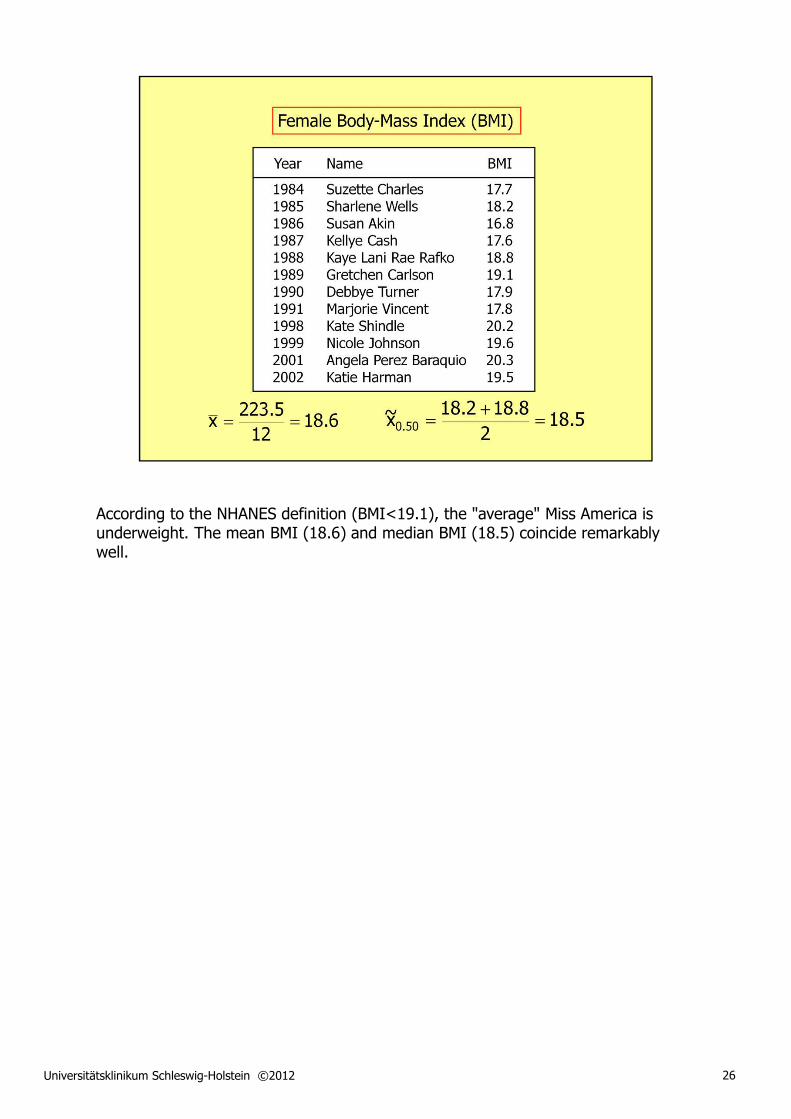
When comparing this list of female BMI to the thresholds for malnutrition and underweight provided by the WHO and the National Health and Nutrition Examination Survey (NHANES), respectively, it becomes clear that this group of women is not representative of the "average" white US American woman aged 20 to 29 years. Being the Miss Americas of the 1980's and 1990's, these females are probably more representative of people's imagination of health and beauty than of real life.
Universitätsklinikum Schleswig-Holstein ©2012 13
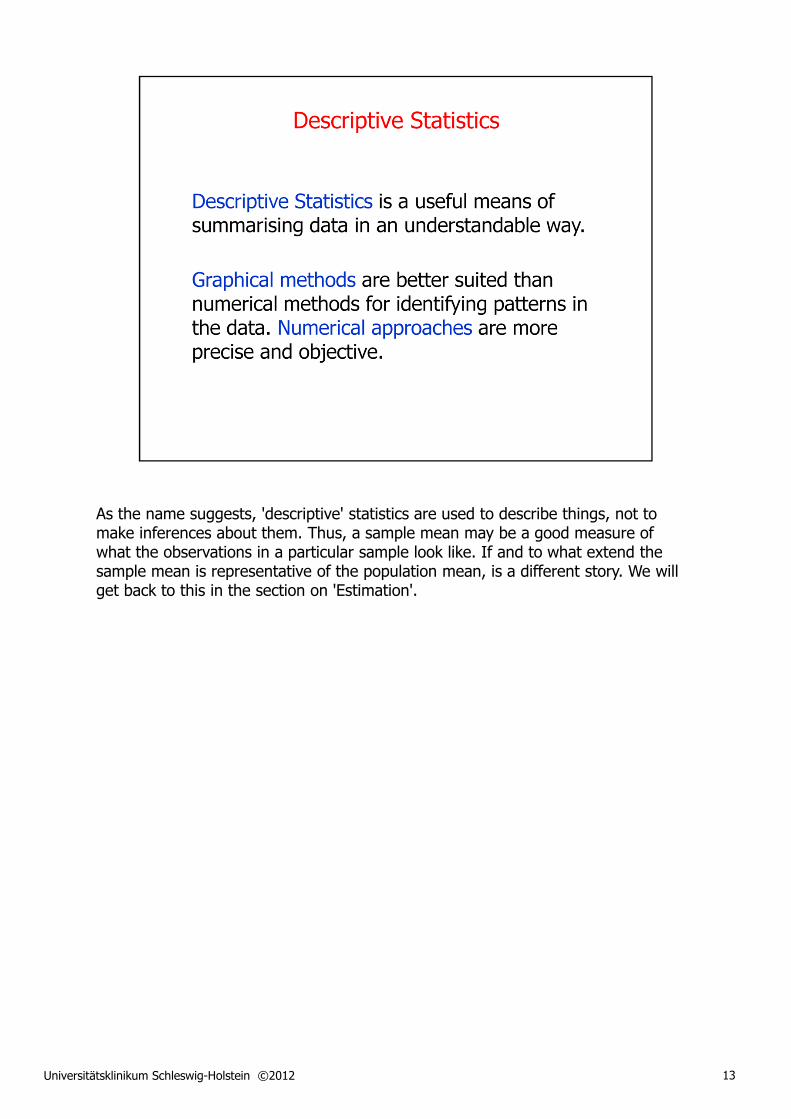
As the name suggests, 'descriptive' statistics are used to describe things, not to make inferences about them. Thus, a sample mean may be a good measure of what the observations in a particular sample look like. If and to what extend the sample mean is representative of the population mean, is a different story. We will get back to this in the section on 'Estimation'.
Universitätsklinikum Schleswig-Holstein ©2012 14
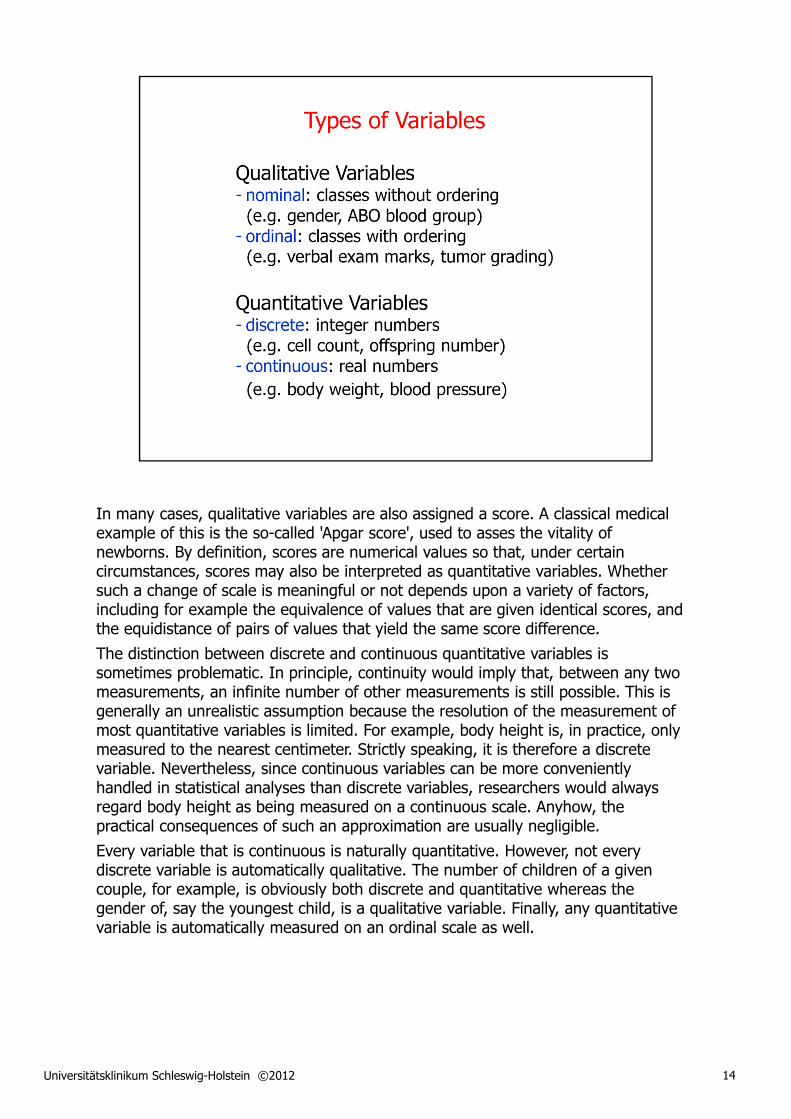
In many cases, qualitative variables are also assigned a score. A classical medical example of this is the so-called 'Apgar score', used to asses the vitality of newborns. By definition, scores are numerical values so that, under certain circumstances, scores may also be interpreted as quantitative variables. Whether such a change of scale is meaningful or not depends upon a variety of factors, including for example the equivalence of values that are given identical scores, and the equidistance of pairs of values that yield the same score difference.
The distinction between discrete and continuous quantitative variables is sometimes problematic. In principle, continuity would imply that, between any two measurements, an infinite number of other measurements is still possible. This is generally an unrealistic assumption because the resolution of the measurement of most quantitative variables is limited. For example, body height is, in practice, only measured to the nearest centimeter. Strictly speaking, it is therefore a discrete variable. Nevertheless, since continuous variables can be more conveniently handled in statistical analyses than discrete variables, researchers would always regard body height as being measured on a continuous scale. Anyhow, the practical consequences of such an approximation are usually negligible.
Every variable that is continuous is naturally quantitative. However, not every discrete variable is automatically qualitative. The number of children of a given couple, for example, is obviously both discrete and quantitative whereas the gender of, say the youngest child, is a qualitative variable. Finally, any quantitative variable is automatically measured on an ordinal scale as well.
Universitätsklinikum Schleswig-Holstein ©2012 15
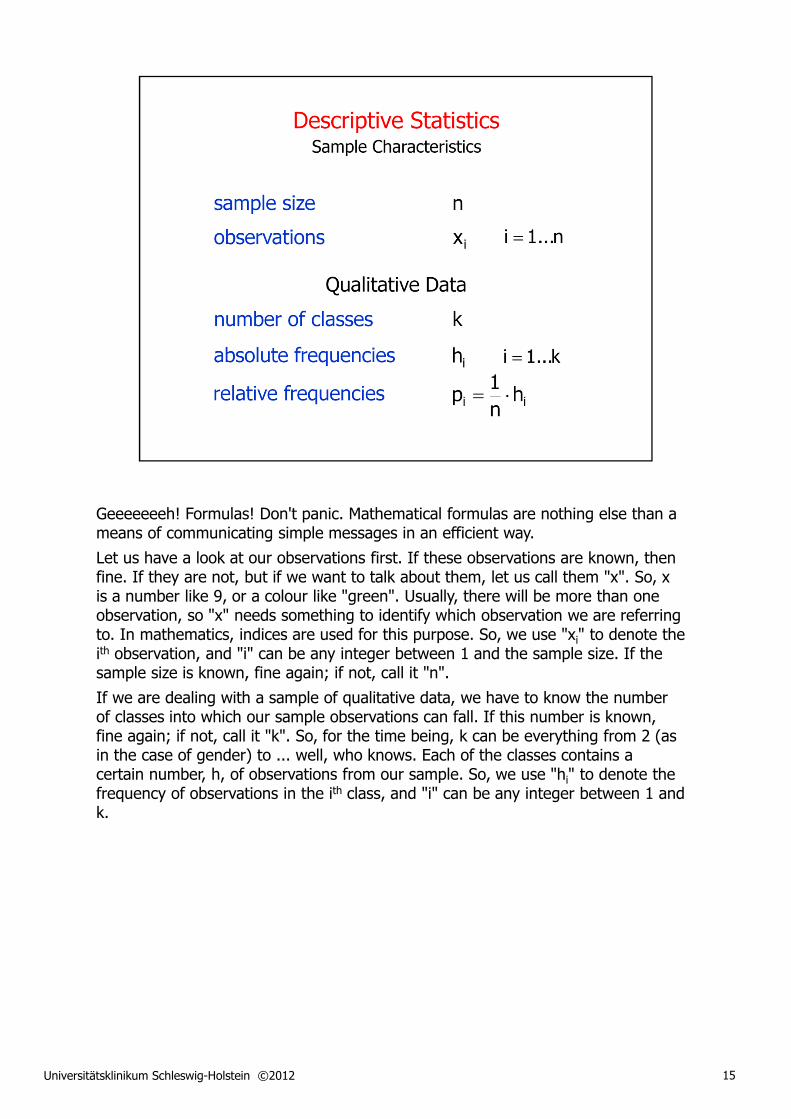
Geeeeeeeh! Formulas! Don't panic. Mathematical formulas are nothing else than a means of communicating simple messages in an efficient way.
Let us have a look at our observations first. If these observations are known, then fine. If they are not, but if we want to talk about them, let us call them "x". So, x is a number like 9, or a colour like "green". Usually, there will be more than one observation, so "x" needs something to identify which observation we are referring to. In mathematics, indices are used for this purpose. So, we use "xi" to denote the ith observation, and "i" can be any integer between 1 and the sample size. If the sample size is known, fine again; if not, call it "n".
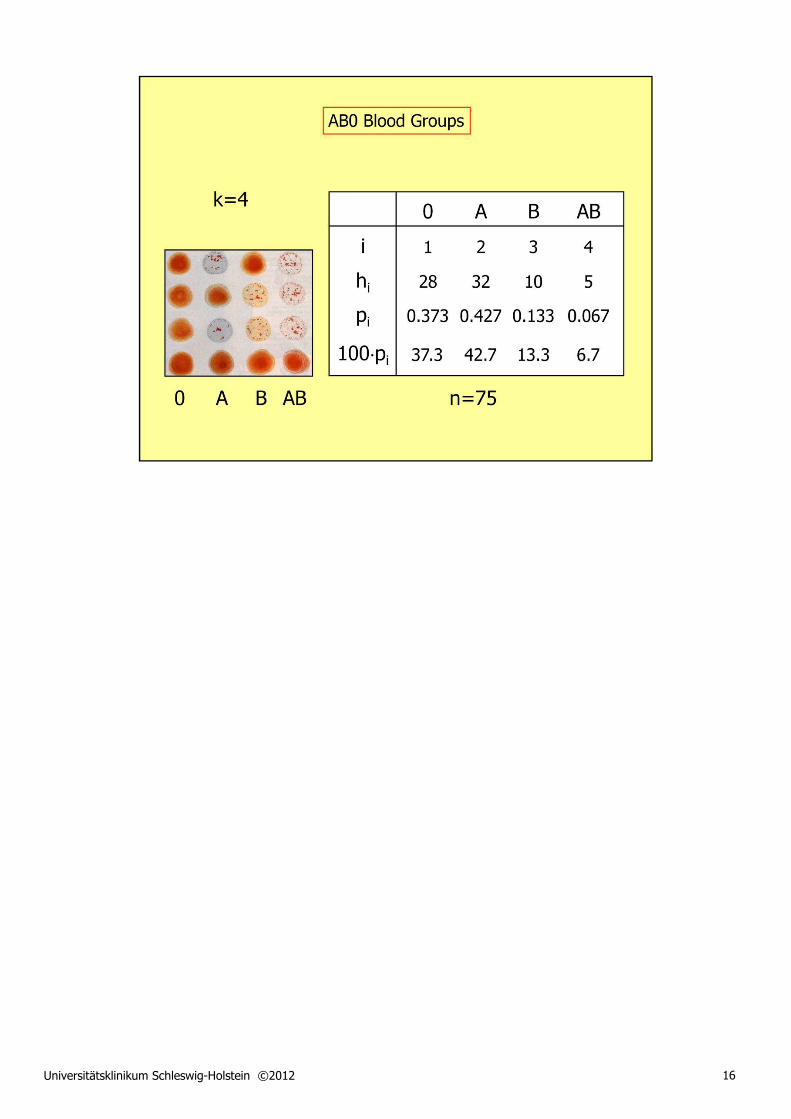
If we are dealing with a sample of qualitative data, we have to know the number of classes into which our sample observations can fall. If this number is known, fine again; if not, call it "k". So, for the time being, k can be everything from 2 (as in the case of gender) to ... well, who knows. Each of the classes contains a certain number, h, of observations from our sample. So, we use "hi" to denote the frequency of observations in the ith class, and "i" can be any integer between 1 and k.
Universitätsklinikum Schleswig-Holstein ©2012 16
Universitätsklinikum Schleswig-Holstein ©2012 17
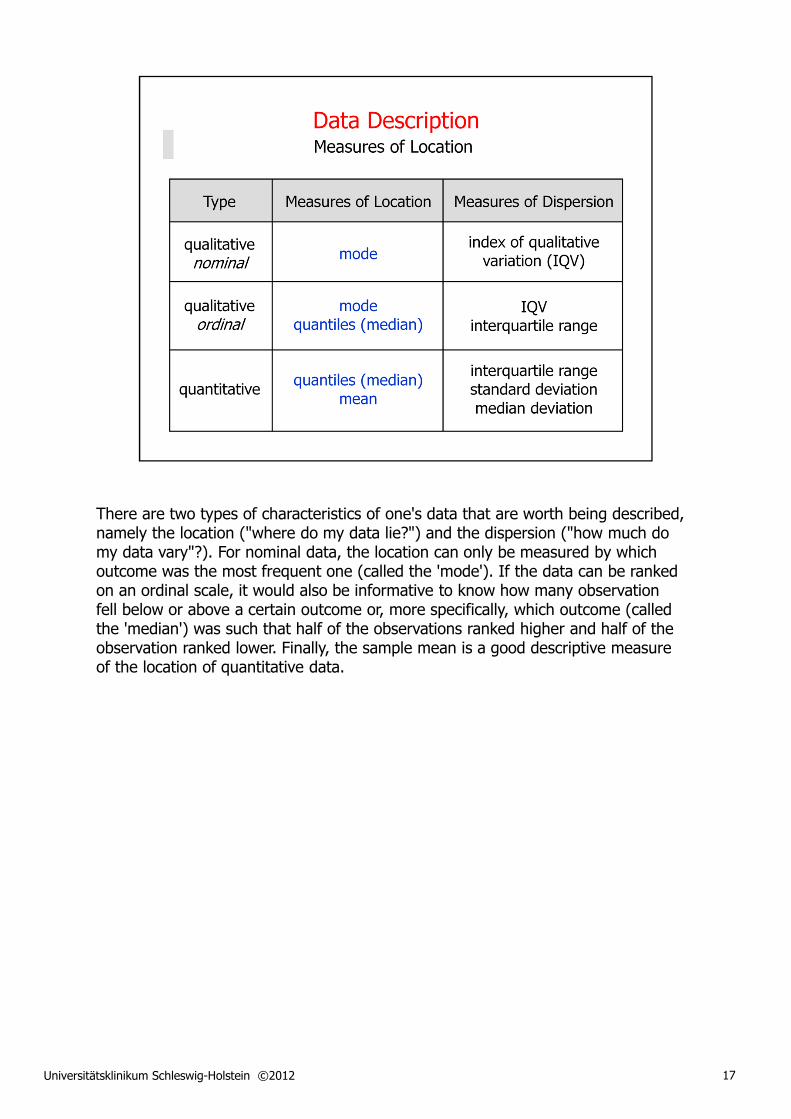
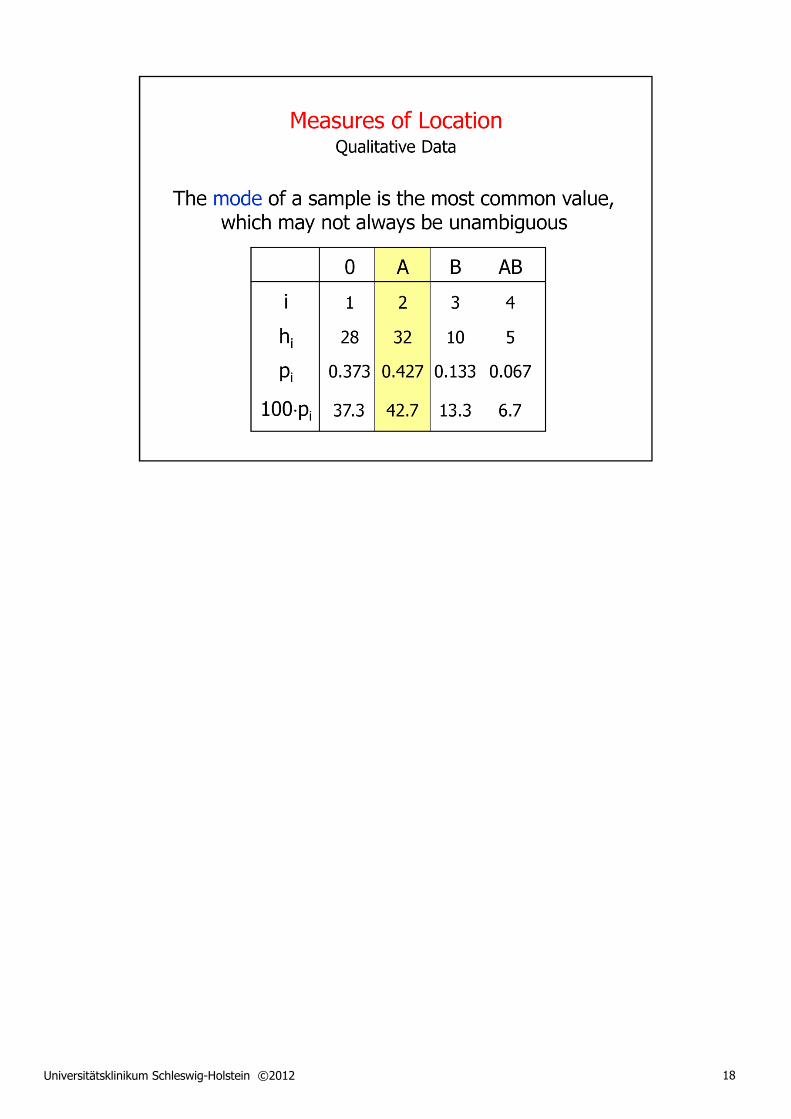
There are two types of characteristics of one's data that are worth being described, namely the location ("where do my data lie?") and the dispersion ("how much do my data vary"?). For nominal data, the location can only be measured by which outcome was the most frequent one (called the 'mode'). If the data can be ranked on an ordinal scale, it would also be informative to know how many observation fell below or above a certain outcome or, more specifically, which outcome (called the 'median') was such that half of the observations ranked higher and half of the observation ranked lower. Finally, the sample mean is a good descriptive measure of the location of quantitative data.
Universitätsklinikum Schleswig-Holstein ©2012 18
Universitätsklinikum Schleswig-Holstein ©2012 19
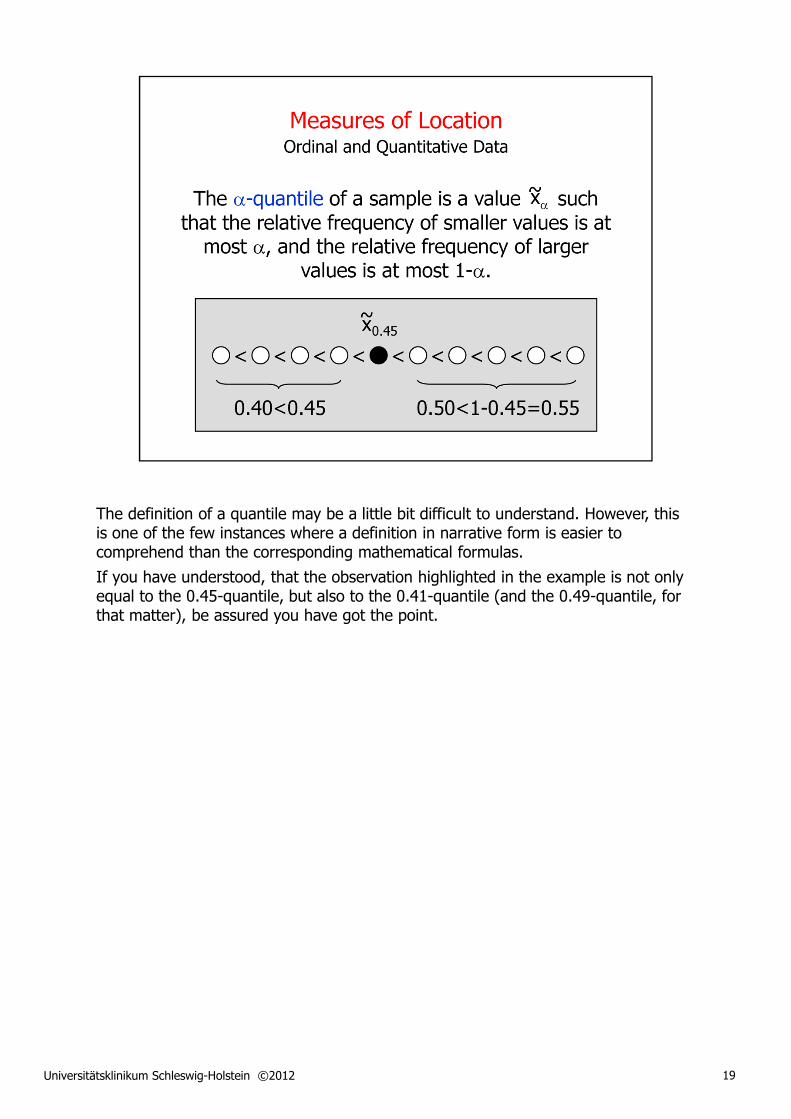
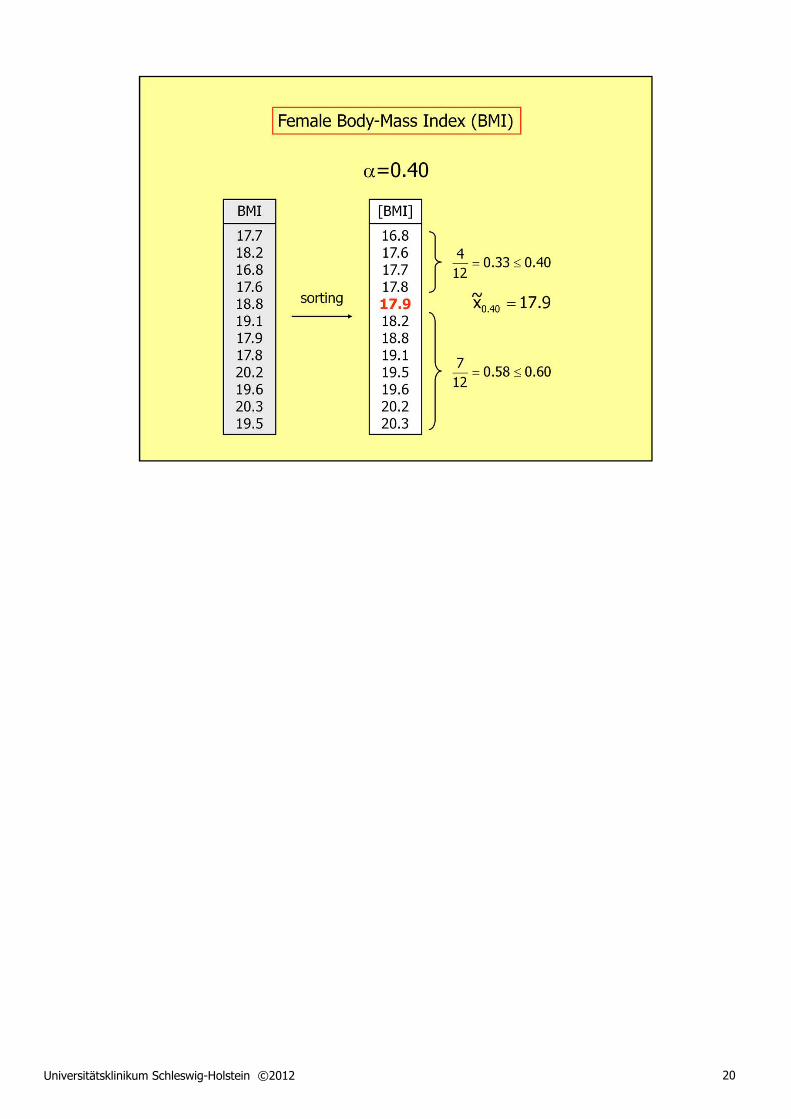
The definition of a quantile may be a little bit difficult to understand. However, this is one of the few instances where a definition in narrative form is easier to comprehend than the corresponding mathematical formulas.
If you have understood, that the observation highlighted in the example is not only equal to the 0.45-quantile, but also to the 0.41-quantile (and the 0.49-quantile, for that matter), be assured you have got the point.
Universitätsklinikum Schleswig-Holstein ©2012 20
Universitätsklinikum Schleswig-Holstein ©2012 21
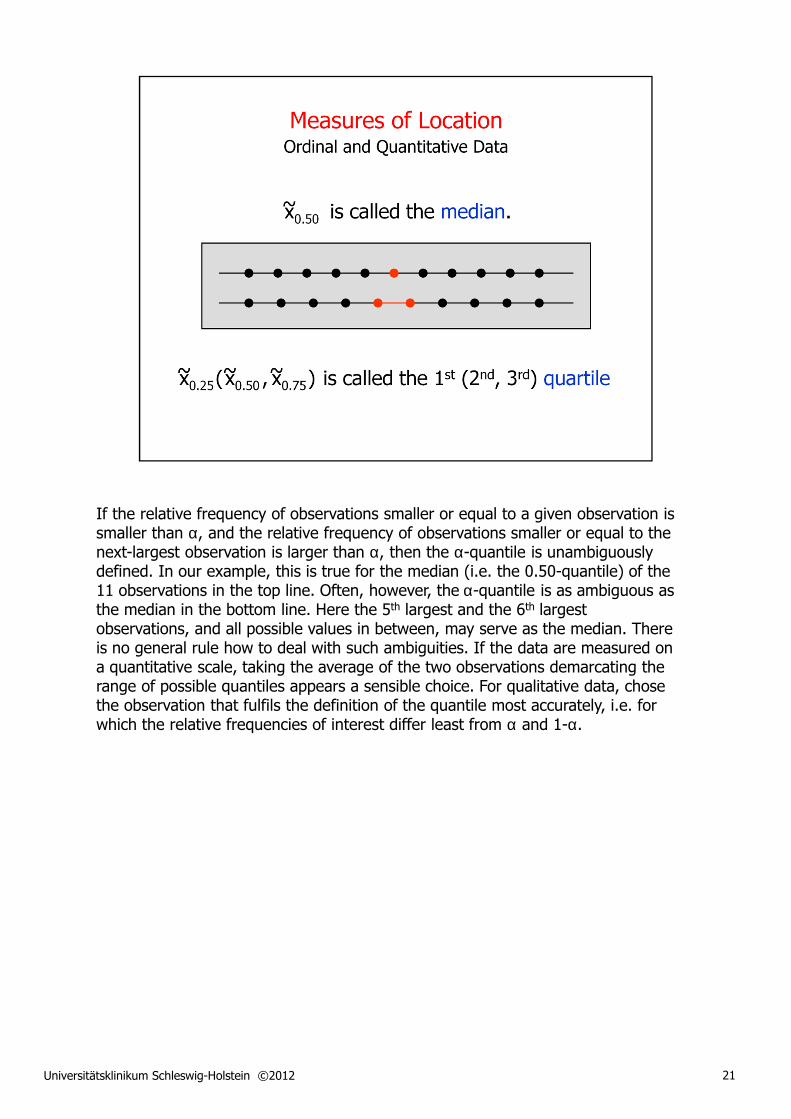
If the relative frequency of observations smaller or equal to a given observation is smaller than α, and the relative frequency of observations smaller or equal to the next-largest observation is larger than α, then the α-quantile is unambiguously defined. In our example, this is true for the median (i.e. the 0.50-quantile) of the 11 observations in the top line. Often, however, the α-quantile is as ambiguous as the median in the bottom line. Here the 5th largest and the 6th largest observations, and all possible values in between, may serve as the median. There is no general rule how to deal with such ambiguities. If the data are measured on a quantitative scale, taking the average of the two observations demarcating the range of possible quantiles appears a sensible choice. For qualitative data, chose the observation that fulfils the definition of the quantile most accurately, i.e. for which the relative frequencies of interest differ least from α and 1-α.

Universitätsklinikum Schleswig-Holstein ©2012 22
The Apgar score helps practitioners decide whether a baby needs immediate medical help. If the baby scores between 7 and 10, it usually means it is in good shape and does not need more than routine post-delivery care. If the baby scores between 4 and 6, it may need some help breathing. This could mean suctioning its nostrils or massaging it, or it could mean giving the baby oxygen. If the baby scores 3 or less, it may need immediate lifesaving measures, such as resuscitation. A low score at one minute does not however mean that the baby would not eventually be fine. Sometimes babies born prematurely or delivered by Caesarean section, for example, have lower-than-normal scores, especially at the one-minute testing. The five-minute Apgar score helps practitioners see how a baby is progressing and whether it has responded to any initial medical intervention.
Universitätsklinikum Schleswig-Holstein ©2012 23
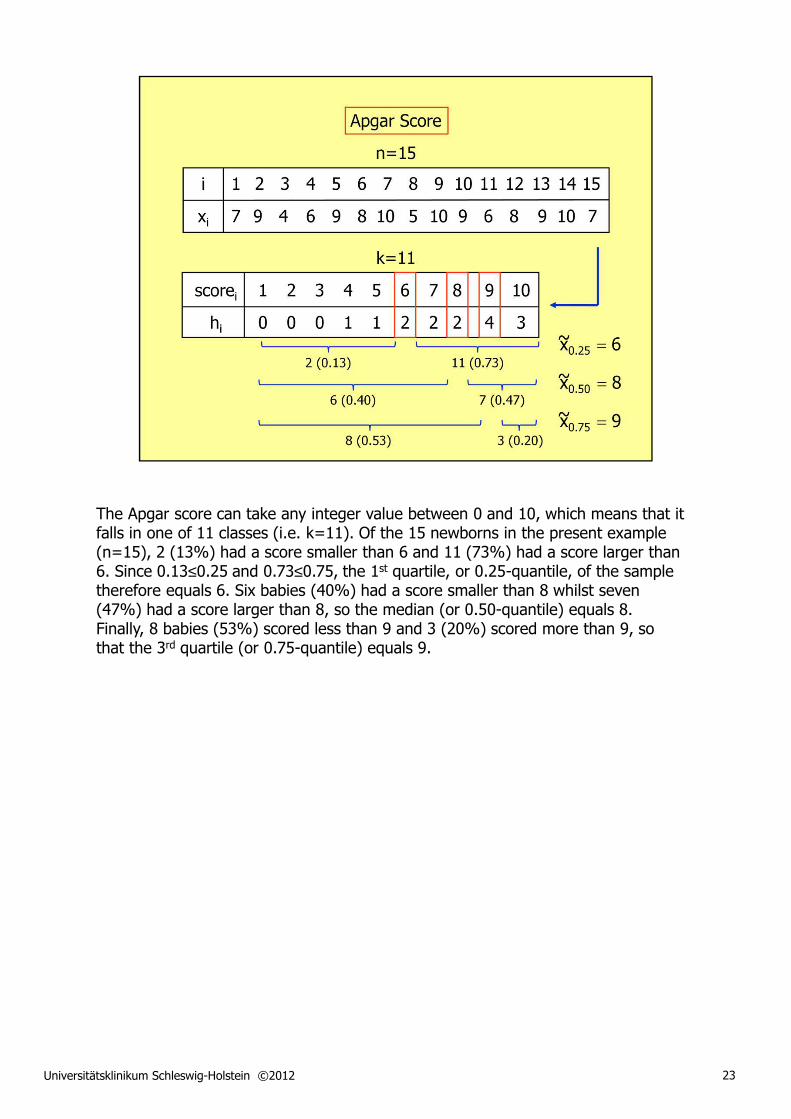
The Apgar score can take any integer value between 0 and 10, which means that it falls in one of 11 classes (i.e. k=11). Of the 15 newborns in the present example (n=15), 2 (13%) had a score smaller than 6 and 11 (73%) had a score larger than 6. Since 0.13≤0.25 and 0.73≤0.75, the 1st quartile, or 0.25-quantile, of the sample therefore equals 6. Six babies (40%) had a score smaller than 8 whilst seven (47%) had a score larger than 8, so the median (or 0.50-quantile) equals 8. Finally, 8 babies (53%) scored less than 9 and 3 (20%) scored more than 9, so that the 3rd quartile (or 0.75-quantile) equals 9.
Universitätsklinikum Schleswig-Holstein ©2012 24
Universitätsklinikum Schleswig-Holstein ©2012 25
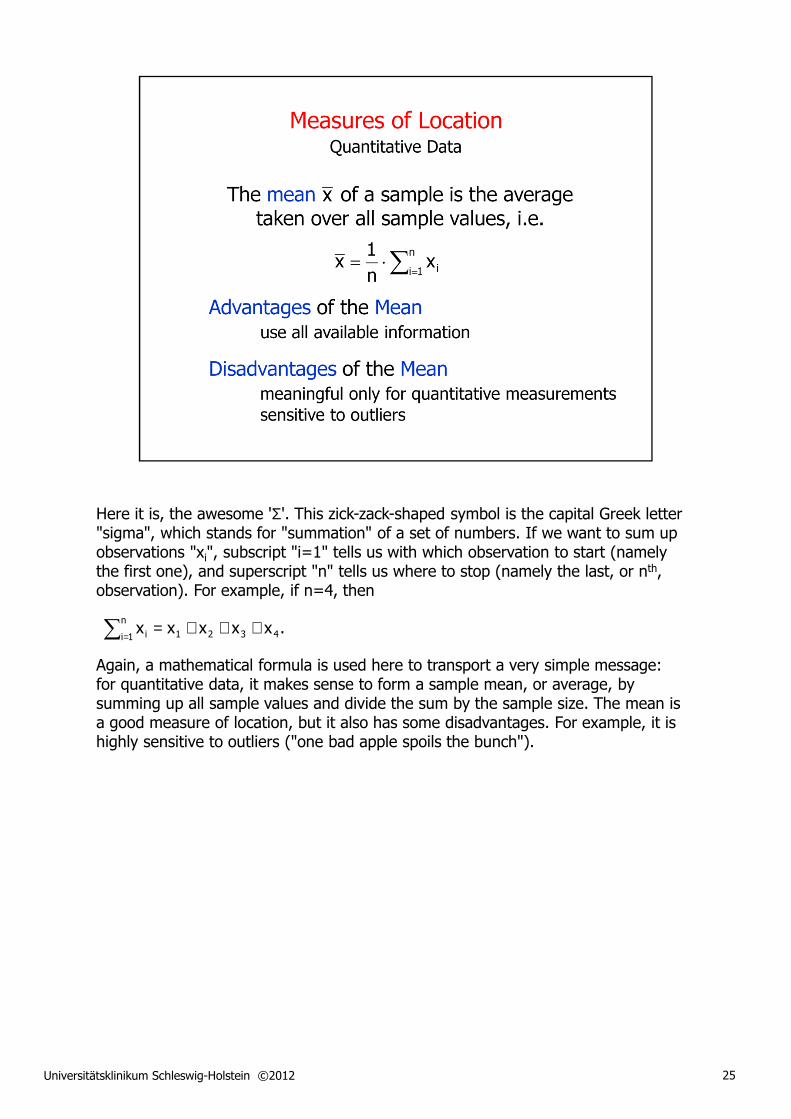
Here it is, the awesome 'Σ'. This zick-zack-shaped symbol is the capital Greek letter "sigma", which stands for "summation" of a set of numbers. If we want to sum up observations "xi", subscript "i=1" tells us with which observation to start (namely the first one), and superscript "n" tells us where to stop (namely the last, or nth, observation). For example, if n=4, then
Again, a mathematical formula is used here to transport a very simple message: for quantitative data, it makes sense to form a sample mean, or average, by summing up all sample values and divide the sum by the sample size. The mean is a good measure of location, but it also has some disadvantages. For example, it is highly sensitive to outliers ("one bad apple spoils the bunch").
.xxxxxn
1i 4321i∑ =+++=
Universitätsklinikum Schleswig-Holstein ©2012 26
According to the NHANES definition (BMI<19.1), the "average" Miss America is underweight. The mean BMI (18.6) and median BMI (18.5) coincide remarkably well.

Universitätsklinikum Schleswig-Holstein ©2012 27
The (admittedly unrealistic) inclusion of a single 17th century beauty queen would turn the average Miss America from an underweight scarecrow into a proper girl. The mean BMI has increased by approximately two points to 20.5 whereas the median BMI remained relatively unchanged at 18.8.

Universitätsklinikum Schleswig-Holstein ©2012 28
Universitätsklinikum Schleswig-Holstein ©2012 29
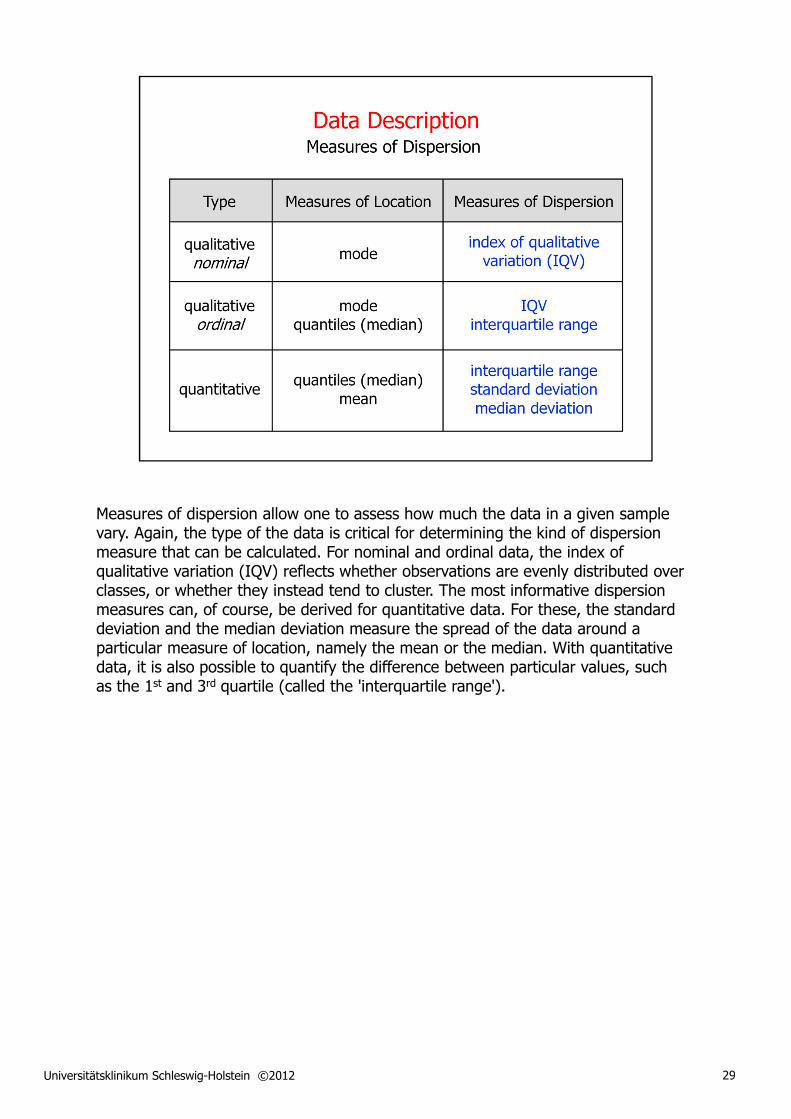
Measures of dispersion allow one to assess how much the data in a given sample vary. Again, the type of the data is critical for determining the kind of dispersion measure that can be calculated. For nominal and ordinal data, the index of qualitative variation (IQV) reflects whether observations are evenly distributed over classes, or whether they instead tend to cluster. The most informative dispersion measures can, of course, be derived for quantitative data. For these, the standard deviation and the median deviation measure the spread of the data around a particular measure of location, namely the mean or the median. With quantitative data, it is also possible to quantify the difference between particular values, such as the 1st and 3rd quartile (called the 'interquartile range').
Universitätsklinikum Schleswig-Holstein ©2012 30
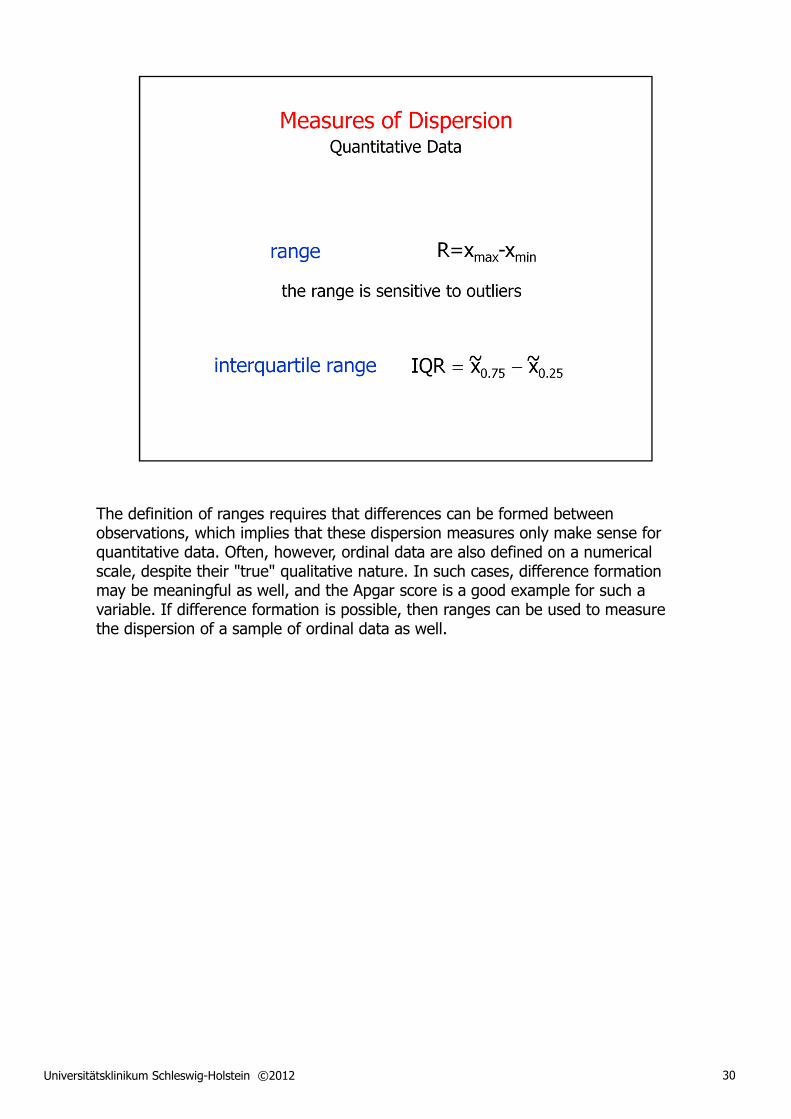
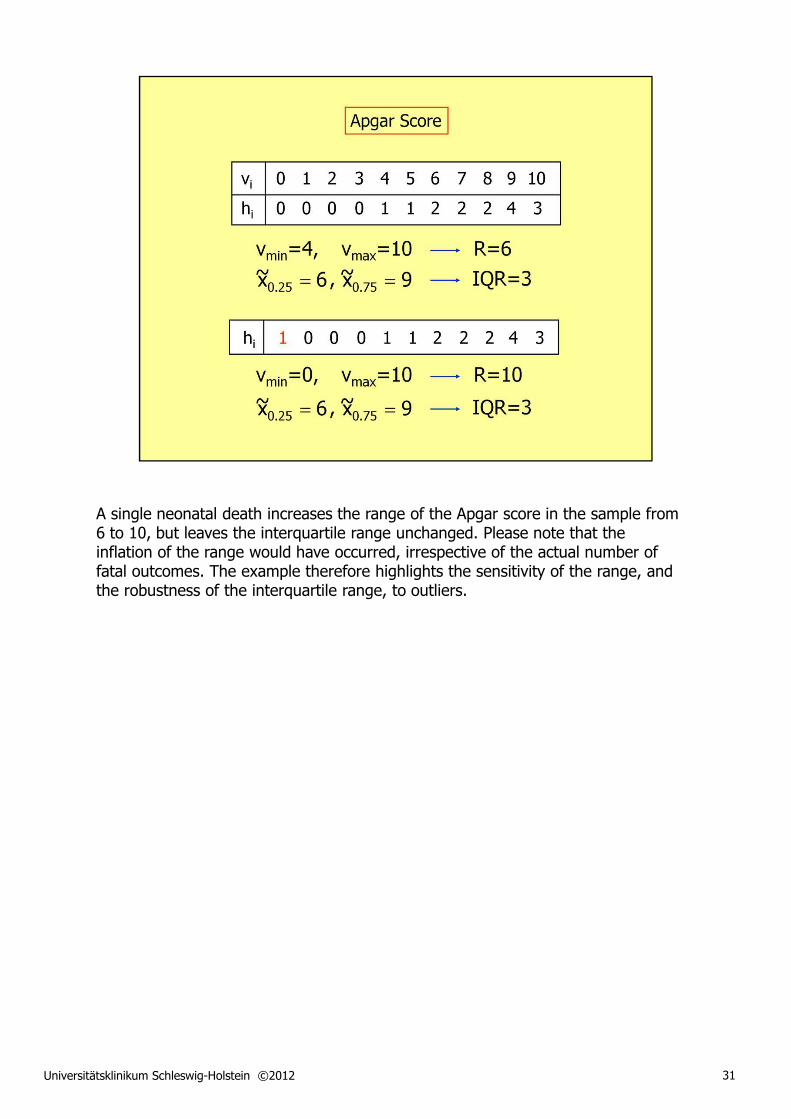
The definition of ranges requires that differences can be formed between observations, which implies that these dispersion measures only make sense for quantitative data. Often, however, ordinal data are also defined on a numerical scale, despite their "true" qualitative nature. In such cases, difference formation may be meaningful as well, and the Apgar score is a good example for such a variable. If difference formation is possible, then ranges can be used to measure the dispersion of a sample of ordinal data as well.
Universitätsklinikum Schleswig-Holstein ©2012 31
A single neonatal death increases the range of the Apgar score in the sample from 6 to 10, but leaves the interquartile range unchanged. Please note that the inflation of the range would have occurred, irrespective of the actual number of fatal outcomes. The example therefore highlights the sensitivity of the range, and the robustness of the interquartile range, to outliers.
Universitätsklinikum Schleswig-Holstein ©2012 32
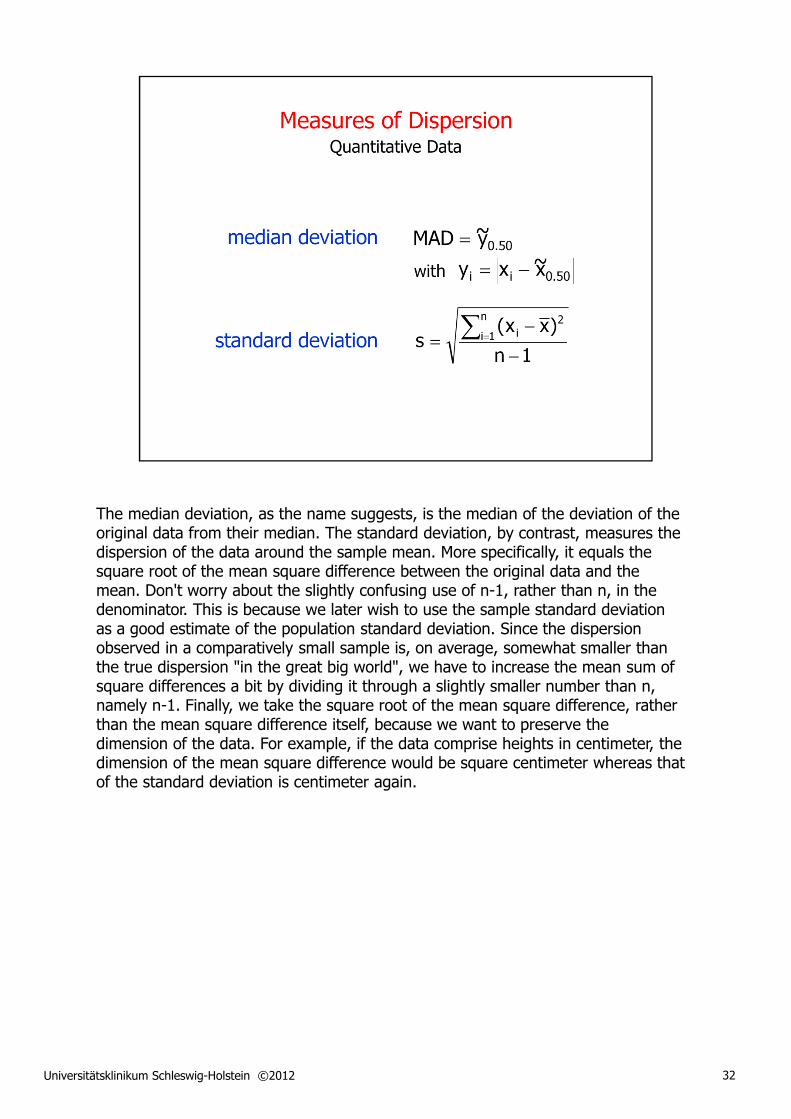
The median deviation, as the name suggests, is the median of the deviation of the original data from their median. The standard deviation, by contrast, measures the dispersion of the data around the sample mean. More specifically, it equals the square root of the mean square difference between the original data and the mean. Don't worry about the slightly confusing use of n-1, rather than n, in the denominator. This is because we later wish to use the sample standard deviation as a good estimate of the population standard deviation. Since the dispersion observed in a comparatively small sample is, on average, somewhat smaller than the true dispersion "in the great big world", we have to increase the mean sum of square differences a bit by dividing it through a slightly smaller number than n, namely n-1. Finally, we take the square root of the mean square difference, rather than the mean square difference itself, because we want to preserve the dimension of the data. For example, if the data comprise heights in centimeter, the dimension of the mean square difference would be square centimeter whereas that of the standard deviation is centimeter again.
Universitätsklinikum Schleswig-Holstein ©2012 33
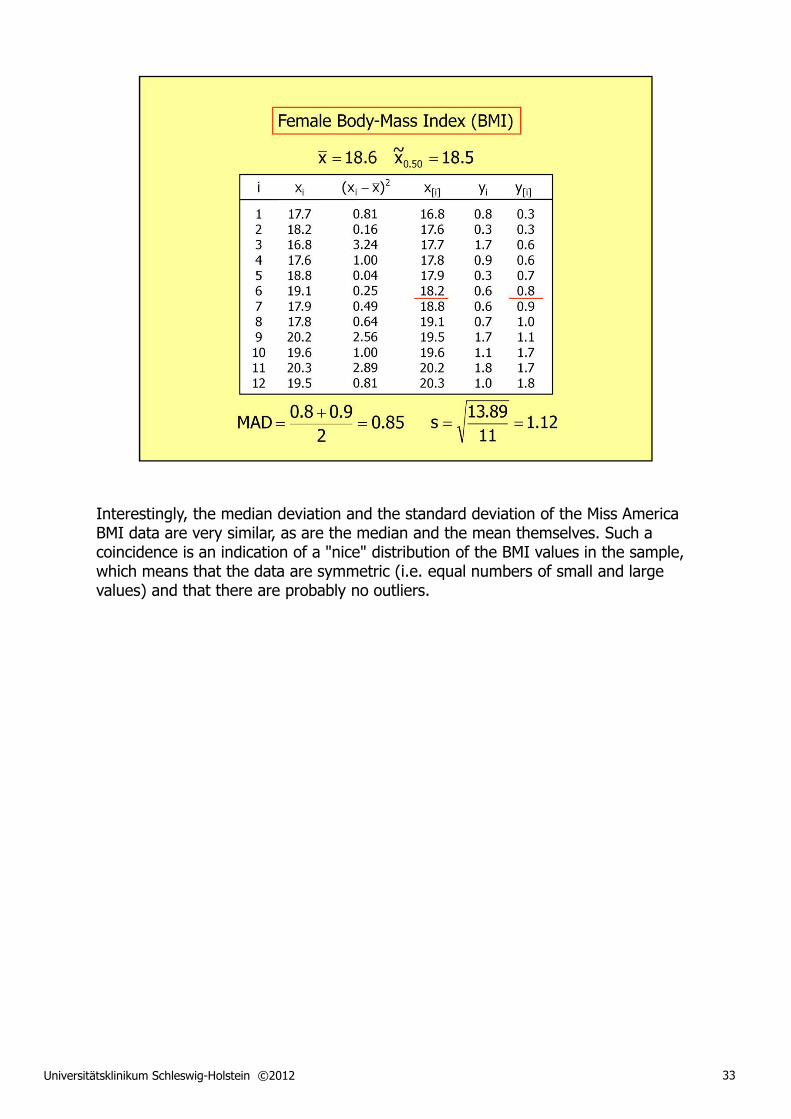
Interestingly, the median deviation and the standard deviation of the Miss America BMI data are very similar, as are the median and the mean themselves. Such a coincidence is an indication of a "nice" distribution of the BMI values in the sample, which means that the data are symmetric (i.e. equal numbers of small and large values) and that there are probably no outliers.
Universitätsklinikum Schleswig-Holstein ©2012 34
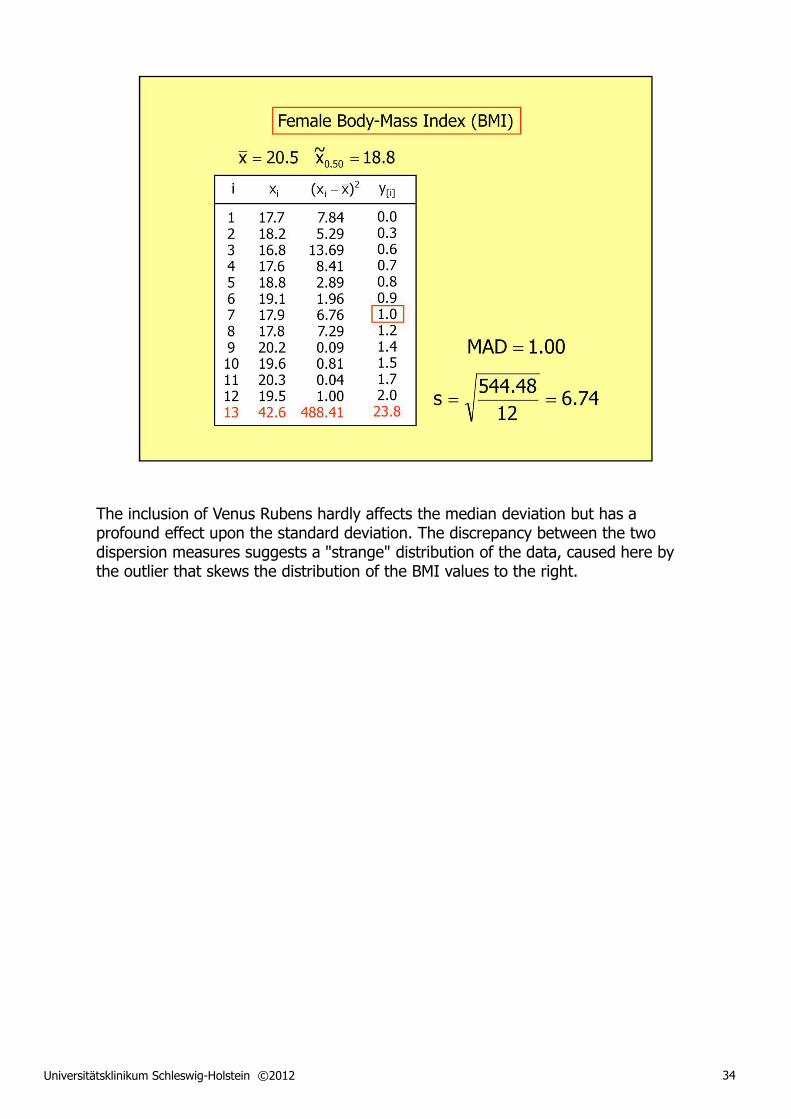
The inclusion of Venus Rubens hardly affects the median deviation but has a profound effect upon the standard deviation. The discrepancy between the two dispersion measures suggests a "strange" distribution of the data, caused here by the outlier that skews the distribution of the BMI values to the right.
Universitätsklinikum Schleswig-Holstein ©2012 35
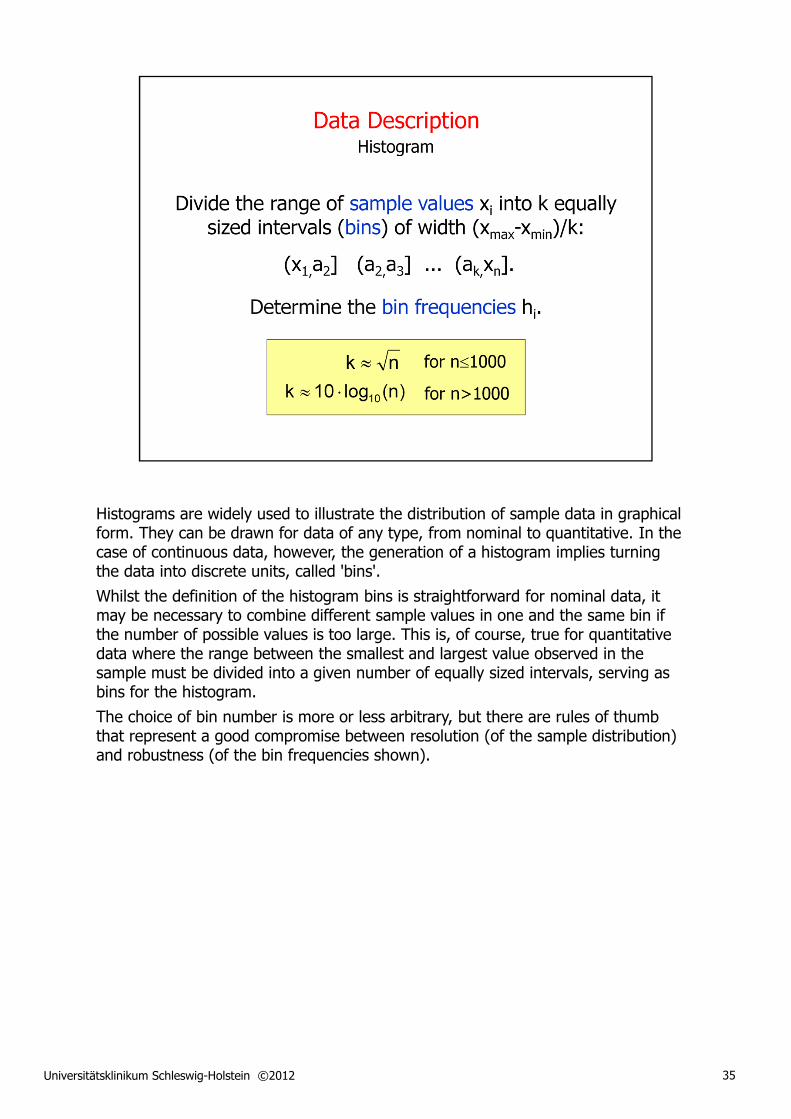
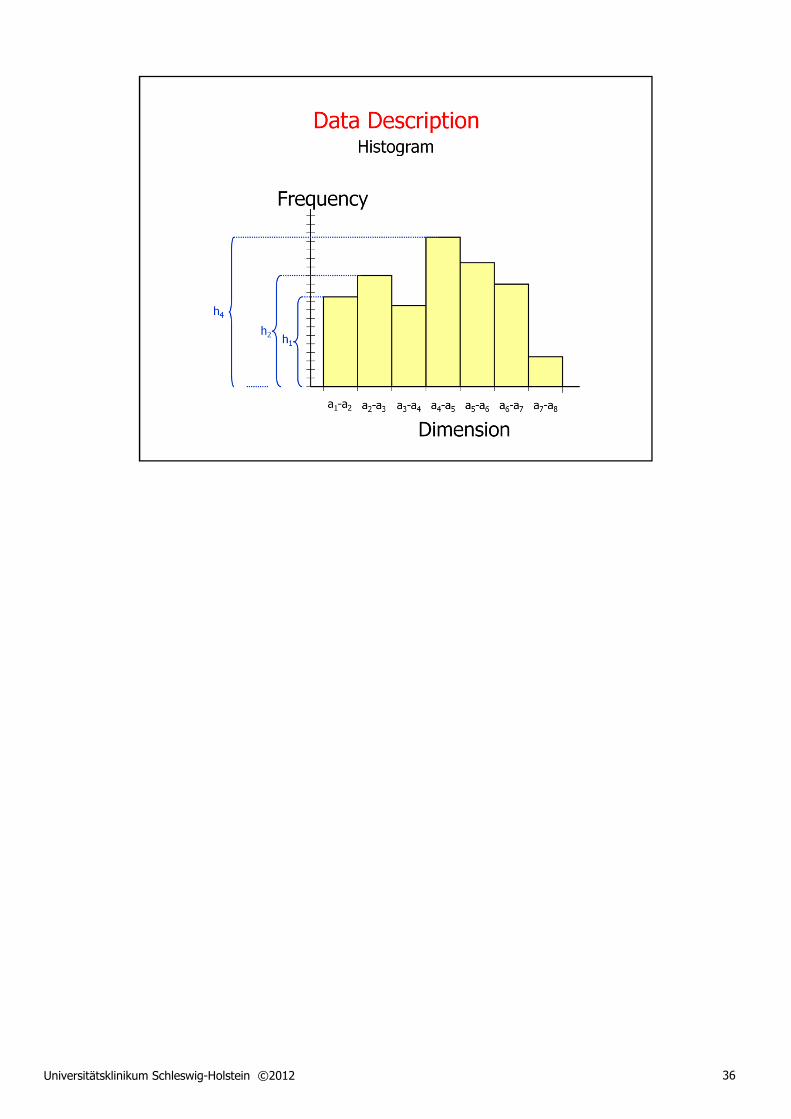
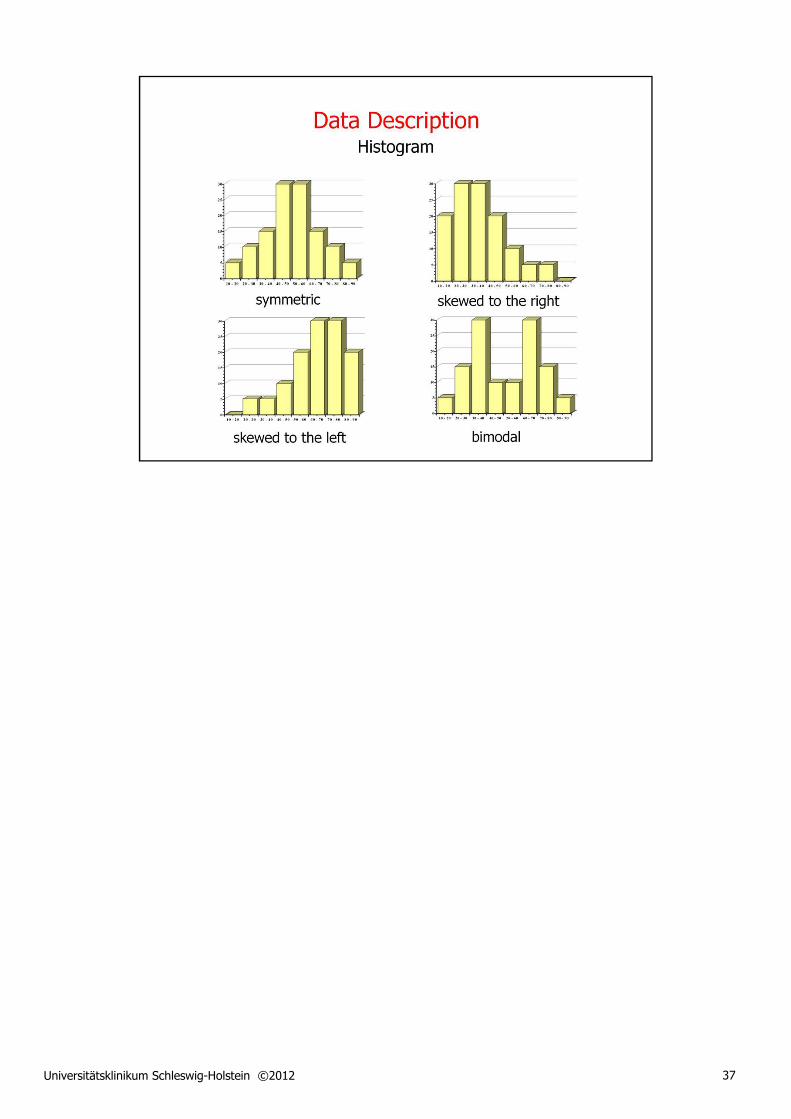
Histograms are widely used to illustrate the distribution of sample data in graphical form. They can be drawn for data of any type, from nominal to quantitative. In the case of continuous data, however, the generation of a histogram implies turning the data into discrete units, called 'bins'.
Whilst the definition of the histogram bins is straightforward for nominal data, it may be necessary to combine different sample values in one and the same bin if the number of possible values is too large. This is, of course, true for quantitative data where the range between the smallest and largest value observed in the sample must be divided into a given number of equally sized intervals, serving as bins for the histogram.
The choice of bin number is more or less arbitrary, but there are rules of thumb that represent a good compromise between resolution (of the sample distribution) and robustness (of the bin frequencies shown).
Universitätsklinikum Schleswig-Holstein ©2012 36
Universitätsklinikum Schleswig-Holstein ©2012 37
Universitätsklinikum Schleswig-Holstein ©2012 38
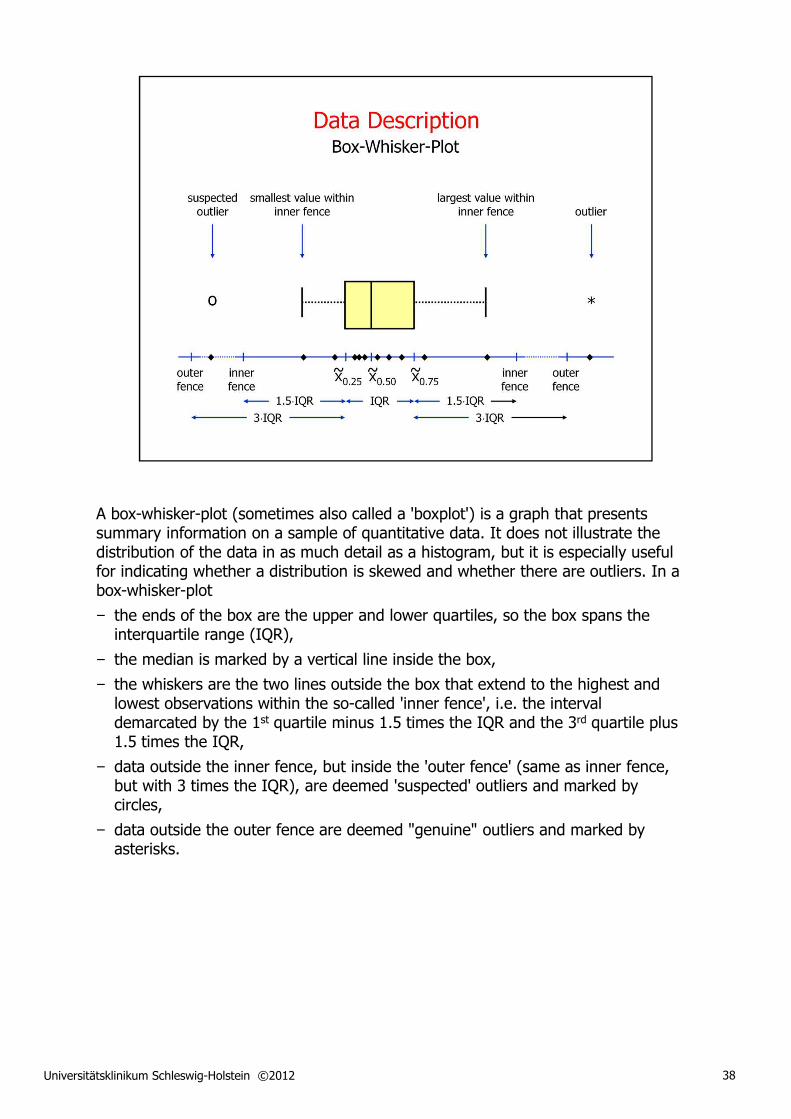
A box-whisker-plot (sometimes also called a 'boxplot') is a graph that presents summary information on a sample of quantitative data. It does not illustrate the distribution of the data in as much detail as a histogram, but it is especially useful for indicating whether a distribution is skewed and whether there are outliers. In a box-whisker-plot
− the ends of the box are the upper and lower quartiles, so the box spans the interquartile range (IQR),
− the median is marked by a vertical line inside the box,
− the whiskers are the two lines outside the box that extend to the highest and lowest observations within the so-called 'inner fence', i.e. the interval demarcated by the 1st quartile minus 1.5 times the IQR and the 3rd quartile plus 1.5 times the IQR,
− data outside the inner fence, but inside the 'outer fence' (same as inner fence, but with 3 times the IQR), are deemed 'suspected' outliers and marked by circles,
− data outside the outer fence are deemed "genuine" outliers and marked by asterisks.
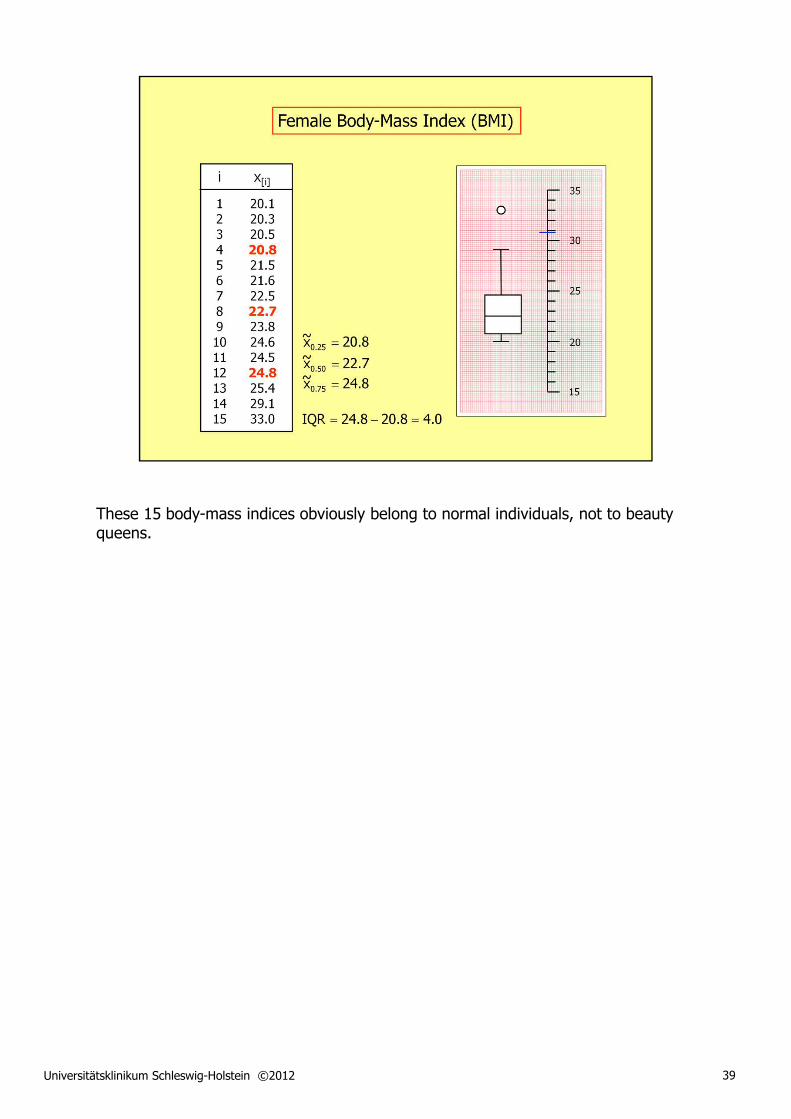
Universitätsklinikum Schleswig-Holstein ©2012 39
These 15 body-mass indices obviously belong to normal individuals, not to beauty queens.
Universitätsklinikum Schleswig-Holstein ©2012 40
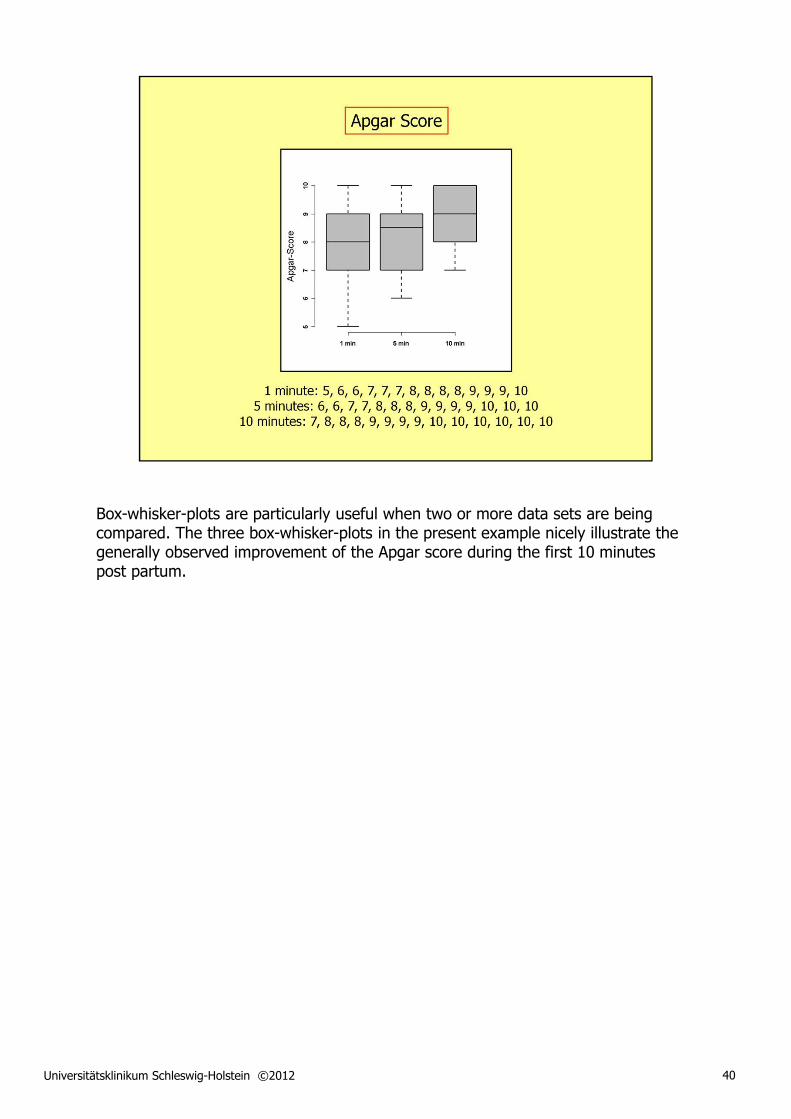
Box-whisker-plots are particularly useful when two or more data sets are being compared. The three box-whisker-plots in the present example nicely illustrate the generally observed improvement of the Apgar score during the first 10 minutes post partum.
Universitätsklinikum Schleswig-Holstein ©2012 41
Universitätsklinikum Schleswig-Holstein ©2012 42
Universitätsklinikum Schleswig-Holstein ©2012 43
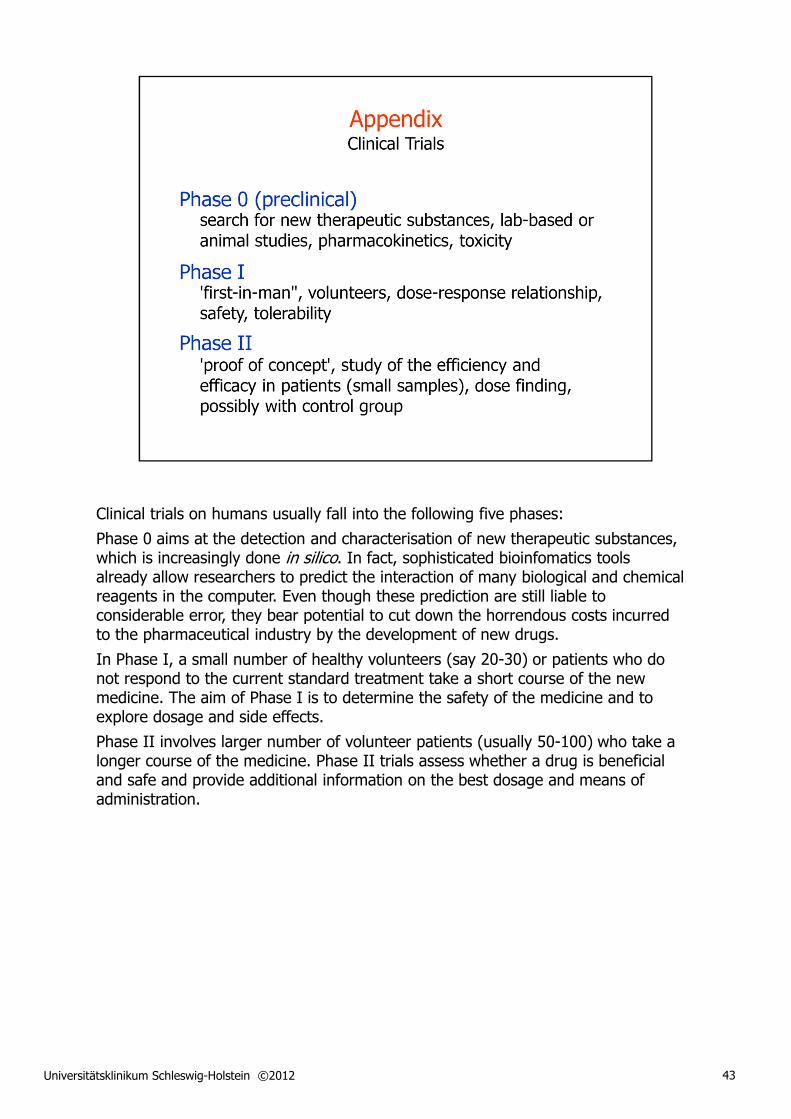
Clinical trials on humans usually fall into the following five phases:
Phase 0 aims at the detection and characterisation of new therapeutic substances, which is increasingly done in silico. In fact, sophisticated bioinfomatics tools already allow researchers to predict the interaction of many biological and chemical reagents in the computer. Even though these prediction are still liable to considerable error, they bear potential to cut down the horrendous costs incurred to the pharmaceutical industry by the development of new drugs.
In Phase I, a small number of healthy volunteers (say 20-30) or patients who do not respond to the current standard treatment take a short course of the new medicine. The aim of Phase I is to determine the safety of the medicine and to explore dosage and side effects.
Phase II involves larger number of volunteer patients (usually 50-100) who take a longer course of the medicine. Phase II trials assess whether a drug is beneficial and safe and provide additional information on the best dosage and means of administration.
Universitätsklinikum Schleswig-Holstein ©2012 44
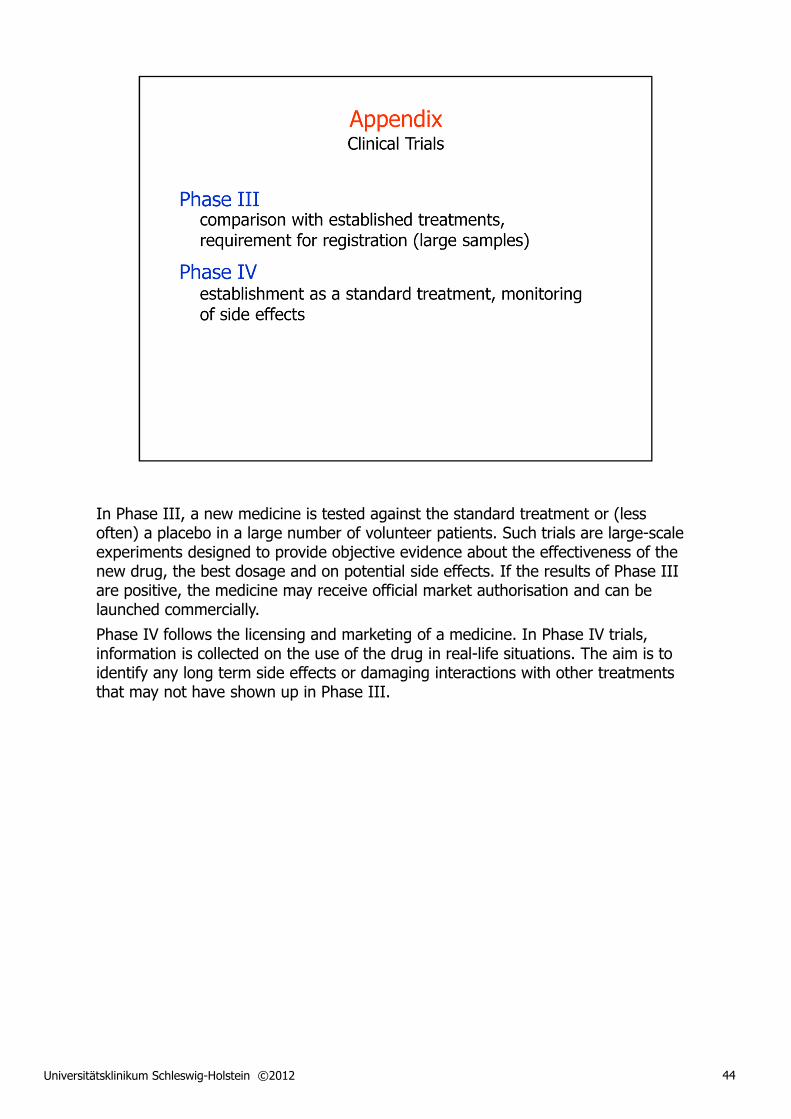
In Phase III, a new medicine is tested against the standard treatment or (less often) a placebo in a large number of volunteer patients. Such trials are large-scale experiments designed to provide objective evidence about the effectiveness of the new drug, the best dosage and on potential side effects. If the results of Phase III are positive, the medicine may receive official market authorisation and can be launched commercially.
Phase IV follows the licensing and marketing of a medicine. In Phase IV trials, information is collected on the use of the drug in real-life situations. The aim is to identify any long term side effects or damaging interactions with other treatments that may not have shown up in Phase III.

Universitätsklinikum Schleswig-Holstein ©2012 45
Good clinical practice (GCP) is an international ethical and scientific quality standard for designing, conducting, recording, and reporting trials that involve the participation of human subjects. Compliance with this standard provides public assurance that the rights, safety and well-being of trial subjects are protected and that the clinical trial data are credible.
The International Conference on Harmonisation of Technical Requirements for Registration of Pharmaceuticals for Human Use (ICH) brings together experts from the pharmaceutical industry and regulatory authorities of Europe, Japan and the United States to discuss scientific and technical aspects of product registration. The purpose of ICH is to harmonise the technical guidelines and requirements for product registration so as to reduce or obviate the need to duplicate tests of new medicines.
The ICH published GCP guidelines for international use in January 1997. Based originally on the Declaration of Helsinki, these guidelines provide a more detailed and specific framework for the ethical conduct of clinical research. Clinical trials included in any marketing authorisation application in the EU are required to be conducted in accordance with the ICH-GCP guidelines.
Universitätsklinikum Schleswig-Holstein ©2012 46
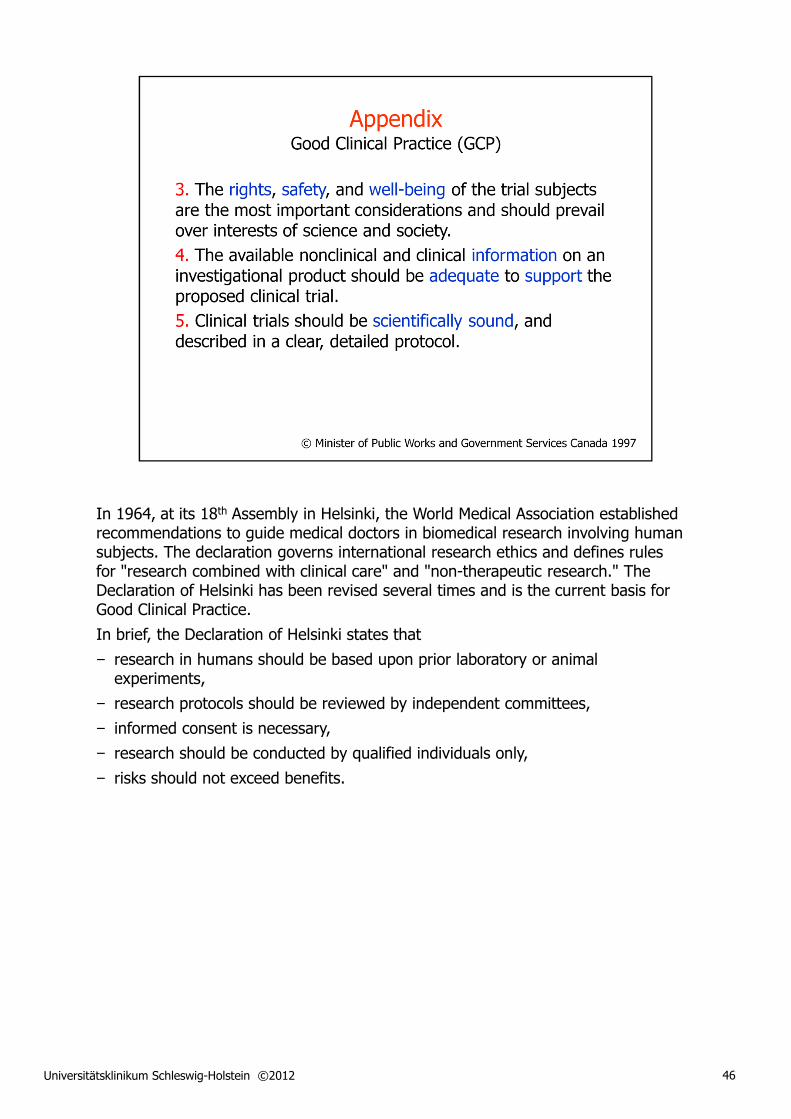
In 1964, at its 18th Assembly in Helsinki, the World Medical Association established recommendations to guide medical doctors in biomedical research involving human subjects. The declaration governs international research ethics and defines rules for "research combined with clinical care" and "non-therapeutic research." The Declaration of Helsinki has been revised several times and is the current basis for Good Clinical Practice.
In brief, the Declaration of Helsinki states that
− research in humans should be based upon prior laboratory or animal experiments,
− research protocols should be reviewed by independent committees,
− informed consent is necessary,
− research should be conducted by qualified individuals only,
− risks should not exceed benefits.
Universitätsklinikum Schleswig-Holstein ©2012 47

Universitätsklinikum Schleswig-Holstein ©2012 48

Universitätsklinikum Schleswig-Holstein ©2012 49
Universitätsklinikum Schleswig-Holstein ©2012 50
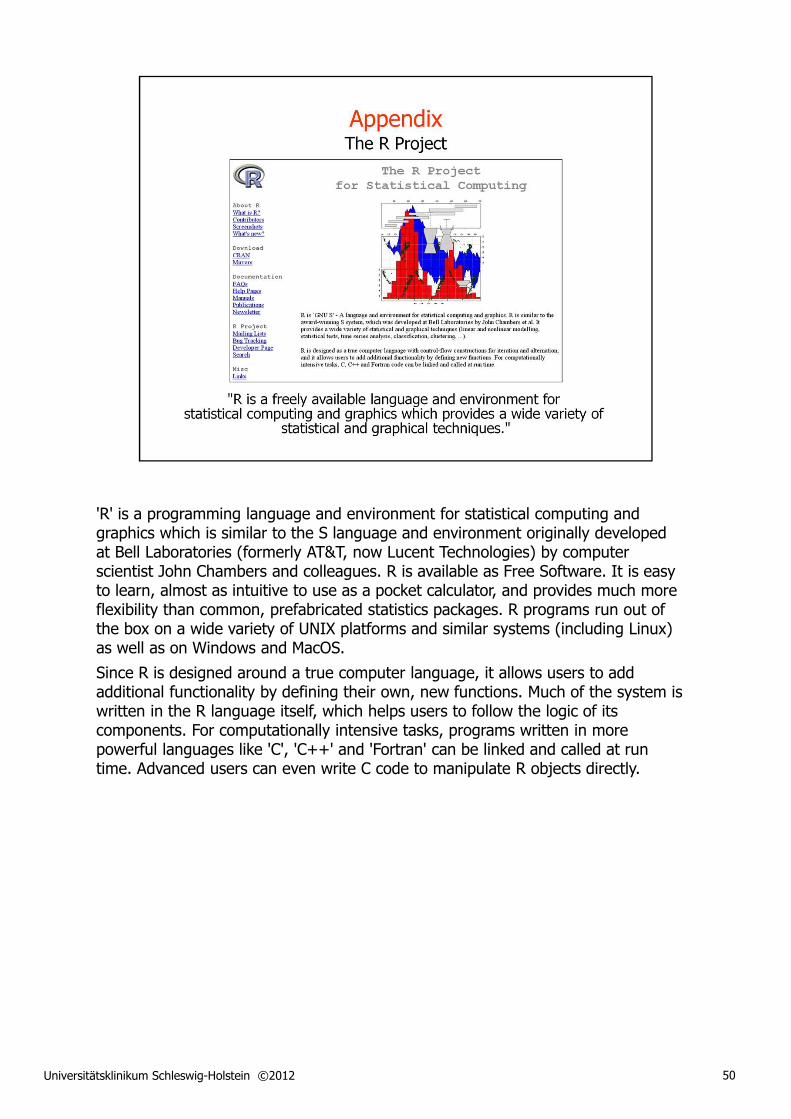
'R' is a programming language and environment for statistical computing and graphics which is similar to the S language and environment originally developed at Bell Laboratories (formerly AT&T, now Lucent Technologies) by computer scientist John Chambers and colleagues. R is available as Free Software. It is easy to learn, almost as intuitive to use as a pocket calculator, and provides much more flexibility than common, prefabricated statistics packages. R programs run out of the box on a wide variety of UNIX platforms and similar systems (including Linux) as well as on Windows and MacOS.
Since R is designed around a true computer language, it allows users to add additional functionality by defining their own, new functions. Much of the system is written in the R language itself, which helps users to follow the logic of its components. For computationally intensive tasks, programs written in more powerful languages like 'C', 'C++' and 'Fortran' can be linked and called at run time. Advanced users can even write C code to manipulate R objects directly.
Universitätsklinikum Schleswig-Holstein ©2012 51
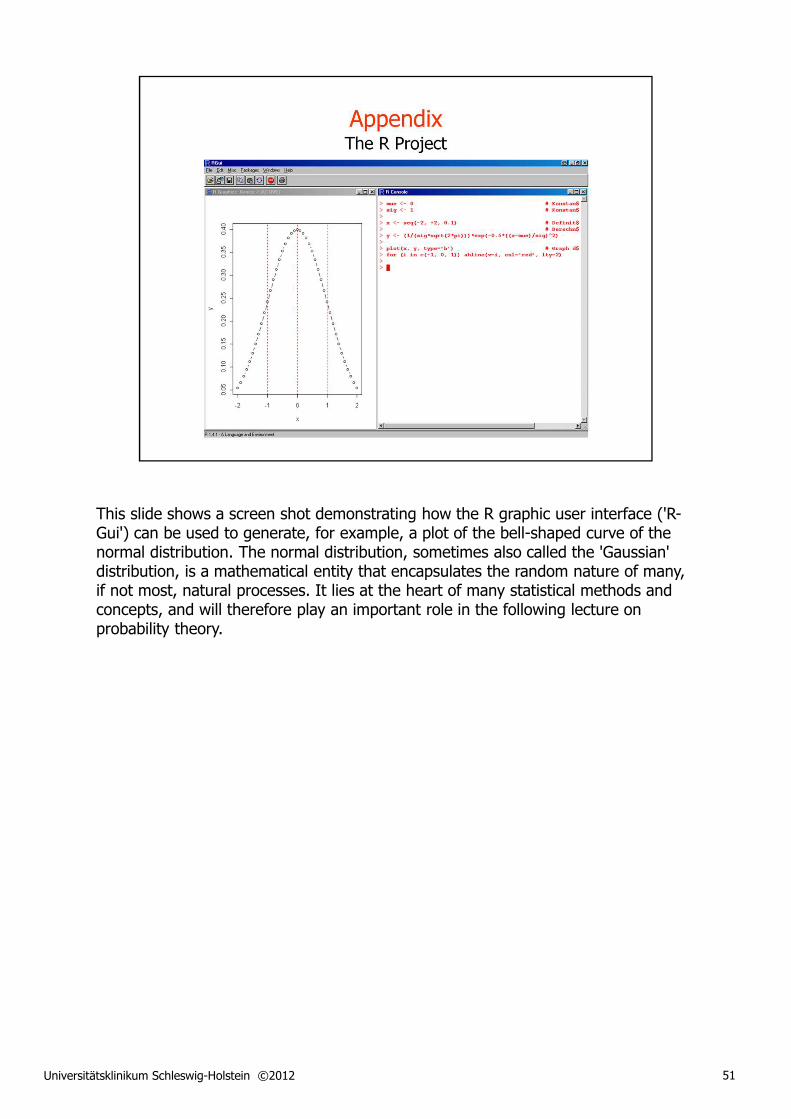
This slide shows a screen shot demonstrating how the R graphic user interface ('R-Gui') can be used to generate, for example, a plot of the bell-shaped curve of the normal distribution. The normal distribution, sometimes also called the 'Gaussian' distribution, is a mathematical entity that encapsulates the random nature of many, if not most, natural processes. It lies at the heart of many statistical methods and concepts, and will therefore play an important role in the following lecture on probability theory.