manual reporter
TRANSCRIPT

7/21/2019 Manual Reporter
http://slidepdf.com/reader/full/manual-reporter 1/140
9.0
User’s manual
Flir Reporter Professional

7/21/2019 Manual Reporter
http://slidepdf.com/reader/full/manual-reporter 2/140

7/21/2019 Manual Reporter
http://slidepdf.com/reader/full/manual-reporter 3/140
User’s manualFlir ReporterProfessional
#1558567; r.6079/6079; en-US iii

7/21/2019 Manual Reporter
http://slidepdf.com/reader/full/manual-reporter 4/140
7/21/2019 Manual Reporter
http://slidepdf.com/reader/full/manual-reporter 5/140
Table of contents
1 Legal disclaimer................................................................................1
1.1 Legal disclaimer .......................................................................11.2 Copyright ................................................................................11.3 Quality assurance .....................................................................1
2 Notice to user....................................................................................2
2.1 User-to-userforums...................................................................22.2 Training...................................................................................22.3 Documentation updates..............................................................22.4 Software updates......................................................................22.5 Important note about this manual.... .......... ......... ......... .......... ........ 22.6 Additional license information.............. ......... .......... ......... ......... .... 2
3 Customer help...................................................................................3
3.1 General ..................................................................................3
3.2 Submittinga question.................................................................33.3 Downloads ..............................................................................3
4 Installation........................................................................................4
4.1 System requirements.................................................................44.1.1 Operating system ......... ......... ......... .......... ......... ......... .... 44.1.2 Hardware ......... .......... ......... ......... .......... ......... ......... .... 44.1.3 Software.......................................................................44.1.4 Related topics ......... ......... .......... ......... ......... .......... ....... 4
4.2 Installation of Flir Reporter Professional.......... .......... ......... ......... .... 54.2.1 Windows 7/8 installation........ .......... ......... ......... ......... ...... 54.2.2 Windows XP installation............. ......... ......... .......... ......... .54.2.3 Windows Vista installation ........ ......... .......... .......... ........ ...6
4.3 Removing Flir Reporter Professional........... ......... ......... .......... ....... 6
5 Managinglicenses.............................................................................7
5.1 Activating your license................................................................75.1.1 General........................................................................75.1.2 Figure..........................................................................75.1.3 Activating Flir Reporter Professional online...... .... .... .... ... .... .. 75.1.4 Activating Flir Reporter Professional by e-mail..... .... .... .... .... .. 8
5.2 Transferring your license. .......... ......... ......... .......... ......... ......... .... 85.2.1 General........................................................................85.2.2 Figure..........................................................................95.2.3 Procedure.............. ......... .......... ......... ......... .......... ........ 9
6 About Flir ReporterProfessional........................................................ 10
6.1 Flir Report Center.................................................................... 10
7 Creating a report .............................................................................11
7.1 Creating a report using the Standard Flir Report Wizard.. .... .... .... .... . 117.2 Creating a report using the Advanced Flir Report Wizard..... .... .... .... . 127.3 Creating a report from a blank Microsoft Word document .... .... .... .... . 16
7.3.1 QuickInsert ................................................................. 17
8 Managingobjects in the report..........................................................19
8.1 Inserting objects ..................................................................... 198.1.1 IR Viewer and Digital Photo objects .............. ......... ......... .. 198.1.2 IR Profile objects .......... ......... ......... .......... ......... ......... .. 198.1.3 IR Histogram objects..... ......... ......... .......... ......... ......... .. 208.1.4 IR Trending objects ....................................................... 208.1.5 Field objects.............. ......... .......... ......... ......... ......... .... 21
8.1.6 Table objects. ......... ......... .......... ......... ......... .......... ...... 228.1.7 Summary Table objects................ ......... ......... .......... ...... 23
8.2 Connectingobjects..................................................................248.3 Resizing objects ..................................................................... 25
#1558567; r.6079/6079; en-US v

7/21/2019 Manual Reporter
http://slidepdf.com/reader/full/manual-reporter 6/140
Table of contents
8.4 Deleting objects...................................................................... 25
8.5 IRViewer measurement tools.....................................................258.5.1 Managing the measurement tools............... ......... ......... .... 268.5.2 Using the Grid tool...... ......... .......... ......... ......... ......... .... 27
8.6 Formulas............................................................................... 288.6.1 General...................................................................... 288.6.2 Creating a simple formula...... .......... ......... ......... ......... .... 298.6.3 Creating a conditional formula .......... ......... ......... ......... .... 30
8.7 Image fusion..........................................................................328.7.1 General...................................................................... 328.7.2 Image fusing procedure ........ .......... ......... ......... ......... .... 32
9 Creating a report template ................................................................35
9.1 General ................................................................................ 35
9.1.1 Few or many report templates?................ ......... .......... ..... 359.1.2 Typical structure... ......... ......... ......... .......... .......... ........ . 359.1.3 A note about working in the Microsoft Word
environment ......... .......... ......... ......... ......... .......... ........ 359.2 Creating a custom infrared report template......... ......... .......... ........ 35
10 Rapid Report Manager......................................................................37
11 Documentproperties ....................................................................... 39
11.1 General ................................................................................ 3911.2 Types of document properties.. ......... .......... ......... ......... ......... .... 3911.3 Creating and editing Microsoft Word document properties .......... ...... 3911.4 Creating a Microsoft Word field and linking the field to a document
property.. ......... .......... ......... ......... .......... ......... ......... ......... .... 39
12 Text comment files...........................................................................41
12.1 Creating a text comment file ......... ......... ......... ......... .......... ........ 4112.2 Linking text comments to a Table object in your report
template ......... ......... ......... ......... .......... ......... ......... .......... ..... 41
13 Emissivitytable files ........................................................................ 43
13.1 Creating an emissivity table file ......... .......... ......... ......... ......... .... 43
14 Panorama images............................................................................ 44
15 Converting radiometric sequence files ......... ......... .......... .......... ........ . 47
15.1 Converting a radiometric sequence file to an AVI file.... .... .... .... .... .... 47
16 Software reference section ........ .......... ......... ......... ......... .......... ........ 48
16.1 Flir Reporter Professional tab......... .......... ......... ......... .......... ...... 4816.1.1 Flir submenu ........ .......... ......... ......... ......... .......... ........ 49
16.2 IRViewer object...................................................................... 5016.2.1 General........ ......... ......... .......... ......... ......... .......... ...... 5016.2.2 IR Viewer shortcut menu ............... ......... ......... .......... ..... 5116.2.3 IR Viewer toolbar... .......... ......... ......... ......... .......... ........ 5216.2.4 IR Viewer tools shortcut menu .......... ......... ......... ......... .... 53
16.3 Digital Photo object ......... ......... ......... ......... .......... .......... ........ . 5416.3.1 General........ ......... ......... .......... ......... ......... .......... ...... 5416.3.2 Digital Photo object shortcut menu .... .... .... .... .... .... .... ... .... 54
16.4 IR Profile object...................................................................... 5416.4.1 General........ ......... ......... .......... ......... ......... .......... ...... 5416.4.2 IR Profile object shortcut menu.. ......... .......... .......... ........ . 5416.4.3 IR Profile toolbar ............. ......... ......... ......... .......... ........ 55
16.5 IR Histogram object................................................................. 55
16.5.1 General........ ......... ......... .......... ......... ......... .......... ...... 5516.5.2 IR Histogram object shortcut menu. .... .... .... .... .... .... .... .... .. 5516.5.3 IR Histogram toolbar ......... .......... ......... ......... .......... ...... 56
16.6 IR Trending object ...................................................................56
#1558567; r.6079/6079; en-US vi
7/21/2019 Manual Reporter
http://slidepdf.com/reader/full/manual-reporter 7/140
Table of contents
16.6.1 General........ ......... ......... .......... ......... ......... .......... ...... 56
16.6.2 IR Trending object shortcut menu. ......... ......... .......... ........ 5716.6.3 IR Trending toolbar...... ......... .......... ......... ......... ......... .... 57
16.7 Field object............................................................................ 5716.7.1 General........ ......... ......... .......... ......... ......... .......... ...... 5716.7.2 Field object shortcut menu..... .... .... .... .... .... ... .... .... .... .... .. 58
16.8 Table object...........................................................................5816.8.1 General........ ......... ......... .......... ......... ......... .......... ...... 5816.8.2 Table object shortcut menu .... .... .... .... .... .... ... .... .... .... .... .. 58
16.9 Summary Table object............... ......... ......... .......... .......... ........ . 5916.9.1 General........ ......... ......... .......... ......... ......... .......... ...... 5916.9.2 Summary Table object shortcut menu..... .... .... .... .... .... ... .... 59
16.10 Flir Reporter Professional dialog boxes .... .... ... .... .... ... .... .... .... .... .. 5916.10.1 Search dialog box......... ......... ......... .......... ......... ......... .. 5916.10.2 QuickInsert dialog box ...................................................6116.10.3 Image Settings dialog box ........ ......... .......... .......... ........ . 6216.10.4 Measurement Settings dialog box ......... ......... .......... ........ 7216.10.5 Profile Settings dialog box ........ ......... .......... .......... ........ . 7416.10.6 Histogram Settings dialog box ......................................... 7716.10.7 Trending Settings dialog box ......... ......... ......... .......... ..... 7916.10.8 Image Fusion dialog box ......... ......... .......... ......... ......... .. 8316.10.9 Formula dialog box .......... ......... ......... ......... .......... ........ 84
16.11 Flir Report Center...... ......... ......... .......... ......... ......... .......... ...... 8416.12 Standard Flir Report Wizard ......... ......... ......... ......... .......... ........ 8616.13 Advanced Flir Report Wizard ......... .......... ......... ......... .......... ...... 86
16.13.1 Filter .......................................................................... 86
16.14 Flir Panorama Tool .......... ......... ......... ......... .......... .......... ........ . 8716.14.1 Organize tab ............................................................... 8816.14.2 Analyze tab................................................................. 89
17 Supported file formats in the IR Viewer object ........ .......... .......... ........ . 92
18 About Flir Systems........................................................................... 93
18.1 More than just an infrared camera........ ......... .......... ......... ......... .. 9418.2 Sharing our knowledge........ ......... .......... ......... ......... .......... ...... 9418.3 Supporting our customers ......... ......... ......... .......... ......... ......... .. 9418.4 A few images from our facilities ......... .......... ......... ......... ......... .... 95
19 Glossary.........................................................................................96
20 Thermographic measurement techniques.............. .......... .......... ........ . 99
20.1 Introduction ........................................................................... 99
20.2 Emissivity.............................................................................. 9920.2.1 Finding the emissivity of a sample .... ... .... .... ... .... .... .... .... .. 99
20.3 Reflected apparent temperature ........ .......... ......... ......... ......... ...10220.4 Distance ..............................................................................10220.5 Relative humidity... .......... ......... ......... ......... .......... .......... ........10220.6 Other parameters............ ......... ......... ......... .......... .......... ........102
21 History of infrared technology......................................................... 104
22 Theory of thermography ................................................................. 107
22.1 Introduction ......... .......... ......... ......... ......... .......... .......... ........10722.2 The electromagnetic spectrum.... ......... ......... .......... .......... ........10722.3 Blackbody radiation... ......... ......... .......... ......... ......... .......... .....107
22.3.1 Planck’s law ......... .......... ......... ......... ......... .......... .......108
22.3.2 Wien’s displacement law ......... ......... .......... ......... ......... .10922.3.3 Stefan-Boltzmann's law......... .......... ......... ......... ......... ...11022.3.4 Non-blackbody emitters. ......... ......... .......... ......... ......... .111
22.4 Infrared semi-transparent materials ......... ......... ......... .......... .......113
#1558567; r.6079/6079; en-US vii

7/21/2019 Manual Reporter
http://slidepdf.com/reader/full/manual-reporter 8/140
Table of contents
23 The measurement formula .............................................................. 114
24 Emissivitytables ........................................................................... 118
24.1 References.......... .......... ......... ......... ......... .......... .......... ........11824.2 Tables .................................................................................118
#1558567; r.6079/6079; en-US viii

7/21/2019 Manual Reporter
http://slidepdf.com/reader/full/manual-reporter 9/140
Legal disclaimer1
1.1 Legal disclaimer
All products manufactured by Flir Systems are warranted against defective materials andworkmanship for a period of one (1) year from the delivery date of the original purchase,provided such products have been under normal storage, use and service, and in accord-ance with Flir Systems instruction.
Products which are not manufactured by Flir Systems but included in systems deliveredby Flir Systems to the original purchaser, carry the warranty, if any, of the particular suppli-er only. Flir Systems has no responsibility whatsoever for such products.
The warranty extends only to the original purchaser and is not transferable. It is not appli-cable to any product which has been subjected to misuse, neglect, accident or abnormalconditions of operation. Expendable parts are excluded from the warranty.
In the case of a defect in a product covered by this warranty the product must not be fur-ther used in order to prevent additional damage. The purchaser shall promptly report any
defect to Flir Systems or this warranty will not apply.Flir Systems will, at its option, repair or replace any such defective product free of chargeif, upon inspection, it proves to be defective in material or workmanship and provided thatit is returned to Flir Systems within the said one-year period.
Flir Systems has no other obligation or liability for defects than those set forth above.
No other warranty is expressed or implied. Flir Systems specifically disclaims the impliedwarranties of merchantability and fitness for a particular purpose.
Flir Systems shall not be liable for any direct, indirect, special, incidental or consequentialloss or damage, whether based on contract, tort or any other legal theory.
This warranty shall be governed by Swedish law.
Any dispute, controversy or claim arising out of or in connection with this warranty, shallbe finally settled by arbitration in accordance with the Rules of the Arbitration Institute ofthe Stockholm Chamber of Commerce. The place of arbitration shall be Stockholm. Thelanguage to be used in the arbitral proceedings shall be English.
1.2 Copyright
© 2012, Flir Systems. All rights reserved worldwide. No parts of the software includingsource code may be reproduced, transmitted, transcribed or translated into any languageor computer language in any form or by any means, electronic, magnetic, optical, manualor otherwise, without the prior written permission of Flir Systems.
This documentation must not, in whole or part, be copied, photocopied, reproduced,translated or transmitted to any electronic medium or machine readable form without priorconsent, in writing, from Flir Systems.
Names and marks appearing on the products herein are either registered trademarks ortrademarks of Flir Systems and/or its subsidiaries. All other trademarks, trade names orcompany names referenced herein are used for identification only and are the property oftheir respective owners.
1.3 Quality assurance
The Quality Management System under which these products are developed and manu-factured has been certified in accordance with the ISO 9001 standard.
Flir Systems is committed to a policy of continuousdevelopment; therefore we reservethe right to make changes and improvements on any of the products described in thismanual without prior notice.
#1558567; r.6079/6079; en-US 1

7/21/2019 Manual Reporter
http://slidepdf.com/reader/full/manual-reporter 10/140
Notice to user2
2.1 User-to-user forums
Exchange ideas, problems, and infrared solutions with fellow thermographers around theworld in our user-to-user forums. To go to the forums, visit:
http://www.infraredtraining.com/community/boards/
2.2 Training
To read about infrared training, visit:
• http://www.infraredtraining.com• http://www.irtraining.com• http://www.irtraining.eu
2.3 Documentation updates
Our manuals are updated several times per year, and we also issue product-critical notifi-cations of changes on a regular basis.
To access the latest manuals and notifications, go to the Download tab at:
http://support.flir.com
It only takes a few minutes to register online. In the download area you will also find thelatest releases of manuals for our other products, as well as manuals for our historicaland obsolete products.
2.4 Software updates
Flir Systems regularly issues software updates and you can update the software usingthis update service. Depending on your software, this update service is located at one orboth of the following locations:
• Start > Flir Systems > Flir Reporter Professional > Check for updates.• Help > Check for updates.
2.5 Important note about this manual
Flir Systems issues generic manuals that cover several software variantswithin a softwaresuite.
This means that this manual may contain descriptions and explanations that do not applyto your software variant.
2.6 Additional license information
For each purchased software license, the software may be installed, activated, and usedon two devices, e.g., one laptop computer for on-site data acquisition, and one desktop
computer for analysis in the office.
#1558567; r.6079/6079; en-US 2

7/21/2019 Manual Reporter
http://slidepdf.com/reader/full/manual-reporter 11/140
Customer help3
3.1 General
For customer help, visit:
http://support.flir.com
3.2 Submitting a questionTo submit a question to the customer help team, you must be a registered user. It onlytakes a few minutes to register online. If you only want to search the knowledgebase forexisting questions and answers, you do not need to be a registered user.
When you want to submit a question, make sure that you have the following information tohand:
• The camera model• The camera serial number• The communication protocol, or method, between the camera and your device (for ex-
ample, HDMI, Ethernet, USB, or FireWire)• Device type (PC/Mac/iPhone/iPad/Android device, etc.)• Version of any programs from Flir Systems
• Full name, publication number, and revision number of the manual3.3 Downloads
On the customer help site you can also download the following:
• Firmware updates for your infrared camera.• Program updates for your PC/Mac software.• Freeware and evaluation versions of PC/Mac software.• User documentation for current, obsolete, and historical products.• Mechanicaldrawings (in *.dxf and *.pdf format).• Cad data models (in *.stp format).• Application stories.• Technical datasheets.• Product catalogs.
#1558567; r.6079/6079; en-US 3
7/21/2019 Manual Reporter
http://slidepdf.com/reader/full/manual-reporter 12/140
Installation4
4.1 System requirements
4.1.1 Operating system
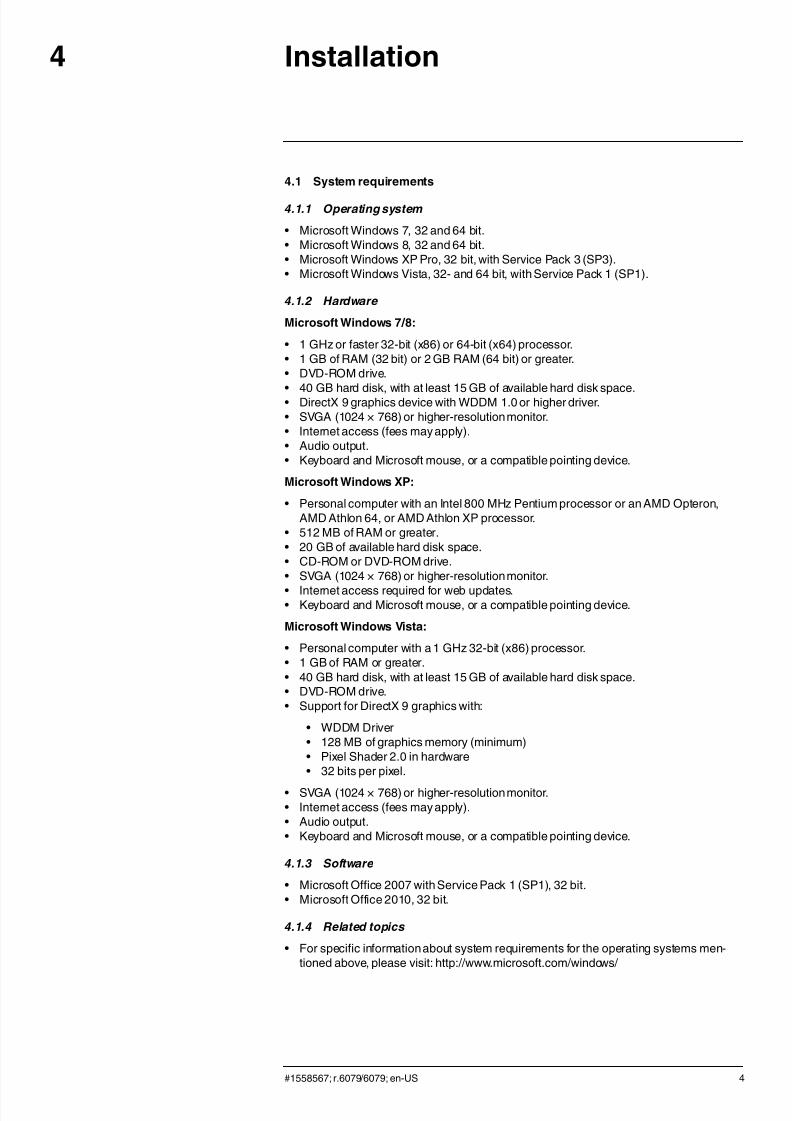
• Microsoft Windows 7, 32 and 64 bit.• Microsoft Windows 8, 32 and 64 bit.• Microsoft Windows XP Pro, 32 bit, with Service Pack 3 (SP3).• Microsoft Windows Vista, 32- and 64 bit, with Service Pack 1 (SP1).
4.1.2 Hardware
Microsoft Windows 7/8:
• 1 GHz or faster 32-bit (x86) or 64-bit (x64) processor.• 1 GB of RAM (32 bit) or 2 GB RAM (64 bit) or greater.• DVD-ROM drive.
• 40 GB hard disk, with at least 15 GB of available hard disk space.• DirectX 9 graphics device with WDDM 1.0 or higher driver.• SVGA (1024 × 768) or higher-resolution monitor.• Internet access (fees may apply).• Audio output.• Keyboard and Microsoft mouse, or a compatible pointing device.
Microsoft Windows XP:
• Personal computer with an Intel 800 MHz Pentium processor or an AMD Opteron,AMD Athlon 64, or AMD Athlon XP processor.
• 512 MB of RAM or greater.• 20 GB of available hard disk space.• CD-ROM or DVD-ROM drive.• SVGA (1024 × 768) or higher-resolution monitor.
• Internet access required for web updates.• Keyboard and Microsoft mouse, or a compatible pointing device.
Microsoft Windows Vista:
• Personal computer with a 1 GHz 32-bit (x86) processor.• 1 GB of RAM or greater.• 40 GB hard disk, with at least 15 GB of available hard disk space.• DVD-ROM drive.• Support for DirectX 9 graphics with:
• WDDM Driver• 128 MB of graphics memory (minimum)• Pixel Shader 2.0 in hardware• 32 bits per pixel.
• SVGA (1024 × 768) or higher-resolution monitor.• Internet access (fees may apply).• Audio output.• Keyboard and Microsoft mouse, or a compatible pointing device.
4.1.3 Software
• Microsoft Office 2007 with Service Pack 1 (SP1), 32 bit.• Microsoft Office 2010, 32 bit.
4.1.4 Related topics
• For specific information about system requirements for the operating systems men-tioned above, please visit: http://www.microsoft.com/windows/
#1558567; r.6079/6079; en-US 4

7/21/2019 Manual Reporter
http://slidepdf.com/reader/full/manual-reporter 13/140
Installation4
4.2 Installationof Flir Reporter Professional
4.2.1 Windows 7/8 installation
Note
• If your software license agreement depends on using a security device, insert the security device inan available USB connector of the computer before you enter the license number.
• The license number is printed on the back of the CD-ROM case.
Installing Flir Reporter Professional on your computer
1. If a previous program version of Flir Reporter Professional is installed on your com-puter, remove this version by using the Microsoft Windows uninstall program proce-dure (Start > Control Panel > Programs > Programs and Features).
2. Close down all running programs, includingMicrosoft Outlook.3. Insert the Flir Reporter Professional into the CD-ROM drive on the computer. The in-
stallation will start automatically.Should the installationnot start automatically, start Windows Explorer and double-clickSETUP.EXE on the CD-ROM.
4. Follow the on-screen instructions.
Note
• If not already installed, Microsoft .NET Framework 4 will be installed on your computer by this instal-lation procedure.
• Neevia docCreator will be added to your computer by this installation procedure.• After installation, make sure that the macro settings in Microsoft Word are set to Disable all macros
with notification (File > Options > Trust Center > Trust Center Settings... > Macro Settings > Disableall macros with notification).
• Whenopening a report, you may be asked whether to disable or enable the macros. Always click En-able Macros.
4.2.2 Windows XP installation
Note
• If your software license agreement depends on using a security device, insert the security device inan available USB connector of the computer before you enter the license number.
• The license number is printed on the back of the CD-ROM case.
Installing Flir Reporter Professional on your computer
1. If a previous program version of Flir Reporter Professional is installed on your com-puter, remove this version by using the Microsoft Windows uninstall program proce-dure (Start > Control Panel > Programs > Programs and Features).
2. Close down all running programs, includingMicrosoft Outlook.
3. Insert the Flir Reporter Professional into the CD-ROM drive on the computer. The in-stallation will start automatically.
Should the installationnot start automatically, start Windows Explorer and double-clickSETUP.EXE on the CD-ROM.
4. Follow the on-screen instructions.
Note
• If not already installed, Microsoft .NET Framework 4 will be installed on your computer by this instal-lation procedure.
• Neevia docCreator will be added to your computer by this installation procedure.• After installation, make sure the macro settings in Microsoft Word are set to Disable all macros with
notification(File > Options > Trust Center > Trust Center Settings... > Macro Settings > Disable all macros with notification).
• Whenopening a report, you may be asked whether to disable or enable the macros. Always click En-
able Macros.
#1558567; r.6079/6079; en-US 5

7/21/2019 Manual Reporter
http://slidepdf.com/reader/full/manual-reporter 14/140
Installation4
4.2.3 Windows Vista installation
Note
• If your software license agreement depends on using a security device, insert the security device inan available USB connector of the computer before you enter the license number.
• The license number is printed on the back of the CD-ROM case.
Installing Flir Reporter Professional on your computer
1. If a previous program version of Flir Reporter Professional is installed on your com-puter, remove this version by using the Microsoft Windows uninstall program proce-dure (Start > Control Panel > Programs > Programs and Features).
2. Close down all running programs, includingMicrosoft Outlook.3. Insert the Flir Reporter Professional into the CD-ROM drive on the computer. The in-
stallation will start automatically.
Should the installationnot start automatically, start Windows Explorer and double-clickSETUP.EXE on the CD-ROM.4. In the Autoplay dialog box, click Run setup.exe (Published by Flir Systems).5. In the User Account Control dialog box, confirm that you want to install Flir Reporter
Professional.
6. Follow the on-screen instructions.
Note
• If not already installed, Microsoft .NET Framework 4 will be installed on your computer by this instal-lation procedure.
• Neevia docCreator will be added to your computer by this installation procedure.• After installation, make sure the macro settings in Microsoft Word are set to Disable all macros with
notification(File > Options > Trust Center > Trust Center Settings... > Macro Settings > Disable all macros with notification).
• Whenopening a report, you may be asked whether to disable or enable the macros. Always click En-
able Macros.
4.3 Removing Flir Reporter Professional
Removing Flir Reporter Professional from your computer
1. Close down all applications.2. Insert the Flir Reporter Professional CD-ROM into the CD-ROM drive on the
computer.
3. When the InstallShieldWizard dialog box is displayed, do the following:
1. Click Remove.2. Click Next .3. Follow the on-screen instructions.
Note
You can also remove Flir Reporter Professional from your computer by using the Microsoft Windows un-install program procedure (Start > Control Panel > Programs > Programs and Features).
#1558567; r.6079/6079; en-US 6
7/21/2019 Manual Reporter
http://slidepdf.com/reader/full/manual-reporter 15/140
Managing licenses5
5.1 Activating your license
5.1.1 General
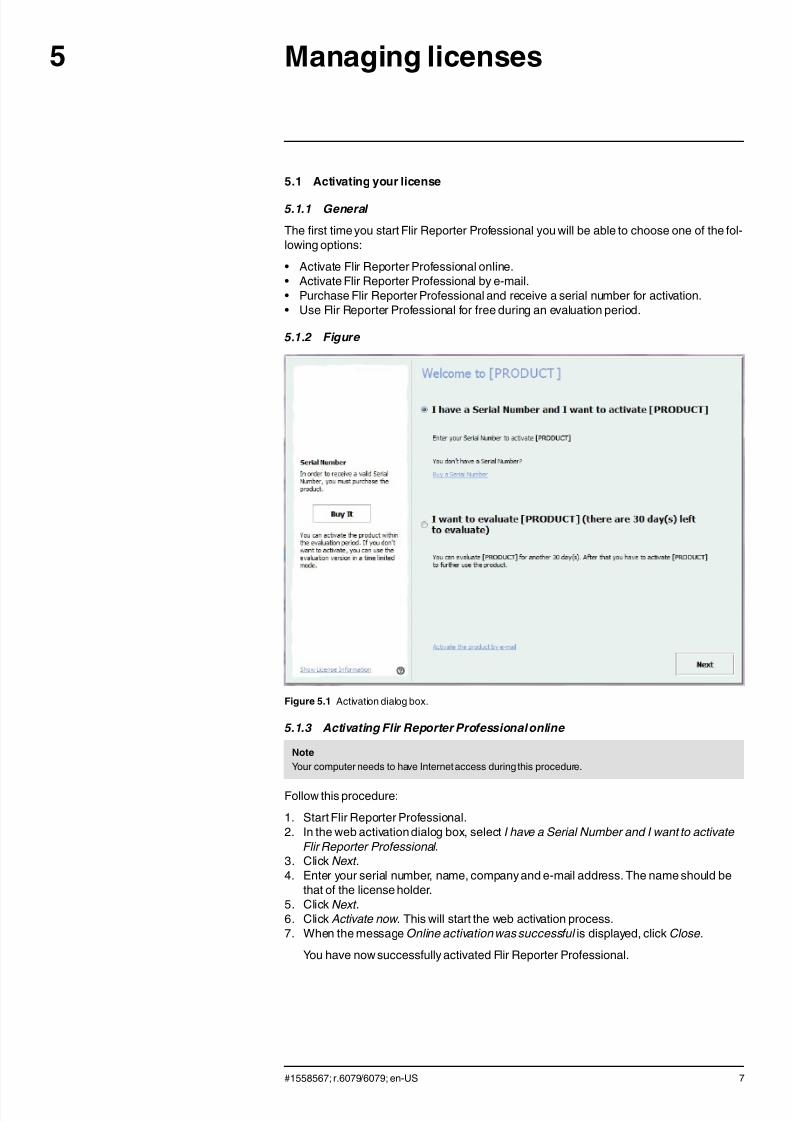
The first time you start Flir Reporter Professional you will be able to choose one of the fol-lowing options:
• Activate Flir Reporter Professional online.• Activate Flir Reporter Professional by e-mail.• Purchase Flir Reporter Professional and receive a serial number for activation.• Use Flir Reporter Professional for free during an evaluation period.
5.1.2 Figure
Figure 5.1 Activation dialog box.
5.1.3 Activating Flir Reporter Professional online
Note
Your computer needs to have Internet access during this procedure.
Follow this procedure:
1. Start Flir Reporter Professional.2. In the web activation dialog box, select I have a Serial Number and I want to activate
Flir Reporter Professional .3. Click Next .4. Enter your serial number, name, company and e-mail address. The name should be
that of the license holder.5. Click Next .6. Click Activate now . This will start the web activation process.7. When the message Online activation was successful is displayed, click Close.
You have now successfully activated Flir Reporter Professional.
#1558567; r.6079/6079; en-US 7
7/21/2019 Manual Reporter
http://slidepdf.com/reader/full/manual-reporter 16/140
Managing licenses5
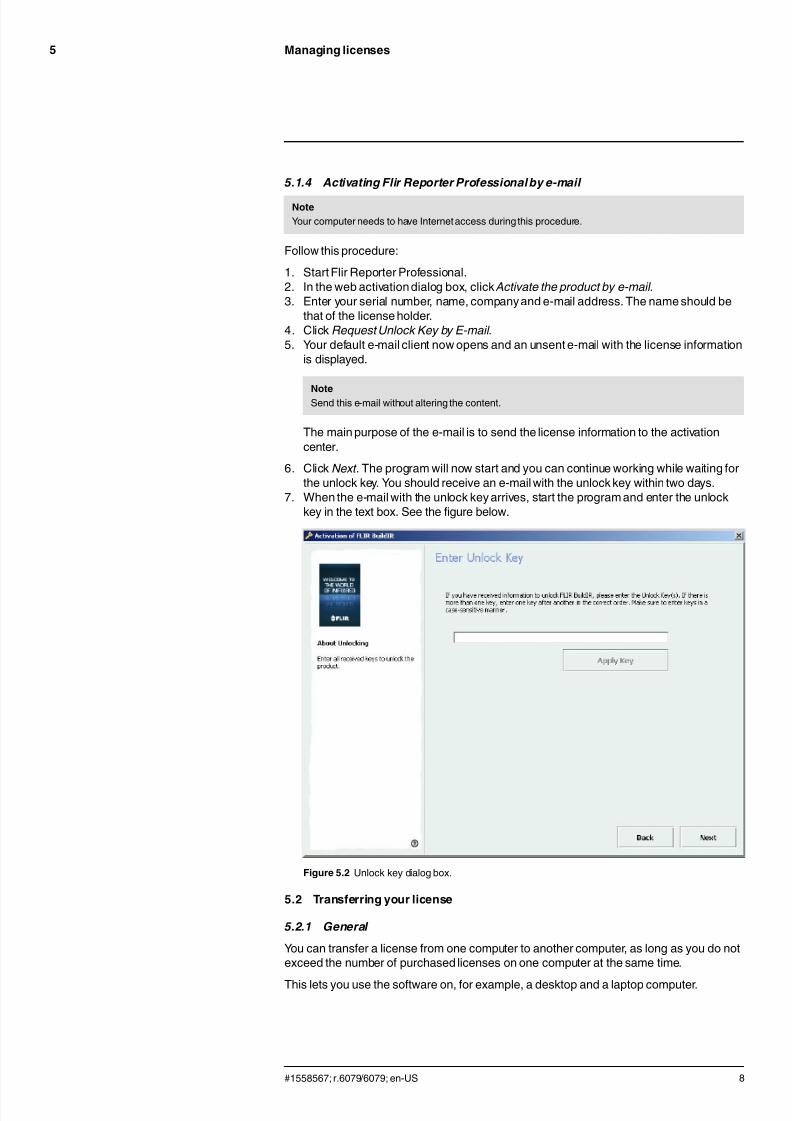
5.1.4 Activating Flir Reporter Professional by e-mail
Note
Your computer needs to have Internet access during this procedure.
Follow this procedure:
1. Start Flir Reporter Professional.2. In the web activation dialog box, click Activate the product by e-mail .3. Enter your serial number, name, company and e-mail address. The name should be
that of the license holder.4. Click Request Unlock Key by E-mail .5. Your default e-mail client now opens and an unsent e-mail with the license information
is displayed.
NoteSend this e-mail without altering the content.
The main purpose of the e-mail is to send the license information to the activationcenter.
6. Click Next . The program will now start and you can continue working while waiting forthe unlock key. You should receive an e-mail with the unlock key within two days.
7. When the e-mail with the unlock key arrives, start the program and enter the unlockkey in the text box. See the figure below.
Figure 5.2 Unlock key dialog box.
5.2 Transferring your license
5.2.1 General
You can transfer a license from one computer to another computer, as long as you do notexceed the number of purchased licenses on one computer at the same time.
This lets you use the software on, for example, a desktop and a laptop computer.
#1558567; r.6079/6079; en-US 8

7/21/2019 Manual Reporter
http://slidepdf.com/reader/full/manual-reporter 17/140
Managing licenses5
5.2.2 Figure
Figure 5.3 License viewer (example image only).
5.2.3 Procedure
Note
Your computer needs to have Internet access during this procedure.
Follow this procedure:
1. Start Flir Reporter Professional.2. On the Help menu, select Show license information. This will display the license view-
er shown above.3. In the license viewer, click Transfer license. This will display a deactivation dialog box.4. In the a deactivation dialog box, click Deactivate.5. On the computer to which you want to transfer the license, start Flir Reporter
Professional.
As soon as the computer gets Internet access, the license will be automaticallyadopted.
Note
The adoption of licenses is based on a “first-come, first-serve” concept. This means that the first com-puter that gets Internet access automaticallyadopts the transferred license.
#1558567; r.6079/6079; en-US 9
7/21/2019 Manual Reporter
http://slidepdf.com/reader/full/manual-reporter 18/140
About Flir Reporter Professional6
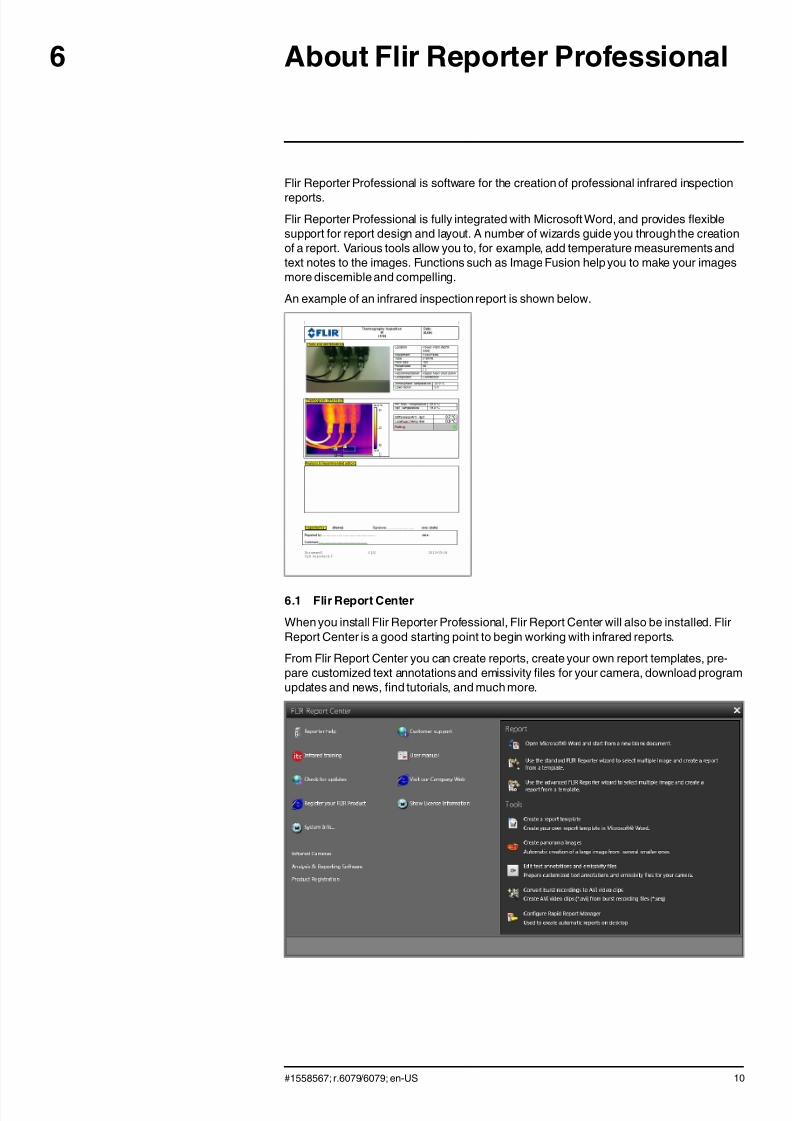
Flir Reporter Professional is software for the creation of professional infrared inspection
reports.Flir Reporter Professional is fully integrated with Microsoft Word, and provides flexiblesupport for report design and layout. A number of wizards guide you through the creationof a report. Various tools allow you to, for example, add temperature measurements andtext notes to the images. Functions such as Image Fusion help you to make your imagesmore discernible and compelling.
An example of an infrared inspection report is shown below.
6.1 Flir Report Center
When you install Flir Reporter Professional, Flir Report Center will also be installed. FlirReport Center is a good starting point to begin working with infrared reports.
From Flir Report Center you can create reports, create your own report templates, pre-pare customized text annotations and emissivity files for your camera, download programupdates and news, find tutorials, and much more.
#1558567; r.6079/6079; en-US 10
7/21/2019 Manual Reporter
http://slidepdf.com/reader/full/manual-reporter 19/140
Creating a report7
You can create an infrared inspection report in different ways:
• Using the Standard Flir Report Wizard.• Using the Advanced Flir Report Wizard.• From a blank Microsoft Word document.
If you have created a Rapid Report Manager icon on your Desktop, you can also create areport by dragging and dropping images to the icon, see section 10 Rapid Report Manag-
er , page 37
7.1 Creating a report using the Standard Flir Report Wizard
In the Standard Flir Report Wizard you can select different report templates, add images,move pages up and down, and delete pages.
Note
To create an infrared report, a report template (a Microsoft Word *.dot file) must be available. Flir Report-er Professional ships with several different report templates, which you may find useful. You can alsocreate your own templates, see section 9 Creating a report template, page 35.
Creating a report using the Standard Flir Report Wizard
1. Start the Standard Flir Report Wizard by doing one of the following:
• Select Reporter Wizard from the Start menu (Start > All Programs > Flir Systems >Flir Reporter Professional > Reporter Wizard ).
• In Flir Report Center, select Use the standard FLIR Reporter wizard... from the Re-
port pane.
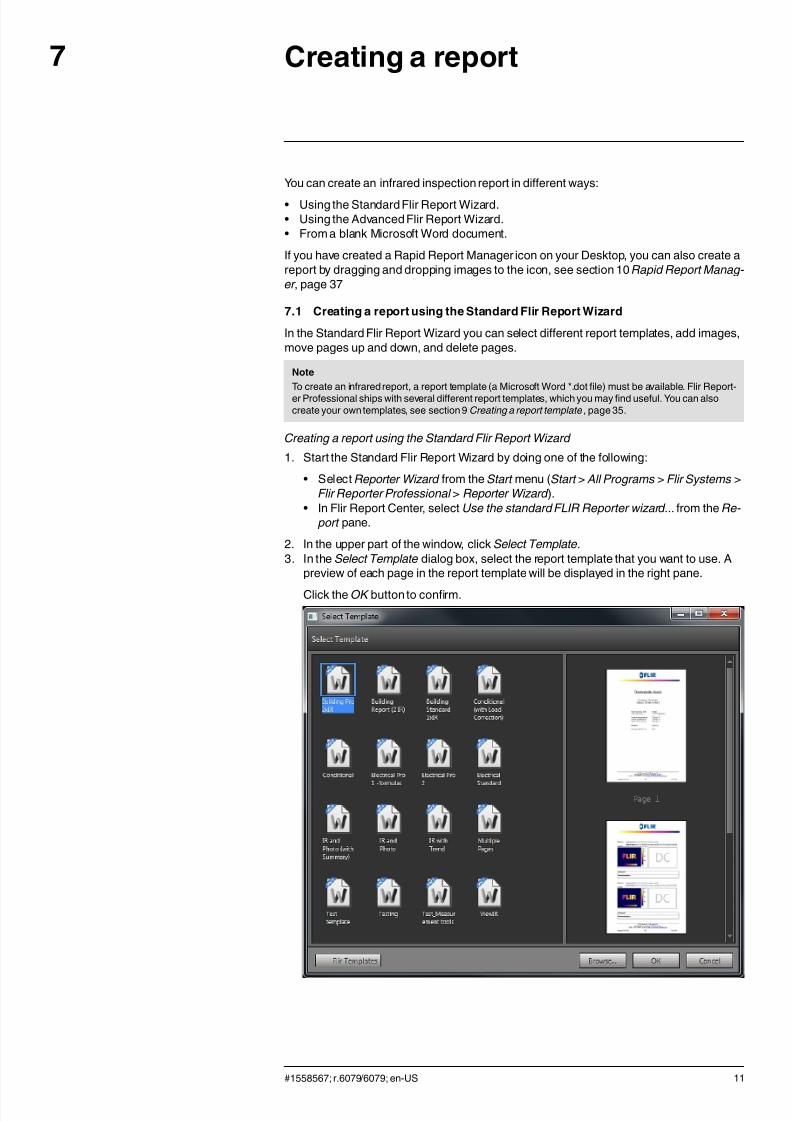
2. In the upper part of the window, click Select Template.3. In the Select Template dialog box, select the report template that you want to use. A
preview of each page in the report template will be displayed in the right pane.
Click the OK button to confirm.
#1558567; r.6079/6079; en-US 11
7/21/2019 Manual Reporter
http://slidepdf.com/reader/full/manual-reporter 20/140
Creating a report7
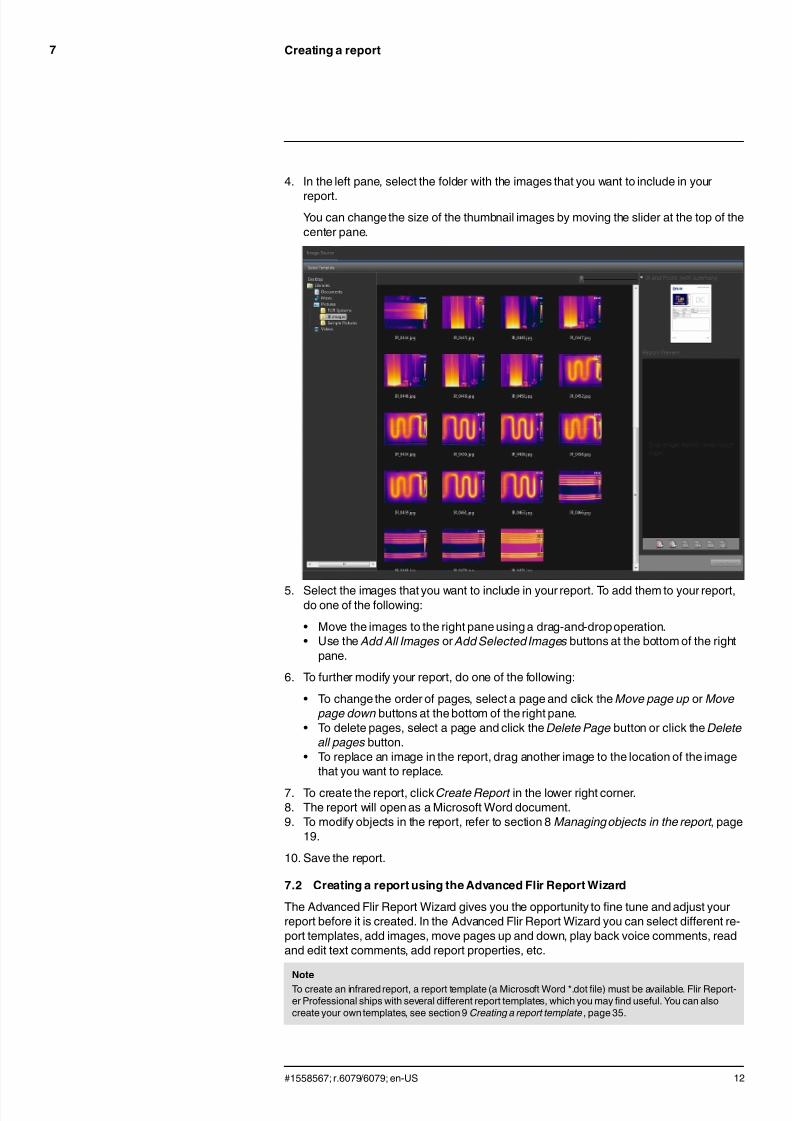
4. In the left pane, select the folder with the images that you want to include in your
report.You can change the size of the thumbnail images by moving the slider at the top of thecenter pane.
5. Select the images that you want to include in your report. To add them to your report,do one of the following:
• Move the images to the right pane using a drag-and-dropoperation.• Use the Add All Images or Add Selected Images buttons at the bottom of the right
pane.
6. To further modify your report, do one of the following:
• To change the order of pages, select a page and click the Move page up or Move
page down buttons at the bottom of the right pane.• To delete pages, select a page and click the Delete Page button or click the Delete
all pages button.• To replace an image in the report, drag another image to the location of the image
that you want to replace.
7. To create the report, click Create Report in the lower right corner.8. The report will open as a Microsoft Word document.9. To modify objects in the report, refer to section 8 Managing objects in the report , page
19.
10. Save the report.
7.2 Creating a report using the Advanced Flir Report Wizard
The Advanced Flir Report Wizard gives you the opportunity to fine tune and adjust yourreport before it is created. In the Advanced Flir Report Wizard you can select different re-port templates, add images, move pages up and down, play back voice comments, readand edit text comments, add report properties, etc.
Note
To create an infrared report, a report template (a Microsoft Word *.dot file) must be available. Flir Report-er Professional ships with several different report templates, which you may find useful. You can alsocreate your own templates, see section 9 Creating a report template, page 35.
#1558567; r.6079/6079; en-US 12
7/21/2019 Manual Reporter
http://slidepdf.com/reader/full/manual-reporter 21/140
Creating a report7
Creating a report using the Advanced Flir Report Wizard
1. Start the Advanced Flir Report Wizard by doing one of the following:
• Select Professional Reporter Wizard from the Start menu (Start > All Programs >Flir Systems > Flir Reporter Professional > Professional Reporter Wizard ).
• In Flir Report Center, select Use the advanced FLIR Reporter wizard... from the Re-
port pane.
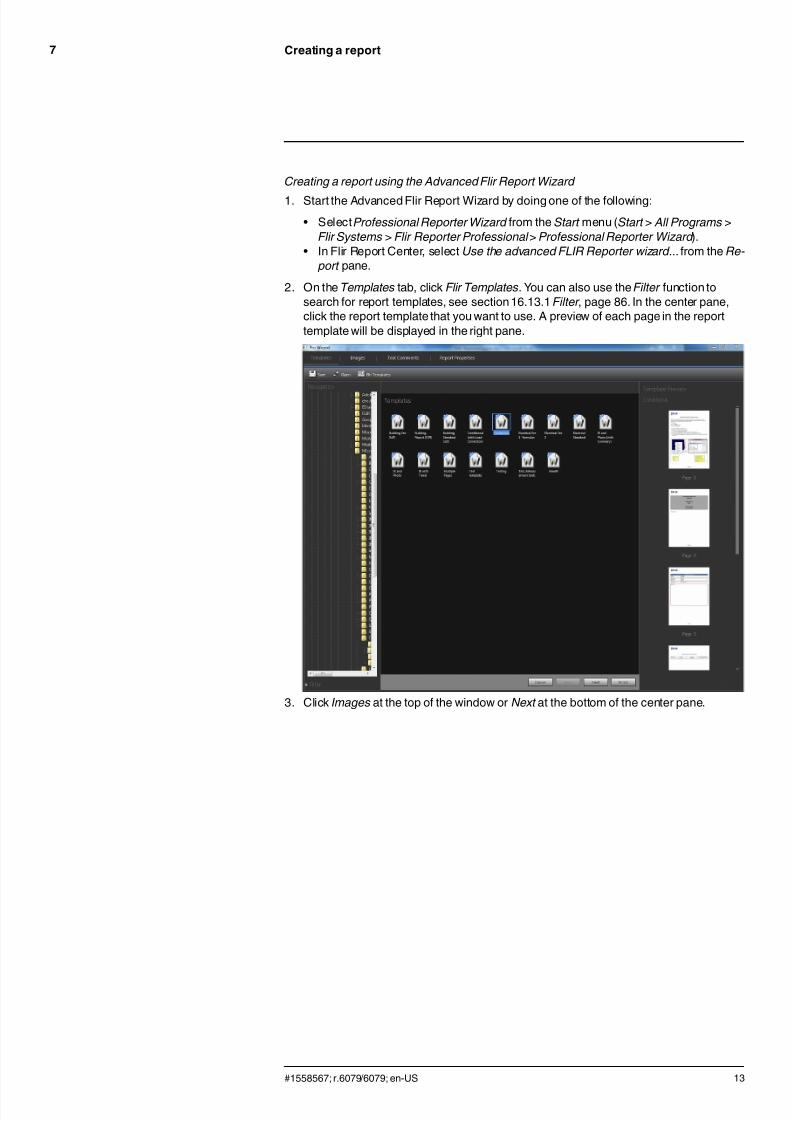
2. On the Templates tab, click Flir Templates. You can also use the Filter function tosearch for report templates, see section 16.13.1 Filter , page 86. In the center pane,click the report template that you want to use. A preview of each page in the reporttemplate will be displayed in the right pane.
3. Click Images at the top of the window or Next at the bottom of the center pane.
#1558567; r.6079/6079; en-US 13
7/21/2019 Manual Reporter
http://slidepdf.com/reader/full/manual-reporter 22/140
Creating a report7
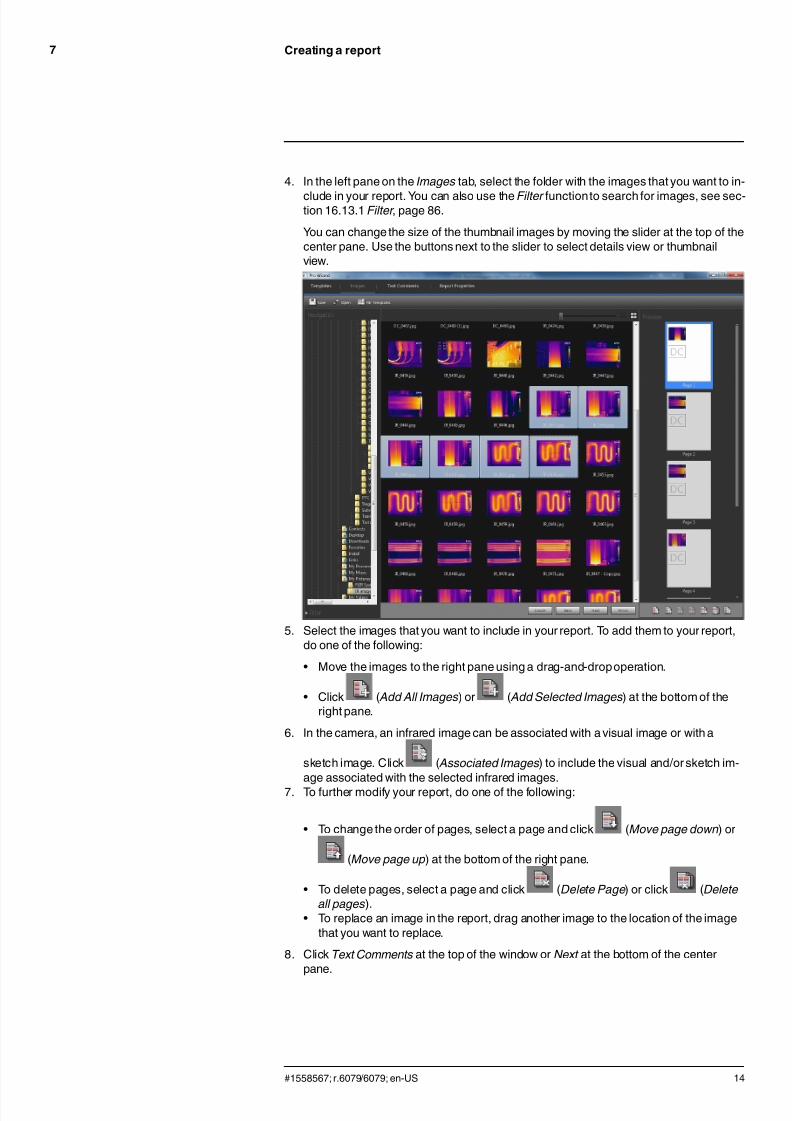
4. In the left pane on the Images tab, select the folder with the images that you want to in-
clude in your report. You can also use the Filter functionto search for images, see sec-tion 16.13.1 Filter , page 86.
You can change the size of the thumbnail images by moving the slider at the top of thecenter pane. Use the buttons next to the slider to select details view or thumbnailview.
5. Select the images that you want to include in your report. To add them to your report,do one of the following:
• Move the images to the right pane using a drag-and-dropoperation.
• Click ( Add All Images) or ( Add Selected Images) at the bottom of theright pane.
6. In the camera, an infrared image can be associated with a visual image or with a
sketch image. Click ( Associated Images) to include the visual and/or sketch im-age associated with the selected infrared images.
7. To further modify your report, do one of the following:
• To change the order of pages, select a page and click (Move page down) or
(Move page up) at the bottom of the right pane.
• To delete pages, select a page and click (Delete Page) or click (Delete
all pages).• To replace an image in the report, drag another image to the location of the image
that you want to replace.
8. Click Text Comments at the top of the window or Next at the bottom of the centerpane.
#1558567; r.6079/6079; en-US 14

7/21/2019 Manual Reporter
http://slidepdf.com/reader/full/manual-reporter 23/140
Creating a report7
9. On the Text Comments tab, mark a page in the right pane, and do one or more of the
following in the center pane:• For images with a text comment, you can edit the text comment value by clicking it
and then typing a new value.• Click Add Comments from Template to add text comments fields from the report
template.• For images with a voice comment, you can play back the voice comment.
If a page contains more than one image with text comments or voice comments, youmust select the image to be able to see the text comment or play back the voicecomment.
10. Click Report Properties at the top of the window or Next at the bottom of the centerpane.
#1558567; r.6079/6079; en-US 15

7/21/2019 Manual Reporter
http://slidepdf.com/reader/full/manual-reporter 24/140
Creating a report7
11. On the Report Properties tab, you do one or more of the following in the center pane:
On the Text Comments tab, mark a page in the right pane and do one or more of thefollowing in the center pane:
• Edit values for report properties by clicking the value and then typing a new value.• Click Get settings from Property Settings File to open a previously saved property
settings text file (see below).• Click Save settings from Property Settings File to save the current property settings
to a text file.• Click Revert settings to template default to apply the property settings defined by
the report template.
12. To create the report, click Finish at the bottom of the center pane.13. The report will open as a Microsoft Word document.14. To modify objects in the report, refer to section 8 Managing objects in the report , page
19.
15. Save the report.
7.3 Creating a report from a blank Microsoft Word document
You can create a report by inserting objects and specifying object properties directly in ablank Microsoft Word document.
A fast and convenient way to create a report is to use the QuickInsert button on the FlirReporter Professional tab. Using this button, you can select a predefined page layout, orchoose to customize one of the page layouts.
Creating a report from a blank Microsoft Word document
1. Open a blank Microsoft Word document by doing one of the following:
• Select Blank Report from the Start menu (Start > All Programs > Flir Systems > Flir
Reporter Professional > Blank Report ).• In Flir Report Center, select Open Microsoft Word and start from a new blank docu-
ment from the Report pane.• Start Microsoft Word.
2. In Microsoft Word, select the on the Flir Reporter Professional tab.
#1558567; r.6079/6079; en-US 16
7/21/2019 Manual Reporter
http://slidepdf.com/reader/full/manual-reporter 25/140
Creating a report7
3. Insert objects and modify the objects properties, as described in section 8 Managing
objects in the report , page 19.4. Save the report.
7.3.1 QuickInsert
Creating a report using QuickInsert
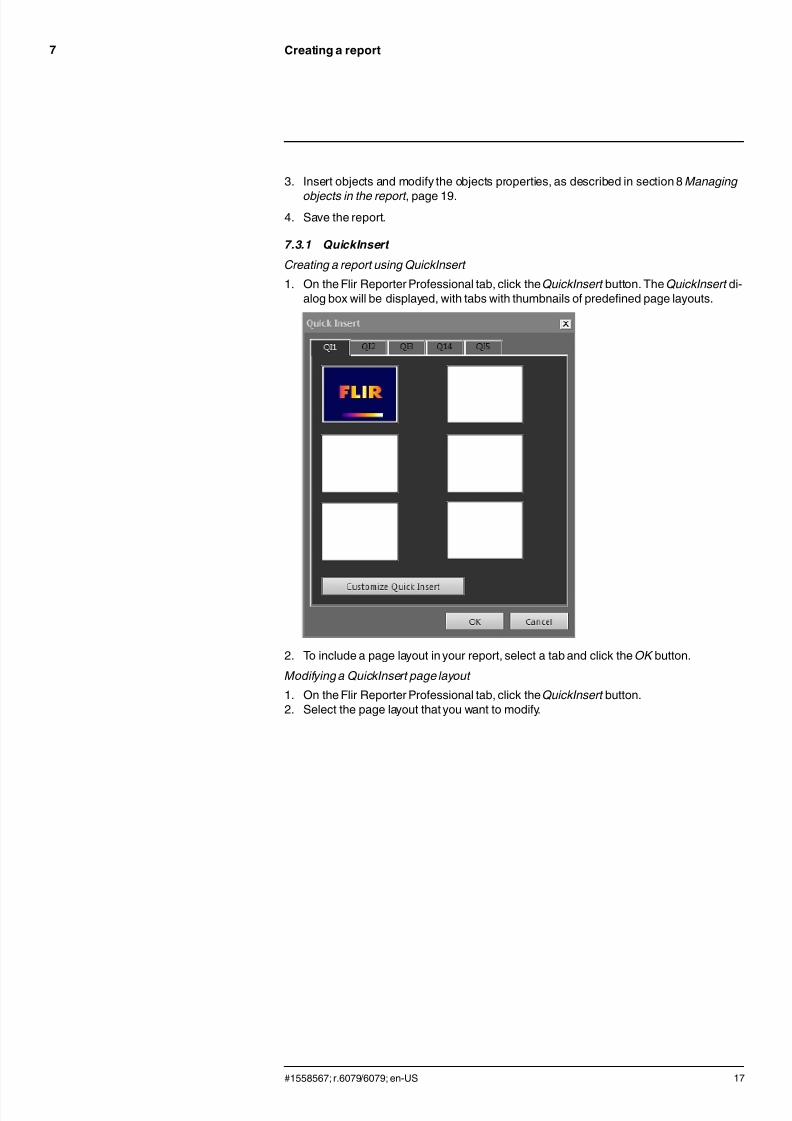
1. On the Flir Reporter Professional tab, click the QuickInsert button. The QuickInsert di-alog box will be displayed, with tabs with thumbnails of predefined page layouts.
2. To include a page layout in your report, select a tab and click the OK button.
Modifying a QuickInsert page layout
1. On the Flir Reporter Professional tab, click the QuickInsert button.2. Select the page layout that you want to modify.
#1558567; r.6079/6079; en-US 17

7/21/2019 Manual Reporter
http://slidepdf.com/reader/full/manual-reporter 26/140
7/21/2019 Manual Reporter
http://slidepdf.com/reader/full/manual-reporter 27/140
Managing objects in the report8
When you create a report based on a report template, objects are automatically inserted
as placeholders for infrared images, digital photos, tables, and fields on the report pages.You can also insert objects and modify their properties after you have launched the reportin Microsoft Word, as described in the sections below.
When you create your own report templates, see section 9 Creating a report template,page 35, you insert objects and define their properties according to the sections below.
The following objects can appear in the report:
• IR Viewer object.• Digital Photo object.• IR Profile object.• IR Histogram object.• IR Trending object.• Field object.
• Table object.• Summary Table object.
Toolbars, submenus, buttons, etc., related to the objects are described in detail in section16 Software reference section, page 48.
8.1 Inserting objects
You insert objects in the report template by clicking the buttons on the Flir Reporter Pro-fessional tab.
8.1.1 IR Viewer and Digital Photo objects
IR Viewer and Digital Photo objects are placeholders that automatically load infrared andvisual images when a report is created using the StandardFlir Report Wizard, Advanced
Flir Report Wizard, or Rapid Report Manager.Inserting IR Viewer and Digital Photo objects
1. On your template page, place the cursor where you want the IR Viewer object or theDigital Photo object to appear. The placeholderswill be inserted after and below thecursor.
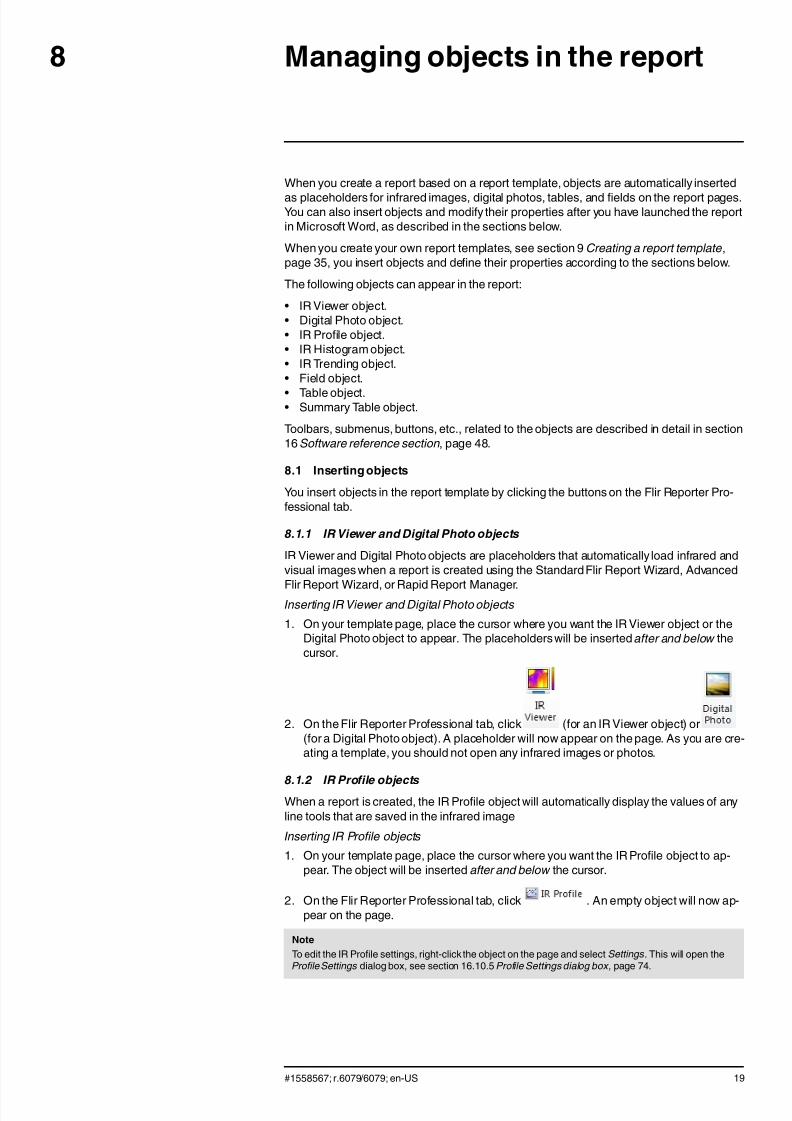
2. On the Flir Reporter Professional tab, click (for an IR Viewer object) or(for a Digital Photo object). A placeholder will now appear on the page. As you are cre-ating a template, you should not open any infrared images or photos.
8.1.2 IR Profile objectsWhen a report is created, the IR Profile object will automatically display the values of anyline tools that are saved in the infrared image
Inserting IR Profile objects
1. On your template page, place the cursor where you want the IR Profile object to ap-pear. The object will be inserted after and below the cursor.
2. On the Flir Reporter Professional tab, click . An empty object will now ap-pear on the page.
Note
To edit the IR Profile settings, right-click the object on the page and select Settings. This will open theProfile Settings dialog box, see section 16.10.5 Profile Settings dialog box , page 74.
#1558567; r.6079/6079; en-US 19

7/21/2019 Manual Reporter
http://slidepdf.com/reader/full/manual-reporter 28/140
Managing objects in the report8
8.1.3 IR Histogram objects
When a report is created, the IR Histogram object will illustrate how pixels in the areatools of the image are distributed by plotting the number of pixels at each temperaturelevel.
Inserting IR Histogram objects
1. On your template page, place the cursor where you want the IR Histogram object toappear. The object will be inserted after and below the cursor.
2. On the Flir Reporter Professional tab, click . An empty object will nowappear on the page.
Note
To edit the IR Histogram settings, right-click the object on the page and select Settings. This will openthe Histogram Settings dialog box, see section 16.10.6 Histogram Settings dialog box , page 77.
8.1.4 IR Trending objects
The default behavior of the IR Trending object is that it automatically displays a trend forall IR Viewer objects in the report, once the report is created. You can also manually moveimages to the IR Trending object using a drag-and-drop operation.
Inserting IR Trending objects
1. On your template page, place the cursor where you want the IR Trending object to ap-pear. The object will be inserted after and below the cursor.
2. On the Flir Reporter Professional tab, click . An empty object will nowappear on the page and the Trending Settings dialog box will open (if the dialog boxdoes not open, right-click the object and select Settings).
3. On the Connect tab, do the following:
• Specify a parameter for the Yaxis. To do this click Add and select a label and valuein the left and right panes, respectively.
• Specify a parameter for the X axis: Time, Image sequence number or Text
Comment .
#1558567; r.6079/6079; en-US 20

7/21/2019 Manual Reporter
http://slidepdf.com/reader/full/manual-reporter 29/140
Managing objects in the report8
4. On the General tab, do the following:
• Under General , select options related to how the IR Trending object will bedisplayed.
• Under Trend range, select which images should be included in the IR Trendingobject.
• In the Threshold text box, enter a value that will display a horizontal baseline in theIR Trending object.
5. On the Prediction tab, do the following:
• Under Forecast , select the number of periods forward and backward for which thealgorithm will present a probable trend.
• Under Trend Regression type, select the algorithm that you want to use.
6. On the Color tab, select colors for various items in the IR Trending object.7. On the Line tab, select colors and line types for the lines that will be displayed in the
IR Trending object.
8. Click OK .
Note
To edit the IR Trending settings, right-click the object on the page and select Settings. This will open theTrending Settings dialog box.
8.1.5 Field objects
When you create your report, the Field object will automaticallydisplay values or textlinked to an infrared image.
Inserting Field objects
1. On your template page, place the cursor where you want the Field object to appear.The object will be inserted after and below the cursor.
Note
Field objects will not work if you insert them into a text box. Only Microsoft Word fields work in textboxes. However, Field objects work properly in Microsoft Word tables.
2. If there is more than one IR Viewer object on the page, the Select IR Image dialog boxwill be displayed. Select which IR Viewer object the Field object should be connectedto and click OK.
If there is only one IR Viewer object on the page, the Field object will automaticallybeconnected to that IR Viewer object.
#1558567; r.6079/6079; en-US 21

7/21/2019 Manual Reporter
http://slidepdf.com/reader/full/manual-reporter 30/140
Managing objects in the report8
3. On the Flir Reporter Professional tab, click . The Field Contents dialog box
will open.
4. Select the Image or Object Parameters values that you want the Field object todisplay.
5. Click OK .
6. The Field object with the contents you have selected will now appear on the page.
Note
To edit the Field contents, right-click the object on the page and select Contents. This will open the Field Contents dialog box.
8.1.6 Table objects
When you create your report, the Table object will automaticallydisplay the values of anymeasurement tools in the infrared image.
Inserting Table objects
1. On your template page, place the cursor where you want the Table object to appear.The object will be inserted after and below the cursor.
#1558567; r.6079/6079; en-US 22

7/21/2019 Manual Reporter
http://slidepdf.com/reader/full/manual-reporter 31/140
Managing objects in the report8
2. On the Flir Reporter Professional tab, click . The Table Contents dialog box
will be displayed.
3. For each item that you want to include in the table, do the following:
• In the left pane of the Table Items area, select an Object .• In the right pane of the Table Items area, select the Values that you want to display
in the Table object.
4. A structural preview of the table will be displayed in the Preview area, where you cando the following:
• To edit the label of a table item, double-click the item and enter a new label.• To remove an item from the table, click the item and then click Delete.• To change the order of the table items, click an item and then click Move Up or
Move Down.
5. Click OK .
6. The Table object with the contents you have selected will now appear on the page.
Note
• To edit the table contents, right-click the object on the page and select Contents. This will open theTable Contents dialog box.
• To link text comments to the Table object, see section Linking text comments to a Table object , page41.
• If a table is connected to an infrared image and you delete either the table or the image, you will notbe able to recreate the connection again.
8.1.7 Summary Table objects
When you create your report, the Summary Table object will automatically display valuesof the items you have chosen to include in the table.
Inserting Summary Table objects
1. On your template page, place the cursor where you want the Summary Table object toappear. The object will be inserted after and below the cursor.
#1558567; r.6079/6079; en-US 23

7/21/2019 Manual Reporter
http://slidepdf.com/reader/full/manual-reporter 32/140
Managing objects in the report8
2. On the Flir Reporter Professional tab, click . The Summary Table di-alog box will open.
3. For each item that you want to include in the Summary Table, do the following:
• In the left pane of the Columns area, select an object.• In the right pane of the Columns area, select the value that you want to display in
the Table object.
4. A structural preview of the Summary Table will be displayed in the Preview area.
To edit the label of an item, double-click the item in the Preview area and enter a newlabel.
5. Click OK .
6. The Summary Table object with the contents you have selected will now appear onthe page.
Note
To edit the Summary Table contents, right-click the object on the page and select Contents. This willopen the Summary Table dialog box.
8.2 Connecting objects
This description assumes that you have one IR Profile object and at least one IR Viewerobject on your template page.
The objects you connect must be on the same page when you connect them. If the docu-ment is repaginated and one of the objects falls on a different page, the connection will,however, still be maintained.
Connecting objects
1. Select the IR Profile object on the page.2. On the Flir Reporter Professional tab, click . The Select IR Image dialog
box will open.
3. Select the IR Viewer object that you want to connect the IR Profile object to.
4. Click OK .
#1558567; r.6079/6079; en-US 24
7/21/2019 Manual Reporter
http://slidepdf.com/reader/full/manual-reporter 33/140
Managing objects in the report8
8.3 Resizing objects
Resizing infrared objects
1. Select an IR Viewer, Digital Photo, IR Profile, IR Histogram, or IR Trending object onyour template page.
2. To change the size of the object, drag one of the handles.
Resizing Table and Summary Table objects
1. Select a Table or Summary Table object on your template page.
2. On the Microsoft Word contextual tab Table Tools, select the Layout tab and use thecontrols to change the size of the table.
8.4 Deleting objects
Deleting infrared objects
1. Select an IR Viewer, Digital Photo, IR Profile, IR Histogram, or IR Trending object onyour template page.
2. To delete the object, click .
Deleting Table and Summary Table objects
1. Select a Table or Summary Table object on your template page.
2. On the Microsoft Word contextual tab Table Tools, select the Layout tab. Click the De-
lete button and select Delete Table.
Deleting Field objects
Note
This procedure applies to Flir Reporter Professional Field objects only (not Microsoft Word fields).
1. Place the cursor just to the left of the Field object on your template page and clickonce. This will select the whole Field object.
2. Press DELETE on your keyboard twice.
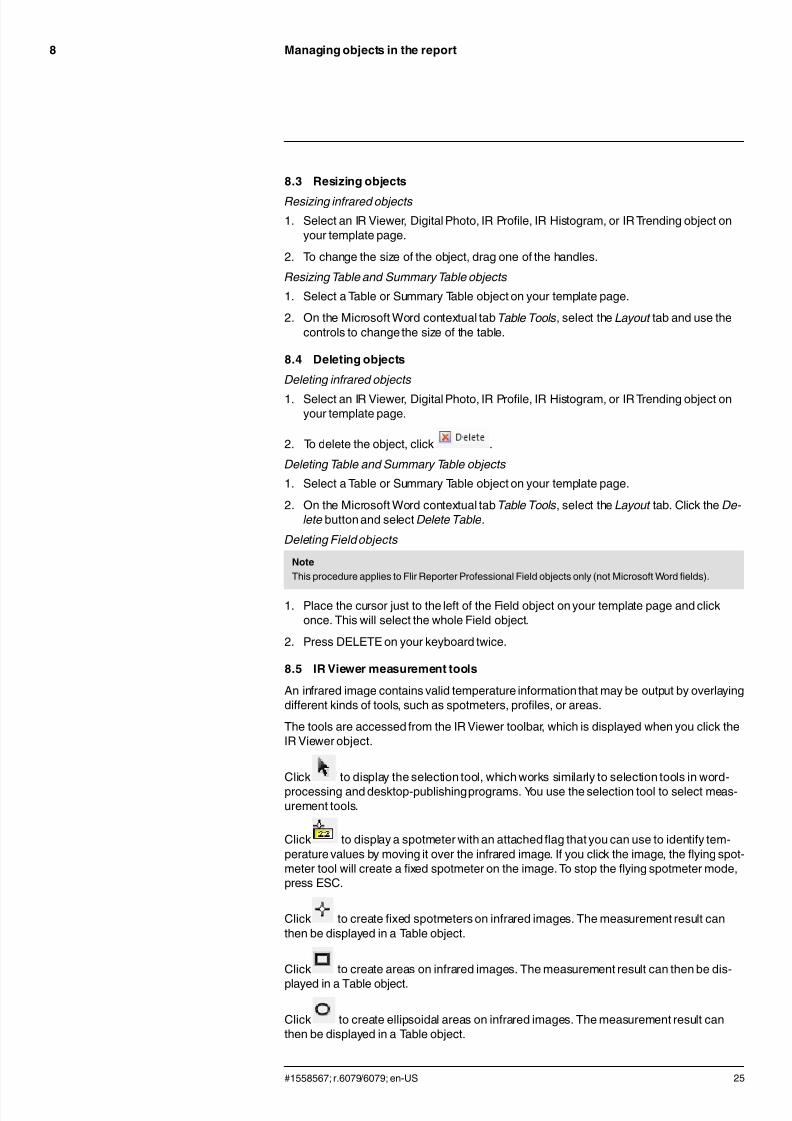
8.5 IR Viewer measurement tools
An infrared image contains valid temperature information that may be output by overlayingdifferent kinds of tools, such as spotmeters, profiles, or areas.
The tools are accessed from the IR Viewer toolbar, which is displayed when you click theIR Viewer object.
Click to display the selection tool, which works similarly to selection tools in word-processing and desktop-publishingprograms. You use the selection tool to select meas-urement tools.
Click to display a spotmeter with an attached flag that you can use to identify tem-perature values by moving it over the infrared image. If you click the image, the flying spot-meter tool will create a fixed spotmeter on the image. To stop the flying spotmeter mode,press ESC.
Click to create fixed spotmeters on infrared images. The measurement result canthen be displayed in a Table object.
Click to create areas on infrared images. The measurement result can then be dis-
played in a Table object.
Click to create ellipsoidal areas on infrared images. The measurement result canthen be displayed in a Table object.
#1558567; r.6079/6079; en-US 25

7/21/2019 Manual Reporter
http://slidepdf.com/reader/full/manual-reporter 34/140
Managing objects in the report8
Click to create polygon areas on infrared images. The measurement result can thenbe displayed in a Table object.
Click to create a line on infrared images. The measurement result can then be dis-played in an IR Profile object.
Click to create a bent line on infrared images. The measurement result can then bedisplayed in an IR Profile object.
Click to calculate the difference between two temperatures—for example, two spot-meters, or a spotmeter and the maximum temperature in the image. The result from thecalculation will be displayed both as a ToolTip and as a result in the result table. Using this
toolbar button requires you to have laid out at least one measurement function on yourimage.
Click to create a marker that you can move anywhere in an image and point to anarea of interest.
Click to display a menu where you can do one of the following:
• Insert an isotherm above a temperature level. This assigns a color to all temperaturesabove a certain temperature level in an image with one preset color.
• Insert an isotherm below a temperature level. This assigns a color to all temperaturesbelow a certain temperature level in an image with one preset color.
• Set an isotherm color that is displayed when the camera detects an area where theremay be a risk of humidity in the building structure (a humidity alarm).
• Set an isotherm color that is displayed when the camera detects what may be an insu-lation deficiency in a wall (an insulation alarm).
• Insert an isotherm between two temperature levels. This assigns a color to all tempera-tures between two temperature levels in an image with one preset color.
For more information about isotherm settings, see section 16.10.3.2 Isotherms tab, page64.
Click to draw a rectangle around the area that you want to zoom in on. When youare in zoom mode, a thumbnail image will appear in the top right corner, indicating the lo-cation of the area you have zoomed in to. You can move the area by clicking and holdingdown the left mouse button, then moving the mouse in any direction. To leave the zoommode, either select 1× on the Zoom menu or press the space bar on the keyboard.
Click to open the Image Fusion dialog box. For more information on image fusion,see section 8.7 Image fusion, page 32.
Click to turn on/off grid lines in the IR Viewer object. For more information about thegrid tool, see section 8.5.2 Using the Grid tool , page 27.
8.5.1 Managing the measurement tools
Once you have added measurement tools such as spotmeters, areas, and markers to anIR Viewer object, you can apply actions such as moving, cloning, and deleting to them.
#1558567; r.6079/6079; en-US 26

7/21/2019 Manual Reporter
http://slidepdf.com/reader/full/manual-reporter 35/140

7/21/2019 Manual Reporter
http://slidepdf.com/reader/full/manual-reporter 36/140
Managing objects in the report8
5. The Image Settings dialog box will open. Select the Grid Settings tab.
6. Set the grid size to a value of your choice.7. Click one of the option buttons and do one of the following:
• Enter values for distance and and FOV (field of view).• Select a line from the drop-down list and specify the length of the line.
8. Click OK .
9. Select on the IR Viewer object toolbar and move the grid to the desired position.For example, you may want to align the grid with certain structures in the image, areasof interest, etc.
10. To lock the grid relative to the image, check the box Lock Grid Position on the Grid
Settings tab and click OK .
8.6 Formulas
8.6.1 General
Flir Reporter Professional allows you to carry out advanced calculations on various itemsin the infrared image. A formula can contain all common mathematical operators andfunctions (+, –, ×, ÷, etc). Also, numerical constants such as π can be used.
Most importantly, references to measurement results, other formulas, and other numericaldata can be inserted into formulas.
Note
A formula can onlyoperate on a single infrared image: it cannot calculate, for example, differences be-tween two infrared images.
A major new feature introduced in Flir Reporter Professional version 8.5 SP1 is the abilityto use any existing MeterLink data in the infrared image as a value in a formula, in thesame way as you would use a measurement value. MeterLink data can be stored in the in-
frared image by using an external Extech sensor—such as a clamp meter or a moisturemeter—together with the infrared camera.
#1558567; r.6079/6079; en-US 28
7/21/2019 Manual Reporter
http://slidepdf.com/reader/full/manual-reporter 37/140

7/21/2019 Manual Reporter
http://slidepdf.com/reader/full/manual-reporter 38/140
Managing objects in the report8
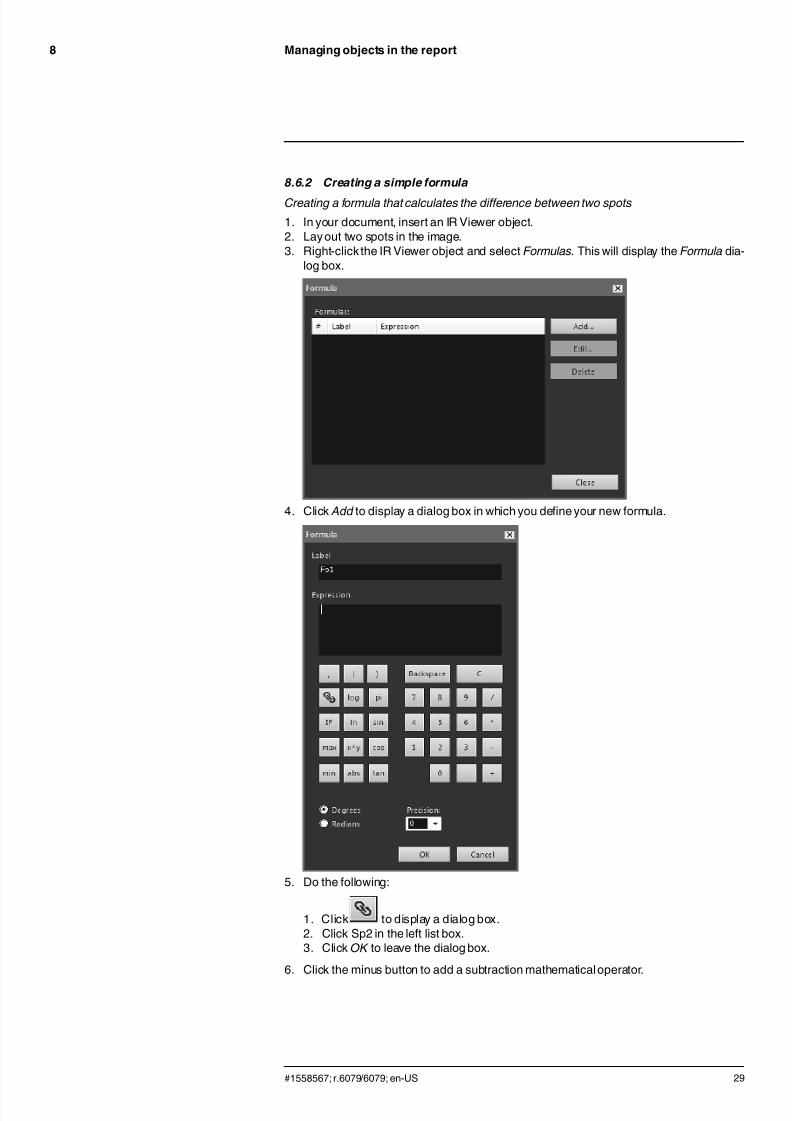
7. Do the following:
1. Click to display a dialog box.2. Click Sp1 in the left list box.3. Click OK to leave the dialog box.
8. The Formula dialog box will now display your formula using Flir Systems syntax:
9. Click OK to leave the Formula dialog box.10. Click Close.11. Place the cursor below the IR Viewer object and insert a Table object. The Table Con-
tents dialog box will open.12. Do the following:
1. In the left pane of the Table Items area, double-click Formula and select the formu-la you have created. Formulas are indicated by the Fo prefix.
2. In the right pane of the Table Items area, check the Values box.
A structural preview of the Table will be displayed in the Preview area.
3. Click OK .
13. The formula result is now displayed in your Table object.
8.6.3 Creating a conditional formula
For some applications, you may, for example, want to display the result of a calculation ina green font color if the result is lower than a critical value, and in a red font color if the re-sult is higher than the critical value.
You do this by creating a conditional formula using the IF statement.
Creating a conditional formula using the IF statement
1. Repeat Steps 1.–10. in the procedure in section 8.6.2 Creating a simple formula, page29.
2. Right-click the IR Viewer object and select Formulas.3. Do the following:
1. Click Add to display a dialog box in which you define your new formula.2. Click the IF button to display a new dialog box.
#1558567; r.6079/6079; en-US 30

7/21/2019 Manual Reporter
http://slidepdf.com/reader/full/manual-reporter 39/140
Managing objects in the report8
4. You will now set up a conditional formula that displays the result from the Fo1 formula
in red if the value is higher than 2.0 degrees, and in green if the value is lower than 2.0degrees.
Do the following:
1. Click to the right of the Logical test text box, select Fo1 from the left drop-down list, and click OK .
2. In the Logical test text box, enter >2.0. This will be your condition.
3. Click to the right of the Value if true text box, select Fo1 from the left drop-down list, and click OK .
4. Click Default Color to the right of the Value if true text box and select the color red.
5. Click to the right of the Value if false text box, select Fo1 from the left drop-down list, and click OK .6. Click Default Color to the right of the Value if false text box and select the color
green.
7. Click OK to leave the dialog box.
#1558567; r.6079/6079; en-US 31
7/21/2019 Manual Reporter
http://slidepdf.com/reader/full/manual-reporter 40/140
Managing objects in the report8
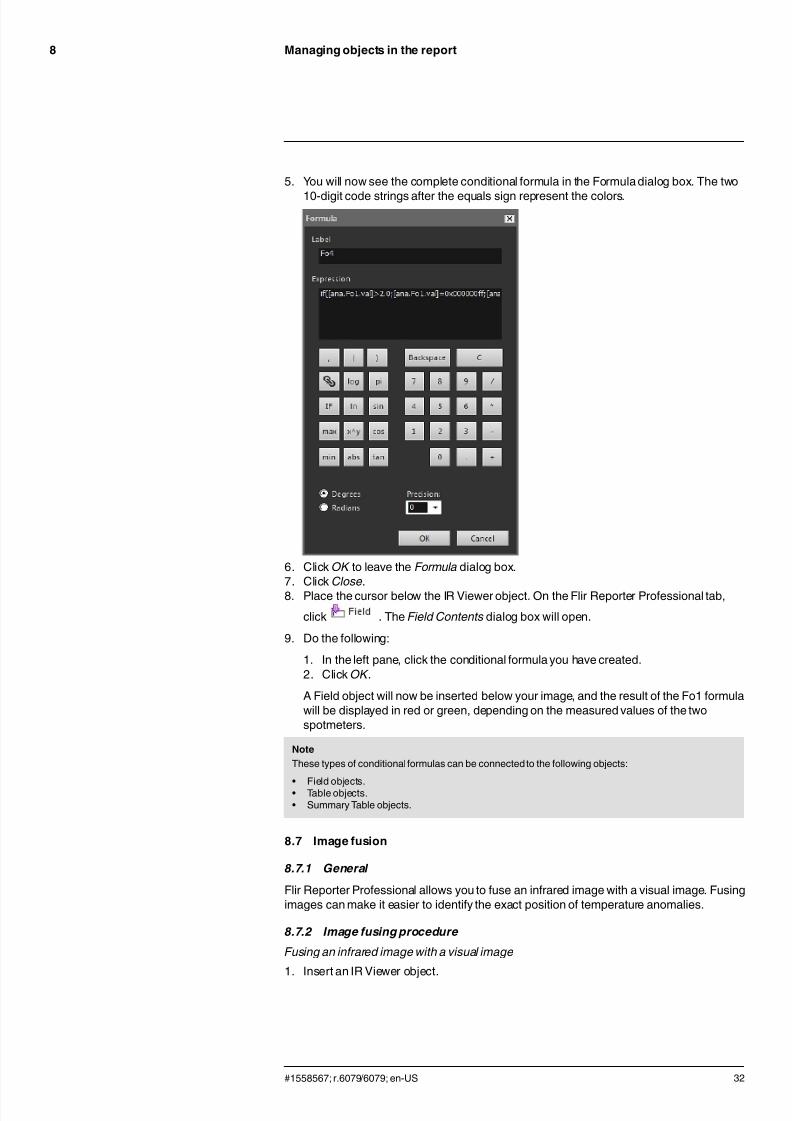
5. You will now see the complete conditional formula in the Formula dialog box. The two
10-digit code strings after the equals sign represent the colors.
6. Click OK to leave the Formula dialog box.7. Click Close.8. Place the cursor below the IR Viewer object. On the Flir Reporter Professional tab,
click . The Field Contents dialog box will open.
9. Do the following:
1. In the left pane, click the conditional formula you have created.2. Click OK .
A Field object will now be inserted below your image, and the result of the Fo1 formulawill be displayed in red or green, depending on the measured values of the twospotmeters.
Note
These types of conditional formulas can be connectedto the following objects:
• Field objects.• Table objects.• Summary Table objects.
8.7 Image fusion
8.7.1 General
Flir Reporter Professional allows you to fuse an infrared image with a visual image. Fusingimages can make it easier to identify the exact position of temperature anomalies.
8.7.2 Image fusing procedure
Fusing an infrared image with a visual image
1. Insert an IR Viewer object.
#1558567; r.6079/6079; en-US 32
7/21/2019 Manual Reporter
http://slidepdf.com/reader/full/manual-reporter 41/140
Managing objects in the report8
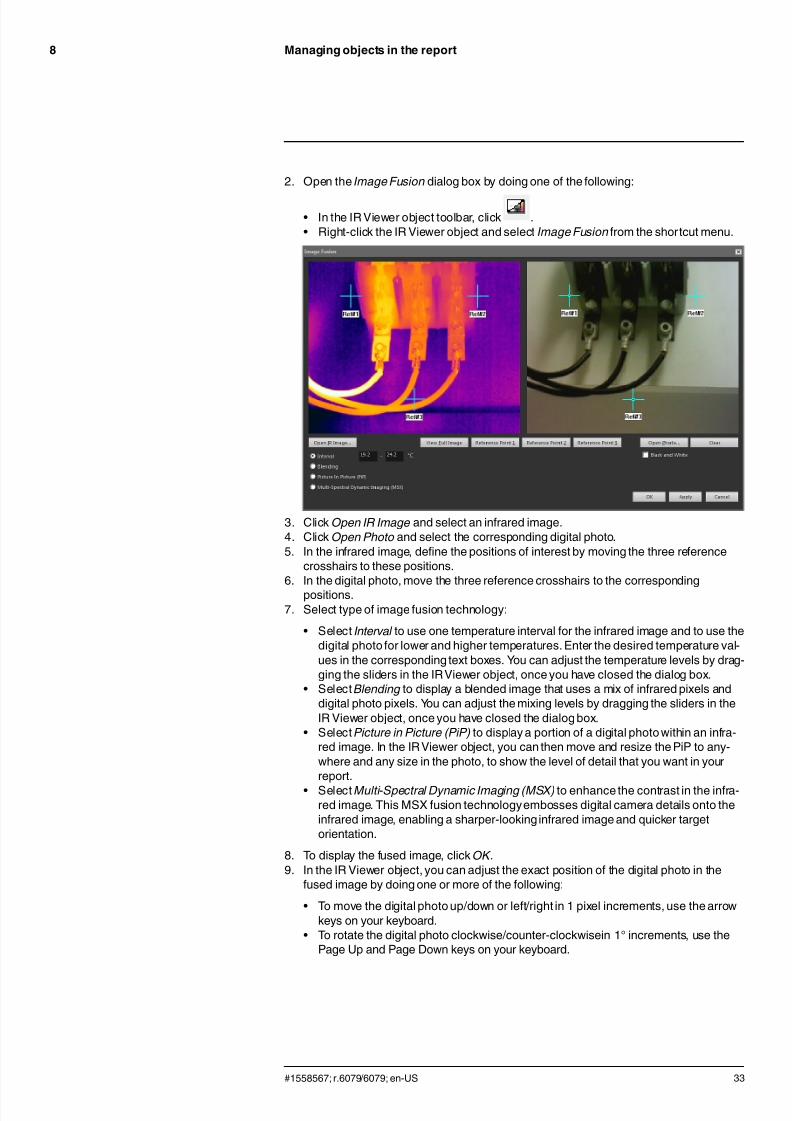
2. Open the Image Fusion dialog box by doing one of the following:
• In the IR Viewer object toolbar, click .• Right-click the IR Viewer object and select Image Fusion from the shortcut menu.
3. Click Open IR Image and select an infrared image.4. Click Open Photo and select the corresponding digital photo.5. In the infrared image, define the positions of interest by moving the three reference
crosshairs to these positions.6. In the digital photo, move the three reference crosshairs to the corresponding
positions.7. Select type of image fusion technology:
• Select Interval to use one temperature interval for the infrared image and to use thedigital photo for lower and higher temperatures. Enter the desired temperature val-ues in the corresponding text boxes. You can adjust the temperature levels by drag-ging the sliders in the IR Viewer object, once you have closed the dialog box.
• Select Blending to display a blended image that uses a mix of infrared pixels anddigital photo pixels. You can adjust the mixing levels by dragging the sliders in theIR Viewer object, once you have closed the dialog box.
• Select Picture in Picture (PiP) to display a portion of a digital photo within an infra-red image. In the IR Viewer object, you can then move and resize the PiP to any-where and any size in the photo, to show the level of detail that you want in yourreport.
• Select Multi-Spectral Dynamic Imaging (MSX) to enhance the contrast in the infra-red image. This MSX fusion technologyembosses digital camera details onto theinfrared image, enabling a sharper-looking infrared image and quicker targetorientation.
8. To display the fused image, click OK .9. In the IR Viewer object, you can adjust the exact position of the digital photo in the
fused image by doing one or more of the following:
• To move the digital photo up/down or left/right in 1 pixel increments, use the arrowkeys on your keyboard.
• To rotate the digital photo clockwise/counter-clockwisein 1° increments, use thePage Up and Page Down keys on your keyboard.
#1558567; r.6079/6079; en-US 33
7/21/2019 Manual Reporter
http://slidepdf.com/reader/full/manual-reporter 42/140
Managing objects in the report8
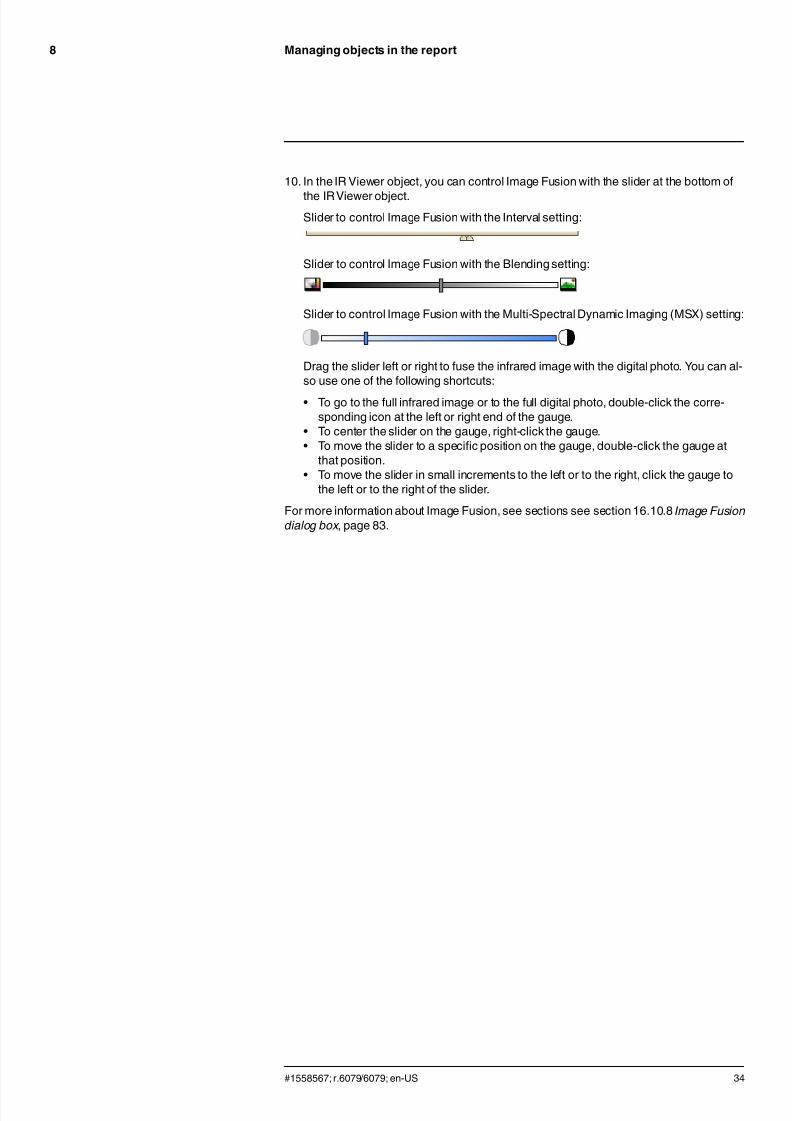
10. In the IR Viewer object, you can control Image Fusion with the slider at the bottom of
the IR Viewer object.Slider to control Image Fusion with the Interval setting:
Slider to control Image Fusion with the Blending setting:
Slider to control Image Fusion with the Multi-Spectral Dynamic Imaging (MSX) setting:
Drag the slider left or right to fuse the infrared image with the digital photo. You can al-so use one of the following shortcuts:
• To go to the full infrared image or to the full digital photo, double-click the corre-sponding icon at the left or right end of the gauge.
• To center the slider on the gauge, right-click the gauge.• To move the slider to a specific position on the gauge, double-click the gauge at
that position.• To move the slider in small increments to the left or to the right, click the gauge to
the left or to the right of the slider.
For more information about Image Fusion, see sections see section 16.10.8 Image Fusion
dialog box , page 83.
#1558567; r.6079/6079; en-US 34
7/21/2019 Manual Reporter
http://slidepdf.com/reader/full/manual-reporter 43/140
Creating a report template9
9.1 General
Flir Reporter Professional ships with several different report templates (Microsoft Word *.dotx files). If these templates do not meet your needs, you can create your own custom in-frared report templates.
9.1.1 Few or many report templates?
It is not uncommonthat you will use one specific template for one specific customer. If thisis the case, you may want to include your customer’s company-specific information in thetemplate, rather than entering it manually after the infrared report has been generated.
However, if several of your customers request an infrared report that could be met usingone template, or just a few, company-specific information should probably not be includedin the template, since that kind of information may easily be entered after the Standard FlirReport Wizard, Advanced Flir Report Wizard or Rapid Report Manager has generated
the report.9.1.2 Typical structure
A custom infrared report template usually consists of the following types of pages:
• A front cover.• A number of different pages, containingcombinations of IR Viewer objects, Digital Pho-
to objects, IR Histogram objects, IR Profile objects, Table objects, Summary Table ob- jects, etc.
• A back cover.
You create the front and back covers of the report template using existing features in Mi-crosoft Word.
The front and back covers of an infrared report template typically include the following
information:• Your and your customer’s company names.• Other contact information.• The current date.• The title of the infrared report.• Your and your customer’s company logos.• Any additional artwork or information that you may want to include.
9.1.3 A note about working in the Microsoft Word environment
Due to the fact that Flir Reporter Professional is an add-in to Microsoft Word, basically allexisting features you usually use when creating a Microsoft Word document template canbe used when creating your report templates.
Flir Reporter Professional adds a number of commands that are specific to the industry ofinfrared imaging and reporting, and these commands can be accessed on the Flir Report-er Professional tab.
You use these features, along with the usual Microsoft Word features, when you create in-frared report templates.
Note
Creating a report template requires skill in creating document templates in Microsoft Word. For more in-formationabout this, refer to your Microsoft Word documentation, or to the Microsoft Word online help.
When creating a custom report template, you may find it useful to select Show/Hide ¶ on the Home tabin Microsoft Word.
9.2 Creating a custom infrared report template
You can create a custom infrared report template from a blank Microsoft Word template.The easiest way, however, is to create a report template by modifying an existing tem-plate. By doing this, you can take advantage of the existing infrared objects already laid
#1558567; r.6079/6079; en-US 35

7/21/2019 Manual Reporter
http://slidepdf.com/reader/full/manual-reporter 44/140
Creating a report template9
out on the report template page, and you will save a lot of time compared with creating an
infrared report template from scratch.You can create a report template in three different ways:
• Customize a basic report template.• Modify an existing report template.• Create a report template from a blank Microsoft Word template.
Customizing a basic report template
1. In Flir Report Center, select Create a report template from the Tools menu. This willopen the New Template dialog box.
2. Enter a template name and click OK .3. A report template with a basic layout opens. Follow the instructions in the document to
modify the report template. You can also customize the report template by adding andremoving objects and by modifyingthe properties of the objects as described in sec-tion 8 Managing objects in the report , page 19.
4. Save the new infrared report template. Make sure that you save the template with the*.dotx file name extension.
Modifying an existing template
1. Start Microsoft Word, but make sure that all infrared reports are closed.2. On the File tab, click New .
3. Under Available Templates, select My templates.4. On the IR tab, select the infrared report template that you want to use. Under Create
New , select Template.5. Click OK .6. To avoid overwriting the original template, save the template under a different filename
before making any changes. When saving it, make sure that you save it with the *.dotxfile name extension.
7. Make your changes to the original template by adding and removing objects and bymodifying the properties of the objects as described in section 8 Managing objects inthe report , page 19.
8. Save the new infrared report template. Make sure that you save the template with the*.dotx file name extension.
Create a report template from a blank Microsoft Word template
1. Start Microsoft Word, but make sure that all infrared reports are closed.2. On the File tab, click New .3. Under Available Templates, select My templates.4. On the Personal Templates tab, select Blank Document . Under Create New , select
Template.5. Click OK .6. Create your report template by adding and removing objects and by modifying the
properties of the objects as described in section 8 Managing objects in the report ,page 19.
7. Save the new infrared report template. Make sure that you save the template with the*.dotx file name extension.
#1558567; r.6079/6079; en-US 36
7/21/2019 Manual Reporter
http://slidepdf.com/reader/full/manual-reporter 45/140
Rapid Report Manager10
With Rapid Report Manager, you can create one or more Rapid Report Manager icons on
your Desktop, each having different settings and using different report templates.To create a report, you drag-and-drop infrared and/or visual images onto a Rapid ReportManager icon. The report will be created in the background and opened as a MicrosoftWord document.
The valid file format for a Rapid Report Manager file is *.r8r.
Creating a Rapid Report Manager icon on the Desktop
1. Start Rapid Report Manager by doing one of the following:
• Select Rapid Report from the Start menu (Start > All Programs > Flir Systems > Flir Reporter Professional > Rapid Report ).
• In Flir Report Center, select Configure Rapid Report Manager from the Tools pane.
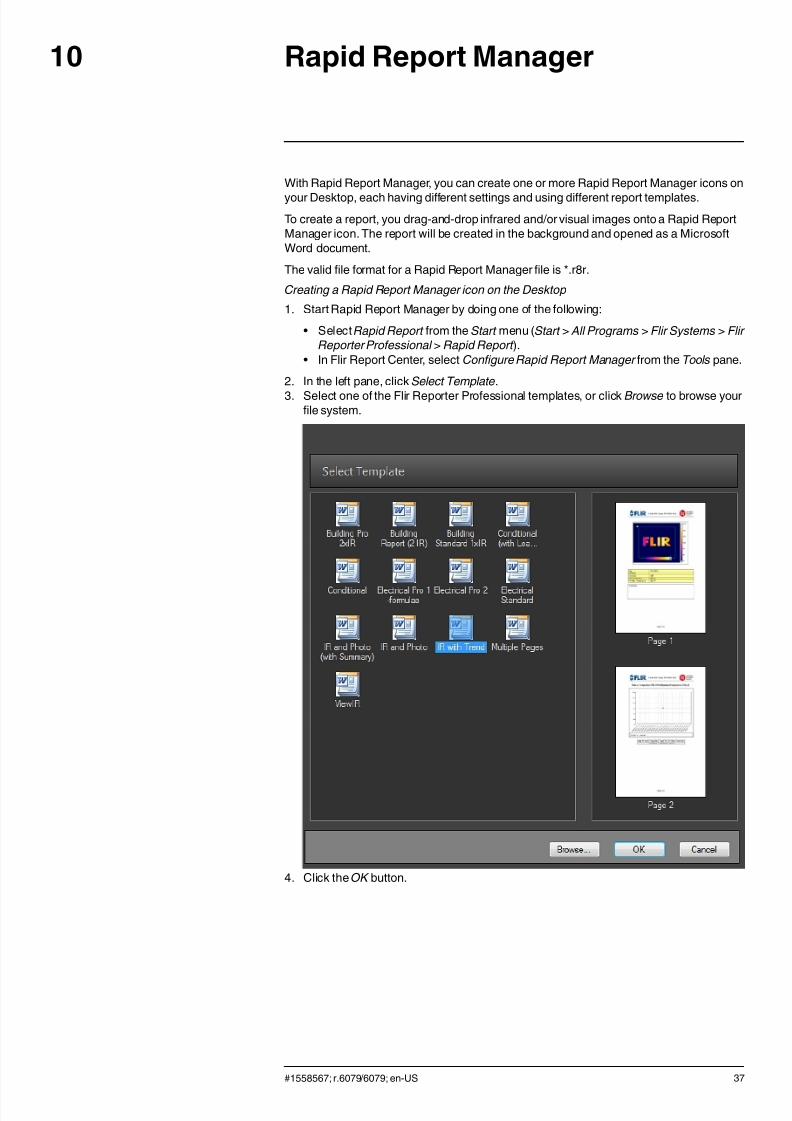
2. In the left pane, click Select Template.
3. Select one of the Flir Reporter Professional templates, or click Browse to browse yourfile system.
4. Click the OK button.
#1558567; r.6079/6079; en-US 37

7/21/2019 Manual Reporter
http://slidepdf.com/reader/full/manual-reporter 46/140
7/21/2019 Manual Reporter
http://slidepdf.com/reader/full/manual-reporter 47/140
Document properties11
11.1 General
When creating an infrared report, Flir Reporter Professional extracts the Microsoft Worddocument properties for the report template and inserts these properties into correspond-ing Microsoft Word fields in the final report.
You can use these document properties to automate several time-consumingtasks whencreating a report. For example, you may want Flir Reporter Professional to automaticallyadd information such as the name, address, and e-mail address of the inspection site, themodel name of the camera that you are using, and your e-mail address.
11.2 Types of document properties
There are two different types of document properties:
• Summary document properties.• Custom document properties.
For the former, you can only change the values, but for the latter you can change both thelabels and the values.
11.3 Creating and editing Microsoft Word document properties
Creating and editing document properties
1. Start Microsoft Word and open one of your infrared report templates (*.dotx). You canlocate the report templates that are shipped with Flir Reporter Professional by typingthe following path:
C:\Documentsand Settings\[Your user name]\Application Data\Microsoft\Templates \IR
2. On the File tab, click Info.3. From the Properties download menu, select Advanced Properties.
4. On the Summary tab, enter your information in the appropriate text boxes.5. Click the Custom tab.6. To add a custom property, type a name in the Name box. To make your custom prop-
erties easy to find, you can type an underscore ( _ ) as the first character in the nameof the property.
7. Use the Type box to specify the type of property.8. To specify the value of the property, type it in the Value box.9. Click Add to add the custom property to the list of properties, and then click OK .
10. Save the infrared report template using a different filename but with the same filenameextension (*.dotx). You have now added summary and custom properties to your re-named infrared report template.
Note
• If you want to change the name of a custom document property, due to how the Custom tab of theProperties dialog box in Microsoft Word works, the only way to do this is to delete it and then recre-ate it. If you want to move a document property up or down, the whole list has to be recreated.
• A Microsoft Word field is not the same as a field inserted by clicking on the Field button on the FlirReporter Professional tab.
• You may find that a Flir Systems property has been added to your document automatically. Do not re-move this property. Flir Reporter Professional uses it to distinguishbetween infrared documents andother documents.
11.4 Creating a Microsoft Word field and linking the field to a document property
Note
This descriptionassumes that you have created summary and custom properties according to section11.3 Creating and editing Microsoft Word document properties, page 39.
Creating and linking a Microsoft Word field
1. In your infrared report or report template, put the cursor where you want to insert thefield.
#1558567; r.6079/6079; en-US 39

7/21/2019 Manual Reporter
http://slidepdf.com/reader/full/manual-reporter 48/140
Document properties11
2. On the Insert tab, click Quick Parts and select Field .
3. In the Field names box, select DocProperty .4. Select a property in the Property box.
5. Click OK .
#1558567; r.6079/6079; en-US 40

7/21/2019 Manual Reporter
http://slidepdf.com/reader/full/manual-reporter 49/140
Text comment files12
Flir Text File Editor is a part of Flir Reporter Professional. With Flir Text File Editor you can
create a text comment file that can be used when carrying out your infrared inspections.After having saved this text comment file to your hard disk drive and moving it to the cam-era on a CompactFlash card or an SD Memory Card, the text comments in the file will ap-pear in the camera software.
For example, you can set the camera to prompt you for a text comment every time yousave an image. The text comments you have created in Flir Text File Editor will be avail-able for selection in the camera to be saved with the image.
The valid file format for a text comment file is *.tcf.
12.1 Creating a text comment file
Creating a text comment file
1. Start the Flir Text File Editor by doing one of the following:• Select Edit Text Annotation or Emissivity file from the Start menu (Start > All Pro-
grams > Flir Systems > Flir Reporter Professional > Edit Text Annotation or Emis-
sivity file).• In Flir Report Center, select Edit Text Annotation or Emissivity file from the Report
pane.
2. On the File menu, click New > Text Comment .
To create a new text comment label, click at the top of the left pane and enter a la-bel name.
You can delete labels and move them up or down in the list by using the , , and
buttons at the top of the pane.
3. To create a new text comment value, click the label for which you want to create val-ues, and then click at the top of the right pane and enter a value. You use the but-tons at the top in the same way as when creating the labels.
4. When you have finished, save the text comment file to a CompactFlash or SD MemoryCard by clicking Save As on the File menu.
12.2 Linking text comments to a Table object in your report template
When carrying out large inspections of similar objects—e.g., radiators or air conditionersin every room in a large office building—you will save a lot of time if you add rows for textcomments in the table in your template, rather than adding these rows afterwards in the fi-nal report.
When you have finishedyour inspection and moved the infrared images from your camera
to your computer, Flir Reporter Professional will extract the text comments from your im-ages and insert them in the predefined rows in the Table object.
This requires that a “dummy” text comment is added to the IR Viewer object in the reporttemplate. This “dummy” text comment must have the same labels as the text comment filein the camera.
Linking text comments to a Table object
1. Start Microsoft Word and open one of your infrared report templates (*.dot). You canlocate the report templates that are shipped with Flir Reporter Professional by typingthe following path:
C:\Documentsand Settings\[Your user name]\Application Data\Microsoft\Templates \IR
#1558567; r.6079/6079; en-US 41
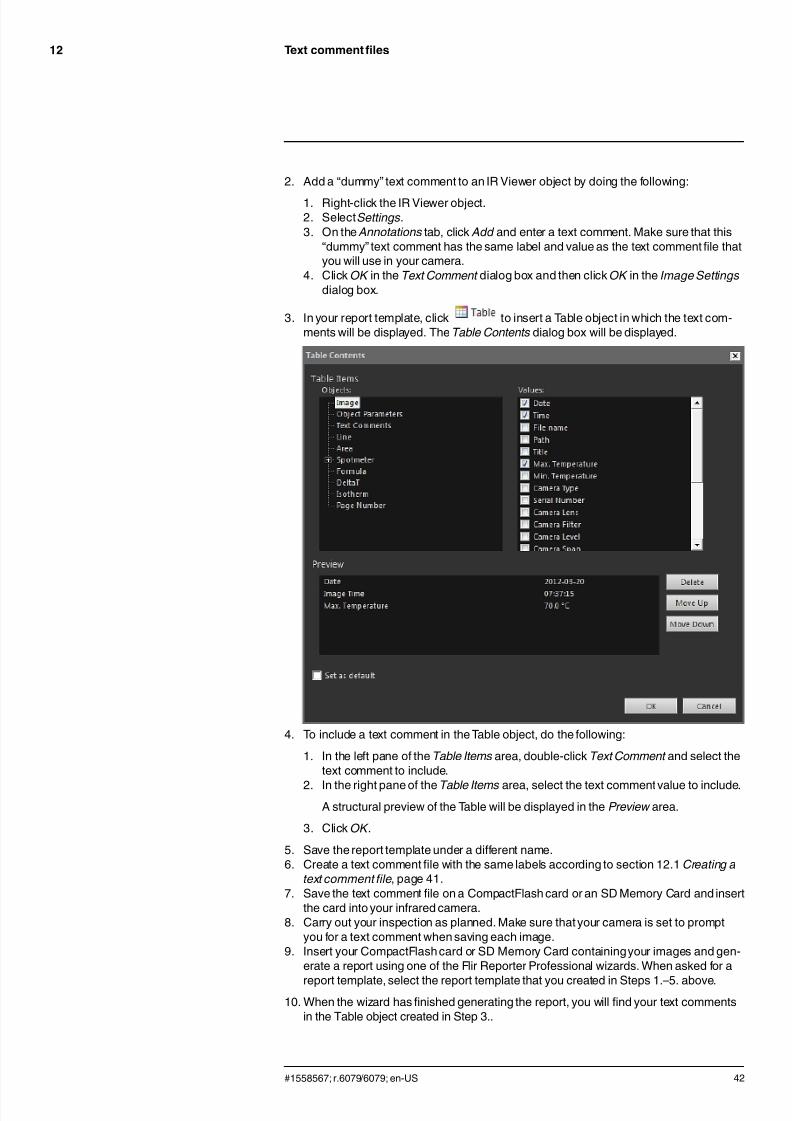
7/21/2019 Manual Reporter
http://slidepdf.com/reader/full/manual-reporter 50/140
Text comment files12
2. Add a “dummy” text comment to an IR Viewer object by doing the following:
1. Right-click the IR Viewer object.2. Select Settings.3. On the Annotations tab, click Add and enter a text comment. Make sure that this
“dummy” text comment has the same label and value as the text comment file thatyou will use in your camera.
4. Click OK in the Text Comment dialog box and then click OK in the Image Settings
dialog box.
3. In your report template, click to insert a Table object in which the text com-ments will be displayed. The Table Contents dialog box will be displayed.
4. To include a text comment in the Table object, do the following:
1. In the left pane of the Table Items area, double-click Text Comment and select thetext comment to include.
2. In the right pane of the Table Items area, select the text comment value to include.A structural preview of the Table will be displayed in the Preview area.
3. Click OK .
5. Save the report template under a different name.6. Create a text comment file with the same labels according to section 12.1 Creating a
text comment file, page 41.7. Save the text comment file on a CompactFlash card or an SD Memory Card and insert
the card into your infrared camera.8. Carry out your inspection as planned. Make sure that your camera is set to prompt
you for a text comment when saving each image.9. Insert your CompactFlash card or SD Memory Card containingyour images and gen-
erate a report using one of the Flir Reporter Professional wizards. When asked for a
report template, select the report template that you created in Steps 1.–5. above.10. When the wizard has finished generating the report, you will find your text comments
in the Table object created in Step 3..
#1558567; r.6079/6079; en-US 42
7/21/2019 Manual Reporter
http://slidepdf.com/reader/full/manual-reporter 51/140
Emissivity table files13
Flir Text File Editor is a part of Flir Reporter Professional. With Flir Text File Editor you can
create an emissivity table file that can be used when carrying out your infraredinspections.
After having saved this emissivity table file to your hard disk drive and moved it to thecamera on a CompactFlash card or an SD Memory Card, the text comments in the file willappear in the camera software. You can then set the emissivity from this emissivity tablefile when changing object parameters in the camera.
Definition: Emissivity is a value that specifies how much radiation an object emits, com-pared with the radiation of a theoretical reference object of the same temperature (calleda “blackbody”). For more information about emissivity, see sections 20 Thermographic
measurement techniques, page 99 and 24 Emissivity tables, page 118.
The valid file format for an emissivity table file is *.tcf.
13.1 Creating an emissivity table fileCreating an emissivity table file
1. Start the Flir Text File Editor by doing one of the following:
• Select Edit Text Annotation or Emissivity file from the Start menu (Start > All Pro-
grams > Flir Systems > Flir Reporter Professional > Edit Text Annotation or Emis-
sivity file).• In Flir Report Center, select Edit Text Annotation or Emissivity file from the Report
pane.
2. On the File menu, click New > Emissivity Table.
To create a new emissivity label, click at the top of the left pane and enter a labelname.
You can delete labels and move them up or down in the list by using the , , and
buttons at the top of the pane.
If you don’t need a subgroup for a material, you can enter the emissivity value at thisstage, e.g., iron = 0.21.
3. To create a subgroup for a material, click the label for which you want to create the
subgroup, and then click at the top of the right pane.
You use the buttons at the top in the same way as when creating the labels.
4. When you have finished, save the emissivity table file to a CompactFlash or SD Mem-ory Card by clicking Save As on the File menu.
#1558567; r.6079/6079; en-US 43

7/21/2019 Manual Reporter
http://slidepdf.com/reader/full/manual-reporter 52/140
Panorama images14
The Flir Panorama Tool is a part of Flir Reporter Professional. With the Flir Panorama Tool
you can combine several images into a larger image. This is useful, for example, whenyou need to inspect objects larger than the camera’s field of view.
For more information about the Flir Panorama Tool, see section 16.14 Flir Panorama Tool ,page 87.
Creating a panorama image
1. Start the Flir Panorama Tool from Flir Report Center by selecting Create panorama im-
ages from the Tools pane.2. If the images that you want to combine are all stored in the same folder, do the
following:
• In the left pane, select the folder with the images that you want to combine.
3. If the images that you want to combine are stored in different folders, do the following:
• In the left pane, select a folder.• In the center pane, select the images that you want to include and click Add To
Quick Collection.• Repeat the two steps above until all the images are added to the Quick Collection
folder.
• In the upper part of the left pane, click to display the Quick Collection folder.
4. In the upper part of the window, click Analyze.
#1558567; r.6079/6079; en-US 44
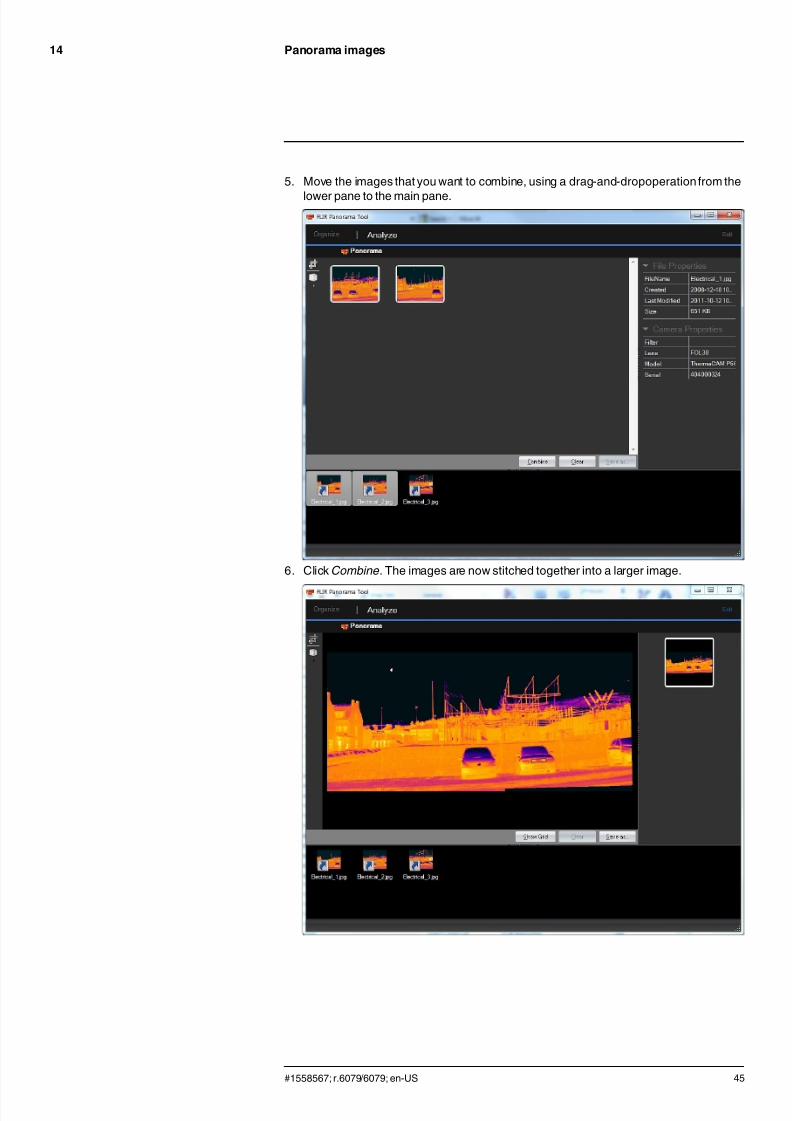
7/21/2019 Manual Reporter
http://slidepdf.com/reader/full/manual-reporter 53/140
Panorama images14
5. Move the images that you want to combine, using a drag-and-dropoperation from the
lower pane to the main pane.
6. Click Combine. The images are now stitched together into a larger image.
#1558567; r.6079/6079; en-US 45

7/21/2019 Manual Reporter
http://slidepdf.com/reader/full/manual-reporter 54/140
Panorama images14
7. (Optional) Do one of the following:
• Click to crop the image. This will display a frame with eight handles. By drag-ging the handles you can decide which areas of the image will be removed.
• Click and then click or to perform a perspective correction.This will display two vertical or two horizontal lines on the image, respectively. Bydragging the line handles, you can align the lines to edges in the image that youknow should be parallel, such as two doors or two balconies. The perspective willthen be corrected according to how you have aligned the lines.
Valid for all tools:Click to confirmand to cancel the operation.
8. Once the operation is complete, you can save the image to any location by clickingSave As.
#1558567; r.6079/6079; en-US 46

7/21/2019 Manual Reporter
http://slidepdf.com/reader/full/manual-reporter 55/140
Converting radiometric sequencefiles
15
With the Flir AVI Wizard you can convert a radiometric sequence file (*.seq) to an *.avi
file.The AVI format stands for Audio Video Interlaced and was created by Microsoft and intro-duced along with Windows 3.1. It is one of the most widespread semi-professional videoformats and will let you or your recipients view the converted sequence file in a variety ofvideo applications.
Valid file formats:
• The valid file format for a radiometric sequence file is *.seq.• The valid file format for an AVI file is *.avi.
15.1 Converting a radiometric sequence file to an AVI file
Converting a radiometric sequence file to an AVI file
1. Start the Flir AVI Wizard by doing one of the following:• Select Create AVI-movie from sequence from the Start menu (Start > All Programs
> Flir Systems > Flir Reporter Professional > Create AVI-movie from sequence).• In Flir Report Center, select Convert burst recordings to AVI video clips from the
Report pane.
2. Click Next to continue. This will display the Open File dialog box.3. Click Open to locate the file that you want to convert.4. By default the converted file will be saved in the same location with the new file name
extension (*.avi). You can specify a different filename and location by clicking .5. Click Next to continue.6. Do the following:
1. Select which video compression algorithm that you want to use—Microsoft video
(recommended) or Additional codecs.2. Specify the frame rate, which is the number of frames that will be displayed per
second.3. Click Next to continue.
7. Click Finish to create your AVI file.
#1558567; r.6079/6079; en-US 47
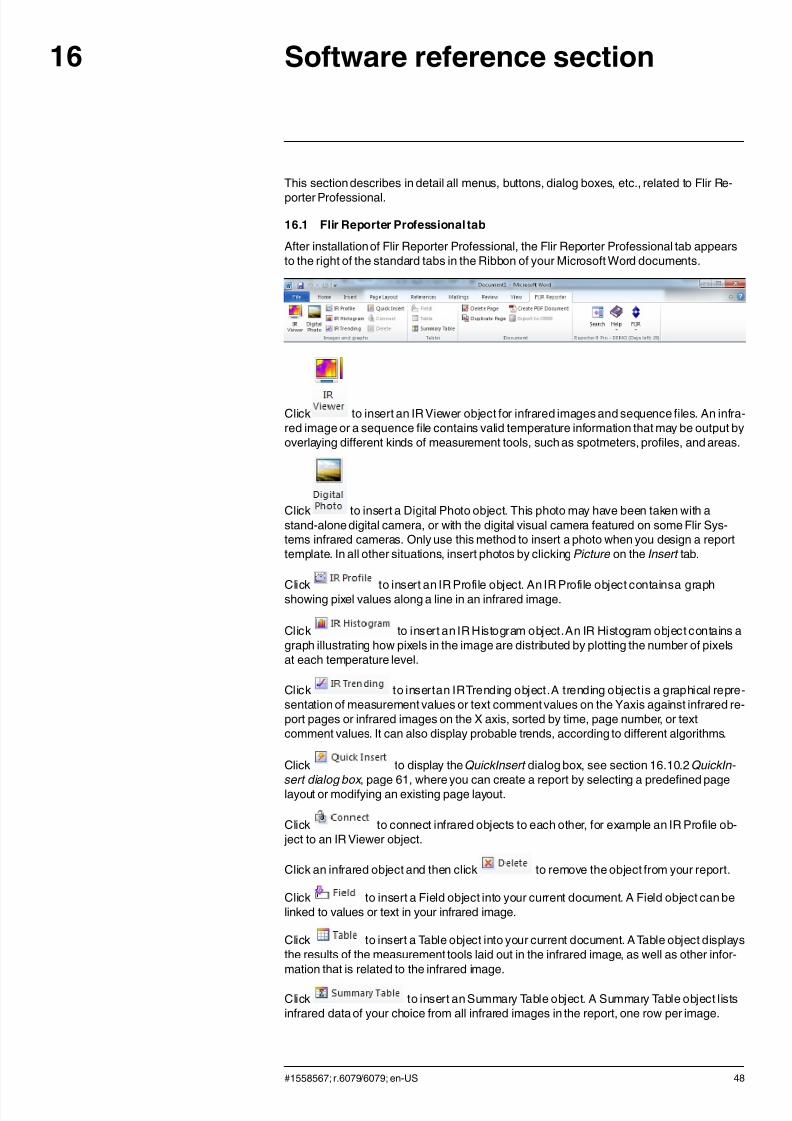
7/21/2019 Manual Reporter
http://slidepdf.com/reader/full/manual-reporter 56/140
Software reference section16
This section describes in detail all menus, buttons, dialog boxes, etc., related to Flir Re-
porter Professional.
16.1 Flir Reporter Professional tab
After installation of Flir Reporter Professional, the Flir Reporter Professional tab appearsto the right of the standard tabs in the Ribbon of your Microsoft Word documents.
Click to insert an IR Viewer object for infrared images and sequence files. An infra-red image or a sequence file contains valid temperature information that may be output byoverlaying different kinds of measurement tools, such as spotmeters, profiles, and areas.
Click to insert a Digital Photo object. This photo may have been taken with astand-alone digital camera, or with the digital visual camera featured on some Flir Sys-tems infrared cameras. Only use this method to insert a photo when you design a reporttemplate. In all other situations, insert photos by clicking Picture on the Insert tab.
Click to insert an IR Profile object. An IR Profile object containsa graphshowing pixel values along a line in an infrared image.
Click to insert an IR Histogram object.An IR Histogram object contains agraph illustrating how pixels in the image are distributed by plotting the number of pixelsat each temperature level.
Click to insertan IRTrending object.A trending objectis a graphical repre-sentation of measurement values or text comment values on the Yaxis against infrared re-port pages or infrared images on the X axis, sorted by time, page number, or textcomment values. It can also display probable trends, according to different algorithms.
Click to display the QuickInsert dialog box, see section 16.10.2 QuickIn-
sert dialog box , page 61, where you can create a report by selecting a predefined pagelayout or modifying an existing page layout.
Click to connect infrared objects to each other, for example an IR Profile ob- ject to an IR Viewer object.
Click an infrared object and then click to remove the object from your report.
Click to insert a Field object into your current document. A Field object can belinked to values or text in your infrared image.
Click to insert a Table object into your current document. A Table object displaysthe results of the measurement tools laid out in the infrared image, as well as other infor-mation that is related to the infrared image.
Click to insert an Summary Table object. A Summary Table object listsinfrared data of your choice from all infrared images in the report, one row per image.
#1558567; r.6079/6079; en-US 48

7/21/2019 Manual Reporter
http://slidepdf.com/reader/full/manual-reporter 57/140
Software reference section16
Click to delete the current page.
Click to duplicatethe current page and insert the duplicate page afterthe current page.
Click to create an Adobe PDF document of the Microsoft Worddocument. Free software (Adobe Reader) for viewing and printing PDF files is availablefrom http://get.adobe.com/reader/.
Click to export the document to ThermaCAM Database99. This pro-gram is aimed at users who wish to bring systematic order to infrared inspection reportsproduced using Flir Reporter Professional. The program can also handle old reports pro-duced by earlier versions of Flir Systems' reporting software. For more information aboutThermaCAM Database 99, download the manual from http://support.flir.com.
Click to open the Search dialog box, see section 16.10.1 Search dialog box , page59.
Click to display the Flir submenu, see section 16.1.1 Flir submenu, page 49.
16.1.1 Flir submenu
The Flir submenu is displayed when you click on the Flir Reporter Professional tab:
Flir Report Center : Click to start Flir Report Center, see section 16.11 Flir Report Center ,page 84.
Check for updates: Click to check for program updates.
Select Units: Click to display a dialog box, where you can set temperature and distanceunits.
DB99 Settings: Click to display a dialog box, where you can set settings for ThermaCAMDatabase 99. This program is aimed at users who wish to bring systematic order to infra-red inspection reports produced using Flir Reporter Professional. The program can alsohandle old reports produced by earlier versions of Flir Systems' reporting software. Formore information about ThermaCAM Database 99, download the manual fromhttp://sup-port.flir.com.
Apply IR Viewer settings globally : This command is only enabled when an IR Viewer ob- ject has been selected. Click to apply the settings of the selected IR Viewer objectglobally.
Selected language: Click to display a dialog box where you can set language.
#1558567; r.6079/6079; en-US 49

7/21/2019 Manual Reporter
http://slidepdf.com/reader/full/manual-reporter 58/140
Software reference section16
About : Click to display a dialog box with information about the program version.
16.2 IR Viewer object
16.2.1 General
An IR Viewer object is a placeholder for infrared images and sequence files. An infraredimage contains valid temperature information that may be output by overlaying differentkinds of measurement tools, such as spotmeters, profiles, and areas.
The appearance of the IR Viewer object depends on whether an infrared image or a se-quence file is selected.
16.2.1.1 IR Viewer object with infrared image
The IR Viewer object with an infrared image contains the following information (numbersrefer to the figure above):
1. Infrared image.2. Temperature scale.3. Sliders to adjust the level and span. To auto-adjust an image for the best image bright-
ness and contrast, right-click one of the sliders. To move both sliders together, pressand hold SHIFTand move one of the sliders.
4. Indicates that the image file has a voice comment. Click to listen to the voicecomment.
5. Indicates that the image file has a text comment. Click to display the text comment.6. Indicates that the image file has embedded GPS data. Click the globe to display the
position on a map.If Image Fusion is applied, an additionalslider is displayed at the bottom of the IR Viewerobject. The appearance of the slider depends on the type of Image Fusion, as illustratedin the figures below.
Slider to control Image Fusion with the Interval setting:
Slider to control Image Fusion with the Blending setting:
Slider to control Image Fusion with the Multi-Spectral Dynamic Imaging (MSX) setting:
To control Image Fusion, drag the slider left or right to fuse an infrared image with a digitalphoto. You can also use one of the following shortcuts:
#1558567; r.6079/6079; en-US 50
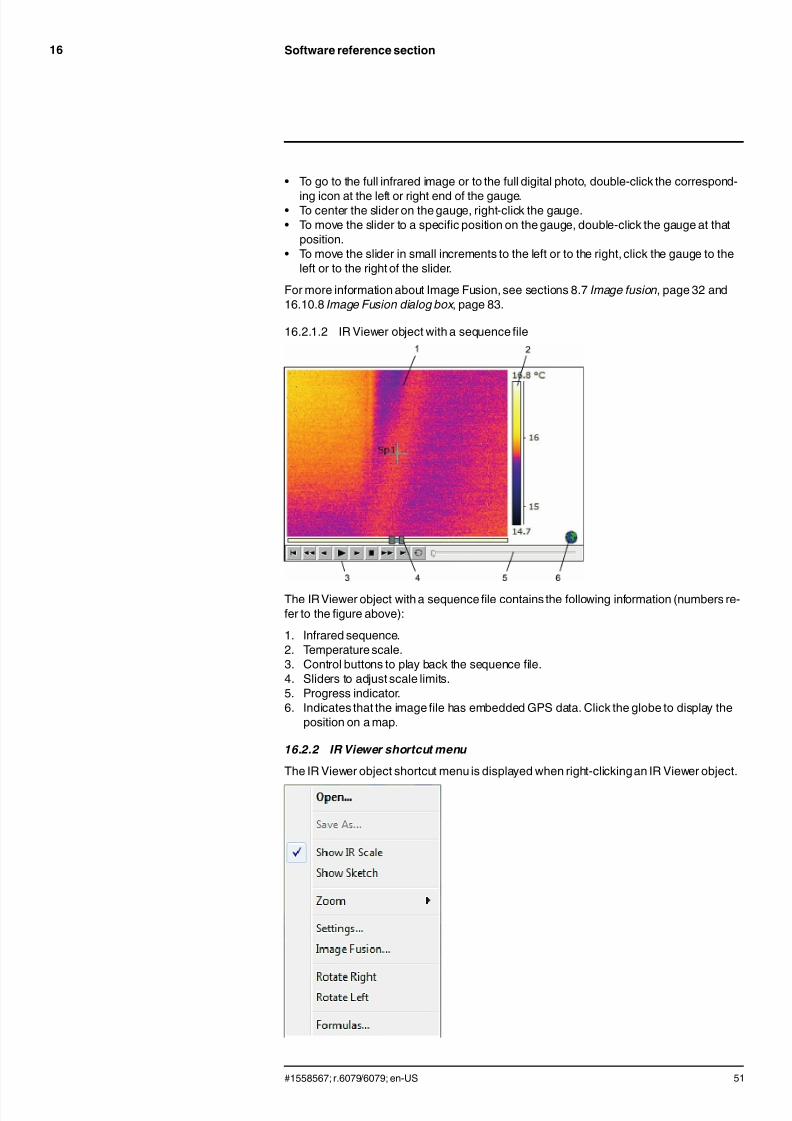
7/21/2019 Manual Reporter
http://slidepdf.com/reader/full/manual-reporter 59/140
Software reference section16
• To go to the full infrared image or to the full digital photo, double-click the correspond-
ing icon at the left or right end of the gauge.• To center the slider on the gauge, right-click the gauge.• To move the slider to a specific position on the gauge, double-click the gauge at that
position.• To move the slider in small increments to the left or to the right, click the gauge to the
left or to the right of the slider.
For more information about Image Fusion, see sections 8.7 Image fusion, page 32 and16.10.8 Image Fusion dialog box , page 83.
16.2.1.2 IR Viewer object with a sequence file
The IR Viewer object with a sequence file contains the following information (numbers re-fer to the figure above):
1. Infrared sequence.2. Temperature scale.3. Control buttons to play back the sequence file.4. Sliders to adjust scale limits.5. Progress indicator.6. Indicates that the image file has embedded GPS data. Click the globe to display the
position on a map.
16.2.2 IR Viewer shortcut menu
The IR Viewer object shortcut menu is displayed when right-clickingan IR Viewer object.
#1558567; r.6079/6079; en-US 51
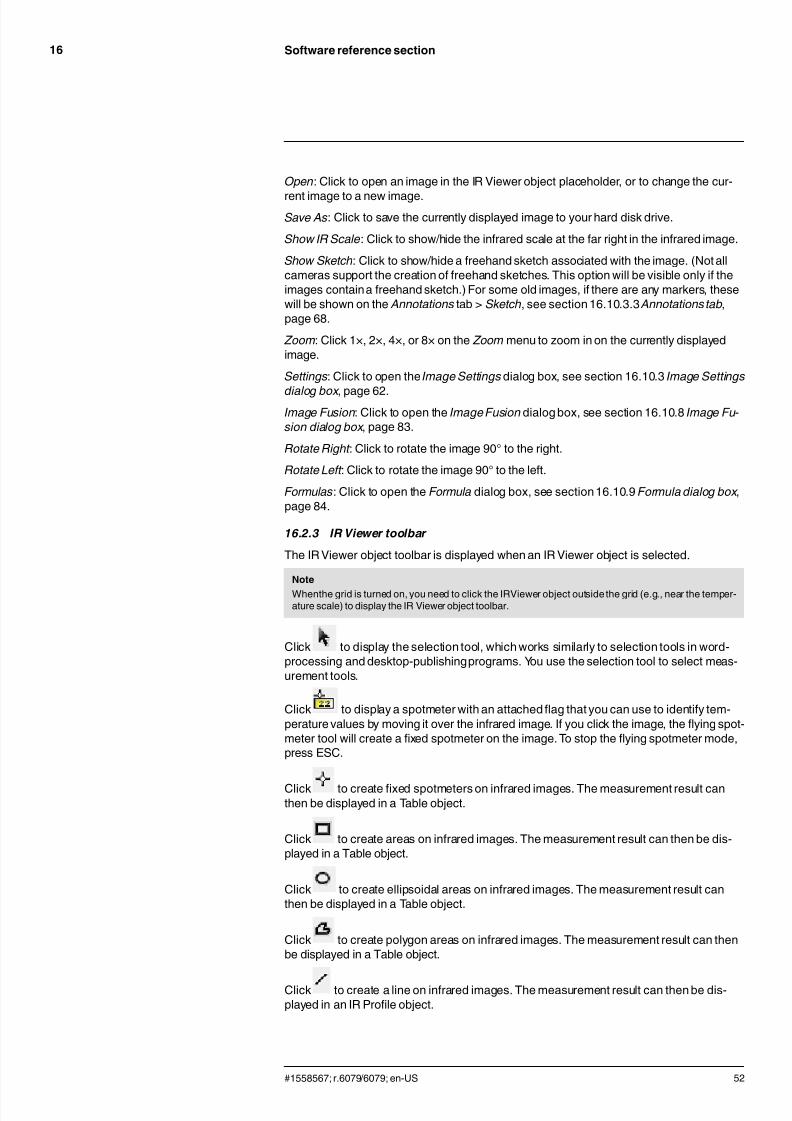
7/21/2019 Manual Reporter
http://slidepdf.com/reader/full/manual-reporter 60/140
Software reference section16
Open: Click to open an image in the IR Viewer object placeholder, or to change the cur-
rent image to a new image.Save As: Click to save the currently displayed image to your hard disk drive.
Show IR Scale: Click to show/hide the infrared scale at the far right in the infrared image.
Show Sketch: Click to show/hide a freehand sketch associated with the image. (Not allcameras support the creation of freehand sketches. This option will be visible only if theimages contain a freehand sketch.) For some old images, if there are any markers, thesewill be shown on the Annotations tab > Sketch, see section 16.10.3.3 Annotations tab,page 68.
Zoom: Click 1×, 2×, 4×, or 8× on the Zoom menu to zoom in on the currently displayedimage.
Settings: Click to open the Image Settings dialog box, see section 16.10.3 Image Settings
dialog box , page 62.Image Fusion: Click to open the Image Fusion dialog box, see section 16.10.8 Image Fu-
sion dialog box , page 83.
Rotate Right : Click to rotate the image 90° to the right.
Rotate Left : Click to rotate the image 90° to the left.
Formulas: Click to open the Formula dialog box, see section 16.10.9 Formula dialog box ,page 84.
16.2.3 IR Viewer toolbar
The IR Viewer object toolbar is displayed when an IR Viewer object is selected.
Note
Whenthe grid is turned on, you need to click the IRViewer object outside the grid (e.g., near the temper-ature scale) to display the IR Viewer object toolbar.
Click to display the selection tool, which works similarly to selection tools in word-processing and desktop-publishingprograms. You use the selection tool to select meas-urement tools.
Click to display a spotmeter with an attached flag that you can use to identify tem-perature values by moving it over the infrared image. If you click the image, the flying spot-meter tool will create a fixed spotmeter on the image. To stop the flying spotmeter mode,press ESC.
Click to create fixed spotmeters on infrared images. The measurement result canthen be displayed in a Table object.
Click to create areas on infrared images. The measurement result can then be dis-played in a Table object.
Click to create ellipsoidal areas on infrared images. The measurement result canthen be displayed in a Table object.
Click to create polygon areas on infrared images. The measurement result can thenbe displayed in a Table object.
Click to create a line on infrared images. The measurement result can then be dis-played in an IR Profile object.
#1558567; r.6079/6079; en-US 52
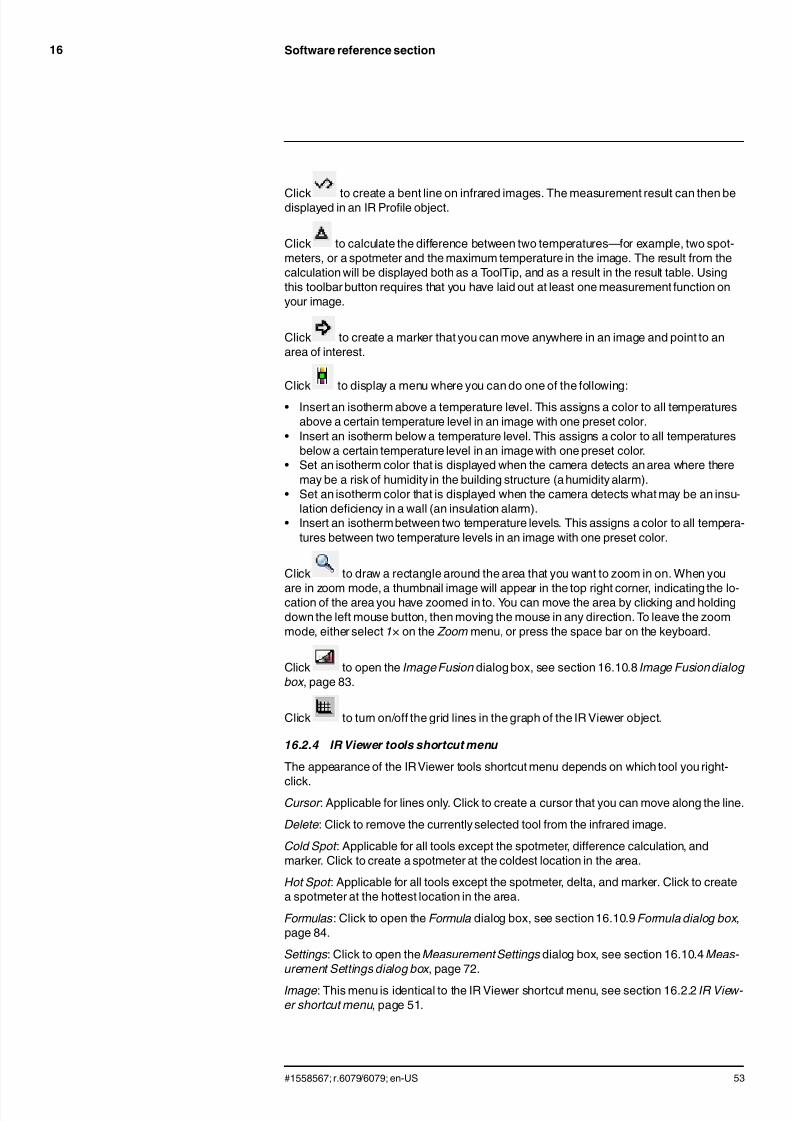
7/21/2019 Manual Reporter
http://slidepdf.com/reader/full/manual-reporter 61/140
Software reference section16
Click to create a bent line on infrared images. The measurement result can then bedisplayed in an IR Profile object.
Click to calculate the difference between two temperatures—for example, two spot-meters, or a spotmeter and the maximum temperature in the image. The result from thecalculation will be displayed both as a ToolTip, and as a result in the result table. Usingthis toolbar button requires that you have laid out at least one measurement function onyour image.
Click to create a marker that you can move anywhere in an image and point to anarea of interest.
Click to display a menu where you can do one of the following:
• Insert an isotherm above a temperature level. This assigns a color to all temperaturesabove a certain temperature level in an image with one preset color.
• Insert an isotherm below a temperature level. This assigns a color to all temperaturesbelow a certain temperature level in an image with one preset color.
• Set an isotherm color that is displayed when the camera detects an area where theremay be a risk of humidity in the building structure (a humidity alarm).
• Set an isotherm color that is displayed when the camera detects what may be an insu-lation deficiency in a wall (an insulation alarm).
• Insert an isotherm between two temperature levels. This assigns a color to all tempera-tures between two temperature levels in an image with one preset color.
Click to draw a rectangle around the area that you want to zoom in on. When you
are in zoom mode, a thumbnail image will appear in the top right corner, indicating the lo-cation of the area you have zoomed in to. You can move the area by clicking and holdingdown the left mouse button, then moving the mouse in any direction. To leave the zoommode, either select 1× on the Zoom menu, or press the space bar on the keyboard.
Click to open the Image Fusion dialog box, see section 16.10.8 Image Fusion dialog
box , page 83.
Click to turn on/off the grid lines in the graph of the IR Viewer object.
16.2.4 IR Viewer tools shortcut menu
The appearance of the IR Viewer tools shortcut menu depends on which tool you right-
click.Cursor : Applicable for lines only. Click to create a cursor that you can move along the line.
Delete: Click to remove the currently selected tool from the infrared image.
Cold Spot : Applicable for all tools except the spotmeter, difference calculation, andmarker. Click to create a spotmeter at the coldest location in the area.
Hot Spot : Applicable for all tools except the spotmeter, delta, and marker. Click to createa spotmeter at the hottest location in the area.
Formulas: Click to open the Formula dialog box, see section 16.10.9 Formula dialog box ,page 84.
Settings: Click to open the Measurement Settings dialog box, see section 16.10.4 Meas-
urement Settings dialog box , page 72.
Image: This menu is identical to the IR Viewer shortcut menu, see section 16.2.2 IR View-
er shortcut menu, page 51.
#1558567; r.6079/6079; en-US 53
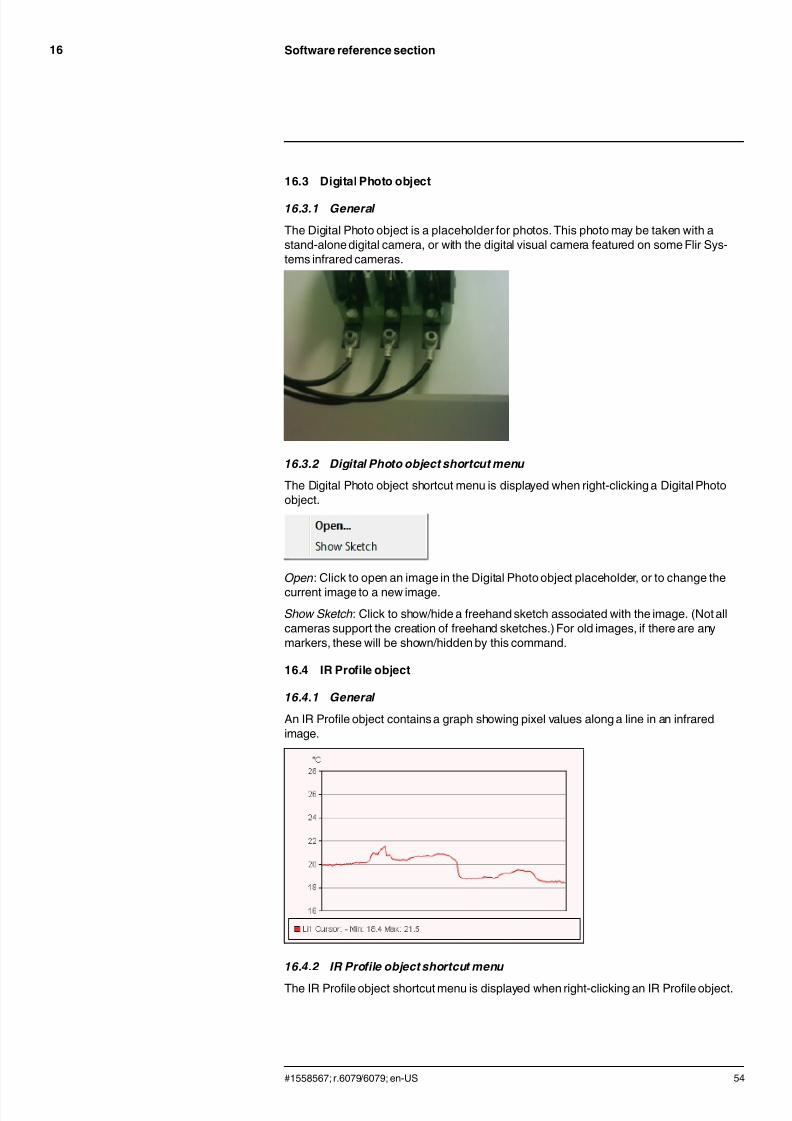
7/21/2019 Manual Reporter
http://slidepdf.com/reader/full/manual-reporter 62/140
Software reference section16
16.3 Digital Photo object
16.3.1 General
The Digital Photo object is a placeholder for photos. This photo may be taken with astand-alone digital camera, or with the digital visual camera featured on some Flir Sys-tems infrared cameras.
16.3.2 Digital Photo object shortcut menu
The Digital Photo object shortcut menu is displayed when right-clicking a Digital Photoobject.
Open: Click to open an image in the Digital Photo object placeholder, or to change the
current image to a new image.Show Sketch: Click to show/hide a freehand sketch associated with the image. (Not allcameras support the creation of freehand sketches.) For old images, if there are anymarkers, these will be shown/hidden by this command.
16.4 IR Profile object
16.4.1 General
An IR Profile object contains a graph showing pixel values along a line in an infraredimage.
16.4.2 IR Profile object shortcut menu
The IR Profile object shortcut menu is displayed when right-clicking an IR Profile object.
#1558567; r.6079/6079; en-US 54
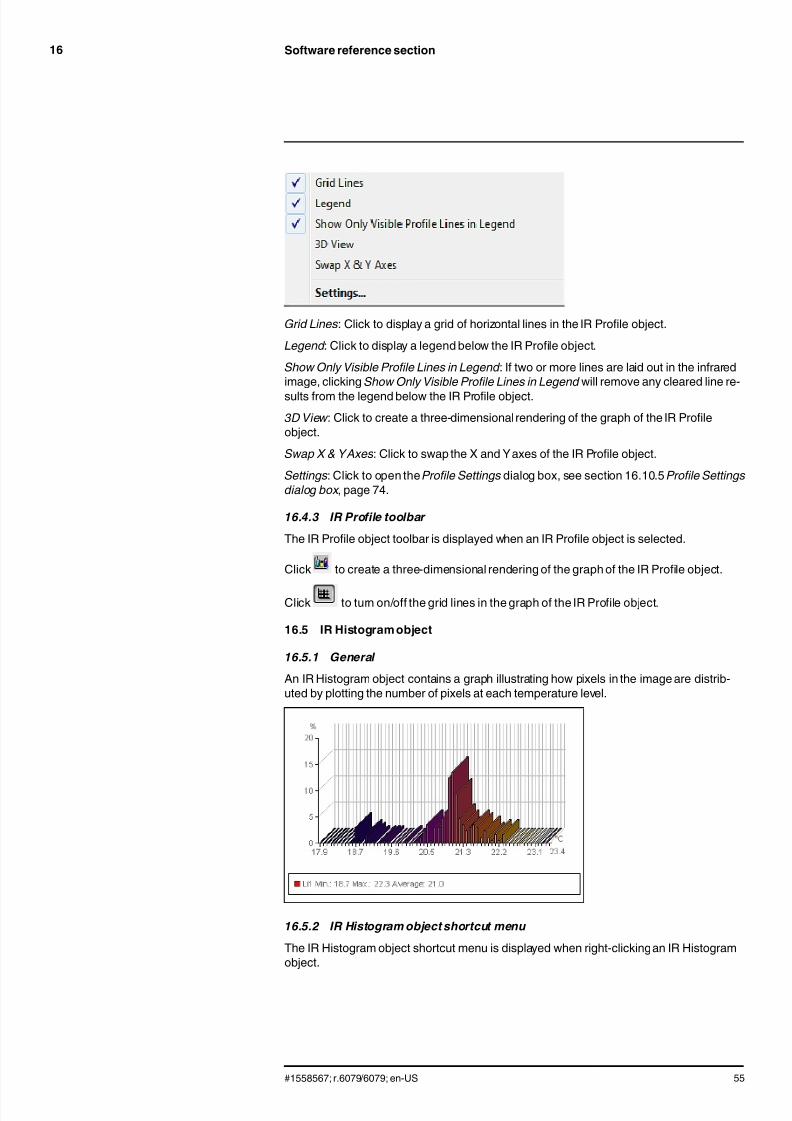
7/21/2019 Manual Reporter
http://slidepdf.com/reader/full/manual-reporter 63/140
Software reference section16
Grid Lines: Click to display a grid of horizontal lines in the IR Profile object.
Legend : Click to display a legend below the IR Profile object.
Show Only Visible Profile Lines in Legend : If two or more lines are laid out in the infraredimage, clicking Show Only Visible Profile Lines in Legend will remove any cleared line re-
sults from the legend below the IR Profile object.
3D View : Click to create a three-dimensional rendering of the graph of the IR Profileobject.
Swap X & YAxes: Click to swap the X and Yaxes of the IR Profile object.
Settings: Click to open the Profile Settings dialog box, see section 16.10.5 Profile Settings
dialog box , page 74.
16.4.3 IR Profile toolbar
The IR Profile object toolbar is displayed when an IR Profile object is selected.
Click to create a three-dimensional rendering of the graph of the IR Profile object.
Click to turn on/off the grid lines in the graph of the IR Profile object.
16.5 IR Histogram object
16.5.1 General
An IR Histogram object contains a graph illustrating how pixels in the image are distrib-uted by plotting the number of pixels at each temperature level.
16.5.2 IR Histogram object shortcut menu
The IR Histogram object shortcut menu is displayed when right-clickingan IR Histogramobject.
#1558567; r.6079/6079; en-US 55
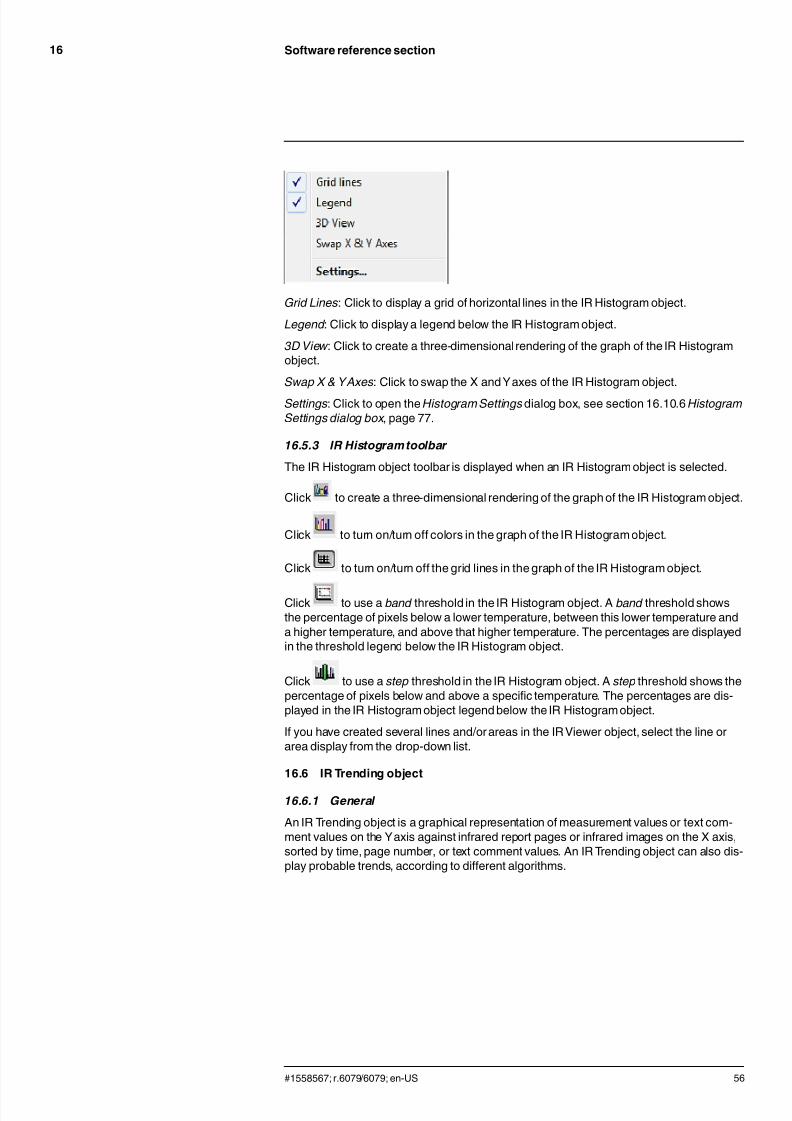
7/21/2019 Manual Reporter
http://slidepdf.com/reader/full/manual-reporter 64/140
Software reference section16
Grid Lines: Click to display a grid of horizontal lines in the IR Histogram object.
Legend : Click to display a legend below the IR Histogram object.
3D View : Click to create a three-dimensional rendering of the graph of the IR Histogramobject.
Swap X & YAxes: Click to swap the X and Yaxes of the IR Histogram object.
Settings: Click to open the Histogram Settings dialog box, see section 16.10.6 Histogram
Settings dialog box , page 77.
16.5.3 IR Histogram toolbar
The IR Histogram object toolbar is displayed when an IR Histogram object is selected.
Click to create a three-dimensional rendering of the graph of the IR Histogram object.
Click to turn on/turn off colors in the graph of the IR Histogram object.
Click to turn on/turn off the grid lines in the graph of the IR Histogram object.
Click to use a band threshold in the IR Histogram object. A band threshold showsthe percentage of pixels below a lower temperature, between this lower temperature anda higher temperature, and above that higher temperature. The percentages are displayedin the threshold legend below the IR Histogram object.
Click to use a step threshold in the IR Histogram object. A step threshold shows thepercentage of pixels below and above a specific temperature. The percentages are dis-played in the IR Histogram object legend below the IR Histogram object.
If you have created several lines and/or areas in the IR Viewer object, select the line orarea display from the drop-down list.
16.6 IR Trending object
16.6.1 General
An IR Trending object is a graphical representation of measurement values or text com-ment values on the Yaxis against infrared report pages or infrared images on the X axis,sorted by time, page number, or text comment values. An IR Trending object can also dis-play probable trends, according to different algorithms.
#1558567; r.6079/6079; en-US 56
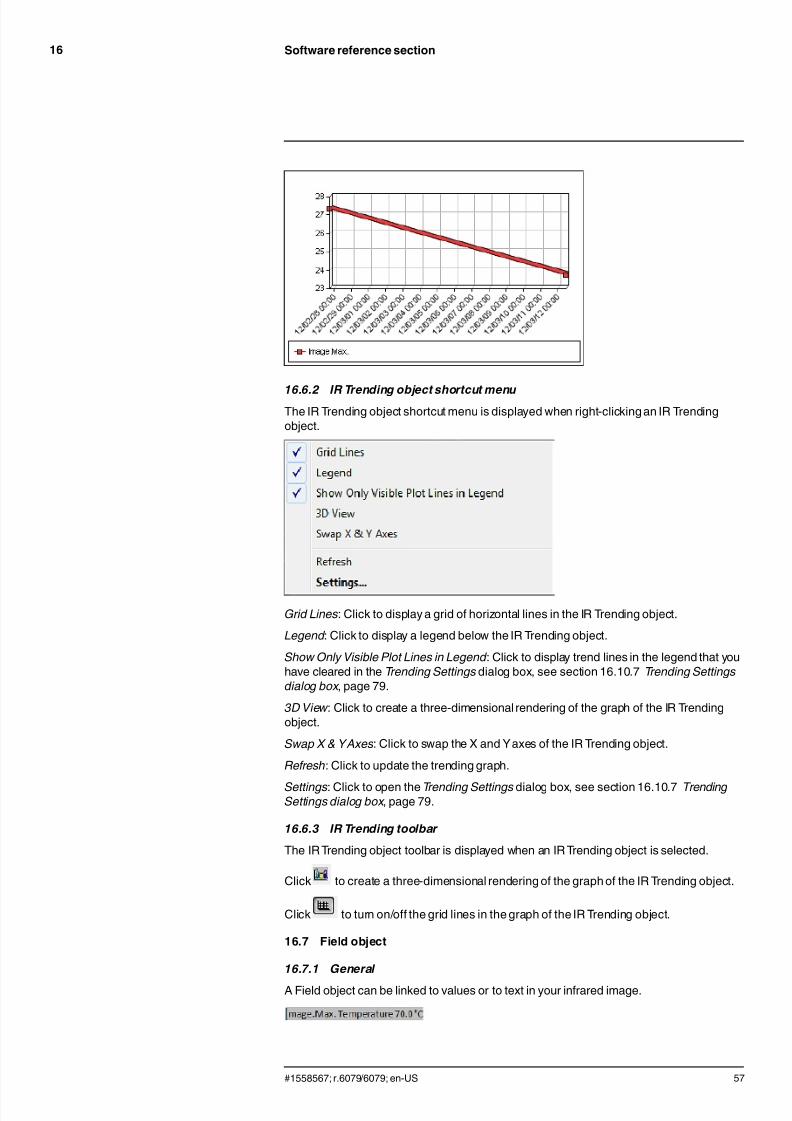
7/21/2019 Manual Reporter
http://slidepdf.com/reader/full/manual-reporter 65/140
Software reference section16
16.6.2 IR Trending object shortcut menuThe IR Trending object shortcut menu is displayed when right-clicking an IR Trendingobject.
Grid Lines: Click to display a grid of horizontal lines in the IR Trending object.
Legend : Click to display a legend below the IR Trending object.
Show Only Visible Plot Lines in Legend : Click to display trend lines in the legend that youhave cleared in the Trending Settings dialog box, see section 16.10.7 Trending Settings
dialog box , page 79.
3D View : Click to create a three-dimensional rendering of the graph of the IR Trendingobject.
Swap X & YAxes: Click to swap the X and Yaxes of the IR Trending object.
Refresh: Click to update the trending graph.
Settings: Click to open the Trending Settings dialog box, see section 16.10.7 TrendingSettings dialog box , page 79.
16.6.3 IR Trending toolbar
The IR Trending object toolbar is displayed when an IR Trending object is selected.
Click to create a three-dimensional rendering of the graph of the IR Trending object.
Click to turn on/off the grid lines in the graph of the IR Trending object.
16.7 Field object
16.7.1 General
A Field object can be linked to values or to text in your infrared image.
#1558567; r.6079/6079; en-US 57
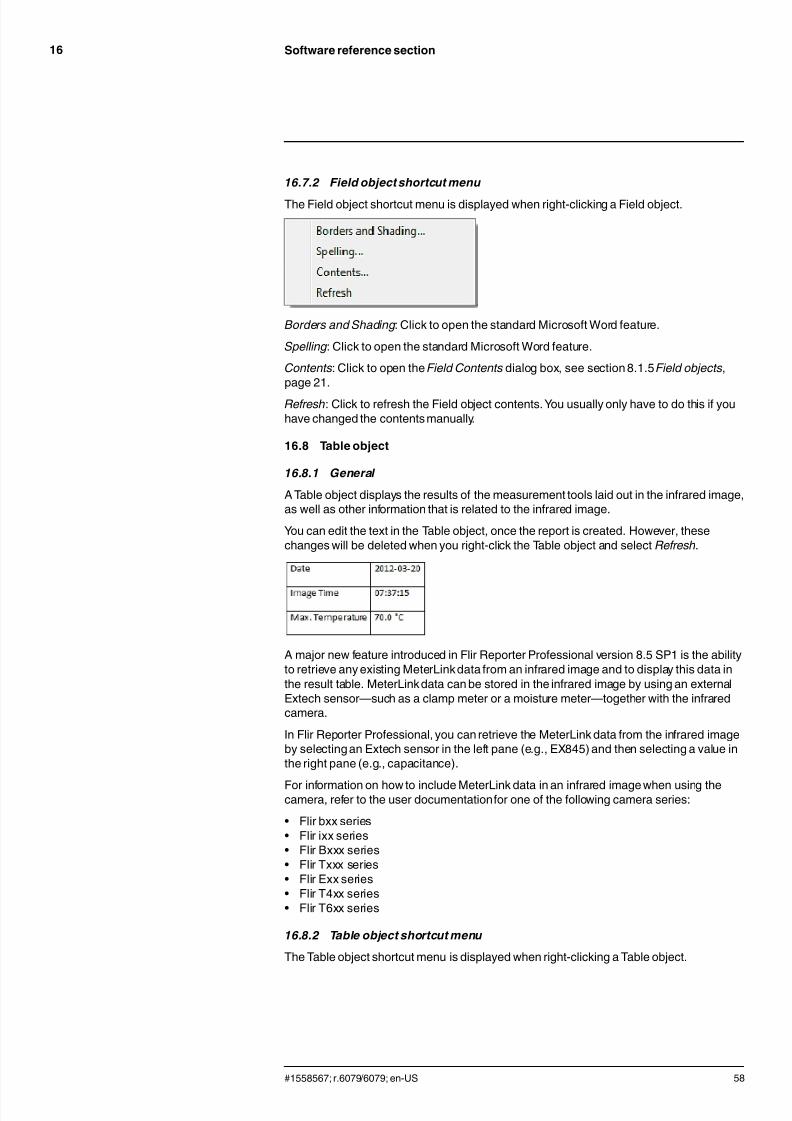
7/21/2019 Manual Reporter
http://slidepdf.com/reader/full/manual-reporter 66/140
Software reference section16
16.7.2 Field object shortcut menu
The Field object shortcut menu is displayed when right-clicking a Field object.
Borders and Shading: Click to open the standard Microsoft Word feature.
Spelling: Click to open the standard Microsoft Word feature.
Contents: Click to open the Field Contents dialog box, see section 8.1.5 Field objects,page 21.
Refresh: Click to refresh the Field object contents. You usually only have to do this if youhave changed the contents manually.
16.8 Table object
16.8.1 General
A Table object displays the results of the measurement tools laid out in the infrared image,as well as other information that is related to the infrared image.
You can edit the text in the Table object, once the report is created. However, thesechanges will be deleted when you right-click the Table object and select Refresh.
A major new feature introduced in Flir Reporter Professional version 8.5 SP1 is the abilityto retrieve any existing MeterLinkdata from an infrared image and to display this data inthe result table. MeterLinkdata can be stored in the infrared image by using an externalExtech sensor—such as a clamp meter or a moisture meter—together with the infraredcamera.
In Flir Reporter Professional, you can retrieve the MeterLink data from the infrared imageby selecting an Extech sensor in the left pane (e.g., EX845) and then selecting a value inthe right pane (e.g., capacitance).
For information on how to include MeterLink data in an infrared image when using thecamera, refer to the user documentationfor one of the following camera series:
• Flir bxx series• Flir ixx series• Flir Bxxx series• Flir Txxx series• Flir Exx series• Flir T4xx series• Flir T6xx series
16.8.2 Table object shortcut menu
The Table object shortcut menu is displayed when right-clicking a Table object.
#1558567; r.6079/6079; en-US 58
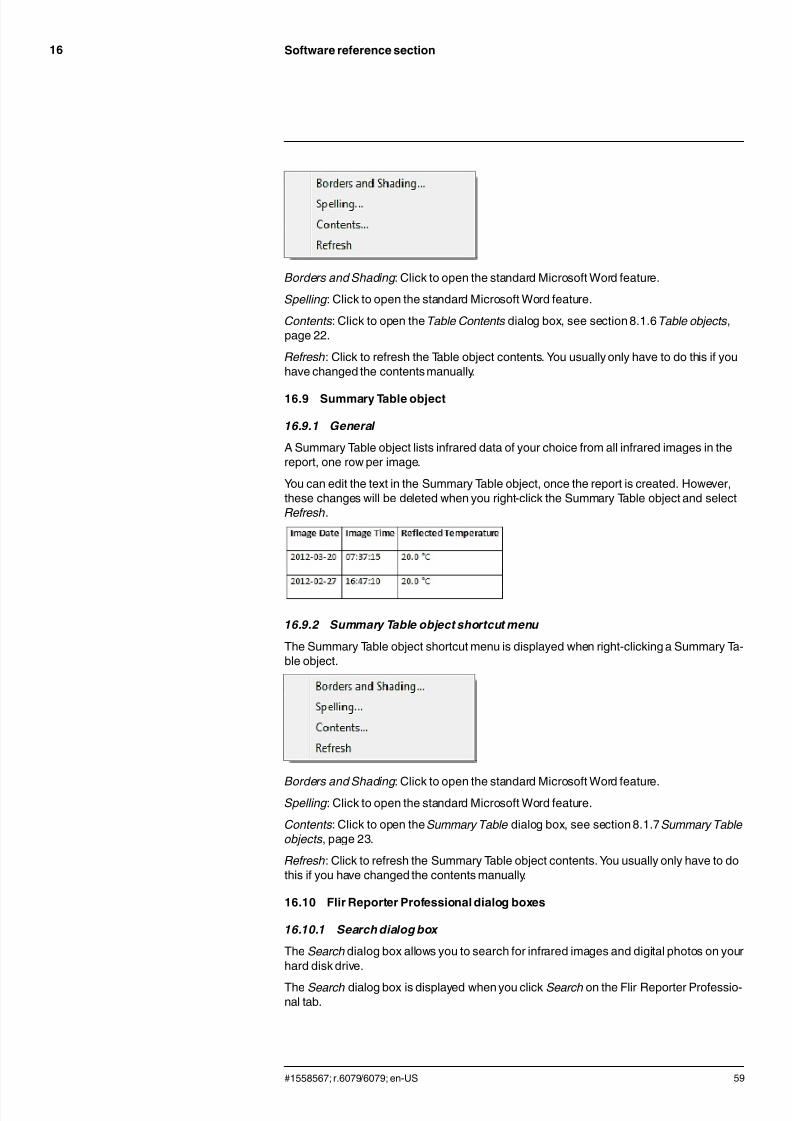
7/21/2019 Manual Reporter
http://slidepdf.com/reader/full/manual-reporter 67/140
Software reference section16
Borders and Shading: Click to open the standard Microsoft Word feature.
Spelling: Click to open the standard Microsoft Word feature.
Contents: Click to open the Table Contents dialog box, see section 8.1.6 Table objects,page 22.
Refresh: Click to refresh the Table object contents. You usually only have to do this if youhave changed the contents manually.
16.9 Summary Table object
16.9.1 General
A Summary Table object lists infrared data of your choice from all infrared images in thereport, one row per image.
You can edit the text in the Summary Table object, once the report is created. However,these changes will be deleted when you right-click the Summary Table object and selectRefresh.
16.9.2 Summary Table object shortcut menu
The Summary Table object shortcut menu is displayed when right-clicking a Summary Ta-ble object.
Borders and Shading: Click to open the standard Microsoft Word feature.Spelling: Click to open the standard Microsoft Word feature.
Contents: Click to open the Summary Table dialog box, see section 8.1.7 Summary Table
objects, page 23.
Refresh: Click to refresh the Summary Table object contents. You usually only have to dothis if you have changed the contents manually.
16.10 Flir Reporter Professional dialog boxes
16.10.1 Search dialog box
The Search dialog box allows you to search for infrared images and digital photos on yourhard disk drive.
The Search dialog box is displayed when you click Search on the Flir Reporter Professio-nal tab.
#1558567; r.6079/6079; en-US 59
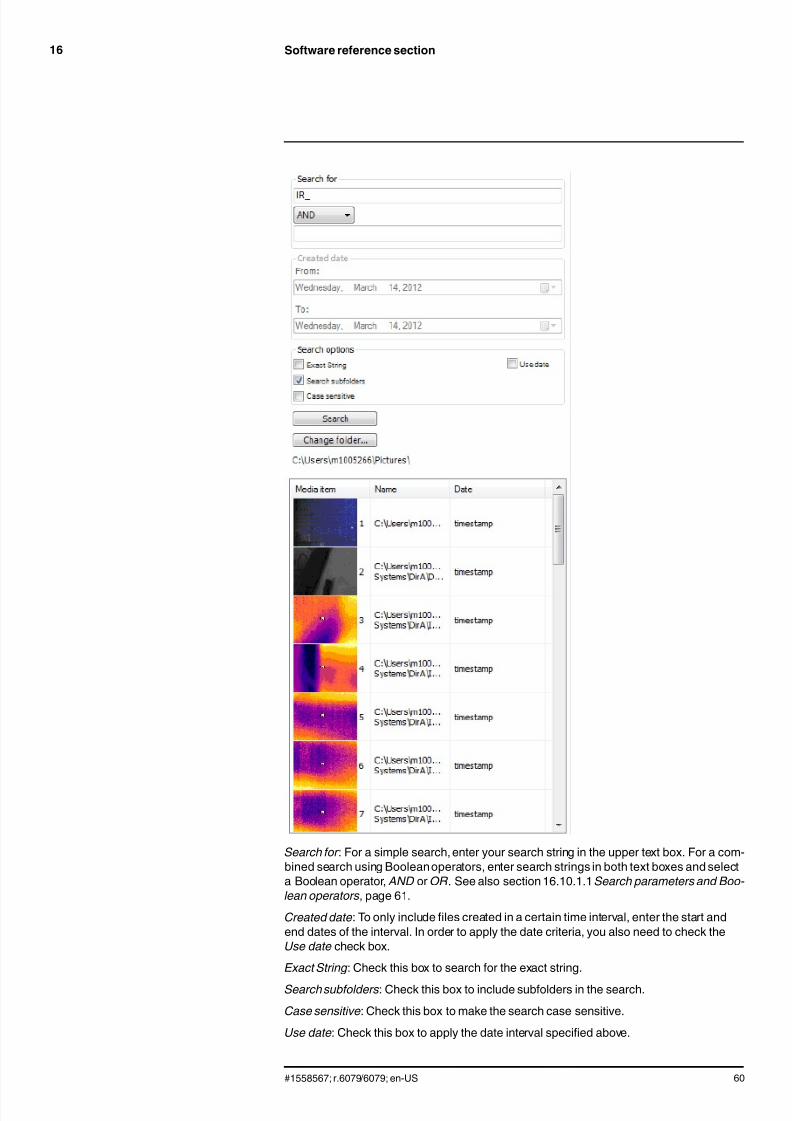
7/21/2019 Manual Reporter
http://slidepdf.com/reader/full/manual-reporter 68/140

7/21/2019 Manual Reporter
http://slidepdf.com/reader/full/manual-reporter 69/140
Software reference section16
Search: Click to search for files according to your settings. The resulting files will be dis-
played in the lower pane.Change folder : Click to select the folder in which the search shall be made.
16.10.1.1 Search parameters and Boolean operators
16.10.1.1.1 About search parameters
The search engine accepts alphabetic characters (a–z, A–Z) and numerical characters(0–9). However, numerical characters will be treated as text.
When you enter a search string, the search engine searches for this string in any locationof a file. This means that a search string such as “25” can, for example, return the follow-ing results:
• IR_0025.jpg (“25” in the file name).
• An image file with a text comment containing“25.”• An image file with an image description containing “25.”• An image file with a spotmeter that has a measurement result of +25°C.• A Microsoft Word document with a document property containing the expression “25.”
16.10.1.1.2 About Boolean operators
You can combine search strings using Boolean operators. Example:
• To find an image file that contains both a text comment containing “10” and a spotmeterthat has a measurement result of +25°C, use the AND Boolean operator.
• To find all files that either contains a text comment containing “10” or a spotmeter thathas a measurement result of +25°C, use the OR Boolean operator.
However, you cannot use Boolean operators in the following two example cases:
• To search for IR_0025.jpg (“25” in the file name) and a spotmeter that has a measure-ment result of +25°C.
• To search for IR_0025.jpg (“25” in the file name) or a spotmeter that has a measure-ment result of +25°C.
16.10.2 QuickInsert dialog box
In the QuickInsert dialog box, you can create a report by selecting a predefined page lay-out or modifying an existing page layout.
The QuickInsert dialog box is displayed when you click QuickInsert on the Flir ReporterProfessional tab.
#1558567; r.6079/6079; en-US 61
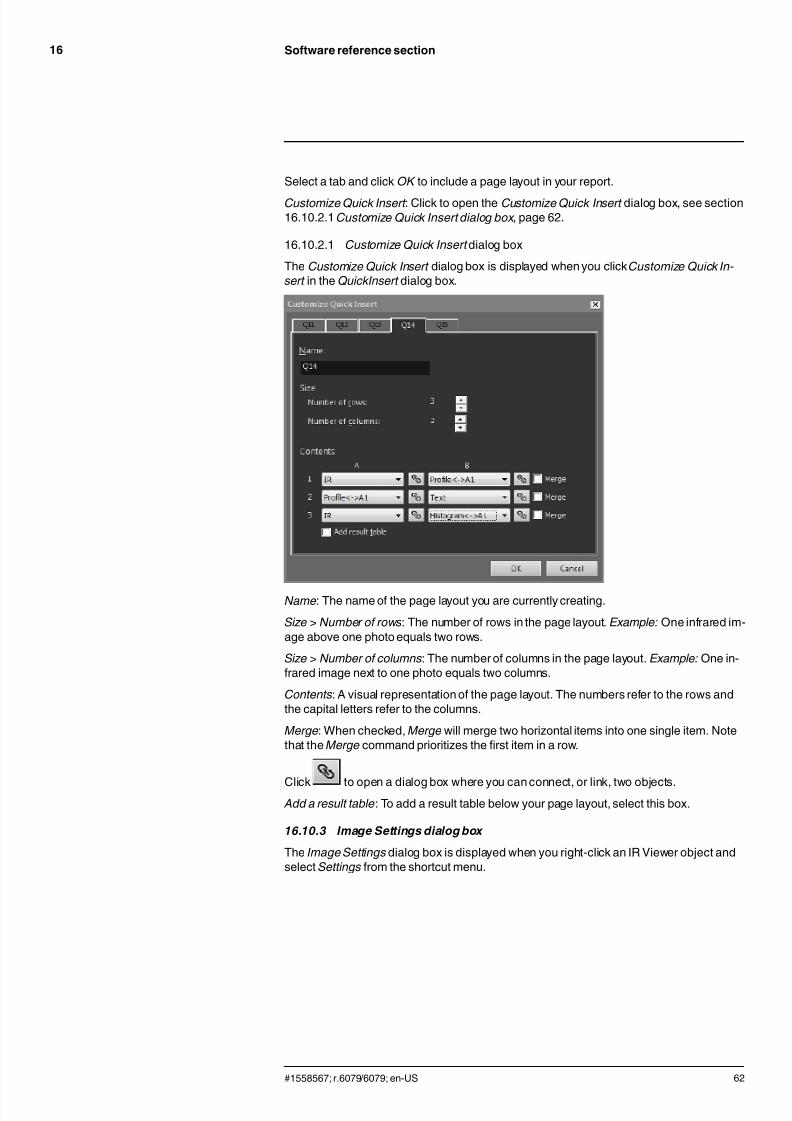
7/21/2019 Manual Reporter
http://slidepdf.com/reader/full/manual-reporter 70/140
Software reference section16
Select a tab and click OK to include a page layout in your report.
Customize Quick Insert : Click to open the Customize Quick Insert dialog box, see section16.10.2.1 Customize Quick Insert dialog box , page 62.
16.10.2.1 Customize Quick Insert dialog box
The Customize Quick Insert dialog box is displayed when you click Customize Quick In-sert in the QuickInsert dialog box.
Name: The name of the page layout you are currently creating.
Size > Number of rows: The number of rows in the page layout. Example: One infrared im-age above one photo equals two rows.
Size > Number of columns: The number of columns in the page layout. Example: One in-frared image next to one photo equals two columns.
Contents: A visual representation of the page layout. The numbers refer to the rows andthe capital letters refer to the columns.
Merge: When checked, Merge will merge two horizontal items into one single item. Notethat the Merge command prioritizes the first item in a row.
Click to open a dialog box where you can connect, or link, two objects. Add a result table: To add a result table below your page layout, select this box.
16.10.3 Image Settings dialog box
The Image Settings dialog box is displayed when you right-click an IR Viewer object andselect Settings from the shortcut menu.
#1558567; r.6079/6079; en-US 62
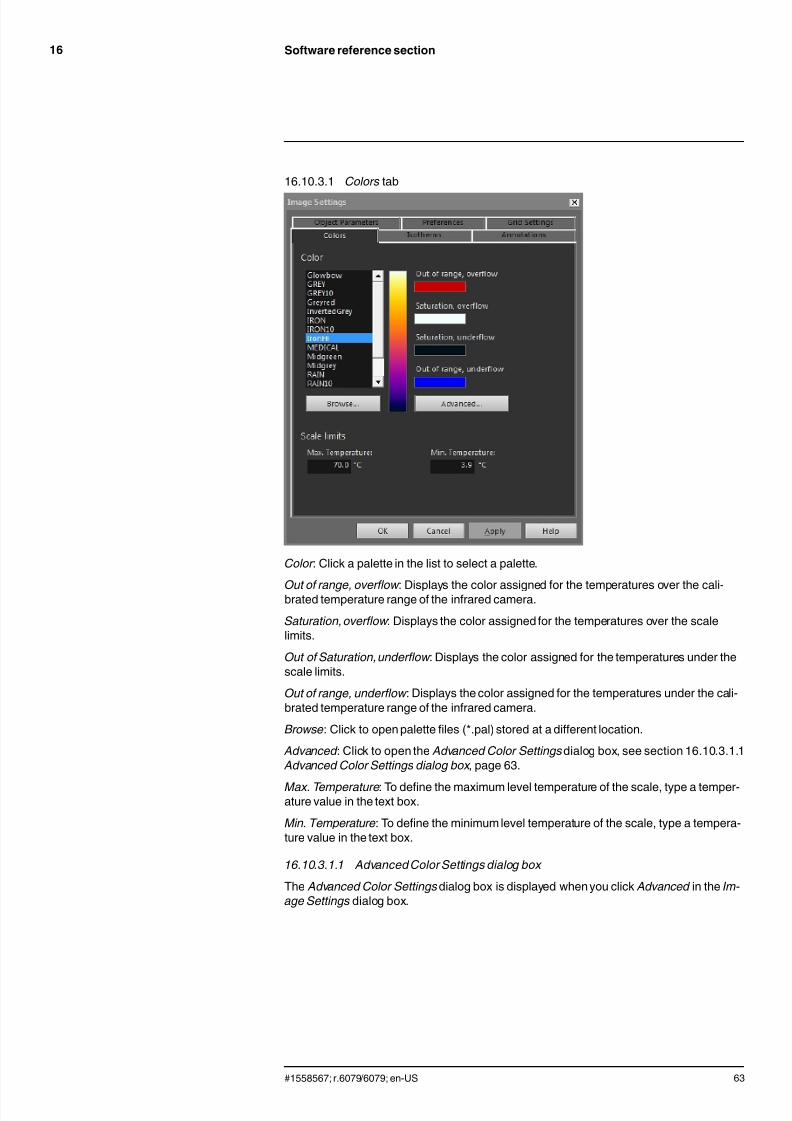
7/21/2019 Manual Reporter
http://slidepdf.com/reader/full/manual-reporter 71/140
Software reference section16
16.10.3.1 Colors tab
Color : Click a palette in the list to select a palette.
Out of range, overflow : Displays the color assigned for the temperatures over the cali-brated temperature range of the infrared camera.
Saturation, overflow : Displays the color assigned for the temperatures over the scalelimits.
Out of Saturation, underflow : Displays the color assigned for the temperatures under thescale limits.
Out of range, underflow : Displays the color assigned for the temperatures under the cali-brated temperature range of the infrared camera.
Browse: Click to open palette files (*.pal) stored at a different location.
Advanced : Click to open the Advanced Color Settings dialog box, see section 16.10.3.1.1 Advanced Color Settings dialog box , page 63.
Max. Temperature: To define the maximum level temperature of the scale, type a temper-ature value in the text box.
Min. Temperature: To define the minimum level temperature of the scale, type a tempera-ture value in the text box.
16.10.3.1.1 Advanced Color Settings dialog box
The Advanced Color Settings dialog box is displayed when you click Advanced in the Im-
age Settings dialog box.
#1558567; r.6079/6079; en-US 63
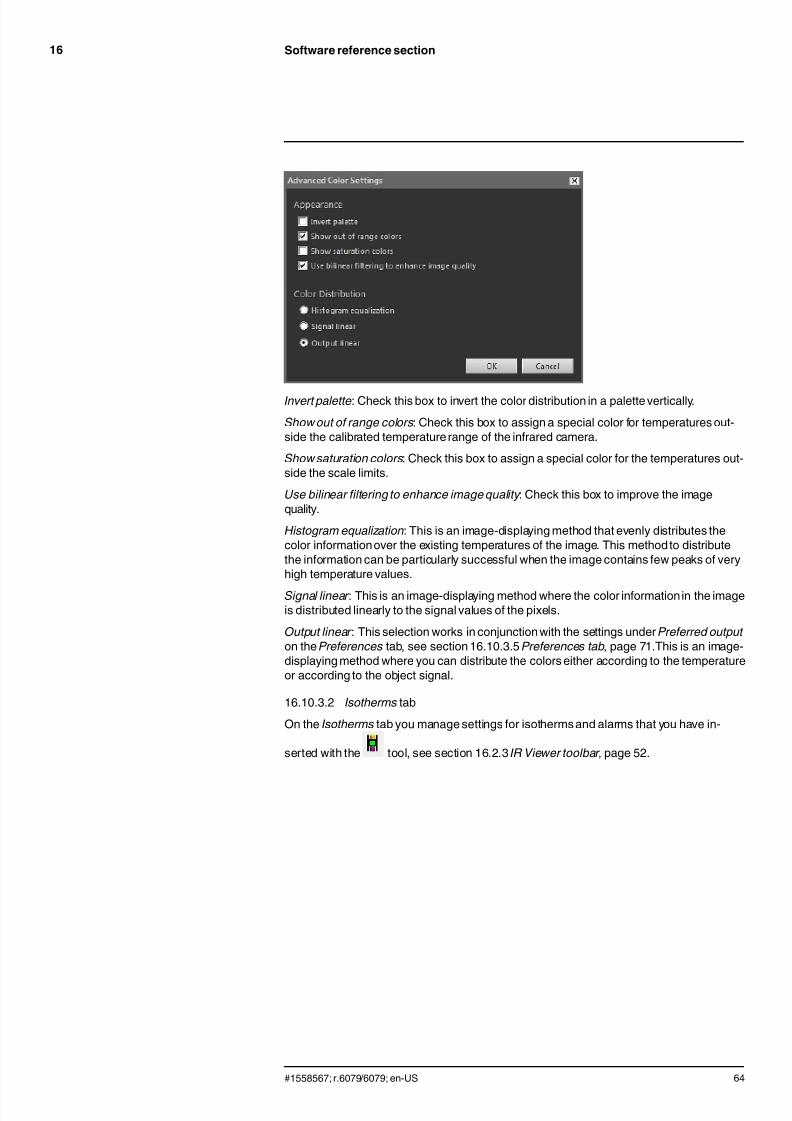
7/21/2019 Manual Reporter
http://slidepdf.com/reader/full/manual-reporter 72/140
Software reference section16
Invert palette: Check this box to invert the color distribution in a palette vertically.
Show out of range colors: Check this box to assign a special color for temperatures out-side the calibrated temperature range of the infrared camera.
Show saturation colors: Check this box to assign a special color for the temperatures out-side the scale limits.
Use bilinear filtering to enhance image quality : Check this box to improve the imagequality.
Histogram equalization: This is an image-displaying method that evenly distributes thecolor information over the existing temperatures of the image. This methodto distributethe information can be particularly successful when the image contains few peaks of veryhigh temperature values.
Signal linear : This is an image-displaying method where the color information in the imageis distributed linearly to the signal values of the pixels.
Output linear : This selection works in conjunction with the settings under Preferred output
on the Preferences tab, see section 16.10.3.5 Preferences tab, page 71.This is an image-displaying method where you can distribute the colors either according to the temperatureor according to the object signal.
16.10.3.2 Isotherms tab
On the Isotherms tab you manage settings for isotherms and alarms that you have in-
serted with the tool, see section 16.2.3 IR Viewer toolbar , page 52.
#1558567; r.6079/6079; en-US 64

7/21/2019 Manual Reporter
http://slidepdf.com/reader/full/manual-reporter 73/140
Software reference section16
Isotherms: Select an isotherm from the list.
Delete: Click to delete the active isotherm.
Solid : Select this option to assign a solid color to the active isotherm. Select the colorfrom the drop-down list.
Contrast : Select this option to assign a contrasting color to the active isotherm. Select thecolor from the drop-down list.
Palette: Select this option and click Open to open a palette and use this palette for the ac-tive isotherm.
Max. Temperature: Click to set the maximum temperature of the active isotherm, enter anew value here and click Apply . Isotherms may exist outside the temperature range of thecurrent image, which will make the isotherm invisible. By changing the maximum tempera-ture, invisible isotherms can be brought back into range.
Min. Temperature: Click to set the minimum temperature of the active isotherm, enter anew value here and click Apply . Isotherms may exist outside the temperature range of the
current image, which will make the isotherm invisible. By changing the minimum tempera-ture, invisible isotherms can be brought back into range.
The appearance of the Isotherms tab is slightly different if a humidityor an insulationalarm is active, see sections below.
#1558567; r.6079/6079; en-US 65
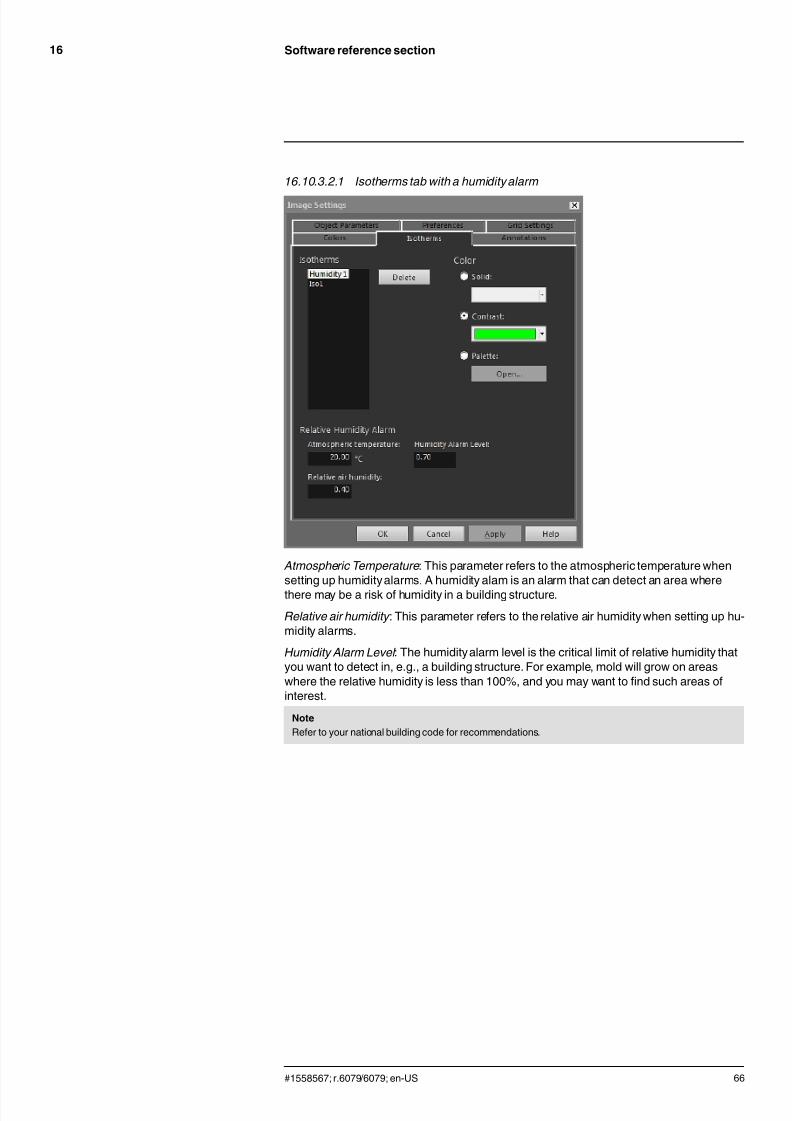
7/21/2019 Manual Reporter
http://slidepdf.com/reader/full/manual-reporter 74/140
Software reference section16
16.10.3.2.1 Isotherms tab with a humidity alarm
Atmospheric Temperature: This parameter refers to the atmospheric temperature whensetting up humidity alarms. A humidity alam is an alarm that can detect an area wherethere may be a risk of humidity in a building structure.
Relative air humidity : This parameter refers to the relative air humidity when setting up hu-midity alarms.
Humidity Alarm Level : The humidity alarm level is the critical limit of relative humidity thatyou want to detect in, e.g., a building structure. For example, mold will grow on areaswhere the relative humidity is less than 100%, and you may want to find such areas ofinterest.
Note
Refer to your national building code for recommendations.
#1558567; r.6079/6079; en-US 66

7/21/2019 Manual Reporter
http://slidepdf.com/reader/full/manual-reporter 75/140
Software reference section16
16.10.3.2.2 Isotherms tab with an insulation alarm
Indoor air temperature: This parameter refers to the air temperature inside the building inquestion when setting up insulation alarms. An insulation alarm is an alarm that can detect
what may be an insulation deficiency in a wall.Outdoor air temperature: This parameter refers to the air temperature outside the buildingin question when setting up insulation alarms.
Insulation factor : The insulation factor is the accepted energy loss through the wall. Differ-ent building codes recommend different values, but typical values are 0.70–0.80 for newbuildings.
Note
Refer to your national building code for recommendations.
#1558567; r.6079/6079; en-US 67

7/21/2019 Manual Reporter
http://slidepdf.com/reader/full/manual-reporter 76/140
Software reference section16
16.10.3.3 Annotations tab
Label : The label of a text comment.
Value: The value of a text comment. Add : Click to display a dialog box where you can add a new text comment.
Edit : Click to display a dialog box where you can change the label and value.
Delete: To delete the text comment, select the text comment and then click Delete.
Image Description: An image description is a brief textual description that is stored insidean image file. It can be created using a Pocket PC and then beamed to the camera usingthe IrDA communicationlink. If the image has an image description, the text will be dis-played in this edit box. If not, you can add an image description for the image by enteringtext. The maximum number of characters in an image description is 512.
Click to listen to a voice comment.
Click to pause the current playback.Click to stop the current playback.
Sketch: Click to display a dialog box where you can view a freehand sketch that is associ-ated with an image. (Not all cameras support the creation of freehand sketches.)
#1558567; r.6079/6079; en-US 68

7/21/2019 Manual Reporter
http://slidepdf.com/reader/full/manual-reporter 77/140
Software reference section16
16.10.3.4 Object Parameters tab
Emissivity : To change the emissivity, enter a new value and click Apply . You can also se-
lect a preset emissivity from a table by clicking .Reflected temperature: To change the reflected apparent temperature, enter a new valueand click Apply .
Atmospheric Temperature: To change the atmospheric temperature, enter a new valueand click Apply .
Relative humidity : To change the relative humidity, enter a new value and click Apply .
Distance to object : To change the distance, enter a new value and click Apply .
More: Click to open the More Object Parameters dialog box, see the section below.
Note
For more information about object parameters, see section 20 Thermographic measurement techni-ques, page 99.
#1558567; r.6079/6079; en-US 69

7/21/2019 Manual Reporter
http://slidepdf.com/reader/full/manual-reporter 78/140
Software reference section16
16.10.3.4.1 More Object Parameters dialog box
Temperature: To specify the temperature of, e.g., an external lens or heat shield, enter anew value and click OK and then Apply .
Transmission: To specify the transmission of, e.g., an external lens or heat shield, enter anew value and click OK and then Apply .
Computed transmission: Flir Reporter Professional can compute the transmission basedon the atmospheric temperature and the relative humidity. Clear the Fixed transmission
check box to use the computed transmission.
Fixed transmission: To use a specific transmission, check this box, enter a value and click
OK and then Apply .Value: To specify the reference temperature, enter a value OK and then Apply .
Note
For more information about object parameters, see section 20 Thermographic measurement techni-ques, page 99.
#1558567; r.6079/6079; en-US 70
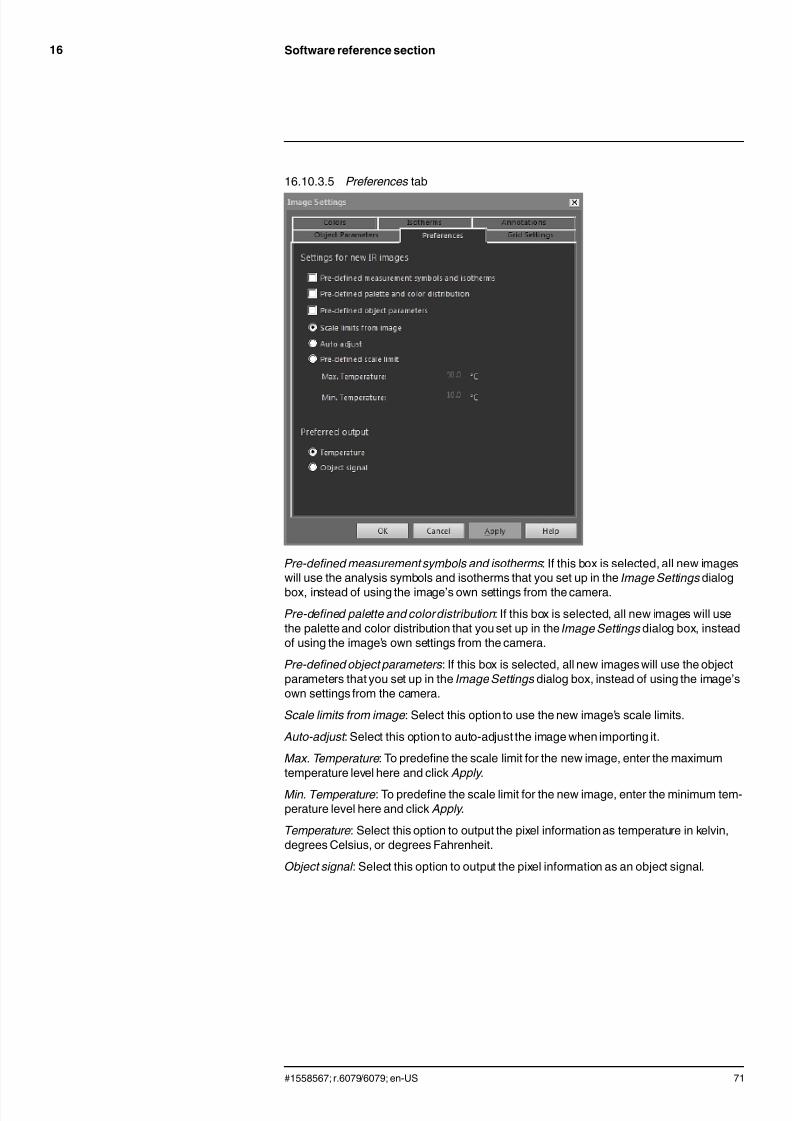
7/21/2019 Manual Reporter
http://slidepdf.com/reader/full/manual-reporter 79/140
Software reference section16
16.10.3.5 Preferences tab
Pre-defined measurement symbols and isotherms: If this box is selected, all new imageswill use the analysis symbols and isotherms that you set up in the Image Settings dialog
box, instead of using the image’s own settings from the camera.Pre-defined palette and color distribution: If this box is selected, all new images will usethe palette and color distribution that you set up in the Image Settings dialog box, insteadof using the image’s own settings from the camera.
Pre-defined object parameters: If this box is selected, all new images will use the objectparameters that you set up in the Image Settings dialog box, instead of using the image’sown settings from the camera.
Scale limits from image: Select this option to use the new image’s scale limits.
Auto-adjust : Select this option to auto-adjust the image when importing it.
Max. Temperature: To predefine the scale limit for the new image, enter the maximumtemperature level here and click Apply .
Min. Temperature: To predefine the scale limit for the new image, enter the minimum tem-perature level here and click Apply .
Temperature: Select this option to output the pixel information as temperature in kelvin,degrees Celsius, or degrees Fahrenheit.
Object signal : Select this option to output the pixel information as an object signal.
#1558567; r.6079/6079; en-US 71
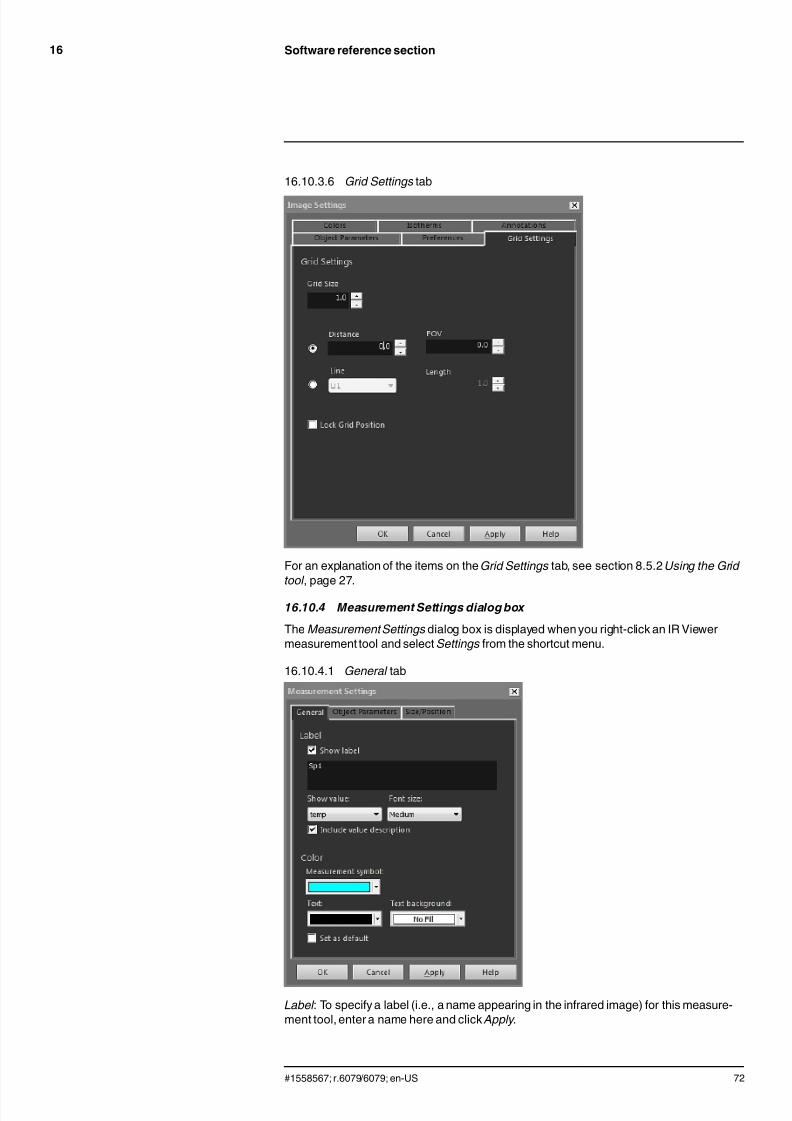
7/21/2019 Manual Reporter
http://slidepdf.com/reader/full/manual-reporter 80/140
Software reference section16
16.10.3.6 Grid Settings tab
For an explanation of the items on the Grid Settings tab, see section 8.5.2 Using the Grid
tool , page 27.
16.10.4 Measurement Settings dialog box
The Measurement Settings dialog box is displayed when you right-click an IR Viewermeasurement tool and select Settings from the shortcut menu.
16.10.4.1 General tab
Label : To specify a label (i.e., a name appearing in the infrared image) for this measure-ment tool, enter a name here and click Apply .
#1558567; r.6079/6079; en-US 72

7/21/2019 Manual Reporter
http://slidepdf.com/reader/full/manual-reporter 81/140
Software reference section16
Show label : To show the label for the measurement tool, check the Show label box and
click Apply .Show value: To display the value of the measurement tool (i.e., the measurement result)in the infrared image, select the value type and click Apply . The number of possible valuetypes differs between different measurement tools.
Font size: To specify the font size of the label, select a font size in the Font size box andclick Apply .
Include value description: To display the value description in the infrared image, check theInclude value description box and click Apply .
Measurement symbol : To specify the color of the symbol for the measurement tool, selecta color in the Measurement symbol box and click Apply .
Text : To specify the color of the label text, select a color in the Text box and click Apply .
Text background : To specify the color of the background, select a color in the Text back-
ground box and click Apply .
Set as default : To use these settings as default settings for all measurement tools, checkthe Set as default box and click Apply .
16.10.4.2 Object Parameters tab
Custom: To specify custom parameters, select Custom, enter new values in the three textboxes and click Apply .
Emissivity : To change the emissivity, enter a new value and click Emissivity . You can also
select a preset emissivity from a table by clicking .
Distance to object : To change the distance, enter a new value and click Apply .
Reflected apparent temperature: To change the reflected apparent temperature, enter anew value and click Apply .
Set as default : To use these object parameters settings as default settings for all meas-urement tools, check the Set as default box and click Apply .
Note
For more information about object parameters, see section 20 Thermographic measurement techni-ques, page 99.
#1558567; r.6079/6079; en-US 73
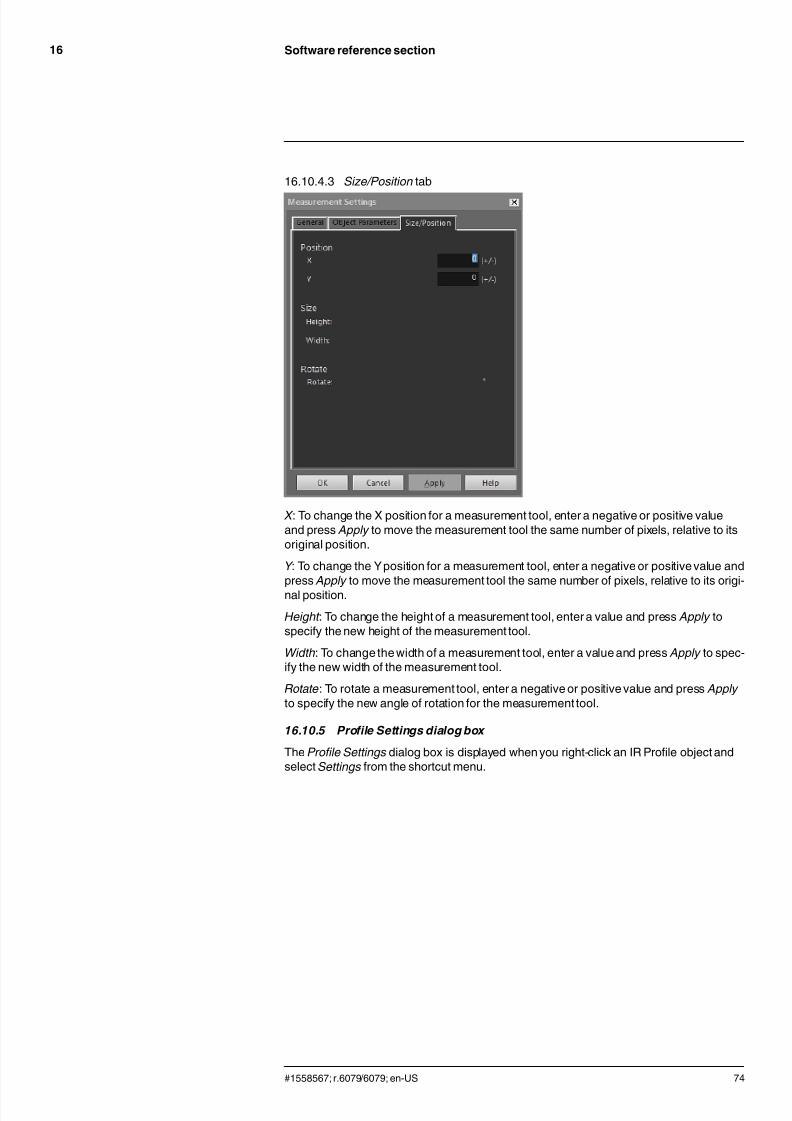
7/21/2019 Manual Reporter
http://slidepdf.com/reader/full/manual-reporter 82/140
Software reference section16
16.10.4.3 Size/Position tab
X : To change the X position for a measurement tool, enter a negative or positive valueand press Apply to move the measurement tool the same number of pixels, relative to itsoriginal position.
Y : To change the Yposition for a measurement tool, enter a negative or positive value andpress Apply to move the measurement tool the same number of pixels, relative to its origi-nal position.
Height : To change the height of a measurement tool, enter a value and press Apply tospecify the new height of the measurement tool.
Width: To change the width of a measurement tool, enter a value and press Apply to spec-ify the new width of the measurement tool.
Rotate: To rotate a measurement tool, enter a negative or positive value and press Apply
to specify the new angle of rotation for the measurement tool.
16.10.5 Profile Settings dialog box
The Profile Settings dialog box is displayed when you right-click an IR Profile object andselect Settings from the shortcut menu.
#1558567; r.6079/6079; en-US 74

7/21/2019 Manual Reporter
http://slidepdf.com/reader/full/manual-reporter 83/140
Software reference section16
16.10.5.1 General tab
Grid Lines: To display a grid of horizontal lines in the IR Profile object, click Grid Lines.
Legend : To display a legend below the IR Profile object, click Legend .
Show Only Visible Profile Lines in Legend : If two or more lines are laid out in the infraredimage, clicking Show Only Visible Profile Lines in Legend will remove any cleared line re-sults from the legend below the IR Profile object.
3D View : To create a three-dimensionalrendering of the graph of the IR Profile object,click 3D View .
Swap X & YAxes: To swap the X and Yaxes of the IR Profile object, click Swap X & Y
Axes.
Columns: To add or remove columns in the IR Profile object, select or clear these boxes.
IR Scale: To use the infrared scale as the temperature axis, select this option button andclick Apply .
Auto: To let Flir Reporter Professional automatically define the temperature axis, selectthis option button and click Apply .
Fixed : To manually define the maximum and minimum axis temperature, select this optionbutton, enter new values in the Max. Temperature and Min. Temperature boxes, and click Apply .
Threshold : To display a horizontal line at a certain temperature in the IR Profile object, en-ter a value in the text box and click Apply .
#1558567; r.6079/6079; en-US 75
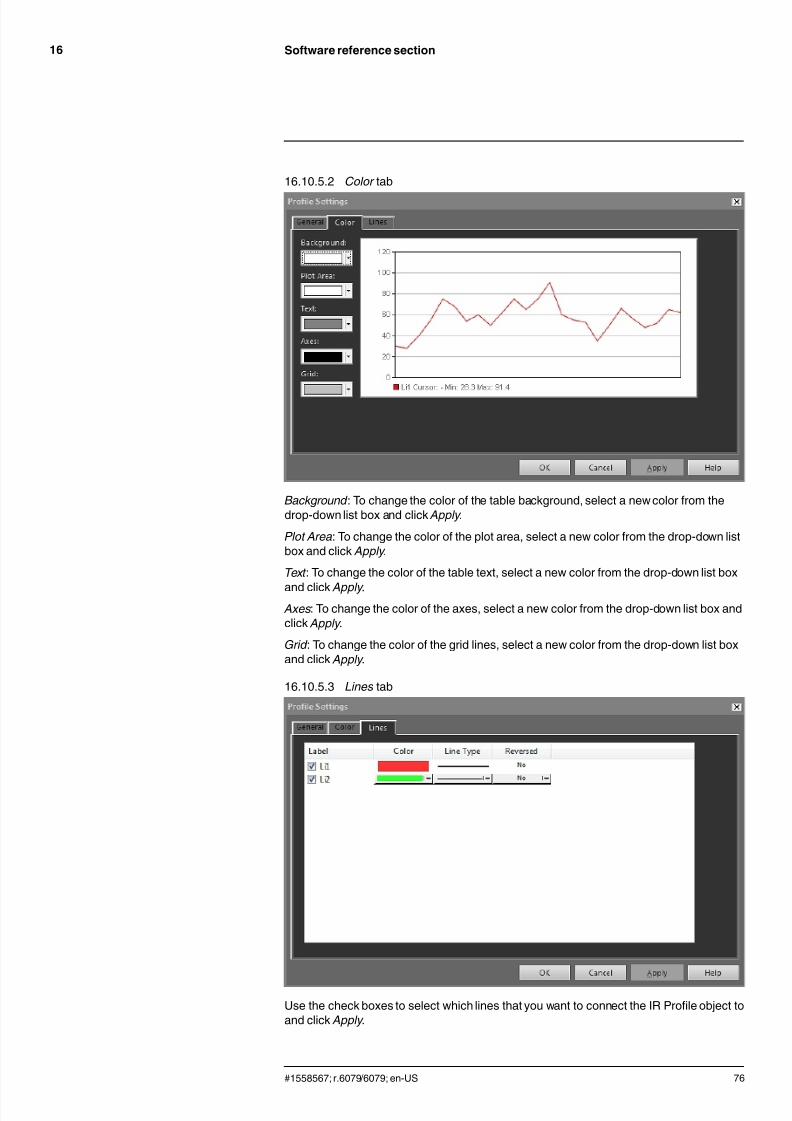
7/21/2019 Manual Reporter
http://slidepdf.com/reader/full/manual-reporter 84/140
Software reference section16
16.10.5.2 Color tab
Background : To change the color of the table background, select a new color from thedrop-down list box and click Apply .
Plot Area: To change the color of the plot area, select a new color from the drop-down listbox and click Apply .
Text : To change the color of the table text, select a new color from the drop-down list box
and click Apply . Axes: To change the color of the axes, select a new color from the drop-down list box andclick Apply .
Grid : To change the color of the grid lines, select a new color from the drop-down list boxand click Apply .
16.10.5.3 Lines tab
Use the check boxes to select which lines that you want to connect the IR Profile object toand click Apply .
#1558567; r.6079/6079; en-US 76

7/21/2019 Manual Reporter
http://slidepdf.com/reader/full/manual-reporter 85/140
Software reference section16
Color : To change the color of a line, select a new color from the drop-down list box and
click Apply .Line Type: To change the line type of a line, select a new line type from the drop-down listbox and click Apply .
Reversed : To reverse direction of the graph, select Yes from the drop-down list box andclick Apply .
16.10.6 Histogram Settings dialog box
The Histogram Settings dialog box is displayed when you right-click an IR Histogram ob- ject and select Settings from the shortcut menu.
16.10.6.1 General tab
Grid Lines: To display a grid of horizontal lines in the IR Histogram object, click Grid
Lines.
Legend : To display a legend below the IR Histogram object, click Legend .
3D View : To create a three-dimensionalrendering of the graph of the IR Histogram object,click 3D View .
Swap X & YAxes: To swap the X and Yaxes of the IR Histogram object, click Swap X & Y
Axes.
Use palette: To use a color palette for the three-dimensional rendering of the IR Histo-gram object, select Use palette and click Apply .
Columns: To add or remove columns in the IR Histogram object, select or clear theseboxes.
None: Select this option button if no threshold should be used in the IR Histogram object.
Step: To use a step threshold in the IR Histogram object, select this option button. A stepthreshold shows the percentage of pixels below and above a specific temperature. Thepercentages are displayed in the IR Histogram object legend below the IR Histogramobject.
#1558567; r.6079/6079; en-US 77
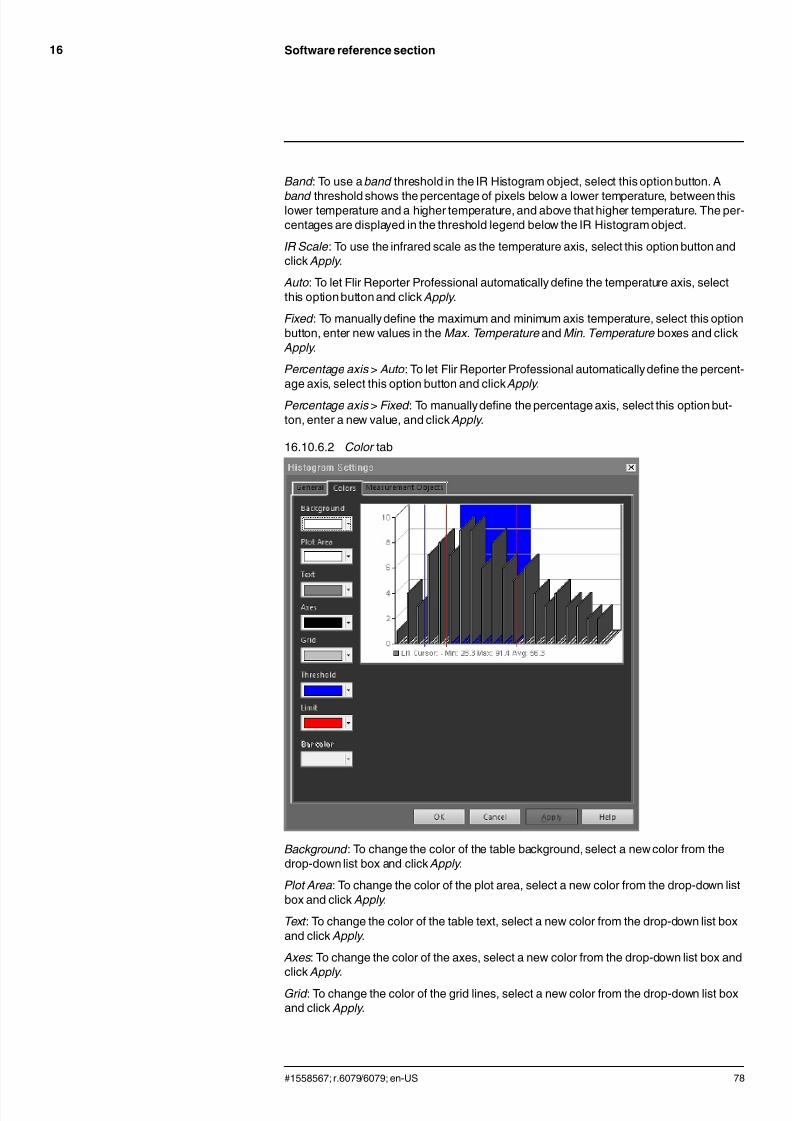
7/21/2019 Manual Reporter
http://slidepdf.com/reader/full/manual-reporter 86/140
Software reference section16
Band : To use a band threshold in the IR Histogram object, select this option button. A
band threshold shows the percentage of pixels below a lower temperature, between thislower temperature and a higher temperature, and above that higher temperature. The per-centages are displayed in the threshold legend below the IR Histogram object.
IR Scale: To use the infrared scale as the temperature axis, select this option button andclick Apply .
Auto: To let Flir Reporter Professional automatically define the temperature axis, selectthis option button and click Apply .
Fixed : To manually define the maximum and minimum axis temperature, select this optionbutton, enter new values in the Max. Temperature and Min. Temperature boxes and click Apply .
Percentage axis > Auto: To let Flir Reporter Professional automatically define the percent-age axis, select this option button and click Apply .
Percentage axis > Fixed : To manuallydefine the percentage axis, select this option but-ton, enter a new value, and click Apply .
16.10.6.2 Color tab
Background : To change the color of the table background, select a new color from thedrop-down list box and click Apply .
Plot Area: To change the color of the plot area, select a new color from the drop-down listbox and click Apply .
Text : To change the color of the table text, select a new color from the drop-down list boxand click Apply .
Axes: To change the color of the axes, select a new color from the drop-down list box andclick Apply .
Grid : To change the color of the grid lines, select a new color from the drop-down list boxand click Apply .
#1558567; r.6079/6079; en-US 78

7/21/2019 Manual Reporter
http://slidepdf.com/reader/full/manual-reporter 87/140
Software reference section16
Threshold : To change the color of the threshold, select a new color from the drop-down
list box and click Apply .Limit : To change the color of the limit, select a new color from the drop-down list box andclick Apply .
Bar color : To change the color of the bar color, select a new color from the drop-down listbox and click Apply .
16.10.6.3 Measurement Objects tab
Use the check boxes to specify which line that you want to connect the IR Histogram ob- ject to and click Apply .
16.10.7 Trending Settings dialog box
The Trending Settings dialog box is displayed when you right-click an IR Trending objectand select Settings from the shortcut menu.
#1558567; r.6079/6079; en-US 79

7/21/2019 Manual Reporter
http://slidepdf.com/reader/full/manual-reporter 88/140
Software reference section16
16.10.7.1 Connect tab
YAxis: To specify a parameter for the Yaxis, click Add and select a label and value for itin the left and right panes, respectively.
Time: To specify time as the X-axis parameter, select the Time option button.
Image sequence number : To specify an incrementally stepped image sequence numberas the X-axis parameter, select the Image sequence number option button.
Text Comment : To specify text comments as the X-axis parameter, select the Text Com-ment option button. When using text comments as the X-axis parameter, all images musthave the same text comment label. The value of the text comment must be a numericalvalue.
16.10.7.2 General tab
Grid Lines: Click to display a grid of horizontal lines in the IR Trending object.Legend : Click to display a legend below the IR Trending object.
Show Only Visible Plot Lines in Legend : Click to display trend lines in the legend that youhave cleared on theLine tab.
#1558567; r.6079/6079; en-US 80
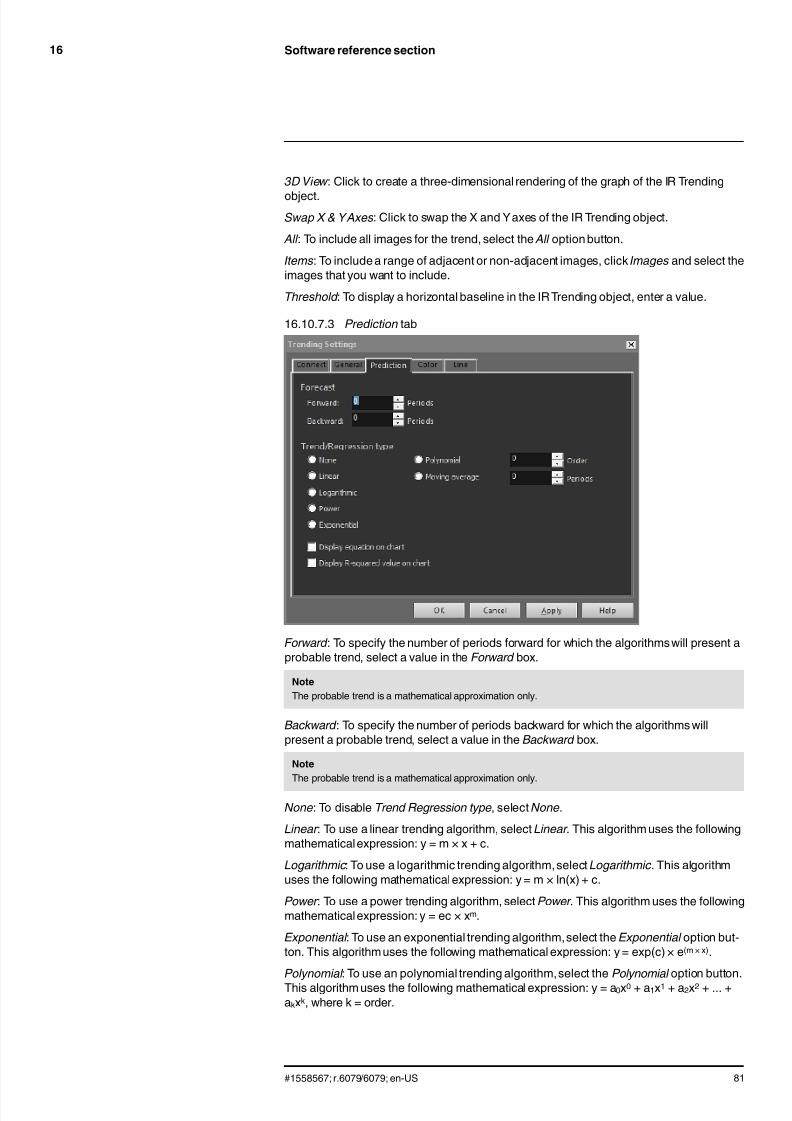
7/21/2019 Manual Reporter
http://slidepdf.com/reader/full/manual-reporter 89/140
Software reference section16
3D View : Click to create a three-dimensional rendering of the graph of the IR Trending
object.Swap X & YAxes: Click to swap the X and Yaxes of the IR Trending object.
All : To include all images for the trend, select the All option button.
Items: To include a range of adjacent or non-adjacent images, click Images and select theimages that you want to include.
Threshold : To display a horizontal baseline in the IR Trending object, enter a value.
16.10.7.3 Prediction tab
Forward : To specify the number of periods forward for which the algorithmswill present aprobable trend, select a value in the Forward box.
Note
The probable trend is a mathematical approximation only.
Backward : To specify the number of periods backward for which the algorithms willpresent a probable trend, select a value in the Backward box.
Note
The probable trend is a mathematical approximation only.
None: To disable Trend Regression type, select None.
Linear : To use a linear trending algorithm, select Linear . This algorithm uses the followingmathematicalexpression: y = m × x + c.
Logarithmic: To use a logarithmic trending algorithm, select Logarithmic. This algorithmuses the following mathematical expression: y = m × ln(x) + c.
Power : To use a power trending algorithm, select Power . This algorithm uses the followingmathematicalexpression: y = ec × xm.
Exponential : To use an exponential trending algorithm,select the Exponential option but-ton. This algorithm uses the following mathematical expression: y = exp(c) × e(m × x).
Polynomial : To use an polynomial trending algorithm,select the Polynomial option button.This algorithm uses the following mathematical expression: y = a0x0 + a1x1 + a2x2 + ... +akxk, where k = order.
#1558567; r.6079/6079; en-US 81
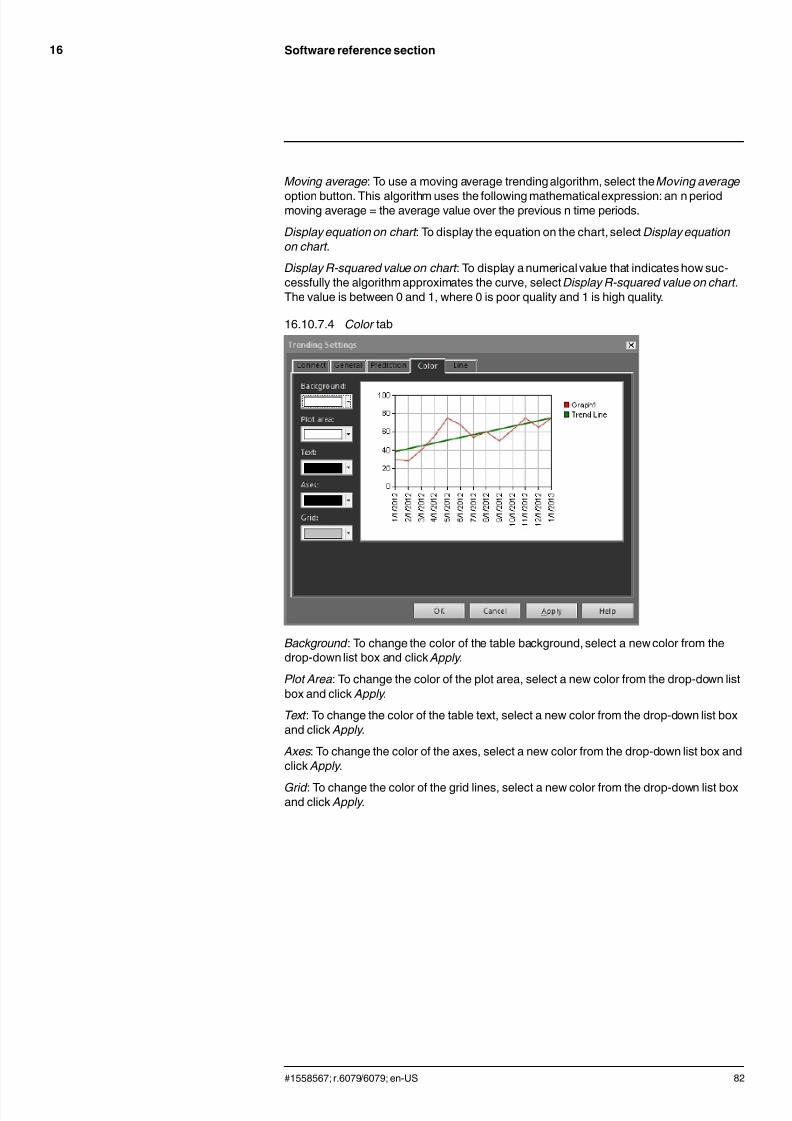
7/21/2019 Manual Reporter
http://slidepdf.com/reader/full/manual-reporter 90/140
Software reference section16
Moving average: To use a moving average trending algorithm, select the Moving average
option button. This algorithm uses the following mathematicalexpression: an n periodmoving average = the average value over the previous n time periods.
Display equation on chart : To display the equation on the chart, select Display equation
on chart .
Display R-squared value on chart : To display a numerical value that indicates how suc-cessfully the algorithm approximates the curve, select Display R-squared value on chart .The value is between 0 and 1, where 0 is poor quality and 1 is high quality.
16.10.7.4 Color tab
Background : To change the color of the table background, select a new color from thedrop-down list box and click Apply .
Plot Area: To change the color of the plot area, select a new color from the drop-down listbox and click Apply .
Text : To change the color of the table text, select a new color from the drop-down list boxand click Apply .
Axes: To change the color of the axes, select a new color from the drop-down list box andclick Apply .
Grid : To change the color of the grid lines, select a new color from the drop-down list boxand click Apply .
#1558567; r.6079/6079; en-US 82
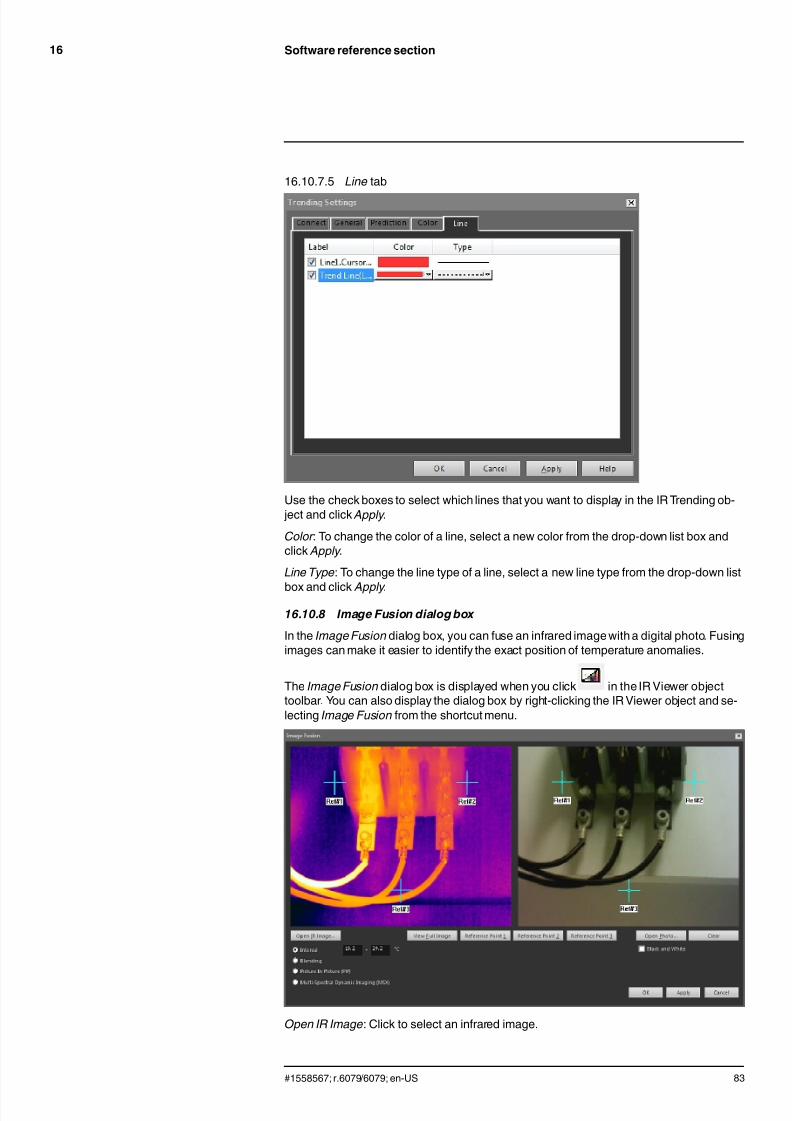
7/21/2019 Manual Reporter
http://slidepdf.com/reader/full/manual-reporter 91/140
Software reference section16
16.10.7.5 Line tab
Use the check boxes to select which lines that you want to display in the IR Trending ob- ject and click Apply .
Color : To change the color of a line, select a new color from the drop-down list box andclick Apply .
Line Type: To change the line type of a line, select a new line type from the drop-down list
box and click Apply .
16.10.8 Image Fusion dialog box
In the Image Fusion dialog box, you can fuse an infrared image with a digital photo. Fusingimages can make it easier to identify the exact position of temperature anomalies.
The Image Fusion dialog box is displayed when you click in the IR Viewer objecttoolbar. You can also display the dialog box by right-clicking the IR Viewer object and se-lecting Image Fusion from the shortcut menu.
Open IR Image: Click to select an infrared image.
#1558567; r.6079/6079; en-US 83

7/21/2019 Manual Reporter
http://slidepdf.com/reader/full/manual-reporter 92/140
Software reference section16
View Full Image: Click to view the full image.
Ref#1: Click to zoom in on crosshair Ref#1.
Ref#2 : Click to zoom in on crosshair Ref#2 .
Ref#3: Click to zoom in on crosshair Ref#3.
Open Photo: Click to select a digital photo.
Black and White: Check to display the digital photo in grayscale.
Clear : Click to remove the digital photo.
Interval : Select this option to use one temperature interval for the infrared image and touse the digital photo for lower and higher temperatures. Enter the desired temperaturevalues in the corresponding text boxes. You can adjust the temperature levels by draggingthe sliders in the IR Viewer object, once you have closed the dialog box.
Blending: Select this option to blend the image from a mix of infrared pixels and digitalphoto pixels. You can adjust the mixing levels by dragging the sliders in the IR Viewer ob-
ject, once you have closed the dialog box.
Picture in Picture (PiP): Select this option to display a portion of a digital photo as an infra-red image. In the IR Viewer object, you can then move and resize the PIP anywhere in thephoto to show the level of detail that you want in your report.
Multi-Spectral Dynamic Imaging (MSX): Select this option to enhance the contrast in theinfrared image. This MSX fusion technologyembosses digital camera details onto the in-frared image, enabling a sharper-lookinginfrared image and quicker target orientation.
16.10.9 Formula dialog box
The Formula dialog box is displayed when you right-click the IR Viewer object and select
Formulas from the shortcut menu.
Add : Click Add to display a dialog box in which you define your new formula.
Edit : Select a formula and click Edit to display a dialog box in which you edit your formula.
Delete: Select a formula and click Delete to delete.
For more information about how you define formulas, see section 8.6 Formulas, page 28.
16.11 Flir Report Center
To start Flir Report Center, do one of the following:
• Select Flir Report Center from the Start menu (Start > All Programs > Flir Systems >Flir Report Center ).
#1558567; r.6079/6079; en-US 84

7/21/2019 Manual Reporter
http://slidepdf.com/reader/full/manual-reporter 93/140
Software reference section16
• Click on the Flir Reporter Professional tab and select Flir Report Center from theFlir submenu.
Infrared training: Link to the Infrared Training Center website.
Click Check for updates to check for program updates.
Click Register your FLIR Product to register Flir Reporter Professional, see section .
Customer support : Link to the Flir Customer Support Center website.Click User manual to open the Flir Reporter Professional User’s guide (PDF).
Visit our Company web: Link to the Flir Systems website.
Click Show License Information to open the License Viewer, see section .
Click Open Microsoft Word and start from a new blank document to create a report from ablank document, see section 7.3 Creating a report from a blank Microsoft Word docu-
ment , page 16.
Click Use the standard FLIR Reporter wizard... to create a report using the Standard FlirReport Wizard, see section 7.1 Creating a report using the Standard Flir Report Wizard ,page 11.
Click Use the advanced FLIR Reporter wizard... to create a report using the Advanced FlirReport Wizard, see section 7.2 Creating a report using the Advanced Flir Report Wizard ,page 12.
Click Create a report template to create a report template, see section 9 Creating a report
template, page 35.
Click Create panorama images to combine several images into a large image, see sec-tions 14 Panorama images, page 44 and 16.14 Flir Panorama Tool , page 87.
Click Edit Text Annotation or Emissivity file to prepare customized text annotationsandemissivity files, see sections 12 Text comment files, page 41 and 13 Emissivity table files,page 43.
Click Convert burst recordings to AVI video clips to create AVI video clips from radiometricsequence files, see section 15 Converting radiometric sequence files, page 47.
Click Configure Rapid Report Manager to create automatic reports on the Desktop, seesection 10 Rapid Report Manager , page 37.
#1558567; r.6079/6079; en-US 85
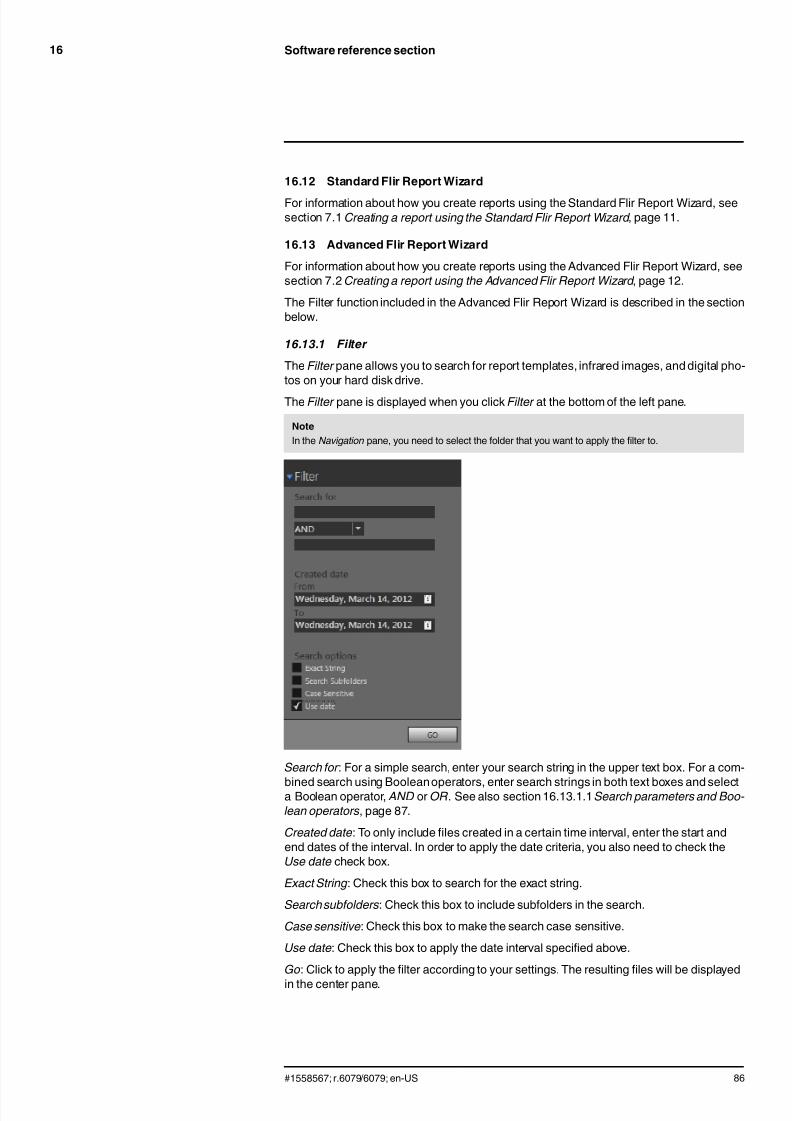
7/21/2019 Manual Reporter
http://slidepdf.com/reader/full/manual-reporter 94/140

7/21/2019 Manual Reporter
http://slidepdf.com/reader/full/manual-reporter 95/140
Software reference section16
16.13.1.1 Search parameters and Boolean operators
16.13.1.1.1 About search parameters
The search engine accepts alphabetic characters (a–z, A–Z) and numerical characters(0–9). However, numerical characters will be treated as text.
When you enter a search string, the search engine searches for this string in any locationof a file. This means that a search string such as “25” can, for example, return the follow-ing results:
• IR_0025.jpg (“25” in the file name).• An image file with a text comment containing“25.”• An image file with an image description containing “25.”• An image file with a spotmeter that has a measurement result of +25°C.• A Microsoft Word document with a document property containing the expression “25.”
16.13.1.1.2 About Boolean operators
You can combine search strings using Boolean operators. Example:
• To find an image file that contains both a text comment containing “10” and a spotmeterthat has a measurement result of +25°C, use the AND Boolean operator.
• To find all files that either contains a text comment containing “10” or a spotmeter thathas a measurement result of +25°C, use the OR Boolean operator.
However, you cannot use Boolean operators in the following two example cases:
• To search for IR_0025.jpg (“25” in the file name) and a spotmeter that has a measure-ment result of +25°C.
• To search for IR_0025.jpg (“25” in the file name) or a spotmeter that has a measure-ment result of +25°C.
16.14 Flir Panorama Tool
The Flir Panorama Tool is used to combine several images into a larger image. This isuseful, for example, when you need to inspect objects larger than the camera’s field ofview.
To start Flir Panorama Tool, do the following:
• In Flir Report Center, select Create panorama images from the Tools pane.
See also section 14 Panorama images, page 44.
#1558567; r.6079/6079; en-US 87

7/21/2019 Manual Reporter
http://slidepdf.com/reader/full/manual-reporter 96/140
Software reference section16
16.14.1 Organize tab
In the left pane:
• Select the folder with the images that you want to combine.
• Click in the upper part of the left pane to display the Quick Collection folder.
In the center pane:
• Click Thumbnails to display thumbnails of the images in the folder selected in the leftpane.
• ClickDetails to display file properties for all images in the selected folder.• Click Film Strip to display images in full view.• (When at least one image is selected:) Click Add To Quick Collection to add the se-
lected image to the Quick Collection folder.• (When at least one image is selected:) Click Remove From Quick Collection to remove
the selected image from the Quick Collection folder. This button is only active when
the Quick Collection folder is selected.• (When at least two images are selected:) Click Link Files to link the image files.
The right pane displays detailed information about the selected file. Use the andbuttons to show/hide the information.
#1558567; r.6079/6079; en-US 88
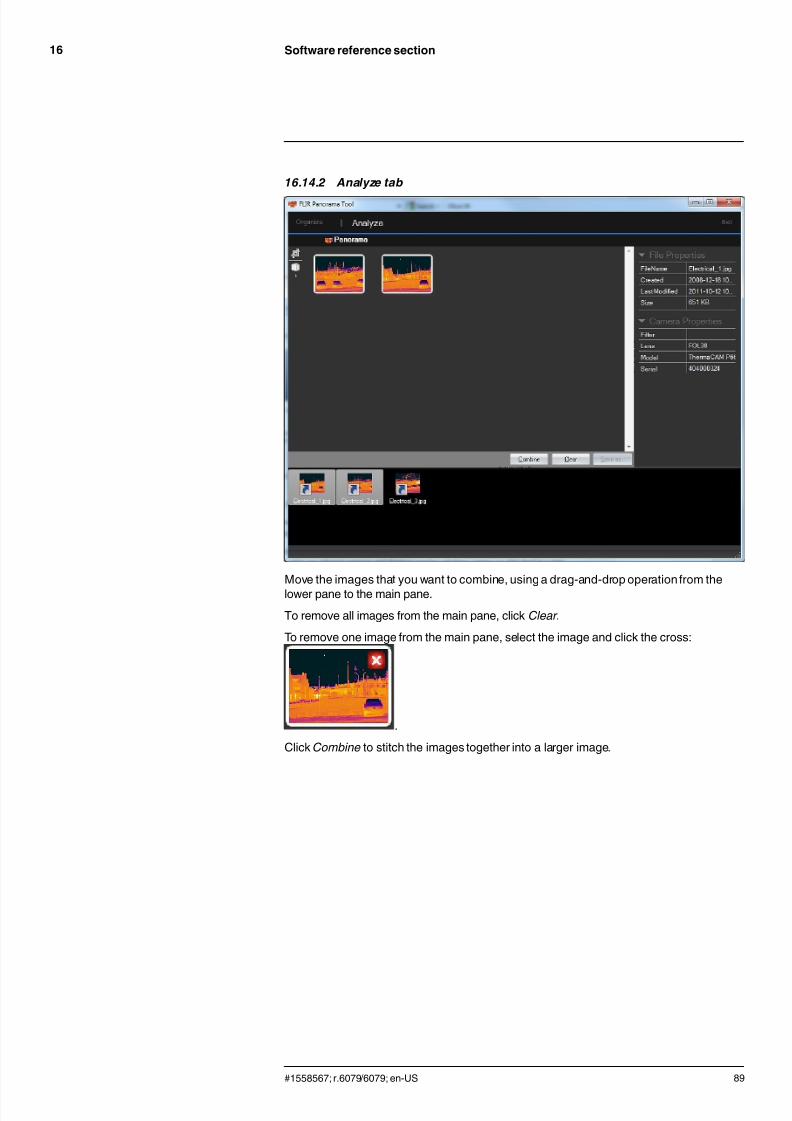
7/21/2019 Manual Reporter
http://slidepdf.com/reader/full/manual-reporter 97/140
Software reference section16
16.14.2 Analyze tab
Move the images that you want to combine, using a drag-and-drop operation from thelower pane to the main pane.
To remove all images from the main pane, click Clear .
To remove one image from the main pane, select the image and click the cross:
.
Click Combine to stitch the images together into a larger image.
#1558567; r.6079/6079; en-US 89

7/21/2019 Manual Reporter
http://slidepdf.com/reader/full/manual-reporter 98/140
Software reference section16
Click to crop the image. This will display a frame with eight handles. By dragging thehandles you can decide which areas of the image will be removed.
Click to confirm and to cancel the crop operation.
#1558567; r.6079/6079; en-US 90
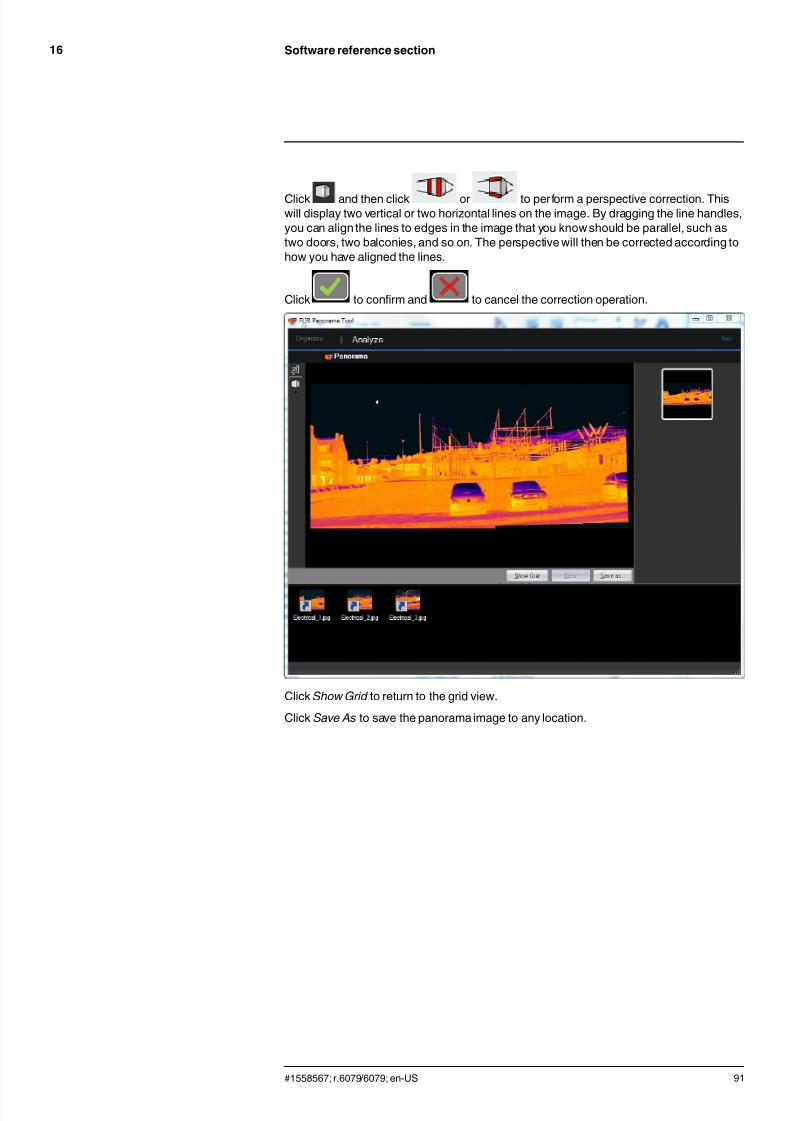
7/21/2019 Manual Reporter
http://slidepdf.com/reader/full/manual-reporter 99/140
Software reference section16
Click and then click or to perform a perspective correction. Thiswill display two vertical or two horizontal lines on the image. By dragging the line handles,you can align the lines to edges in the image that you know should be parallel, such astwo doors, two balconies, and so on. The perspective will then be corrected according tohow you have aligned the lines.
Click to confirm and to cancel the correction operation.
Click Show Grid to return to the grid view.
Click Save As to save the panorama image to any location.
#1558567; r.6079/6079; en-US 91

7/21/2019 Manual Reporter
http://slidepdf.com/reader/full/manual-reporter 100/140
Supported file formats in the IRViewer object
17
The IR Viewer object supports the following radiometric file formats:
• ThermaCAM radiometric *.jpg.• ThermaCAM radiometric *.img.• ThermaCAM radiometric 8-bit *.tif.• ThermaCAM radiometric 8/12-bit *.tif.• ThermaCAM radiometric 12-bit *.tif.• ThermoTeknix *.tgw.• ThermoTeknix *.tmw.• ThermoTeknix *.tlw.• ThermaCAM radiometric *.seq (radiometric sequence files).
#1558567; r.6079/6079; en-US 92
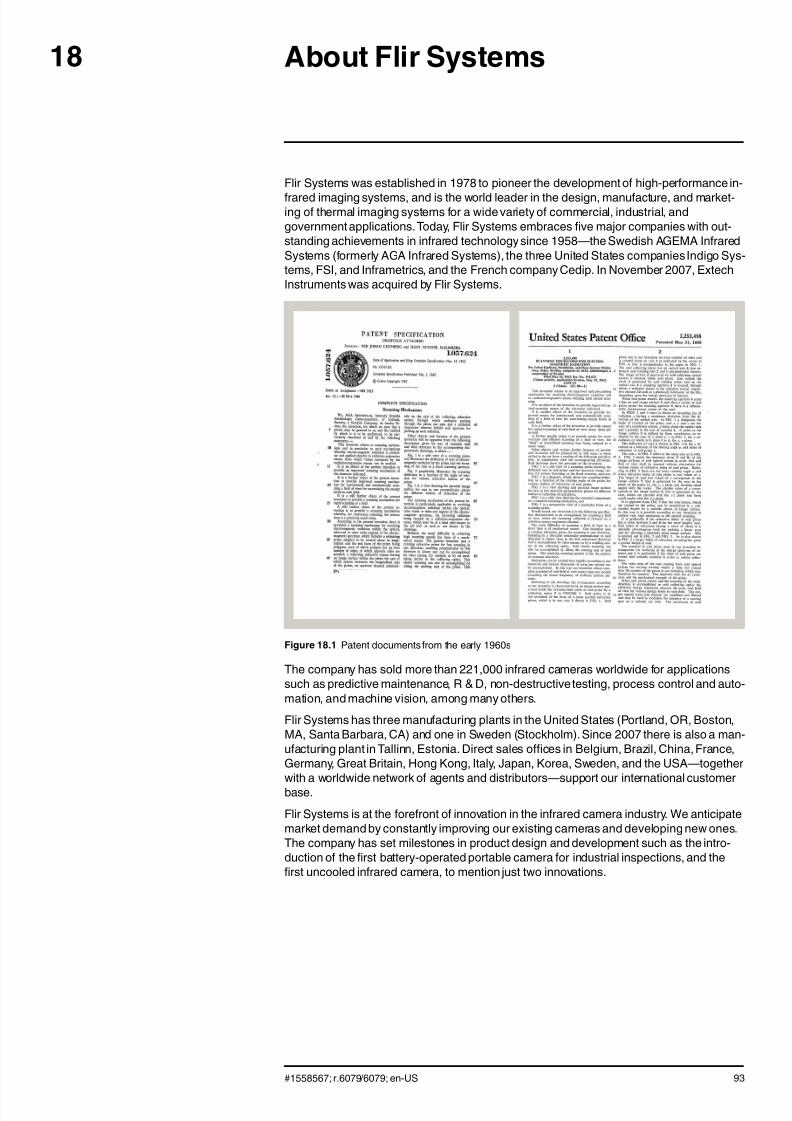
7/21/2019 Manual Reporter
http://slidepdf.com/reader/full/manual-reporter 101/140
About Flir Systems18
Flir Systems was established in 1978 to pioneer the development of high-performance in-
frared imaging systems, and is the world leader in the design, manufacture, and market-ing of thermal imaging systems for a wide variety of commercial, industrial, andgovernment applications. Today, Flir Systems embraces five major companies with out-standing achievements in infrared technology since 1958—the Swedish AGEMA InfraredSystems (formerly AGA Infrared Systems), the three United States companies Indigo Sys-tems, FSI, and Inframetrics, and the French company Cedip. In November 2007, ExtechInstruments was acquired by Flir Systems.
Figure 18.1 Patent documents from the early 1960s
The company has sold more than 221,000 infrared cameras worldwide for applicationssuch as predictive maintenance, R & D, non-destructivetesting, process control and auto-mation, and machine vision, among many others.
Flir Systems has three manufacturing plants in the United States (Portland, OR, Boston,MA, Santa Barbara, CA) and one in Sweden (Stockholm). Since 2007 there is also a man-ufacturing plant in Tallinn, Estonia. Direct sales offices in Belgium, Brazil, China, France,Germany, Great Britain, Hong Kong, Italy, Japan, Korea, Sweden, and the USA—togetherwith a worldwide network of agents and distributors—support our international customerbase.
Flir Systems is at the forefront of innovation in the infrared camera industry. We anticipatemarket demand by constantly improving our existing cameras and developing new ones.The company has set milestones in product design and development such as the intro-duction of the first battery-operated portable camera for industrial inspections, and thefirst uncooled infrared camera, to mention just two innovations.
#1558567; r.6079/6079; en-US 93

7/21/2019 Manual Reporter
http://slidepdf.com/reader/full/manual-reporter 102/140
About Flir Systems18
Figure 18.2 LEFT: Thermovision Model 661 from 1969. The camera weighed approximately 25 kg (55 lb.),the oscilloscope 20 kg (44 lb.), and the tripod 15 kg (33 lb.). The operator also needed a 220 VAC generatorset, and a 10 L (2.6 US gallon) jar with liquid nitrogen. To the left of the oscilloscope the Polaroid attachment(6 kg/13 lb.) can be seen. RIGHT: Flir i7 from 2012. Weight: 0.34 kg (0.75 lb.), including the battery.
Flir Systems manufactures all vital mechanical and electronic components of the camerasystems itself. From detector design and manufacturing, to lenses and system elec-tronics, to final testing and calibration, all production steps are carried out and supervisedby our own engineers. The in-depth expertise of these infrared specialists ensures the ac-curacy and reliability of all vital components that are assembled into your infrared camera.
18.1 More than just an infrared camera
At Flir Systems we recognize that our job is to go beyond just producing the best infraredcamera systems. We are committed to enabling all users of our infrared camera systems
to work more productively by providing them with the most powerful camera–softwarecombination. Especially tailored software for predictive maintenance, R & D, and processmonitoring is developed in-house. Most software is available in a wide variety oflanguages.
We support all our infrared cameras with a wide variety of accessories to adapt yourequipment to the most demanding infrared applications.
18.2 Sharing our knowledge
Although our cameras are designed to be very user-friendly, there is a lot more to ther-mography than just knowing how to handle a camera. Therefore, Flir Systems hasfounded the Infrared Training Center (ITC), a separate business unit, that provides certi-fied training courses. Attending one of the ITC courses will give you a truly hands-onlearning experience.
The staff of the ITC are also there to provide you with any application support you mayneed in putting infrared theory into practice.
18.3 Supporting our customers
Flir Systems operates a worldwide service network to keep your camera running at alltimes. If you discover a problem with your camera, local service centers have all theequipment and expertise to solve it within the shortest possible time. Therefore, there isno need to send your camera to the other side of the world or to talk to someone whodoes not speak your language.
#1558567; r.6079/6079; en-US 94
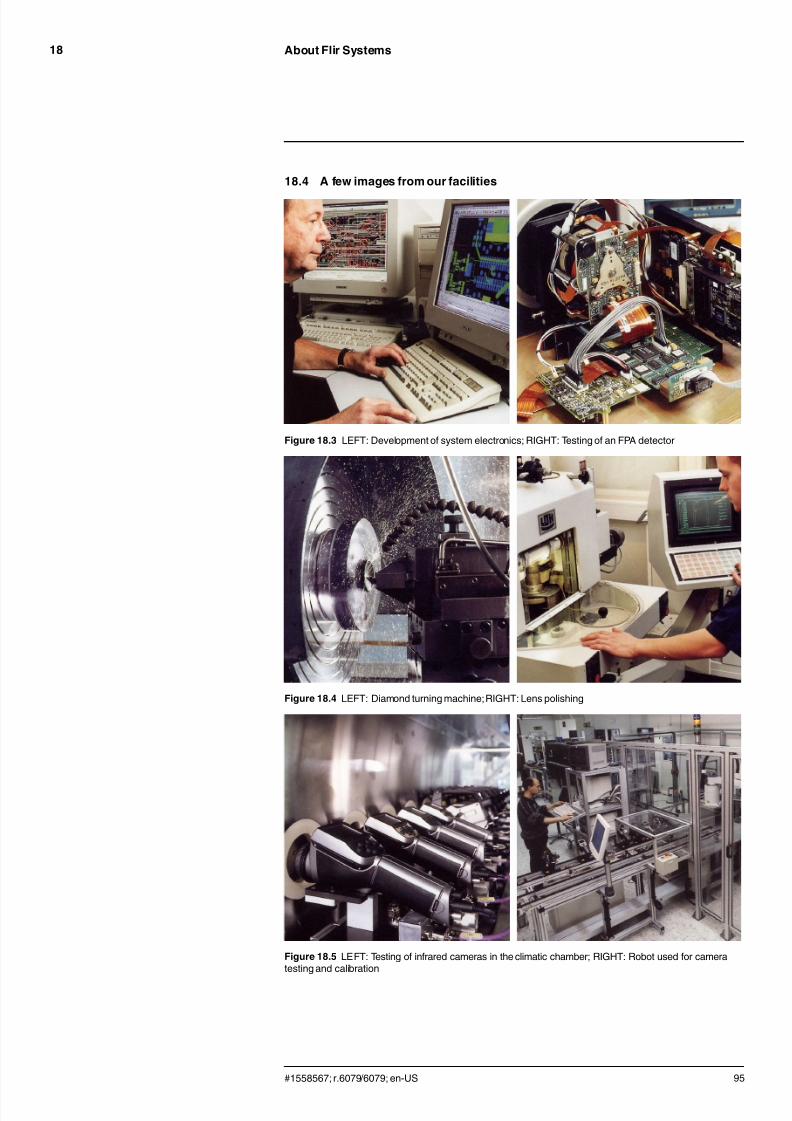
7/21/2019 Manual Reporter
http://slidepdf.com/reader/full/manual-reporter 103/140
About Flir Systems18
18.4 A few images from our facilities
Figure 18.3 LEFT: Development of system electronics; RIGHT: Testing of an FPA detector
Figure 18.4 LEFT: Diamond turning machine;RIGHT: Lens polishing
Figure 18.5 LEFT: Testing of infrared cameras in the climatic chamber; RIGHT: Robot used for cameratesting and calibration
#1558567; r.6079/6079; en-US 95
7/21/2019 Manual Reporter
http://slidepdf.com/reader/full/manual-reporter 104/140
Glossary19
absorption (ab-sorption factor)
The amount of radiation absorbed by an object relative to the re-ceived radiation. A number between 0 and 1.
atmosphere The gases between the object being measured and the camera, nor-mally air.
autoadjust A function making a camera perform an internal image correction.
autopalette The IR image is shown with an uneven spread of colors, displayingcold objects as well as hot ones at the same time.
blackbody Totally non-reflective object. All its radiation is due to its owntemperature.
blackbodyradiator An IR radiating equipment with blackbody properties used to cali-brate IR cameras.
calculatedat-mospherictransmission
A transmission value computed from the temperature, the relative hu-midity of air and the distance to the object.
cavity radiator A bottle shaped radiator with an absorbing inside, viewed throughthe bottleneck.
colortemperature
The temperature for which the color of a blackbody matches a specif-ic color.
conduction The process that makes heat diffuse into a material.
continuousadjust
A function that adjusts the image. The function works all the time,continuously adjusting brightness and contrast according to the im-age content.
convection Convection is a heat transfer mode where a fluid is brought into mo-tion, either by gravity or another force, thereby transferring heat fromone place to another.
dual isotherm An isotherm with two color bands, instead of one.
emissivity(emissivityfactor)
The amount of radiation coming from an object, compared to that ofa blackbody. A number between 0 and 1.
emittance Amount of energy emitted from an object per unit of time and area(W/m2)
environment Objects and gases that emit radiation towards the object beingmeasured.
estimated at-mospherictransmission
A transmissionvalue, supplied by a user, replacing a calculatedone
external optics Extra lenses, filters, heat shields etc. that can be put between thecamera and the object being measured.
filter A material transparent only to some of the infrared wavelengths.
#1558567; r.6079/6079; en-US 96

7/21/2019 Manual Reporter
http://slidepdf.com/reader/full/manual-reporter 105/140
Glossary19
FOV Field of view: The horizontal angle that can be viewed through an IRlens.
FPA Focal plane array: A type of IR detector.
graybody An object that emits a fixed fraction of the amount of energy of ablackbody for each wavelength.
IFOV Instantaneous field of view: A measure of the geometrical resolutionof an IR camera.
image correc-tion (internalorexternal)
A way of compensating for sensitivity differences in various parts oflive images and also of stabilizing the camera.
infrared Non-visible radiation, having a wavelength from about 2–13 μm.
IR infrared
isotherm A function highlightingthose parts of an image that fall above, belowor between one or more temperature intervals.
isothermalcavity
A bottle-shaped radiator with a uniform temperature viewed throughthe bottleneck.
Laser LocatIR An electrically powered light source on the camera that emits laserradiation in a thin, concentrated beam to point at certain parts of theobject in front of the camera.
laser pointer An electrically powered light source on the camera that emits laserradiation in a thin, concentrated beam to point at certain parts of theobject in front of the camera.
level The center value of the temperature scale, usually expressed as asignal value.
manual adjust A way to adjust the image by manually changing certain parameters.
NETD Noise equivalent temperature difference. A measure of the imagenoise level of an IR camera.
noise Undesired small disturbance in the infrared image
objectparameters
A set of values describing the circumstances under which the meas-urement of an object was made, and the object itself (such as emis-sivity, reflected apparent temperature, distance etc.)
object signal A non-calibratedvalue related to the amount of radiation received bythe camera from the object.
palette The set of colors used to display an IR image.
pixel Stands for picture element . One single spot in an image.
radiance Amount of energy emitted from an object per unit of time, area andangle (W/m2 /sr)
radiant power Amount of energy emitted from an object per unit of time (W)
#1558567; r.6079/6079; en-US 97

7/21/2019 Manual Reporter
http://slidepdf.com/reader/full/manual-reporter 106/140
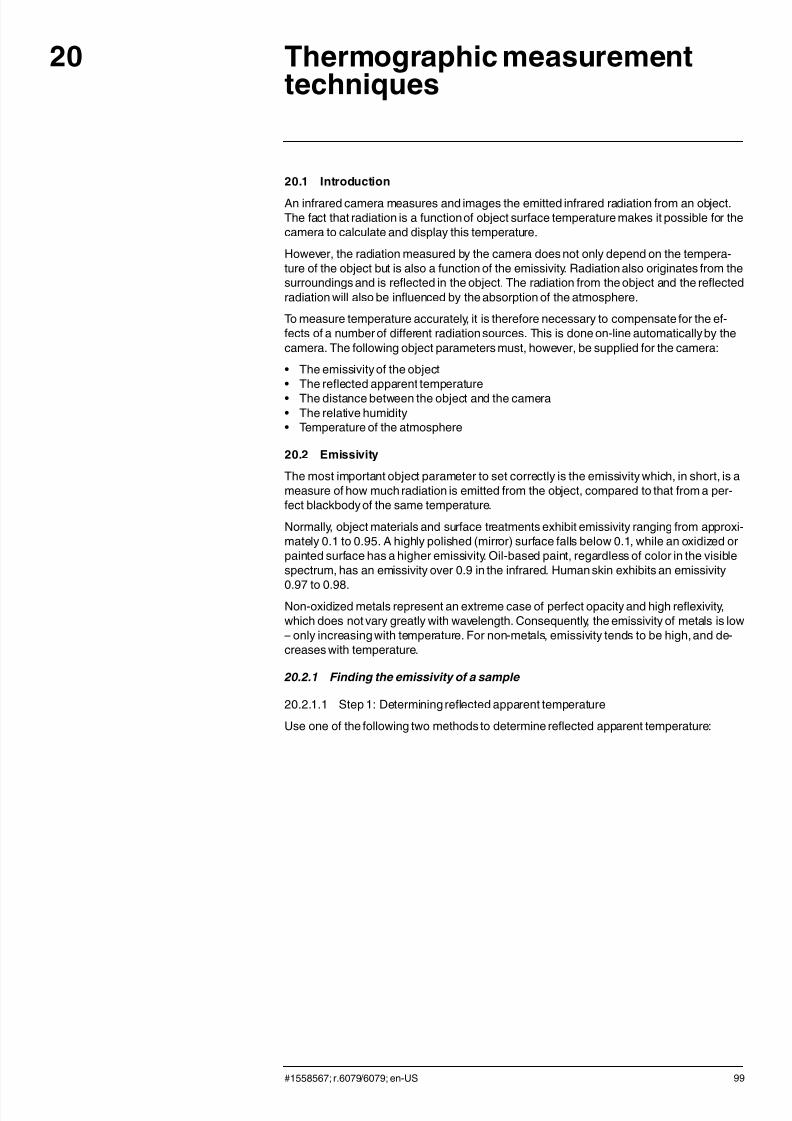
7/21/2019 Manual Reporter
http://slidepdf.com/reader/full/manual-reporter 107/140
Thermographic measurementtechniques
20
20.1 Introduction
An infrared camera measures and images the emitted infrared radiation from an object.The fact that radiation is a function of object surface temperature makes it possible for thecamera to calculate and display this temperature.
However, the radiation measured by the camera does not only depend on the tempera-ture of the object but is also a function of the emissivity. Radiation also originates from thesurroundings and is reflected in the object. The radiation from the object and the reflectedradiation will also be influenced by the absorption of the atmosphere.
To measure temperature accurately, it is therefore necessary to compensate for the ef-fects of a number of different radiation sources. This is done on-line automatically by thecamera. The following object parameters must, however, be supplied for the camera:
• The emissivity of the object• The reflected apparent temperature• The distance between the object and the camera• The relative humidity• Temperature of the atmosphere
20.2 Emissivity
The most important object parameter to set correctly is the emissivity which, in short, is ameasure of how much radiation is emitted from the object, compared to that from a per-fect blackbody of the same temperature.
Normally, object materials and surface treatments exhibit emissivity ranging from approxi-mately 0.1 to 0.95. A highly polished (mirror) surface falls below 0.1, while an oxidized orpainted surface has a higher emissivity. Oil-based paint, regardless of color in the visiblespectrum, has an emissivity over 0.9 in the infrared. Human skin exhibits an emissivity
0.97 to 0.98.Non-oxidized metals represent an extreme case of perfect opacity and high reflexivity,which does not vary greatly with wavelength. Consequently, the emissivity of metals is low– only increasing with temperature. For non-metals, emissivity tends to be high, and de-creases with temperature.
20.2.1 Finding the emissivity of a sample
20.2.1.1 Step 1: Determining reflected apparent temperature
Use one of the following two methods to determine reflected apparent temperature:
#1558567; r.6079/6079; en-US 99

7/21/2019 Manual Reporter
http://slidepdf.com/reader/full/manual-reporter 108/140
Thermographic measurement techniques20
20.2.1.1.1 Method 1: Direct method
Follow this procedure:
1. Look for possible reflection sources, consideringthat the incident angle = reflectionangle (a = b).
Figure 20.1 1 = Reflection source
2. If the reflection source is a spot source, modify the source by obstructing it using apiece if cardboard.
Figure 20.2 1 = Reflection source
#1558567; r.6079/6079; en-US 100
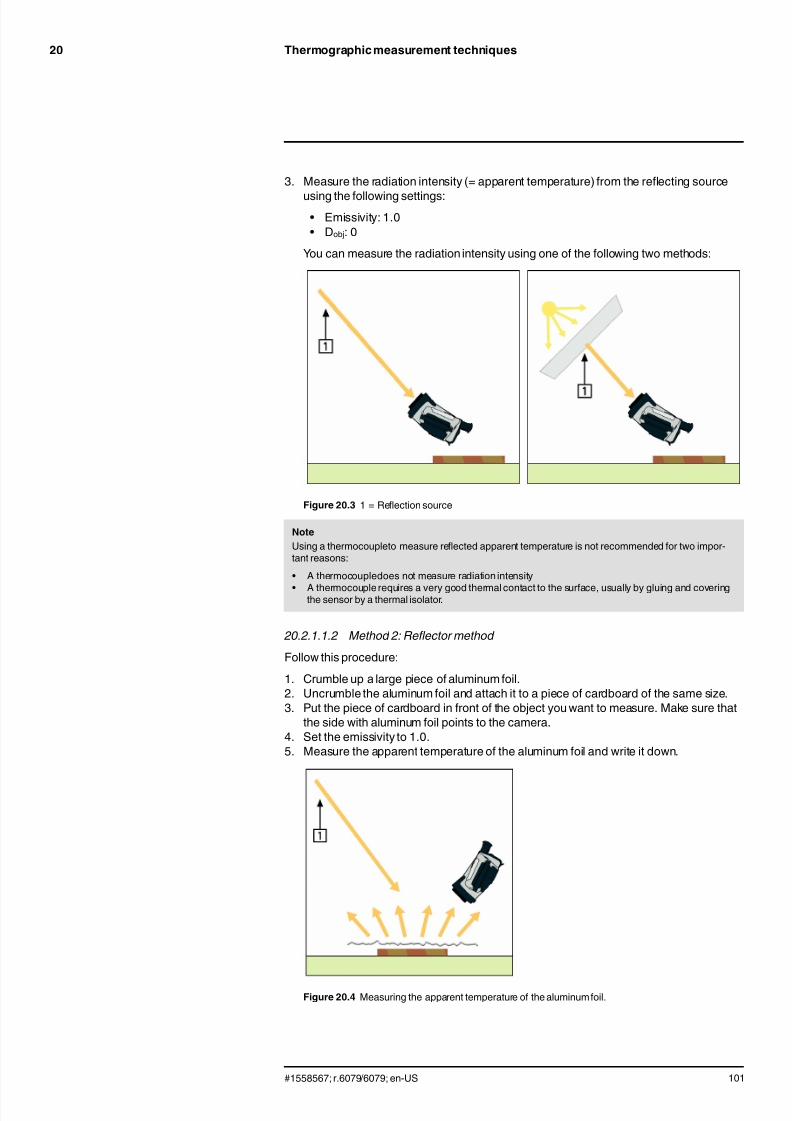
7/21/2019 Manual Reporter
http://slidepdf.com/reader/full/manual-reporter 109/140

7/21/2019 Manual Reporter
http://slidepdf.com/reader/full/manual-reporter 110/140
Thermographic measurement techniques20
20.2.1.2 Step 2: Determining the emissivity
Follow this procedure:
1. Select a place to put the sample.2. Determine and set reflected apparent temperature according to the previous
procedure.3. Put a piece of electrical tape with known high emissivity on the sample.4. Heat the sample at least 20 K above room temperature. Heating must be reasonably
even.5. Focus and auto-adjust the camera, and freeze the image.6. Adjust Level and Span for best image brightness and contrast.7. Set emissivity to that of the tape (usually 0.97).8. Measure the temperature of the tape using one of the following measurement
functions:
• Isotherm (helps you to determine both the temperature and how evenly you haveheated the sample)• Spot (simpler)• Box Avg (good for surfaces with varying emissivity).
9. Write down the temperature.10. Move your measurement function to the sample surface.11. Change the emissivity setting until you read the same temperature as your previous
measurement.12. Write down the emissivity.
Note
• Avoid forced convection• Look for a thermallystable surroundingthat will not generate spot reflections• Use high quality tape that you know is not transparent, and has a high emissivity you are certainof• This method assumes that the temperature of your tape and the sample surface are the same. If they
are not, your emissivity measurement will be wrong.
20.3 Reflected apparent temperature
This parameter is used to compensate for the radiation reflected in the object. If the emis-sivity is low and the object temperature relatively far from that of the reflected it will be im-portant to set and compensate for the reflected apparent temperature correctly.
20.4 Distance
The distance is the distance between the object and the front lens of the camera. This pa-rameter is used to compensate for the following two facts:
• That radiation from the target is absorbed by the atmosphere between the object andthe camera.
• That radiation from the atmosphere itself is detected by the camera.
20.5 Relative humidity
The camera can also compensate for the fact that the transmittance is also dependent onthe relative humidity of the atmosphere. To do this set the relative humidity to the correctvalue. For short distances and normal humidity the relative humidity can normally be leftat a default value of 50%.
20.6 Other parameters
In addition, some cameras and analysis programs from Flir Systems allow you to com-pensate for the following parameters:
• Atmospheric temperature – i.e. the temperature of the atmosphere between the cam-era and the target
• External optics temperature – i.e. the temperature of any external lenses or windowsused in front of the camera
#1558567; r.6079/6079; en-US 102

7/21/2019 Manual Reporter
http://slidepdf.com/reader/full/manual-reporter 111/140
Thermographic measurement techniques20
• External optics transmittance – i.e. the transmission of any external lenses or windows
used in front of the camera
#1558567; r.6079/6079; en-US 103
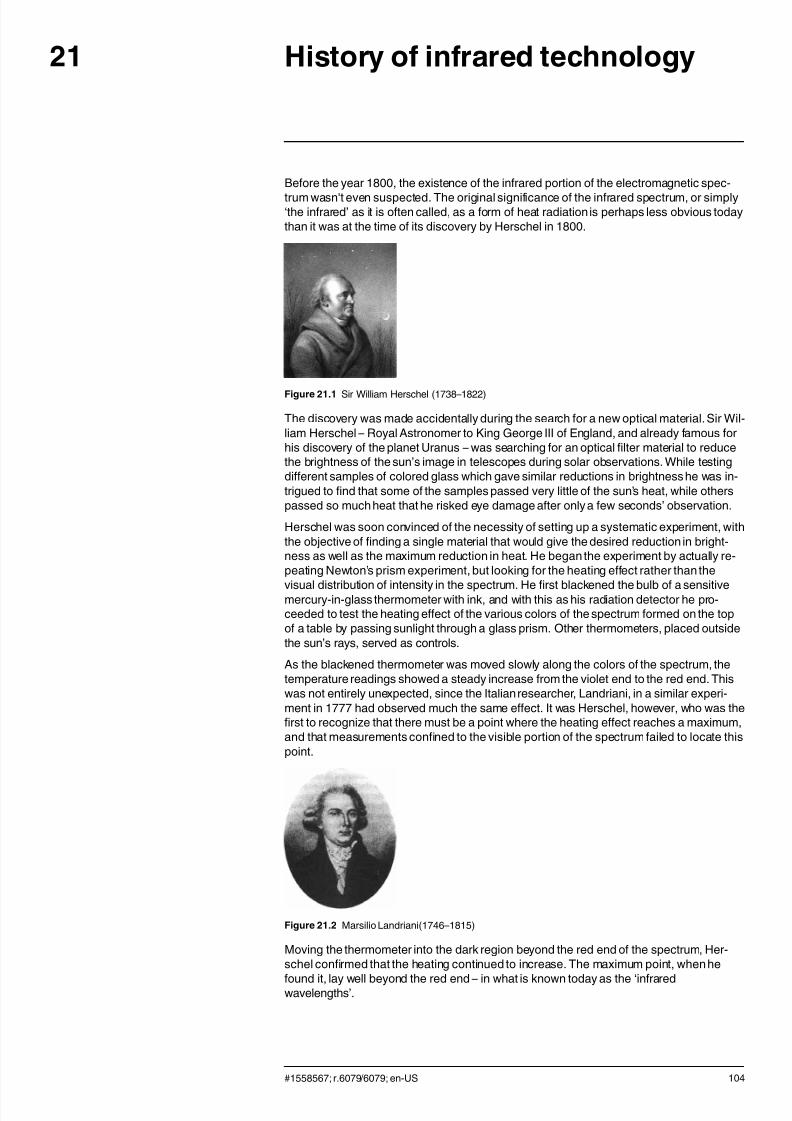
7/21/2019 Manual Reporter
http://slidepdf.com/reader/full/manual-reporter 112/140
History of infrared technology21
Before the year 1800, the existence of the infrared portion of the electromagnetic spec-
trum wasn't even suspected. The original significance of the infrared spectrum, or simply‘the infrared’ as it is often called, as a form of heat radiation is perhaps less obvious todaythan it was at the time of its discovery by Herschel in 1800.
Figure 21.1 Sir William Herschel (1738–1822)
The discovery was made accidentally during the search for a new optical material. Sir Wil-liam Herschel – Royal Astronomer to King George III of England, and already famous forhis discovery of the planet Uranus – was searching for an optical filter material to reducethe brightness of the sun’s image in telescopes during solar observations. While testingdifferent samples of colored glass which gave similar reductions in brightness he was in-trigued to find that some of the samples passed very little of the sun’s heat, while otherspassed so much heat that he risked eye damage after only a few seconds’ observation.
Herschel was soon convinced of the necessity of setting up a systematic experiment, withthe objective of finding a single material that would give the desired reduction in bright-ness as well as the maximum reduction in heat. He began the experiment by actually re-peating Newton’s prism experiment, but looking for the heating effect rather than the
visual distribution of intensity in the spectrum. He first blackened the bulb of a sensitivemercury-in-glass thermometer with ink, and with this as his radiation detector he pro-ceeded to test the heating effect of the various colors of the spectrum formed on the topof a table by passing sunlight through a glass prism. Other thermometers, placed outsidethe sun’s rays, served as controls.
As the blackened thermometer was moved slowly along the colors of the spectrum, thetemperature readings showed a steady increase from the violet end to the red end. Thiswas not entirely unexpected, since the Italian researcher, Landriani, in a similar experi-ment in 1777 had observed much the same effect. It was Herschel, however, who was thefirst to recognize that there must be a point where the heating effect reaches a maximum,and that measurements confined to the visible portion of the spectrum failed to locate thispoint.
Figure 21.2 Marsilio Landriani(1746–1815)
Moving the thermometer into the dark region beyond the red end of the spectrum, Her-schel confirmed that the heating continued to increase. The maximum point, when he
found it, lay well beyond the red end – in what is known today as the ‘infraredwavelengths’.
#1558567; r.6079/6079; en-US 104

7/21/2019 Manual Reporter
http://slidepdf.com/reader/full/manual-reporter 113/140
History of infrared technology21
When Herschel revealed his discovery, he referred to this new portion of the electromag-
netic spectrum as the ‘thermometrical spectrum’. The radiation itself he sometimes re-ferred to as ‘dark heat’, or simply ‘the invisible rays’. Ironically, and contrary to popularopinion, it wasn't Herschel who originatedthe term ‘infrared’. The word only began to ap-pear in print around 75 years later, and it is still unclear who should receive credit as theoriginator.
Herschel’s use of glass in the prism of his original experiment led to some early controver-sies with his contemporaries about the actual existence of the infrared wavelengths. Dif-ferent investigators, in attempting to confirm his work, used various types of glassindiscriminately, having different transparencies in the infrared. Through his later experi-ments, Herschel was aware of the limited transparencyof glass to the newly-discoveredthermal radiation, and he was forced to conclude that optics for the infrared would prob-ably be doomed to the use of reflective elements exclusively (i.e. plane and curved mir-rors). Fortunately, this proved to be true only until 1830, when the Italian investigator,
Melloni, made his great discovery that naturally occurring rock salt (NaCl) – which wasavailable in large enough natural crystals to be made into lenses and prisms – is remark-ably transparent to the infrared. The result was that rock salt became the principal infraredoptical material, and remained so for the next hundred years, until the art of syntheticcrystal growing was mastered in the 1930’s.
Figure 21.3 Macedonio Melloni (1798–1854)
Thermometers, as radiation detectors, remained unchallenged until 1829, the year Nobiliinvented the thermocouple. (Herschel’s own thermometer could be read to 0.2 °C(0.036 °F), and later models were able to be read to 0.05 °C (0.09 °F)). Then a break-through occurred; Melloni connected a number of thermocouples in series to form the firstthermopile. The new device was at least 40 times as sensitive as the best thermometer ofthe day for detecting heat radiation – capable of detecting the heat from a person standingthree meters away.
The first so-called ‘heat-picture’ became possible in 1840, the result of work by Sir John
Herschel, son of the discoverer of the infrared and a famous astronomer in his own right.Based upon the differential evaporation of a thin film of oil when exposed to a heat patternfocused upon it, the thermal image could be seen by reflected light where the interferenceeffects of the oil film made the image visible to the eye. Sir John also managedto obtain aprimitive record of the thermal image on paper, which he called a ‘thermograph’.
#1558567; r.6079/6079; en-US 105
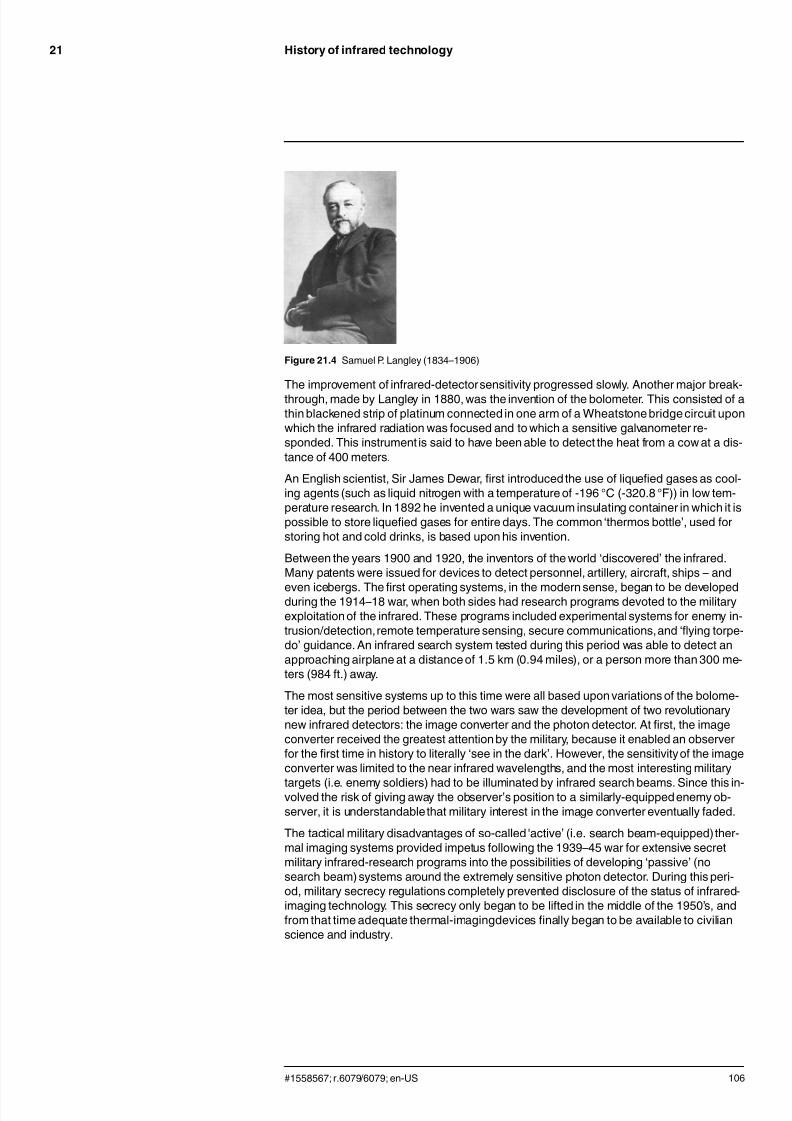
7/21/2019 Manual Reporter
http://slidepdf.com/reader/full/manual-reporter 114/140
History of infrared technology21
Figure 21.4 Samuel P. Langley (1834–1906)
The improvement of infrared-detectorsensitivity progressed slowly. Another major break-through, made by Langley in 1880, was the invention of the bolometer. This consisted of athin blackened strip of platinum connected in one arm of a Wheatstone bridge circuit uponwhich the infrared radiation was focused and to which a sensitive galvanometer re-sponded. This instrument is said to have been able to detect the heat from a cow at a dis-tance of 400 meters.
An English scientist, Sir James Dewar, first introducedthe use of liquefied gases as cool-ing agents (such as liquid nitrogen with a temperature of -196 °C (-320.8 °F)) in low tem-perature research. In 1892 he invented a unique vacuum insulating container in which it ispossible to store liquefied gases for entire days. The common ‘thermos bottle’, used forstoring hot and cold drinks, is based upon his invention.
Between the years 1900 and 1920, the inventors of the world ‘discovered’ the infrared.Many patents were issued for devices to detect personnel, artillery, aircraft, ships – and
even icebergs. The first operating systems, in the modern sense, began to be developedduring the 1914–18 war, when both sides had research programs devoted to the militaryexploitation of the infrared. These programs included experimental systems for enemy in-trusion/detection,remote temperature sensing, secure communications,and ‘flying torpe-do’ guidance. An infrared search system tested during this period was able to detect anapproaching airplane at a distance of 1.5 km (0.94 miles), or a person more than 300 me-ters (984 ft.) away.
The most sensitive systems up to this time were all based upon variations of the bolome-ter idea, but the period between the two wars saw the development of two revolutionarynew infrared detectors: the image converter and the photon detector. At first, the imageconverter received the greatest attention by the military, because it enabled an observerfor the first time in history to literally ‘see in the dark’. However, the sensitivity of the imageconverter was limited to the near infrared wavelengths, and the most interesting military
targets (i.e. enemy soldiers) had to be illuminated by infrared search beams. Since this in-volved the risk of giving away the observer’s position to a similarly-equippedenemy ob-server, it is understandablethat military interest in the image converter eventually faded.
The tactical military disadvantages of so-called 'active’ (i.e. search beam-equipped)ther-mal imaging systems provided impetus following the 1939–45 war for extensive secretmilitary infrared-research programs into the possibilities of developing ‘passive’ (nosearch beam) systems around the extremely sensitive photon detector. During this peri-od, military secrecy regulations completely prevented disclosure of the status of infrared-imaging technology. This secrecy only began to be lifted in the middle of the 1950’s, andfrom that time adequate thermal-imagingdevices finally began to be available to civilianscience and industry.
#1558567; r.6079/6079; en-US 106

7/21/2019 Manual Reporter
http://slidepdf.com/reader/full/manual-reporter 115/140
Theory of thermography22
22.1 Introduction
The subjects of infrared radiation and the related technique of thermography are still newto many who will use an infrared camera. In this section the theory behind thermographywill be given.
22.2 The electromagnetic spectrum
The electromagnetic spectrum is divided arbitrarily into a number of wavelength regions,called bands, distinguished by the methods used to produce and detect the radiation.There is no fundamentaldifference between radiation in the different bands of the electro-magnetic spectrum. They are all governed by the same laws and the only differences arethose due to differences in wavelength.
Figure 22.1 The electromagnetic spectrum. 1: X-ray; 2: UV; 3: Visible; 4: IR; 5: Microwaves; 6:Radiowaves.
Thermography makes use of the infrared spectral band. At the short-wavelength end theboundary lies at the limit of visual perception, in the deep red. At the long-wavelength endit merges with the microwave radio wavelengths, in the millimeter range.
The infrared band is often further subdivided into four smaller bands, the boundaries ofwhich are also arbitrarily chosen. They include: the near infrared (0.75–3 μm), the middle
infrared (3–6 μm), the far infrared (6–15 μm) and the extreme infrared (15–100 μm).
Although the wavelengths are given in μm (micrometers), other units are often still used tomeasure wavelength in this spectral region, e.g. nanometer (nm) and Ångström (Å).
The relationships between the different wavelength measurements is:
22.3 Blackbody radiation
A blackbody is defined as an object which absorbs all radiation that impinges on it at anywavelength. The apparent misnomer black relating to an object emitting radiation is ex-plained by Kirchhoff’s Law (after Gustav Robert Kirchhoff , 1824–1887), which states thata body capable of absorbing all radiation at any wavelength is equally capable in theemission of radiation.
#1558567; r.6079/6079; en-US 107
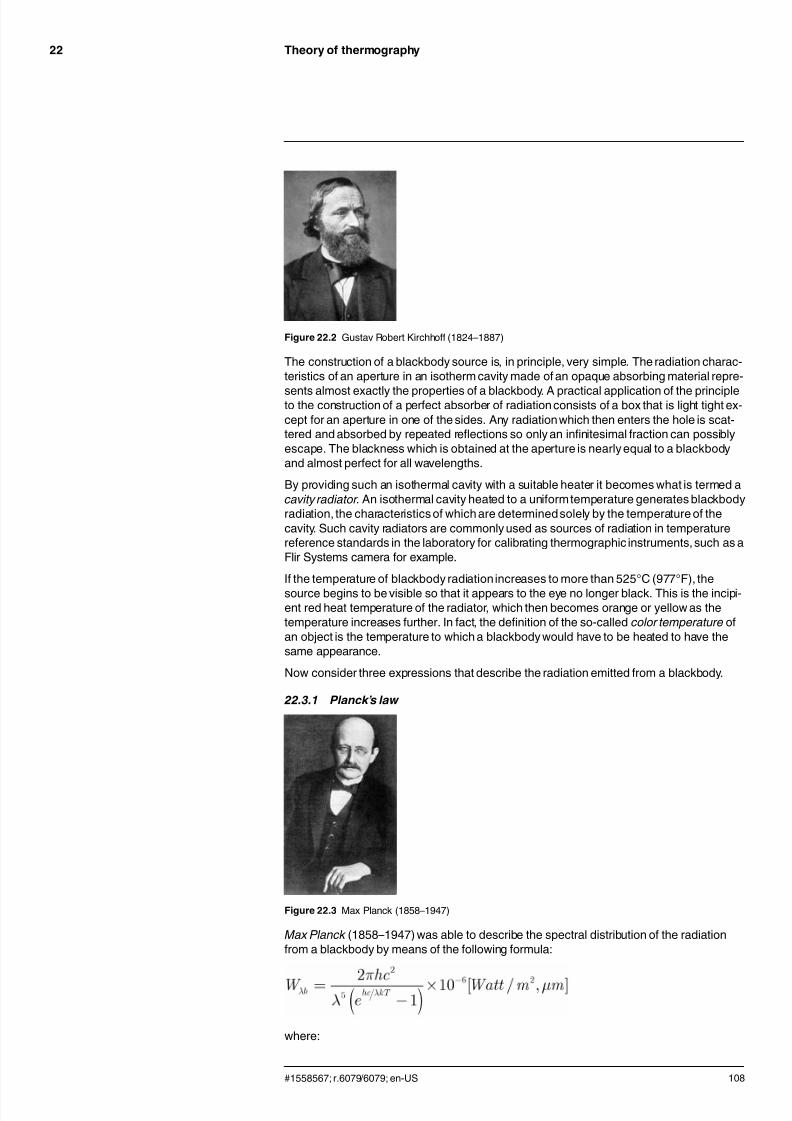
7/21/2019 Manual Reporter
http://slidepdf.com/reader/full/manual-reporter 116/140
Theory of thermography22
Figure 22.2 Gustav Robert Kirchhoff (1824–1887)
The construction of a blackbody source is, in principle, very simple. The radiation charac-teristics of an aperture in an isotherm cavity made of an opaque absorbing material repre-
sents almost exactly the properties of a blackbody. A practical application of the principleto the construction of a perfect absorber of radiation consists of a box that is light tight ex-cept for an aperture in one of the sides. Any radiation which then enters the hole is scat-tered and absorbed by repeated reflections so only an infinitesimal fraction can possiblyescape. The blackness which is obtained at the aperture is nearly equal to a blackbodyand almost perfect for all wavelengths.
By providing such an isothermal cavity with a suitable heater it becomes what is termed acavity radiator . An isothermal cavity heated to a uniform temperature generates blackbodyradiation, the characteristics of which are determinedsolely by the temperature of thecavity. Such cavity radiators are commonly used as sources of radiation in temperaturereference standards in the laboratory for calibrating thermographic instruments, such as aFlir Systems camera for example.
If the temperature of blackbody radiation increases to more than 525°C (977°F), the
source begins to be visible so that it appears to the eye no longer black. This is the incipi-ent red heat temperature of the radiator, which then becomes orange or yellow as thetemperature increases further. In fact, the definition of the so-called color temperature ofan object is the temperature to which a blackbody would have to be heated to have thesame appearance.
Now consider three expressions that describe the radiation emitted from a blackbody.
22.3.1 Planck’s law
Figure 22.3 Max Planck (1858–1947)
Max Planck (1858–1947) was able to describe the spectral distribution of the radiationfrom a blackbody by means of the following formula:
where:
#1558567; r.6079/6079; en-US 108
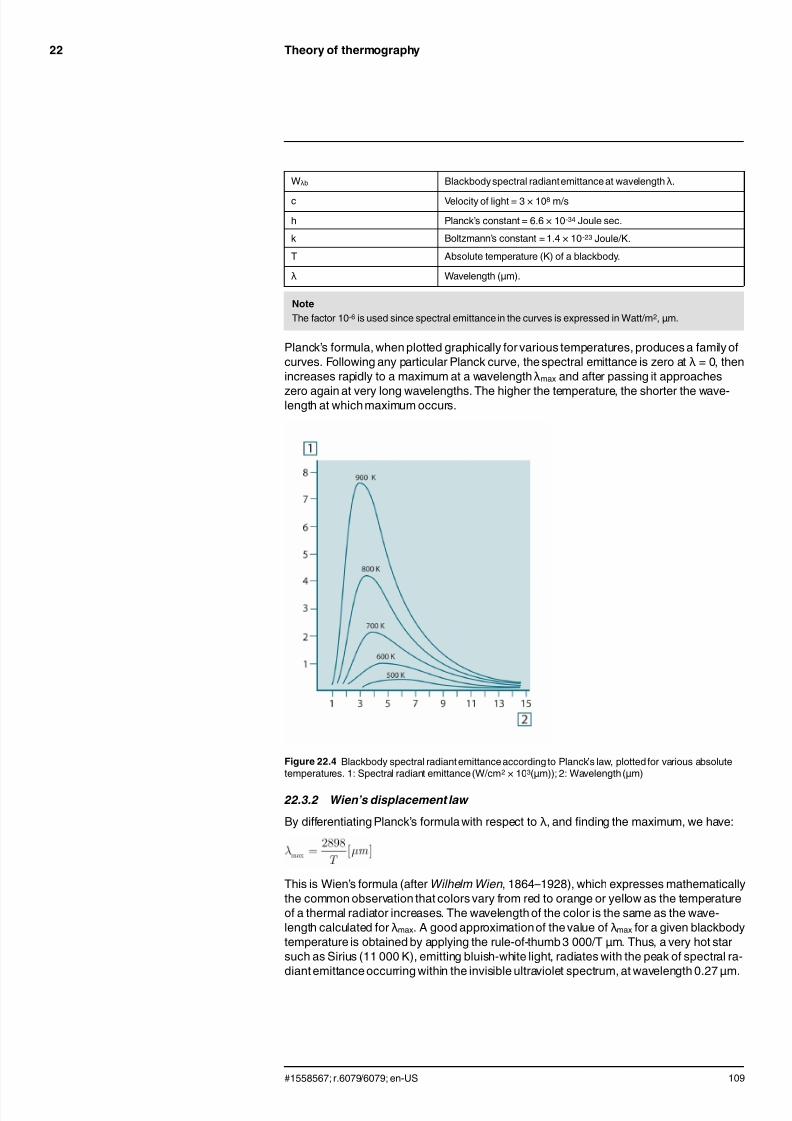
7/21/2019 Manual Reporter
http://slidepdf.com/reader/full/manual-reporter 117/140
Theory of thermography22
Wλb Blackbodyspectral radiantemittance at wavelength λ.
c Velocity of light = 3 × 10⁸ m/s
h Planck’s constant = 6.6 × 10⁻³⁴ Joule sec.
k Boltzmann’s constant = 1.4 × 10⁻²³ Joule/K.
T Absolute temperature (K) of a blackbody.
λ Wavelength (μm).
Note
The factor 10-6 is used since spectral emittance in the curves is expressed in Watt/m2, μm.
Planck’s formula, when plotted graphically for various temperatures, produces a family ofcurves. Following any particular Planck curve, the spectral emittance is zero at λ = 0, thenincreases rapidly to a maximum at a wavelength λmax and after passing it approaches
zero again at very long wavelengths. The higher the temperature, the shorter the wave-length at which maximum occurs.
Figure 22.4 Blackbody spectral radiant emittance according to Planck’s law, plotted for various absolutetemperatures. 1: Spectral radiant emittance(W/cm2 × 103(μm)); 2: Wavelength (μm)
22.3.2 Wien’s displacement law
By differentiating Planck’s formula with respect to λ, and finding the maximum, we have:
This is Wien’s formula (after Wilhelm Wien, 1864–1928), which expresses mathematicallythe common observation that colors vary from red to orange or yellow as the temperatureof a thermal radiator increases. The wavelength of the color is the same as the wave-length calculated for λmax. A good approximation of the value of λmax for a given blackbodytemperature is obtained by applying the rule-of-thumb 3 000/T μm. Thus, a very hot starsuch as Sirius (11 000 K), emitting bluish-white light, radiates with the peak of spectral ra-diant emittance occurring within the invisible ultraviolet spectrum, at wavelength 0.27 μm.
#1558567; r.6079/6079; en-US 109
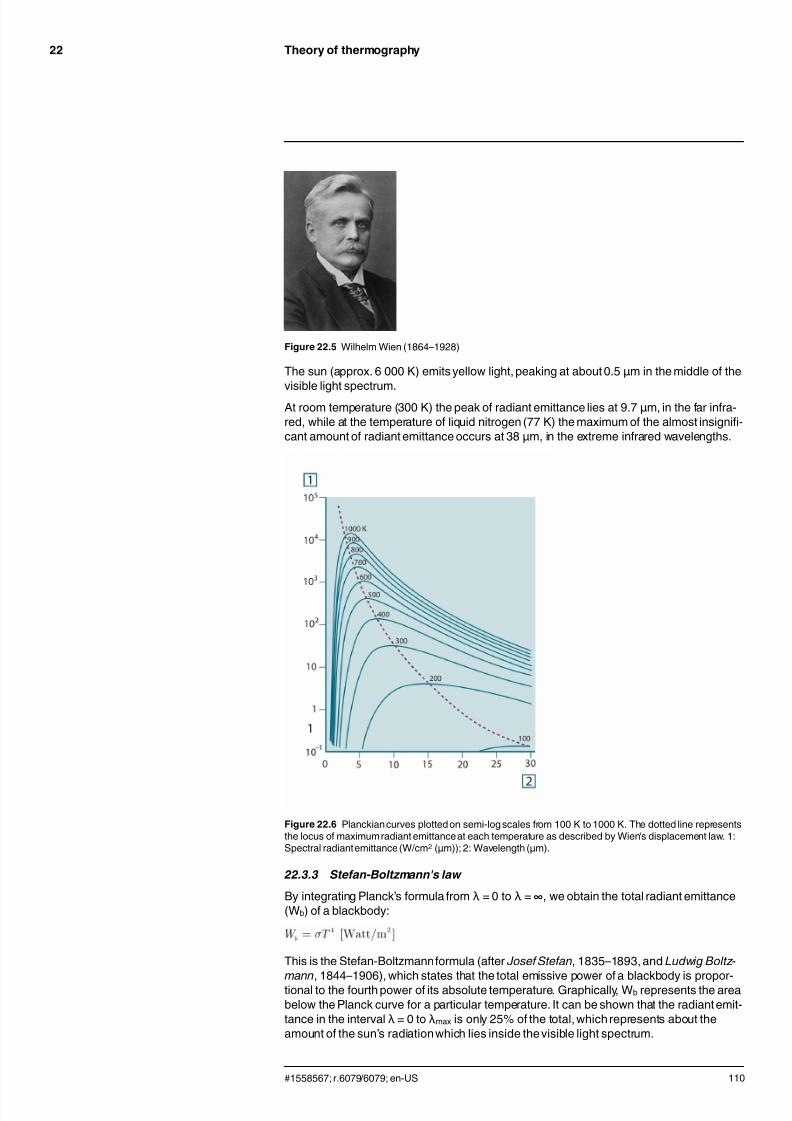
7/21/2019 Manual Reporter
http://slidepdf.com/reader/full/manual-reporter 118/140
Theory of thermography22
Figure 22.5 Wilhelm Wien (1864–1928)
The sun (approx. 6 000 K) emits yellow light, peaking at about 0.5 μm in the middle of thevisible light spectrum.
At room temperature (300 K) the peak of radiant emittance lies at 9.7 μm, in the far infra-red, while at the temperature of liquid nitrogen (77 K) the maximum of the almost insignifi-cant amount of radiant emittance occurs at 38 μm, in the extreme infrared wavelengths.
Figure 22.6 Planckian curves plotted on semi-log scales from 100 K to 1000 K. The dotted line representsthe locus of maximum radiant emittanceat each temperature as described by Wien's displacement law. 1:Spectral radiantemittance (W/cm2 (μm)); 2: Wavelength (μm).
22.3.3 Stefan-Boltzmann's law
By integrating Planck’s formula from λ = 0 to λ = ∞, we obtain the total radiant emittance(Wb) of a blackbody:
This is the Stefan-Boltzmannformula (after Josef Stefan, 1835–1893, and Ludwig Boltz-
mann, 1844–1906), which states that the total emissive power of a blackbody is propor-tional to the fourth power of its absolute temperature. Graphically, Wb represents the areabelow the Planck curve for a particular temperature. It can be shown that the radiant emit-tance in the interval λ = 0 to λmax is only 25% of the total, which represents about theamount of the sun’s radiation which lies inside the visible light spectrum.
#1558567; r.6079/6079; en-US 110
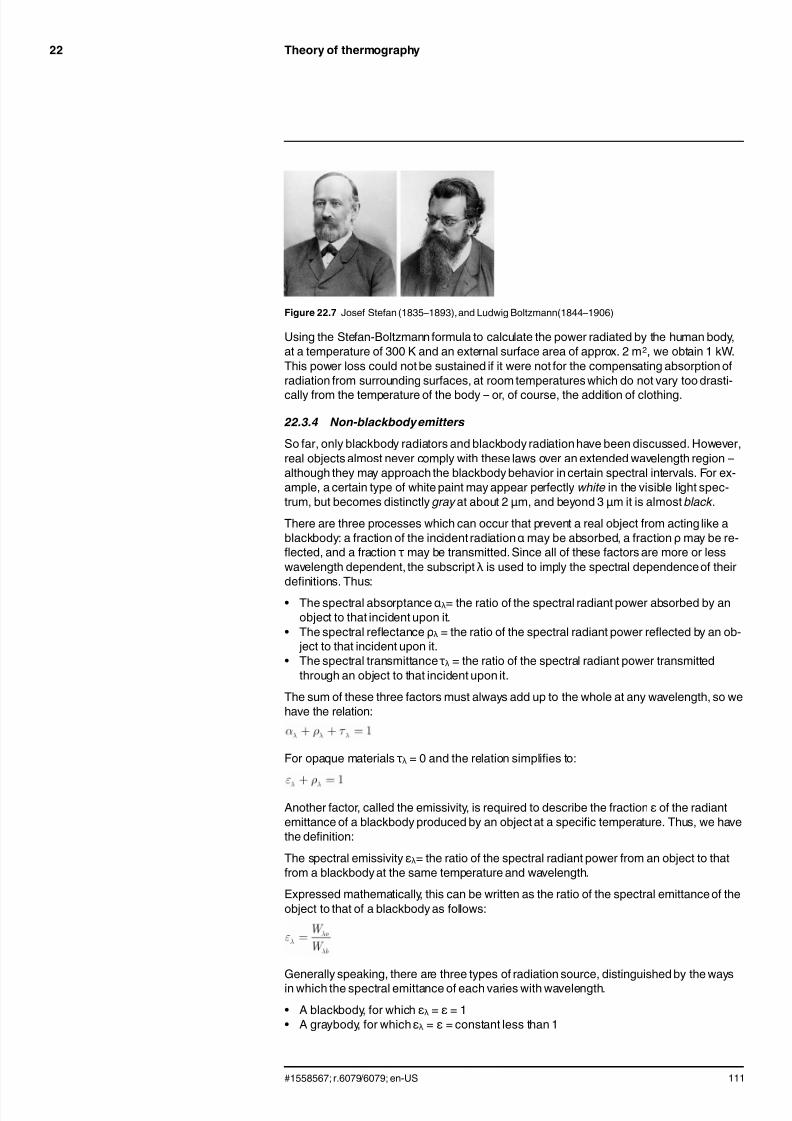
7/21/2019 Manual Reporter
http://slidepdf.com/reader/full/manual-reporter 119/140
Theory of thermography22
Figure 22.7 Josef Stefan (1835–1893),and Ludwig Boltzmann(1844–1906)
Using the Stefan-Boltzmann formula to calculate the power radiated by the human body,at a temperature of 300 K and an external surface area of approx. 2 m2, we obtain 1 kW.This power loss could not be sustained if it were not for the compensating absorption ofradiation from surrounding surfaces, at room temperatures which do not vary too drasti-
cally from the temperature of the body – or, of course, the addition of clothing.
22.3.4 Non-blackbody emitters
So far, only blackbody radiators and blackbody radiation have been discussed. However,real objects almost never comply with these laws over an extended wavelength region –although they may approach the blackbody behavior in certain spectral intervals. For ex-ample, a certain type of white paint may appear perfectly white in the visible light spec-trum, but becomes distinctly gray at about 2 μm, and beyond 3 μm it is almost black .
There are three processes which can occur that prevent a real object from acting like ablackbody: a fraction of the incident radiation α may be absorbed, a fraction ρ may be re-flected, and a fraction τ may be transmitted. Since all of these factors are more or lesswavelength dependent, the subscript λ is used to imply the spectral dependence of theirdefinitions. Thus:
• The spectral absorptance αλ= the ratio of the spectral radiant power absorbed by anobject to that incident upon it.
• The spectral reflectance ρλ = the ratio of the spectral radiant power reflected by an ob- ject to that incident upon it.
• The spectral transmittance τλ = the ratio of the spectral radiant power transmittedthrough an object to that incident upon it.
The sum of these three factors must always add up to the whole at any wavelength, so wehave the relation:
For opaque materials τλ = 0 and the relation simplifies to:
Another factor, called the emissivity, is required to describe the fraction ε of the radiantemittance of a blackbody produced by an object at a specific temperature. Thus, we havethe definition:
The spectral emissivity ελ= the ratio of the spectral radiant power from an object to thatfrom a blackbody at the same temperature and wavelength.
Expressed mathematically, this can be written as the ratio of the spectral emittance of theobject to that of a blackbody as follows:
Generally speaking, there are three types of radiation source, distinguished by the waysin which the spectral emittance of each varies with wavelength.
• A blackbody, for which ελ = ε = 1• A graybody, for which ελ = ε = constant less than 1
#1558567; r.6079/6079; en-US 111
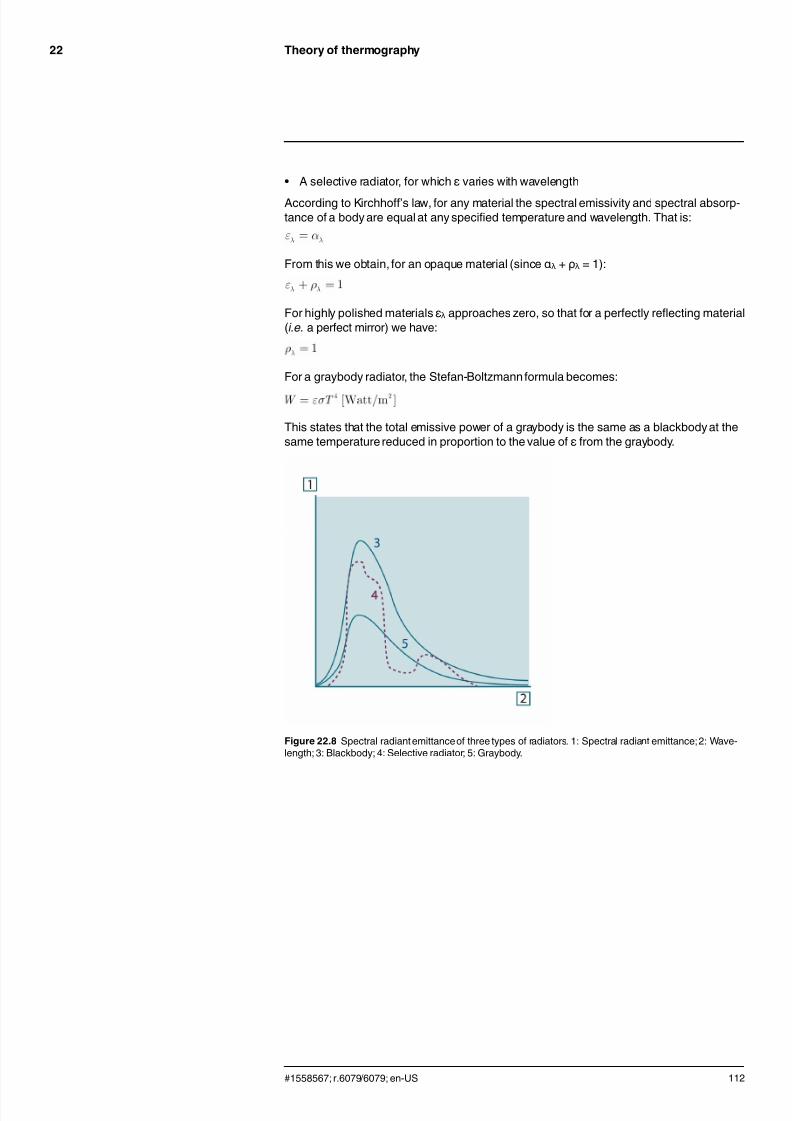
7/21/2019 Manual Reporter
http://slidepdf.com/reader/full/manual-reporter 120/140
Theory of thermography22
• A selective radiator, for which ε varies with wavelength
According to Kirchhoff’s law, for any material the spectral emissivity and spectral absorp-tance of a body are equal at any specified temperature and wavelength. That is:
From this we obtain, for an opaque material (since αλ + ρλ = 1):
For highly polished materials ελ approaches zero, so that for a perfectly reflecting material(i.e. a perfect mirror) we have:
For a graybody radiator, the Stefan-Boltzmann formula becomes:
This states that the total emissive power of a graybody is the same as a blackbody at thesame temperature reduced in proportion to the value of ε from the graybody.
Figure 22.8 Spectral radiant emittanceof three types of radiators. 1: Spectral radiant emittance;2: Wave-length; 3: Blackbody; 4: Selective radiator; 5: Graybody.
#1558567; r.6079/6079; en-US 112

7/21/2019 Manual Reporter
http://slidepdf.com/reader/full/manual-reporter 121/140
Theory of thermography22
Figure 22.9 Spectral emissivity of three types of radiators. 1: Spectral emissivity; 2: Wavelength; 3: Black-body; 4: Graybody; 5: Selective radiator.
22.4 Infrared semi-transparent materials
Consider now a non-metallic, semi-transparent body – let us say, in the form of a thick flatplate of plastic material. When the plate is heated, radiation generated within its volumemust work its way toward the surfaces through the material in which it is partially ab-sorbed. Moreover, when it arrives at the surface, some of it is reflected back into the interi-or. The back-reflected radiation is again partially absorbed, but some of it arrives at theother surface, through which most of it escapes; part of it is reflected back again.Although the progressive reflections become weaker and weaker they must all be addedup when the total emittance of the plate is sought. When the resulting geometrical seriesis summed, the effective emissivity of a semi-transparent plate is obtained as:
When the plate becomes opaque this formula is reduced to the single formula:
This last relation is a particularly convenient one, because it is often easier to measure re-flectance than to measure emissivity directly.
#1558567; r.6079/6079; en-US 113

7/21/2019 Manual Reporter
http://slidepdf.com/reader/full/manual-reporter 122/140
The measurement formula23
As already mentioned, when viewing an object, the camera receives radiation not only
from the object itself. It also collects radiation from the surroundings reflected via the ob- ject surface. Both these radiation contributions become attenuated to some extent by theatmosphere in the measurement path. To this comes a third radiation contribution fromthe atmosphere itself.
This description of the measurement situation, as illustrated in the figure below, is so far afairly true description of the real conditions. What has been neglectedcould for instancebe sun light scattering in the atmosphere or stray radiation from intense radiation sourcesoutside the field of view. Such disturbances are difficult to quantify, however, in mostcases they are fortunately small enough to be neglected. In case they are not negligible,the measurement configuration is likely to be such that the risk for disturbance is obvious,at least to a trained operator. It is then his responsibility to modify the measurement situa-tion to avoid the disturbance e.g. by changing the viewing direction, shielding off intenseradiation sources etc.
Accepting the description above, we can use the figure below to derive a formula for thecalculation of the object temperature from the calibrated camera output.
Figure 23.1 A schematic representation of the general thermographic measurement situation.1:Surround-ings; 2: Object; 3: Atmosphere; 4: Camera
Assume that the received radiation power W from a blackbody source of temperatureTsource on short distance generates a camera output signal Usource that is proportional tothe power input (power linear camera). We can then write (Equation 1):
or, with simplified notation:
where C is a constant.
Should the source be a graybody with emittance ε, the received radiation would conse-quently be εWsource.
We are now ready to write the three collected radiation power terms:
1. Emission from the object = ετWobj, where ε is the emittance of the object and τ is thetransmittance of the atmosphere. The object temperature is Tobj.
#1558567; r.6079/6079; en-US 114
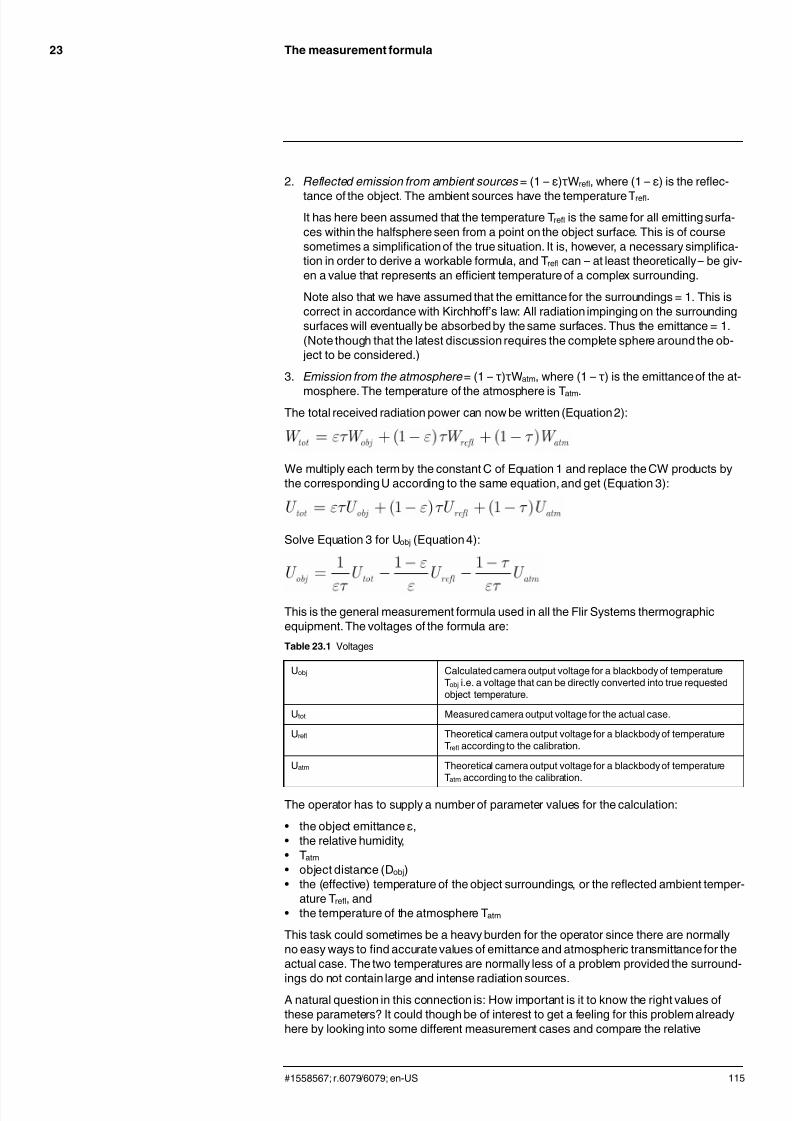
7/21/2019 Manual Reporter
http://slidepdf.com/reader/full/manual-reporter 123/140
The measurement formula23
2. Reflected emission from ambient sources = (1 – ε)τWrefl, where (1 – ε) is the reflec-
tance of the object. The ambient sources have the temperature Trefl.It has here been assumed that the temperature Trefl is the same for all emitting surfa-ces within the halfsphere seen from a point on the object surface. This is of coursesometimes a simplification of the true situation. It is, however, a necessary simplifica-tion in order to derive a workable formula, and Trefl can – at least theoretically – be giv-en a value that represents an efficient temperature of a complex surrounding.
Note also that we have assumed that the emittance for the surroundings = 1. This iscorrect in accordance with Kirchhoff’s law: All radiation impinging on the surroundingsurfaces will eventually be absorbed by the same surfaces. Thus the emittance = 1.(Note though that the latest discussion requires the complete sphere around the ob-
ject to be considered.)
3. Emission from the atmosphere = (1 – τ)τWatm, where (1 – τ) is the emittance of the at-
mosphere. The temperature of the atmosphere is Tatm.The total received radiation power can now be written (Equation 2):
We multiply each term by the constant C of Equation 1 and replace the CW products bythe corresponding U according to the same equation, and get (Equation 3):
Solve Equation 3 for Uobj (Equation 4):
This is the general measurement formula used in all the Flir Systems thermographicequipment. The voltages of the formula are:
Table 23.1 Voltages
Uobj Calculated camera output voltage for a blackbody of temperatureTobj i.e. a voltage that can be directly converted into true requestedobject temperature.
Utot Measured camera output voltage for the actual case.
Urefl Theoretical camera output voltage for a blackbodyof temperatureTrefl according to the calibration.
Uatm Theoretical camera output voltage for a blackbodyof temperatureTatm according to the calibration.
The operator has to supply a number of parameter values for the calculation:
• the object emittance ε,• the relative humidity,• Tatm
• object distance (Dobj)• the (effective) temperature of the object surroundings, or the reflected ambient temper-
ature Trefl, and• the temperature of the atmosphere Tatm
This task could sometimes be a heavy burden for the operator since there are normallyno easy ways to find accurate values of emittance and atmospheric transmittance for theactual case. The two temperatures are normally less of a problem provided the surround-
ings do not contain large and intense radiation sources.A natural question in this connection is: How important is it to know the right values ofthese parameters? It could though be of interest to get a feeling for this problem alreadyhere by looking into some different measurement cases and compare the relative
#1558567; r.6079/6079; en-US 115

7/21/2019 Manual Reporter
http://slidepdf.com/reader/full/manual-reporter 124/140
The measurement formula23
magnitudes of the three radiation terms. This will give indications about when it is impor-
tant to use correct values of which parameters.The figures below illustrates the relative magnitudes of the three radiation contributionsfor three different object temperatures, two emittances, and two spectral ranges: SW andLW. Remaining parameters have the following fixed values:
• τ = 0.88• Trefl = +20°C (+68°F)• Tatm = +20°C (+68°F)
It is obvious that measurement of low object temperatures are more critical than measur-ing high temperatures since the ‘disturbing’ radiation sources are relatively much strongerin the first case. Should also the object emittance be low, the situation would be still moredifficult.
We have finally to answer a question about the importance of being allowed to use thecalibration curve above the highest calibration point, what we call extrapolation. Imaginethat we in a certain case measure Utot = 4.5 volts. The highest calibration point for thecamera was in the order of 4.1 volts, a value unknown to the operator. Thus, even if theobject happened to be a blackbody, i.e. Uobj = Utot, we are actually performing extrapola-tion of the calibration curve when converting 4.5 volts into temperature.
Let us now assume that the object is not black, it has an emittance of 0.75, and the trans-mittance is 0.92. We also assume that the two second terms of Equation 4 amount to 0.5volts together. Computation of Uobj by means of Equation 4 then results in Uobj = 4.5 / 0.75
/ 0.92 – 0.5 = 6.0. This is a rather extreme extrapolation, particularly when consideringthat the video amplifier might limit the output to 5 volts! Note, though, that the applicationof the calibration curve is a theoretical procedure where no electronic or other limitationsexist. We trust that if there had been no signal limitations in the camera, and if it had beencalibrated far beyond 5 volts, the resulting curve would have been very much the same as
our real curve extrapolated beyond 4.1 volts, provided the calibration algorithm is basedon radiation physics, like the Flir Systems algorithm. Of course there must be a limit tosuch extrapolations.
Figure 23.2 Relative magnitudes of radiation sources under varying measurement conditions (SW cam-era). 1: Object temperature; 2: Emittance; Obj: Object radiation; Refl: Reflected radiation;Atm: atmosphereradiation. Fixed parameters: τ = 0.88; Trefl = 20°C (+68°F); Tatm = 20°C (+68°F).
#1558567; r.6079/6079; en-US 116

7/21/2019 Manual Reporter
http://slidepdf.com/reader/full/manual-reporter 125/140
The measurement formula23
Figure 23.3 Relative magnitudes of radiation sources under varying measurement conditions (LW cam-era). 1: Object temperature; 2: Emittance; Obj: Object radiation; Refl: Reflected radiation;Atm: atmosphereradiation. Fixed parameters: τ = 0.88; Trefl = 20°C (+68°F); Tatm = 20°C (+68°F).
#1558567; r.6079/6079; en-US 117

7/21/2019 Manual Reporter
http://slidepdf.com/reader/full/manual-reporter 126/140
Emissivity tables24
This section presents a compilation of emissivity data from the infrared literature and
measurements made by Flir Systems.
24.1 References
1. Mikaél A. Bramson: Infrared Radiation, A Handbook for Applications, Plenum press,N.Y.
2. William L. Wolfe, George J. Zissis: The Infrared Handbook , Office of Naval Research,Department of Navy, Washington, D.C.
3. Madding, R. P.: Thermographic Instruments and systems. Madison, Wisconsin: Uni-versity of Wisconsin – Extension, Department of Engineering and Applied Science.
4. William L. Wolfe: Handbook of Military Infrared Technology , Office of Naval Research,Department of Navy, Washington, D.C.
5. Jones, Smith, Probert: External thermography of buildings..., Proc. of the Society ofPhoto-Optical Instrumentation Engineers, vol.110, Industrial and Civil Applications of
Infrared Technology, June 1977 London.6. Paljak, Pettersson: Thermography of Buildings, Swedish Building Research Institute,Stockholm 1972.
7. Vlcek, J: Determination of emissivity with imaging radiometers and some emissivities
at λ = 5 µm. Photogrammetric Engineering and Remote Sensing.8. Kern: Evaluation of infrared emission of clouds and ground as measured by weather
satellites, Defence DocumentationCenter, AD 617 417.9. Öhman, Claes: Emittansmätningarmed AGEMA E-Box . Teknisk rapport, AGEMA
1999. (Emittance measurements using AGEMA E-Box. Technical report, AGEMA1999.)
10. Matteï, S., Tang-Kwor, E: Emissivity measurements for Nextel Velvet coating 811-21
between –36°C AND 82°C.
11. Lohrengel & Todtenhaupt (1996)12. ITC Technical publication 32.13. ITC Technical publication 29.
Note
The emissivity values in the table below are recorded using a shortwave (SW) camera. The valuesshould be regarded as recommendationsonly and used with caution.
24.2 Tables
Table 24.1 T: Total spectrum; SW: 2–5 µm; LW: 8–14 µm, LLW: 6.5–20 µm; 1: Material; 2: Specification;3:Temperature in °C; 4: Spectrum; 5: Emissivity: 6:Reference
1 2 3 4 6 6
3M type 35 Vinyl electricaltape (severalcolors)
< 80 LW Ca. 0.96 13
3M type 88 Black vinyl electri-cal tape
< 105 LW Ca. 0.96 13
3M type 88 Black vinyl electri-cal tape
< 105 MW < 0.96 13
3M type Super 33+
Black vinyl electri-cal tape
< 80 LW Ca. 0.96 13
Aluminum anodized sheet 100 T 0.55 2
Aluminum anodized, black,dull
70 SW 0.67 9
Aluminum anodized, black,dull
70 LW 0.95 9
Aluminum anodized, light
gray, dull
70 SW 0.61 9
Aluminum anodized, lightgray, dull
70 LW 0.97 9
#1558567; r.6079/6079; en-US 118
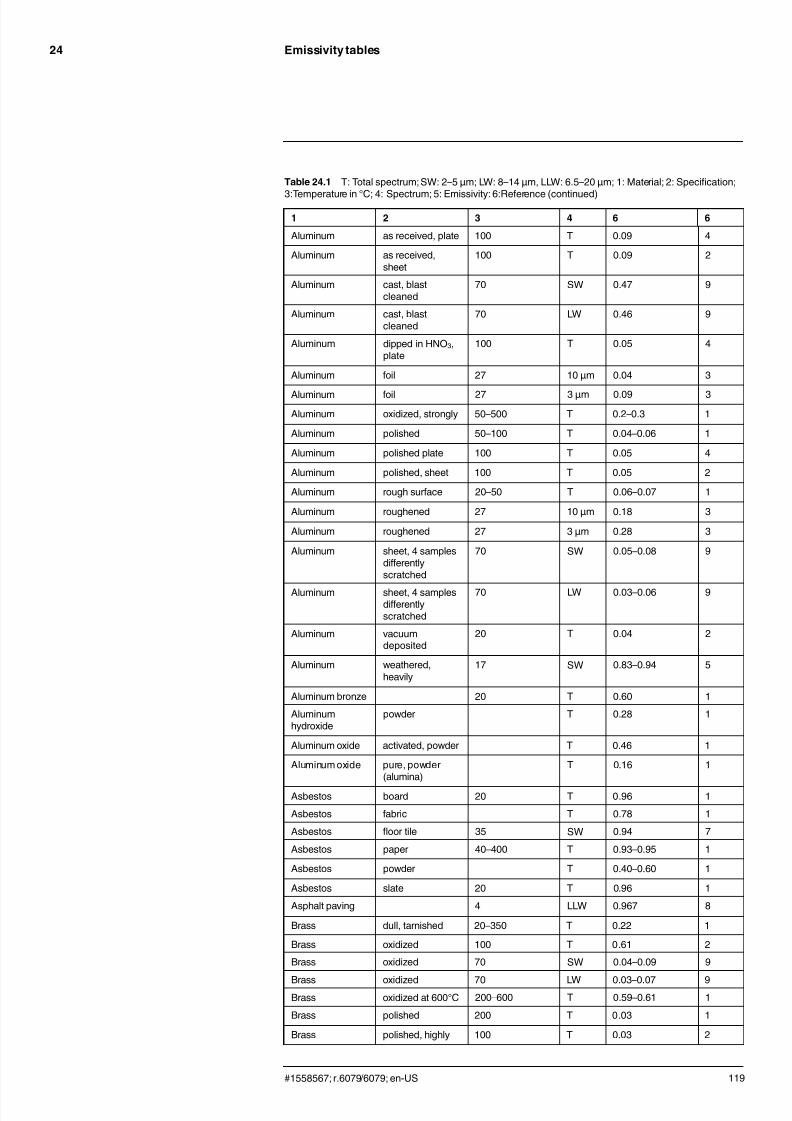
7/21/2019 Manual Reporter
http://slidepdf.com/reader/full/manual-reporter 127/140

7/21/2019 Manual Reporter
http://slidepdf.com/reader/full/manual-reporter 128/140
Emissivity tables24
Table 24.1 T: Total spectrum; SW: 2–5 µm; LW: 8–14 µm, LLW: 6.5–20 µm; 1: Material; 2: Specification;
3:Temperature in °C; 4: Spectrum; 5: Emissivity: 6:Reference (continued)
1 2 3 4 6 6
Brass rubbed with 80-grit emery
20 T 0.20 2
Brass sheet, rolled 20 T 0.06 1
Brass sheet, workedwith emery
20 T 0.2 1
Brick alumina 17 SW 0.68 5
Brick common 17 SW 0.86–0.81 5
Brick Dinas silica,glazed, rough
1100 T 0.85 1
Brick Dinas silica,refractory
1000 T 0.66 1
Brick Dinas silica, un-glazed, rough
1000 T 0.80 1
Brick firebrick 17 SW 0.68 5
Brick fireclay 1000 T 0.75 1
Brick fireclay 1200 T 0.59 1
Brick fireclay 20 T 0.85 1
Brick masonry 35 SW 0.94 7
Brick masonry,plastered
20 T 0.94 1
Brick red, common 20 T 0.93 2
Brick red, rough 20 T 0.88–0.93 1
Brick refractory,corundum
1000 T 0.46 1
Brick refractory,magnesite
1000–1300 T 0.38 1
Brick refractory,strongly radiating
500–1000 T 0.8–0.9 1
Brick refractory, weaklyradiating
500–1000 T 0.65–0.75 1
Brick silica, 95% SiO2 1230 T 0.66 1
Brick sillimanite, 33%SiO2, 64% Al2O3
1500 T 0.29 1
Brick waterproof 17 SW 0.87 5
Bronze phosphor bronze 70 SW 0.08 9
Bronze phosphor bronze 70 LW 0.06 9
Bronze polished 50 T 0.1 1
Bronze porous, rough 50–150 T 0.55 1
Bronze powder T 0.76–0.80 1
Carbon candle soot 20 T 0.95 2
Carbon charcoal powder T 0.96 1
Carbon graphite powder T 0.97 1
Carbon graphite, filedsurface
20 T 0.98 2
Carbon lampblack 20–400 T 0.95–0.97 1
Chipboard untreated 20 SW 0.90 6
Chromium polished 50 T 0.10 1
#1558567; r.6079/6079; en-US 120

7/21/2019 Manual Reporter
http://slidepdf.com/reader/full/manual-reporter 129/140
Emissivity tables24
Table 24.1 T: Total spectrum; SW: 2–5 µm; LW: 8–14 µm, LLW: 6.5–20 µm; 1: Material; 2: Specification;
3:Temperature in °C; 4: Spectrum; 5: Emissivity: 6:Reference (continued)
1 2 3 4 6 6
Chromium polished 500–1000 T 0.28–0.38 1
Clay fired 70 T 0.91 1
Cloth black 20 T 0.98 1
Concrete 20 T 0.92 2
Concrete dry 36 SW 0.95 7
Concrete rough 17 SW 0.97 5
Concrete walkway 5 LLW 0.974 8
Copper commercial,burnished
20 T 0.07 1
Copper electrolytic, care-fully polished
80 T 0.018 1
Copper electrolytic,polished
–34 T 0.006 4
Copper molten 1100–1300 T 0.13–0.15 1
Copper oxidized 50 T 0.6–0.7 1
Copper oxidized toblackness
T 0.88 1
Copper oxidized, black 27 T 0.78 4
Copper oxidized, heavily 20 T 0.78 2
Copper polished 50–100 T 0.02 1
Copper polished 100 T 0.03 2Copper polished,
commercial27 T 0.03 4
Copper polished,mechanical
22 T 0.015 4
Copper pure, carefullyprepared surface
22 T 0.008 4
Copper scraped 27 T 0.07 4
Copper dioxide powder T 0.84 1
Copper oxide red, powder T 0.70 1
Ebonite T 0.89 1
Emery coarse 80 T 0.85 1
Enamel 20 T 0.9 1
Enamel lacquer 20 T 0.85–0.95 1
Fiber board hard, untreated 20 SW 0.85 6
Fiber board masonite 70 SW 0.75 9
Fiber board masonite 70 LW 0.88 9
Fiber board particle board 70 SW 0.77 9
Fiber board particle board 70 LW 0.89 9
Fiber board porous, untreated 20 SW 0.85 6
Gold polished 130 T 0.018 1
Gold polished, carefully 200–600 T 0.02–0.03 1
Gold polished, highly 100 T 0.02 2
Granite polished 20 LLW 0.849 8
Granite rough 21 LLW 0.879 8
#1558567; r.6079/6079; en-US 121

7/21/2019 Manual Reporter
http://slidepdf.com/reader/full/manual-reporter 130/140
Emissivity tables24
Table 24.1 T: Total spectrum; SW: 2–5 µm; LW: 8–14 µm, LLW: 6.5–20 µm; 1: Material; 2: Specification;
3:Temperature in °C; 4: Spectrum; 5: Emissivity: 6:Reference (continued)
1 2 3 4 6 6
Granite rough, 4 differentsamples
70 SW 0.95–0.97 9
Granite rough, 4 differentsamples
70 LW 0.77–0.87 9
Gypsum 20 T 0.8–0.9 1
Ice: See Water
Iron and steel cold rolled 70 SW 0.20 9
Iron and steel cold rolled 70 LW 0.09 9
Iron and steel covered with redrust
20 T 0.61–0.85 1
Iron and steel electrolytic 100 T 0.05 4
Iron and steel electrolytic 22 T 0.05 4
Iron and steel electrolytic 260 T 0.07 4
Iron and steel electrolytic, care-fully polished
175–225 T 0.05–0.06 1
Iron and steel freshly workedwith emery
20 T 0.24 1
Iron and steel ground sheet 950–1100 T 0.55–0.61 1
Iron and steel heavily rustedsheet
20 T 0.69 2
Iron and steel hot rolled 130 T 0.60 1
Iron and steel hot rolled 20 T 0.77 1Iron and steel oxidized 100 T 0.74 4
Iron and steel oxidized 100 T 0.74 1
Iron and steel oxidized 1227 T 0.89 4
Iron and steel oxidized 125–525 T 0.78–0.82 1
Iron and steel oxidized 200 T 0.79 2
Iron and steel oxidized 200–600 T 0.80 1
Iron and steel oxidized strongly 50 T 0.88 1
Iron and steel oxidized strongly 500 T 0.98 1
Iron and steel polished 100 T 0.07 2
Iron and steel polished 400–1000 T 0.14–0.38 1
Iron and steel polished sheet 750–1050 T 0.52–0.56 1
Iron and steel rolled sheet 50 T 0.56 1
Iron and steel rolled, freshly 20 T 0.24 1
Iron and steel rough, planesurface
50 T 0.95–0.98 1
Iron and steel rusted red, sheet 22 T 0.69 4
Iron and steel rusted, heavily 17 SW 0.96 5
Iron and steel rusty, red 20 T 0.69 1
Iron and steel shiny oxide layer,sheet,
20 T 0.82 1
Iron and steel shiny, etched 150 T 0.16 1
Iron and steel wrought, carefullypolished
40–250 T 0.28 1
Iron galvanized heavilyoxidized 70 SW 0.64 9
Iron galvanized heavily oxidized 70 LW 0.85 9
#1558567; r.6079/6079; en-US 122
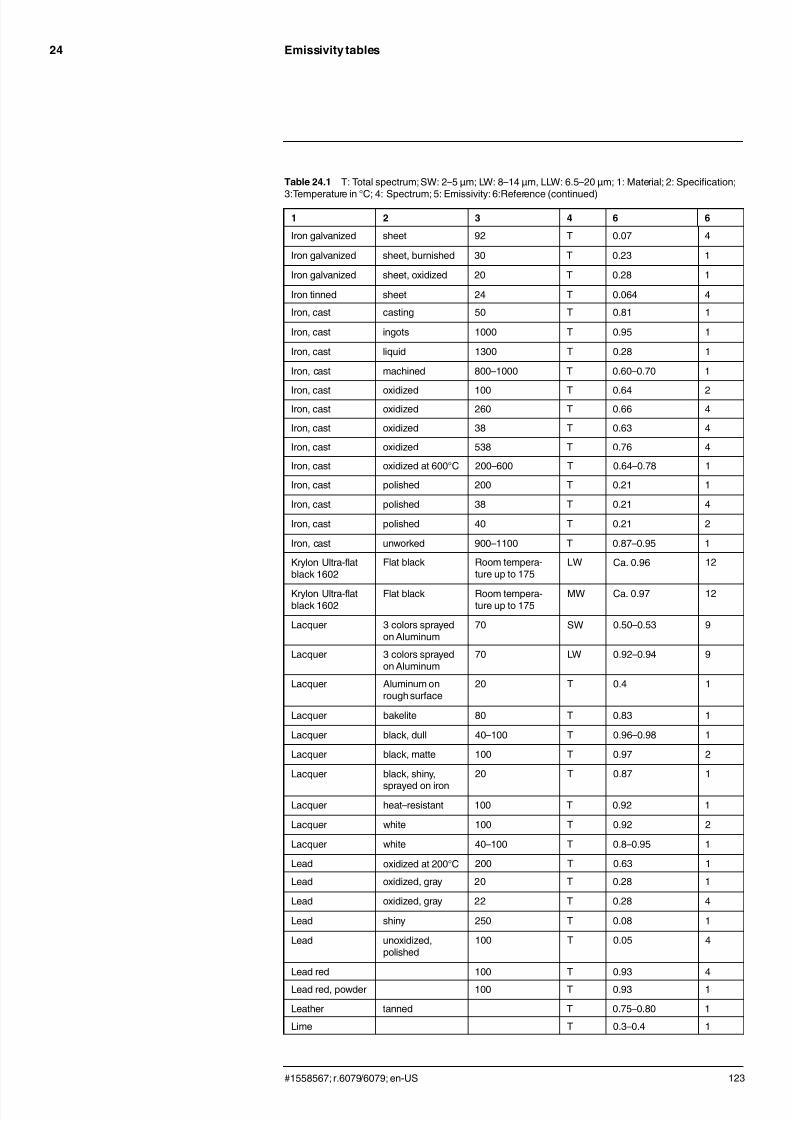
7/21/2019 Manual Reporter
http://slidepdf.com/reader/full/manual-reporter 131/140
Emissivity tables24
Table 24.1 T: Total spectrum; SW: 2–5 µm; LW: 8–14 µm, LLW: 6.5–20 µm; 1: Material; 2: Specification;
3:Temperature in °C; 4: Spectrum; 5: Emissivity: 6:Reference (continued)
1 2 3 4 6 6
Iron galvanized sheet 92 T 0.07 4
Iron galvanized sheet, burnished 30 T 0.23 1
Iron galvanized sheet, oxidized 20 T 0.28 1
Iron tinned sheet 24 T 0.064 4
Iron, cast casting 50 T 0.81 1
Iron, cast ingots 1000 T 0.95 1
Iron, cast liquid 1300 T 0.28 1
Iron, cast machined 800–1000 T 0.60–0.70 1
Iron, cast oxidized 100 T 0.64 2Iron, cast oxidized 260 T 0.66 4
Iron, cast oxidized 38 T 0.63 4
Iron, cast oxidized 538 T 0.76 4
Iron, cast oxidized at 600°C 200–600 T 0.64–0.78 1
Iron, cast polished 200 T 0.21 1
Iron, cast polished 38 T 0.21 4
Iron, cast polished 40 T 0.21 2
Iron, cast unworked 900–1100 T 0.87–0.95 1
Krylon Ultra-flatblack 1602
Flat black Room tempera-ture up to 175
LW Ca. 0.96 12
Krylon Ultra-flatblack 1602
Flat black Room tempera-ture up to 175
MW Ca. 0.97 12
Lacquer 3 colors sprayedon Aluminum
70 SW 0.50–0.53 9
Lacquer 3 colors sprayedon Aluminum
70 LW 0.92–0.94 9
Lacquer Aluminum onrough surface
20 T 0.4 1
Lacquer bakelite 80 T 0.83 1
Lacquer black, dull 40–100 T 0.96–0.98 1
Lacquer black, matte 100 T 0.97 2
Lacquer black, shiny,
sprayed on iron
20 T 0.87 1
Lacquer heat–resistant 100 T 0.92 1
Lacquer white 100 T 0.92 2
Lacquer white 40–100 T 0.8–0.95 1
Lead oxidized at 200°C 200 T 0.63 1
Lead oxidized, gray 20 T 0.28 1
Lead oxidized, gray 22 T 0.28 4
Lead shiny 250 T 0.08 1
Lead unoxidized,polished
100 T 0.05 4
Lead red 100 T 0.93 4
Lead red, powder 100 T 0.93 1
Leather tanned T 0.75–0.80 1
Lime T 0.3–0.4 1
#1558567; r.6079/6079; en-US 123
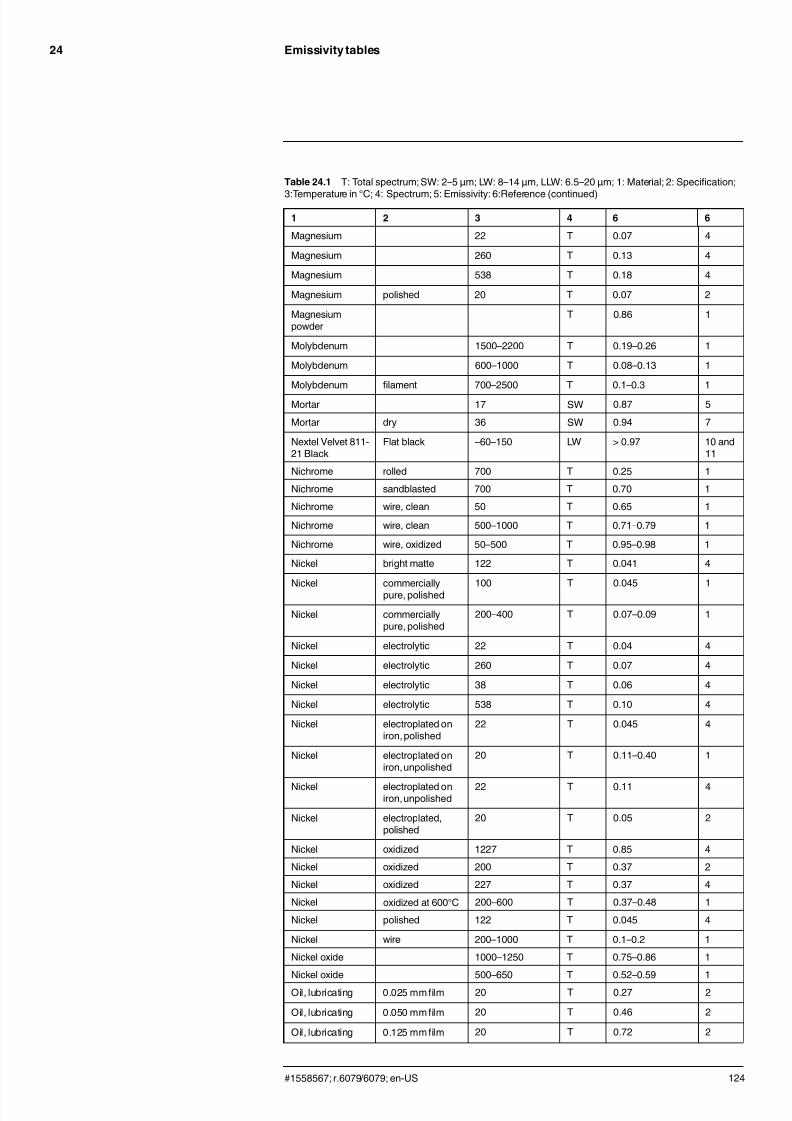
7/21/2019 Manual Reporter
http://slidepdf.com/reader/full/manual-reporter 132/140
Emissivity tables24
Table 24.1 T: Total spectrum; SW: 2–5 µm; LW: 8–14 µm, LLW: 6.5–20 µm; 1: Material; 2: Specification;
3:Temperature in °C; 4: Spectrum; 5: Emissivity: 6:Reference (continued)
1 2 3 4 6 6
Magnesium 22 T 0.07 4
Magnesium 260 T 0.13 4
Magnesium 538 T 0.18 4
Magnesium polished 20 T 0.07 2
Magnesiumpowder
T 0.86 1
Molybdenum 1500–2200 T 0.19–0.26 1
Molybdenum 600–1000 T 0.08–0.13 1
Molybdenum filament 700–2500 T 0.1–0.3 1
Mortar 17 SW 0.87 5
Mortar dry 36 SW 0.94 7
Nextel Velvet 811-21 Black
Flat black –60–150 LW > 0.97 10 and11
Nichrome rolled 700 T 0.25 1
Nichrome sandblasted 700 T 0.70 1
Nichrome wire, clean 50 T 0.65 1
Nichrome wire, clean 500–1000 T 0.71–0.79 1
Nichrome wire, oxidized 50–500 T 0.95–0.98 1
Nickel bright matte 122 T 0.041 4
Nickel commerciallypure, polished
100 T 0.045 1
Nickel commerciallypure, polished
200–400 T 0.07–0.09 1
Nickel electrolytic 22 T 0.04 4
Nickel electrolytic 260 T 0.07 4
Nickel electrolytic 38 T 0.06 4
Nickel electrolytic 538 T 0.10 4
Nickel electroplated oniron, polished
22 T 0.045 4
Nickel electroplated oniron, unpolished
20 T 0.11–0.40 1
Nickel electroplated oniron, unpolished
22 T 0.11 4
Nickel electroplated,polished
20 T 0.05 2
Nickel oxidized 1227 T 0.85 4
Nickel oxidized 200 T 0.37 2
Nickel oxidized 227 T 0.37 4
Nickel oxidized at 600°C 200–600 T 0.37–0.48 1
Nickel polished 122 T 0.045 4
Nickel wire 200–1000 T 0.1–0.2 1
Nickel oxide 1000–1250 T 0.75–0.86 1
Nickel oxide 500–650 T 0.52–0.59 1
Oil, lubricating 0.025 mm film 20 T 0.27 2
Oil, lubricating 0.050 mm film 20 T 0.46 2
Oil, lubricating 0.125 mm film 20 T 0.72 2
#1558567; r.6079/6079; en-US 124
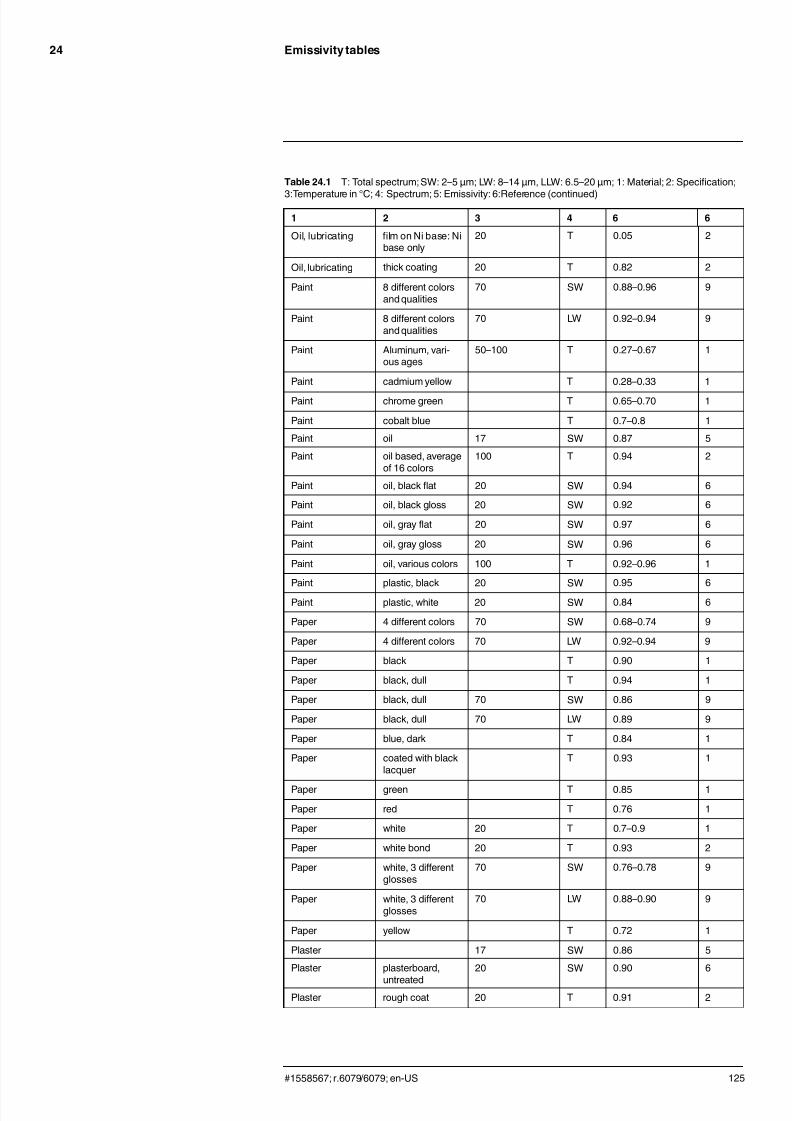
7/21/2019 Manual Reporter
http://slidepdf.com/reader/full/manual-reporter 133/140
Emissivity tables24
Table 24.1 T: Total spectrum; SW: 2–5 µm; LW: 8–14 µm, LLW: 6.5–20 µm; 1: Material; 2: Specification;
3:Temperature in °C; 4: Spectrum; 5: Emissivity: 6:Reference (continued)
1 2 3 4 6 6
Oil, lubricating film on Ni base: Nibase only
20 T 0.05 2
Oil, lubricating thick coating 20 T 0.82 2
Paint 8 different colorsand qualities
70 SW 0.88–0.96 9
Paint 8 different colorsand qualities
70 LW 0.92–0.94 9
Paint Aluminum, vari-ous ages
50–100 T 0.27–0.67 1
Paint cadmium yellow T 0.28–0.33 1
Paint chrome green T 0.65–0.70 1
Paint cobalt blue T 0.7–0.8 1
Paint oil 17 SW 0.87 5
Paint oil based, averageof 16 colors
100 T 0.94 2
Paint oil, black flat 20 SW 0.94 6
Paint oil, black gloss 20 SW 0.92 6
Paint oil, gray flat 20 SW 0.97 6
Paint oil, gray gloss 20 SW 0.96 6
Paint oil, various colors 100 T 0.92–0.96 1
Paint plastic, black 20 SW 0.95 6
Paint plastic, white 20 SW 0.84 6
Paper 4 different colors 70 SW 0.68–0.74 9
Paper 4 different colors 70 LW 0.92–0.94 9
Paper black T 0.90 1
Paper black, dull T 0.94 1
Paper black, dull 70 SW 0.86 9
Paper black, dull 70 LW 0.89 9
Paper blue, dark T 0.84 1
Paper coated with blacklacquer
T 0.93 1
Paper green T 0.85 1
Paper red T 0.76 1
Paper white 20 T 0.7–0.9 1
Paper white bond 20 T 0.93 2
Paper white, 3 differentglosses
70 SW 0.76–0.78 9
Paper white, 3 differentglosses
70 LW 0.88–0.90 9
Paper yellow T 0.72 1
Plaster 17 SW 0.86 5
Plaster plasterboard,
untreated
20 SW 0.90 6
Plaster rough coat 20 T 0.91 2
#1558567; r.6079/6079; en-US 125

7/21/2019 Manual Reporter
http://slidepdf.com/reader/full/manual-reporter 134/140
Emissivity tables24
Table 24.1 T: Total spectrum; SW: 2–5 µm; LW: 8–14 µm, LLW: 6.5–20 µm; 1: Material; 2: Specification;
3:Temperature in °C; 4: Spectrum; 5: Emissivity: 6:Reference (continued)
1 2 3 4 6 6
Plastic glass fibre lami-nate (printed circ.board)
70 SW 0.94 9
Plastic glass fibre lami-nate (printed circ.board)
70 LW 0.91 9
Plastic polyurethane iso-lation board
70 LW 0.55 9
Plastic polyurethane iso-lation board
70 SW 0.29 9
Plastic PVC, plastic floor,
dull, structured
70 SW 0.94 9
Plastic PVC, plastic floor,dull, structured
70 LW 0.93 9
Platinum 100 T 0.05 4
Platinum 1000–1500 T 0.14–0.18 1
Platinum 1094 T 0.18 4
Platinum 17 T 0.016 4
Platinum 22 T 0.03 4
Platinum 260 T 0.06 4
Platinum 538 T 0.10 4
Platinum pure, polished 200–600 T 0.05–0.10 1
Platinum ribbon 900–1100 T 0.12–0.17 1Platinum wire 1400 T 0.18 1
Platinum wire 500–1000 T 0.10–0.16 1
Platinum wire 50–200 T 0.06–0.07 1
Porcelain glazed 20 T 0.92 1
Porcelain white, shiny T 0.70–0.75 1
Rubber hard 20 T 0.95 1
Rubber soft, gray, rough 20 T 0.95 1
Sand T 0.60 1
Sand 20 T 0.90 2
Sandstone polished 19 LLW 0.909 8
Sandstone rough 19 LLW 0.935 8
Silver polished 100 T 0.03 2
Silver pure, polished 200–600 T 0.02–0.03 1
Skin human 32 T 0.98 2
Slag boiler 0–100 T 0.97–0.93 1
Slag boiler 1400–1800 T 0.69–0.67 1
Slag boiler 200–500 T 0.89–0.78 1
Slag boiler 600–1200 T 0.76–0.70 1
Snow: See Water
Soil dry 20 T 0.92 2
Soil saturated withwater 20 T 0.95 2
Stainless steel alloy, 8% Ni, 18%Cr
500 T 0.35 1
Stainless steel rolled 700 T 0.45 1
#1558567; r.6079/6079; en-US 126

7/21/2019 Manual Reporter
http://slidepdf.com/reader/full/manual-reporter 135/140
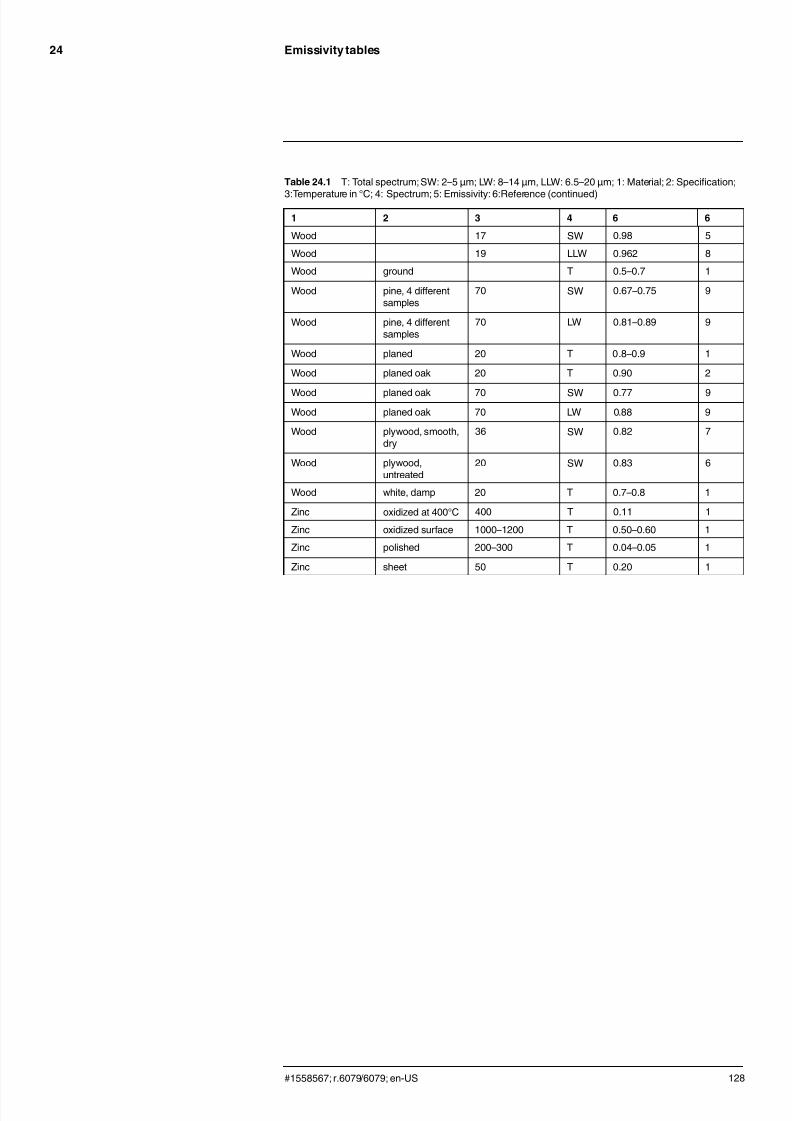
7/21/2019 Manual Reporter
http://slidepdf.com/reader/full/manual-reporter 136/140
Emissivity tables24
Table 24.1 T: Total spectrum; SW: 2–5 µm; LW: 8–14 µm, LLW: 6.5–20 µm; 1: Material; 2: Specification;
3:Temperature in °C; 4: Spectrum; 5: Emissivity: 6:Reference (continued)
1 2 3 4 6 6
Wood 17 SW 0.98 5
Wood 19 LLW 0.962 8
Wood ground T 0.5–0.7 1
Wood pine, 4 differentsamples
70 SW 0.67–0.75 9
Wood pine, 4 differentsamples
70 LW 0.81–0.89 9
Wood planed 20 T 0.8–0.9 1
Wood planed oak 20 T 0.90 2
Wood planed oak 70 SW 0.77 9Wood planed oak 70 LW 0.88 9
Wood plywood, smooth,dry
36 SW 0.82 7
Wood plywood,untreated
20 SW 0.83 6
Wood white, damp 20 T 0.7–0.8 1
Zinc oxidized at 400°C 400 T 0.11 1
Zinc oxidized surface 1000–1200 T 0.50–0.60 1
Zinc polished 200–300 T 0.04–0.05 1
Zinc sheet 50 T 0.20 1
#1558567; r.6079/6079; en-US 128

7/21/2019 Manual Reporter
http://slidepdf.com/reader/full/manual-reporter 137/140

7/21/2019 Manual Reporter
http://slidepdf.com/reader/full/manual-reporter 138/140
A note on the technical productionof this publication
This publicationwas produced using XML — the eXtensible Markup Language. For more information aboutXML, please visit http://www.w3.org/XML/
A note on the typeface used in this publication
This publicationwas typeset using Linotype Helvetica™ World. Helvetica™ was designed by MaxMiedinger (1910–1980).
LOEF (List Of Effective Files)
T501002.xml; 6079; 2012-11-15T505473.xml; 5520; 2012-09-18T505474.xml; 5524; 2012-09-18T505013.xml; 5929; 2012-10-29T505452.xml; 6079; 2012-11-15T505505.xml; 6076; 2012-11-14T505454.xml; 6012; 2012-11-06T505455.xml; 6031; 2012-11-08T505456.xml; 6054; 2012-11-12T505459.xml; 6054; 2012-11-12T505460.xml; 6031; 2012-11-08T505461.xml; 6054; 2012-11-12T505462.xml; 6031; 2012-11-08T505463.xml; 6031; 2012-11-08T505464.xml; 6031; 2012-11-08T505465.xml; 6031; 2012-11-08T505466.xml; 6054; 2012-11-12T505468.xml; 5879; 2012-10-21T505007.xml; 5936; 2012-10-29T505004.xml; 5937; 2012-10-29T505000.xml; 6040; 2012-11-09
T505005.xml; 5939; 2012-10-29T505001.xml; 5940; 2012-10-29T505006.xml; 5941; 2012-10-29T505002.xml; 5942; 2012-10-29
#1558567; r.6079/6079; en-US 130

7/21/2019 Manual Reporter
http://slidepdf.com/reader/full/manual-reporter 139/140

7/21/2019 Manual Reporter
http://slidepdf.com/reader/full/manual-reporter 140/140
last pageCorporate Headquarters
Flir System, Inc.27700 SW Parkway Ave.Wilsonville, OR 97070USA
Telephone: +1-503-498-3547Websitehttp://www.flir.com
Customer supporthttp://support.flir.com