manual for the application of theefi-plus.boku.ac.at/software/doc/efi+manual.pdf · manual for the...
TRANSCRIPT

MANUAL FOR THE APPLICATION
OF THE
NEW European Fish Index – EFI+
Developed within the project Improvement and Spatial Extension of the European Fish Index
http://efi-plus.boku.ac.at/software
FINAL VERSION, June 2009 DEVELOPED BY THE EFI+ CONSORTIUM
EFI+ - Improvement and Spatial extension of the European Fish Index A project under the 6th Framework Programme, task “Ecological Status Assessment”.
Priority “Integrating and Strengthening the European Research Area - Scientific Support to Policies”, Task 4 Contract Number 044096. http://efi-plus.boku.ac.at

To be cited as:
EFI+ CONSORTIUM (2009). Manual for the application of the new European Fish Index –
EFI+. A fish-based method to assess the ecological status of European running waters in support
of the Water Framework Directive. June 2009.
The text of this manual was written by Joaquin Solana, Diego Garcia de Jalon, Didier Pont, Pierre Bady, Maxime Logez, Richard Noble, Rafaela Schinegger, Gertrud Haidvogl, Andreas Melcher & Stefan Schmutz. Acknowledgements The EFI+ consortium would like to thank numerous individual persons, private and public institutions throughout Europe for providing the large volume of data that made the EFI+ project possible. Special thanks are dedicated to the EFI+ external evaluation and advisory group: Robert Hughes; Stephane Stroffek, Nikolaus Schotzko, Tom Buijse, Ian Cowx, Nicolas Roset, Didier Pont, Birgit Vogel, Cornelia Schütz, Pedro Serra, Wouter van de Bund, Niels Jepsen, Panagiotis Balabanis, and Jorge Rodriguez-Romero. The EFI+ project was financed by the EC contract no. 044096. Help desk: Please direct all questions and suggestions for improvements to [email protected]. Keywords: new European Fish Index (EFI+), fish based assessment method, multi metric index, Water Framework Directive, software, modelling, metrics, fish communities, reference conditions, prediction, zonation.

Contents PREFACE 6 General introduction 7
Part I: 1. Introduction 8 1.1. The Water Framework Directive (WFD) 8 1.2. A Fish-based ecological assessment method for Europe 9
2. The European research project EFI+ 10 2.1. Central Database a basic tool to develop EFI+ 10
3. The development of the European Fish Index (EFI+) 11 3.1. Objectives 11 3.2. Method description 12 1st step Setup and input data 15 2nd step River type and ecoregion 17 3rd step Predictive models 18 4th step Metric score 18 5th step Standardization and re-scaling of metric scores 19 6th step Fish Index 20 7th step Ecological class boundaries 22
4. EFI+ Application 26 4.1. Site selection 26 4.2. Environmental variables and sampling methods 27 4.3. Fish sampling 27 4.4. Fish data 30
Part II: A manual for application 31
1. Introduction 31
2. Web page 31
3. Input data 33
4. How to insert data 35 4.1. Manually 36 4.2. By MS Excel© spread sheet 37
5. Output 41 3

6. References 44 Annexes 1. Field protocol: 3 tables 2. River groups, ecoregions and Mediterranean types: 3 figures, 2 tables 3. Fish species in EFI software: 1 table 4. Guilds table: 4 tables 5. Data catalogue: 3 tables 6. Software technical report: 2 figures 7. Index development 1 figure, 1 table 8. Glossary for EFI+ List of figures, pictures and tables Figure 1: Steps prescribed in the WFD for ecological status assessment .......................................8 Figure 2: Locations of the sites used to develop the EFI...............................................................10 Figure 3: Flow chart describing the modelling procedure............................................................14 Figure 4: Map of Illies ecoregions represented in EFI+...............................................................17 Figure 5: Different steps required to apply the assessment method ..............................................26 Figure 6: The front page of EFI+ ..................................................................................................31 Figure 7: The front page of EFI+ software ...................................................................................32 Figure 8: Manual data input selection...........................................................................................36 Figure 9: Manual entering data form ............................................................................................37 Figure 10: Get the MS Excel© copy of input data..........................................................................38 Figure 11: Getting the MS Excel© template...................................................................................38 Figure 12: MS Excel© input file .....................................................................................................39 Figure 13: Example of warnings and errors page.........................................................................40 Figure 14: Content of Input.txt ......................................................................................................40 Figure 15: Running the script for the calculation of the EFI+......................................................41 Figure 16: The windows-related error message ............................................................................42 Figure 17: The web help system.....................................................................................................42 Figure 18: Showing the first part of the MS Excel© output table. .................................................43 Picture 1: Electric fishing in a wadable river................................................................................28 Picture 2: Electric fishing from a boat...........................................................................................29 Table 1: Number of records included in the central database.......................................................11 Table 2: Metrics used to calculate the Salmonid and Cyprinid Fish Index...................................12 Table 3: List of intolerant species ..................................................................................................13 Table 4: Description of the numerical variables used in the modelling procedure.......................15 Table 5: Description of the categorical variables used in the modelling procedure.....................16 Table 6: Ecoregions covered by EFI+...........................................................................................16 Table 7: Variables used to compute the European Fish Types (EFT). ..........................................17 Table 8: Parameters and factors correlated to the four selected metrics......................................18
4

Table 9: Summary of the four selected metrics distribution for undisturbed sites ........................19 Table 10: Summary of the different options to select the appropriate fish index. .........................22 Table 11: Ecological class boundaries for the two indices. ..........................................................23 Table 12: Fishing method: Rivers < 0.7 m depth = wadable rivers............................................239 Table 13: Fishing method: Rivers > 0.7 m depth = non-wadable rivers (boat fishing)................29 Table 14: Input variables required for the calculation of the EFI+..............................................33 Table 15: List of species selected to compute the index based on diadromous species.................35 Table 16: Allowed ranges of variables. .........................................................................................37 Table 17: Comments and explanation of the software output........................................................44
5

PREFACE This manual describes the new European Fish Index – EFI+ - and its application software. The EFI+ software and manual have been developed within the EFI+ project. The EFI+ project was funded by the European Commission (EC) under the 6th Framework Programme, “Energy, Environment and Sustainable Development”, Key Action 1: Sustainable Management and Quality of Water of the European Commission (Specific Targeted Research Project FP6-2005-SSP-5-A, Task 4: Ecological status assessment – filling the gaps). In the year 2000, the EC adopted a new legislation, the Water Framework Directive (WFD). This new legislation, now implemented in 27 EU member countries, aims for good ecological conditions in all surface waters. Fishes are, for the first time, part of a European-wide monitoring network designed to assess the ecological status of running waters. Between 2001 and 2004 the EC funded the FAME project developed, evaluated and implemented new standardised fish-based methods to assess the ecological status of running waters in Europe (FP5, Energy, Environment and Sustainable Management. Key Action 1: Sustainable Management and Quality of Water, EVK1-CT-2001-00094, http://fame.boku.ac.at). The main output of the FAME project was the European Fish Index (EFI), the first standardised fish-based assessment method applicable across a wide range of European rivers. The EFI employs a number of environmental descriptors to predict biological reference conditions and then quantifies the deviation of the fish community structure from these reference conditions on a statistical basis. The EFI was developed mainly based on data from Western and Northern Europe and was calibrated against estimates of human pressures and impacts. Although a wide range of river types was included in the development of the EFI, some river types, e.g. very large rivers, were underrepresented. The EFI has now been tested by European countries within their national monitoring programmes and has been evaluated for use for reporting under the WFD. During this evaluation process a number of limitations were observed in the performance of the index. Therefore, the overall objective of the EFI+ project was to overcome the existing limitations of the EFI by developing a new, more accurate and pan-European fish index. The scientific and technological objectives were to (1) evaluate the applicability of the existing EFI and make necessary improvements in Central-Eastern Europe and Mediterranean ecoregions; (2) extend the scope of the existing EFI to cover large rivers; (3) analyse relationships between hydromorphological pressures (including continuity disruption) and fish assemblages to increase the accuracy of the EFI; (4) adapt the existing software to the requirements of the EFI+ to allow calculation of the ecological status for running waters.
6

General introduction This manual is divided in two parts. Part I introduces the concepts and methods on which the EFI+ is based. This section gives an overview of the development of the new European Fish Index and its achievements to fulfil the objectives of the Water Framework Directive in terms of using fishes as indicators for assessing the ecological status of running waters. Part II is the instruction manual to the web-based software. It details the fish assemblage and environmental data required and the process for obtaining scores and classification of the ecological status of a sampling site (or set of sampling sites) using the EFI+ online software.
7

Part I: 1. Introduction
1.1. The Water Framework Directive (WFD)
The aim of the WFD is to create a European framework for the protection of inland surface waters, transitional waters, coastal waters and groundwater (EU Water Framework Directive, 2000). Its principal objective is to protect, enhance and restore all bodies of surface waters with the aim of achieving a good ecological status by 2015 (WFD Article 4). The WFD requires member states to assess the ecological quality status (EcoQ) of their water bodies (WFD Article 8). The EcoQ is based on the status of biological quality elements supported by hydromorphological and chemical/physicochemical quality elements. Consequently, the implementation of the WFD requires appropriate and standardised methods to assess the ecological status. The four biological elements to be considered in rivers are (1) phytoplankton; (2) phytobenthos and macrophytes; (3) benthic invertebrate fauna and; (4) fish fauna. The WFD prescribes the following steps for ecological status assessment (Figure 1):
classify river
typesdefine reference
conditions
sample monitoring sites
assess deviation
high (1)
good (2)
moderate (3)
poor (4)
bad (5)
high (1)
good (2)
moderate (3)
poor (4)
bad (5)
assign quality status
Figure 1: Steps prescribed in the WFD for ecological status assessment
Initially, river types have to be defined. Each type is described by abiotic parameters (System A or B, WFD Annex II 1.2) and verified by the biota. For each type, reference conditions with no or only very minor anthropogenic alterations have to be defined for each biological quality element. Reference conditions may be derived from actual data, historical data or modelling techniques. Finally, an assessment method for each quality element has to be developed. The assessment of a specific site is based on its deviation from type-specific reference conditions. The status of the fish fauna should be assessed with the following criteria: species composition, abundance, sensitive species, age structure and reproduction (WFD Annex V 1.2.1). The WFD distinguishes between five levels of ecological status: (1) high status, (2) good status, (3) moderate status, (4) poor status and (5) bad status. The methods used to develop the EFI and the EFI+ followed this general scheme of assessment.
8

1.2. A Fish-based ecological assessment method for Europe
The successful and coherent implementation of the WFD across the whole of Europe depends on the provision of reliable and standardised assessment tools. However, currently a number of different fish-based methods are used in different countries in Europe. Therefore, the observed need for a coherent standardised assessment method, applicable across Europe, was the motivation for the EC-funded FAME and EFI+ projects.
Fishes have proved their suitability as indicators for human disturbances for many reasons:
− Fishes are present in most surface waters.
− The identification of fishes is relatively easy and their taxonomy, ecological requirements and life histories are generally better known than in other species groups.
− Fishes have evolved complex migration patterns making them sensitive to continuum interruptions.
− The longevity of many fish species enables assessments to be sensitive to disturbance over relatively long time scales.
− The natural history and sensitivity to disturbances are well documented for many species and their responses to environmental stressors are often known.
− Fishes generally occupy high trophic levels, and thus integrate conditions of lower trophic levels. In addition, different fish species represent distinct trophic levels: omnivores, herbivores, insectivores, planktivores and piscivores.
− Fishes occupy a variety of habitats in rivers: benthic, pelagic, rheophilic, limnophilic, etc.. Species have specific habitat requirements and thus exhibit predictable responses to human induced habitat alterations.
− Depressed growth and recruitment are easily assessed and reflect environmental stress.
− Fishes are valuable economic resources and are of public concern. Using fishes as indicators confers an easy and intuitive understanding of cause-effect relationships to stakeholders beyond the scientific community.
The EFI+ project is underpinned by long established concepts that fish assemblage structure responds to human alterations of aquatic ecosystems in a predictable and quantifiable manner (e.g. Index of Biotic Integrity (IBI) concepts, Karr 1981). The main concept for these models is to assess those components, guilds or traits (quantified as ‘metrics’) of the fish assemblage that can be predicted under reference conditions and respond to the different river degradation types in a predictable manner.
9

2. The European research project EFI+
The EFI+ project was undertaken for the Improvement and Spatial extension of the European Fish Index and is an EC-funded research project aimed to contribute to the implementation of the Water Framework Directive.
Research institutions based in 15 countries participated in the EFI+ project. The original project consortium consisted of partners based in Austria, Finland, France, Germany, Hungary, Italy, Poland, Portugal, Romania, Spain, Sweden, Switzerland and UK. In addition, partners from the Netherlands (RIZA/Deltares) and Lithuania (University of Vilnius) participated in the EFI+-project as self-funded associate partners.
Figure 2: Locations of the sites used to develop the EFI+: The green (N=533), red (N=2526) and black (N=7244) points correspond to the calibration, slightly disturbed and disturbed datasets, respectively. The grey shading indicates the home countries of the research partners within the
EFI+ project consortium.
2.1. Central Database - a basic tool to develop EFI+ The development of the EFI+ was based on a large database of about 30,000 fish assemblage surveys covering more than 14,000 sites from 2,700 rivers in 15 European eco-regions contributed by partners and associated institutions based in 15 countries (Figure 2, Table 1). For each survey information about the fish assemblage, environmental characteristics and human pressures was collected.
10

The database also includes a comprehensive list of European freshwater fish species assigned to functional guilds according to their ecological characteristics. This information was used to calculate metrics for the newly developed index. Table 1: Number of records included in the central database
Country Sites Fishing occasions Diadromous samples
Catches Length of fishes
Austria 938 1172 0 6294 326039Finland 530 530 257 2207 0France 1145 6542 65700 62576 3896905Germany 803 1817 27240 18543 648243Hungary 193 193 246 2094 0Italy 652 1152 0 4238 62847Lithuania 115 130 280 1086 6275Netherlands 182 790 11850 5903 135934Poland 919 978 3480 6926 73140Portugal 923 923 7384 45227 60431Romania 263 323 0 1671 27722Spain 4239 5176 10010 14092 233344Sweden 615 5652 7607 16751 426826Switzerland 717 969 0 2781 171583UK 1987 3162 22134 16361 241111Total 14221 29509 156188 206750 6310400
3. The development of the new European Fish Index (EFI+)
3.1. Objectives The new European Fish Index (EFI+) is a multimetric index based on a predictive model that derives reference conditions from abiotic environmental characteristics of individual sites and quantifies the deviation between the predicted fish assemblage (in the “quasi absence” of any human disturbance) and the observed fish assemblage (described during a fish sampling occasion). The metrics used are based on functional guilds describing the main ecological and biological characteristics of the fish assemblage. The purpose of the index is to evaluate the ecological status of sites at the European scale. One of the main objectives during the development phase was to define a calibration dataset and to model and select metrics in a way that the index could be correctly calibrated for all or most ecoregions and environmental situations across Europe. In addition the index needed to be comparable between ecoregions, river types and different local environments. The sensitivity of the final indices to pressures (especially morphological pressures) was considered at the European scale. The ecological class boundaries are based on the distributions of index values for undisturbed sites in two types of rivers (see below). The main objective was firstly to optimise the specificity of the indices (capacity to classify correctly an undisturbed site as undisturbed, i.e. an unimpacted
11

sites should not have a low index value) and secondly to optimise the sensitivity of the indices (capacity to classify correctly an disturbed site as disturbed, i.e. an impacted site should not have a high index value). 3.2. Method description For the EFI+ two indices were developed (Table 2). These two indices, each composed of two different metrics, can be computed depending on the river type classification of a given site: • Salmonid Dominated Fish Assemblage Index (Salm.Fish.Index) for sites classified as
Salmonid Dominated Fish Assemblage River Type (Salmonid river type) Salm.Fish.Index = (Ni.Hab.150 + Ni.O2.Intol) / 2 • Cyprinid Dominated Fish Assemblage Index (Cypr.Fish.Index) for sites classified as
Cyprinid Dominated Fish Assemblage River Type (Cyprinid river type) Cypr.Fish.Index = (Ric.RH.Par + Ni.LITHO) / 2 Table 2: Metrics used to calculate the Salmonid and Cyprinid Fish Index
Index Metric name Detailed name - guild Ni.O2.Intol Density (number of individuals per 100m² in the 1. run of
a sample site) of species intolerant to oxygen depletion, always more than 6 mg/l O2 in water.
Salmonid
Ni.Hab.Intol.150 Density (number of individuals per 100m² in the 1. run of a sample site) ≤ 150 mm (total length) of species intolerant to habitat degradation.
Ric.RH.Par Richness (number of species in the 1. run of a sample site) of rheopar species; requiring a rheophilic reproduction habitat, i.e. preference to spawn in running waters.
Cyprinid
Ni.LITHO Density (number of individuals per 100m² in the 1. run of a sample site) of species requiring lithophilic reproduction habitat, species which spawn exclusively on gravel, rocks, stones, cobble or pebbles. Their hatchlings are photophobic.
One metric is expressed in terms of richness, two in density of individuals and one in density per size class. Two metrics are based on tolerance responses, and two are based on reproduction habitat requirements. The four metrics exhibit a negative response to increases in human pressure. The correlations between metrics are relatively low (Pearson’s coefficients less than 0.65). The species classified as oxygen depletion intolerant, habitat degradation intolerant, and those requiring lithophilic or rheophilic reproduction habitats are listed in Annex 4. The distinction between the two river types is based on the proportion (relative abundance of individuals) of typical species belonging to salmonid dominated fish assemblage (or Salmonid type species - denominated ST-species) - which are oxygen depletion intolerant, habitat alteration intolerant, stenothermic, lithophilic or speleophilic reproduction type species and with a rheophilic reproductive habitat. These 19 species are shown in Table 3.
12

Table 3: List of intolerant species, typically belonging to salmonid dominated fish communities. Alburnoides bipunctatus Cobitis calderoni Coregonus lavaretus Cottus gobio Cottus poecilopus Eudontomyzon mariae Hucho hucho Lampetra planeri Phoxinus phoxinus Salmo salar Salmo trutta fario Salmo trutta lacustris Salmo trutta macrostigma Salmo trutta trutta Salmo trutta marmoratus Salvelinus fontinalis Salvelinus namaycush Salvelinus umbla Thymallus thymallus Typically, an undisturbed Salmonid river type site is dominated by ST-species which represent more than 80% of the number of individuals caught (more than 90 % in most cases). Conversely, the relative abundance of these species is less than 20% (in most cases < 10%) for a typical undisturbed Cyprinid type site. As human pressures alter the fish assemblage structure, it is not possible to directly use a fish assemblage based criteria to discriminate between Salmonid-type and Cyprinid-type sites. A solution to classify sites was to use a typology based on abiotic variables. Melcher et al. (2007) produced such a typology at the European scale during the FAME project (European Fish Types classification - EFT). Using 7 environmental variables, the EFT classification differentiated between 15 fish-based river types. These 15 types have been re-classified into the two main river types for EFI+, considering criteria related to the relative abundance of ST-species. The Salmonid/Cyprinid fish assemblage typology was used during the process of metric standardisation and selection. However, in some situations, sites may be misclassified into an inappropriate reference fish assemblage type: • Some undisturbed sites classified as Cyprinid river type sites have a high relative
abundance of ST-species. • Alternatively, undisturbed sites classified as Salmonid river type sites have a too low
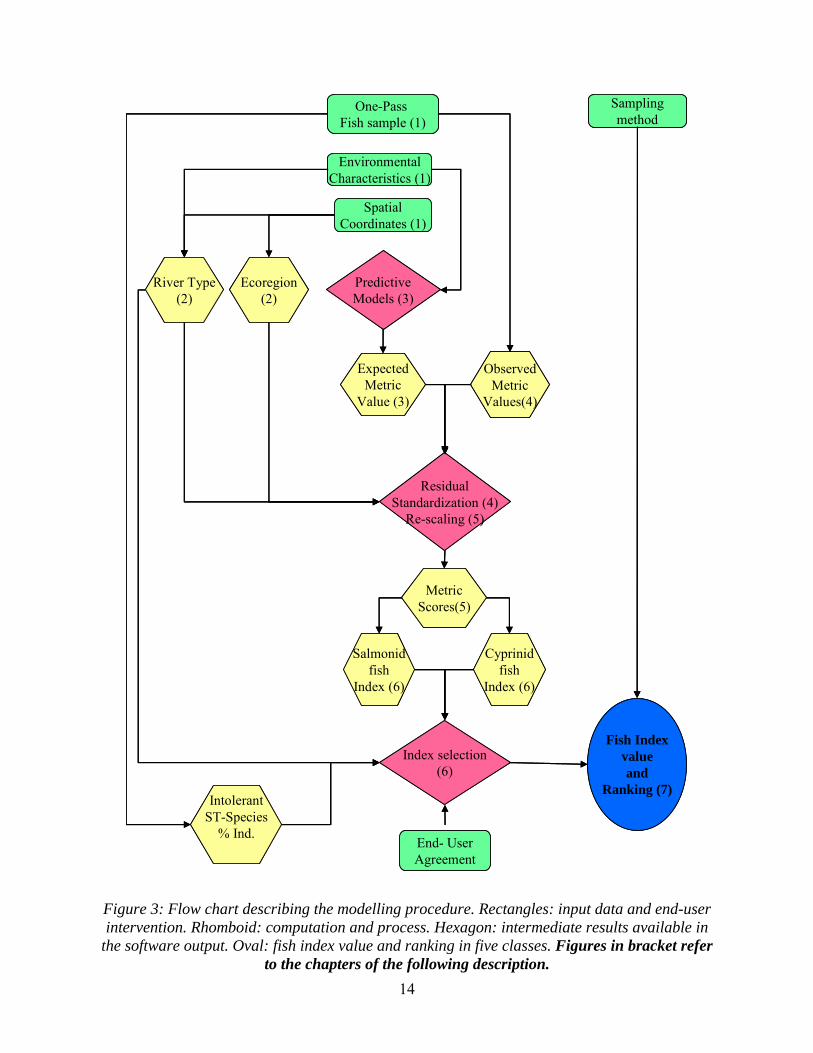
relative abundance of typical intolerant ST species (less common). In such cases the proportion of Salmonid-type species has then to be evaluated by the user a posteriori (using situation-dependent recommendations (shown later)) to validate the river type proposed for each site and to determine the correct index to evaluate the site (Salm.Fish.Index or Cypr.Fish.Index). In the following section the EFI+ method is summarised, the limitations of the two indices are indicated and the procedure used for metric modelling, metric selection and standardisation are described. In Annex 8, the main results related to indices performance (specificity versus sensitivity) and evaluations of uncertainties are presented. The data flow and process for obtaining a new European Fish Index (EFI+) score is summarised in Figure 3.
13
One-PassFish sample (1)
SpatialCoordinates (1)
EnvironmentalCharacteristics (1)
Samplingmethod
Ecoregion(2)
IntolerantST-Species
% Ind.
ObservedMetric
Values(4)
PredictiveModels (3)
ExpectedMetric
Value (3)
River Type(2)
ResidualStandardization (4)
Re-scaling (5)
MetricScores(5)
Salmonidfish
Index (6)
Cyprinidfish
Index (6)
Index selection(6)
Fish Indexvalueand
Ranking (7)
End- UserAgreement
Figure 3: Flow chart describing the modelling procedure. Rectangles: input data and end-user intervention. Rhomboid: computation and process. Hexagon: intermediate results available in
the software output. Oval: fish index value and ranking in five classes. Figures in bracket refer to the chapters of the following description.
14

1st Step: Setup and Input data1 The EFI+ method requires three types of obligatory data and one type of optional data: • Data from single-pass electric fishing catches to calculate the assessment metrics.
Individuals from all species have to be measured (total length in mm) to compute the observed values of metrics. Results should be recorded as number of individuals caught per species, including the numbers in two size classes determined by a 150-mm threshold.
• Data describing environmental conditions at the site scale or at the river segment scale as well as the sampling method (Table 4 and 5, numerical and categorical variables).
• Data describing the fishing method. • In addition optional data on the present and historical occurrence of diadromous species
can be used. Table 4: Description of the numerical variables used in the modelling procedure. Variable Median Minimum Maximum
Latitude 46.26 36.77 68.80Longitude 5.24 -9.25 29.65Drainage area (km2) 56.02 0.72 208,106.00Distance.from.source (km) 13 0.50 1454.00Actual.river.slope (m.km-1) 9.13 0.001 323.63Wetted.width (m) 6.00 0.70 658.00Fished.area (m2) 372 100 32,500Temp.jan (°C) 1.60 -16.00 11.40Temp.jul (°C) 17.80 8.60 25.10
The ranges of environmental conditions (median, minimum and maximum values) for the slightly impacted (calibration) sites are shown in Table 4. For the categorical variables indicated in Table 5, the number of sites per modality is indicated. These values indicate the range of environmental conditions for which the models can be considered as calibrated (N = 2526 sites). In addition, information on the site location (longitude and latitude, for definition see Table 14, Part II), site name and sampling date is required. Spatial coordinates are used to define the corresponding ecoregion. Ecoregion classification has been done according to Illies, but with the addition of a Mediterranean region (Table 6, Figure 4). The Mediterranean region was delineated based on precipitation and temperature criteria. Information about the historical and present occurrence of 17 diadromous species can be used to calculate an additional diadromous species metric. This information is not solely based on current fish sampling data but should also integrate knowledge of the user from other sampling methods and data sources (as e.g. commercial, other samplings or literature information especially in the case of historical data). For species currently present but with no historical information the user has to decide whether a historical occurrence can be assumed. The diadromous species used are listed in Table 15.
15 1 Numbers of this and the following chapters refer to the flow chart in figure 3

Table 5: Description of the categorical variables used in the modelling procedure.
Variable Modality Number of sites Water.source.type Glacial 12 Groundwater 78 Nival 539 Pluvial 1897Floodplain.site No 2120 Yes 406Natural.sediment Boulder/Rock 432 Gravel/Pebble/Cobble 1853 Organic 12 Sand 197 Silt 32Geomorph.river.type Braided 86 Meandering regular 236 Meandering tortous 121 Naturally constraint 1053 Sinuous 1030Sampling.method Wading or wading/boating 2362 Boating 164
Table 6: Ecoregions covered by EFI+. Abbreviation, full name and corresponding number are shown. Pontic Province and Eastern Plains are not well represented in EFI+.
Alp Alps (4) Car The Carpathians (10)
Pyr Pyrenees (2) GB Great Britain (18) Hun Hungarian Lowlands (11) Ibe Iberian Peninsula (1) E.p Eastern Plains (16)* Ita Italy, Corsica and Malte (3)
Pon Pontic Province (12)* W.p Western Plains (13)
Fen Fenno-Scandian Shield (22) W.h Western Highlands (8) Bor Borealic Uplands (20) C.h Central Highlands (9) Bal Baltic Province (15) C.p Central Plains (14) Med Mediterranean region (1)
* Pontic Province and Eastern Plains are not well represented in EFI+.
16

GB
Figure 4: Map of Illies ecoregions represented in EFI+ and the additional Mediterranean region.
2nd Step: River type and ecoregion As described in chapter 3.2, the European Fish Types (EFT) are used to identify the correct river type. The appropriate ecoregion for a sampling site is defined based on the spatial coordinates of the site. Table 7: Variables used to compute the European Fish Types (EFT).
EFI+ variable Type Description Longitude Numeric Longitude in decimal degree Latitude Numeric Latitude in decimal degree Altitude Integer Altitude in metres Distance from source Integer Distance from the source (in km) Temp mean Numeric Average annual air temperature (in °C) Wetted width Numeric Width of the river (in metres) Actual river slope Numeric Slope of the river segment (in m/km)
17

3rd step: Predictive models For each metric and for a given site a statistical model is used to predict the metric value in the absence or quasi-absence of human disturbance (i.e. a value corresponding to “a reference condition”). These expected values are computed from environmental parameters (see tables 4 and 5) using generalised linear models. These models were calibrated using “undisturbed” sites.
The parameters retained for each of the four models are given in Table 8. Details about the modelling procedure are given in Annex 8. Table 8: Parameters and factors correlated to the four selected metrics.
Metric Ni.O2.Intol Ni.Hab.Intol.150 Ric.RH.Par Ni.LITHO Temperature July +
Annual Temp Range + +
Actual river slope + + + +
Natural Sediment + + + +
Syngeomorph1 + + Syngeomorph2 + + +
The environmental variables describing the hydro-morphological characteristics of the river site are synthesised (using multivariate statistical methods) into two independent geomorphological factors (named Syngeomorph1 and Syngeomorph2, see Table 8). Syngeomorph1 refers to the variables drainage area, the presence of flood plain and distance from the source. This factor discriminates small and large rivers characterized by a floodplain and high distance from the source and high drainage area. Syngeomorph2 refers to geomorphological and water source types. The annual temperature range is the difference between mean July air temperature and mean January air temperature. 4th step: Metric score The metric score is the standardised distance (Miq) between the predicted value (Ti, i.e. the expected value in the absence of any significant human disturbance) and the observed value Oi (computed from the sampled fish assemblage). The score (Miq) of each of the four metrics in a given river zone “q” (Salmonid river zone or Cyprinid zone) and a given ecoregion “j” is obtained in the following manner for each site: Miq = ( Ri - Mjq ) / Sq Where Ri = Oi - Ti
18

Ri: model residual, i.e. difference between observed and expected metric value for the given site. Mjq: Median value of the residuals in the ecoregion “j” and the river zone “q” in the whole undisturbed dataset for a given river zone (Salmonid or Cyprinid) Sq: Standard deviation of the residuals in the whole undisturbed dataset for a given river zone (Salmonid or Cyprinid) Sites defined here as “undisturbed” are those (N = 2526) which present no or only a slight degree of perturbation (selection based on the pressure variables: channelisation, impoundment, water quality, toxic presence, water abstraction, hydropeaking, presence of barrier at the river segment scale). The value of the median is chosen because it is less sensitive to extreme values than the mean. For the same reason (model stability), the standard deviation of residuals of the whole undisturbed dataset is used instead of the standard deviation of the residual distribution in each ecoregion. 5th step: Standardisation and re-scaling of metric scores Standardised metric scores vary from -∞ to + ∞. However, development of ecological quality ratios (EQRs) requires that each final metric score varies within a finite interval from 0 to 1 and each metric must have the same median value in the absence of any disturbance (i.e. in the undisturbed dataset). Such “rescaling” is accomplished by using two transformations (see Annex 8 for details). The final result is that, when only considering undisturbed sites, all the four metrics have a median value of 0.80 and very similar values for the 25% quantile (0.69 to 0.73). Then, metrics can be aggregated, each one having a similar distribution in the absence of any significant disturbance. Observed metric values from impacted sites exhibit a greater deviation from the expected metric value and thus will be characterised by a low metric score and are less likely to belong to the reference residual distribution than un-impacted or only slightly impacted sites (i.e. value << 0.80). Table 9: Summary of the four selected metrics distribution for undisturbed sites
River type Min. 25% quantile Median Mean 95%
quantile Max.
Ni.Hab.Intol.150 Salmonid 0.000 0.69 0.80 0.74 0.87 1.000 Ni.02.Intol Salmonid 0.000 0.73 0.80 0.77 0.86 1.000 Ric.RH.Par Cyprinid 0.000 0.70 0.80 0.77 0.86 1.000 Ni.LITHO Cyprinid 0.000 0.71 0.80 0.73 0.83 1.000
Metric based on diadromous species A diadromous species metric can be calculated corresponding to the ratio between the present number of diadromous species occurring and the richness of diadromous species that would have
19

historically occurred. A loss of diadromous species can be due to several human pressures but they are mainly affected by barriers causing interruptions to river continuity and fish migration pathways. Thus the metrics indicates connectivity problems. It is calculated as follows:
( )
( )∑
∑
=
== K
khistoricalk
K
kactualk
x
xIndMig
1,
1,
where K corresponds to the number of diadromous species used in the index computation. The
terms and correspond to the actual number of diadromous species and
the number of diadromous species historically present at the site respectively. If a species occurs naturally at present the user can decide to assume also historical occurrence (see table 15 for details). The obtained value (“Index diadromous species richness”) ranges from [0,1].
( )∑=
K
kactualkx
1, (∑
=
K
khistoricalkx
1, )
The metric is not integrated into the final index because of its different structure compared to the other metrics. In addition further tests need to be done for a robust computation and interpretation of the metric values. 6th step: Fish Index The EFI+ method finally consists of two indices: Salm.Fish.Index = (Ni.Hab.150 + Ni.O2.Intol) / 2 Cypr.Fish.Index = (Ric.RH.Par + Ni.LITHO) / 2 The Indices values vary between 0 and 1. As for each metric, an undisturbed site would have an index value close to 0.80, and a highly disturbed site a value lower than the 25% quantile of the index distribution for undisturbed sites. Each index is composed of 2 different metrics, and can be computed for each site, although the final selection of the most appropriate index depends on the river type classification. The critical point in the use of the EFI+ method is the classification of sites in one of the two river types (Salmonid type versus Cyprinid type). As previously indicated the automatic classification (based on prediction of fish type from abiotic environmental parameters) is more efficient at correctly determining the Salmonid river type rather than the Cyprinid type. For the Salmonid river type, generally only a small number of sites are considered as misclassified (i.e. sites with a very low relative abundance of ST-species are still classified as the Salmonid river type). Conversely, the automated classification of “Cyprinid river type” appears to have a higher rate of misclassification e.g. classifying sites are dominated by ST-species into the Cyprinid river type.
20
The consequences of this risk of misclassification are quite different, depending of the river type. • For undisturbed sites classified by the model as the Salmonid river type but with a low
relative abundance of ST-species in the sample, the Salmonid fish index cannot be used. Therefore, the site is misclassified and the Cyprinid fish index should be used.
• For undisturbed sites classified by the model as a Cyprinid type but with a high relative abundance of ST- species in the sample, the values given by the Cyprinid index are quite close to the ones given by the Salmonid index. However, in case of disturbed sites, the impact is not correctly evaluated if the Cyprinid index is used instead of the Salmonid index. Therefore, such sites are misclassified in terms of river type and the Salmonid index should be applied.
Considering the risk of misclassification and the associated consequences on the evaluation of sites the best solution is for the end-user to systematically validate the initial classification of the site (Cyprinid or Salmonid river type), the relative abundance of ST-species and the value of both indices (Salmonid index and Cyprinid index) when they can be computed. In most cases, the river type proposed by the model is correct and the user can use the corresponding index proposed by the software. In other cases, the users, as experts, will have to evaluate the situation and to confirm the proposed classification or choose the most appropriate of the two fish indices. There are several possibilities and associated recommendations (summarized in Table 10): Sites classified by the EFT classification as Salmonid river type
• The site is classified as a Salmonid type and the % of ST- species is high (i.e. > 80%). The
classification is correct and the Salmonid index has to be used. • The site is classified as a Salmonid type and the % of ST-species is relatively high (from 50
to 80%). The reduction of the relative abundance of ST-species could be due to a human disturbance of the river ecosystem. The risk of misclassification is relatively low but the user has to check and confirm the proposed river type.
• The site is classified as a Salmonid type but the % of ST-species is relatively low (from 20
to 50%) to very low (less than 20%). The reduction of the relative abundance of these intolerant species can only be due to severe human disturbance (i.e. heavy impoundment, high level of water quality degradation). The risk of misclassification is important and the user has to evaluate the proposed river type and to confirm or reject the choice of the fish index. A warning is included in the output of the software.
Sites classified by the EFT classification as a Cyprinid river type • The site is classified as Cyprinid type and the % of ST-species is very low (less than 20 %).
The classification is correct and the Cyprinid index has to be used. • The site is classified as a Cyprinid type but the % of ST-species is relatively high (from 20
to 50%). The increase of the relative abundance of these ST-species can be due to some
21

particular human disturbance of the river ecosystem (some types of channelisation and large increases of the water velocity, water cooling downstream from a dam etc.). Nevertheless, in most of cases, a misclassification of the site is possible. The software proposes to classify the site as a Salmonid river type and to use the Salmonid index. The user has to evaluate the proposed type and to confirm or reject the choice of the fish index. A warning is included in the output of the software.
• The site is classified as a Cyprinid type but the % of ST-species is quite high (from 50 to
80%) or very high (more than 80%). The increase of the relative abundance of these ST-species can also be due to particular severe human disturbances but the risk of misclassification is very important. A correction for the river type is included in the output of the software (site reclassified as Salmonid type) and the value of the Salmonid index is proposed. The software proposes to classify the site as a Salmonid type and to use the Salmonid index. The user has to evaluate the proposed type and to confirm or reject the choice of the fish index. A warning is included in the output of the software.
Table 10: Summary of the different options to select the appropriate fish index.
PERCENTAGE of INTOLERANT SALMONID TYPE SPECIES (ST-SPECIES)
Initial site classification [0% – 20%] ]20% - 50%] ]50% - 80%] ]80% - 100%]
Salmonid type Risk of misclassification
Risk of misclassification
Correct classification
Salmonid Index
proposed
Salmonid Index
proposed
Salmonid Index
recommended
Salmonid Index
should be used User has to
confirm the river type and the index choice
User has to confirm the river
zone and the index choice
User has to check the classification
Cyprinid type Correct classification
Increase of % of ST-species can be linked to a human
disturbance
Increase of % of intolerant species can be linked to
particular extreme disturbance
High risk of misclassification
Cyprinid Index
should be used
Salmonid Index
proposed
Salmonid Index
proposed
Salmonid Index
proposed
User has to confirm the river
zone and the index choice
User has to confirm the river
zone and the index choice
User has to confirm the river
zone and the index choice
In particular ecoregions, the possibilities for sites to be a Salmonid type are low. This is the case for Hungarian lowlands, Eastern plains, Pontic province, Baltic province and Mediterranean region. In particular ecoregions, the possibility for sites to be a Cyprinid type are low. This is the case for Alps, Pyrenees, Fenno-Scandian shield and Borealic uplands.
22

7th step: Ecological class boundaries Ecological class boundaries are only based on the distributions of index values for undisturbed sites in the two river types (Table 11). As the sampling method (sampling by boat or by wading) has been shown to influence the score value, especially in the Cyprinid zone, class boundaries have been computed separately for sites sampled by boating and wading in the Cyprinid zone (see indices limitations section below). • The limits between class 1 and 2 correspond to the value of the 95% quantile of the index
distribution for undisturbed sites. • The limits between class 2 and 3 correspond to the value of the 25% quantile of the index
distribution for undisturbed sites. • The limits between classes 3-4 and 4-5 are defined in a way that the ranges between classes
3, 4 and 5 are similar. The specific class scoring for Cyprinid type sites sampled by boating has to be considered as a preliminary one. More work is needed in the future (requiring more data from undisturbed or slightly disturbed boating sites) to correctly handle these parameters as predictors within in the different index models. Table 11: Ecological class boundaries for the two indices.
Cyprinid index Salmonid index Wading Boating
Class 1 [0.911 -1] [0.939 -1] [0.917 - 1]
Class 2 [0.755- 0.911[ [0.655- 0.939[ [0.562 - 0.917[
Class 3 [0.503 -0.755[ [0.437 -0.655[ [0.375 - 0.562[
Class 4 [0.252 -0.503[ [0.218 -0.437[ [0.187 - 0.375[
Class 5 [0 - 0.252[ [0 - 0.218[ [0 - 0.187[
Limitations in the use of the Index due to the sampling location The fish index, in the present state, cannot be used for surveys undertaken in lateral water bodies of the floodplain and is only calibrated correctly for sites sampled in the main river channel. In the case of fishing occasions where the lateral water bodies from the floodplain were sampled (in addition to or separately from sampling the main channel) the index values are significantly lower in comparison with sites where only the main channel is sampled. Limitation in the use of the indices in relation with the environment The statistical models that are used for the EFI+ reflect the average response of fish communities to environmental conditions. The application of the EFI+ for particular environmental situations might cause problems. These indices have been developed for sites located in the ecoregions
23

presented in Annex 2. Therefore, the index should not be applied in areas with a fish fauna deviating from those of the tested ecoregions. The model was developed using data from sites with environmental characteristics ranging between specific limits. These values are given in Table 4 and 5. Sites should have characteristics within these ranges in order to obtain a confident assessment. Some environmental situations are not correctly handled by the two indices. These situations are: - presence of a natural lake upstream from the site (see Table 14, Part II) - presence of a winter dry period - “organic” rivers (main substrate of the river is organic) Although no clear differences in index behaviour have been observed for intermittent/ summer dry rivers, the indices must be used with caution due to the low number of undisturbed sites available to calibrate and test the index in these conditions. River size: The metrics have been mainly calibrated for rivers with an upstream drainage area less than 10,000 km2. Independent of the sampling method, the river size seems not to significantly influence the index values for undisturbed sites when the upstream drainage area is less than 10,000 km2. The index should be used with caution in the lowland reaches of very large rivers as no reference sites from these reaches have been available for the calibration of the index. In those cases the index uses only extrapolated predictions based on the trends observed in the models. Limitations in the use of the Index due to very low species richness The EFI+ is based on the analysis of the whole fish assemblage and metrics are based on the relative occurrence or abundance of functional guilds of species. Therefore, it is clear that assemblage-based metrics are unsuitable when the richness of a site is limited to one species. In most cases in Europe this relates to small headwater rivers where brown trout are the only fish species present. The only case where such species composition based metrics could react is when the response to a disturbance is an increase of species richness. That could be the case for example for impounded sites in headwaters: other species can appear (including rheophilic cyprinid species if the water temperature is not too low) and the proportion of intolerant fish species can be lower than expected in the absence of human disturbance. In principle, one metric selected for the Salmonid type (the abundance of individuals < 15 cm of habitat intolerant species (Hab.Intol.150)) should be able to give a response when only trout is present. But at present, additional analysis are needed to test the efficiency of this metric alone in such situations. Nevertheless, in general, it has to be considered that the sensitivity of the EFI+ to disturbance is quite low in areas of naturally very low species richness.
24

Limitations in the use of the index due to the number of fish caught When few specimens were caught the software still allows the calculation of the indices, but the results must be considered with caution. The same caution applies when the sampled area is smaller than 100 m². These criteria reflect the need for sampling to be adequate to assess the abundance and structure of the fish assemblage and the population structure of the species caught. The index seems relatively independent from the number of fish caught. This could be directly related to the modelling methods used. All the four selected metrics are modelled after taking into account a measure of the total richness or the number of fish caught depending of the metric. Nevertheless, too low a number of fish caught would alter the capacity of the index to assess robustly the ecological status. The user has to be careful when the number of fish caught is less than 30 individuals and a warning is included in the output of the software in such a situation. Two cases could be problematic and the EFI+ should be used with care: (1) undisturbed rivers with naturally low fish density and (2) heavily disturbed sites where fishes are nearly extinct. In the first case, fish are close to the natural limits of occurrence and therefore might not be good indicators for human impacts. The occurrence of fish in those rivers is highly coincidental and therefore not predictable. If the very low density is caused by severe human impacts more simple methods or even expert judgement are sufficient to assess the ecological status of the river. Consequently, when no fish occur at a site, this method is not applicable. Limitations in the use of the index due to the sampling method The EFI+ has been calibrated using only fish data obtained from single-pass electric fishing (or first run of a depletion survey). Therefore, the model is only calibrated using catch-per-unit-effort (CPUE) data and not from quantitative population estimates. If data population estimates from multiple passes are used (i.e. same site fished several times and catches cumulated) the EFI+ will produce erroneous results. Therefore, where multi-pass sites are considered, only the first run data should be used to calculate the indices. The sampling method (boating or wading) has a strong impact on the index values. Most of the calibration sites were sampled by wading and it was not possible to include this method variable as a potential explanatory variable within the calibration model. The number of sites sampled by boating in the Salmonid type is strongly limited but the response of the index is not too different from those sampled by wading. Conversely, there is a clear effect of the sampling method on the index values for the Cyprinid type. In most cases sites sampled by boating tend to exhibit lower index values. This pattern is observed across the dataset and these low value boating were not generated by sites from any particular region or country. In conclusion, it seems that the EFI+, in its present state, should be used with caution when sites have been sampled by boating, especially for the Cyprinid type, i.e. for larger and deeper rivers. Nevertheless, in the case of the Cyprinid index an alternative rating system is proposed to allow a specific ranking of sites sampled by boating in the five ecological classes. The boundaries between classes are defined in a different way than for sites sampled by wading. However, this alternative scoring has just to be considered as preliminary and more work is needed to evaluate this index (including additional collection of data from undisturbed or slightly disturbed sites sampled by boating).
25

4. EFI+ application (sampling and data requirements)
The principle procedure of the EFI+ application is shown below (Figure 5).
Site selection
Data collection
1. Location 2. Environment 3. Sampling procedure
Fish sampling Fish data collection
Input of data into database
Assessment of site with the EFI+ software
1. Import of data to software 2. Run the software 3. Output - Identification of river type and appropriate index
- Calculation of observed, theoretical and probability metrics - Calculation of EFI + score and assignment to status class
Figure 5: Different steps required to apply the assessment method 4.1. Site selection
The selected site should be representative within the river segment in terms of habitat types and diversity, landscape use and intensity of human pressures.
A river segment is defined as:
1 km for small rivers (catchment<100 km²)
5 km for medium-sized rivers (100-1000 km²)
10 km for large rivers (>1000 km²)
A segment for a small river will thus be 500 m upstream and 500 m downstream of the sampling site.
26

4.2. Environmental variables and sampling methods
To model the reference conditions for the sampled site, the variables from Annex 1-Table 2 should be recorded in the data sheet (see field protocol in Annex 1). 4.3. Fish sampling
To calculate the index, only fish data obtained by electric fishing can be used. Standardised electric fishing procedures are precisely described in the CEN directive, “Water Analysis – Fishing with Electricity (EN 14011; CEN, 2003) for wadable and non-wadable rivers”.
Fishing procedures and equipment differ depending upon the water depth and wetted width of the sampling site. The selection of waveform, DC (Direct Current) or PDC (Pulsed Direct Current) depends on the conductivity of the water, the dimensions of the water body and the fish species to be expected. AC (Alternating Current) is harmful for the fish and should not be used. The fishing procedure is summarised below, separately for wadable and non-wadable rivers. In both cases, fishing equipment must be suitable to sample small individuals (young-of-the-year).
According to the CEN-standard, the main purpose of the standardised sampling procedure is to record information concerning fish composition and abundance; therefore, no sampling period is defined (according to CEN). However, the EFI+ approach recommends a sampling period of late summer/early autumn except for non-permanent Mediterranean rivers where spring samples may be more appropriate.
Electric fishing at a given site must be conducted over a river length of 10 to 20 times the river width, with a minimum length of 100m. This is to ensure sampling covers the variability of habitats and fish communities within rivers sections, and to ensure accurate characterisation of a fish assemblage. However, in large and shallow rivers (width >15m and water depth <70cm) where electric fishing by wading can be used, several sampling areas cumulating in total at least 1000m2 should be prospected, covering all types of mesohabitats present in a given sampling site (partial sampling method). The length of the sampling site (station) is also calculated as 10 to 20 times the river width. Fishing of longer river sections should be avoided as some metrics referring to the number of species caught (e.g. number of rheophilic species) might be biased due to over sampling.
As a general guide one anode per 5-m of wetted width should be appropriate for sampling in wadable rivers. The operators should fish upstream so that water and sediment disturbed by wading does not affect efficiency. Operators should move slowly, covering the habitat with a sweeping movement of the anodes and attempt to draw fish out of hiding. To aid effective fish capture in fast flowing water the catching nets should be held in the wake of the anode. Each anode is generally followed by one or two hand-netters (hand net: mesh size of 6 mm maximum) and one suitable vessel for transporting fish (Table 12).
In large rivers, the depth (> 0.7 m) and variety of habitats makes prospecting the entire area impossible. Therefore, a partial sampling procedure is applied covering all types of habitats to obtain a representative sample of the site. Qualitative and semi-quantitative information can be obtained by using conventional electric fishing with hand held electrodes in the river margins and delimited areas of habitat. Alternatively, where resources exist capture efficiency can be improved by increasing the size of the effective electric field relative to the area being fished by
27

increasing the number of catching electrodes (electric fishing boats with booms). Arrays comprising many pendant electrodes can be mounted on booms attached to the bows of the fishing boat. The principal array should be entirely anodic with separate provision being made for cathodes. Depending upon water conductivity, the current demands of multiple electrodes can be high and large generators and powerful control boxes may be needed (Tables 12 and 13). In the Tables 12 and 13, the river width corresponds with wetted width.
Table 12: Fishing method: Rivers < 0.7 m depth = wadable rivers Waveform selection: DC or PDC Number of anodes: One anode per 5-m wetted width Number of hand-netters: Each anode followed by 1 or 2 hand-netters (mesh size of 6 mm maximum)
and 1 suitable vessel for holding fish. Number of runs: One run Time of the day: Daylight hours Fishing length: 10 - 20 times the wetted width, with a minimum length of 100 m
Fished area: river width <15 m: The whole site surface river width >15 m: Several separated sampling areas are selected and prospected within a sampling site, with a minimum of 1000 m² (partial sampling method)
Fishing direction: Upstream Movement: Slowly, covering the habitat with a sweeping movement of the anodes and
attempt to draw fish out of hiding. Stop nets: Used if necessary and feasible
Picture 1: Electric fishing in a wadable river
28

Table 13: Fishing method: Rivers > 0.7 m depth = non-wadable rivers (boat fishing) Waveform selection: DC or PDC
Number of anodes: Depending on boat configuration
Number of runs: One run
Time of the day: Daylight hours
Fishing length: 10 -20 times the wetted width, with a minimum length of 100 m
Fished area:
Both banks of the river or a number of sub-samples proportional to the diversity of the habitats present with a minimum of 1000 m² (partial sampling method)
Fishing direction: Normal flow: downstream in such a manner as to facilitate good coverage of the habitat, especially where weed beds are present or hiding places of any kind are likely to conceal fish High flow: upstream Low flow: not necessary to match boat movement to water flow, and the boat can be controlled by ropes from the bank side if required
Movement: Slowly, covering the habitat with a sweeping movement of the anodes or drifting with the boom along selected habitats and attempting to draw fish out of hiding.
Stop net Used if necessary and feasible
Picture 2: Electric fishing from a boat
29

30
4.4. Fish data To calculate the EFI+, each collected specimen should be identified to species level by external morphological characters and the total number of specimens per species should be recorded on the field protocol data sheet (Annex 1-Table 1: fish data). Also, the EFI+ requires the number of fishes larger and smaller than 150 mm to be recorded. Therefore, total length (in mm) of all fish captured should be measured.

Part II: A manual for application 1. Introduction
This part of manual explains how to use the web-based EFI+ software. It details the data input, the interpretation and handling of error messages and the features of the software output.
The EFI+ software application is implemented as Web Client-Server using R-script statistical processing.
2. Web page
The EFI+ software is accessible via the webpage of the EFI+ project: http://efi-plus.boku.ac.at/software
Link to EFI+ software calculation
Figure 6: The front page of EFI+ The main software web page (Figure 7) can be accessed via the link above or via the “EFI+ Software” button on the EFI+ project homepage (Figure 6).
31
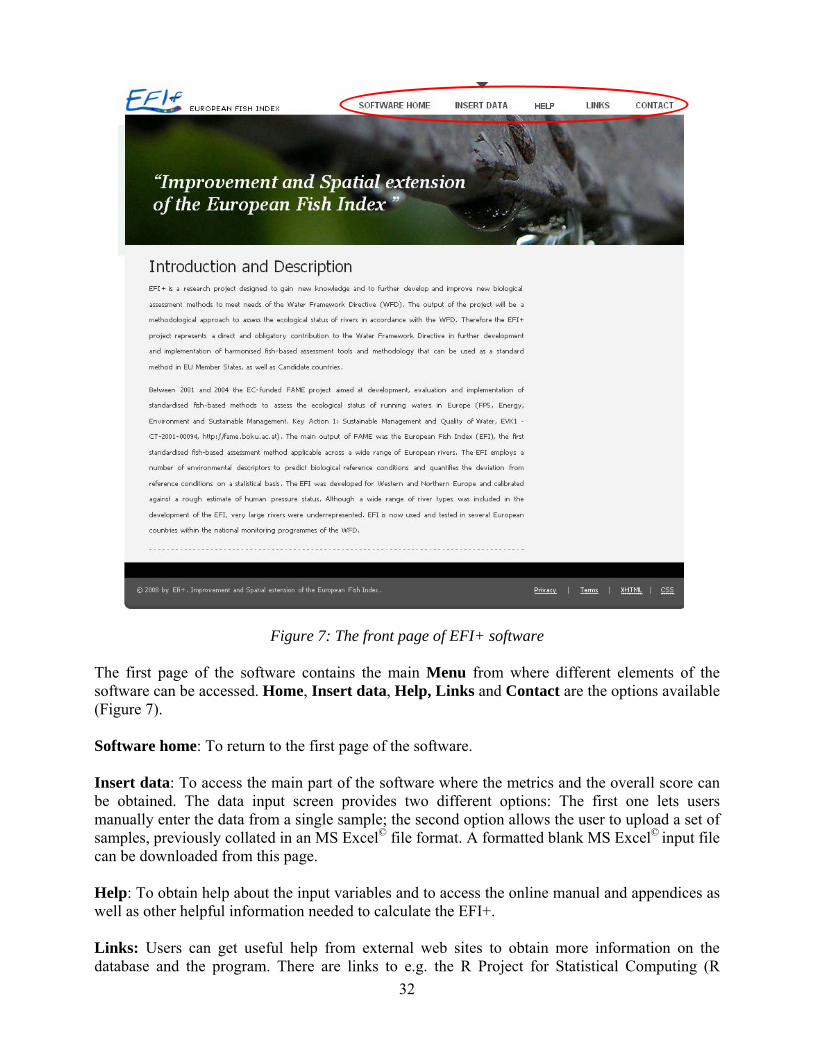
Figure 7: The front page of EFI+ software The first page of the software contains the main Menu from where different elements of the software can be accessed. Home, Insert data, Help, Links and Contact are the options available (Figure 7). Software home: To return to the first page of the software. Insert data: To access the main part of the software where the metrics and the overall score can be obtained. The data input screen provides two different options: The first one lets users manually enter the data from a single sample; the second option allows the user to upload a set of samples, previously collated in an MS Excel© file format. A formatted blank MS Excel© input file can be downloaded from this page. Help: To obtain help about the input variables and to access the online manual and appendices as well as other helpful information needed to calculate the EFI+. Links: Users can get useful help from external web sites to obtain more information on the database and the program. There are links to e.g. the R Project for Statistical Computing (R
32

Development Core Team, 2008) and the River and Catchment Database for Europe (CCM, European Commission 2007). The functionality of the links to external resources is not within the responsibility of the EFI+ consortium. At the bottom of the page there are some links concerning legal warnings and requirements, as well as privacy, ITT terms, software releases, and style formats. 3. Input data
The data required to calculate the EFI+ are described next. This includes the correct formatting to ensure data are entered into the software correctly (Table 14). Table 14: Input variables required for the calculation of the EFI+. Asterisk indicate mandatory variables Variables describing the location, name of site and date of fishing
*Site code Code given to each sampling site by user (could be country abbreviation + users own code of the site, e.g. DE0001).
*Latitude Latitude in decimal degrees, projection WGS 84.
*Longitude Longitude in decimal degrees, projection WGS 84.
*Day e.g.: 08
*Month e.g.: 10
*Year e.g.: 2008
Country Name of country (should be in English).
*River Name National name of the river (for transboundary, small rivers, the name of country where it confluences, i.e. Semois, Belgium – Semoy – France could be used).
*Site Name Location name e.g. indicating a nearby town or village.
*Altitude The altitude of the site in metres above average sea level.
* Ecoregion Ecoregion according to Illies, according Table 6, Part I
* River Region To define the river region use table in Annex 2, Table 1, (e.g. Danube, Ebro, North_Sea, Mediterranean_Sea_WB).
Variables describing the sampling method
*Sampling Location
Where the sampling site is situated in relation to the river. Categories: Main channel = sampling was done in the main channel Backwaters = sampling was done in a floodplain water body Mixed = Sampling in both main channel and backwaters. NoData = No information of location
*Method Definition, how electric fishing was carried out in three classes (NoData, Boat, Wading, Mixed (sites sampled with both - wading and boat).
*Fished Area Area of the section that has been sampled (sampled length * sampled width) given in m2.
33

*Wetted width Wetted width in metres is normally calculated as the average of several transects across the stream. The wetted width is measured during fish sampling (performed mainly in autumn during low flow conditions)
Environmental variables describing the sampling site, used to obtain the expected value of metrics
*Mediterranean Type A factor of three classes that is needed for the classification of Mediterranean rivers (see Annex 2, Figure 3).
Natural Lake
Are there natural lakes present upstream of the site? Categories: Yes/ No/NoData. Only applicable if the lake affects the fish fauna of the site, e.g. by altering thermal regime, flow regime or providing seston. Use Water Framework Directive definition of lake: more than 50ha. If there are artificial lakes (as e.g. fish ponds upstream) these are pressures and must not be considered in environmental variables.
Flow Regime
Normal flow pattern for the river. Divided into four classes: Permanent = Never (or extremely rarely) having zero water velocity or low flow. Never drying out. Summer dry = In normal years having extreme summer low flow with no water velocity or even dry conditions. (Mediterranean regime). Winter dry = In normal years having extreme winter low flow with no water velocity or even dry conditions. Intermittent = Having extreme low flow with no water velocity (or even dry conditions) at intervals. The timing and length of intervals is unpredictable. NoData when data is not available.
*Geomorphology
Information in 5 categories to be selected: Naturally constraint no mob = Naturally constraint without mobility (riverbed is fixed), Braided, Sinuous, Meandering regular, Meandering tortuous, NoData = Not applicable Describe the situation before any major human control of river bed!
*Former Flood Plain If the river has a former floodplain: Proportion of connected floodplain still remaining. Categories: No/Small/Medium/Large/Some waterbodies remaining/NoData
*Water Source
The source of the river water should be assigned to one of three classes; glacial, nival, and pluvial. Glacial = >15% glaciated area in the catchment, maximum monthly mean flow during summer. Nival = Yearly flow regime dominated by snowmelt in spring, with spring maximum flow. Pluvial = Yearly flow regime dominated by rainfall, maximum flow often during spring, autumn/winter. Mediterranean areas will fall under pluvial (but often with flow regime “Summer dry” or “Intermittent”). Groundwater = groundwater must be dominant! NoData. = not available. (See Annex 7)
*Upstream Drainage Area Drainage area upstream of the site in km2
*Distance from Source Distance from source in kilometres to the sampling site measured along the river. In the case of multiple sources, measurement shall be made to the most distant upstream source (data source: maps, preferably 1:25 000).
*River Slope
Slope of streambed along stream expressed as per mill, m/km (‰). The slope is the drop of altitude divided by stream segment length. The stream segment should be as close as possible to 1 km for small streams, 5 km for intermediate streams and 10 km for large streams (Data source: maps with scale 1:50 000 or 1:100 000).
*Air Temperature Mean Annual
Average annual air temperature measured for at least 10 years. Given in degrees Celsius (°C) (data source: nearby measuring site, interpolated data).
*Air Temperature January Average January air temperature, given in degrees Celsius (°C) (data source: nearby measuring site, interpolated data).
*Air Temperature July Average July air temperature, given in degrees Celsius (°C) (data source: nearby measuring site, interpolated data).
34

*Former Sediment
Naturally dominant sediment information in the following categories: Organic Silt Sand Gravel/Pebble/Cobble Boulder/Rock NoData = Not avaiable Situation before major changes of sediment conditions! (See Annex 7)
Variables describing the fish data
*Species Name Scientific name of species (see Annex 3).
*Total Number Run1
All caught individuals (incl. 0+) of the species in run 1.
*Number Length Below Number of individuals with total length ≤150mm for a given species for the first run of sampling.
*Number Length Over
Number of individuals with total length > 150mm for a given species for the first run of sampling.
To analyse river connectivity and impacts on diadromous species, it is possible to upload additional information about the current and historical occurrence of diadromous species (according to Table 15). Table 15: List of species selected to compute the index based on diadromous species.
Number Species Names 1 Alosa alosa 2 Anguilla anguilla 3 Alosa fallax 4 Acipenser gueldenstaedti 5 Alosa immaculata 6 Acipenser nacarii 7 Acipenser nudiventris 8 Acipenser stellatus 9 Acipenser sturio
10 Diadromous Coregonidae family11 Huso huso 12 Lampetra fluviatilis 13 Osmerus eperlanus 14 Platychtys flesus 15 Petromyzon marinus 16 Salmo salar
17 Salmo trutta trutta
Insert information about historical and present occurrence of the species; The valid categories for historical informationare: “No”, “Yes” and “NoData”. For present information the categories are: “Yes” and “No”. Please note: In the case that the present occurrence of a diadromous species is mainly due to stocking the user has to decide whether “No” will be chosen. If a species occurs at present and there are no historical data available historical presence can be assumed.
35

4. How to insert data
There are two different ways available to upload data: Manually online or upload of an MS Excel© file. The manual data entry method, via an online form, uses variable modality lists and an integrated error check system to ensure correct entry of data. However, it is necessary to introduce data site by site and step by step. When using the MS Excel© file input, it is possible to upload large datasets. However, although the software will check for errors in the uploaded file the user must correct these errors manually in the original data file before the software will process the dataset. 4.1. Manual data input
Click to go to the manual data input site
Figure 8: Manual data input selection Once this input option has been chosen, a data entry form page with a large number of mandatory variables (all of them are marked by asterisk) appears. To avoid typing errors, records can be entered with help of selection boxes (for variables Country, Date, Eco-regions, River-region, Sampling method, Flow regime, Natural lake upstream, Geomorphology, Former floodplain, Water source, Temperature of January, Temperature of July, Former sediment size, Species and Presence of diadromous species). For some variables, information signs are available that can be clicked to access help with definitions or possible values of variables. Once the data have been filled, they can be send to the server (by clicking on the “Send” button) to check for errors and possible solutions. This information will be indicated on a new screen. Categorical data are checked against a list of possible classes and modalities whilst numerical variables are checked against a range of allowable values (see Table 16).
36

Table 16: Allowed ranges of variables. Variable Range Variable Range Longitude -12 to 40 Upstream drainage area 1 to 20000000 km² Latitude 35 to 72 Distance from source 0.01 to 8000 km Day 1 to 31 River slope 0.001 to 200 0/00 Month 1 to 12 Air temperature mean annual -15 to 35ºC Year 1950 to 2020 Air temperature January -25 to 30ºC Altitude 0 to 4800 m Air temperature July -5 to 45ºC Mediterranean type 0 to 2 Total number of run1 1 to 1100000 Fished area 50 to 100000 m² Number Length below 150mm 0 to 1000000 River width 1 to 6000 m Number Length above 150mm 0 to 1000000
Note: Manual input data are not recorded but the data entered are included in the output file for further use (e.g. data sheet input if you have to repeat the assessment procedure).
Figure 9: Manual entering data form In addition, it’s possible to store manual input data by getting an MS Excel© copy before calculating the EFI+ (Figure 10).
37

Click to get the MS Excel© copy of input data
Figure 10: Get the MS Excel© copy of input data 4.2. Data input by MS Excel© spread sheet A standardised input data MS Excel© spread sheet file can be downloaded from the server. spread sheet file can be downloaded from the server.
Figure 11: Getting the MS Excel© input file Figure 11: Getting the MS Excel© input file
38

This spread sheet is named “EFI+SpreadSheet.xls” (Figure 12) and contains two work sheets: The first is called “input1 all actual variables”, where all site and survey information should be entered. The second worksheet is called “input2 all diadromous variables”, where information about diadromous species can be entered. Each sampling occasion*species record combination makes up an array that is filled in one row of the input1 file. The addition of diadromous species information in corresponding data arrays in input2 file is optional. Note: The name of the provided spread sheet can be changed by the user but the new name must not have any space between words and must not include special cases (e.g. “(“etc.). In order to guarantee that the upload works, it’s recommended to always use the MS Excel© input file provided at the software web site with the original file name (Figure 11).
Figure 12: MS Excel© input file
In the first work sheet (“input1 all actual variables”) each variable has to be filled on the appropriated column. It is important to be very careful when entering data and variable names and it is necessary to assign the correct variable names to the data columns; otherwise an error message will appear after the sheet has been checked by the software. Note: Correct formatting and entry of values in the worksheet is essential. When formatting and variable mistakes happen, the array of data will be identified as an error by the software; therefore it is extremely important that imported data are thoroughly checked according to the input variable definitions in Annex 5-Table 1. The second work sheet deals with diadromous species (“input2 all diadromous variables”). It is composed of a set of reference variables, which can be used to relate information on diadromous
39

species status to the samples recorded in work sheet one and a second group of Yes/No/NoData variables about presence/absence of diadromous species. Once data have been entered into the blank data file the MS Excel© file can be uploaded into the software using the “Browse” function to locate the file on the computer and the “Send file” button to send the information to the software. During the upload the file is sent to the server for a check, and errors in data formats and possible solutions are indicated on the next screen. Categorical data are checked against a list of possible classes and modalities whilst numerical variables are checked against a range of allowable values (see Table 16). Errors in the dataset must be corrected in the original MS Excel© file and then the corrected file must be re-imported into the software.
Figure 13: Example of warnings and errors page The checked input files are converted into an ASCII file, a semicolon separated file format in which the first row are the name of variables to be use by R modules, where metrics will be calculated, the other rows represent the input data (Figure 13).
Figure 14: Content of Input.txt
40

After upload of a clean data file a separate web page will appear where the ASCII versions of both work sheets can be displayed (either “See the R-Input-file” or “See the R-Input-Diadromous file” prior to calculation of the EFI+. At this stage the EFI+ values can be calculated by clicking on the “Run script” button. This activity processes the ASCII input files using the R-Script analysis and produces the output files.
Press the button “Run script” to calculate the output.
Figure 15: Running the script for the calculation of the EFI+ Windows-related problem In case you are using MS Excel© 2003 with “Service Pack 3 for Office 2003”, you may get the error message “File error: data may have been lost”. In this case you have to click OK one time and the file does open without data being lost. The error message is related to a version conflict of MS Excel© only and has no influence on the calculation of results.
Figure 16: The MS Windows-related error message
41

Getting help The EFI+ calculation software contains different help systems. For manual data input, selection boxes help to avoid misspelling for different variables and some variables have a mark up reference that helps users with definitions and deeper information. When clicking the button “Help”, users’ access to a web page with detailed help information, e.g. in section “See documentation - PDF” the EFI+ software manual and the annexes. The documents are accessible in pdf format . In addition, a filled input template file is available and it’s possible to check Illies Ecoregions and the Mediterranean Type directly via Google Maps (“See documentation - WEB”). In section “View values” all data required for the EFI+ calculation are explained.
Figure 17: The web help system
5. Output
The final index values are computed and exported to an MS Excel© file (NewEFI+output.xls) by the web server. The output file is composed of four sets of data: reference and classification data, observed and expected metrics, partial and aggregated indices and final scores (Figure 18). Reference and classification data Contents: site, date, latitude, longitude, ecoregion, sampling method, EFT.river.typology, ST-Species, River type and Comment.river.type.
42

This set of variables reports the site information (Sample.code, Date, Latitude, Longitude) and the typological variables (Modified.ecoregion, Modified.typology) as well as the classification into Salmonid or Cyprinid type. This also includes the modified Illies ecoregion classification in which Mediterranean region has been divided.
Figure 18: Showing the first part of the MS Excel© output table. Observed and expected metrics Contents: Obs.dens.HINTOL.inf.150, Obs.dens.O2INTOL, Obs.ric.RH.PAR, Obs.dens.LITH, Exp.dens.HINTOL.inf150, Exp.dens.O2INTOL, Exp.ric.RH.PAR, Exp.dens.LITH, Hist.ric.diadromous, Present.ric.diadromous This part of the output includes the observed density and richness data: Obs.dens.HINTOL.inf.150: density of individuals with length ≤ 150 mm that belong to species intolerant to habitat degradation, Obs.dens.O2INTOL: density of oxygen depletion intolerant species, Obs.dens.RH.PAR: richness in number of species of rheophilic reproduction habitat species, Obs.dens.LITHO: density of species with lithophilic reproduction habitat. There are also included the expected densities that have been predicted by the software models: Exp.dens.HINTOL.inf.150, Exp.dens.O2INTOL, Exp.dens.RH.PAR, and Exp.dens.LITHO as well as the actual presence of diadromous species (Present.ric.diadromous) and the historical one (Hist.ric.diadromous). Partial and aggregated indices Contents: Ids.dens.HINTOL.inf.150, Ids.dens.O2INTOL, Ids.ric.RH.PAR, Ids.dens.LITH, Aggregated.score.Salmonid.zone and Aggregated.score.Cyprinid.zone, Ids.ric.diadromous This set of variables includes the scores of indices Ids.dens.HINTOL.inf.150, Ids.dens.O2INTOL, Ids.ric.RH.PAR, Ids.dens.LITH. as well as the aggregated indices (Aggregated.score.Salmonid.zone and Aggregated.score.Cyprinid.zone) obtained by the average of both single indices. For the Salmonid index it is the average of oxygen intolerant species index and habitat intolerant species index, for the Cyprinid index it is an average of
43

indices related to rheopar species. In addition, the variable “Ids.ric.diadromous” (index diadromous species richness) is obtained by comparison between actual presence of diadromous species (Present.ric.diadromous) and the historical one (Hist.ric.diadromous). If the actual occurrence of diadromous species is mainly due to natural reproduction and this index is close to 1 it is unlikely that there are connectivity problems on a catchment scale. Vice versa, an index value close to 0 indicates the possibility of severe migration barriers. Final scores Contents: Fish.Index, Fish.Index.class, Comment Fish Index, Comments sampling effort. Finally, the aggregated indices are classified in a five class range (Class.scores.Salmonid.zone and Class.scores.Cyprinid.zone, see Table 10 in Part I). In addition to the final metric values, comments and information regarding the limits of the EFI+ are given in the output file on a site specific basis. Four additional fields with important comments about the limits of results are indicated (Table 17). These four fields give comments and suggestions for end-users to validate the options used and assessments made. Table 17: Comments and explanation of the software output.
Comment Explanation SAMPLING DATE Ok Sampling date is within the EFI+ sampling period between
August and November. Date out of sampling period Please handle EFI+ results with care. The EFI+ sampling
period must be between August and November, to consider recruitment and the end of the productive season.
RIVER TYPE Nothing to report The initial river type selected seems correct (good agreement
between the proportion of Salmonid type species and the selected river type.
To be checked by user The initial river type selected is not in agreement with the proportion of Salmonid type species. User has to confirm the river type and the index choice.
SAMPLING LOCATION Nothing to report The main channel has been sampled Fish index to be used with caution Both the main channel and some connected water bodies have
been sampled. Fish index inadequate Only backwaters have been sampled SAMPLING EFFORT Nothing to report High number of fish caught Fish index to be used with caution Low number of fish caught (less than 30 fish) SPECIES RICHNESS Nothing to report Species richness moderate or high Fish index to be used with caution Only one species
44

45
6. References
CEN, 2003. Water Analysis: Fishing with Electricity (EN 14011; CEN, 2003) for wadable and non-wadable rivers.
EU Water Framework Directive, 2000. Directive 2000/60/EC of the European Parliament and the Council of 23 October 2000 establishing a framework for community action in the field of water policy. Official Journal of the European Communities (22.12.2000) L327,1.
European Commission 2007, EUR 22649 EN, DG Joint Research Centre, Institute for the Environment and Sustainability, European River and Catchment Database – Version 2.0 (CCM2) – Analysis Tools, Authors Jürgen Vogt, Stephanie Foisneau, 22pp. ISSN 1018
FAME, 2001-2004. FAME - Development, Evaluation and Implementation of a Standardised Fish-based Assessment Method for the Ecological Status of European Rivers. A Contribution to the Water Framework Directive. A project under the 5th Framework Programme Energy, Environment and Sustainable Development Key Action 1: Sustainable Management and Quality of Water. Contract No: EVK1 -CT-2001-00094. http://fame.boku.ac.at
FAME CONSORTIUM (2004). Manual for the application of the European Fish Index - EFI. A fish-based method to assess the ecological status of European rivers in support of the Water Framework Directive. Version 1.1, January 2005.
Karr J.B., 1981. Assessment of biotic integrity using fish communities. Fisheries (6) 6, 21-27
Melcher A., Schmutz S., Haidvogl G., 2007. Spatially based methods to assess the ecological status of European fish assemblage types. Fisheries Management and Ecology, 2007, 14, 453-463.
R Development Core Team (2008). R: A language and environment for statistical computing. R Foundation for Statistical Computing. Vienna, Austria. ISBN 3-900051-07-0, URL: http://www.R-project.org