manpower and employment - documents.gov.indocuments.gov.in/or/10464.pdf · manpower and employment...
TRANSCRIPT
MANPOWER AND EMPLOYMENT 1. Orissa is rich in natural resources, but still it
groans under poverty and unemployment.
While the Labour force shows an increasing
trend over the years, the employment
opportunity in the organized sector has
already been saturated. In-spite of
introduction of a number of employment
generation programmes by Central
Government / State Government, the backlog
of un-employment in the State by the end of
Tenth Plan period has been estimated to be
9.74 lakh. To fight the situation, focused
attention is being given for creation of
sustainable self-employment opportunities in
the State.
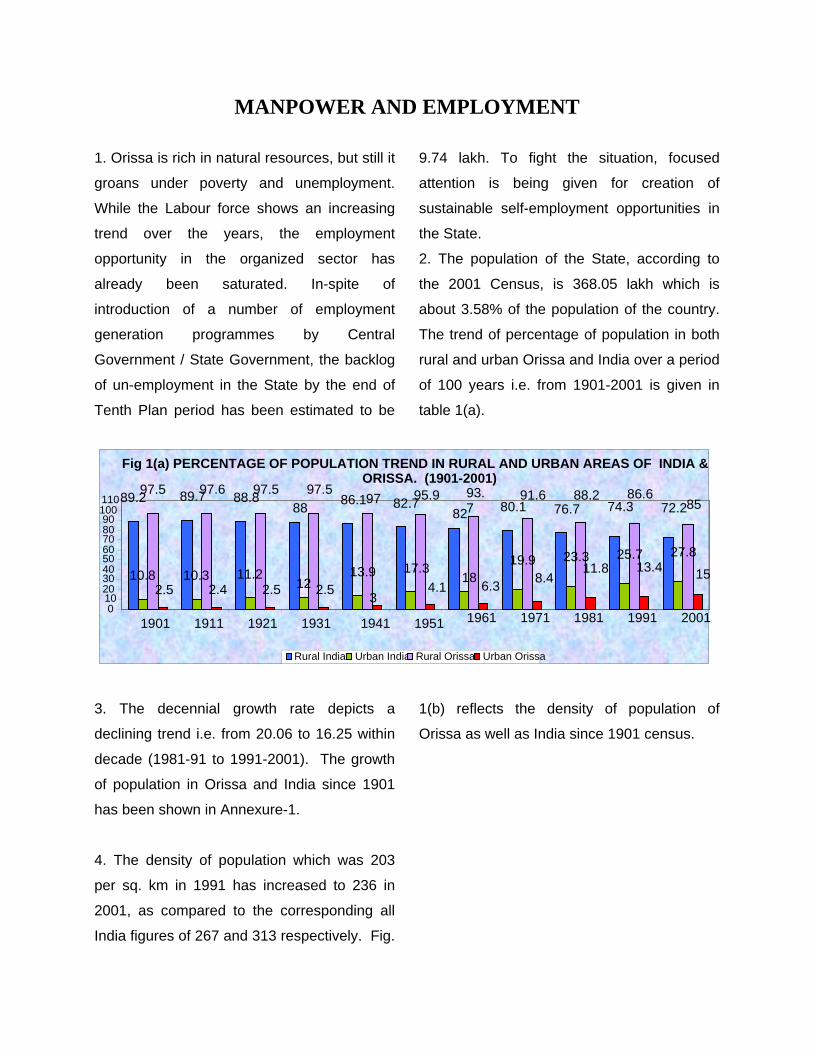
2. The population of the State, according to
the 2001 Census, is 368.05 lakh which is
about 3.58% of the population of the country.
The trend of percentage of population in both
rural and urban Orissa and India over a period
of 100 years i.e. from 1901-2001 is given in
table 1(a).
Fig 1(a) PERCENTAGE OF POPULATION TREND IN RURAL AND URBAN AREAS OF INDIA &ORISSA. (1901-2001)
89.2 89.7 88.888 86.1 82.7
82 80.1 76.7 74.3 72.2
10.8 10.3 11.2 12
13.9 17.318
19.9 23.3 25.7 27.8
97.5 97.6 97.5 97.597 93.
7 91.6 88.2 86.6
85
2.5 2.4 2.5 2.5 34.1 6.3 8.4
11.8 13.4 15
95.9
0 1020 30 40 50 60 70 80 90
100 110
1901 1911 1921 1931 1941 1951 1961 1971 1981 1991 2001
Rural India Urban India Rural Orissa Urban Orissa
3. The decennial growth rate depicts a
declining trend i.e. from 20.06 to 16.25 within
decade (1981-91 to 1991-2001). The growth
of population in Orissa and India since 1901
has been shown in Annexure-1.
4. The density of population which was 203
per sq. km in 1991 has increased to 236 in
2001, as compared to the corresponding all
India figures of 267 and 313 respectively. Fig.
1(b) reflects the density of population of
Orissa as well as India since 1901 census.

MANPOWER AND EMPLOYMENT
5. The district wise decadal growth rate (DGR)
and population density are given in Map-1 &
Map 2 respectively.
Map – 1
6. As regards DGR it was observed that, it is
fairly high i.e. (17.5% to 25%) in 10 nos. of
districts as compared to state average 16.3%.
In 13 districts the growth rates have been
lower than the State average. DGR in urban
population has been very high i.e. 30% to
50%. The high growth rate may be attributed
to either installation of different projects which
attracted immigration to these areas or due to
the development of more urban growth
centres.
Fig.1(b) Distribution of Population Density of Orissa and India. 1901-
2001,Census-2001.
267
216177
142117
10390818277
313
0
50
100
150
200
250
300
350Orissa India
Map – 2
7. As regards population density the districts
vary widely from 667 per sq. km. in Khurda
district to as low as 81 per sq. km. in
Kandhamal district. It also reflected that the
districts lying in the coastal plain have
invariably higher population density than
those lying in other regions.
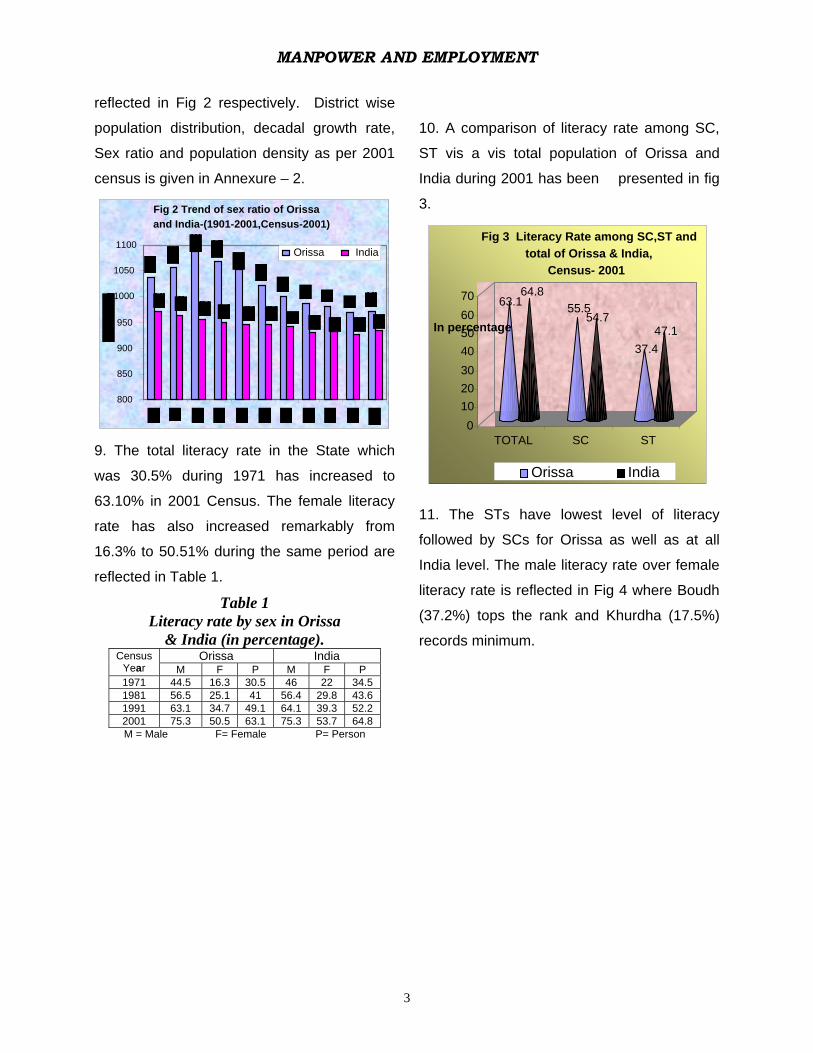
8. The sex ratio has increased marginally from
971 during 1991 to 972 in 2001 which is much
higher than the all India figures 927 and 933
respectively. Sex ratio since 1901-2001 is
2
MANPOWER AND EMPLOYMENT
reflected in Fig 2 respectively. District wise
population distribution, decadal growth rate,
Sex ratio and population density as per 2001
census is given in Annexure – 2.
9. The total literacy rate in the State which
was 30.5% during 1971 has increased to
63.10% in 2001 Census. The female literacy
rate has also increased remarkably from
16.3% to 50.51% during the same period are
reflected in Table 1.
Table 1 Literacy rate by sex in Orissa
& India (in percentage). Orissa India Census
Year M F P M F P 1971 44.5 16.3 30.5 46 22 34.5 1981 56.5 25.1 41 56.4 29.8 43.6 1991 63.1 34.7 49.1 64.1 39.3 52.2 2001 75.3 50.5 63.1 75.3 53.7 64.8 M = Male F= Female P= Person
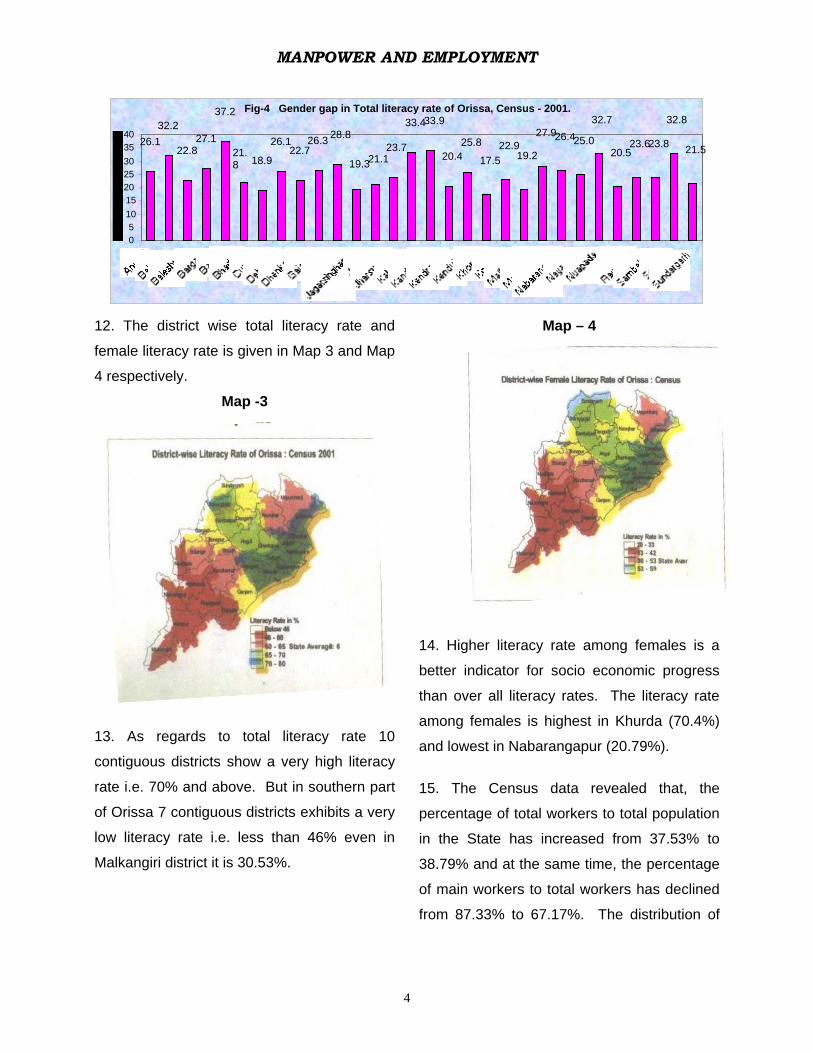
10. A comparison of literacy rate among SC,
ST vis a vis total population of Orissa and
India during 2001 has been presented in fig
3. Fig 2 Trend of sex ratio of Orissa and India-(1901-2001,Census-2001)
800
850
900
950
1000
1050
1100Orissa India
63.164.8
55.5 54.7
37.447.1
010203040506070
In percentage
TOTAL SC ST
Fig 3 Literacy Rate among SC,ST and total of Orissa & India,
Census- 2001
Orissa India
11. The STs have lowest level of literacy
followed by SCs for Orissa as well as at all
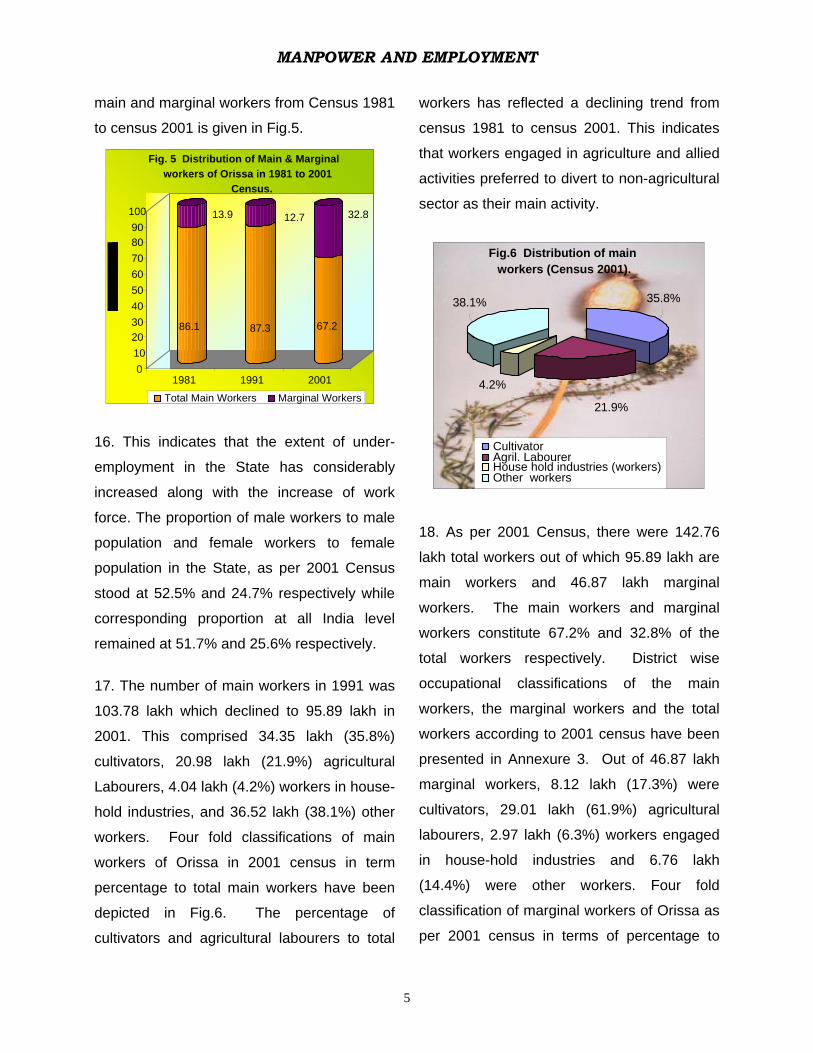
India level. The male literacy rate over female
literacy rate is reflected in Fig 4 where Boudh
(37.2%) tops the rank and Khurdha (17.5%)
records minimum.
3
MANPOWER AND EMPLOYMENT
Fig-4 Gender gap in Total literacy rate of Orissa, Census - 2001.
26.1 32.2
22.8 27.1
37.2
21.8 18.9
26.1 22.7
26.3 28.8
19.321.123.7
33.433.9
20.425.8
17.522.9
19.2
27.926.4 25.0 32.7
20.5 23.6 23.8
32.8
21.5
05
10152025303540
12. The district wise total literacy rate and
female literacy rate is given in Map 3 and Map
4 respectively.
Map -3
13. As regards to total literacy rate 10
contiguous districts show a very high literacy
rate i.e. 70% and above. But in southern part
of Orissa 7 contiguous districts exhibits a very
low literacy rate i.e. less than 46% even in
Malkangiri district it is 30.53%.
Map – 4
14. Higher literacy rate among females is a
better indicator for socio economic progress
than over all literacy rates. The literacy rate
among females is highest in Khurda (70.4%)
and lowest in Nabarangapur (20.79%).
15. The Census data revealed that, the
percentage of total workers to total population
in the State has increased from 37.53% to
38.79% and at the same time, the percentage
of main workers to total workers has declined
from 87.33% to 67.17%. The distribution of
4
MANPOWER AND EMPLOYMENT
main and marginal workers from Census 1981
to census 2001 is given in Fig.5.
16. This indicates that the extent of under-
employment in the State has considerably
increased along with the increase of work
force. The proportion of male workers to male
population and female workers to female
population in the State, as per 2001 Census
stood at 52.5% and 24.7% respectively while
corresponding proportion at all India level
remained at 51.7% and 25.6% respectively.
17. The number of main workers in 1991 was
103.78 lakh which declined to 95.89 lakh in
2001. This comprised 34.35 lakh (35.8%)
cultivators, 20.98 lakh (21.9%) agricultural
Labourers, 4.04 lakh (4.2%) workers in house-
hold industries, and 36.52 lakh (38.1%) other
workers. Four fold classifications of main
workers of Orissa in 2001 census in term
percentage to total main workers have been
depicted in Fig.6. The percentage of
cultivators and agricultural labourers to total
workers has reflected a declining trend from
census 1981 to census 2001. This indicates
that workers engaged in agriculture and allied
activities preferred to divert to non-agricultural
sector as their main activity.
86.1
13.9
87.3
12.7
67.2
32.8
0102030405060708090
100
1981 1991 2001
Fig. 5 Distribution of Main & Marginal workers of Orissa in 1981 to 2001
Census.
Total Main Workers Marginal Workers
Fig.6 Distribution of main
workers (Census 2001).
4.2%
21.9%
35.8%38.1%
CultivatorAgril. Labourer House hold industries (workers)Other workers
18. As per 2001 Census, there were 142.76
lakh total workers out of which 95.89 lakh are
main workers and 46.87 lakh marginal
workers. The main workers and marginal
workers constitute 67.2% and 32.8% of the
total workers respectively. District wise
occupational classifications of the main
workers, the marginal workers and the total
workers according to 2001 census have been
presented in Annexure 3. Out of 46.87 lakh
marginal workers, 8.12 lakh (17.3%) were
cultivators, 29.01 lakh (61.9%) agricultural
labourers, 2.97 lakh (6.3%) workers engaged
in house-hold industries and 6.76 lakh
(14.4%) were other workers. Four fold
classification of marginal workers of Orissa as
per 2001 census in terms of percentage to
5

MANPOWER AND EMPLOYMENT
total marginal workers of Orissa has been
reflected in Fig.7.
19. Table 2 shows the economic classification
of workers in Orissa since Census - 1981. Fig.7 Distribution of marginal
workers, Census - 2001.
17.30%
61.90%
6.40% 14.40%
Cultivators Agricultural labourers Household industries Other workers
Table - 2 Economic Classification of Workers in Orissa.
(Number in thousands) As per 1981Census As per 1991
Census As per 2001
Census Sl. No.
Category of Workers
Number % Number % Number % A. MAIN WORKERS 1. Cultivators 4053 (40.4) 4599 (38.7) 3435 (24.1)
2. Agricultural labourers 2397 (23.9) 2977 (25.1) 2098 (14.7)
3. Live stock, forest, fisheries etc. 207 (2.1) 193 (1.6) N.C. N.C.
4. Mining and quarrying 72 (0.7) 101 (0.8) N.C. N.C.
5. Manufacturing and processing
i. Household industries 285 (2.8) 324 (2.7) 404 (2.8)
ii. Other than household industries 313 (3.1) 364 (3.1) N.C. N.C.
6. Construction 96 (1.0) 90 (0.8) N.C. N.C.
7. Trade and commerce 355 (3.5) 558 (4.7) N.C. N.C.
8. Transport, storage and communication 136 (1.4) 181 (1.5) N.C.
9. Other services / other workers 721 (7.2) 991 (8.3) 3652 (25.6)
TOTAL MAIN WORKERS 8635 ( 86.1) 10378 (87.3) 9589 (67.2) B. MARGINAL WORKERS 1387 (13.9) 1505 (12.7) 4687 (32.8)
C. TOTAL WORKERS (A+B) 10022 (100.0) 11883 (100.0) 14276 (100.0)
D. TOTAL NON-WORKERS 16348 16348 19777 22528
N.C. – Not compiled N.B : Figures in brackets are percentages to total workers, Source : 1981, 1991and 2001 Census.
* Other workers in 2001 Census – all workers except Cultivator, Agricultural Labourers and Household industries.
EGISTERED UNEMPLOYMENT
hanges in
the State functioning under Directorate of
Employment. These employment exchanges
R
20. There are 80 Employment Exc
6

MANPOWER AND EMPLOYMENT
normally undertake registration of eligible
unemployed with the aim to provide them
possible placement in the existing vacancies
under different public sector establishments.
But the present ongoing reform process of the
State Government to downsize the State
Government establishments as well as PSUs
has severely affected the placement
initiatives. During 2005, about 1.43 lakh job-
seekers including 0.26 lakh female applicants
were registered in employment exchanges as
against 2.67 lakh job seekers including 0.82
lakh females registered during 2004. Out of
1.43 lakh registrants during 2005, 20247 were
SC and 15967 were ST which together
constitutes 25.2% of the total registrants as
against 42.4% recorded in 2004. During the
year 2005 about 1876 vacancies were notified
as against 1760 vacancies notified in the year
2004. During 2005, 1908 placements were
made including the spill over vacancies
notified earlier which constitute 1.3% of the
registrations made during the year and 0.23%
of the total applicants on the Live Register by
the end of 2005. Out of 1908 placements
made in 2005, 470 (24.6%) were SC and ST
and 275 (14.4%) were females. Table 3
shows the status of registration, vacancies,
and placements in the State since the year
2000.
Table 3 Registration, Notification of V
through Employmenacancies and Placement made
t Exchanges. Placement made
Year Regismade
the y
Placement made as % to
registration made
tration during ear
Vacancies notifie
Vacancies notified as % to
stration made d Total SC ST Female regi
2000 164577 3171 2421 403 407 422 1.93 1.47 2001 130586 2620 2412 583 445 336 2.01 1.85 2002 141234 2239 2601 393 338 615 1.59 1.84 2003 168824 2325 1529 231 293 443 1.38 0.91 2004 267337 1760 1760 238 266 420 0.66 0.66 2005 143323 1876 1908 203 267 275 1.31 1.33
Sourc ct of oyme rissa. 21. T otal r of j eeke
Live Register by the end o 04 w b
h b e end of 2004 to 7.17 by the
o 05, the mbers of ducated
uate in the Live
egister occupies highest position followed by
Graduates and Post graduates (general).
e : Dire orate Empl nt, Ohe t numbe ob s rs in the
f 20 as a out
8.59 lakh, which has declined to 8.34 lakh by
the end of 2005; while the stock of female, SC
and ST job seekers on the Live Register by
the end of 2004 was 1.94 lakh, 1.73 lakh and
1.22 lakh respectively, which declined to 1.91
lakh, 1.70 lakh and 1.21 lakh respectively by
the end of the year 2005. The L.R. position
also reveals that while the number of
educated unemployed decreased from 7.45
(below matric) job seekers has increased from
1.14 lakh to 1.17 lakh during the same
period. The details on L.R. position have
been reflected on Table 4.
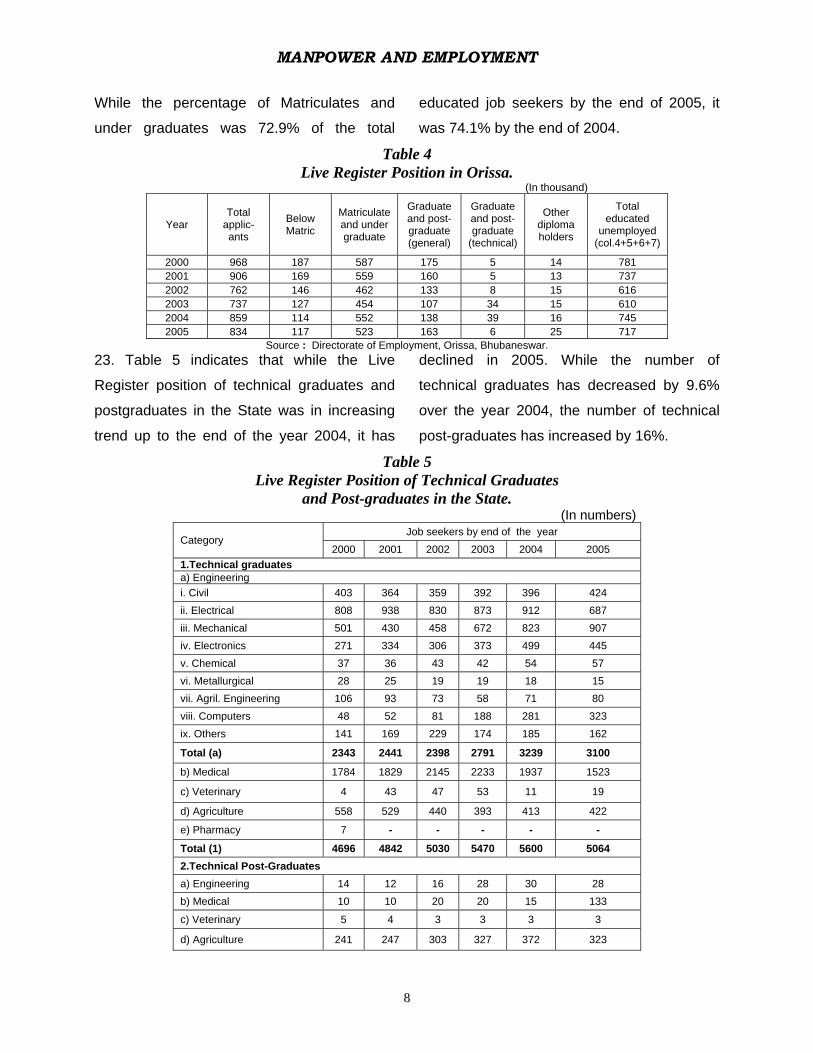
22. Table 4 also indicates that the percentage
of job seekers having educational background
Matriculate and Under Grad
lak y th lakh
end f 20 nu un-e
R
7
MANPOWER AND EMPLOYMENT
While the percentage of Matriculates and
under graduates was 72.9% of the total
educated job seekers by the end of 2005, it
was 74.1% by the end of 2004.
Table 4 Live Register Position in Orissa.
(In thousand)
Total Matriculate Grad
Year applic-ants
Below Matric and und
uate st-te
Graduate and post-graduate
Other diploma holders
Total educated
unemployed (col.4+5+6+7)
er and pograduagraduate (general) (technical)
2000 968 187 587 175 14 5 781 2001 906 169 559 13 160 5 737 2002 762 146 462 133 8 15 616 2003 737 127 454 107 34 15 610 2004 859 114 552 138 39 16 745 2005 834 117 523 163 6 25 717
Sour rate of Employm Orissa, B aneswar. 23. Table dica that le the Live
Register position of technical graduates and
postgradua n the
ined umber of
nical duates s decr d by 9.6%
the y f technical
of
ekers by end of the year
ce : Directo ent, hub 5 in tes whi
tes i State was in increasing
trend up to the end of the year 2004, it has post-graduates has increased by 16%.
Table 5 Live Register Position Technical Graduates
and Post-graduates in the State. (In numbers)
decl in 2005. While the n
tech gra ha ease
over ear 2004, the number o
Job seCategory
2005 2000 2001 2002 2003 2004 1.Technical graduates a) Engineering i. Civil 403 364 359 392 396 424 ii. Electrical 808 938 687 830 873 912 iii. Mechanical 501 430 458 672 823 907 iv. Electronics 271 334 306 373 499 445 v. Chemical 37 36 43 42 54 57 vi. Metallurgical 28 25 19 19 18 15 vii. Agril. Engineering 106 93 73 58 71 80 viii. Computers 48 52 81 188 281 323 ix. Others 141 169 229 174 185 162
Total (a) 2343 2441 2398 2791 3239 3100
b) Medical 1784 1829 2145 2233 1937 1523
c) Veterinary 4 43 47 53 11 19
d) Agriculture 558 529 440 393 413 422
e) Pharmacy 7 - - - - -
Total (1) 4696 4842 5030 5470 5600 5064 2.Technical Post-Graduates a) Engineering 14 12 16 28 30 28 b) Medical 10 10 20 20 15 133
c) Veterinary 5 4 3 3 3 3
d) Agriculture 241 247 303 327 372 323
8
MANPOWER AND EMPLOYMENT
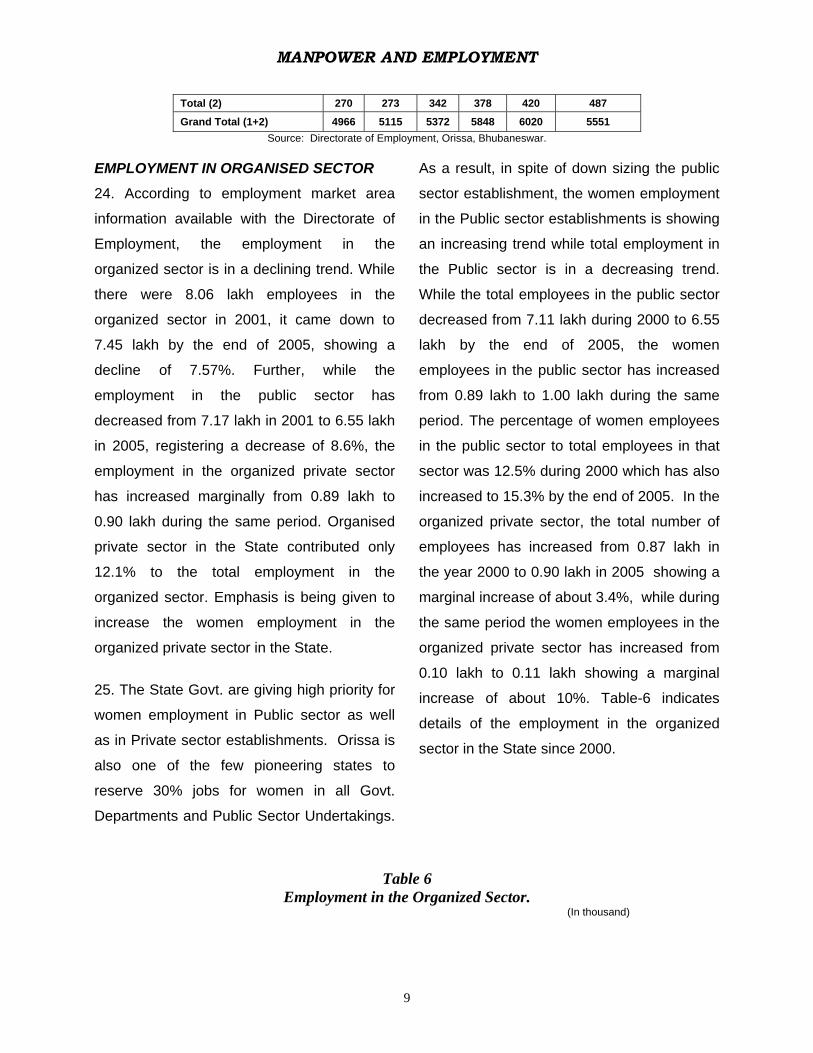
Total (2) 270 273 342 378 420 487
Grand Total (1+2) 4966 5115 5372 5848 6020 5551 Source: Direct yment, Orissa, Bhubaneswar.
EMPLOYMENT IN OR SED SE
24. According to employment ma a
formation available with
e
as well
s in Private sector establishments. Orissa is
As a result, in spite of down sizing the public
sector e e women employment
stablishments is showing
Organized Sector. (In thousand)
orate of Emplo
GANI CTOR
rket rea
in the Directorate of in the Public sector e
Employment, the employment in th
organized sector is in a declining trend. While
there were 8.06 lakh employees in the
organized sector in 2001, it came down to
7.45 lakh by the end of 2005, showing a
decline of 7.57%. Further, while the
employment in the public sector has
decreased from 7.17 lakh in 2001 to 6.55 lakh
in 2005, registering a decrease of 8.6%, the
employment in the organized private sector
has increased marginally from 0.89 lakh to
0.90 lakh during the same period. Organised
private sector in the State contributed only
12.1% to the total employment in the
organized sector. Emphasis is being given to
increase the women employment in the
organized private sector in the State.
25. The State Govt. are giving high priority for
women employment in Public sector
a
also one of the few pioneering states to
reserve 30% jobs for women in all Govt.
Departments and Public Sector Undertakings.
an increasing trend while total employment in
the Public sector is in a decreasing trend.
While the total employees in the public sector
decreased from 7.11 lakh during 2000 to 6.55
lakh by the end of 2005, the women
employees in the public sector has increased
from 0.89 lakh to 1.00 lakh during the same
period. The percentage of women employees
in the public sector to total employees in that
sector was 12.5% during 2000 which has also
increased to 15.3% by the end of 2005. In the
organized private sector, the total number of
employees has increased from 0.87 lakh in
the year 2000 to 0.90 lakh in 2005 showing a
marginal increase of about 3.4%, while during
the same period the women employees in the
organized private sector has increased from
0.10 lakh to 0.11 lakh showing a marginal
increase of about 10%. Table-6 indicates
details of the employment in the organized
sector in the State since 2000.
Table 6 Employment in the
stablishment, th
9

MANPOWER AND EMPLOYMENT
Public sector Private sector Year
Total Women Total Women
Total
employment
Women loyees in
Organized
Percentage of women
l
Organized sector
emp
employees
to totasector employees
2000 711 89 87 10 798 99 12.4 2001 717 92 89 10 806 102 12.7 2002 771 692 93 79 10 103 13.4 2003 680 96 87 10 767 106 13.8 2004 657 96 89 11 746 107 14.3 2005 655 100 90 11 745 111 14.9
Source: Dir rate of Employment, Orissa, Bhubaneswar. 26. In ord cr gre r em ymen
avenues for women, both in
s in recruitment g condition for
omen employees.
♦ enable them to get
part-time employment in the productive
♦
nal structure of women workers and improve their educational standards.
♦
o improve employability by developing skills of educated as well as
♦
e tertiary sector for educated women by providing training in
EMPLOSECTO
nd wage
nt schemes/ programmes initiated
28. The scheme “Swarnjayanti Gram
State since 01.04.1999 by
malgamating the earlier schemes like
Yojana (SGRY), a
Centrally Sponsored scheme is being
ectoer to eate ate plo t
organised as well
as in un-organised sectors, it has been
proposed to continue the following measures
during the Tenth Plan period.
♦ To eliminate gender biaand to improve workinw
To organize women’s associations in the form of societies to
sectors.
To keep a close watch on change of occupatio
To explore new areas of employment for women.
♦ To provide vocational training in various
fields t
un-educated women.
To develop new job opportunities and higher skill levels in th
specific fields.
YMENT IN UNORGANISED R
27. A number of self employment a
employme
during earlier Plans are continuing during the
Tenth Plan period.
Swarozgar Yojana” (SGSY) is being
implemented in the
a
I.R.D.P. (Integrated Rural Development
Programme), TRYSEM (Training of Rural
Youth for Self Employment) and DWCRA
(Development of Women and Children in
Rural Area). The objective of “SGSY” is to
bring every assisted poor family above the
poverty line within a period of three years.
63,904 swarozgaries were assisted for self
employment under this programme during
2005-06 with an expenditure of Rs.80.74
crore as against 65,712 swarozgaries
assisted with an expenditure of Rs.82.82
crore during 2004-05. Out of 63904
swarozaries benefited during 2005-06, 17105
belong to SC, 18584 belong to ST and 57307
were women beneficiaries.
29. In order to create employment avenues for
the unskilled labourers of rural areas,
Sampoorna Gramin Rojgar
implemented by Government with effect from
25.9.2001, restructuring the erstwhile
10
MANPOWER AND EMPLOYMENT
"Jawahar Gram Samrudhi Yojana (JGSY)”
and “Employment Assurance Scheme (EAS)”.
The main objective of the scheme is to
provide additional wage employment in rural
areas, ensure food security, create durable
community assets and develop rural
infrastructure. As against the target of
generating 589.91 lakh mandays of
employment, 556.02 lakh mandays could be
generated during 2005-06 with an investment
of Rs.354.44 crore showing an achievement
of about 94.3%. Besides, a new scheme
“National Rural Employment Guarantee
Programme” is in operation since
February’2006. During March’2006, about
355 lakh mandays of employment has been
created with an expenditure of Rs.347.17
crore.
30. Prime Minister’s Rozgar Yojana (PMRY) is
being implemented in the State since 1993-94
to provide employment to the educated youth
aving minimum qualification of Class-VIII and
different child
elfare programmes, there is a large number
in the State. As per 2001
bour from
azardous occupation. Under the scheme h
annual family income Rs.40,000/- or less.
Rs.642.35 crore has been disbursed to 1,
03,182 educated unemployed youth and
91,175 micro enterprises have been promoted
till July, 2006 since inception and 1, 88,818
persons have been provided employment
under the scheme. Out of these Rs.93.73
crore has been disbursed in 15,768 cases
during 2005-06 and employment for 27,925
persons could be generated.
CHILD LABOUR
31. In spite of the imposition of Child Labour
Act and implementation of
w
of child Labourers
population Census, the child population in the
State in the age group of 5-14 was 86.34 lakh,
of which 3.78 lakh (4.4%) were engaged in
various economically gainful activities and
94.4% of them were engaged in rural areas.
Out of total 3.78 lakh workers in the age group
5-14, 1.10 lakh (29.1%) were categorized as
main workers while 2.68 lakh (70.9%) were
marginal workers. Out of total 3.78 lakh
workers in the age group 5-14 the percentage
of girl workers was 51.5%. Further, Census
sources also reveal that about 26.3% of the
total child workers were illiterate.
32. Eighteen National Child Labour Projects
are in operation in 18 districts for rehabilitation
and elimination of child La
h
20/40 nos. of special schools are opened for
50/100 Child Labour in each school, which are
providing non-formal education and vocational
training. By the end of 2005, about 31,748
Child labourers have been admitted in 609
special schools opened under National Child
Labour Project. Project proposal for opening
of 12 new National Child Labour Projects in
the remaining 12 districts have been
submitted to Government of India.
11

MANPOWER AND EMPLOYMENT
33. As recommended by the Technical
Advisory Committee on Child Labour headed
by the Director, General , ICMR, Govt. of India
rrangement, was more or less prevalent in
has been tackled by
State Govt. has mounted a special
rive for creation of self-employment
uring the
uted under the chairmanship of
e Development Commissioner to monitor
olve the problem of unemployment,
overnment has put in place the State
05. As a part of the
have imposed ban on employment of children
as domestic help or servant at the road side
dhabas and such recreational centres under
the Child Labour (prohibition & Regulation)
Act, 1986 has high effect from October’2006.
BONDED LABOUR
34. Bonded Labour system, a heinous
a
the State which
implementing Bonded Labour Act and
rehabilitating the released bonded Labourers
with financial support from Government of
India. 50,790 bonded Labourers including
13,904 SC and 20,424 ST have been
identified in the State by the end of March
2005 of which 41.4% belonged to undivided
KBK districts. Highest number of bonded
Labour has been identified in Bolangir district
(4931) followed by Mayurbhanj district (3496)
while lowest number in Deogarh district (115).
By the end of March, 2005 about 49,011
bonded Labourers were released and 47,044
including 13,121 SC and 18,357 ST were
rehabilitated with an expenditure of Rs. 18.24
crore. During the year 2004-05, only 19
bonded labourers have been rehabilitated with
an expenditure of Rs. 10.41 lakh. An outlay of
Rs. 0.50 lakh has been provided in the Annual
plan, 2006-07 as State share for rehabilitation
of Bonded Labourers as against Rs. 51.79
lakh State share proposed for the Tenth Plan
period.
Special drive for self employment
35. The
d
opportunity for 14.34 lakh persons d
Tenth Plan period, against which the
achievement in the said period up to
December, 2006 is estimated to be 10.06
lakh. Now innovative important schemes
included in this drive were the establishment
of Agro-service Centres /Agri Business
Enterprises including Horticulture &
Floriculture, Cultivation of medicinal plants,
shopping complex in identified urban centers,
I.T. Kiosks and promotive of small scale
industries.
36. A State Level Steering Committee has
been constit
th
proper implementation of self-employment
schemes. Similarly at the district level, District
Level Committee has been setup to review
the progress of Self Employment Programmes
(SEPS).
Employment Mission
37. To s
G
Employment Policy, 20
Policy a High Power Employment Mission
under the Chairmanship of Hon’ble Chief
Minister has been constituted on 31.03.2005.
12
MANPOWER AND EMPLOYMENT
The Mission is facilitating generation of
adequate employment opportunity through the
policy framework. The Executive Body of the
High Power Employment Mission (HPEM) is
headed by the Chief Secretary. Five steering
committees of the HPEM Agriculture and
Allied activities, Industries and Allied activities,
Capacity Building, Finance and
Communication have been constituted under
the Chairmanship of the Hon’ble Chief
Minister. Director, Employment is functioning
as the Mission Director of the Employment
Mission. The Orissa State Employment
Mission Society (OSEMS) has been
constituted since February 2006.
Development Commissioner –cum- Addl.
Chief Secretary, Commissioner –cum-
Secretary of Labour & Employment
Department and Director, Employment-cum-
Employment Mission are functioning as
President, Vice-president, and Member
Secretary of the OSEMS.
38. Grant in Aid to the tu
ne of Rs.1.5 crore
nd Rs.7.95 crore have been placed with the
a
OSEMS during 2005-06 and 2006-07
respectively for skill up gradation / self
employment training programmes and
anguative self employment opportunities in
the State. During 2005-06, 4516 unemployed
youth have been imparted skilled up
gradations training by the OSEMS through the
DTET.
13