manfred r. mauntz ceo germany - esi-africa.com old view: adhesive wear is based on the notion that...
TRANSCRIPT

Manfred R. Mauntz
CEO
cmc Instruments GmbH
Germany

WearSens®
A new concept in oil
condition monitoring from
start up

WearSens® - Agenda
1. Introduction
2.The problem
3.Existing techniques
4.Wear and how it occurs
5.The effect of additives
6.WearSens® measurement principle
7.Monitoring system
8.Conclusions
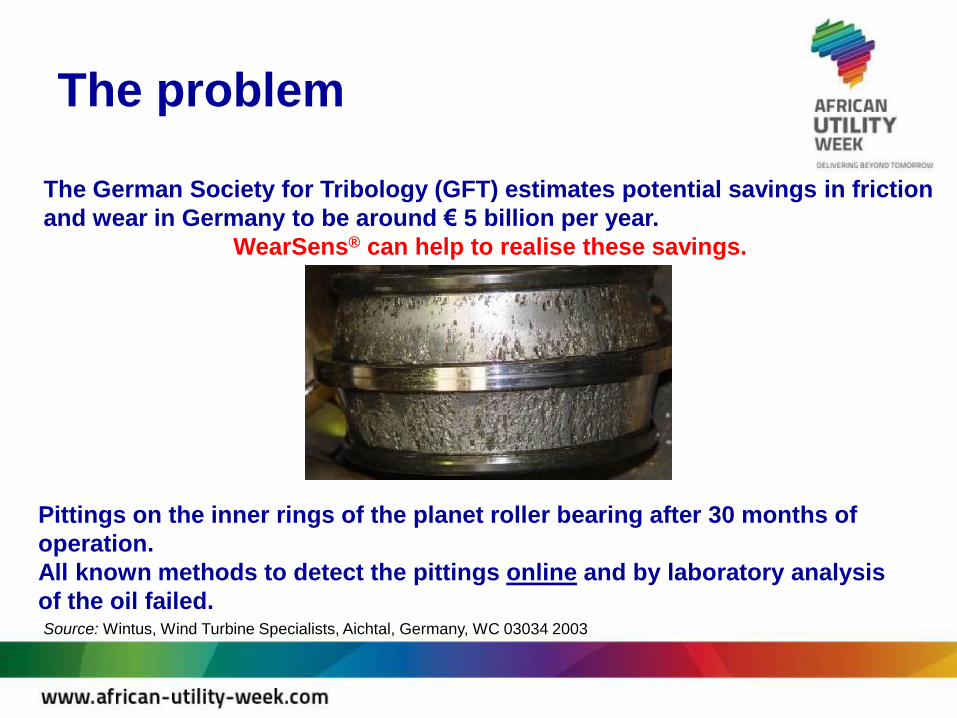
The problem
The German Society for Tribology (GFT) estimates potential savings in friction
and wear in Germany to be around € 5 billion per year.
WearSens® can help to realise these savings.
Source: Wintus, Wind Turbine Specialists, Aichtal, Germany, WC 03034 2003
Pittings on the inner rings of the planet roller bearing after 30 months of
operation.
All known methods to detect the pittings online and by laboratory analysis
of the oil failed.
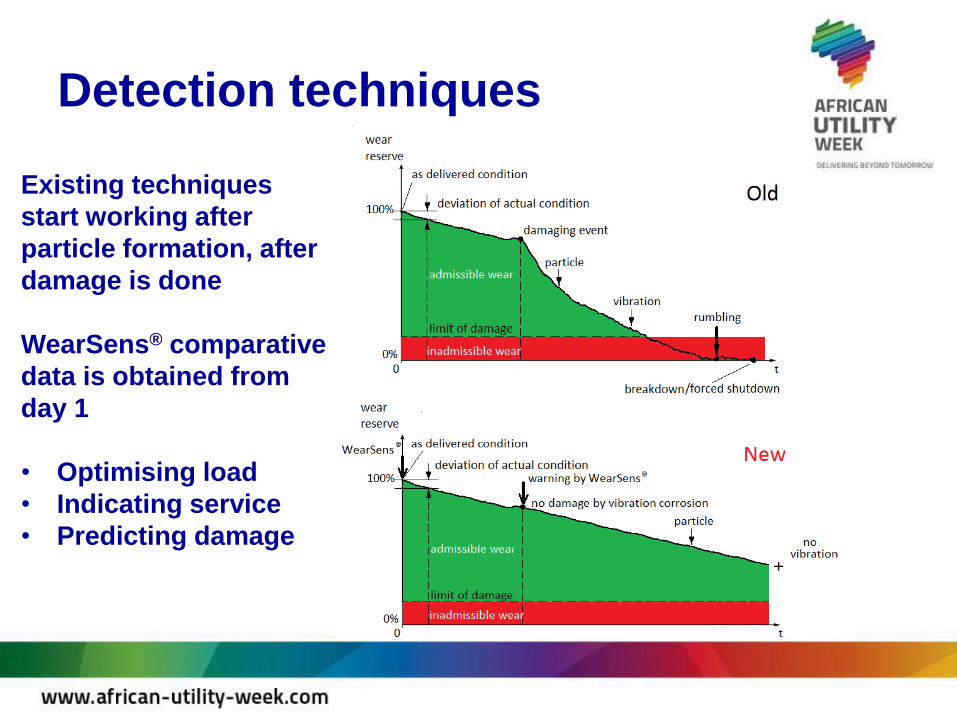
Detection techniques
Existing techniques
start working after
particle formation, after
damage is done
WearSens® comparative
data is obtained from
day 1
• Optimising load
• Indicating service
• Predicting damage

Wear and how it occurs
Source: J. P. Davim,Tribology for Engineers, Woodhead Publishing, Cambridge, UK, 2011
The old view:
Adhesive wear is based on the notion that adhesion occurs
between asperities when they touch and finally separate as wear
particles.
Micro friction model of vibrational loading in rolling-sliding contact
The new view:
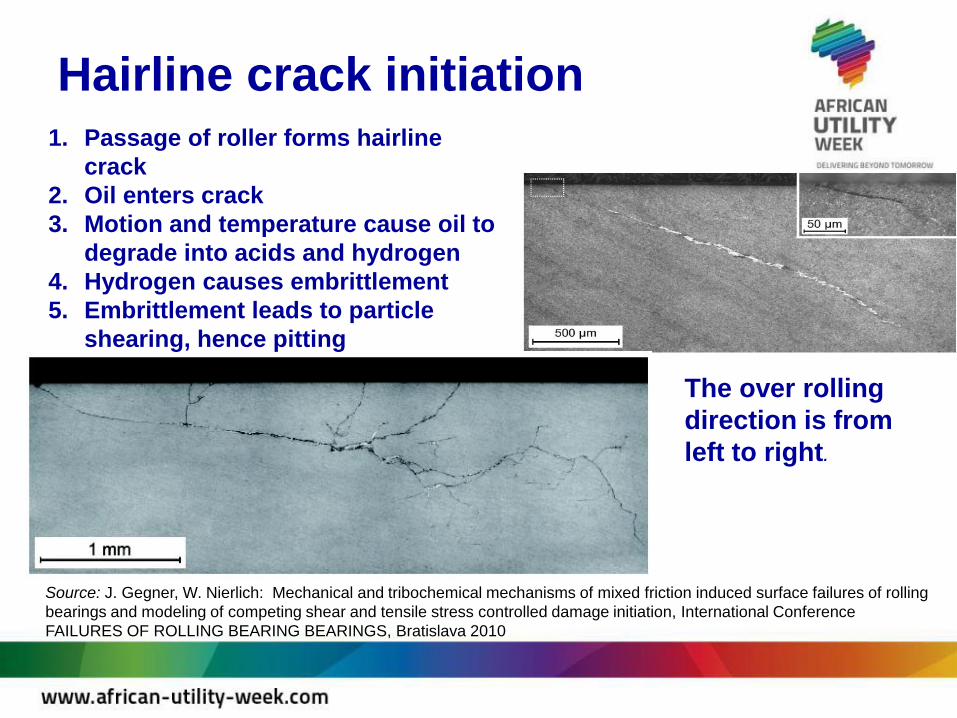
Hairline crack initiation
The over rolling
direction is from
left to right.
Source: J. Gegner, W. Nierlich: Mechanical and tribochemical mechanisms of mixed friction induced surface failures of rolling
bearings and modeling of competing shear and tensile stress controlled damage initiation, International Conference
FAILURES OF ROLLING BEARING BEARINGS, Bratislava 2010
1. Passage of roller forms hairline
crack
2. Oil enters crack
3. Motion and temperature cause oil to
degrade into acids and hydrogen
4. Hydrogen causes embrittlement
5. Embrittlement leads to particle
shearing, hence pitting
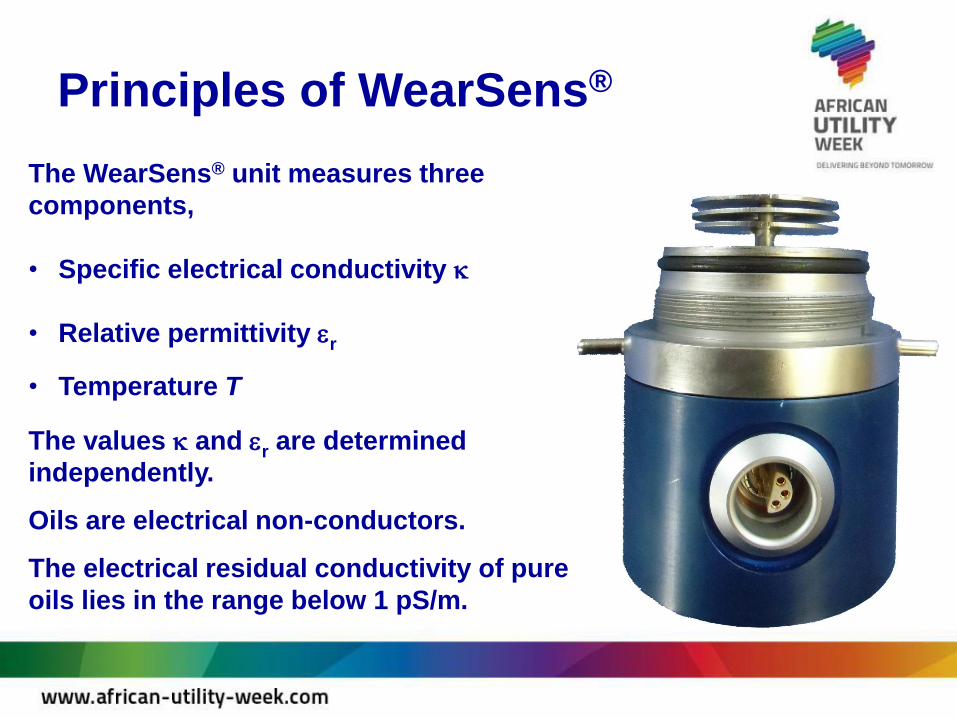
Principles of WearSens®
The WearSens® unit measures three
components,
• Specific electrical conductivity k
• Relative permittivity er
• Temperature T
The values k and er are determined
independently.
Oils are electrical non-conductors.
The electrical residual conductivity of pure
oils lies in the range below 1 pS/m.
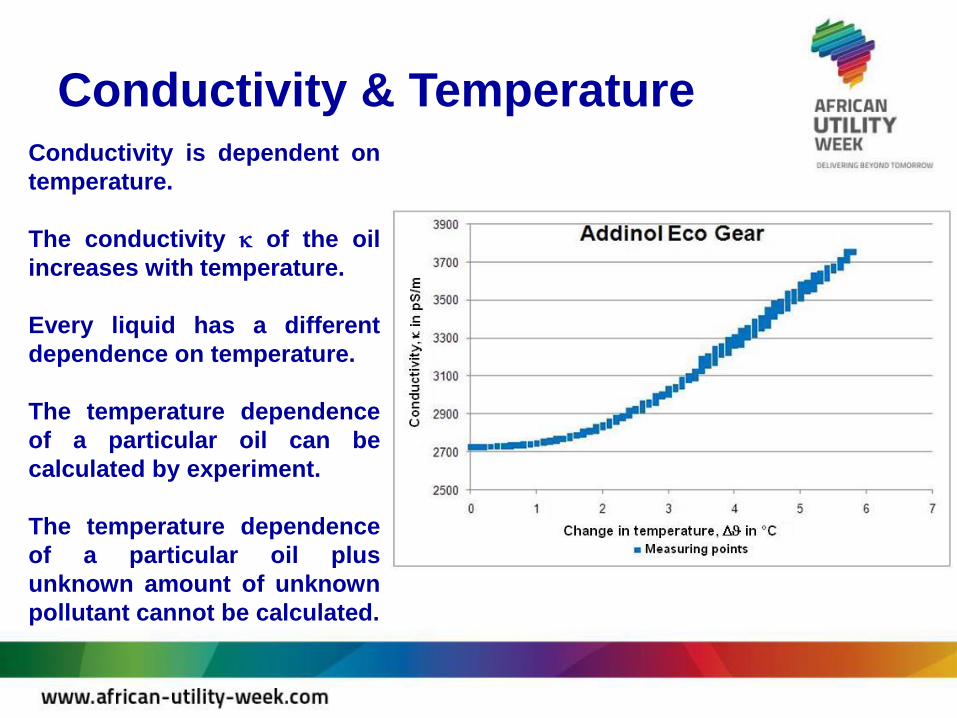
Conductivity & Temperature Conductivity is dependent on
temperature.
The conductivity k of the oil
increases with temperature.
Every liquid has a different
dependence on temperature.
The temperature dependence
of a particular oil can be
calculated by experiment.
The temperature dependence
of a particular oil plus
unknown amount of unknown
pollutant cannot be calculated.

Neural network
To compare measurements at
different temperatures conductivity
is usually expressed as a value at a
set reference temperature.
To do this in our example a self-
learning adaptive temperature
compensation algorithm* is
necessary.
*Gaussian least squares method
with risk function
Source: U. Lämmel: WI Projekt – Neuronale Netze, University of Technology, Business and Design, Wismar 2010
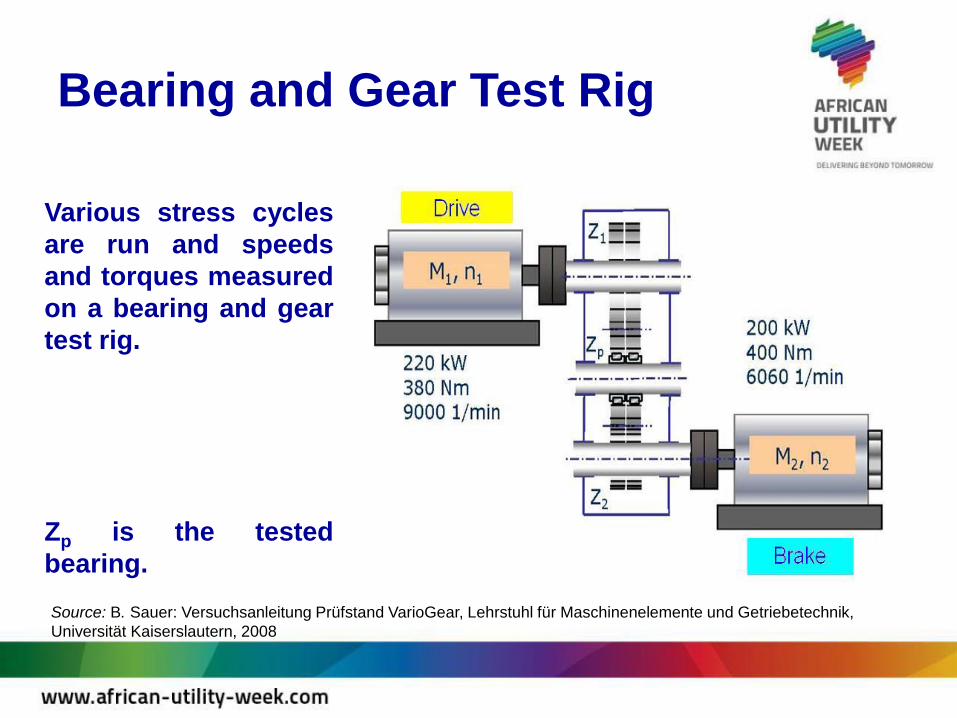
Bearing and Gear Test Rig
Various stress cycles
are run and speeds
and torques measured
on a bearing and gear
test rig.
Zp is the tested
bearing.
Source: B. Sauer: Versuchsanleitung Prüfstand VarioGear, Lehrstuhl für Maschinenelemente und Getriebetechnik,
Universität Kaiserslautern, 2008

Measurement of the electrical
conductivity k vs. running time t
The oil temperature
and conductivity k is
measured against the
running time.
The rate of change of
conductivity at two
different torques can
be clearly seen.

Measurement of the electrical
conductivity k40 vs. running time t
At start up with a speed frequency
of 2000 min-1 and a torque of 150
Nm, a relatively constant alteration
of the conductivity from 0.6 to 0.8
pS/m-3 per minute occurs.
After increasing the load to 330 Nm
at 3000 min–1, the change in
conductivity goes up to 3.8 pS/m-3
minute. After the load increase,
the effect on the change of the oil
conductivity appears stronger.
This data can then be used to
optimise load.

Measurement of the electrical
conductivity k40 vs. running time t
The change in ‘quality
of the machine’ during
the course of the
experiment can be
shown graphically in
the lower diagram.
NB Vibration is only
detected after
irrevocable damage
has occurred.
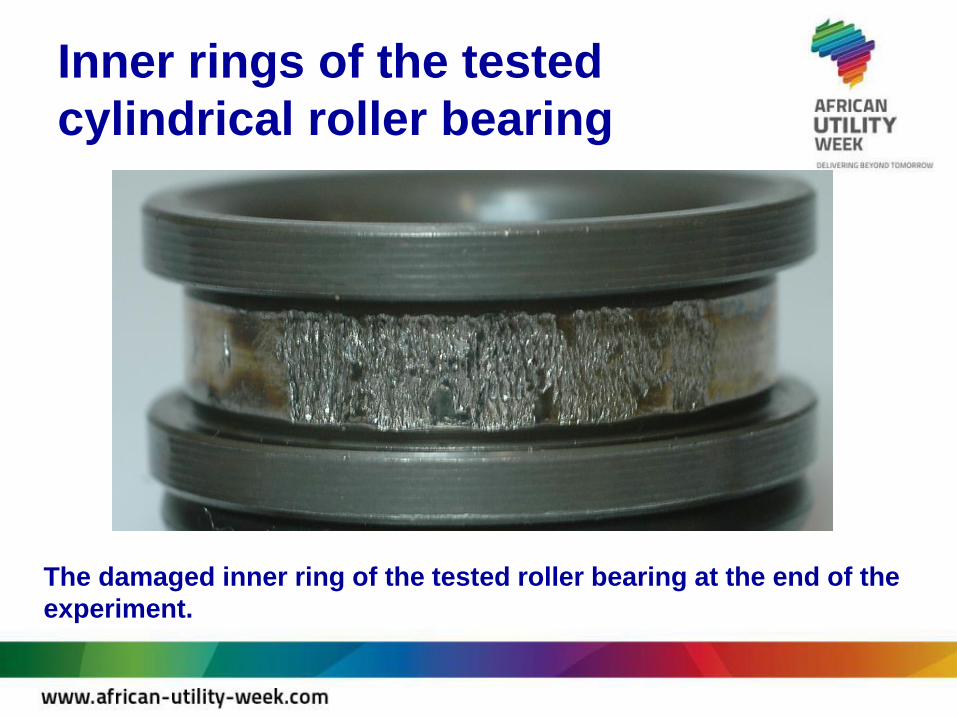
Inner rings of the tested
cylindrical roller bearing
The damaged inner ring of the tested roller bearing at the end of the
experiment.
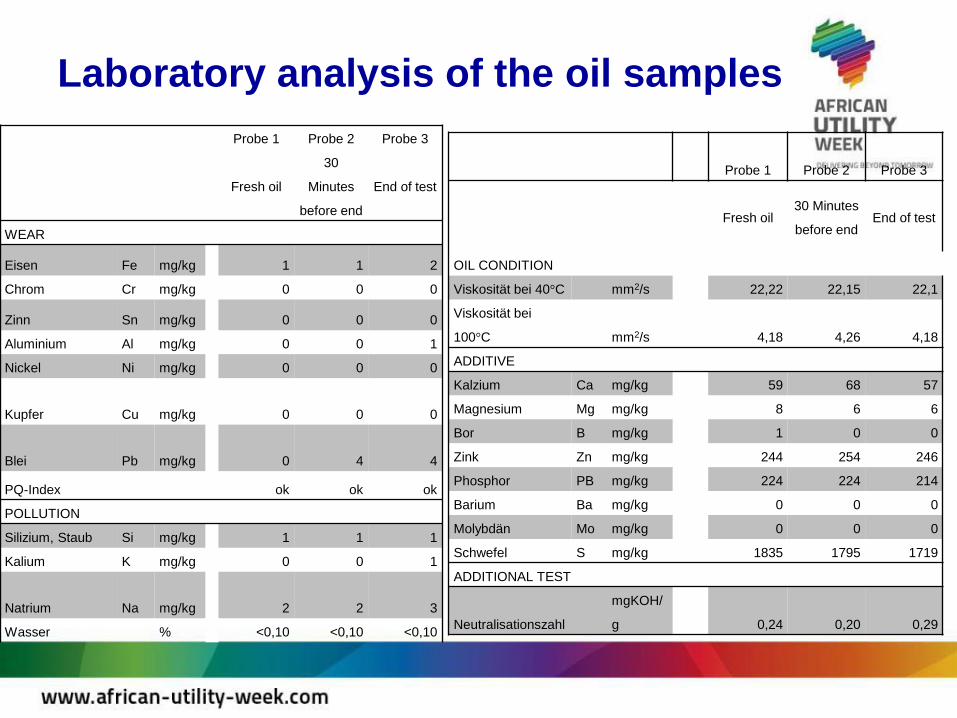
Laboratory analysis of the oil samples
Probe 1 Probe 2 Probe 3
Fresh oil
30
Minutes
before end
End of test
WEAR
Eisen Fe mg/kg 1 1 2
Chrom Cr mg/kg 0 0 0
Zinn Sn mg/kg 0 0 0
Aluminium Al mg/kg 0 0 1
Nickel Ni mg/kg 0 0 0
Kupfer Cu mg/kg 0 0 0
Blei Pb mg/kg 0 4 4
PQ-Index ok ok ok
POLLUTION
Silizium, Staub Si mg/kg 1 1 1
Kalium K mg/kg 0 0 1
Natrium Na mg/kg 2 2 3
Wasser % <0,10 <0,10 <0,10
Probe 1 Probe 2 Probe 3
Fresh oil 30 Minutes
before end End of test
OIL CONDITION
Viskosität bei 40°C mm2/s 22,22 22,15 22,1
Viskosität bei
100°C mm2/s 4,18 4,26 4,18
ADDITIVE
Kalzium Ca mg/kg 59 68 57
Magnesium Mg mg/kg 8 6 6
Bor B mg/kg 1 0 0
Zink Zn mg/kg 244 254 246
Phosphor PB mg/kg 224 224 214
Barium Ba mg/kg 0 0 0
Molybdän Mo mg/kg 0 0 0
Schwefel S mg/kg 1835 1795 1719
ADDITIONAL TEST
Neutralisationszahl
mgKOH/
g 0,24 0,20 0,29
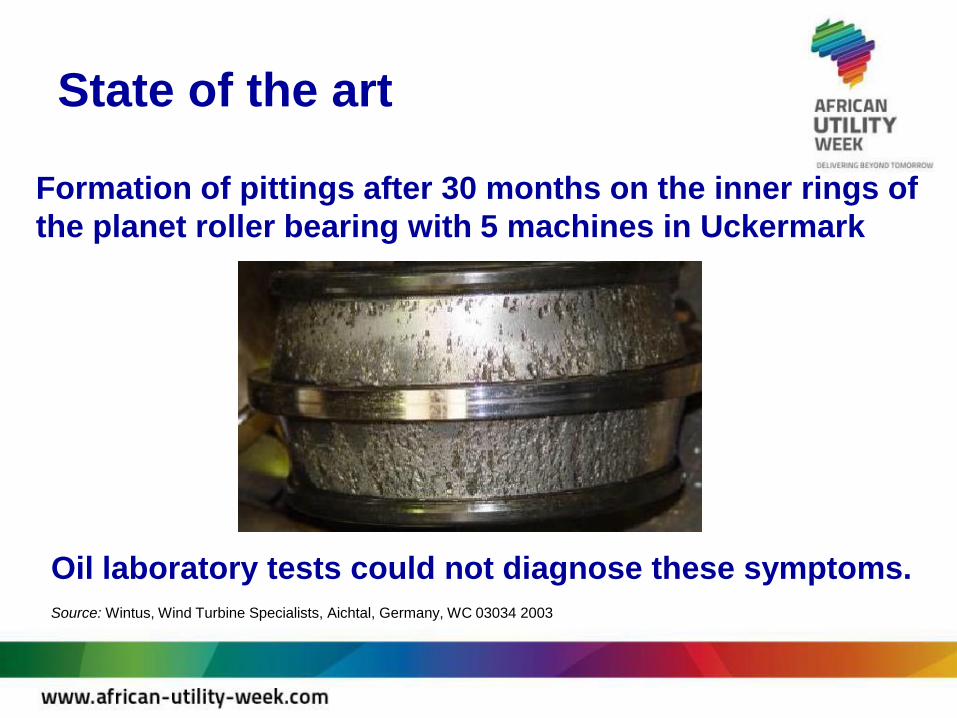
State of the art
Formation of pittings after 30 months on the inner rings of
the planet roller bearing with 5 machines in Uckermark
Oil laboratory tests could not diagnose these symptoms.
Source: Wintus, Wind Turbine Specialists, Aichtal, Germany, WC 03034 2003
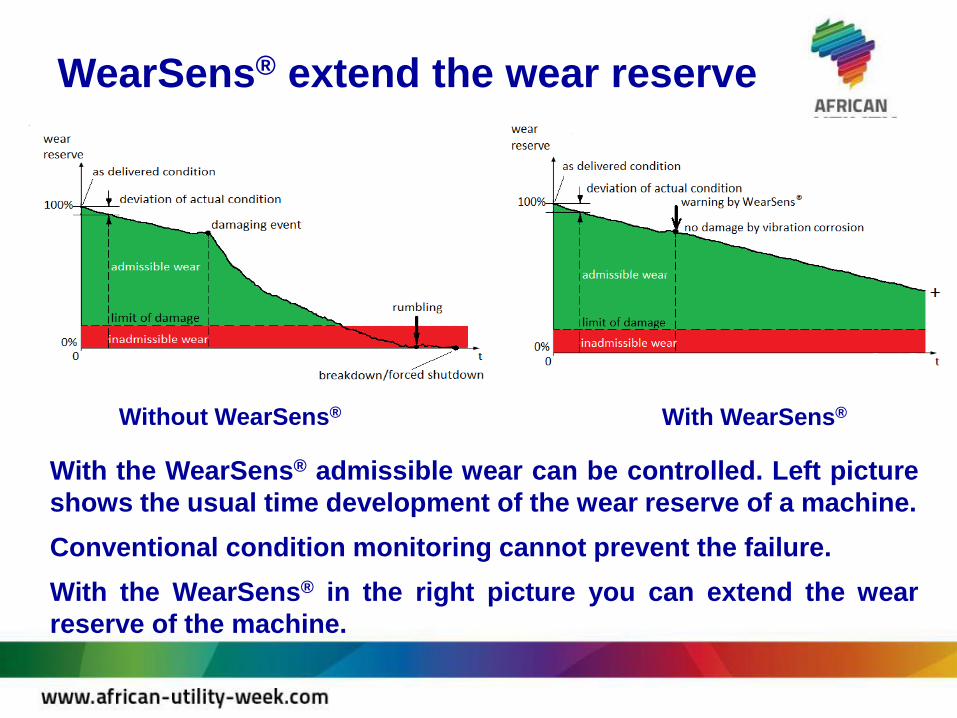
WearSens® extend the wear reserve
With the WearSens® admissible wear can be controlled. Left picture
shows the usual time development of the wear reserve of a machine.
Conventional condition monitoring cannot prevent the failure.
With the WearSens® in the right picture you can extend the wear
reserve of the machine.
Without WearSens® With WearSens®
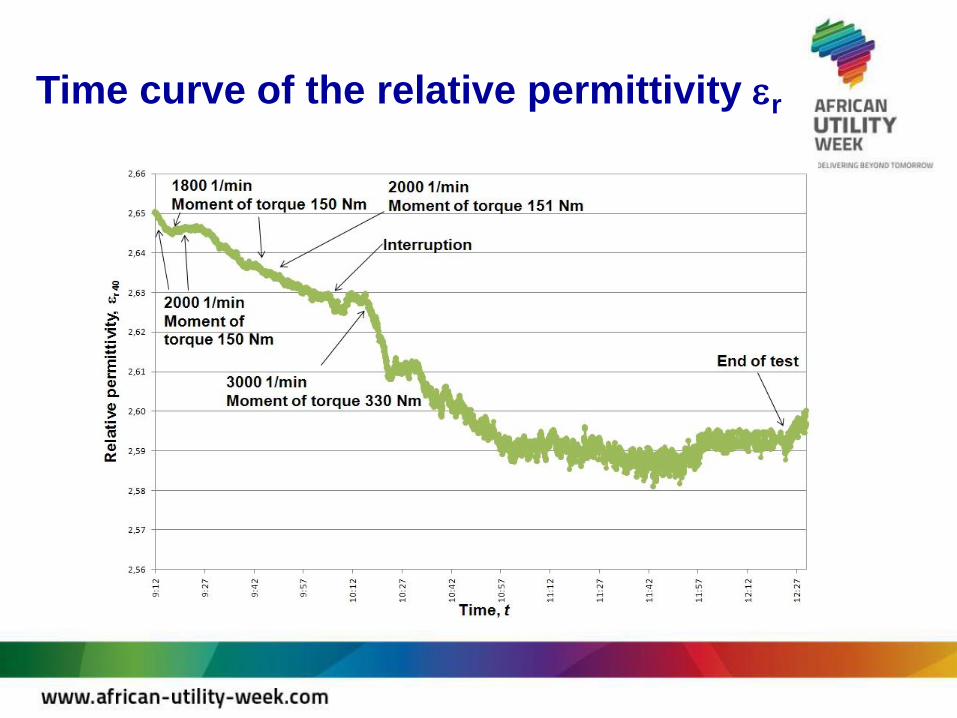
Time curve of the relative permittivity er
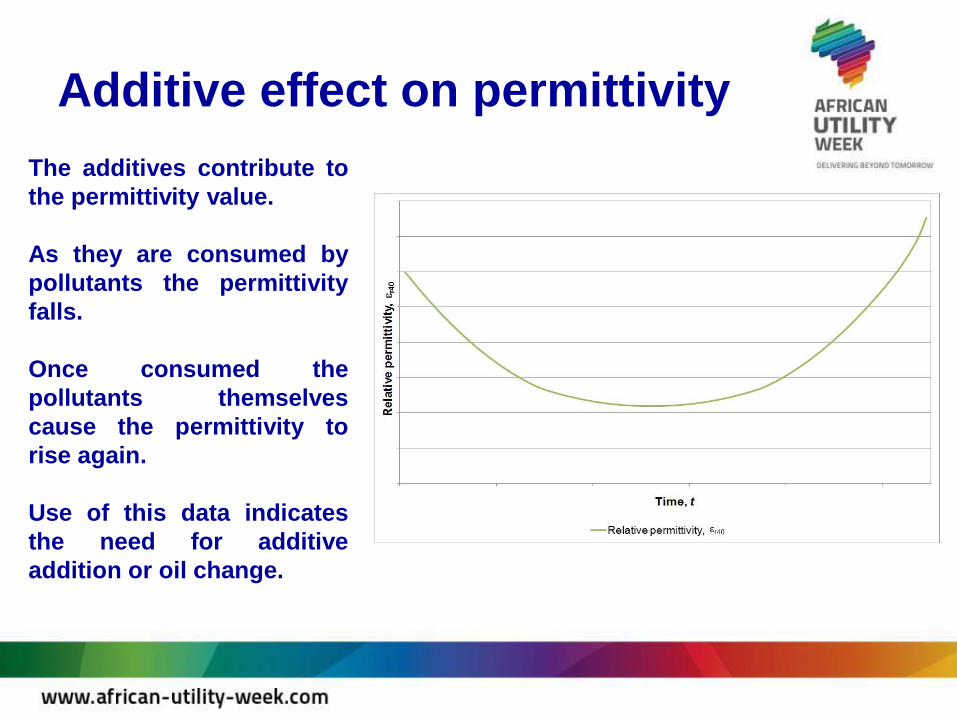
Additive effect on permittivity
The additives contribute to
the permittivity value.
As they are consumed by
pollutants the permittivity
falls.
Once consumed the
pollutants themselves
cause the permittivity to
rise again.
Use of this data indicates
the need for additive
addition or oil change.
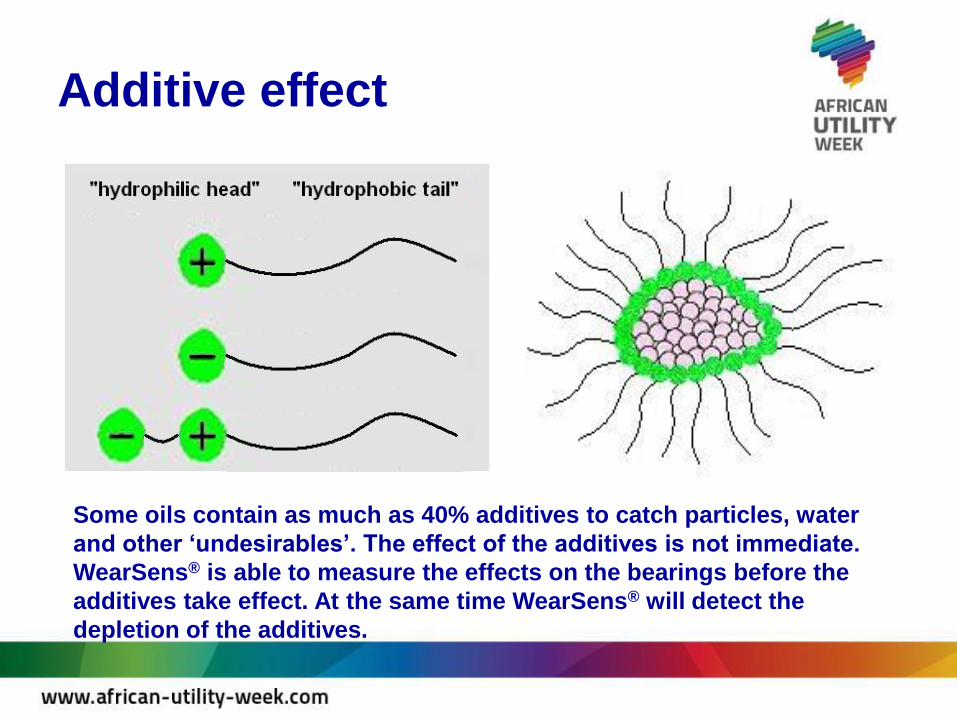
Additive effect
Some oils contain as much as 40% additives to catch particles, water
and other ‘undesirables’. The effect of the additives is not immediate.
WearSens® is able to measure the effects on the bearings before the
additives take effect. At the same time WearSens® will detect the
depletion of the additives.

Permissible working ranges
WearSens® data
allows users to
draw clear
boundaries of
acceptable and
unacceptable
operating ranges

Web based, decentralised
monitoring system
The measuring signals
can be transmitted to
a web-based condition
monitoring system via
LAN, WLAN or serial
interfaces of the
sensor system.
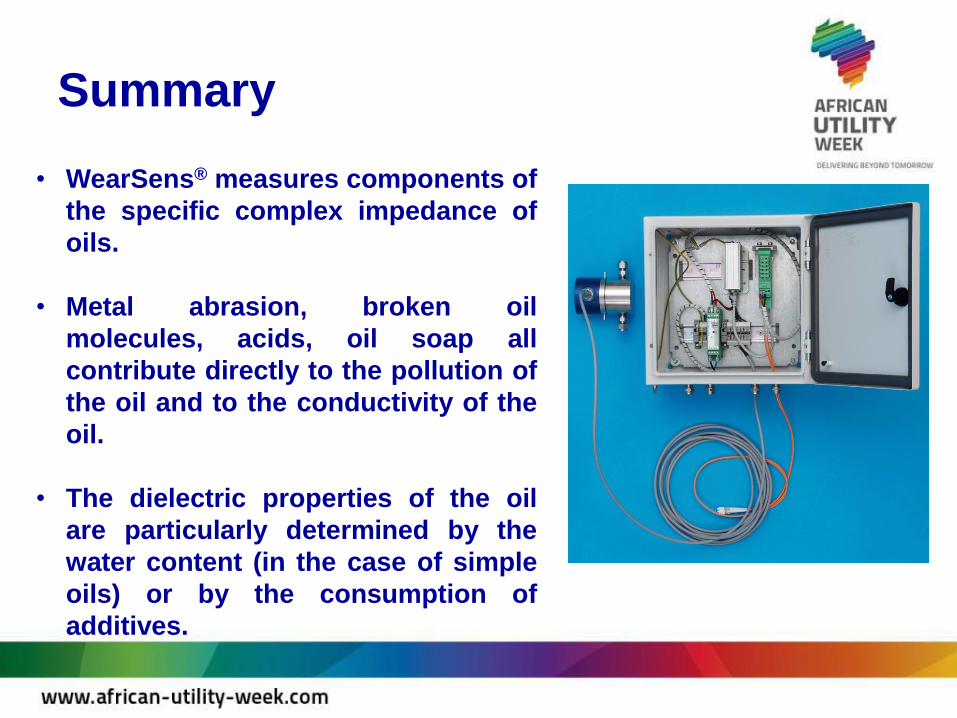
Summary
• WearSens® measures components of
the specific complex impedance of
oils.
• Metal abrasion, broken oil
molecules, acids, oil soap all
contribute directly to the pollution of
the oil and to the conductivity of the
oil.
• The dielectric properties of the oil
are particularly determined by the
water content (in the case of simple
oils) or by the consumption of
additives.

Benefits
• Thus WearSens® online
condition monitoring system
can
• Optimise load vs wear –
run the turbine hard when
the grid is open, extend life
at other times
• Advise timely preventative
maintenance on demand
rather than rigid inspection
intervals
• Reduce downtime
The result – increased efficiency, cost savings
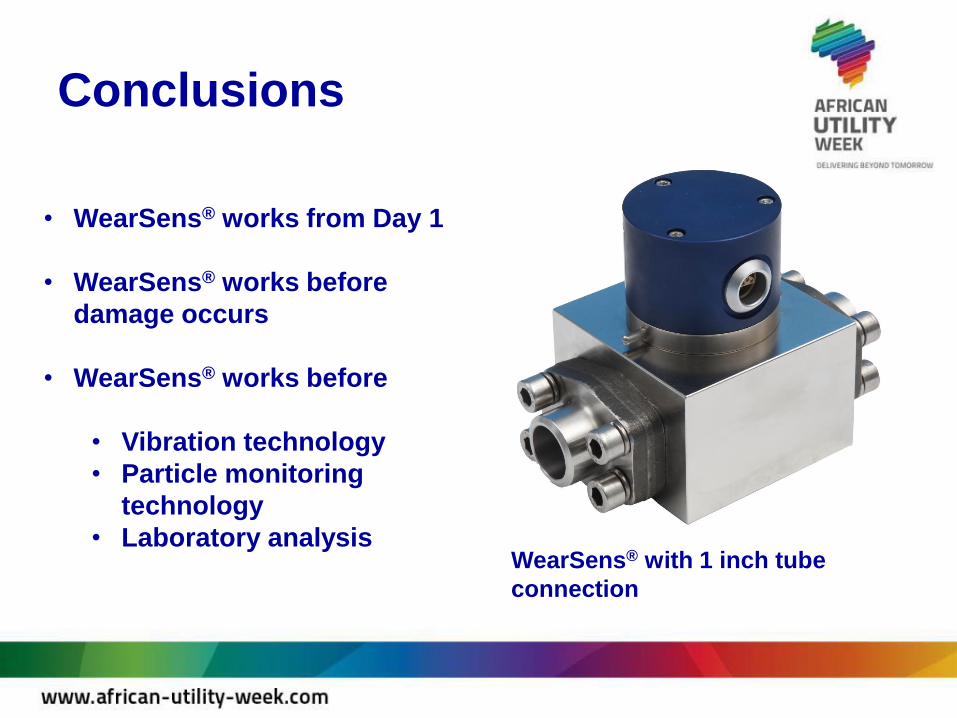
Conclusions
WearSens® with 1 inch tube
connection
• WearSens® works from Day 1
• WearSens® works before
damage occurs
• WearSens® works before
• Vibration technology
• Particle monitoring
technology
• Laboratory analysis

WearSens®
Thank
you!
Any
Questions? Source: Windenergie-Agentur Bremerhaven/Bremen e.V. (WAB), 2011