maneconmm
TRANSCRIPT
7/27/2019 ManeconMM
http://slidepdf.com/reader/full/maneconmm 1/119
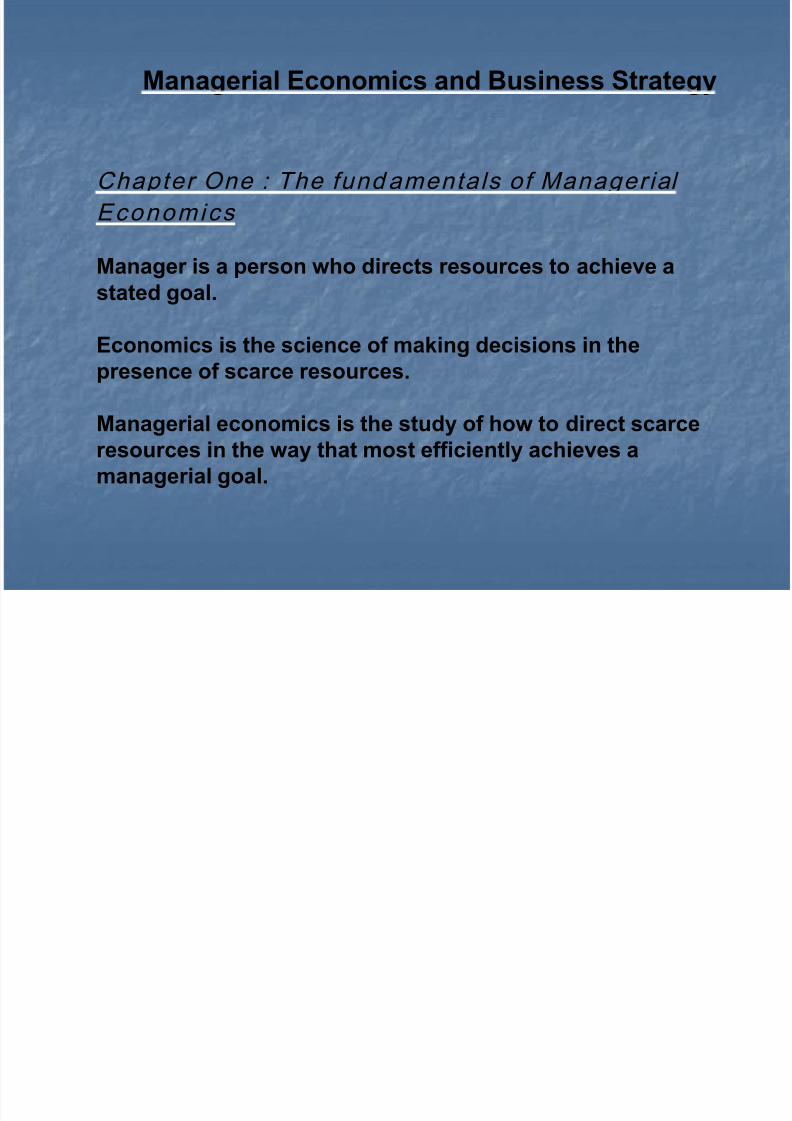
Managerial Economics and Business Strategy
Chapter One : The fundamentals of Managerial
Economics
Manager is a person who directs resources to achieve astated goal.
Economics is the science of making decisions in the
presence of scarce resources.
Managerial economics is the study of how to direct scarce
resources in the way that most efficiently achieves a
managerial goal.

7/27/2019 ManeconMM
http://slidepdf.com/reader/full/maneconmm 2/119
Head Line: Chapter 1 Amcott Company merugi $3,5 M berbuntut
manager dipecat (fired)
Tahun ini Amcott (persh.yg bergerak di bidang software)rugi $3,5 M dimana $1,7 M diantaranya berasal daridivisi pemrograman alih bhs.dari Perancis ke Inggris(magicword software programm/MSP).RUPS
memutuskan Mr.Ralph (sang manager) hrs.diganti!Mr.Ralph tdk.menerima kalau ia dikatakan harus tanggung jawab thd.kerugian itu, karena menurut catatannya darisitu sebenarnya ia justru menangguk untung $1 M,perhitungannya MSP tsb.ia jual dgn.nilai $7M per
thn.dan berlaku selama 3 thn.dan dibayar masing2diawal thn.Padahal MSP tsb.biaya produksinya hanya$20 M
Pertanyaan:bagaimana komentar sdr.!
7/27/2019 ManeconMM
http://slidepdf.com/reader/full/maneconmm 3/119
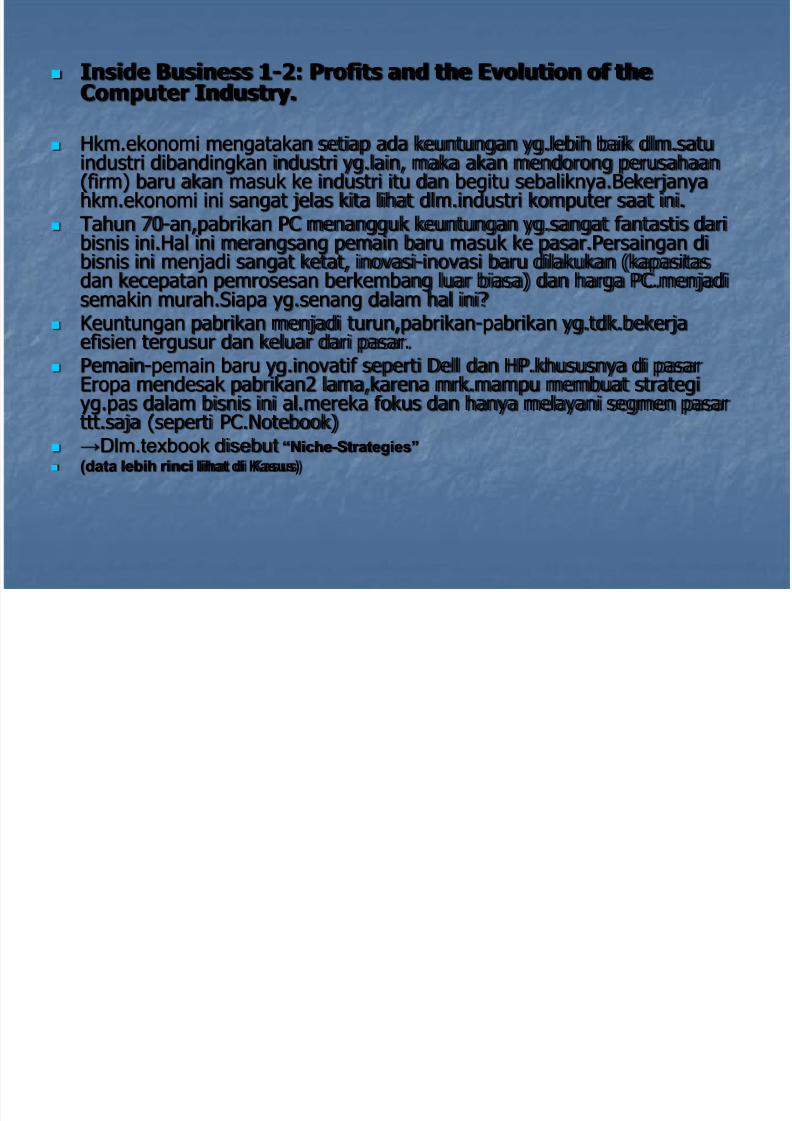
Inside Business 1-2: Profits and the Evolution of theComputer Industry.
Hkm.ekonomi mengatakan setiap ada keuntungan yg.lebih baik dlm.satuindustri dibandingkan industri yg.lain, maka akan mendorong perusahaan(firm) baru akan masuk ke industri itu dan begitu sebaliknya.Bekerjanyahkm.ekonomi ini sangat jelas kita lihat dlm.industri komputer saat ini.
Tahun 70-an,pabrikan PC menangguk keuntungan yg.sangat fantastis daribisnis ini.Hal ini merangsang pemain baru masuk ke pasar.Persaingan dibisnis ini menjadi sangat ketat, inovasi-inovasi baru dilakukan (kapasitasdan kecepatan pemrosesan berkembang luar biasa) dan harga PC.menjadisemakin murah.Siapa yg.senang dalam hal ini?
Keuntungan pabrikan menjadi turun,pabrikan-pabrikan yg.tdk.bekerjaefisien tergusur dan keluar dari pasar.
Pemain-pemain baru yg.inovatif seperti Dell dan HP.khususnya di pasarEropa mendesak pabrikan2 lama,karena mrk.mampu membuat strategiyg.pas dalam bisnis ini al.mereka fokus dan hanya melayani segmen pasarttt.saja (seperti PC.Notebook)
→Dlm.texbook disebut “Niche-Strategies”
(data lebih rinci lihat di Kasus)

7/27/2019 ManeconMM
http://slidepdf.com/reader/full/maneconmm 4/119
Firms’ goals:
1.Economic profit maximization
2.Accounting profit maximization
3.Revenue maximization 4.Maintained a certain level of profit
5.Enlarged a market share
6.Create employment 7.etc.

7/27/2019 ManeconMM
http://slidepdf.com/reader/full/maneconmm 5/119
What are the goal of Firms?
1.Clinton R. Wharton , CEO of Teachers Insurance and
Annuity Association-College Retirement Equities Fund:
To attempt to consistently improve the long-term health of the
corporation and manager must resist a narrow focus that
looks only at short-term profits.
2.Lord Hansen, CEO of Hanson PLC:Service to its customers, quality of it goods and services,
effective research and development, a positive attitude about
environment, combined with welfare of its employees and
pensioners are critical. These must be aligned with to
increase shareholder’s value.
3.The overall goal of most firms is to maximize profits or the
firm’s value.
What is a profit?
Economic profit versus Accounting profit.

7/27/2019 ManeconMM
http://slidepdf.com/reader/full/maneconmm 6/119
The Nature and Function of Profits.
1. Business/Accounting profit refers to therevenue of the firm minus the explicitcosts/the actual out-of pocket
expenditures only.
2. Economic profit equals the revenue of the firm minus its explicit costs andimplicit costs refer to the value of theinputs owned and used by the firm in itsproduction process.

7/27/2019 ManeconMM
http://slidepdf.com/reader/full/maneconmm 7/119
Theories of Profit.
1. Risk-Bearing Theories of Profit
2. Frictional Theory of Profit
3. Monopoly Theory of Profit
4. Innovation Theory of Profit
5. Managerial Efficiency Theory of Profit

7/27/2019 ManeconMM
http://slidepdf.com/reader/full/maneconmm 8/119
Concept of profit. Profit is defined as the excess of revenue over costs. For a
nonprofit institution, an excess of revenue over cost is called asurplus. The attainment of a profit (or the avoidance of a deficit) is
seen as a measure of managerial effectiveness.
Competition for profits among private business firms leads :1.to the ongoing availability of high-quality goods and services atreasonable price.2.to increasing productivity.3.to continuing economic growth and well-being for the nation’speople.
So profit should be seen as :1.reward for enterprise.
2.reward for risking capital.3.reward for superior insight and judgment concerning marketconditions.
Profit should not be seen as :1.profiteering or gouging the consumer because consumer illwill is
likely to hurt the firm in the longer term.

7/27/2019 ManeconMM
http://slidepdf.com/reader/full/maneconmm 9/119
Tugas utama setiap manager adalah : memaksimalkan keuntungan perusahaan
( profit maximization ) utk.kurun waktu ttt.
Tugas tsb.memiliki 2 implikasi yaitu:
1.Mengupayakan terjadinya peningkatanpenerimaan persh.dari waktu ke waktu(revenue enhancement).
2.Mengendalikan proses produksi agarbiaya produksi yg.dikeluarkan terhindar
dari adanya pemborosan-pemborosan(cost control), sehingga mencapai titik minimal.

7/27/2019 ManeconMM
http://slidepdf.com/reader/full/maneconmm 10/119
Ad 1.Mencakup langkah-langkah a.l.: a.menghasilkan produk yg.diinginkan pasar
(riset, inovasi, pengembangan produk) b.menetapkan jumlah dan harga jual produk
optimal c.melakukan promosi seperlunya
Ad 2.Mencakup langkah-langkah a.l.: a.menggunakan input sebanyak
yg.dibutuhkan/menghindari pemborosan b.mengadakan input dgn.cara yg.ekonomis c.menciptakan sistim pemberian kompensasi/gaji
yg.merangsang karyawan kerja produktif

7/27/2019 ManeconMM
http://slidepdf.com/reader/full/maneconmm 11/119
Apa yg.dimaksudkan dgn.biaya produksi?
1.Menurut konsep akuntansi : mencakup seluruh pengeluaranpersh.(dlm.satuan moneter) utk.membeli/menyewa seluruh input yg.digunakan/dibutuhkan dlm.proses produksi yg.betul-betulhanya berasal dari luar persh saja. Biaya produksi ini disebut jugaexplicit cost atau out-of pocket cost.
2.Menurut konsep ilmu ekonomi : mencakup seluruh pengeluaranpersh.(dlm.satuan moneter) utk.membeli/menyewa seluruh input yg.digunakan/dibutuhkan dlm.proses produksi baik yg.berasaldari luar persh.(explicit cost) maupun yg.berasal dari dlm.persh.itusendiri (dihitung dgn.menggunakan konsep biaya oportunitas).Biaya produksi ini disebut juga implicit cost.
Pertanyaan: 1.Menurut sdr.mana yg.lebih besar : biaya produksi menurut
akuntansi atau ilmu ekonomi? Jelaskan!
2.Coba sdr.hitung berapa besarnya biaya produksi utk.membuat 1loyang “kue tart” yg.sdr.buat pada hari Minggu dgn.berpedomanresep praktis yg.ada di majalah “Femina”!
3.Coba sdr.hitung berapa biaya produksi yg.dikeluarkan pabrik gula “Madukismo” utk.membuat 1 Kw.gula pasir?Jelaskan!

7/27/2019 ManeconMM
http://slidepdf.com/reader/full/maneconmm 12/119
The basic principles that compriseeffective management:
1.Identify goals and constraints2.Recognize the importance of profits3.Understand incentives4.Understand markets
5.Recognize the time value of money and6.Use marginal analysis
Present value is the amount that would have
to be invested today at the prevailing interestrate to generate the given future value.
Net present value is the present value theincome stream generated by a project minus
the current cot of the project.

7/27/2019 ManeconMM
http://slidepdf.com/reader/full/maneconmm 13/119
Marginal benefit is the change in total benefitsarising from a change in the managerial controlvariable, Q.
Marginal cost is the change in total cost arisingfrom a change in the management control, Q.
Incremental revenue is the additional revenuethat stem from a yes-or-no decision.
Incremental cost is the additional cost that stemfrom a yes-or-no decision.

7/27/2019 ManeconMM
http://slidepdf.com/reader/full/maneconmm 14/119
Principles:
1. Profits signal to resource holder where resources are most highlyvalued by society
2. If the growth rate in profits is less than the interest rate and bothare constant, maximizing long-term profits is the same asmaximizing current (short-term) profits.
3. To maximize net benefits, the manager should increase the
managerial control variable to the point where marginal benefitsequal marginal costs. This level of managerial control variablecorresponds to the level at which marginal net benefits are zero,nothing more can be gained by further change in that variable.
4. When the control variable is infinitely divisible, the slope of a total
value a curve at a given point is the marginal value at that point.In particular, the slope of the total benefit curve at a given Q ismarginal benefit of that level Q. The slope of the net benefitcurve at a given Q is the marginal net benefit of that level of Q.

7/27/2019 ManeconMM
http://slidepdf.com/reader/full/maneconmm 15/119

7/27/2019 ManeconMM
http://slidepdf.com/reader/full/maneconmm 16/119

7/27/2019 ManeconMM
http://slidepdf.com/reader/full/maneconmm 17/119
Contoh 1.Perusahaan Raksasa Amcot yang bergerak di bidang softwarekomputer, pada tahun lalu rugi sebesar $3,5 juta dimana $1,7 jutadiantaranya disebabkan karena kesalahan manager dalam menjual
software baru (“Magicword software”) yaitu software yang dapatmengubah bhs. Perancis langsung ke bhs.Inggris.Program itu dijualselama 3 tahun berturut-turut dengan harga $7juta per tahun -flat.Dan untuk membuat program tsb.perusahaan telah keluar uang $20 juta. Akibat kesalahan /kerugian itu manager dipecat (fired).Kenapa dari
program “MWS” itu kok dikatakan rugi $1,7 juta? Catatan: short-term rate is 7% annually.
Contoh2.Manager sebuah usaha di bidang automated product berpikiruntuk membeli mesin baru dalam rangka ekspansi
usaha.Harga mesin $300.000 yang memiliki useful life 5tahun.Selama itu diperkirakan di masing-masing tahun mesintsb. menghasilkan uang $50.000 - $60.000 - $75.000 – $90.000 - $90.000 atau total sebesar $365.000.Menurut sdr.layakkah pemikiran tsb.dilaksanakan?Catatan:short-term interest rate is 8% annually

7/27/2019 ManeconMM
http://slidepdf.com/reader/full/maneconmm 18/119
Contoh 3.
Perusahaan yang bekerja di bidangconstruction engineering mempelajarikemungkinan penggunaan struktur baruuntuk menghasilkan produk tertentu (Y).Benefits (penerimaan) dan cost (korbanan)
yang timbul akibat penggunaan strukturbaru tsb. dikaitkan dengan jumlah Y yangdiproduksi adalah sbb.:B(Y) = 300Y – 6Y² sedang C(Y) = 4Y².
Menurut sdr.berapa Y harus diproduksi agarNB (keuntungan) mencapai maksimal? Dan berapabesarnya keuntungan itu? Jelaskan!

7/27/2019 ManeconMM
http://slidepdf.com/reader/full/maneconmm 19/119
Tugas 1. 1.Utk.soal yg.ada di contoh 2, kalau seandainya: a.tingkat bunga berubah menjadi 5% per
tahun, jawab kembali soal itu! b.kalau seandainya tingkat bunga tetap 8% per
tahun, tapi umur teknis mesin 8 tahun danmasing-masing tahun ke-6,7 dan 8 menghasilkan$65.000 maka jawab kembali soal itu!
2.Diketahui suatu proyek mendatangkan totalbenefit sbb.: B(Q)=150+28Q-5Q² danmemerlukan biaya total sbb.: C(Q)=100+8Q
a.pada tingkat Q berapa keuntungan/net benefit
maksimal? b.berapa total benefit,total cost dan keuntungan
pada Q tsb. soal a.? Jelaskan jawaban sdr.! c.buat tabel spt.tabel 1-1 hal.19

7/27/2019 ManeconMM
http://slidepdf.com/reader/full/maneconmm 20/119
Pengantar Bab 2.
Di muka sdh.dijelaskan bahwa utk.terciptanyamanajemen yg.efektif a.l.manager harusmengenali situasi pasar.Cara yg.paling baik utk.itu adalah dgn jalan mempelajari kekuatan-kekuatan yg.ada di pasar dan ternyata kekuatanitu ada 2 yaitu permintaan (demand )
yg.menggambarkan kekuatan pembeli dankekuatan penawaran (supply ) yg.menggambarkan kekuatan penjual.
Secara lebih teknis cara utk. mengenali kekuatan
tsb.adalah mengidentifikasi faktor-faktor apa saja yg.mempengaruhi kekuatan permintaan danpenawaran dan seberapa besar serta bagaimanafaktor-faktor itu mempengaruhinya.
7/27/2019 ManeconMM
http://slidepdf.com/reader/full/maneconmm 21/119
25 global most admired companies (2002)
01.General electric: electronic (USA) 03.Microsoft: computers (USA) 06.Johnson&Johnson: pharmaceuticals (USA) 09.Intel: semiconductors (USA)
15.Procter&Gamble: soaps and cosmetics (USA) 16.Pepsico: beverage (USA) 19.Exxon mobil: petroleum refining (USA) 20.Cocacola enterprise: beverages (USA) 24.Nokia: network communications (Finland) 25.Toyota: motor vehicles (Japan)

7/27/2019 ManeconMM
http://slidepdf.com/reader/full/maneconmm 22/119
Head Line Ch.2: Samsung and HynixSemiconductor to cut Chip production.
Sam Robbins,pemilik dan CEO PC.Solutions dpt.informasi
bhw.2 raksasa pabrikan semiconductor(SC) yaituSamsung dan Hynix dlm.waktu dekat akan mengurangi(suspend) produksi mrk.Dan hal ini nampaknya akansegera diikuti oleh pabrikan besar ke 3 lainnya. Tigapabrikan tsb.menguasai 30% produksi SC dunia.
PC.Solutions adalah sebuah pers.perakit PC papantengah yg.sedang naik daun dimana pd.tahun terakhiromset penjualannya naik 100% .Saat ini persh.sedangmenyeleksi fresh-graduates dlm.rangka menambah
karyawan baru. Pertanyaan:menurut sdr.apa yg.sebaiknya dilakukan
oleh CEO.tersebut dalam rangka mengantisipasiinformasi yg.cukup penting ini?

7/27/2019 ManeconMM
http://slidepdf.com/reader/full/maneconmm 23/119
Inside Business 2-1:Asahi BreweriesLtd.and the Asian Recession
Pada thn.90-an ekonomi Jepang dilanda resesi
yg.berakibat puluhan persh.raksasa limbungbahkan beberapa diantaranya gulung tikar.Duapersh.raksasa bir papan atas yaitu Kirin BreweryCo.Ltd dan Sapporo Brewery Co.Ltd termasuk 2persh.yg.kena dampak resesi tsb.Omsetpenjualan mrk.turun drastis, namun anehnya,pesaing mrk.yaitu Asahi BreweryCo.Ltd.(termasuk persh.bir papan bawah) justrumalah mengalami hal yg.sebaliknya,omset
penjualannya naik dgn.tajam. Pertanyaan:konsep apa yg.dapat menjelaskan
fenomena ini!
7/27/2019 ManeconMM
http://slidepdf.com/reader/full/maneconmm 24/119
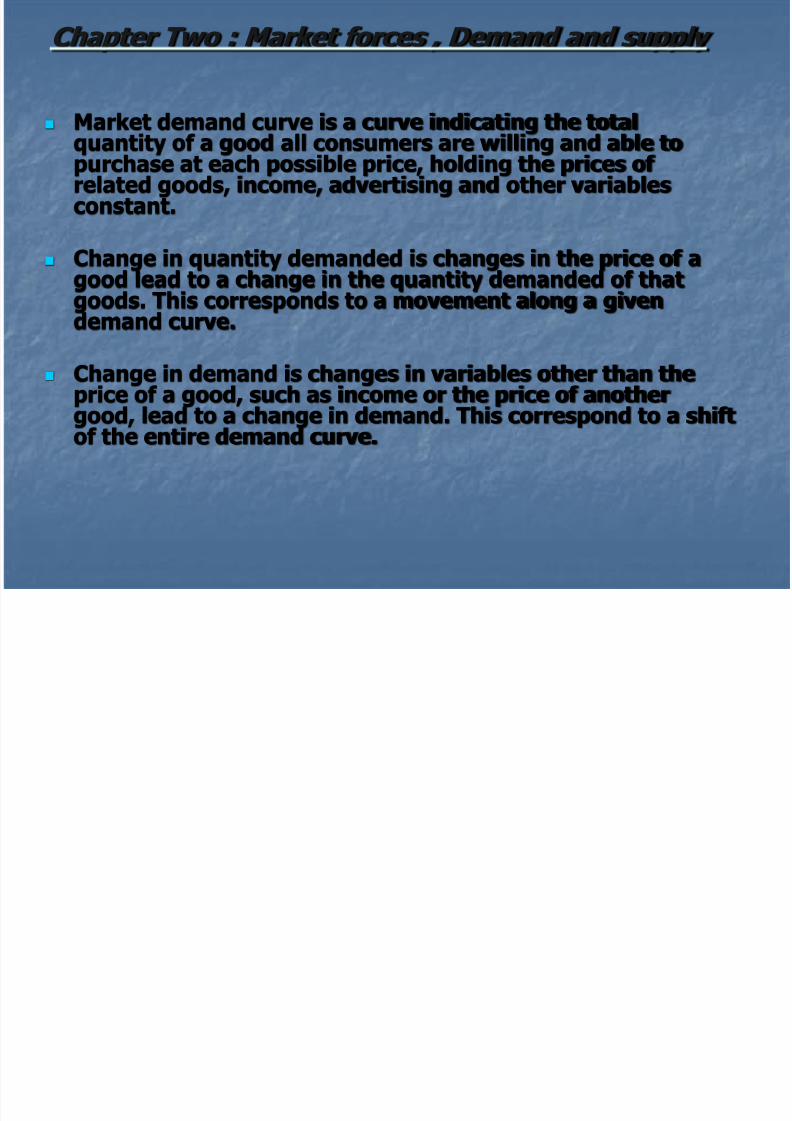
Chapter Two : Market forces , Demand and supply
Market demand curve is a curve indicating the total
quantity of a good all consumers are willing and able topurchase at each possible price, holding the prices of related goods, income, advertising and other variablesconstant.
Change in quantity demanded is changes in the price of a
good lead to a change in the quantity demanded of thatgoods. This corresponds to a movement along a givendemand curve.
Change in demand is changes in variables other than theprice of a good, such as income or the price of another
good, lead to a change in demand. This correspond to a shiftof the entire demand curve.

7/27/2019 ManeconMM
http://slidepdf.com/reader/full/maneconmm 25/119
Variables influence demand
are: 1.The price of a good (Px)
2.Consumer’s income (M)
3.Prices of related goods (Py , Pz)
4.Advertising and consumer tastes (A)
5.Population (N)
6.Consumer expectations (E)
7.Others factors (O)
7/27/2019 ManeconMM
http://slidepdf.com/reader/full/maneconmm 26/119
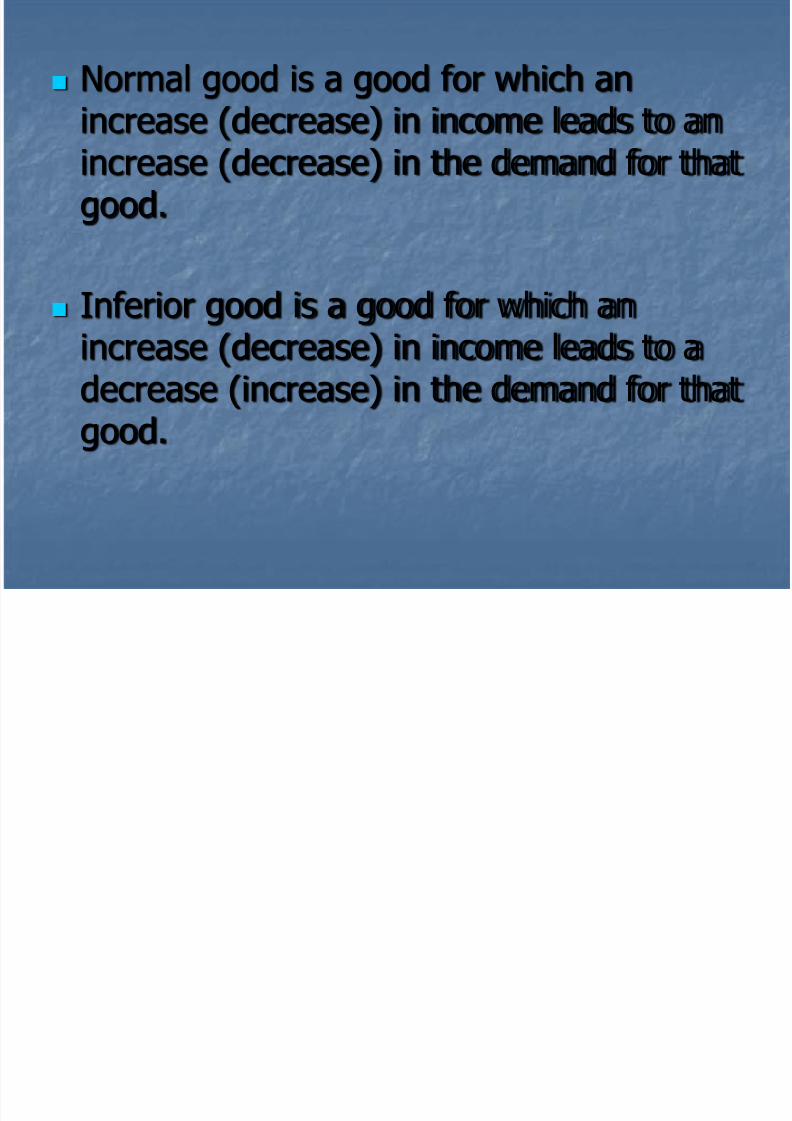
Normal good is a good for which anincrease (decrease) in income leads to anincrease (decrease) in the demand for thatgood.
Inferior good is a good for which anincrease (decrease) in income leads to adecrease (increase) in the demand for that
good.

7/27/2019 ManeconMM
http://slidepdf.com/reader/full/maneconmm 27/119
Substitutes good is a good for which an increase(decrease) in the price of one good leads to anincrease (decrease) in the demand for the othergood.
Complements good is a good for which anincrease (decrease) in the price of one good leadsto a decrease (increase) in the demand for theother good.
Demand function is a function that describe howmuch of a good will be purchased at alternativeprices of that good and related goods, alternativeincome level and alternative values of othervariables affecting demand.

7/27/2019 ManeconMM
http://slidepdf.com/reader/full/maneconmm 28/119

7/27/2019 ManeconMM
http://slidepdf.com/reader/full/maneconmm 29/119
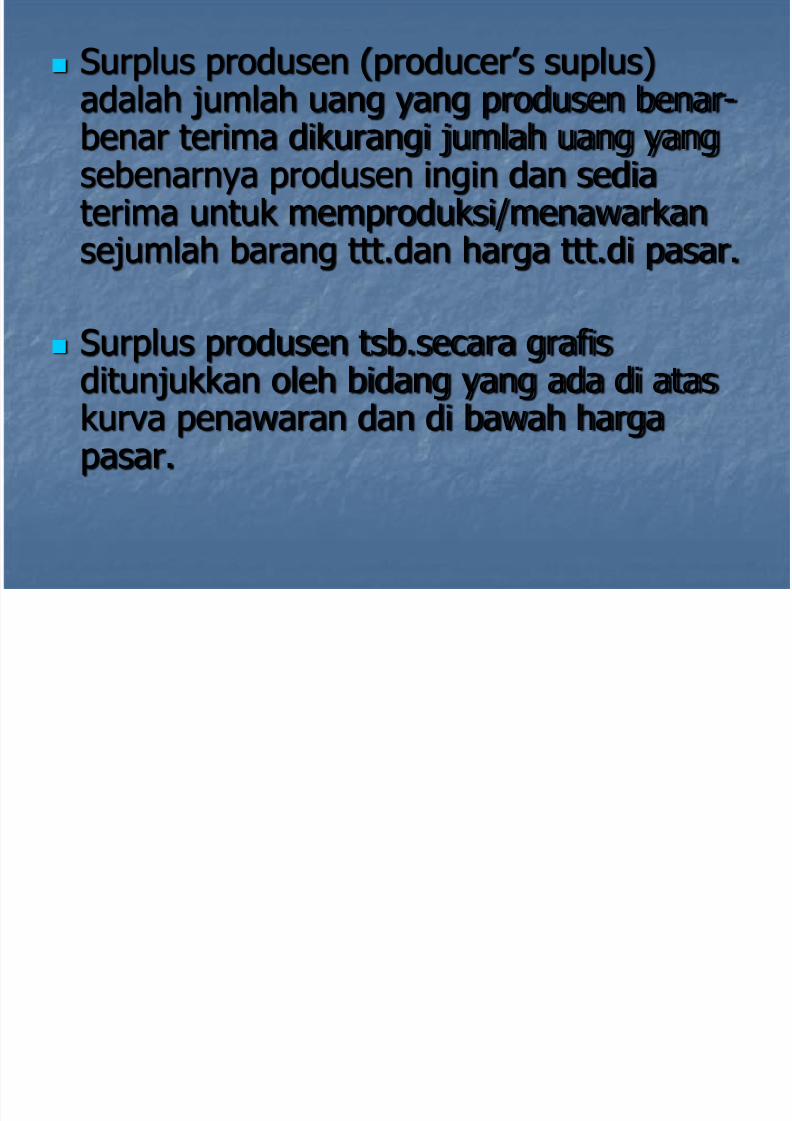
Surplus konsumen (consumer’s surplus)adalah jumlah uang yang sebenarnya
konsumen ingin dan dapat bayar dikurangi jumlah uang yang konsumen benar-benarbayar untuk mendapatkan barang dalam
jumlah ttt.pada tingkat harga ttt. di pasar.
Surplus konsumen tsb. secara grafis
ditunjukkan oleh bidang di bawah kurvapermintaan yang ada di atas harga pasar.

7/27/2019 ManeconMM
http://slidepdf.com/reader/full/maneconmm 30/119
&
Market supply curve is a curve indicating the total quantity
of a good that all producers in a competitive market wouldproduce at each price, holding input price, technology and
other variables affecting supply constant.
Change in quantity supplied is a changes in the price of agood lead to a change in the quantity supplied of thatgoods. This corresponds to a movement along a givensupply curve.
Change in supply is a changes in variables other that theprice of a good, such as input prices or technologicaladvance, lead to a change in supply. This corresponds to ashift of the entire supply curve.
Variables affect supply: 1.Price of a good (Px) 2.Input prices (Pw) 3.Price of technologically related goods (Pr) 4.Number of firms in the market (H) and
5.Taxes/subsidy (Tx/Sb)

7/27/2019 ManeconMM
http://slidepdf.com/reader/full/maneconmm 31/119
Qsx=f (Px, Pw, Pr, Tx/Sb)
+ - -/+ -/+
Contoh. Sebuah produk penawaran pasarnya sbb.
Qsx=2000+3Px-4Pr-Pw, cet.par.
Apabila diketahui Pr=$100,Pw=$2000,maka
a.bila Px=$400, hitung berapa Qsx?
a.identifikasi kurva penawaran danbagaimana bentuknya dlm.grafik!

7/27/2019 ManeconMM
http://slidepdf.com/reader/full/maneconmm 32/119
7/27/2019 ManeconMM
http://slidepdf.com/reader/full/maneconmm 33/119

7/27/2019 ManeconMM
http://slidepdf.com/reader/full/maneconmm 34/119
Principles:
1.Equilibrium in a competitive market isdetermined by the intersection of themarket demand and supply curves. The
equilibrium price is the price that equatesquantity demanded with quantity supplied.Mathematically, the equilibrium price (Pe)is the price such that
Qd (Pe) = Qs (Pe)

7/27/2019 ManeconMM
http://slidepdf.com/reader/full/maneconmm 35/119

7/27/2019 ManeconMM
http://slidepdf.com/reader/full/maneconmm 36/119
Contoh 2.
Diketahui fungsi permintaan :
Qdx=6060-3Px sedang fungsipenawarannya : Qsx=-540+3Px
Pertanyaan:
a.Hitung harga pasar!
b.Hitung surplus konsumen dan surplusprodusen pada harga pasar tsb di atas!
c.Lukiskan persoalan di atas ke dalamgrafik!

7/27/2019 ManeconMM
http://slidepdf.com/reader/full/maneconmm 37/119
Pengantar Bab 3.
Pada Bab 2 sdh.dibahas variabel-variabel yg secara teoritis
mempengaruhi jumlah brg.yg.diminta konsumen maupun jumlahbrg.yg.ditawarkan produsen di pasar beserta arah pengaruhnyadari masing-masing variabel tsb. Namun dlm.bab itu secaraspesifik/kuantitatif bagaimana masing-masing variabelmempengaruhi jumlah yg.diminta konsumen/ditawarkanprodusen sama sekali belum dibahas secara detail.
Pada Bab 3 ini akan dicoba dibahas: 1.Bagaimana secara kuantitatif masing-masing variabel
tsb.mempengaruhi jumlah yang diminta konsumen/ditawarkanoleh produsen
2.Teknik (metoda) yg.dpt.digunakan utk.mengestimasi parameter(konstanta dan koefisien) baik yg.ada dlm.fungsiperimintaan/penawaran dgn .menggunakan analisis regresi OLS.
Pemahaman terhadap 2 point di atas menjadi sesuatu yg.sangatbermanfaat bagi manager,khususnya berkaitan dgn.penetapankebijakansanaan persh.utk.pencapaian keuntungan maksimal.

7/27/2019 ManeconMM
http://slidepdf.com/reader/full/maneconmm 38/119
Head Line Ch.3:Winner of Wireless Auction to pay $7 B CEO dari sebuah Regional Telephone CO.thn.depan
berusaha mengikuti lelang (auction) utk.memperolehlisensi penyelenggaraan wireless communication network (WCN) yg.diselenggarakan oleh FCC.
Utk.tahun ini lelang dimenangkan oleh 99rekanan/penawar (bider) dengan keseluruhan nilailelang $7 B atau secara rata-rata $70,7M per penawar.
Pertanyaan:menurut sdr.berapa dana harus disediakanoleh CEO tsb.agar supaya tahun depan ia bisamemenangkan lelang utk.memperoleh lisensi WCN diwilayahnya?
Keterangan:utk.analisis ia memperoleh data penduduk thn.depan tumbuh 7%. Harga lisensi fungsi dari jumlahlisensi yg.dikeluarkan (-) dan banyaknya penduduk yg.mendapat layanan (+). Dari 10 negara yg.diketahuiada datanya dpt.diregres dgn.hasil sbb.:
Ln.P = 2,23 – 1,2 ln.Q + 1,25 ln.Pop
7/27/2019 ManeconMM
http://slidepdf.com/reader/full/maneconmm 39/119
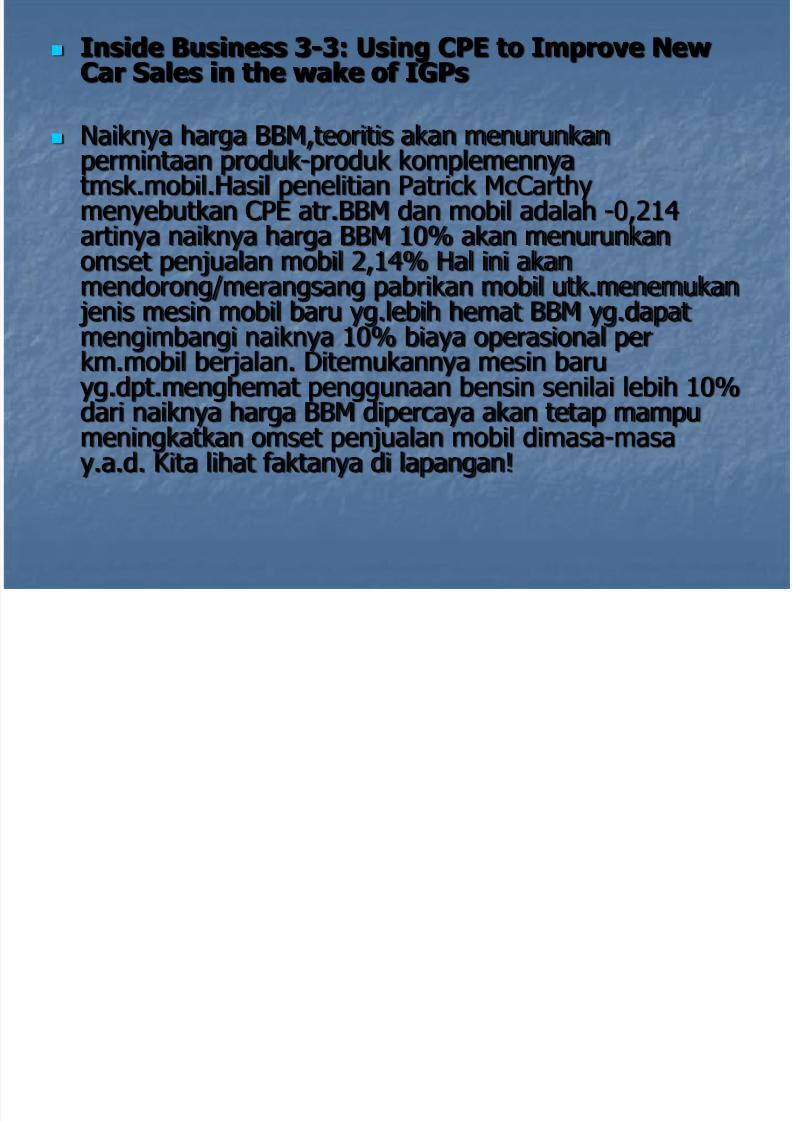
Inside Business 3-3: Using CPE to Improve NewCar Sales in the wake of IGPs
Naiknya harga BBM,teoritis akan menurunkanpermintaan produk-produk komplemennyatmsk.mobil.Hasil penelitian Patrick McCarthymenyebutkan CPE atr.BBM dan mobil adalah -0,214artinya naiknya harga BBM 10% akan menurunkanomset penjualan mobil 2,14% Hal ini akan
mendorong/merangsang pabrikan mobil utk.menemukan jenis mesin mobil baru yg.lebih hemat BBM yg.dapatmengimbangi naiknya 10% biaya operasional perkm.mobil berjalan. Ditemukannya mesin baruyg.dpt.menghemat penggunaan bensin senilai lebih 10%
dari naiknya harga BBM dipercaya akan tetap mampumeningkatkan omset penjualan mobil dimasa-masay.a.d. Kita lihat faktanya di lapangan!

7/27/2019 ManeconMM
http://slidepdf.com/reader/full/maneconmm 40/119
Chapter Three : Quantitative demand analysis
Elasticity a measure of the responsiveness of one variableto changes in another variable; the percentage change inone variable that arises due to a given percentage change inanother variable.
Own price elasticity is a measure of the responsiveness of
the quantity demanded of a good to a change in a price of that good; the percentage change in quantity demandeddivided by the percentage change in the price of the good.
Demand is Elastic/unitary/inelastic if the absolute value of the own price elasticity is greater/equal/less than 1.
Perfectly elastic/inelastic demand if the own price elasticityis infinite/zero in absolute value. In this case the demandcurve is horizontal/vertical.

7/27/2019 ManeconMM
http://slidepdf.com/reader/full/maneconmm 41/119
Cross price elasticity is a measure of the responsiveness of the demand for a good to a change in a price of relatedgood; the percentage change in quantity demanded of onegood divided by the percentage change in the price of
related good.
Income elasticity is a measure of the responsiveness of thedemand for a good to a change in consumer income; thepercentage change in quantity demanded divided by thepercentage change in income.
Linear demand function is a representation of the demandfunction in which the demand for a given good is a linearfunction of prices, income level and other variablesinfluencing demand.
Qdx = a + bPx + cPy + dM + eH

7/27/2019 ManeconMM
http://slidepdf.com/reader/full/maneconmm 42/119
Demand is Log-linear if the logarithm of demandis linear function of the logarithms of prices,income and other variables.
Qdx = aPxbPycMdHe
If we take the natural logarithm of this equation
we obtain an expression that is linear in thelogarithms of the variables: lnQdx = lna + blnPx + clnPy + dlnM + elnH
Least squares regression is the line thatminimizes the sum of squared deviationsbetween the line an the actual data points.
7/27/2019 ManeconMM
http://slidepdf.com/reader/full/maneconmm 43/119
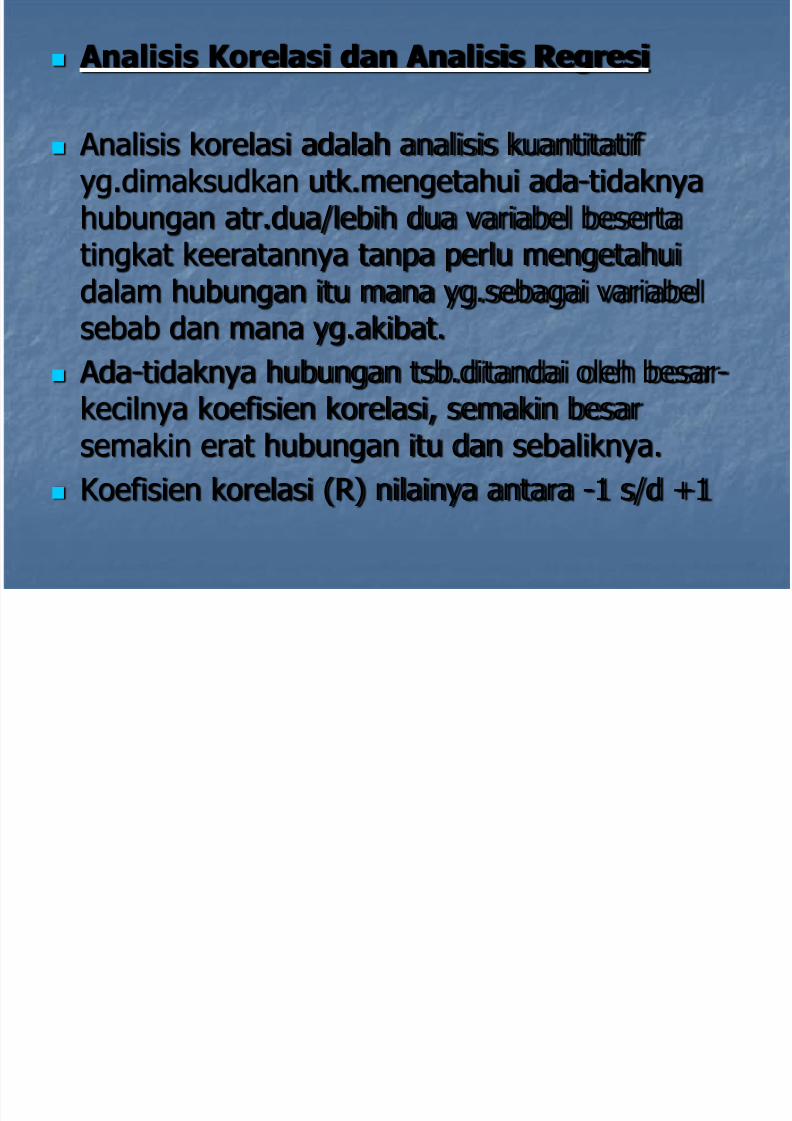
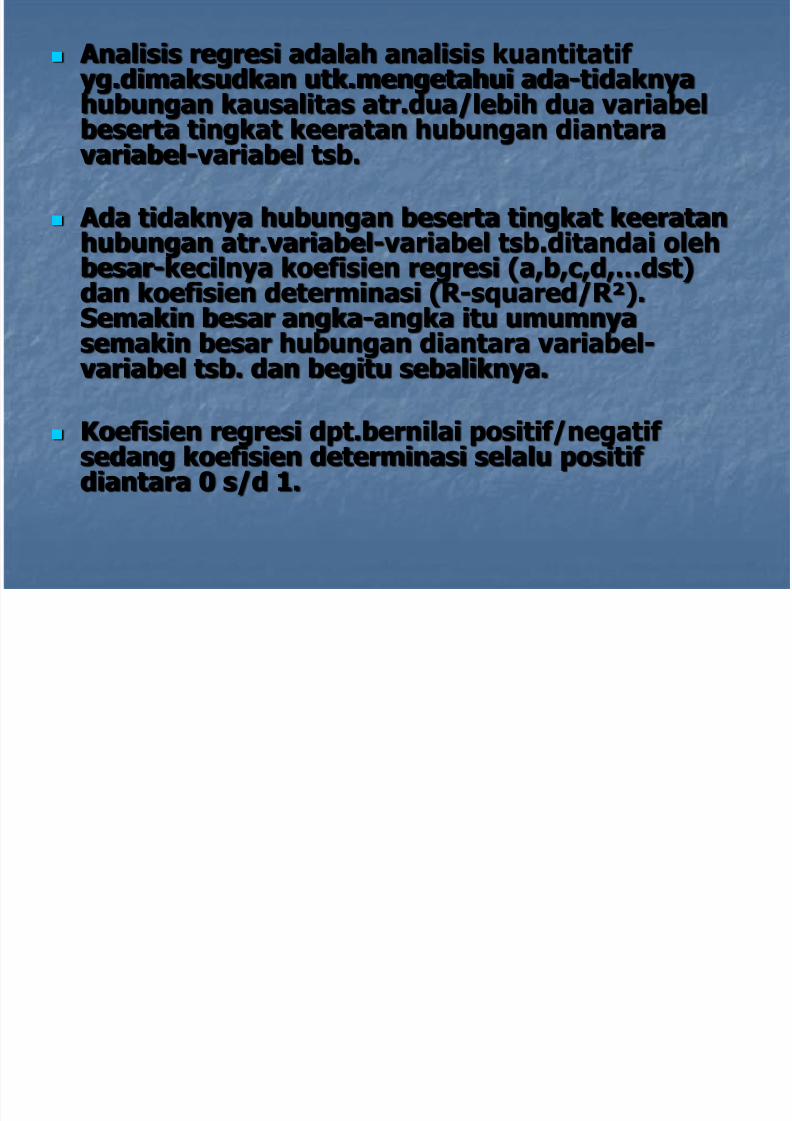
Analisis Korelasi dan Analisis Regresi
Analisis korelasi adalah analisis kuantitatif yg.dimaksudkan utk.mengetahui ada-tidaknyahubungan atr.dua/lebih dua variabel besertatingkat keeratannya tanpa perlu mengetahui
dalam hubungan itu mana yg.sebagai variabelsebab dan mana yg.akibat.
Ada-tidaknya hubungan tsb.ditandai oleh besar-
kecilnya koefisien korelasi, semakin besarsemakin erat hubungan itu dan sebaliknya.
Koefisien korelasi (R) nilainya antara -1 s/d +1
7/27/2019 ManeconMM
http://slidepdf.com/reader/full/maneconmm 44/119

7/27/2019 ManeconMM
http://slidepdf.com/reader/full/maneconmm 45/119
Untuk menilai persamaan regresi taksiran yangdidapat (hal ini disebabkan krn.data yg.dipakaiutk.analisis berupa data dari sample dan bukanpopulasi), perlu diuji dengan beberapa uji sbb.:
A.Uji teori ekonomi, meliputi :
1.tanda koefisien
2.besaran koefisien
B.Uji statistika, meliputi :
1.signifikansi koefisien: uji t
2.goodness of fit : R-square dan F statistik
C.Uji ekonometrika: uji otokorelasi, ujimultikoliniarits dan uji heteroskedastisitas.

7/27/2019 ManeconMM
http://slidepdf.com/reader/full/maneconmm 46/119
t-statistic is the ratio of the value of parameter estimate to thestandard error of the parameter estimate.
Rule of thumb for using t-statistic when the absolute value of thet-statistic is greater than 2,the manager can be 95% confidentthat the true value of the underlying parameter in the regression isnot zero.
R-square (the coefficient of determination) tells the fraction of thetotal variation in the dependent variable that is explained by theregression.
The value of an R-square range from 0 and 1 ; the closer the R-square to 1 the better the overall fit of estimated regressionequation to the actual data.
F-statistic provides a measure of the total variation explained by
regression relative to the total unexplained variation. The greaterthe F-statistic, the better the overall fit of the regression linethrough the actual data. Regression that have F-statistic withsignificance value of 5% or less are generally consideredsignificant

7/27/2019 ManeconMM
http://slidepdf.com/reader/full/maneconmm 47/119
Formula.
Qdx = f(Px, Py, M, H)
EQx,Px = % change inQx/% change in Px
EQx,Py = % change in QX/%change in Py
EQx,M = % change inQx/% change in M

7/27/2019 ManeconMM
http://slidepdf.com/reader/full/maneconmm 48/119
Contoh 1.Diketahui daily demand for
Invogorated shoes to be :
Qdx = 100 – 3Px + 4Py – 0,01M + 2Ax; Apabila diketahui Py=$35; M=$20.000
dan Ax=$50 maka pada waktu Px=$25
hitung:a.Hitung EQx,Px – EQx,Py dan EQx,M! Artikan angka itu!

7/27/2019 ManeconMM
http://slidepdf.com/reader/full/maneconmm 49/119
Contoh 2:
Diketahui fungsi permintaan kamar pndokan di Yogyakartasbb.:
Qdx=135,15-0,14Px+0,54A-5,78D, di mana:Qdx=jumlahkamar yang diminta per smt; Px=sewa kamar per bln;
A=pengeluaran iklan pemilik asrama per smt. Dan A=jarak asrama ke kampus dlm Km.
R=0,89; R-square=0,79; S.E.=9,18; n=10 dan t-hitungmasing-masing intersep dan koefisien adalah 6,54; -2,41;0,85 dan-4,61
Pertanyaan: Apabila ditetapkan Px=$520; A=$20,50 dan D=5,7 Km,
maka menurut sdr. berapa jumlah kamar akan diminta olehkonsumen? Dan catatan apa yang dapat sdr.berikansehubungan dgn.angka-angka statistik di atas!

7/27/2019 ManeconMM
http://slidepdf.com/reader/full/maneconmm 50/119
Tugas 3.
Dengan menggunakan program SPSS:
a.coba sdr. identifikasi bagaimana bentuk fungsipermintaan produk soft-ware komputeryg.datanya seperti nampak pada tabel 3-1 (hal.74),atau tabel 3-8 (hal.95) atau tabel 3-9 (hal102)→Pilih salah satu saja!
b.kemudian sdr.sebutkan berapa nilai koefisienregresi (a,b,..) dalam fungsi itu dan juga
nilai:R,R²,t-a,t-b, dan jelaskan apa arti dariangka-angka itu.Dan jangan lupa sertakan print-out komputer hasil olahan sdr.!

7/27/2019 ManeconMM
http://slidepdf.com/reader/full/maneconmm 51/119
Pengantar Bab 4.
Agar supaya manager dpt.mengelola dgn.baik persh.yg.dipimpinnya ia hrs.mengenali perilaku(behaviour) individu-individu yg.terkait denganpersh-nya khususnya konsumen dan pekerja(worker).
Dengan dikenalinya perilaku mrk.diharapkanmanager akan dpt.mengetahui/mengantisipasiapa yg. akan mrk.lakukan sehubungandgn.kebijaksanaan-kebijaksanaan yg. diambiloleh manager ybs.contohnya :
1.kebijaksanaan dlm.penetapan harga jualproduk, advertensi, inovasi produk baru dll.
2.kebijaksanaan dlm.penetapan upah pekerja.

7/27/2019 ManeconMM
http://slidepdf.com/reader/full/maneconmm 52/119

7/27/2019 ManeconMM
http://slidepdf.com/reader/full/maneconmm 53/119

7/27/2019 ManeconMM
http://slidepdf.com/reader/full/maneconmm 54/119
Titik keseimbangan konsumen (CEP)terjadi pada waktu :
KI bersinggungan dengan BL atau
Slope KI = Slope BL atau
MRS x for y = -Px/Py atau MUx/Muy = -Px/Py atau
Mux/Px = -Muy/Py atau
Rasio atr.MU dan harga utk.barang yangsatu (X) sama dengan rasio atr.MU danharga barang yg.lain (Y)
7/27/2019 ManeconMM
http://slidepdf.com/reader/full/maneconmm 55/119

7/27/2019 ManeconMM
http://slidepdf.com/reader/full/maneconmm 56/119

7/27/2019 ManeconMM
http://slidepdf.com/reader/full/maneconmm 57/119
Value marginal product (VMP) is the value of the outputproduced by the last unit of an input.
Kemungkinan bentuk-bentuk fungsi produksi :
1.Linear production function is a production function thatassumes a perfect linear relationship between all inputsand total output.
Q = f (K,L) = aK + bL; where a and b are constants
2.Leontief production function is a production functionthat assumes that inputs are used in fixed proportion.
Q = f (K,L) = min (bK,cL); where b and c areconstants.

7/27/2019 ManeconMM
http://slidepdf.com/reader/full/maneconmm 58/119
3.Cobb-Douglas production function is a production function thatassumes some degree of substitutability among inputs.
Q = f (K,L) = KaLb Where a and b are constants. Bentuk fungsi ini menjadi linier sth.diubah dlm.bentuk Log,menjadi Log Q = a Log K + b Log L
Isoquant is the combinations of inputs that yield the same level of output.
Q = f (K,L) =Qo
Marginal rate of technical substitution (MRTS) is the rate at which aproducer can substitute between two inputs and maintain the samelevel of output. MRTSKL = MPL/MPK.
Law of diminishing marginal rate of technical substitution is aproperty of a production function stating that as less of one unitinput is used, increasing amounts of another input must beemployed to produce the same level of output.

7/27/2019 ManeconMM
http://slidepdf.com/reader/full/maneconmm 59/119
Isocost is a line that represent the combinations of inputs that will cost the producer the same amount of money.
C = r.K + w.L = Co
Fixed costs is cost that do not change with changes inoutput, include the costs of fixed inputs used inproduction.
Variable costs is a cost that change with changes inoutput; include the costs of inputs that vary with output.
Short-run cost function is a function that defines theminimum possible cost of producing each output levelwhen variable factors are employed in the minimizingfashion.
Average fixed cost (AFC) is fixed cost divided by thenumber of unit of output.
A e ge i ble o t (AVC) i i ble o t

7/27/2019 ManeconMM
http://slidepdf.com/reader/full/maneconmm 60/119
Average variable cost (AVC) is variable costdivided by the number of unit of output.
Marginal cost (MC) is the cost of producing anadditional unit of output.
Sunk cost is a cost that is forever lost after it
has been paid.
Costs are cubic function of output provides areasonable approximation to virtually any cost
function. C= f(Q) = A + aQ + bQ2 + cQ3 ; MC = a +
2bQ + 3cQ2
Long run average cost (LAC) curve is a curve that defines the

7/27/2019 ManeconMM
http://slidepdf.com/reader/full/maneconmm 61/119
Long-run average cost (LAC) curve is a curve that defines theminimum average cost of producing alternative level of output,allowing for optimal selection of both fixed and variable factor of production.
Economies of scale/diseconomies of scale/constant returns to scaleexist whenever long-run average cost declines/rise/remain constantas output is increased.
Multiproduct cost function is a function that defines the cost of
producing given levels of output of two or more types of outputsassuming all inputs are used efficiently.
Economies of scope exist when the total cost of producing twotypes of outputs together is less than the total cost of producingeach type of output separately.
Cost complementarity exist when the marginal cost of producingone type of output decrease when the output of another good isincreased.

7/27/2019 ManeconMM
http://slidepdf.com/reader/full/maneconmm 62/119
Principles:
1.As the usage of an input increases, marginal productinitially increases, than begins to decline and eventuallybecome negative.
2.To maximize profits a manager should use inputs atlevels at which the marginal benefit equals the marginalcost. More specifically when the cost of each additionalunit of labor is w, the manager should continue toemploy labor up to the point where VMPL = w in the
range of diminishing marginal product.
3.For given input prices, isocost farther from the originare associated with higher costs. Changes in input priceschange the slope of isocost lines.

7/27/2019 ManeconMM
http://slidepdf.com/reader/full/maneconmm 63/119
4.To minimize the cost of producing a givenlevel of output, the marginal product per dollar
spent should be equal for all inputs : MPL/w = MPK/r . Equivalently to minimize the
cost of production a firm should employ inputsuch that the marginal rate of technical
substitution is equal to the ratio of input prices:MPL/MPK = w/r. 5.To minimize the cost of producing a given
level of output, the firm should use less of aninput and more of other inputs when that input’s
price rise. 6.A decision maker should ignore sunk costs to
maximize profits or minimize losses.
Tugas 4

7/27/2019 ManeconMM
http://slidepdf.com/reader/full/maneconmm 64/119
Tugas 4.
Diketahui fungsi produksi sbb.: Q=21L+9L²-L³ dimana K tetap =1 unit Apabila diketahui Pl=$200 dan Pk=$400,
a.buat tabel produksi spt.tabel 5-1 hal.154 b.buat tabel biaya produksi spt.tabel 5-4
dan 5-5 hal.176 dan 177 c.kemudian dgn.mendasarkan angka-
angka yg.ada dalam tabel tsb.buatlahkurva-kurva produksi dan kurva-kurva
biaya produksi spt.figure 5-1 hal.156 danfugure 5-11 hal.175 dan figure 5-12hal.178.

7/27/2019 ManeconMM
http://slidepdf.com/reader/full/maneconmm 65/119

7/27/2019 ManeconMM
http://slidepdf.com/reader/full/maneconmm 66/119
Chapter Six : The organization of the firm
A. Methods of procuring inputs:
1.Purchase the inputs using spot exchange 2.Acquire inputs under a contract 3.Produce inputs internally (vertical integration)
Spot exchange is informal relationship between a buyer andseller in which neither party is obligated to adhere tospecific term for exchange.
Contract is a formal relationship between buyer and sellerthat obligated the buyer and seller to exchange a termsspecified in a legal document.
Vertical integration is a situation where a firm produces theinputs required to make its final product.
7/27/2019 ManeconMM
http://slidepdf.com/reader/full/maneconmm 67/119
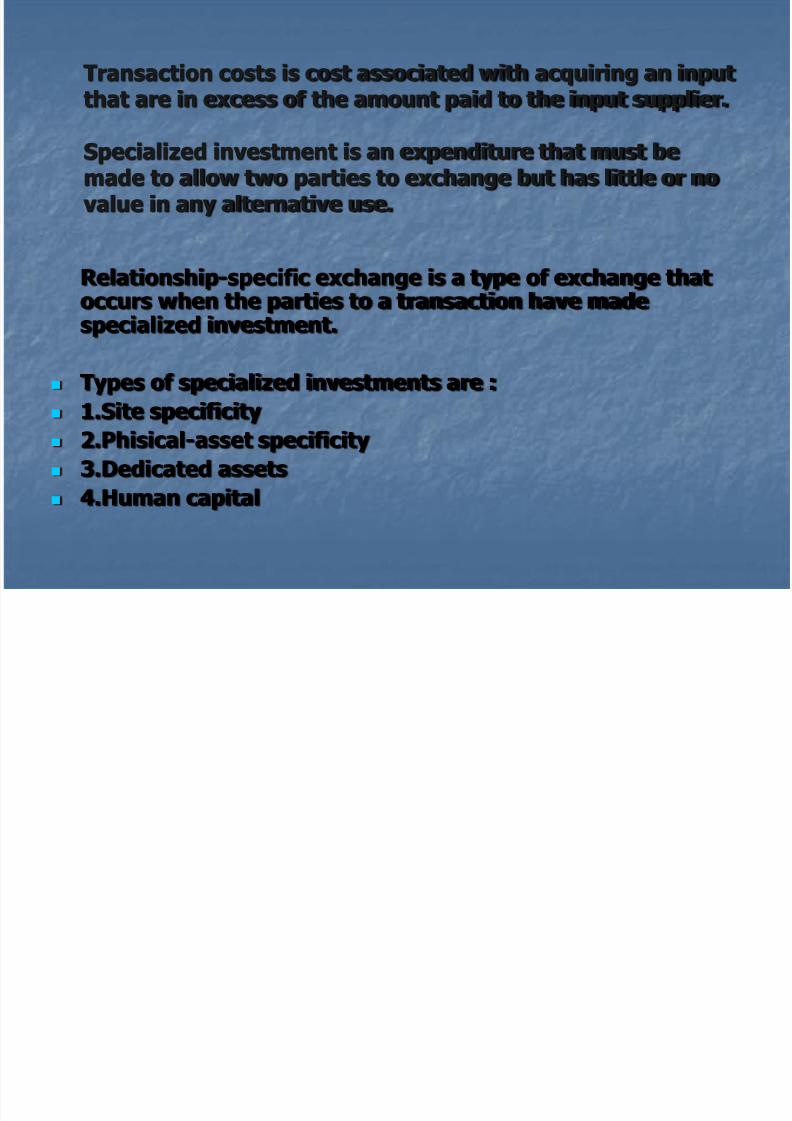
Transaction costs is cost associated with acquiring an inputthat are in excess of the amount paid to the input supplier.
Specialized investment is an expenditure that must bemade to allow two parties to exchange but has little or novalue in any alternative use.
Relationship-specific exchange is a type of exchange thatoccurs when the parties to a transaction have madespecialized investment.
Types of specialized investments are :
1.Site specificity
2.Phisical-asset specificity
3.Dedicated assets
4.Human capital
7/27/2019 ManeconMM
http://slidepdf.com/reader/full/maneconmm 68/119
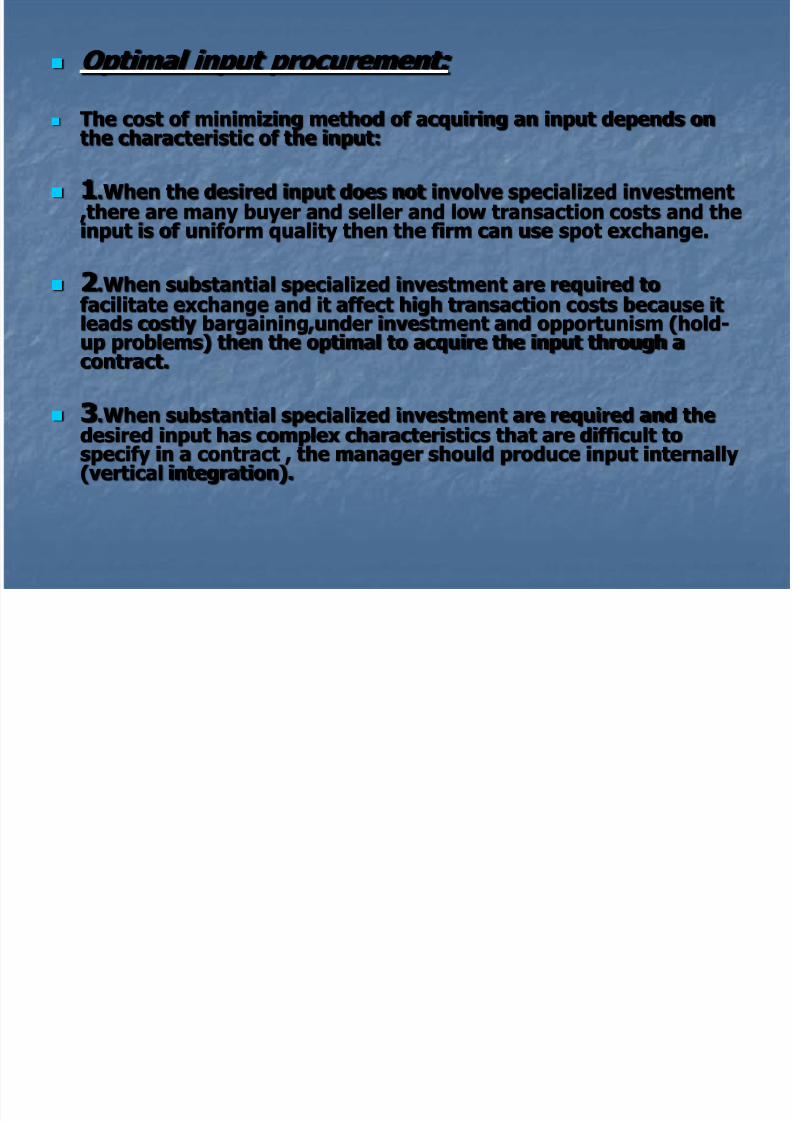
Optimal input procurement:
The cost of minimizing method of acquiring an input depends onthe characteristic of the input:
1.When the desired input does not involve specialized investment ,there are many buyer and seller and low transaction costs and theinput is of uniform quality then the firm can use spot exchange.
2.When substantial specialized investment are required tofacilitate exchange and it affect high transaction costs because itleads costly bargaining,under investment and opportunism (hold-up problems) then the optimal to acquire the input through acontract.
3.When substantial specialized investment are required and thedesired input has complex characteristics that are difficult tospecify in a contract , the manager should produce input internally(vertical integration).
Implications of specialized investment are:
1 C l b i i

7/27/2019 ManeconMM
http://slidepdf.com/reader/full/maneconmm 69/119
1.Costly bargaining2.Under investment3.Opportunism and the “Hold-up problem”
B. Solutions to the manager-worker/principle-agent problem:
Revenue-based incentive scheme are :1.Profit sharing2.Revenue sharing.
Incentive for workers to minimize costs are :1.Piece rate2.Time clock and spot checks
Profit sharing is mechanism used to enhance workers’ efforts thatinvolves tying compensation to underlying profitability of the firm.
Revenue sharing is mechanism used to enhance workers’ effortsthat involves linking compensation to the underlying revenues of the firm.
M i l ti d th

7/27/2019 ManeconMM
http://slidepdf.com/reader/full/maneconmm 70/119
Managerial compensation and theprincipal-agent problem
1.Incentive contract : profit-sharingscheme and other bonuses
2.External incentive : reputation, takeover
Manager-worker principal-agent problem 1.Profit sharing
2.Revenue sharing (include tips and salescommissions)
3.Piece rates
4.Time clocks and spot checks
Tugas 5

7/27/2019 ManeconMM
http://slidepdf.com/reader/full/maneconmm 71/119
Tugas 5.
1.Sebagai seorang manajer dari sebuah fast-
food outlet beef-burger “ABC” dengan omset8000 pack per minggu anda membutuhkan 1000kg.daging sapi klas “A” yg.harus siap setiap hariSenen jam 08.00 pagi tepat.
Pertanyaan: a.apa yg.terjadi menurut sdr.kalau seandainya
utk. memenuhi kebutuhan daging tsb.andamembelinya lewat “spot exchange”,jelaskan!
b.bagi produsen pemasok daging tsb.apayg.harus diantisipasi kalau seandainya ia inginmenjual dagingnya lewat “spot exchange”,
jelaskan!
2 Sebagai seorang manajer sukses dari

7/27/2019 ManeconMM
http://slidepdf.com/reader/full/maneconmm 72/119
2.Sebagai seorang manajer sukses darisebuah persh.yang cukup bergengsi anda
membutuhkan jasa seorang sekretarisyang dapat anda andalkan utk.tugas-tugaskesekretariatan.Menurut pendapat cara pemberiankompensasi tipe yang mana yang perludigunakan agar semuanya berjalanoptimal seimbang dgn.reputasi sdr.:
Profit-sharing, piece rates atau hourlybased wage, jelaskan!
7/27/2019 ManeconMM
http://slidepdf.com/reader/full/maneconmm 73/119
Ch t Th t f i d t

7/27/2019 ManeconMM
http://slidepdf.com/reader/full/maneconmm 74/119
Chapter seven : The nature of industry
Market structure refers all factors that affect managerial decisions,including: (1) the number of firms competing in a market, (2) therelative size of firms, (3) technological and cost considerations, (4)demand conditions and (5) the ease with which firms can enter orexit the industry.
Measures of industry concentration:
1.Four-firm concentration ratio (C4) and 2.Herfindahl-Hirshman index (HHI).
Four-firm concentration ratio (C4) is the fraction of total industry
sales generated by the four largest firms in the industry.C4 =(S1+S2+S3+S4)/ST
C4 value lies between 0 and 1

7/27/2019 ManeconMM
http://slidepdf.com/reader/full/maneconmm 75/119
HHI is the sum of the squared market shares of
firms in a given industry multiplied by 10.000HHI lies between 0 and 10.000
HHI = 10.000 ∑wi ;where wi = Si/ST where Si isfirm i’s sales and ST is total sales industry.
Rothschils index (R) is a measure of thesensitivity to price of a product group as a wholerelative to the sensitivity of the quantitydemanded of a single firm to a change in its price.
R =ET/EF ; where ET is the elasticity of demandfor total market and EF is the elasticity of demandfor the product of an individual firm. R takes onvalue between 0 and 1.

7/27/2019 ManeconMM
http://slidepdf.com/reader/full/maneconmm 76/119
Pricing behavior.Lerner index (L) is a measure of the difference between price andmarginal cost as a fraction of the product’s price.L = (P-MC) / P
Types of integration:1. Vertical integration2. Horizontal integration3. Conglomerate mergers
Vertical integration refers to a situation where various stages in theproduction of a single product are carried out in a single firm.
Horizontal integration refers to the merging of the production of similar products into a single firm.
Conglomerate merger involves the integration of different productlines into a single firm. Conglomerate merger can improve firmscash flow-revenue derived from one product line can be used togenerate working capital when demand for another product is low.

7/27/2019 ManeconMM
http://slidepdf.com/reader/full/maneconmm 77/119
Dansby-Willig performance index is rank
industries according to how much socialwelfare would improve if the output in anindustry were increased by small amount.
Various types of market structure:
1.Perfect competition
2.Monopoly
3.Monopolistic competition
4.Oligopoly

7/27/2019 ManeconMM
http://slidepdf.com/reader/full/maneconmm 78/119

7/27/2019 ManeconMM
http://slidepdf.com/reader/full/maneconmm 79/119
Struktur pasar output
Kriteria Sruktur Pasar Output
Persaingan
Sempurna
Persaingan
Monopolistik
Oligopoli Monopoli
(1) (2) (3) (4)
(1).JumlahProdusen
Banyak sekali Banyak sekali Beberapa Satu
(2).Skala Usaha
Relatif dgn
Luas Pasar
Sangat kecil Kecil Besar Sangat besar
(3).Teknologi yg
digunakan
Sama Sedikit beda Berbeda Sangat beda
(4).Mudah
tidaknya
keluar
masuk pasar
Sangat mudah Mudah Sulit Sangat sulit
(5).Sifat barang
yang dijual
Identik/persis
sama
Sedikit beda/
dibedakan
Sama/sedikit
beda/dibeda
Unik/sama
sekali beda

7/27/2019 ManeconMM
http://slidepdf.com/reader/full/maneconmm 80/119
Angka indeks untuk beberapa struktur pasar
Angka Indeks Persaingan
Sempurna
Persaingan
Monopolistik
Oligopoli Monopoli
(1) (2) (3) (4)
C4 0 Mendekati 0 Mendekati 1 1
H.H.I 0 Mendekati 0 Mendekati
10.000
10.000
R 0 Mendekati 0 Mendekati 1 1
L
0
Mendekati 0
Mendekati ∞
∞
M.U.F 1 Mendekati 1 Mendekati ∞ ∞
D.W.P.I 0 Mendekati 0 Mendekati ∞ ∞
Tugas 6.

7/27/2019 ManeconMM
http://slidepdf.com/reader/full/maneconmm 81/119
Tugas 6. 1.Pasar produk SKT.dilayani lebih dari 50 perusahaan
dengan omset total 100 juta bungkus per bulan.Dari
omset itu 60 juta diantaranya dilayani oleh 4persh.terbesar (the big-four ) jaitu Jarum=25 juta,GG=15 juta,Sampurna=12,5 juta dan Bentoel=7,5 juta.
Pertanyaan:
a.hitung C4 dan HHI, apa arti angka itu!
b.kalau SKT.Jarum dijual dgn.harga Rp.6000 padahalMC-nya Rp.4500 sedang SKT.GG dijual Rp.5500 sedangMC-nya Rp.5000, maka hitung Lerner index dan Mark-upFactor utk.2 komoditi tsb. dan apa arti dari angka itu?
c.Kalau diketahui Et=-0,90; Ef SKT.Jarum=-1,25 dan Ef SKT.GG=-1,50,maka hitung Rothscild index utk.SKTJarum dan GG dan apa arti bilangan itu,jelaskan!

7/27/2019 ManeconMM
http://slidepdf.com/reader/full/maneconmm 82/119
Chapter Eight : Managing in competitive
7/27/2019 ManeconMM
http://slidepdf.com/reader/full/maneconmm 83/119
Chapter Eight : Managing in competitive, monopolistic and monopolistically competitive market.
Perfectly competitive market is market in which : (1) thereare many buyer and seller, (2) each firm produce ahomogeneous product, (3) buyer and seller have perfectinformation, (4) there are no transaction costs, and (5)there is free entry and exit.
Firm demand curve is the demand curve for an individualfirm’s product, in a perfectly competitive market it is simplythe market price.
Marginal revenue is the change in revenue attributable tothe last unit of output, for a competitive firm MR is themarket price.
Monopoly is market structure in which a single firm serves anentire market for a good that has no close substitutes

7/27/2019 ManeconMM
http://slidepdf.com/reader/full/maneconmm 84/119
entire market for a good that has no close substitutes.
Economies/diseconomies of scale exist whenever average totalcosts decline/increase as output increases.
Economies of scope exist when the total cost of producing two products within the same firm is lower than when the
products are produced by separate firms.
Cost complementarities exist when the marginal cost of producing
one output is reduced when the output of another product isincreased.
Deadweight loss of monopoly is the consumer and producersurplus that is loss due to the monopolist charging a price anexcess of marginal cost.
Monopolistically competitive market is a market in which (1) thereare many buyer and seller, (2) each firm produce differentiatedproduct and (3) there is free entry and exit.
Comparative advertising is a form advertising

7/27/2019 ManeconMM
http://slidepdf.com/reader/full/maneconmm 85/119
p g gwhere a firm attempts to increase the demand forits brand by differentiating its product fromcompeting brands.
Brand equity is the additional value added to aproduct because of its brand.
Niche marketing is a marketing strategy wheregoods and services tailored to meet the needs of a particular segment of the market.
Green marketing is a form of niche marketingwhere firms target products toward consumerswho are concerned about environmental issues.

7/27/2019 ManeconMM
http://slidepdf.com/reader/full/maneconmm 86/119
Principles.
1.The demand curve for e competitive firm’s product is ahorizontal line at a market price. The price is the competitivefirm’s marginal revenue. Df =P =MR
2.To maximize profits a perfectly competitive firm produce the
output at which price equals marginal cost in the range over whichmarginal cost is increasing : P = MC(Q)
3.To maximize short-run profits, a perfectly competitive firmshould produce in the range of increasing marginal cost where Pmore than or equal AVC. If P less than AVC, the firm should shutdown its plan to minimize losses.
4.The short-run supply curve for a perfectly competitive firm is itsmarginal cost curve above the minimum point on the AVC curve.

7/27/2019 ManeconMM
http://slidepdf.com/reader/full/maneconmm 87/119
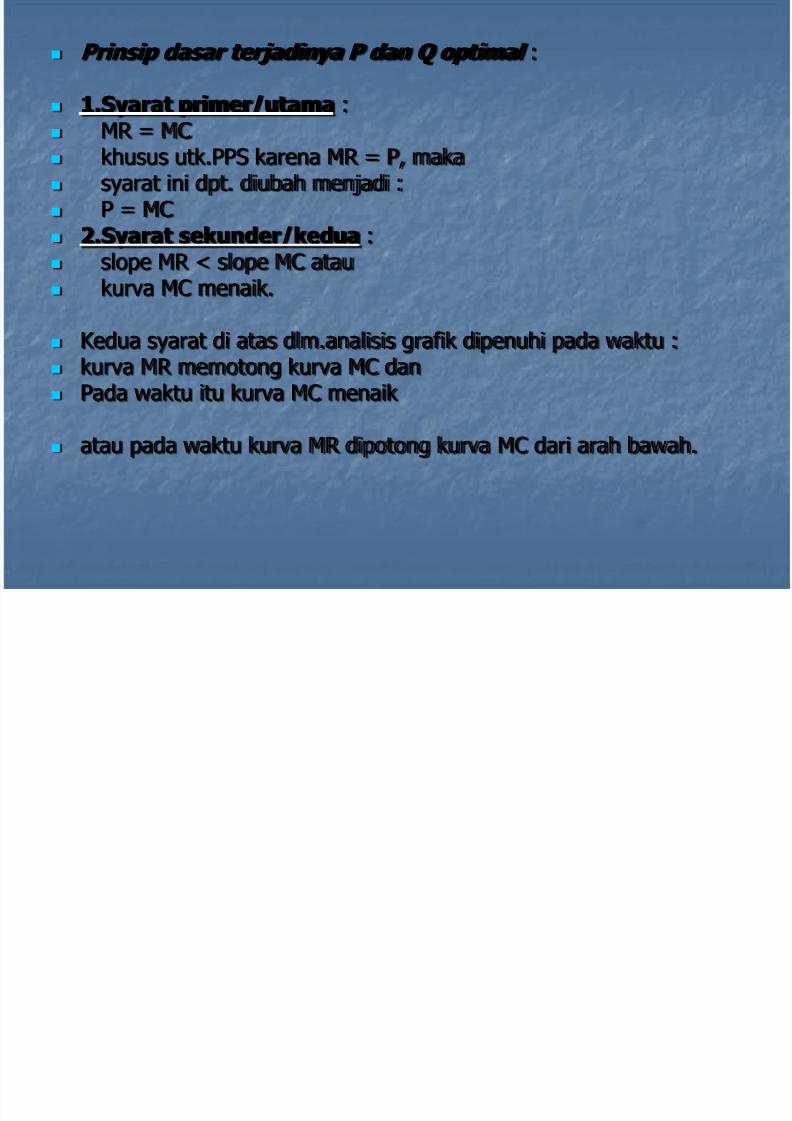
Prinsip dasar terjadinya P dan Q optimal :
7/27/2019 ManeconMM
http://slidepdf.com/reader/full/maneconmm 88/119
p j y Q p
1.Syarat primer/utama : MR = MC khusus utk.PPS karena MR = P, maka syarat ini dpt. diubah menjadi : P = MC 2.Syarat sekunder/kedua : slope MR < slope MC atau
kurva MC menaik.
Kedua syarat di atas dlm.analisis grafik dipenuhi pada waktu : kurva MR memotong kurva MC dan Pada waktu itu kurva MC menaik
atau pada waktu kurva MR dipotong kurva MC dari arah bawah.
Contoh 1.

7/27/2019 ManeconMM
http://slidepdf.com/reader/full/maneconmm 89/119
Diketahui dalam PPS produsen menghadapifungsi biaya secara total sbb.: C(Q) = 5 +Q2.Kalau diketahui harga pasar saat itu P = $20
per unit, maka menurut sdr berapa output harusdiproduksi supaya keuntungan maksimal danberapa keuntungan itu?
Contoh 2. Diketahui dalam PPS produsen menghadapi
fungsi biaya secara total sbb.:C(Q) =100 +Q2.Apabila di pasar produsen dapat menjualoutput sebesar $10 per unit, maka menurut sdrberapa output optimal dan berapa
keuntungan/kerugian yang diperoleh pada saatitu? Menurut sdr ia akan berproduksi/tidak, jelaskan!
Contoh 3.D l PM li t h d i f i

7/27/2019 ManeconMM
http://slidepdf.com/reader/full/maneconmm 90/119
Dalam PM, monopolist menghadapi fungsipermintaan pasar sbb.: P = 100 – 2Q sedangbiaya produksinya C(Q) =10 + 2Q
Menurut sdr.berapa jumlah produksi dan hargaper unit output harus ditetapkan agarkeuntungan produsen maksimal? Dan berapakeuntungan itu?
Contoh 4. Monopolist menghadapi fungsi permintaan pasar
P = 70 – 0,5Q dan untuk melayani pasar tsb. iamenggunakan 2 pabrik. Untuk memproduksi dipabrik 1, MC1 = 3Q1 sedang untuk meproduksi di
pabrik 2, MC2 = Q2. Menurut sdr. agarkeuntungan yang diperoleh produsen dari bisnistsb. maksimal berapa output harus diproduksi dimasing-masing pabrik dan output itu harus dijualpada tingkat harga berapa, jelaskan!
Contoh 5.

7/27/2019 ManeconMM
http://slidepdf.com/reader/full/maneconmm 91/119
Produsen di PPM. menghadapi fungsi permintaanpasar P = 100 – 2Q sedang fungsi biaya
produksinya C = 5 + 2Q. Menurut sdr berapaoutput harus diproduksi? Dan output itu harusdijual pada tingkat harga berapa agarkeuntungan produsen maksimal, dan berapakeuntungan itu! Jelaskan!
Contoh 6.
Sebuah perusahaan yang beroperasi di PPMmengetahui EQ,P = -10 sedang EQ,A = 0,2.
Menurut pendapat sdr. agar keuntungan yangdiperoleh produsen tsb. maksimal, maka berapapersen dari penerimaannya yang harus iakeluarkan untuk keperluan advertensi? Jelaskan!
Chapter Nine : Basic oligopoly model

7/27/2019 ManeconMM
http://slidepdf.com/reader/full/maneconmm 92/119
p g p y
Oligopoly is a market structure in which there are only afew firms, each of which is large relative to the total
industry.
Sweezy oligopoly is an industry in which (1) there are fewfirms serving many consumers, (2) firm producedifferentiated product and (3) each firm believe rivals willrespond to a price reduction but will not follow a price
increase and (4) barriers to entry exist.
Cournot oligopoly is an industry in which (1) there are fewfirms serving many consumers (2) firms produce eitherdifferentiated or homogenous products (3) each firmbelieves rival will hold their output constant if it changes its
output and (4) barriers to entry exist.
Pengantar Bab 9

7/27/2019 ManeconMM
http://slidepdf.com/reader/full/maneconmm 93/119
Dalam bab ini akan dibahas secara detail bagaimana dlm.strukturpasar oligopoli manager seharusnya menentukan harga, jumlahproduksi, R&D dan advertensi agar perusahaaannya optimal.
Dalam struktur pasar oligopoli ini karena produsen hanya adabeberapa buah dan skala usaha mrk.cukup besar sehinggamrk.mendominasi pasar, maka akibatnya mereka akan merasasangat tergantung satu dengan yg.lain (Mutual RecognitionDependency).
Krn.mereka saling tergantung tindakan yg.dilakukan oleh satupersh.selain dampaknya ia rasakan sendiri, juga akan dirasakanoleh persh.yg.lain.
Dlm.struktur pasar ini tdk.ada model yg.berlaku secara umum(krn.bagaimana respon persh.lain terhadap policy yg.diambil satu
persh sangat tergantung pada asumsi yg.ada). Dan dlm.bab iniakan dibahas model-model pasar oligopoli yg.standard/baku yaitu: Cournot, Sweezy, Stackelberg dan Bertrand.
Classical oligopoly models (RMD) :

7/27/2019 ManeconMM
http://slidepdf.com/reader/full/maneconmm 94/119
g p y ( )
A.Non-collusive model :
1.Sweezy (KDC) model 2.Cournot (RC) model
3.Stackelberg (L-F) model
4.Bertrand (PW) model
B.Collusive-model :
1.Cartel model 2.The basing point price system model

7/27/2019 ManeconMM
http://slidepdf.com/reader/full/maneconmm 95/119
Bertrand oligopoly is an industry in which (1)th f fi i (2)

7/27/2019 ManeconMM
http://slidepdf.com/reader/full/maneconmm 96/119
there are few firms serving many consumers (2)firms produce identical products at a constantmarginal cost (3) firms compete in price and reactoptimally to competitor’s price (4) consumershave perfect information and there are notransaction cost and (5) barriers to entry exist.
Contestable market is a market in which (1) allfirms have access to the same technology (2)consumers respond quickly to price changes (3)existing firms can not respond quickly to entry bylowering their prices and (4) there are no sunk
cost.
Comparing oligopoly models.

7/27/2019 ManeconMM
http://slidepdf.com/reader/full/maneconmm 97/119
Diketahui fungsi permintaan pasar : P = 1000 – (Q1+Q2) sedang fungsibiaya masing-masing perusahaan: Ci(Qi) = 4Qi , sehingga MC perusahaan= 4
Pertanyaan: berapa Q dan P harus ditentukan supaya keuntunganperusahaan maksimal?
1.Model Cournot. Profit = [1000-(Q1+Q2)]Qi-4Qi Reaction curve function is: Q1 = r1(Q2) = 498-0,5Q2 dan Q2 = r2(Q1) = 498-0,5Q1 Dengan substitusi diketahui Q1=Q2=332 sehingga total output=664 dan
P=$336 serta perusahaan masing-masing memperoleh keuntungan$110.224
2.Model Bertrand. Output leader’s firm is Q1=(a+c2-2c1)/2b=[1000+4-2(4)]/2=498 sedang follower: Q2=r2(Q1)=[(a-c2)/2b]-0,5Q1=[(1000-4)/2]-0,5(498)=249 Output total (Q)=747 dijual dengan harga,P=$253 keuntungan leader’s
firms =$124.002 dan keuntungan follower’s firm =$62.001
3.Model Bertrand.

7/27/2019 ManeconMM
http://slidepdf.com/reader/full/maneconmm 98/119
Output optimal ditentukan P=MC yaitu 1000-Q =4 sehingga Q =996 karena di pasar ada 2
perusahaan yang simetris masing-masingmenghasilkan Q=498 dan masing-masingmenerima keuntungan $0
4.Model Collusion.
P = 1000 –Q; TR = 1000Q-Q2 ; MR = 1000-2Q
Output optimal ditentukan MR=MC sehingga1000-2Q=4 dan Q=498 dan P=$502 sertamasing-masing perusahaan untung $124.002
Komentar sdr. terhadap model-model inibagaimana?
Pengantar Bab 11

7/27/2019 ManeconMM
http://slidepdf.com/reader/full/maneconmm 99/119
Pada Bab 8 dan 9 sdh.dibahas bagaimana perilaku produsendi 4 struktur pasar, baik dlm.hal pricing,output,R&D dan
adverticing.
Pada Bab 11 berikut ini akan dibahas beberapakebijaksanaan penentuan harga (pricing) yg.hanya dapatdilakukan oleh produsen yg.memiliki “market power” saja,baik yg.bersifat basik sampai yg.sophisticated yg.tujuannya
utk.menambah keuntungan lebih banyak lagi yaitu dgn.carameminta kembali surplus konsumen baik sebagian atauseluruhnya.
Pricing policy yg.sophisticated tsb. ada 8 macam yaitu dariPrice discrimination policy sampai dengan Randomized
pricing policy.
Chapter Eleven: Pricing strategies for firms with k t

7/27/2019 ManeconMM
http://slidepdf.com/reader/full/maneconmm 100/119
market power.
Price discrimination is the practice of charging differentprices to consumers for the same good or service.
Two-part pricing is strategy in which consumers arecharged a fixed fee for the right to purchase a product, plusa per unit charge for each unit purchased.
Block pricing is pricing strategy in which identical productsare packaged together in order to enhance profits byforcing customers to make an all-or-none decision topurchase.
Commodity bundling is practice of bundling of severaldifferent products together and selling them at a singlebundle price.
Peak load pricing is pricing strategy in which higher pricesare charged during peak hours than during off-peak hours

7/27/2019 ManeconMM
http://slidepdf.com/reader/full/maneconmm 101/119
are charged during peak hours than during off-peak hours.
Cross-subsidy is pricing strategy in which profits gained
from the sale of one product are used to subsidize sales of related product.
Transfer pricing is pricing strategy in which a firm optimallysets the internal price at which an upstream division sell aninput to a downstream division.
Price matching is a strategy in which a firm advertises aprice and promise to match any lower price offered by acompetitor.
Randomized pricing is pricing strategy in which
intentionally varies its price in attempt to hide priceinformation from consumers and rivals.
Principles:
7/27/2019 ManeconMM
http://slidepdf.com/reader/full/maneconmm 102/119
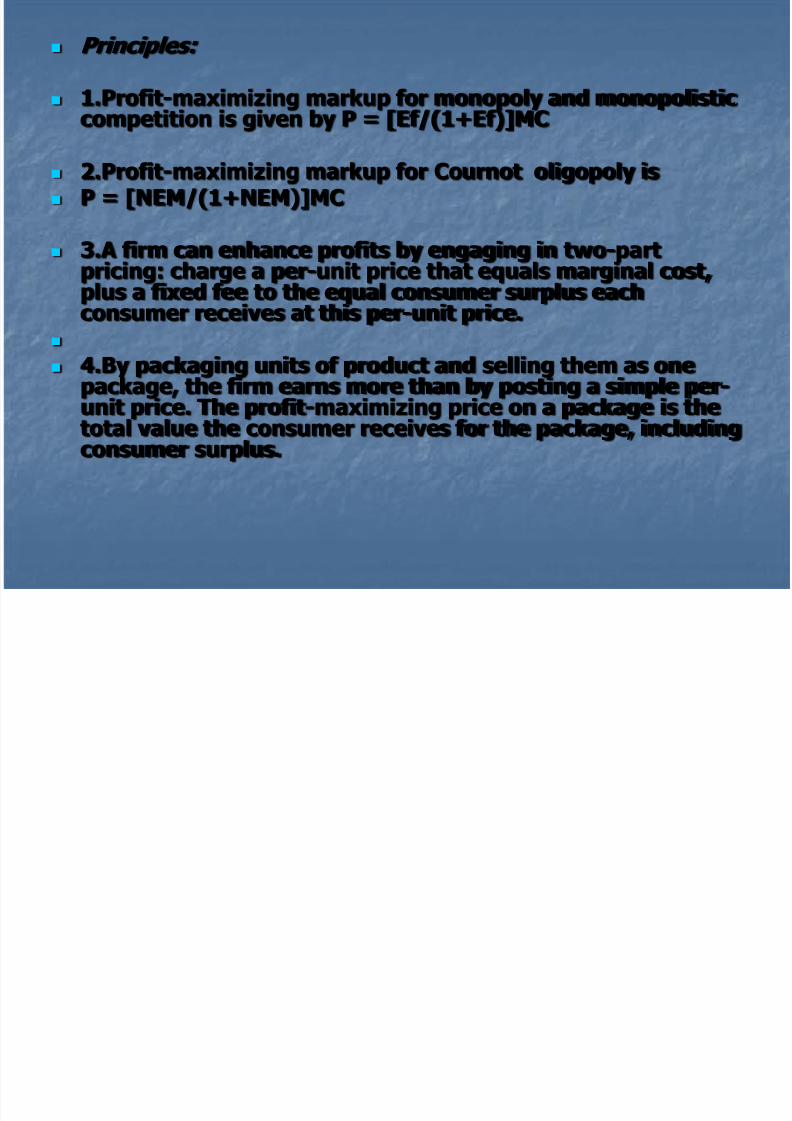
1.Profit-maximizing markup for monopoly and monopolisticcompetition is given by P = [Ef/(1+Ef)]MC
2.Profit-maximizing markup for Cournot oligopoly is P = [NEM/(1+NEM)]MC
3.A firm can enhance profits by engaging in two-partpricing: charge a per-unit price that equals marginal cost,
plus a fixed fee to the equal consumer surplus eachconsumer receives at this per-unit price. 4.By packaging units of product and selling them as one
package, the firm earns more than by posting a simple per-unit price. The profit-maximizing price on a package is the
total value the consumer receives for the package, includingconsumer surplus.
5.When demand is higher at some times of the day thanother times, a firm may enhance profits by peak-load

7/27/2019 ManeconMM
http://slidepdf.com/reader/full/maneconmm 103/119
, y p y ppricing: charge a higher price during peak time than ischarge during off-peak times.
6.Whenever the demand for two products produced by afirm are interrelated through costs or demand, the firm mayenhance profits by cross-subsidization: selling one productat or below cost and the other product above cost.
Contoh 1. Sebuah toko kelontong yang beroperasi di PPM, membeli
cola dari supplier dengan harga $1,25 per liter.Karena disekitar toko tsb.banyak terdapat toko sejenis makapermintaan produk itu diperkirakan sangat elastik dandiperkirakan angka elastistasnya -4.Untuk memaksimirkeuntungan menurut sdr. berapa toko tsb. harus
menetapkan harga jual cola? Jelaskan!
Formula:

7/27/2019 ManeconMM
http://slidepdf.com/reader/full/maneconmm 104/119
1.MR for a firm with market power. MR = P[(1+Ef)/Ef] di mana Ef=elastisitas harga Agar keuntungan maksimal yang harus dipenuhi adalah
MR=MC jadi P[(1+Ef)/Ef]=MC atau P=[Ef/(1+Ef)]MC dan bila Ef/(1+Ef) = K maka P=[K]MC
2.A calculus alternative: Q = ∑ Qi EM = dQ/dP.P/Q = df(P)/dP.P/Q Di mana Qi = f(P) – Q2 – Q3 – Q4 ----- QN di mana N adalah
the number of identical firms in the industry. Ef = dQ1/dP.P/Q1 = df(P)/dP.P/Q1 karena Q1 =Q/N Ef = df(P)/dP.PN/Q = NEM , atau Ef = NEM
Chapter Twelve: Economics of information

7/27/2019 ManeconMM
http://slidepdf.com/reader/full/maneconmm 105/119
C apte e e co o cs o o at o
Mean (expected value) is the sum of the probabilities thatdifferent outcomes will occur multiplied by the resulting payoffs.
Variance is the sum of the probabilities that different outcomeswill occur multiplied by the squared deviations from the mean of the random variable.
Standard deviation is the square root of the variance.
Risk averse is preferring a sure amount of $M to a risky prospectwith an expected value of $M.
Risk loving is preferring a risky prospect with an expected value of $M to a sure amount of $M.
Risk neutral is indifferent between a risky prospect with anexpected value of $M and a sure amount of $M.
In a Cournot duopoly, each firm believes

7/27/2019 ManeconMM
http://slidepdf.com/reader/full/maneconmm 106/119
In a Cournot duopoly, each firm believes the other will hold its output constant as it
own output. Therefore, the profit maximizing output level for firm 1 depends on firm 2’s output. Each firm will
adjust its profit maximizing output level until the point where the two firms reaction’s function are equal.
Reservation price is the price at which aconsumer is indifferent between purchasing at

7/27/2019 ManeconMM
http://slidepdf.com/reader/full/maneconmm 107/119
consumer is indifferent between purchasing atthat price and searching for a lower price.
Asymmetric information is a situation that existswhen some people have better information thanothers.
Hidden characteristics is a things one party to atransaction knows about itself but which areunknown by the other party.
Hidden action is an action taken by one party in arelationship that cannot be observed by the otherparty.
Adverse selection is a situation where individuals havehidden characteristic in which a selection process results ina pool of individuals with undesirable characteristic

7/27/2019 ManeconMM
http://slidepdf.com/reader/full/maneconmm 108/119
a pool of individuals with undesirable characteristic.
Moral hazard is a situation where one party to a contract
takes a hidden action that benefits him or her at theexpense of another party.
Signaling is an attempt by an informed party to send anobservable indicator of his or her hidden characteristic to anuninformed party.
Screening is an attempt by an uninformed party to sortindividuals according to their characteristic.
Self-selection device is a mechanism in which informedparties are presented with a set options, and the optionsthey choose reveal their hidden characteristics to anuninformed party.
English auction is an ascending sequential-bidauction in which bidders observe the bids of
7/27/2019 ManeconMM
http://slidepdf.com/reader/full/maneconmm 109/119
auction in which bidders observe the bids of others and decide whether or not to increase thebid. The auction ends when a single bidder
remains; this bidder obtains the item and paysthe auctioneer the amount of the bid.
First-price, sealed-bid auction is a simultaneousmove auction in which bidders simultaneously
submit bids on pieces of paper. The auctioneerawards the item to the high bidder, who pays theamount bid.
Second-price, sealed-bid auction is a
simultaneous move auction in which bidderssimultaneously submit bids. The auctioneerawards the item to the high bidder, who pays theamount bid by the second-highest bidder.
Dutch auction is a descending sequential-bid auction inwhich the auctioneer begin with a high asking price and

7/27/2019 ManeconMM
http://slidepdf.com/reader/full/maneconmm 110/119
which the auctioneer begin with a high asking price andgradually reduces the asking price until one bidderannounces a willingness to pay that price for the item.
Independent private values is auction environment in whicheach bidder knows his own valuation of the item but doesnot know how other bidders’ valuation and in which eachbidder’s valuation does not depend on other bidders’ valuation of the object.
Affiliated (correlated) value estimates is auctionenvironment in which bidder does not know their ownvaluation of the item or the valuation of others. Each bidderuses his or her own information to estimate their valuationand these value estimate are affiliated. The higher abidder’s value estimate, the more likely it is that other
bidders also have high value estimate.
Common value is auction environment in

7/27/2019 ManeconMM
http://slidepdf.com/reader/full/maneconmm 111/119
which the item is the same for all bidders,but this common value is unknown. Biddereach use their own (private) informationto form an estimate of the item’s truecommon value.
Winner’s curse is the “bad news” conveyedto the winner that his or her estimate of the item’s value exceeds the estimate of
all other bidders.
Principles:

7/27/2019 ManeconMM
http://slidepdf.com/reader/full/maneconmm 112/119
1.The optimal search rule is such that the consumers rejectsprices above the reservation price (R) and accepts prices
below the reservation price. Stated differently, the optimalsearch strategy is to search for a better price when the pricecharged by a firm is above the reservation price and stopwhen a price below the reservation price is found.
2.The Dutch and first-price, sealed-bid auctions arestrategically equivalent, that is the optimal bids byparticipants are identical for both types of auctions.
3.A player’s optimal bidding strategy in an English auctionwith independent, private valuations is to remain activeuntil the price exceeds his or her own valuation of theobject.
4.In a second-price, sealed-bid auction with independentprivate values, a player’s optimal strategy is to bid his or

7/27/2019 ManeconMM
http://slidepdf.com/reader/full/maneconmm 113/119
p , p y p gyher own valuation of the item. In fact, this is a dominantstrategy.
5.In a first-price, sealed-bid auction with independentprivate value, a bidder’s optimal strategy is to bid less thathis or her valuation of the item. If there are n bidders whoall perceive valuation to be evenly (uniformly) distributedbetween a lowest possible valuation of L and highest of Hthen the optimal bid for player whose own valuation is v
given by: b = v- [(v=L)/n]
6.In a common-value auction, the winner is the bidder whois the most optimistic about the true value of the item. Toavoid the winner’s curse, a bidder should revise downwardhis or her private estimate of the value to account for his
fact.
Chapter Thirteen: Advanced Topics in Business Strategy

7/27/2019 ManeconMM
http://slidepdf.com/reader/full/maneconmm 114/119
Business Strategy
Limit pricing is strategy where anincumbent maintains a price below themonopoly level in order to prevent entry.
Learning curve effects exists when a firmenjoys lower costs due to knowledgegained from its past production decision.
Predatory pricing is strategy where a firmtemporarily prices below its marginal costto drive competitors out of the market.
Raising rival’s costs is strategy in which a firmgains an advantage over competitors by

7/27/2019 ManeconMM
http://slidepdf.com/reader/full/maneconmm 115/119
gains an advantage over competitors byincreasing their costs.
Vertical foreclosure is strategy wherein avertically integrated firm charges downstreamrivals a prohibitive price for an essential input,thus forcing rivals to use more costly substitutesor go out of business.
Price-cost squeeze is a tactic used by a verticallyintegrated firm to squeeze the margins of itscompetitors.
Direct network externality is the direct valueenjoyed by the user of network because othersalso use the network.
Indirect network externality (network complementarities)is the indirect value enjoyed by the user of e network

7/27/2019 ManeconMM
http://slidepdf.com/reader/full/maneconmm 116/119
j y ybecause of complementarities between the size of anetwork and the availability of complementary products orservices.
Penetration pricing is charging a low price initially topenetrate a market and gain a critical mass of customers,useful when strong network effects are present.
Principles: 1.In order for limit pricing to effectively prevent entry by
rational competitors, the pre-entry price must be linked tothe post-entry profits of potential entrants.
2.A two-way network linking n users provide n(n-1)
potential connection services. If one new user joins thenetwork, all of the existing users directly benefit becausethe new user adds 2n potential connection services to thenetwork.
Chapter Fourteen : Manager’s Guide to Government in the Marketplace.

7/27/2019 ManeconMM
http://slidepdf.com/reader/full/maneconmm 117/119
Government in the Marketplace.
Market power is the ability of a firm to setits price above marginal cost.
Antitrust policy is government policiesdesigned to keep firms from monopolizingtheir markets.
Negative externalities exists when costsborne by parties who are not involved inthe production or consumption of a good.
Public good is a good that is non-rival and

7/27/2019 ManeconMM
http://slidepdf.com/reader/full/maneconmm 118/119
non-exclusionary in consumption.
A good is non-rival in consumption if theconsumption of the good by one persondoes not preclude other people from also
consuming the good.
A good is non-exclusionary consumption if
one provided, no one can be excludedfrom consuming it.
Rent seeking is selfishly motivated efforts toinfluence another party’s decision.

7/27/2019 ManeconMM
http://slidepdf.com/reader/full/maneconmm 119/119
influence another party s decision.
Quota is restriction that limits the quantity of imported goods that can legally enter thecountry.
Lump-sum tariff is a fixed fee that an importing
firm must pay the domestic government in orderto have the legal right to sell the product in thedomestic market.
Per-unit (excise) tariff is the fee an importing firmmust pay to the domestic government on eachunit it brings into the country.