mandarin oriental international limiteddoc.irasia.com/listco/sg/mandarin/annual/2017/fs.pdfmandarin...
TRANSCRIPT
for the year ended 31st December 2017
Preliminary Financial Statements
MANDARIN ORIENTAL INTERNATIONAL LIMITED
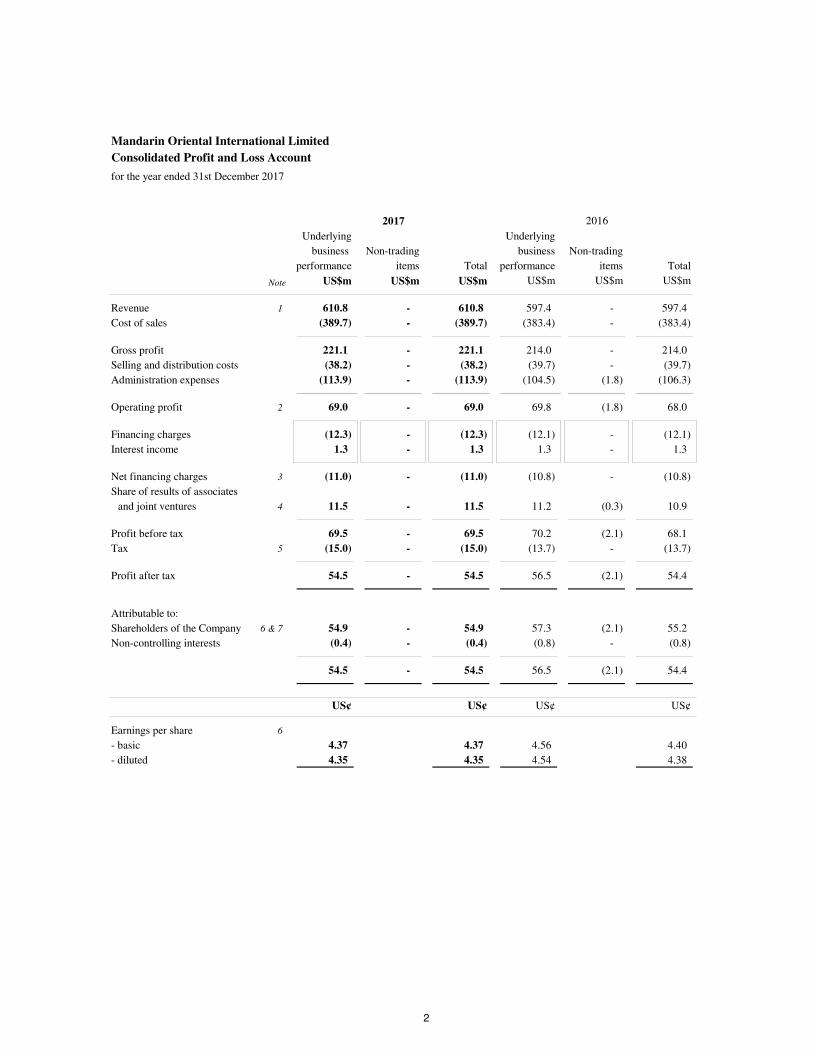
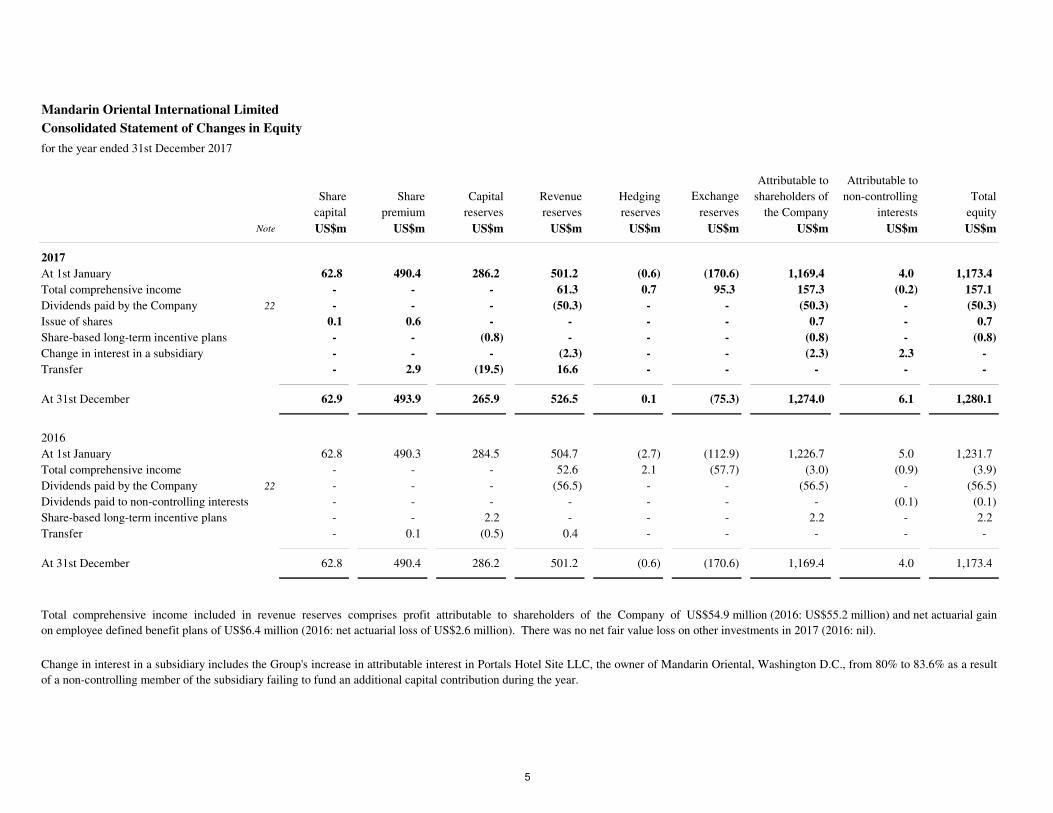
Mandarin Oriental International Limited
Consolidated Profit and Loss Account
for the year ended 31st December 2017
Underlying Underlying
business Non-trading business Non-trading
performance items Total performance items Total
Note US$m US$m US$m US$m US$m US$m
Revenue 1 610.8 - 610.8 597.4 - 597.4
Cost of sales (389.7) - (389.7) (383.4) - (383.4)
Gross profit 221.1 - 221.1 214.0 - 214.0
Selling and distribution costs (38.2) - (38.2) (39.7) - (39.7)
Administration expenses (113.9) - (113.9) (104.5) (1.8) (106.3)
Operating profit 2 69.0 - 69.0 69.8 (1.8) 68.0
Financing charges (12.3) - (12.3) (12.1) - (12.1)
Interest income 1.3 - 1.3 1.3 - 1.3
Net financing charges 3 (11.0) - (11.0) (10.8) - (10.8)
Share of results of associates
and joint ventures 4 11.5 - 11.5 11.2 (0.3) 10.9
Profit before tax 69.5 - 69.5 70.2 (2.1) 68.1
Tax 5 (15.0) - (15.0) (13.7) - (13.7)
Profit after tax 54.5 - 54.5 56.5 (2.1) 54.4
Attributable to:
Shareholders of the Company 6 & 7 54.9 - 54.9 57.3 (2.1) 55.2
Non-controlling interests (0.4) - (0.4) (0.8) - (0.8)
54.5 - 54.5 56.5 (2.1) 54.4
US¢ US¢ US¢ US¢
Earnings per share 6
- basic 4.37 4.37 4.56 4.40
- diluted 4.35 4.35 4.54 4.38
20162017
2

2017 2016
Note US$m US$m
Profit for the year 54.5 54.4
Other comprehensive income/(expense)
Items that will not be reclassified to profit or loss:
Remeasurements of defined benefit plans 12 7.7 (3.1)
Tax on items that will not be reclassified 5 (1.2) 0.5
6.5 (2.6)
Items that may be reclassified subsequently to profit or loss:
Net exchange translation differences
- net gains/(losses) arising during the year 87.1 (56.1)
Cash flow hedges
- net gains arising during the year 0.8 2.5
Tax relating to items that may be reclassified 5 (0.2) (0.4)
Share of other comprehensive income/(expense) of associates
and joint ventures 8.4 (1.7)
96.1 (55.7)
Other comprehensive income/(expense) for the year, net of tax 102.6 (58.3)
Total comprehensive income/(expense) for the year 157.1 (3.9)
Attributable to:
Shareholders of the Company 157.3 (3.0)
Non-controlling interests (0.2) (0.9)
157.1 (3.9)
Consolidated Statement of Comprehensive Income
for the year ended 31st December 2017
Mandarin Oriental International Limited
3
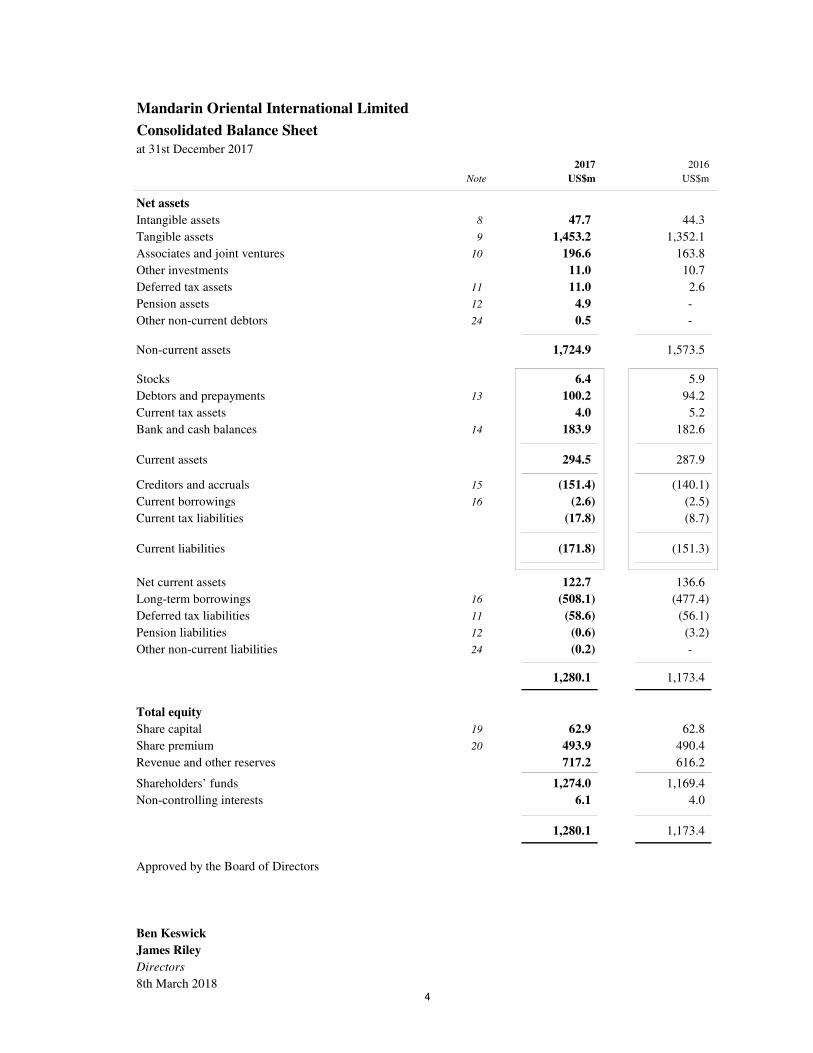
2017 2016
Note US$m US$m
Net assets
Intangible assets 8 47.7 44.3
Tangible assets 9 1,453.2 1,352.1
Associates and joint ventures 10 196.6 163.8
Other investments 11.0 10.7
Deferred tax assets 11 11.0 2.6
Pension assets 12 4.9 -
Other non-current debtors 24 0.5 -
Non-current assets 1,724.9 1,573.5
Stocks 6.4 5.9
Debtors and prepayments 13 100.2 94.2
Current tax assets 4.0 5.2
Bank and cash balances 14 183.9 182.6
Current assets 294.5 287.9
Creditors and accruals 15 (151.4) (140.1)
Current borrowings 16 (2.6) (2.5)
Current tax liabilities (17.8) (8.7)
Current liabilities (171.8) (151.3)
Net current assets 122.7 136.6
Long-term borrowings 16 (508.1) (477.4)
Deferred tax liabilities 11 (58.6) (56.1)
Pension liabilities 12 (0.6) (3.2)
Other non-current liabilities 24 (0.2) -
1,280.1 1,173.4
Total equity
Share capital 19 62.9 62.8
Share premium 20 493.9 490.4
Revenue and other reserves 717.2 616.2
Shareholders’ funds 1,274.0 1,169.4
Non-controlling interests 6.1 4.0
1,280.1 1,173.4
Approved by the Board of Directors
Ben Keswick
James Riley
Directors
8th March 2018
Mandarin Oriental International Limited
Consolidated Balance Sheetat 31st December 2017
4
Mandarin Oriental International Limited
Consolidated Statement of Changes in Equity
for the year ended 31st December 2017
Attributable to Attributable to
Share Share Capital Revenue Hedging Exchange shareholders of non-controlling Total
capital premium reserves reserves reserves reserves the Company interests equity
Note US$m US$m US$m US$m US$m US$m US$m US$m US$m
2017
At 1st January 62.8 490.4 286.2 501.2 (0.6) (170.6) 1,169.4 4.0 1,173.4
Total comprehensive income - - - 61.3 0.7 95.3 157.3 (0.2) 157.1
Dividends paid by the Company 22 - - - (50.3) - - (50.3) - (50.3)
Issue of shares 0.1 0.6 - - - - 0.7 - 0.7
Share-based long-term incentive plans - - (0.8) - - - (0.8) - (0.8)
- - - (2.3) - - (2.3) 2.3 -
Transfer - 2.9 (19.5) 16.6 - - - - -
At 31st December 62.9 493.9 265.9 526.5 0.1 (75.3) 1,274.0 6.1 1,280.1
2016
At 1st January 62.8 490.3 284.5 504.7 (2.7) (112.9) 1,226.7 5.0 1,231.7
Total comprehensive income - - - 52.6 2.1 (57.7) (3.0) (0.9) (3.9)
Dividends paid by the Company 22 - - - (56.5) - - (56.5) - (56.5)
Dividends paid to non-controlling interests - - - - - - - (0.1) (0.1)
Share-based long-term incentive plans - - 2.2 - - - 2.2 - 2.2
Transfer - 0.1 (0.5) 0.4 - - - - -
At 31st December 62.8 490.4 286.2 501.2 (0.6) (170.6) 1,169.4 4.0 1,173.4
Total comprehensive income included in revenue reserves comprises profit attributable to shareholders of the Company of US$54.9 million (2016: US$55.2 million) and net actuarial gain
on employee defined benefit plans of US$6.4 million (2016: net actuarial loss of US$2.6 million). There was no net fair value loss on other investments in 2017 (2016: nil).
Change in interest in a subsidiary
Change in interest in a subsidiary includes the Group's increase in attributable interest in Portals Hotel Site LLC, the owner of Mandarin Oriental, Washington D.C., from 80% to 83.6% as a result
of a non-controlling member of the subsidiary failing to fund an additional capital contribution during the year.
5

2017 2016Note US$m US$m
Operating activities
Operating profit 2 69.0 68.0
Depreciation 9 56.7 57.7
Amortization of intangible assets 8 2.1 2.1
Other non-cash items 23a 0.2 2.7
Movements in working capital 23b 9.6 (3.8)
Interest received 1.3 1.3
Interest and other financing charges paid (12.3) (10.4)
Tax paid (13.3) (19.0)
113.3 98.6
Dividends and interest from associates and joint ventures 6.6 9.1
Cash flows from operating activities 119.9 107.7
Investing activities
Purchase of tangible assets (82.6) (77.0)
Purchase of intangible assets (5.7) (2.7)
Payment on Munich expansion 23c (3.1) -
Acquisition of Mandarin Oriental, Boston 23d - (140.0)
Purchase of other investments (0.9) (1.3)
Advance to associates and joint ventures 23e (11.4) (2.8)
Repayment of loans to associates and joint ventures 23f 1.3 0.9
Sale of tangible assets - 0.1
Sale of other investments 0.4 -
Cash flows from investing activities (102.0) (222.8)
Financing activities
Issue of shares 0.6 -
Drawdown of borrowings 16 30.8 51.5
Repayment of borrowings 16 (2.5) (1.6)
Dividends paid by the Company 22 (50.3) (56.5)
Dividends paid to non-controlling interests - (0.1)
Cash flows from financing activities (21.4) (6.7)
Net decrease in cash and cash equivalents (3.5) (121.8)
Cash and cash equivalents at 1st January 182.5 308.6
Effect of exchange rate changes 4.9 (4.3)
Cash and cash equivalents at 31st December 23g 183.9 182.5
Mandarin Oriental International Limited
Consolidated Cash Flow Statement
for the year ended 31st December 2017
6

Mandarin Oriental International Limited
Principal Accounting Policies
A Basis of preparation
The financial statements have been prepared in accordance with International Financial Reporting Standards
(‘IFRS’), including International Accounting Standards (‘IAS’) and Interpretations adopted by the International
Accounting Standards Board. The financial statements have been prepared on a going concern basis and under
the historical cost convention except as disclosed in the accounting policies below.
The new hedge accounting rules will align the accounting for hedging instruments closely with the Group’s risk
management practices. The Group does not expect a significant impact on the accounting for its hedging
relationships.
A number of new standards and amendments, which are effective for accounting periods beginning after 2017,
have been published and will be adopted by the Group from their effective dates. The Group’s assessment of the
impact of these standards and amendments is set out below.
IFRS 15 Revenue from Contracts with Customers (effective from 1st January 2018)
The standard establishes a comprehensive framework for the recognition of revenue. It replaces IAS 11
‘Construction Contracts’ and IAS 18 ‘Revenue’ which covers contracts for good and services. The core
principle in the framework is that revenue is recognized when control of a good or service transfers to a
customer. Based on the Group’s assessment, the impact of IFRS 15 on the Group’s businesses is expected to be
insignificant.
Notes to the Financial Statements
There are no new standards or amendments, which are effective in 2017 and relevant to the Group’s operations,
that have a material impact on the Group’s accounting policies and disclosures.
IFRS 9 Financial Instruments (effective from 1st January 2018)
The standard replaces IAS 39 ‘Financial Instruments: Recognition and Measurement’, addresses the
classification, measurement and derecognition of financial assets and liabilities, and includes a new expected
credit losses model for financial assets that replaces the incurred loss impairment model used today. A
substantially-reformed approach to hedging accounting is introduced.
New standards and amendments effective after 2017 which are relevant to the Group’s operations and yet to be
adopted:
The Group does not expect the new guidance to have a significant impact on the classification and measurement
of its financial assets and financial liabilities. At 31st December 2017, the Group had investments in equity
securities classified as available-for-sale with a fair value of US$9.3 million. Under IFRS 9, the gains and losses
arising from changes in fair value of these investments will be recognized in profit and loss, instead of through
other comprehensive income. Such fair value gains or losses on revaluation of these investments will be
classified as non-trading items. The above change will not have any impact on the Group’s underlying profit
attributable to shareholders and shareholders’ funds. Based on the assessments undertaken to date, the impact
from the new loan impairment model to the Group’s impairment provisions and earnings is expected to be
insignificant.
7

Mandarin Oriental International Limited
Principal Accounting Policies continued
A Basis of preparation continued
B Basis of consolidation
i)
ii)
Notes to the Financial Statements continued
The consolidated financial statements include the financial statements of the Company, its subsidiaries, and
the Group’s interests in associates and joint ventures.
A subsidiary is an entity over which the Group has control. The Group controls an entity when the Group is
exposed to, or has rights to, variable returns from its involvement with the entity and has the ability to affect
those returns through its power over the entity.
The purchase method of accounting is used to account for the acquisition of subsidiaries by the Group. The
cost of an acquisition includes the fair value at the acquisition date of any contingent consideration. The
Group recognizes the non-controlling interest’s proportionate share of the recognized identifiable net assets
of the acquired subsidiary. In a business combination achieved in stages, the Group remeasures its
previously held interest in the acquiree at its acquisition-date fair value and recognizes the resulting gain or
loss in profit and loss. Changes in a parent’s ownership interest in a subsidiary that do not result in the loss
of control are accounted for as equity transactions. When control over a previous subsidiary is lost, any
remaining interest in the entity is remeasured at fair value and the resulting gain or loss is recognized in
profit and loss.
All material intercompany transactions, balances and unrealized surpluses and deficits on transactions
between Group companies have been eliminated. The cost of and related income arising from shares held in
the Company by subsidiaries are eliminated from shareholders’ funds and non-controlling interests, and
profit, respectively.
IFRS 16 Leases (effective from 1st January 2019)
The standard replaces IAS 17 ‘Leases’ and related interpretations. It will result in lessees bringing almost all
their leases onto the balance sheet as the distinction between operating leases and finance leases is removed.
The model requires a lessee to recognize a right-of-use asset and a lease liability, except for leases with a term of
less than 12 months or with low-value. The accounting for lessors will not change significantly. IFRS 16 will
affect primarily the accounting for the Group’s operating leases. As at 31st December 2017, the Group had total
commitments under operating leases of US$107.6 million (refer note 25).
The principal operating subsidiaries, associates and joint ventures have different functional currencies in line
with the economic environments of the locations in which they operate. The functional currency of the
Company is United States dollars. The consolidated financial statements are presented in United States dollars.
The Group’s reportable segments are set out in note 1.
Apart from the above, there are no other standards or amendments that are not yet effective and that would be
expected to have a material impact to the Group.
The Group is currently finalizing the detailed assessment on its lease portfolio and at the date of this report, it is
therefore not yet possible to estimate the amount of right-of-use assets and lease liabilities that will have to be
recognized on adoption of the new standard and how this may affect the Group’s profit or loss and classification
of cash flows going forward.
8
Mandarin Oriental International Limited
Principal Accounting Policies continued
B Basis of consolidation continued
iii)
iv)
v)
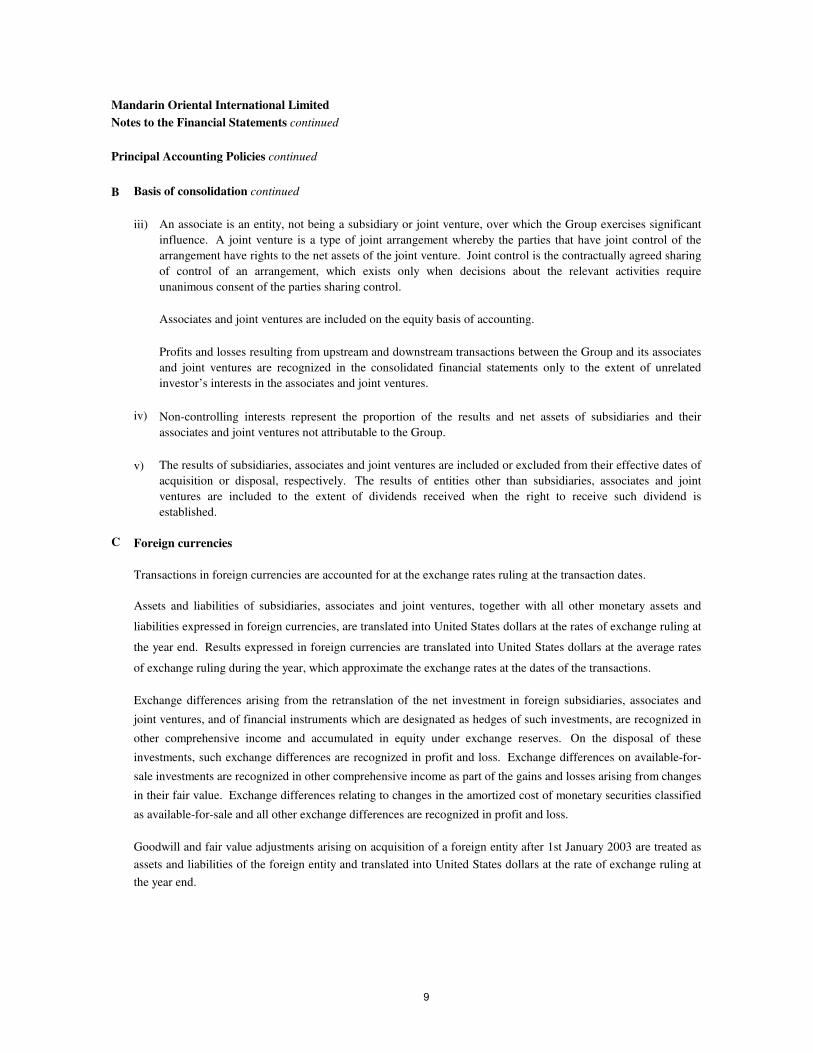
C Foreign currencies
Transactions in foreign currencies are accounted for at the exchange rates ruling at the transaction dates.
Notes to the Financial Statements continued
Assets and liabilities of subsidiaries, associates and joint ventures, together with all other monetary assets and
liabilities expressed in foreign currencies, are translated into United States dollars at the rates of exchange ruling at
the year end. Results expressed in foreign currencies are translated into United States dollars at the average rates
of exchange ruling during the year, which approximate the exchange rates at the dates of the transactions.
Exchange differences arising from the retranslation of the net investment in foreign subsidiaries, associates and
joint ventures, and of financial instruments which are designated as hedges of such investments, are recognized in
other comprehensive income and accumulated in equity under exchange reserves. On the disposal of these
investments, such exchange differences are recognized in profit and loss. Exchange differences on available-for-
sale investments are recognized in other comprehensive income as part of the gains and losses arising from changes
in their fair value. Exchange differences relating to changes in the amortized cost of monetary securities classified
as available-for-sale and all other exchange differences are recognized in profit and loss.
Goodwill and fair value adjustments arising on acquisition of a foreign entity after 1st January 2003 are treated as
assets and liabilities of the foreign entity and translated into United States dollars at the rate of exchange ruling at
the year end.
An associate is an entity, not being a subsidiary or joint venture, over which the Group exercises significant
influence. A joint venture is a type of joint arrangement whereby the parties that have joint control of the
arrangement have rights to the net assets of the joint venture. Joint control is the contractually agreed sharing
of control of an arrangement, which exists only when decisions about the relevant activities require
unanimous consent of the parties sharing control.
Non-controlling interests represent the proportion of the results and net assets of subsidiaries and their
associates and joint ventures not attributable to the Group.
The results of subsidiaries, associates and joint ventures are included or excluded from their effective dates of
acquisition or disposal, respectively. The results of entities other than subsidiaries, associates and joint
ventures are included to the extent of dividends received when the right to receive such dividend is
established.
Associates and joint ventures are included on the equity basis of accounting.
Profits and losses resulting from upstream and downstream transactions between the Group and its associates
and joint ventures are recognized in the consolidated financial statements only to the extent of unrelated
investor’s interests in the associates and joint ventures.
9

Mandarin Oriental International Limited
Principal Accounting Policies continued
D Impairment of non-financial assets
E Intangible assets
i) Goodwill represents the excess of the sum of the consideration transferred, the amount of any non-controlling
interests in the acquiree, and the acquisition-date fair value of any previously held equity interest in the
acquiree over the acquisition-date fair value of the Group’s share of the net identifiable assets acquired. Non-
controlling interests are measured at their proportionate share of the net identifiable assets at the acquisition
date. If the cost of acquisition is less than the fair value of the net assets acquired, the difference is
recognized directly in profit and loss. Goodwill on acquisitions of subsidiaries is included in intangible
assets. Goodwill on acquisitions of associates and joint ventures is included in investment in associates and
joint ventures. Goodwill is allocated to cash-generating units or groups of cash-generating units for the
purpose of impairment testing and is carried at cost less accumulated impairment loss.
The profit or loss on disposal of subsidiaries, associates and joint ventures is stated after deducting the
carrying amount of goodwill relating to the entity sold.
ii) Leasehold land represents payments to third parties to acquire short-term interests in property. These
payments are stated at cost and are amortized over the useful life of the lease which includes the renewal
period if the lease can be renewed by the Group without significant cost.
iii) Computer software represents acquired computer software licences which are capitalized on the basis of the
costs incurred to acquire and bring to use the specific software and are stated at cost less accumulated
amortization. Amortization is calculated on the straight line basis to allocate the cost over their estimated
useful lives.
iv) Development costs directly attributable to hotel projects under development, including borrowing costs,
which are capitalized to the extent that such expenditure is expected to generate future economic benefits and
upon completion of the project are included in non-current assets. Capitalized development costs are
amortized over the term of the management contracts.
Notes to the Financial Statements continued
Assets that have indefinite useful lives are not subject to amortization and are tested for impairment annually and
whenever there is an indication that the assets may be impaired. Assets that are subject to amortization are
reviewed for impairment whenever events or changes in circumstances indicate that the carrying amount may not
be recoverable. For the purpose of assessing impairment, assets are grouped at the lowest level for which there is
separately identifiable cash flows. Cash-generating units or groups of cash-generating units to which goodwill has
been allocated are tested for impairment annually and whenever there is an indication that the units may be
impaired. An impairment loss is recognized for the amount by which the carrying amount of the asset exceeds its
recoverable amount, which is the higher of an asset’s fair value less costs to sell and value in use. Non-financial
assets other than goodwill that suffered an impairment are reviewed for possible reversal of the impairment
annually.
10

Mandarin Oriental International Limited
Principal Accounting Policies continued
F Tangible fixed assets and depreciation
Freehold and long leasehold buildings 21 years to 150 years
Properties on leases with less than 20 years over unexpired period of lease
Surfaces, finishes and services of hotel properties 20 years to 30 years
Leasehold improvements 10 years or period of the lease
Leasehold land period of the lease
Plant and machinery 5 years to 15 years
Furniture, equipment and motor vehicles 3 years to 10 years
No depreciation is provided on freehold land as it is deemed to have an indefinite life.
The profit or loss on disposal of tangible fixed assets is recognized by reference to their carrying amount.
G Investments
i)
ii)
iii)
Notes to the Financial Statements continued
All purchases and sales of investments are recognized on the trade date, which is the date that the Group
commits to purchase or sell the investment.
Freehold land and buildings, and the building component of owner-occupied leasehold properties are stated at cost
less any accumulated depreciation and impairment. Long-term interests in leasehold land are classified as finance
leases and grouped under tangible assets if substantially all risks and rewards relating to the land have been
transferred to the Group, and are amortized over the useful life of the lease. Grants related to tangible assets are
deducted in arriving at the carrying amount of the assets. Other tangible fixed assets are stated at cost less amounts
provided for depreciation.
Depreciation of tangible fixed assets is calculated on the straight line basis to allocate the cost or valuation of each
asset to its residual value over its estimated useful life. The residual values and useful lives are reviewed at each
balance sheet date. The estimated useful lives are as follows:
Where the carrying amount of a tangible fixed asset is greater than its estimated recoverable amount, it is written
down immediately to its recoverable amount.
Investments are classified by management as available for sale or held to maturity on initial recognition.
Available-for-sale investments are shown at fair value. Gains and losses arising from changes in fair value
are recognized in other comprehensive income and accumulated in equity. On the disposal of an investment
or when an investment is determined to be impaired, the cumulative gain or loss previously deferred in equity
is recognized in profit and loss. Held-to-maturity investments are shown at amortized cost. Investments are
classified under non-current assets unless they are expected to be realized within 12 months after the balance
sheet date.
At each balance sheet date, the Group assesses whether there is objective evidence that an investment is
impaired. In the case of equity securities classified as available for sale, a significant or prolonged decline in
the fair value of the security below its cost is considered as an indicator that the securities are impaired and
are recognized in profit and loss.
11
Mandarin Oriental International Limited
Principal Accounting Policies continued
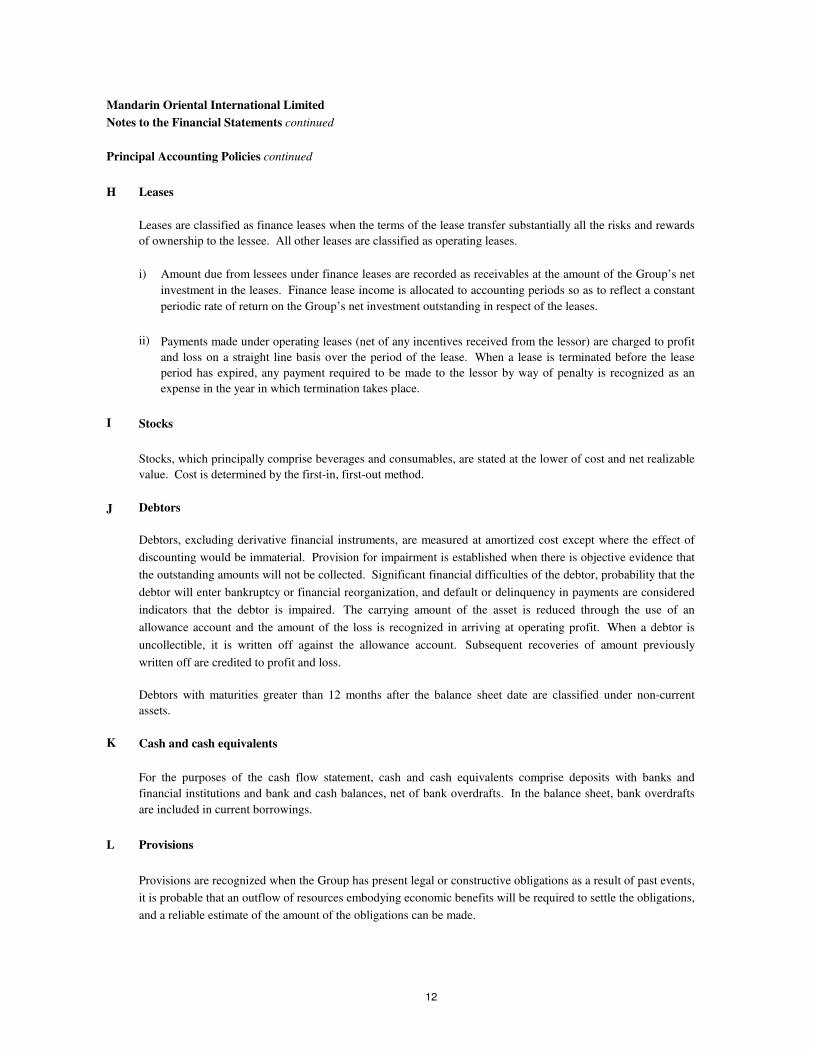
H Leases
i)
ii) Payments made under operating leases (net of any incentives received from the lessor) are charged to profit
and loss on a straight line basis over the period of the lease. When a lease is terminated before the lease
period has expired, any payment required to be made to the lessor by way of penalty is recognized as an
expense in the year in which termination takes place.
I Stocks
J Debtors
K
L
Notes to the Financial Statements continued
Amount due from lessees under finance leases are recorded as receivables at the amount of the Group’s net
investment in the leases. Finance lease income is allocated to accounting periods so as to reflect a constant
periodic rate of return on the Group’s net investment outstanding in respect of the leases.
Leases are classified as finance leases when the terms of the lease transfer substantially all the risks and rewards
of ownership to the lessee. All other leases are classified as operating leases.
Debtors with maturities greater than 12 months after the balance sheet date are classified under non-current
assets.
Provisions
Cash and cash equivalents
Provisions are recognized when the Group has present legal or constructive obligations as a result of past events,
it is probable that an outflow of resources embodying economic benefits will be required to settle the obligations,
and a reliable estimate of the amount of the obligations can be made.
For the purposes of the cash flow statement, cash and cash equivalents comprise deposits with banks and
financial institutions and bank and cash balances, net of bank overdrafts. In the balance sheet, bank overdrafts
are included in current borrowings.
Stocks, which principally comprise beverages and consumables, are stated at the lower of cost and net realizable
value. Cost is determined by the first-in, first-out method.
Debtors, excluding derivative financial instruments, are measured at amortized cost except where the effect of
discounting would be immaterial. Provision for impairment is established when there is objective evidence that
the outstanding amounts will not be collected. Significant financial difficulties of the debtor, probability that the
debtor will enter bankruptcy or financial reorganization, and default or delinquency in payments are considered
indicators that the debtor is impaired. The carrying amount of the asset is reduced through the use of an
allowance account and the amount of the loss is recognized in arriving at operating profit. When a debtor is
uncollectible, it is written off against the allowance account. Subsequent recoveries of amount previously
written off are credited to profit and loss.
12

Mandarin Oriental International Limited
Principal Accounting Policies continued
M Borrowings and borrowing costs
N Government grants
O
Notes to the Financial Statements continued
Provision for deferred tax is made on the revaluation of certain non-current assets and, in relation to
acquisitions, on the difference between the fair value of the net assets acquired and their tax base. Deferred tax
is provided on temporary differences associated with investments in subsidiaries, associates and joint ventures,
except where the Group is able to control the reversal of the temporary difference and it is probable that the
temporary difference will not reverse in the foreseeable future. Deferred tax assets relating to the carry forward
of unused tax losses are recognized to the extent that it is probable that future taxable profit will be available
against which the unused tax losses can be utilized.
Borrowings are initially recognized at fair value, net of transaction costs incurred. In subsequent periods,
borrowings are stated at amortized cost using the effective interest method.
Grants relating to the development of hotel property are deducted in arriving at the carrying amount of the hotel
property.
Current and deferred tax
The current income tax charge is calculated on the basis of the tax laws enacted or substantively enacted at the
balance sheet date in the countries where the Group operates and generates taxable income. Management
periodically evaluates positions taken in tax returns with respect to situations in which applicable tax regulation
is subject to interpretation. It establishes provisions where appropriate on the basis of amounts expected to be
paid to the tax authorities.
Deferred tax is provided, using the liability method, for all temporary differences arising between the tax bases
of assets and liabilities and their carrying values. Deferred tax is determined using tax rates and laws that have
been enacted or substantially enacted by the balance sheet date and are expected to apply when the related
deferred tax asset is realized or the deferred tax liability is settled.
The tax expense for the year comprises current and deferred tax. Tax is recognized in profit and loss, except to
the extent that it relates to items recognized in other comprehensive income or direct in equity. In this case, the
tax is also recognized in other comprehensive income or directly in equity, respectively.
Grants from governments are recognized at their fair value when there is reasonable assurance that the grant
will be received and the Group will comply with all attached conditions.
Borrowing costs relating to major development projects are capitalized until the asset is substantially
completed. Capitalized borrowing costs are included as part of the cost of the asset. All other borrowing costs
are expensed as incurred.
Borrowings are classified as current liabilities unless the Group has an unconditional right to defer settlement
of the liability for at least 12 months after the balance sheet date.
13

Mandarin Oriental International Limited
Principal Accounting Policies continued
P Employee benefits
i) Pension obligations
The Group operates a number of defined benefit and defined contribution plans, the assets of which are
held in trustee administered funds.
Pension accounting costs for defined benefit plans are assessed using the projected unit credit method.
Under this method, the costs of providing pensions are charged to profit and loss spreading the regular cost
over the service lives of employees in accordance with the advice of qualified actuaries, who carry out a
full valuation of major plans every year. The pension obligations are measured as the present value of the
estimated future cash outflows by reference to market yields on high quality corporate bonds which have
terms to maturity approximating the terms of the related liability. Plan assets are measured at fair value.
Actuarial gains and losses arising from experience adjustments and changes in actuarial assumptions are
recognized in other comprehensive income in the year in which they occur.
Past service costs are recognized immediately in profit and loss.
The Group’s total contributions relating to the defined contribution plans are charged to profit and loss in
the year to which they relate.
ii) Share-based compensation
Share-based long-term incentive plans have been set up to provide incentives for selected executives.
Awards can take the form of share options with an exercise price based on the then prevailing market
prices or such other price set by the Directors or they can be share awards which will vest free of payment.
Awards normally vest after the third anniversary of the date of grant and may be subject to the achievement
of performance conditions.
The fair value of the employee services received in exchange for the grant of the share options or the share
awards is recognized as an expense. The total amount to be expensed over the vesting period is
determined by reference to the fair value of the share options or the share awards granted as determined on
the grant date. At each balance sheet date, the Group revises its estimates of the number of share options
that are expected to become exercisable and the number of share awards which will vest free of payment.
The impact of the revision of original estimates, if any, is recognized in profit and loss.
Notes to the Financial Statements continued
14

Mandarin Oriental International Limited
Principal Accounting Policies continued
Q Derivative financial instruments
R Financial guarantee contracts
S
Notes to the Financial Statements continued
Offsetting financial instruments
Financial assets and liabilities are offset and the net amount reported in the balance sheet when there is a legally
enforceable right to offset the recognized amounts and there is an intention to settle on a net basis or realize the
asset and settle the liability simultaneously. The legally enforceable right must not be contingent on future
events and must be enforceable in the normal course of business and in the event of default, insolvency or
bankruptcy of the company or the counterparty.
The Group only enters into derivative financial instruments in order to hedge underlying exposures. Derivative
financial instruments are initially recognized at fair value on the date a derivative contract is entered into and
are subsequently remeasured at their fair value. The method of recognizing the resulting gain or loss is
dependent on the nature of the item being hedged. The Group designates certain derivatives as a hedge of a
forecasted transaction or of the foreign currency risk on a firm commitment (‘cash flow hedge’), or a hedge of a
net investment in a foreign entity.
Changes in the fair value of derivatives that are designated and qualify as cash flow hedges and that are highly
effective, are recognized in other comprehensive income and accumulated in equity under hedging reserves.
Changes in the fair value relating to the ineffective portion is recognized immediately in profit and loss. Where
the forecasted transaction or firm commitment results in the recognition of a non-financial asset or of a non-
financial liability, the gains and losses previously deferred in hedging reserves are transferred from hedging
reserves and included in the initial measurement of the cost of the asset or liability. Otherwise, amounts
deferred in hedging reserves are transferred to profit and loss in the same periods during which the hedged firm
commitment or forecasted transaction affects profit and loss. When a hedging instrument expires or is sold, or
when a hedge no longer meets the criteria for hedge accounting, any cumulative gain or loss existing in hedging
reserves at that time remains in the hedging reserves and is recognized when the committed or forecasted
transaction ultimately is recognized in profit and loss. When a committed or forecasted transaction is no longer
expected to occur, the cumulative gain or loss that was reported in hedging reserves is immediately transferred
to profit and loss.
Certain derivative transactions, while providing effective economic hedges under the Group’s risk management
policies, do not qualify for hedge accounting under the specific rules in IAS 39. Changes in the fair value of
any derivative instruments that do not qualify for hedge accounting under IAS 39 are recognized immediately in
profit and loss.
Hedges of net investments in foreign entities are accounted for on a similar basis to that used for cash flow
hedges. Any gain or loss on the hedging instrument relating to the effective portion of the hedge is recognized
in other comprehensive income and accumulated in exchange reserves; the gain or loss relating to the
ineffective portion is recognized immediately in profit and loss.
The fair value of derivatives which are designated and qualify as effective hedges are classified as non-current
assets or liabilities if the remaining maturities of the hedged assets or liabilities are greater than 12 months after
the balance sheet date.
Financial guarantee contracts under which the Group accepts significant risk from a third party by agreeing to
compensate that party on the occurrence of a specified uncertain future event are accounted for in a manner
similar to insurance contracts. Provisions are recognized when it is probable that the Group has obligations
under such guarantees and an outflow of resources embodying economic benefits will be required to settle the
obligations.
15
Mandarin Oriental International Limited
Principal Accounting Policies continued
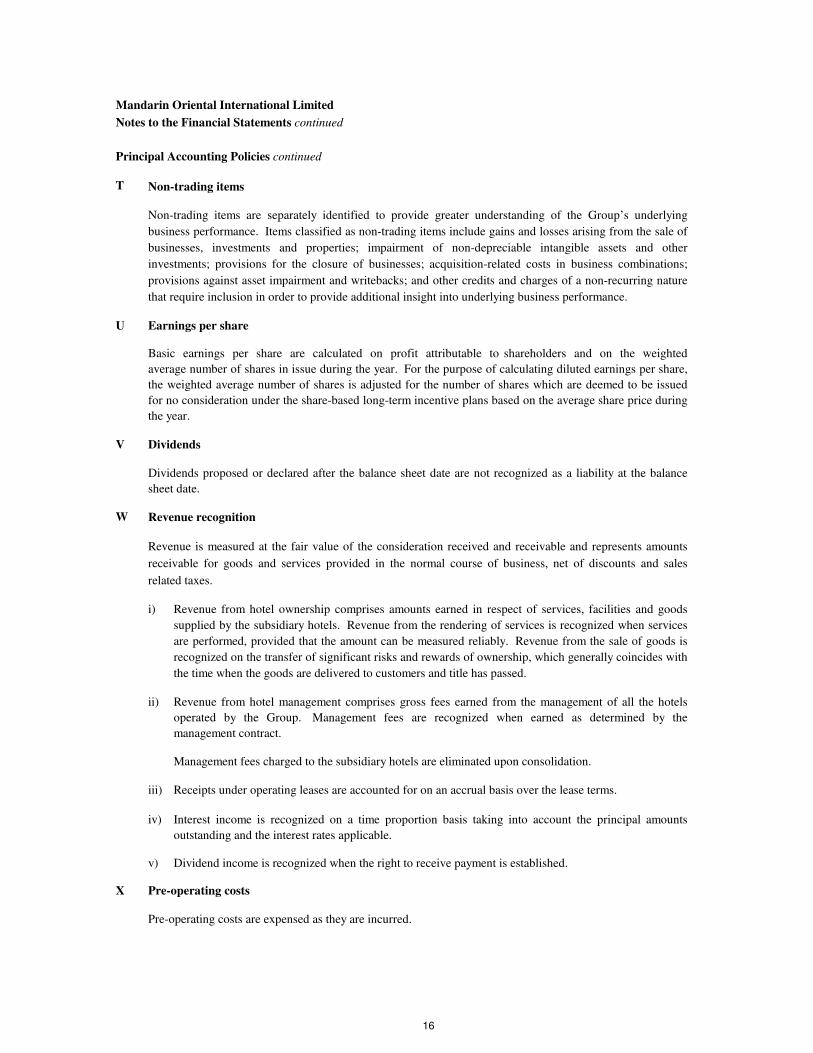
T Non-trading items
U
V Dividends
W
i)
ii)
iii)
iv)
v)
X Pre-operating costs
Notes to the Financial Statements continued
Revenue from hotel ownership comprises amounts earned in respect of services, facilities and goods
supplied by the subsidiary hotels. Revenue from the rendering of services is recognized when services
are performed, provided that the amount can be measured reliably. Revenue from the sale of goods is
recognized on the transfer of significant risks and rewards of ownership, which generally coincides with
the time when the goods are delivered to customers and title has passed.
Earnings per share
Revenue from hotel management comprises gross fees earned from the management of all the hotels
operated by the Group. Management fees are recognized when earned as determined by the
management contract.
Pre-operating costs are expensed as they are incurred.
Dividend income is recognized when the right to receive payment is established.
Revenue recognition
Management fees charged to the subsidiary hotels are eliminated upon consolidation.
Non-trading items are separately identified to provide greater understanding of the Group’s underlying
business performance. Items classified as non-trading items include gains and losses arising from the sale of
businesses, investments and properties; impairment of non-depreciable intangible assets and other
investments; provisions for the closure of businesses; acquisition-related costs in business combinations;
provisions against asset impairment and writebacks; and other credits and charges of a non-recurring nature
that require inclusion in order to provide additional insight into underlying business performance.
Basic earnings per share are calculated on profit attributable to shareholders and on the weighted
average number of shares in issue during the year. For the purpose of calculating diluted earnings per share,
the weighted average number of shares is adjusted for the number of shares which are deemed to be issued
for no consideration under the share-based long-term incentive plans based on the average share price during
the year.
Dividends proposed or declared after the balance sheet date are not recognized as a liability at the balance
sheet date.
Revenue is measured at the fair value of the consideration received and receivable and represents amounts
receivable for goods and services provided in the normal course of business, net of discounts and sales
related taxes.
Receipts under operating leases are accounted for on an accrual basis over the lease terms.
Interest income is recognized on a time proportion basis taking into account the principal amounts
outstanding and the interest rates applicable.
16

Mandarin Oriental International Limited
Notes to the Financial Statements continued
Financial Risk Management
A Financial risk factors
i) Market risk
Foreign exchange risk
The Group’s treasury function co-ordinates, under the directions of the board of Mandarin Oriental Hotel
Group International Limited, financial risk management policies and their implementation on a group-wide
basis. The Group’s treasury policies are designed to manage the financial impact of fluctuations in interest rates
and foreign exchange rates and to minimize the Group’s financial risks. The Group uses derivative financial
instruments, principally interest rate swaps and caps, and forward foreign exchange contracts as appropriate for
hedging transactions and managing the Group’s assets and liabilities in accordance with the Group’s financial
risk management policies. Financial derivative contracts are executed between third party banks and the Group
entity that is directly exposed to the risk being hedged. Certain derivative transactions, while providing
effective economic hedges under the Group’s risk management policies, do not qualify for hedge accounting
under the specific rules in IAS 39. Changes in the fair value of any derivative instruments that do not qualify
for hedge accounting under IAS 39 are recognized immediately in the profit and loss account. It is the Group’s
policy not to enter into derivative transactions for speculative purposes. The notional amounts and fair values of
derivative financial instruments at 31st December 2017 are disclosed in note 24.
The Group’s activities expose it to a variety of financial risks: market risk (including foreign exchange risk and
interest rate risk), credit risk and liquidity risk.
Currency risks as defined by IFRS 7 arise on account of monetary assets and liabilities being denominated in
a currency that is not the functional currency. In 2017 and 2016, the Group’s principal foreign exchange
exposure was with the Euro. At 31st December 2017, if the United States dollar had strengthened/weakened
by 10% against Euro with all other variables unchanged, the Group’s profit after tax would have been
US$0.1 million (2016: US$0.1 million) lower/higher, arising from foreign exchange losses/gains taken on
translation. The impact on amounts attributable to the shareholders of the Company would be US$0.1
million (2016: US$0.1 million) lower/higher. This sensitivity analysis ignores any offsetting foreign
exchange factors and has been determined assuming that the change in foreign exchange rates had occurred
at the balance sheet date. The stated change represents management’s assessment of reasonably possible
changes in foreign exchange rates over the period until the next annual balance sheet date. There are no
other significant monetary balances held by Group companies at 31st December 2017 that are denominated
in a non-functional currency. Differences resulting from the translation of financial statements into the
Group’s presentation currency are not taken into consideration.
Entities within the Group are exposed to foreign exchange risk from future commercial transactions, net
investments in foreign operations and net monetary assets and liabilities that are denominated in a currency
that is not the entity’s functional currency.
Group entities are required to manage their foreign exchange risk against their functional currency. To
manage their foreign exchange risk arising from future commercial transactions, entities in the Group use
forward foreign exchange contracts in a consistent manner to hedge firm and anticipated foreign exchange
commitments. The Group does not usually hedge its net investments in foreign operations except in
circumstances where there is a material exposure arising from a currency that is anticipated to be volatile and
the hedging is cost effective.
17
Mandarin Oriental International Limited
Financial Risk Management continued
A Financial risk factors continued
i) Market risk continued
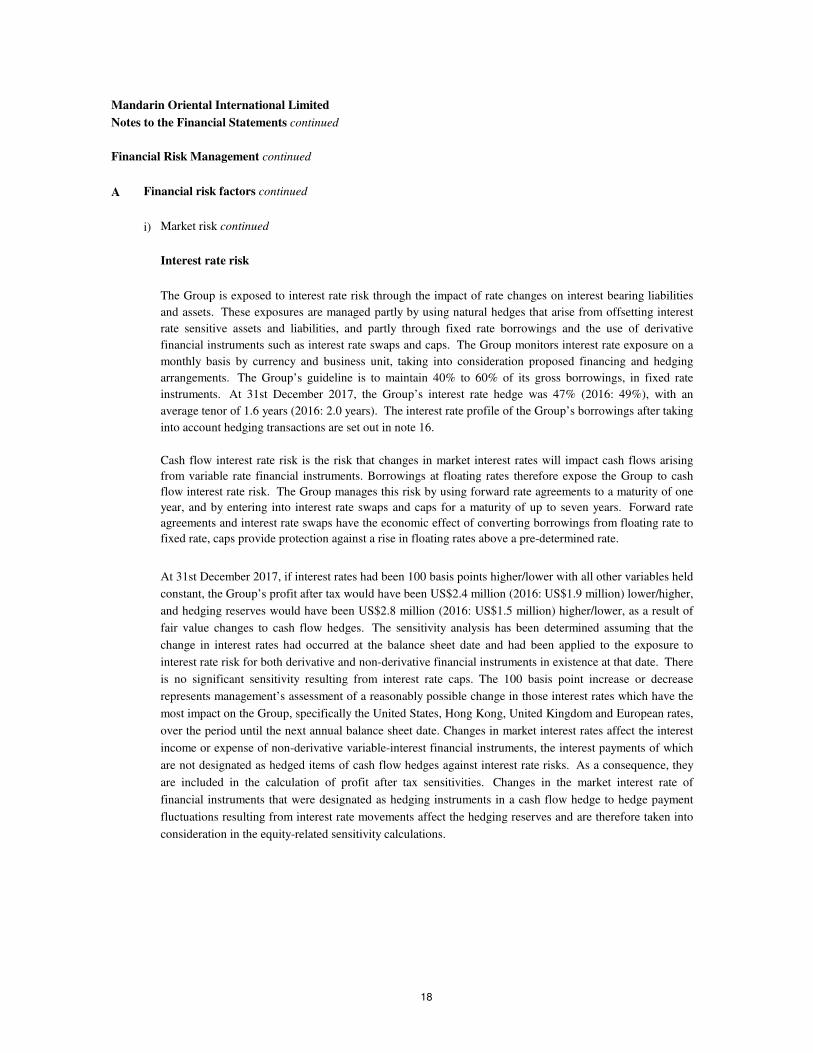
Interest rate risk
The Group is exposed to interest rate risk through the impact of rate changes on interest bearing liabilities
and assets. These exposures are managed partly by using natural hedges that arise from offsetting interest
rate sensitive assets and liabilities, and partly through fixed rate borrowings and the use of derivative
financial instruments such as interest rate swaps and caps. The Group monitors interest rate exposure on a
monthly basis by currency and business unit, taking into consideration proposed financing and hedging
arrangements. The Group’s guideline is to maintain 40% to 60% of its gross borrowings, in fixed rate
instruments. At 31st December 2017, the Group’s interest rate hedge was 47% (2016: 49%), with an
average tenor of 1.6 years (2016: 2.0 years). The interest rate profile of the Group’s borrowings after taking
into account hedging transactions are set out in note 16.
Cash flow interest rate risk is the risk that changes in market interest rates will impact cash flows arising
from variable rate financial instruments. Borrowings at floating rates therefore expose the Group to cash
flow interest rate risk. The Group manages this risk by using forward rate agreements to a maturity of one
year, and by entering into interest rate swaps and caps for a maturity of up to seven years. Forward rate
agreements and interest rate swaps have the economic effect of converting borrowings from floating rate to
fixed rate, caps provide protection against a rise in floating rates above a pre-determined rate.
At 31st December 2017, if interest rates had been 100 basis points higher/lower with all other variables held
constant, the Group’s profit after tax would have been US$2.4 million (2016: US$1.9 million) lower/higher,
and hedging reserves would have been US$2.8 million (2016: US$1.5 million) higher/lower, as a result of
fair value changes to cash flow hedges. The sensitivity analysis has been determined assuming that the
change in interest rates had occurred at the balance sheet date and had been applied to the exposure to
interest rate risk for both derivative and non-derivative financial instruments in existence at that date. There
is no significant sensitivity resulting from interest rate caps. The 100 basis point increase or decrease
represents management’s assessment of a reasonably possible change in those interest rates which have the
most impact on the Group, specifically the United States, Hong Kong, United Kingdom and European rates,
over the period until the next annual balance sheet date. Changes in market interest rates affect the interest
income or expense of non-derivative variable-interest financial instruments, the interest payments of which
are not designated as hedged items of cash flow hedges against interest rate risks. As a consequence, they
are included in the calculation of profit after tax sensitivities. Changes in the market interest rate of
financial instruments that were designated as hedging instruments in a cash flow hedge to hedge payment
fluctuations resulting from interest rate movements affect the hedging reserves and are therefore taken into
consideration in the equity-related sensitivity calculations.
Notes to the Financial Statements continued
18

Mandarin Oriental International Limited
Financial Risk Management continued
A Financial risk factors continued
ii) Credit risk
iii) Liquidity risk
Notes to the Financial Statements continued
Prudent liquidity risk management includes managing the profile of debt maturities and funding sources,
maintaining sufficient cash and marketable securities, and ensuring the availability of funding from an
adequate amount of committed credit facilities and the ability to close out market positions. The Group's
ability to fund its existing and prospective debt requirements is managed by maintaining diversified funding
sources with adequate committed funding lines from high quality lenders, and by monitoring rolling short-
term forecasts of the Group’s cash and gross debt on the basis of expected cash flows. In addition, long-term
cash flows are projected to assist with the Group’s long-term debt financing plans.
At 31st December 2017, total available borrowing facilities amounted to US$560 million (2016: US$556
million) of which US$511 million (2016: US$480 million) was drawn down. Undrawn committed facilities,
in the form of revolving credit and term loan facilities totalled US$49 million (2016: US$76 million), in
addition to cash balances of US$184 million (2016: US$183 million).
The Group’s credit risk is primarily attributable to deposits with banks, credit exposures to customers and
derivative financial instruments with a positive fair value. The Group has credit policies in place and the
exposures to these credit risks are monitored on an ongoing basis.
The Group manages its deposits with banks and financial institutions and transactions involving derivative
financial instruments by monitoring credit ratings and capital adequacy ratios of counterparties, and limiting
the aggregate risk to any individual counterparty. The utilization of credit limits is regularly monitored. At
31st December 2017, 85% (2016: 83%) of deposits and balances with banks and financial institutions were
made to institutions with credit ratings of no less than A- (Fitch). Similarly transactions involving derivative
financial instruments are with banks with sound credit ratings and capital adequacy ratios. In developing
countries it may be necessary to deposit money with banks that have a lower credit rating, however the Group
only enters into derivative transactions with counterparties which have credit rating of at least investment
grade. Management does not expect any counterparty to fail to meet its obligations.
In respect of credit exposures to customers, the Group has policies in place to ensure that sales on credit
without collateral are made principally to travel agents and corporate companies with an appropriate credit
history. Sales to other customers are made in cash or by major credit cards.
The maximum exposure to credit risk is represented by the carrying amount of each financial asset in the
balance sheet after deducting any impairment allowance.
19
Mandarin Oriental International Limited
Notes to the Financial Statements continued
Financial Risk Management continued
A Financial risk factors continued
iii) Liquidity risk continued
Within Between Between Between Between Beyond Total
one one and two and three and four and five
year two years three years four years five years years cash flows
US$m US$m US$m US$m US$m US$m US$m
2017
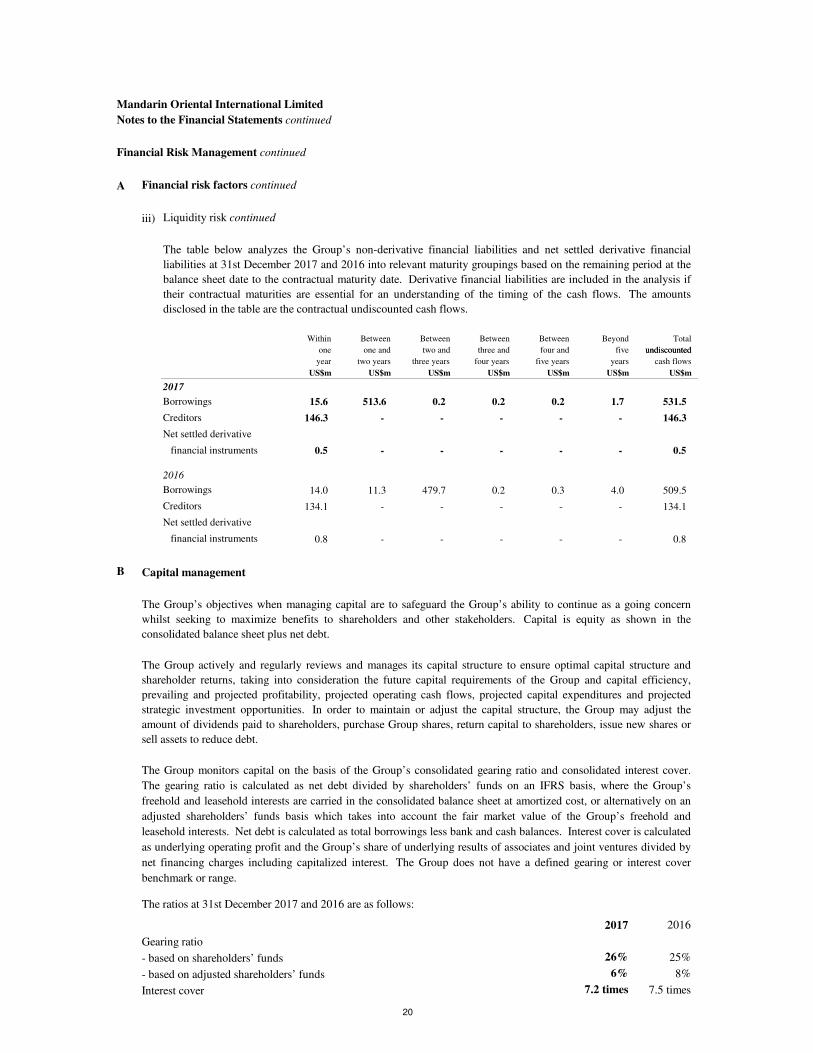
Borrowings 15.6 513.6 0.2 0.2 0.2 1.7 531.5
Creditors 146.3 - - - - - 146.3
Net settled derivative
financial instruments 0.5 - - - - - 0.5
2016
Borrowings 14.0 11.3 479.7 0.2 0.3 4.0 509.5
Creditors 134.1 - - - - - 134.1
Net settled derivative
financial instruments 0.8 - - - - - 0.8
B Capital management
The ratios at 31st December 2017 and 2016 are as follows:
2017 2016
Gearing ratio
- based on shareholders’ funds 26% 25%
- based on adjusted shareholders’ funds 6% 8%
Interest cover 7.2 times 7.5 times
undiscountedundiscounted
The Group’s objectives when managing capital are to safeguard the Group’s ability to continue as a going concern
whilst seeking to maximize benefits to shareholders and other stakeholders. Capital is equity as shown in the
consolidated balance sheet plus net debt.
The Group actively and regularly reviews and manages its capital structure to ensure optimal capital structure and
shareholder returns, taking into consideration the future capital requirements of the Group and capital efficiency,
prevailing and projected profitability, projected operating cash flows, projected capital expenditures and projected
strategic investment opportunities. In order to maintain or adjust the capital structure, the Group may adjust the
amount of dividends paid to shareholders, purchase Group shares, return capital to shareholders, issue new shares or
sell assets to reduce debt.
The Group monitors capital on the basis of the Group’s consolidated gearing ratio and consolidated interest cover.
The gearing ratio is calculated as net debt divided by shareholders’ funds on an IFRS basis, where the Group’s
freehold and leasehold interests are carried in the consolidated balance sheet at amortized cost, or alternatively on an
adjusted shareholders’ funds basis which takes into account the fair market value of the Group’s freehold and
leasehold interests. Net debt is calculated as total borrowings less bank and cash balances. Interest cover is calculated
as underlying operating profit and the Group’s share of underlying results of associates and joint ventures divided by
net financing charges including capitalized interest. The Group does not have a defined gearing or interest cover
benchmark or range.
The table below analyzes the Group’s non-derivative financial liabilities and net settled derivative financial
liabilities at 31st December 2017 and 2016 into relevant maturity groupings based on the remaining period at the
balance sheet date to the contractual maturity date. Derivative financial liabilities are included in the analysis if
their contractual maturities are essential for an understanding of the timing of the cash flows. The amounts
disclosed in the table are the contractual undiscounted cash flows.
20

Mandarin Oriental International Limited
Financial Risk Management continued
C Fair value estimation
i) Financial instruments that are measured at fair value
a)
b)
There were no changes in valuation techniques during the year.
Observable
current market Unobservable
transactions inputs Total
US$m US$m US$m
2017
Assets
Available-for-sale financial assets
1.7 9.3 11.0
0.5 - 0.5
2.2 9.3 11.5
Liabilities
Derivatives designated at fair value
- through other comprehensive income (0.2) - (0.2)
2016
Assets
Available-for-sale financial assets
- unlisted investments 2.1 8.6 10.7
Liabilities
Derivatives designated at fair value
- through other comprehensive income (0.6) - (0.6)
There were no transfers among the two categories during the year ended 31st December 2017 and 2016.
For financial instruments that are measured at fair value in the balance sheet, the corresponding fair value
measurements are disclosed by level of the following fair value measurement hierarchy:
Inputs other than quoted prices in active markets that are observable for the asset or liability, either
directly or indirectly (‘observable current market transactions’)
The fair values of derivative financial instruments are determined using rates quoted by the Group’s
bankers at the balance sheet date. The rates for interest rate swaps and caps and forward foreign exchange
contracts are calculated by reference to market interest rates and foreign exchange rates.
The fair value of unlisted investments, which are classified as available-for-sale and mainly include club
and school debentures, are determined using prices quoted by brokers at the balance sheet date.
Inputs for assets or liabilities that are not based on observable market data (‘unobservable inputs’)
Notes to the Financial Statements continued
The fair value of other unlisted securities, which are classified as available-for-sale, is determined using
valuation techniques by reference to observable current market transactions (including price-to earnings
and price-to book ratios of listed securities of entities engaged in similar industries) or the market prices of
the underlying investments with certain degree of entity specific estimates.
The table below analyzes financial instruments carried at fair value at 31st December 2017 and 2016, by the
levels in the fair value measurement hierarchy.
- unlisted investments
- through other comprehensive income
Derivatives designated at fair value
21
Mandarin Oriental International Limited
Financial Risk Management continued
C Fair value estimation continued
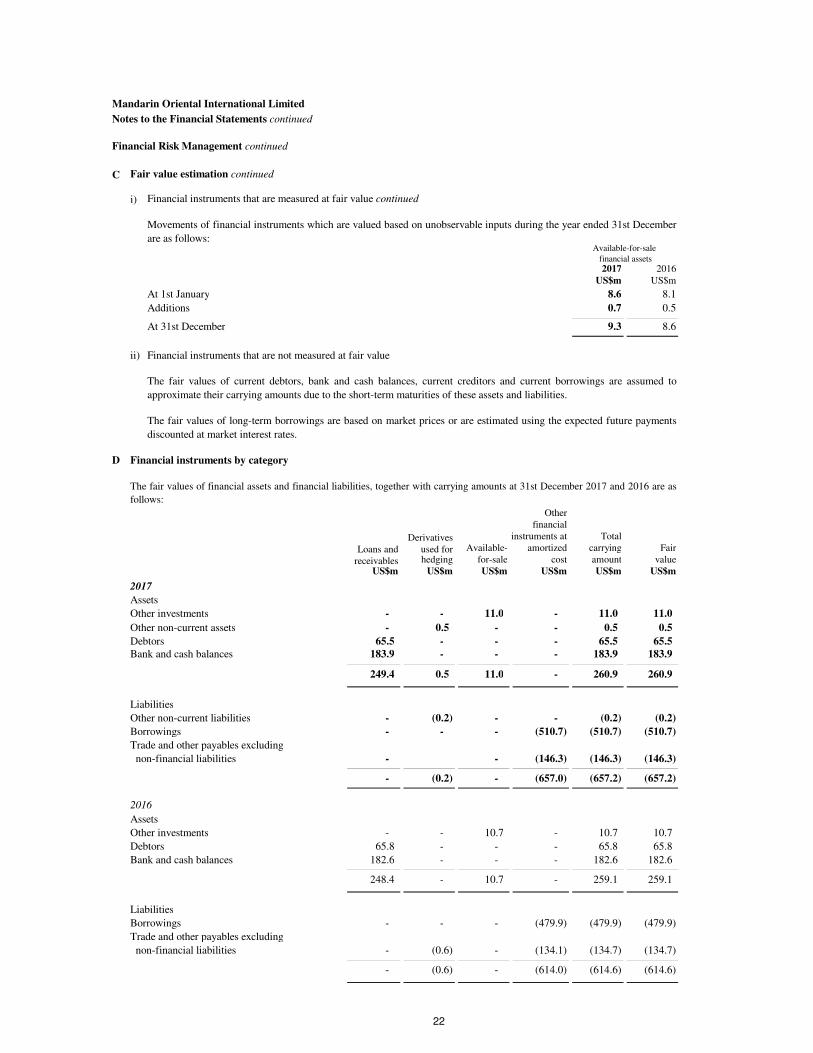
i) Financial instruments that are measured at fair value continued
2017 2016
US$m US$m
At 1st January 8.6 8.1
Additions 0.7 0.5
At 31st December 9.3 8.6
ii) Financial instruments that are not measured at fair value
D Financial instruments by category
Otherfinancial
Derivatives instruments at Total
Loans and used for Available- amortized carrying Fair
receivables hedging US$mfor-sale cost amount value US$m US$m US$m US$m US$m US$m
2017
Assets
Other investments - - 11.0 - 11.0 11.0
Other non-current assets - 0.5 - - 0.5 0.5
Debtors 65.5 - - - 65.5 65.5 Bank and cash balances 183.9 - - - 183.9 183.9
249.4 0.5 11.0 - 260.9 260.9
Liabilities
Other non-current liabilities - (0.2) - - (0.2) (0.2)
Borrowings - - - (510.7) (510.7) (510.7)
Trade and other payables excluding
non-financial liabilities - - (146.3) (146.3) (146.3)
- (0.2) - (657.0) (657.2) (657.2) -
2016
Assets
Other investments - - 10.7 - 10.7 10.7
Debtors 65.8 - - - 65.8 65.8
Bank and cash balances 182.6 - - - 182.6 182.6
248.4 - 10.7 - 259.1 259.1
Liabilities
Borrowings - - - (479.9) (479.9) (479.9)
Trade and other payables excluding
non-financial liabilities - (0.6) - (134.1) (134.7) (134.7)
- (0.6) - (614.0) (614.6) (614.6) -
The fair values of financial assets and financial liabilities, together with carrying amounts at 31st December 2017 and 2016 are as
follows:
Notes to the Financial Statements continued
Movements of financial instruments which are valued based on unobservable inputs during the year ended 31st December
are as follows:Available-for-sale
financial assets
The fair values of current debtors, bank and cash balances, current creditors and current borrowings are assumed to
approximate their carrying amounts due to the short-term maturities of these assets and liabilities.
The fair values of long-term borrowings are based on market prices or are estimated using the expected future payments
discounted at market interest rates.
22
Mandarin Oriental International Limited
Critical Accounting Estimates and Judgements
A
B Impairment of assets
C Tangible fixed assets and depreciation
D Income taxes
Notes to the Financial Statements continued
Estimates and judgements used in preparing the financial statements are continually evaluated and are based on
historical experience and other factors, including expectations of future events that are believed to be reasonable. The
resulting accounting estimates will, by definition, seldom equal the related actual results. The estimates and
assumptions that have a significant effect on the carrying amounts of assets and liabilities are discussed below.
Management determines the estimated useful lives and related depreciation charges for the Group’s tangible
fixed assets. Management will revise the depreciation charge where useful lives are different to those
previously estimated, or it will write off or write down technically obsolete or non-strategic assets that have
been abandoned.
The Group is subject to income taxes in numerous jurisdictions. Significant judgement is required in
determining the worldwide provision for income taxes. There are many transactions and calculations for which
the ultimate tax determination is uncertain during the ordinary course of business. Where the final tax outcome
of these matters is different from the amounts that were initially recorded, such differences will impact the
income tax and deferred tax provisions in the period in which such determination is made.
The Group tests annually whether goodwill and other assets that have indefinite useful lives suffered any
impairment. Other assets such as development costs are reviewed for impairment whenever events or changes
in circumstances indicate that the carrying amount of the asset exceeds its recoverable amount. The recoverable
amount of an asset or a cash generating unit is determined based on the higher of its fair value less cost to sell
and its value in use, calculated on the basis of management’s assumptions and estimates. Changing the key
assumptions, including the discount rates or the growth rate assumptions in the cash flow projections, could
materially affect the value-in-use calculations.
Recognition of deferred tax assets, which principally relate to tax losses, depends on the management’s
expectation of future taxable profit that will be available against which the tax losses can be utilized. The
outcome of their actual utilization may be different.
Provision of deferred tax follows the way management expects to recover or settle the carrying amount of the
related assets or liabilities, which the management may expect to recover through use, sale or combination of
both. Accordingly, deferred tax will be calculated at income tax rate, capital gains tax rate or combination of
both.
Acquisition of subsidiaries, associates and joint ventures
The initial accounting on the acquisition of subsidiaries, associates and joint ventures involves identifying and
determining the fair values to be assigned to the identifiable assets, liabilities and contingent liabilities of the
acquired entities. The fair values of leasehold land and tangible assets are determined by independent valuers
by reference to market prices or present value of expected net cash flows from the assets. Any changes in the
assumptions used and estimates made in determining the fair values, and management’s ability to measure
reliably the contingent liabilities of the acquired entity will impact the carrying amount of these assets and
liabilities.
23

Mandarin Oriental International Limited
Critical Accounting Estimates and Judgements continued
E Pension obligations
F Non-trading items
The Group uses underlying business performance in its internal financial reporting to distinguish between the
underlying profits and non-trading items. The identification of non-trading items requires judgement by
management, but follows the consistent methodology as set out in the Group’s accounting policies.
The present value of the pension obligations depends on a number of factors that are determined on an
actuarial basis using a number of assumptions. The assumptions used in determining the net cost/income for
pensions include the discount rate. Any changes in these assumptions will impact the carrying amount of
pension obligations.
Other key assumptions for pension obligations are based in part on current market conditions.
The Group determines the appropriate discount rate at the end of each year. This is the interest rate that
should be used to determine the present value of estimated future cash outflows expected to be required to
settle the pension obligations. In determining the appropriate discount rate, the Group considers the interest
rates of high-quality corporate bonds that are denominated in the currency in which the benefits will be paid
and that have terms to maturity approximating the terms of the related pension obligation.
Notes to the Financial Statements continued
24
Mandarin Oriental International LimitedNotes to the Financial Statements continued
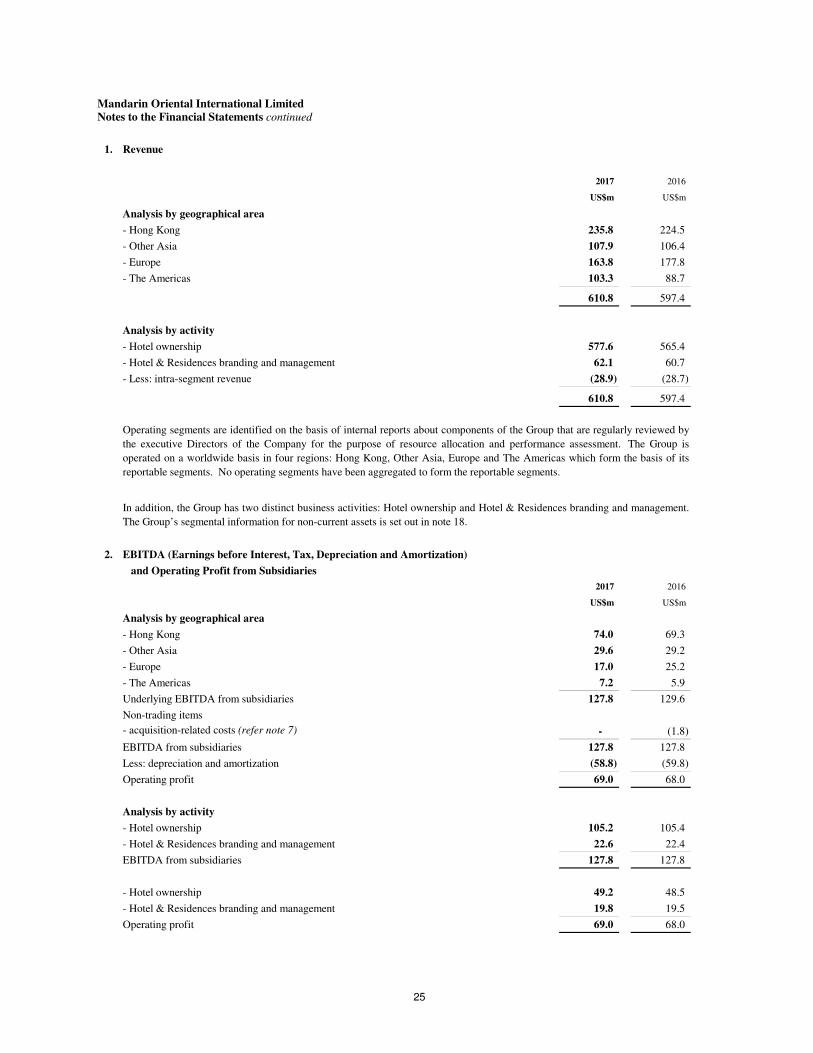
1. Revenue
2017 2016
US$m US$m
Analysis by geographical area
- Hong Kong 235.8 224.5
- Other Asia 107.9 106.4
- Europe 163.8 177.8
- The Americas 103.3 88.7
610.8 597.4
Analysis by activity
- Hotel ownership 577.6 565.4
- Hotel & Residences branding and management 62.1 60.7
- Less: intra-segment revenue (28.9) (28.7)
610.8 597.4
2. EBITDA (Earnings before Interest, Tax, Depreciation and Amortization)
and Operating Profit from Subsidiaries
2017 2016
US$m US$m
Analysis by geographical area
- Hong Kong 74.0 69.3
- Other Asia 29.6 29.2
- Europe 17.0 25.2
- The Americas 7.2 5.9
Underlying EBITDA from subsidiaries 127.8 129.6
Non-trading items
- acquisition-related costs (refer note 7) - (1.8)
EBITDA from subsidiaries 127.8 127.8
Less: depreciation and amortization (58.8) (59.8)
Operating profit 69.0 68.0
Analysis by activity
- Hotel ownership 105.2 105.4
- Hotel & Residences branding and management 22.6 22.4
EBITDA from subsidiaries 127.8 127.8
- Hotel ownership 49.2 48.5
- Hotel & Residences branding and management 19.8 19.5
Operating profit 69.0 68.0
Operating segments are identified on the basis of internal reports about components of the Group that are regularly reviewed by
the executive Directors of the Company for the purpose of resource allocation and performance assessment. The Group is
operated on a worldwide basis in four regions: Hong Kong, Other Asia, Europe and The Americas which form the basis of its
reportable segments. No operating segments have been aggregated to form the reportable segments.
In addition, the Group has two distinct business activities: Hotel ownership and Hotel & Residences branding and management.
The Group’s segmental information for non-current assets is set out in note 18.
25
Mandarin Oriental International LimitedNotes to the Financial Statements continued
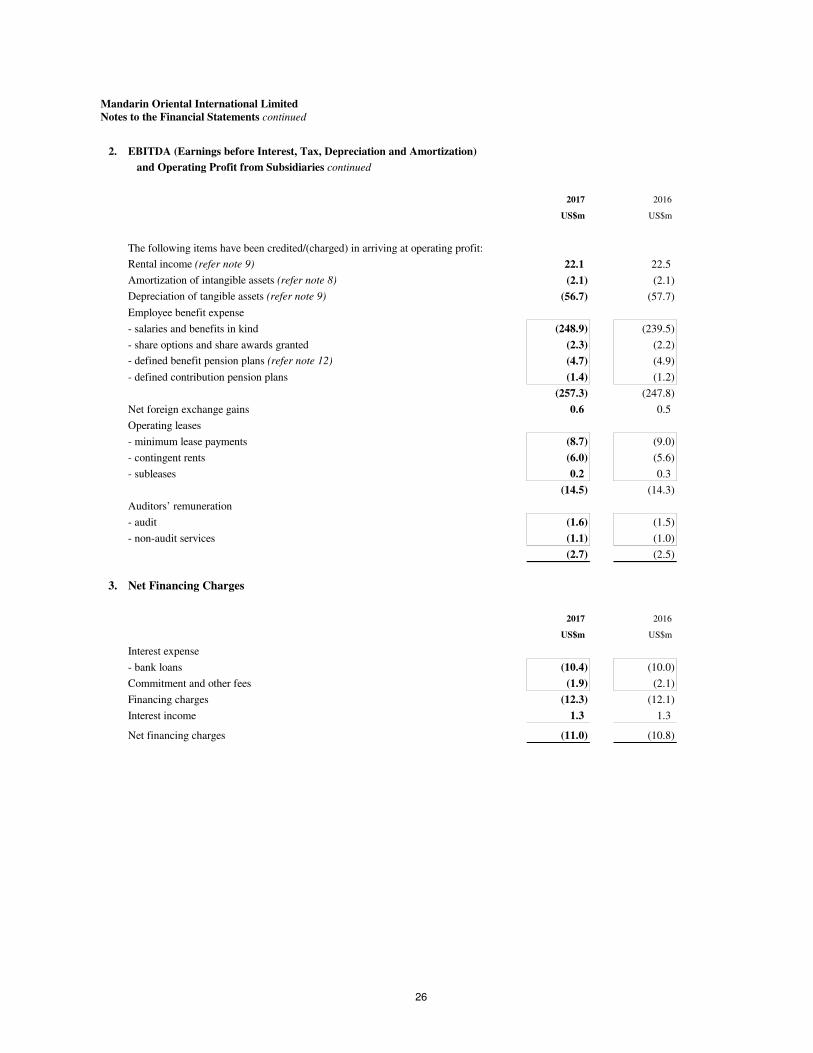
2. EBITDA (Earnings before Interest, Tax, Depreciation and Amortization)
and Operating Profit from Subsidiaries continued
2017 2016
US$m US$m
The following items have been credited/(charged) in arriving at operating profit:
Rental income (refer note 9) 22.1 22.5
Amortization of intangible assets (refer note 8) (2.1) (2.1)
Depreciation of tangible assets (refer note 9) (56.7) (57.7)
Employee benefit expense
- salaries and benefits in kind (248.9) (239.5)
- share options and share awards granted (2.3) (2.2)
- defined benefit pension plans (refer note 12) (4.7) (4.9)
- defined contribution pension plans (1.4) (1.2)
(257.3) (247.8)
Net foreign exchange gains 0.6 0.5
Operating leases
- minimum lease payments (8.7) (9.0)
- contingent rents (6.0) (5.6)
- subleases 0.2 0.3
(14.5) (14.3)
Auditors’ remuneration
- audit (1.6) (1.5)
- non-audit services (1.1) (1.0)
(2.7) (2.5)
3. Net Financing Charges
2017 2016
US$m US$m
Interest expense
- bank loans (10.4) (10.0)
Commitment and other fees (1.9) (2.1)
Financing charges (12.3) (12.1)
Interest income 1.3 1.3
Net financing charges (11.0) (10.8)
26

Mandarin Oriental International LimitedNotes to the Financial Statements continued
4. Share of Results of Associates and Joint Ventures
Depreciation Net Net
and Operating financing profit/
EBITDA amortization profit charges Tax (loss)
US$m US$m US$m US$m US$m US$m
2017
Analysis by geographical area
- Other Asia 23.5 (8.3) 15.2 (1.4) (2.3) 11.5
- Europe 2.7 (0.8) 1.9 - (0.1) 1.8
- The Americas 3.9 (3.0) 0.9 (2.4) (0.3) (1.8)
30.1 (12.1) 18.0 (3.8) (2.7) 11.5
Analysis by activity
- Hotel ownership 28.9 (11.6) 17.3 (3.6) (2.6) 11.1
- Other 1.2 (0.5) 0.7 (0.2) (0.1) 0.4
30.1 (12.1) 18.0 (3.8) (2.7) 11.5
2016
Analysis by geographical area
- Other Asia 20.9 (7.8) 13.1 (1.5) (2.3) 9.3
- Europe 1.8 (0.7) 1.1 - - 1.1
- The Americas 5.9 (3.0) 2.9 (2.2) 0.1 0.8
28.6 (11.5) 17.1 (3.7) (2.2) 11.2
Non-trading items
- provision for litigation (refer note 7) (0.3) - (0.3) - - (0.3)
28.3 (11.5) 16.8 (3.7) (2.2) 10.9
Analysis by activity
- Hotel ownership 27.4 (11.0) 16.4 (3.6) (2.1) 10.7
- Other 0.9 (0.5) 0.4 (0.1) (0.1) 0.2
28.3 (11.5) 16.8 (3.7) (2.2) 10.9
27
Mandarin Oriental International LimitedNotes to the Financial Statements continued
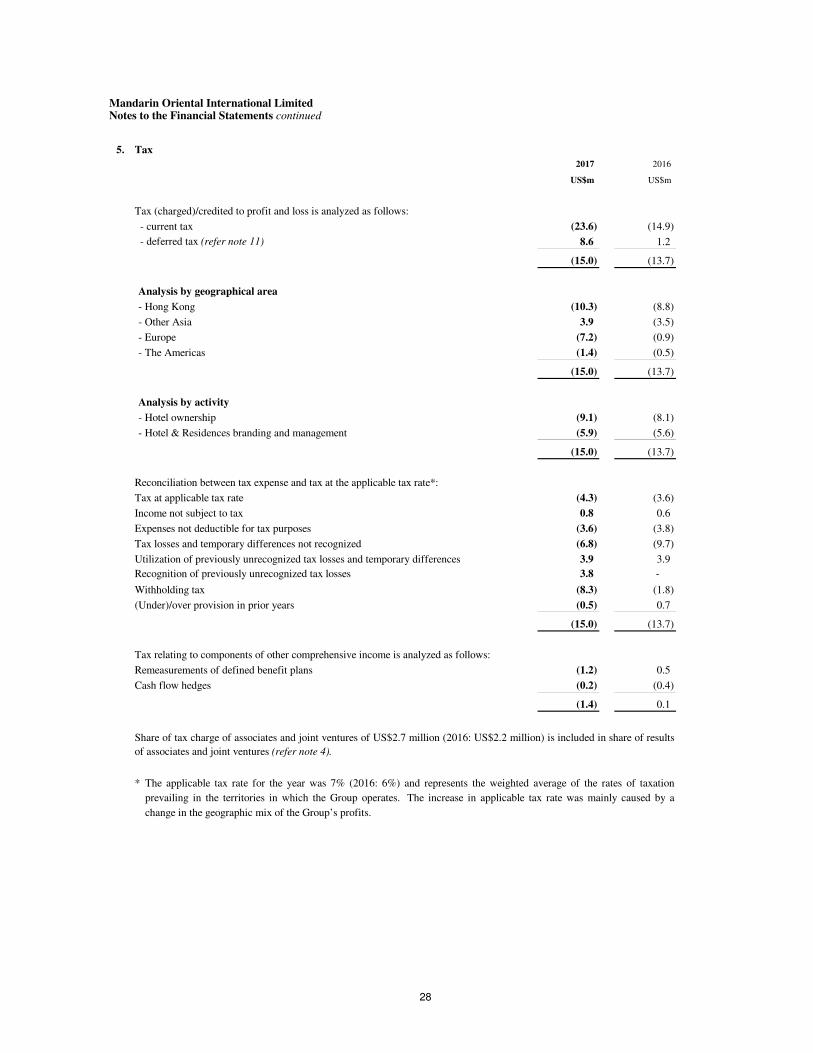
5. Tax
2017 2016
US$m US$m
Tax (charged)/credited to profit and loss is analyzed as follows:
- current tax (23.6) (14.9)
- deferred tax (refer note 11) 8.6 1.2
(15.0) (13.7)
Analysis by geographical area
- Hong Kong (10.3) (8.8)
- Other Asia 3.9 (3.5)
- Europe (7.2) (0.9)
- The Americas (1.4) (0.5)
(15.0) (13.7)
Analysis by activity
- Hotel ownership (9.1) (8.1)
- Hotel & Residences branding and management (5.9) (5.6)
(15.0) (13.7)
Reconciliation between tax expense and tax at the applicable tax rate*:
Tax at applicable tax rate (4.3) (3.6)
Income not subject to tax 0.8 0.6
Expenses not deductible for tax purposes (3.6) (3.8)
Tax losses and temporary differences not recognized (6.8) (9.7)
Utilization of previously unrecognized tax losses and temporary differences 3.9 3.9
3.8 -
Withholding tax (8.3) (1.8)
(Under)/over provision in prior years (0.5) 0.7
(15.0) (13.7)
Tax relating to components of other comprehensive income is analyzed as follows:
Remeasurements of defined benefit plans (1.2) 0.5
Cash flow hedges (0.2) (0.4)
(1.4) 0.1
*
Share of tax charge of associates and joint ventures of US$2.7 million (2016: US$2.2 million) is included in share of results
of associates and joint ventures (refer note 4).
The applicable tax rate for the year was 7% (2016: 6%) and represents the weighted average of the rates of taxation
prevailing in the territories in which the Group operates. The increase in applicable tax rate was mainly caused by a
change in the geographic mix of the Group’s profits.
Recognition of previously unrecognized tax losses
28

Mandarin Oriental International LimitedNotes to the Financial Statements continued
6. Earnings per Share
2017 2016
Weighted average number of shares for basic earnings per share calculation 1,257.7 1,255.9
Adjustment for shares deemed to be issued for no consideration
under the share-based long-term incentive plans 4.3 5.6
Weighted average number of shares for diluted earnings per share calculation 1,262.0 1,261.5
Basic Diluted Basic Diluted
earnings earnings earnings earnings
per share per share per share per share
US$m US¢ US¢ US$m US¢ US¢
Profit attributable to shareholders 54.9 4.37 4.35 55.2 4.40 4.38
Non-trading items (refer note 7) - 2.1
Underlying profit attributable to shareholders 54.9 4.37 4.35 57.3 4.56 4.54
7. Non-Trading Items
An analysis of non-trading items after interest, tax and non-controlling interests is set out below:
2017 2016
US$m US$m
Acquisition-related costs
- administration expenses - 1.8
Provision for litigation
- share of results of associates and joint ventures - 0.3
- 2.1
2017 2016
Basic earnings per share are calculated on profit attributable to shareholders of US$54.9 million (2016: US$55.2 million)
and on the weighted average number of 1,257.7 million (2016: 1,255.9 million) shares in issue during the year.
Diluted earnings per share are calculated on profit attributable to shareholders of US$54.9 million (2016: US$55.2 million)
and on the weighted average number of 1,262.0 million (2016: 1,261.5 million) shares in issue after adjusting for the
numbers of shares which are deemed to be issued for no consideration under the share-based long-term incentive plans
based on average share price during the year.
The weighted average number of shares is arrived at as follows:
Additional basic and diluted earnings per share are also calculated based on underlying profit attributable to shareholders. A
reconciliation of earnings is set out below:
Ordinary shares in millions
29

Mandarin Oriental International LimitedNotes to the Financial Statements continued
8. Intangible AssetsLeasehold Computer Development
Goodwill land software costs Total
US$m US$m US$m US$m US$m
2017
Cost 23.9 6.3 17.8 16.3 64.3
Amortization and impairment - (2.2) (15.1) (2.7) (20.0)
Net book value at 1st January 23.9 4.1 2.7 13.6 44.3
Exchange differences - - - 0.4 0.4
Additions - - 3.4 2.5 5.9
- - (0.2) - (0.2)
Amortization charge - (0.2) (1.5) (0.4) (2.1)
Impairment charge - - - (0.6) (0.6)
Net book value at 31st December 23.9 3.9 4.4 15.5 47.7
Cost 23.9 6.4 23.5 18.6 72.4
Amortization and impairment - (2.5) (19.1) (3.1) (24.7)
23.9 3.9 4.4 15.5 47.7
2016
Cost 23.9 6.3 20.5 16.1 66.8
Amortization and impairment - (2.1) (18.2) (2.4) (22.7)
Net book value at 1st January 23.9 4.2 2.3 13.7 44.1
Exchange differences - - - (0.1) (0.1)
Additions - - 2.0 0.7 2.7
Amortization charge - (0.1) (1.6) (0.4) (2.1)
Impairment charge - - - (0.3) (0.3)
Net book value at 31st December 23.9 4.1 2.7 13.6 44.3
Cost 23.9 6.3 17.8 16.3 64.3
Amortization and impairment - (2.2) (15.1) (2.7) (20.0)
23.9 4.1 2.7 13.6 44.3
The amortization periods for intangible assets are as follows:
Leasehold land 20 to 40 years
Computer software 3 to 5 years
Development costs 15 to 40 years
Management has performed an impairment review of the carrying amount of goodwill at 31st December 2017. For the purpose of
impairment review, goodwill acquired has been allocated to the respective hotels and is reviewed for impairment based on
individual hotel forecast operating performance and cash flows. Cash flow projections for the impairment reviews are based on
updated individual hotel forecasts (including the following year’s individual hotel budgets) with assumptions updated for the
prevailing market conditions, and are discounted appropriately. Key assumptions used for value-in-use calculations include
average growth rates of between 3% to 9% to project cash flows over a five-year period after which the growth rate is assumed up
to 5% in perpetuity, which may vary across the Group’s geographical locations, and are based on management expectations for the
market development; and pre-tax discount rates of around 8% to 13% applied to the cash flow projections. The discount rates used
reflect business specific risks relating to the business life-cycle and geographical location. On the basis of these reviews,
management concluded that no impairment exists.
The amortization charges are all recognized in arriving at operating profit and are included in cost of sales, selling and distribution
costs and administration expenses.
Transfer to tangible assets
30

Mandarin Oriental International LimitedNotes to the Financial Statements continued
9. Tangible Assets
Leasehold Furniture
Freehold properties & Plant & equipment &
properties improvements machinery motor vehicles Total
US$m US$m US$m US$m US$m
2017
Cost 733.3 743.3 139.4 260.2 1,876.2
Depreciation (85.4) (182.6) (75.1) (181.0) (524.1)
Net book value at 1st January 647.9 560.7 64.3 79.2 1,352.1
Exchange differences 57.0 10.5 5.4 2.3 75.2
Additions 34.8 25.2 2.7 19.8 82.5
Disposals - - - (0.1) (0.1)
Transfer from intangible assets - - - 0.2 0.2
Reclassification 22.1 (34.0) 3.1 8.8 -
Depreciation charge (10.7) (18.2) (7.1) (20.7) (56.7)
Net book value at 31st December 751.1 544.2 68.4 89.5 1,453.2
Cost 841.4 744.0 155.0 291.6 2,032.0
Depreciation (90.3) (199.8) (86.6) (202.1) (578.8)
751.1 544.2 68.4 89.5 1,453.2
2016
Cost 650.0 720.8 140.2 257.6 1,768.6
Depreciation (80.5) (171.1) (74.6) (187.4) (513.6)
Net book value at 1st January 569.5 549.7 65.6 70.2 1,255.0
Exchange differences (38.7) (19.3) (2.3) (1.2) (61.5)
Additions 125.6 50.3 8.5 32.5 216.9
Disposals - - - (0.6) (0.6)
Depreciation charge (8.5) (20.0) (7.5) (21.7) (57.7)
Net book value at 31st December 647.9 560.7 64.3 79.2 1,352.1
Cost 733.3 743.3 139.4 260.2 1,876.2
Depreciation (85.4) (182.6) (75.1) (181.0) (524.1)
647.9 560.7 64.3 79.2 1,352.1
2017 2016
US$m US$m
Within one year 18.6 19.1
Between one and two years 16.8 14.9
Between two and five years 38.0 28.9
Beyond five years 1.2 4.4
74.6 67.3
Certain of the hotel properties are pledged as security for bank borrowings as shown in note 16.
Freehold properties include a property of US$108.5 million (2016: US$111.6 million), which is stated net of tax increment
financing of US$21.3 million (2016: US$22.2 million) (refer note 17) .
Net book value of leasehold properties acquired under finance leases amounted to US$181.2 million (2016: US$183.0 million).
Rental income from properties and other tangible assets amounted to US$22.1 million (2016: US$22.5 million) (refer to note 2).
Future minimum rental payments receivable under non-cancellable leases are as follows:
31
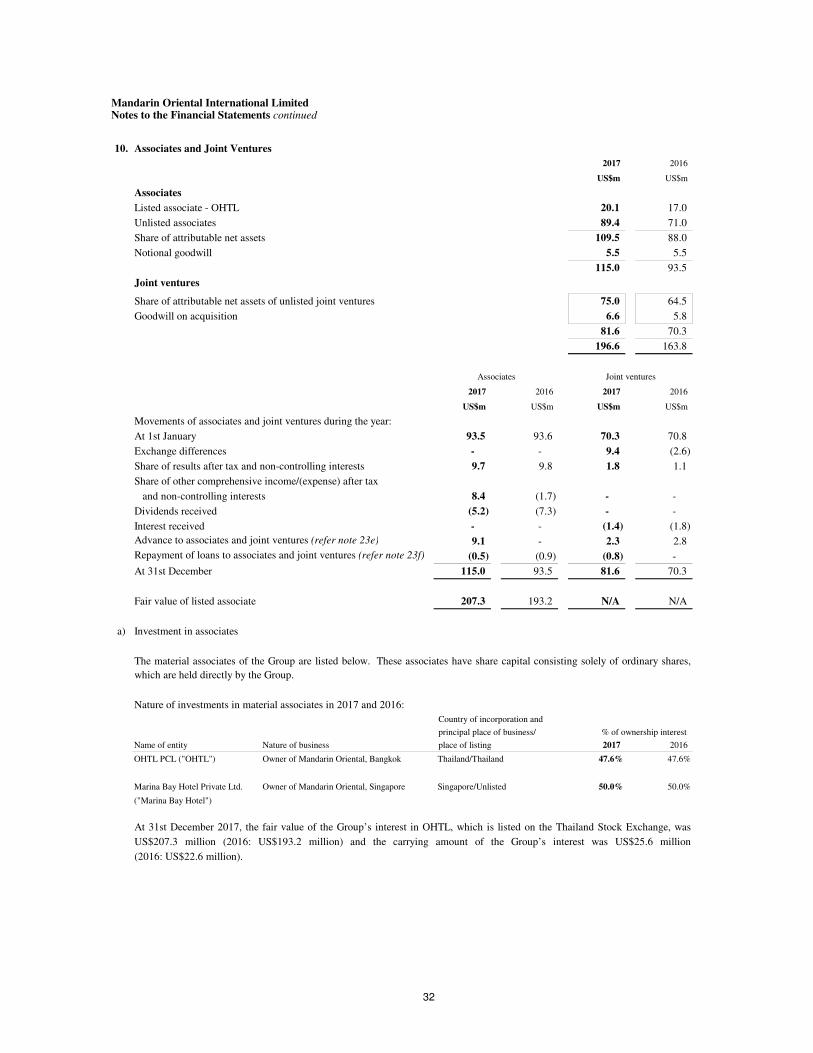
Mandarin Oriental International LimitedNotes to the Financial Statements continued
10. Associates and Joint Ventures
2017 2016
US$m US$m
Associates
Listed associate - OHTL 20.1 17.0
Unlisted associates 89.4 71.0
Share of attributable net assets 109.5 88.0
Notional goodwill 5.5 5.5
115.0 93.5
Joint ventures
Share of attributable net assets of unlisted joint ventures 75.0 64.5
Goodwill on acquisition 6.6 5.8
81.6 70.3
196.6 163.8
2017 2016 2017 2016
US$m US$m US$m US$m
Movements of associates and joint ventures during the year:
At 1st January 93.5 93.6 70.3 70.8
Exchange differences - - 9.4 (2.6)
Share of results after tax and non-controlling interests 9.7 9.8 1.8 1.1
Share of other comprehensive income/(expense) after tax
and non-controlling interests 8.4 (1.7) - -
Dividends received (5.2) (7.3) - -
Interest received - - (1.4) (1.8)
Advance to associates and joint ventures (refer note 23e) 9.1 - 2.3 2.8
Repayment of loans to associates and joint ventures (refer note 23f) (0.5) (0.9) (0.8) -
At 31st December 115.0 93.5 81.6 70.3
Fair value of listed associate 207.3 193.2 N/A N/A
a) Investment in associates
Name of entity Nature of business 2017 2016
OHTL PCL ("OHTL") Owner of Mandarin Oriental, Bangkok 47.6% 47.6%
Marina Bay Hotel Private Ltd. Owner of Mandarin Oriental, Singapore 50.0% 50.0%
("Marina Bay Hotel")
principal place of business/
Joint venturesAssociates
The material associates of the Group are listed below. These associates have share capital consisting solely of ordinary shares,
which are held directly by the Group.
At 31st December 2017, the fair value of the Group’s interest in OHTL, which is listed on the Thailand Stock Exchange, was
US$207.3 million (2016: US$193.2 million) and the carrying amount of the Group’s interest was US$25.6 million
(2016: US$22.6 million).
Country of incorporation and
place of listing
% of ownership interest
Nature of investments in material associates in 2017 and 2016:
Thailand/Thailand
Singapore/Unlisted
32
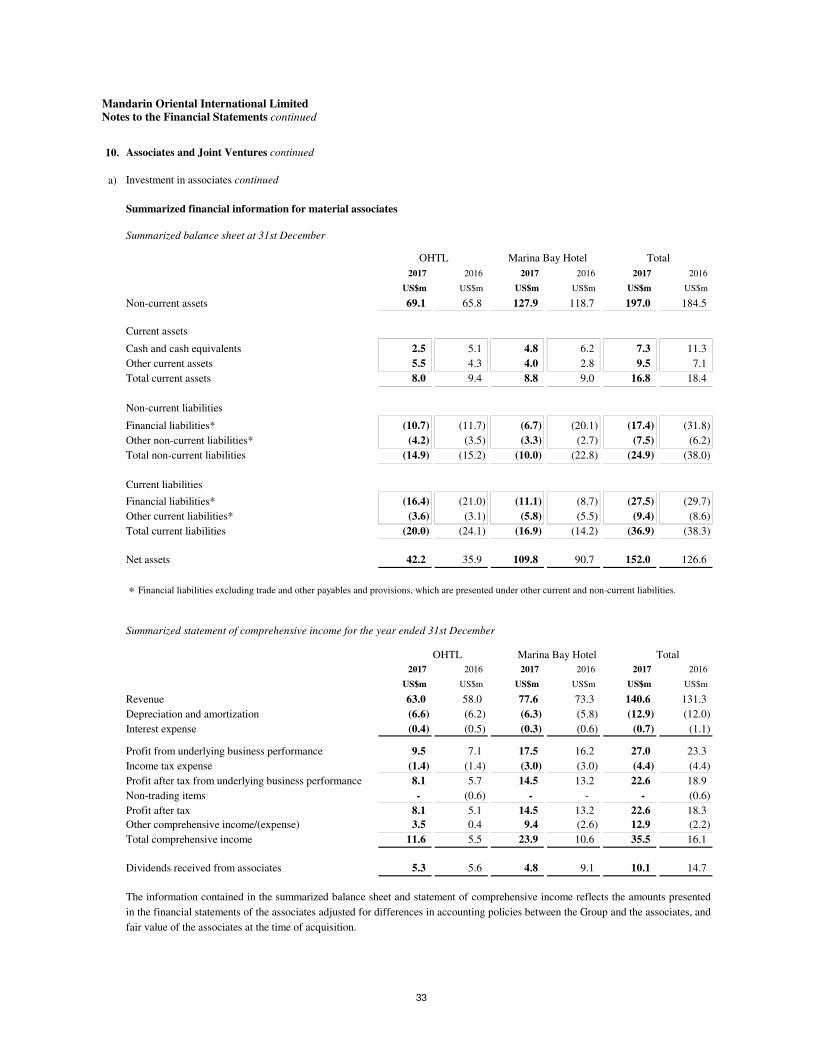
Mandarin Oriental International LimitedNotes to the Financial Statements continued
10. Associates and Joint Ventures continued
a) Investment in associates continued
Summarized financial information for material associates
Summarized balance sheet at 31st December
2017 2016 2017 2016 2017 2016
US$m US$m US$m US$m US$m US$m
Non-current assets 69.1 65.8 127.9 118.7 197.0 184.5
Current assets
Cash and cash equivalents 2.5 5.1 4.8 6.2 7.3 11.3
Other current assets 5.5 4.3 4.0 2.8 9.5 7.1
Total current assets 8.0 9.4 8.8 9.0 16.8 18.4
Non-current liabilities
Financial liabilities* (10.7) (11.7) (6.7) (20.1) (17.4) (31.8)
Other non-current liabilities* (4.2) (3.5) (3.3) (2.7) (7.5) (6.2)
Total non-current liabilities (14.9) (15.2) (10.0) (22.8) (24.9) (38.0)
Current liabilities
Financial liabilities* (16.4) (21.0) (11.1) (8.7) (27.5) (29.7)
Other current liabilities* (3.6) (3.1) (5.8) (5.5) (9.4) (8.6)
Total current liabilities (20.0) (24.1) (16.9) (14.2) (36.9) (38.3)
Net assets 42.2 35.9 109.8 90.7 152.0 126.6
*
Summarized statement of comprehensive income for the year ended 31st December
2017 2016 2017 2016 2017 2016
US$m US$m US$m US$m US$m US$m
Revenue 63.0 58.0 77.6 73.3 140.6 131.3
Depreciation and amortization (6.6) (6.2) (6.3) (5.8) (12.9) (12.0)
Interest expense (0.4) (0.5) (0.3) (0.6) (0.7) (1.1)
Profit from underlying business performance 9.5 7.1 17.5 16.2 27.0 23.3
Income tax expense (1.4) (1.4) (3.0) (3.0) (4.4) (4.4)
Profit after tax from underlying business performance 8.1 5.7 14.5 13.2 22.6 18.9
Non-trading items - (0.6) - - - (0.6)
Profit after tax 8.1 5.1 14.5 13.2 22.6 18.3
Other comprehensive income/(expense) 3.5 0.4 9.4 (2.6) 12.9 (2.2)
Total comprehensive income 11.6 5.5 23.9 10.6 35.5 16.1
Dividends received from associates 5.3 5.6 4.8 9.1 10.1 14.7
The information contained in the summarized balance sheet and statement of comprehensive income reflects the amounts presented
in the financial statements of the associates adjusted for differences in accounting policies between the Group and the associates, and
fair value of the associates at the time of acquisition.
OHTL Marina Bay Hotel Total
Financial liabilities excluding trade and other payables and provisions, which are presented under other current and non-current liabilities.
OHTL Marina Bay Hotel Total
33

Mandarin Oriental International LimitedNotes to the Financial Statements continued
10. Associates and Joint Ventures continued
a) Investment in associates continued
Reconciliation of the summarized financial information
2017 2016 2017 2016 2017 2016
US$m US$m US$m US$m US$m US$m
Net assets at 1st January 35.9 36.0 90.7 89.2 126.6 125.2
Profit for the year 8.1 5.1 14.5 13.2 22.6 18.3
Other comprehensive income/(expense) 3.5 0.4 9.4 (2.6) 12.9 (2.2)
Dividends paid (5.3) (5.6) (4.8) (9.1) (10.1) (14.7)
Net assets at 31st December 42.2 35.9 109.8 90.7 152.0 126.6
Effective interest in associates (%)* 47.6 47.6 50.0 50.0
Group’s share of net assets in associates 20.1 17.0 54.9 45.4 75.0 62.4
Notional goodwill* 5.5 5.5 - - 5.5 5.5
Carrying value 25.6 22.5 54.9 45.4 80.5 67.9
Fair value 207.3 193.2 N/A N/A 207.3 193.2
2017 2016
US$m US$m
Share of (loss)/profit (1.3) 0.8
Share of other comprehensive income/(expense) 2.1 (0.6)
Share of total comprehensive income 0.8 0.2
Carrying amount of interests in these associates 34.5 25.6
*
Contingent liabilities relating to the Group’s interest in associates
2017 2016
US$m US$m
Financial guarantee in respect of facilities made available to an associate 20.4 20.8
Reconciliation of the summarized financial information presented to the carrying amount of the Group’s interests in its material associates for the
year ended 31st December:
The Group has interests in a number of individually immaterial associates. The following table analyzes, in aggregate, the share of profit and
other comprehensive expense and carrying amount of these associates.
The guarantee in respect of facilities made available to an associate is stated at its contracted amount. The Directors are of the opinion that it is
not probable that this guarantee will be called upon.
OHTL repurchased some of its own shares in 2013 which were subsequently cancelled in 2016. The number of OHTL shares held by the
Group remained unchanged. As a result of the share repurchase, notional goodwill of US$5.5 million was recognized and the Group’s effective
interest increased to 47.6%.
OHTL Marina Bay Hotel Total
34

Mandarin Oriental International LimitedNotes to the Financial Statements continued
10. Associates and Joint Ventures continued
b)
Country of incorporation and
Name of entity Nature of business principal place of business 2017 2016
Ritz Madrid, S.A. Owner of Spain 50.0% 50.0%
("Ritz Madrid") Hotel Ritz, Madrid
Summarized financial information for material joint venture
Summarized balance sheet at 31st December
2017 2016
US$m US$m
Non-current assets 186.3 162.4
Current assets
Cash and cash equivalents 7.8 4.6
Other current assets 2.4 2.0
Total current assets 10.2 6.6
Non-current liabilities
Financial liabilities*+
(154.6) (133.8)
Other non-current liabilities* (38.5) (34.2)
Total non-current liabilities (193.1) (168.0)
Current liabilities
Other current liabilities* (8.1) (5.8)
Total current liabilities (8.1) (5.8)
Net liabilities (4.7) (4.8)
* +
Ritz Madrid
% of ownership interest
Investment in joint ventures
Nature of investment in material joint venture in 2017 and 2016:
The material joint venture of the Group is listed below. This joint venture has share capital consisting solely of ordinary
shares, which are held directly by the Group.
Financial liabilities excluding trade and other payables and provisions, which are presented under other current and non-current liabilities.
Including shareholders' loans from joint venture partners of US$154.6 million (2016: US$133.8 million).
35
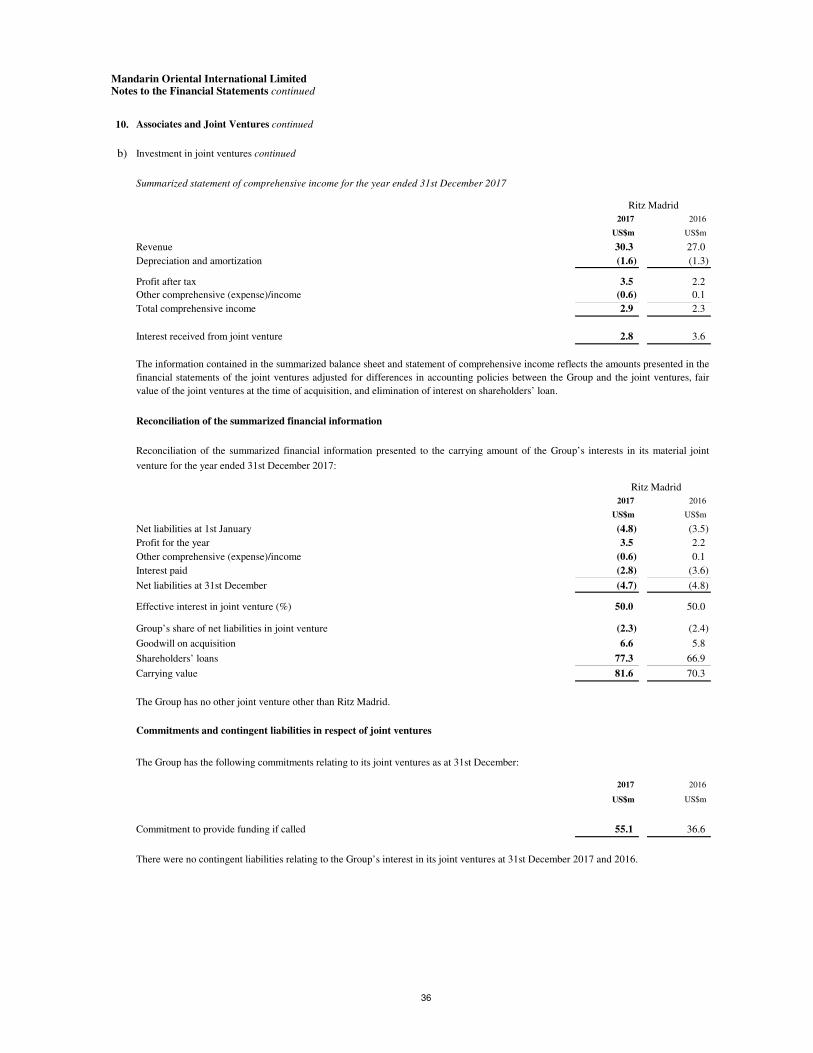
Mandarin Oriental International LimitedNotes to the Financial Statements continued
10. Associates and Joint Ventures continued
b)
2017 2016
US$m US$m
Revenue 30.3 27.0
Depreciation and amortization (1.6) (1.3)
Profit after tax 3.5 2.2
Other comprehensive (expense)/income (0.6) 0.1
Total comprehensive income 2.9 2.3
Interest received from joint venture 2.8 3.6
Reconciliation of the summarized financial information
2017 2016
US$m US$m
Net liabilities at 1st January (4.8) (3.5)
Profit for the year 3.5 2.2
Other comprehensive (expense)/income (0.6) 0.1
Interest paid (2.8) (3.6)
Net liabilities at 31st December (4.7) (4.8)
Effective interest in joint venture (%) 50.0 50.0
Group’s share of net liabilities in joint venture (2.3) (2.4)
Goodwill on acquisition 6.6 5.8
Shareholders’ loans 77.3 66.9
Carrying value 81.6 70.3
The Group has the following commitments relating to its joint ventures as at 31st December:
2017 2016
US$m US$m
Commitment to provide funding if called 55.1 36.6
There were no contingent liabilities relating to the Group’s interest in its joint ventures at 31st December 2017 and 2016.
Investment in joint ventures continued
Summarized statement of comprehensive income for the year ended 31st December 2017
Commitments and contingent liabilities in respect of joint ventures
Ritz Madrid
Ritz Madrid
The information contained in the summarized balance sheet and statement of comprehensive income reflects the amounts presented in the
financial statements of the joint ventures adjusted for differences in accounting policies between the Group and the joint ventures, fair
value of the joint ventures at the time of acquisition, and elimination of interest on shareholders’ loan.
Reconciliation of the summarized financial information presented to the carrying amount of the Group’s interests in its material joint
venture for the year ended 31st December 2017:
The Group has no other joint venture other than Ritz Madrid.
36

Mandarin Oriental International LimitedNotes to the Financial Statements continued
11. Deferred Tax Assets/(Liabilities)
Unremitted Provisions
Fair value earnings in and other
Accelerated tax gains/ Employee associates/ temporary
depreciation losses Losses benefits joint ventures differences Total
US$m US$m US$m US$m US$m US$m US$m
2017
At 1st January (52.6) 0.1 1.1 0.5 (1.4) (1.2) (53.5)
Exchange differences (1.2) - 0.1 - (0.1) (0.1) (1.3)
(Charged)/credited to profit and loss (0.4) - 6.6 - - 2.4 8.6
Charged to other
comprehensive income - (0.2) - (1.2) - - (1.4)
At 31st December (54.2) (0.1) 7.8 (0.7) (1.5) 1.1 (47.6)
Deferred tax assets 0.3 - 7.8 0.4 - 2.5 11.0
Deferred tax liabilities (54.5) (0.1) - (1.1) (1.5) (1.4) (58.6)
(54.2) (0.1) 7.8 (0.7) (1.5) 1.1 (47.6)
2016
At 1st January (56.4) 0.5 1.1 - (1.4) (0.8) (57.0)
Exchange differences 2.2 - - - - - 2.2
Credited/(charged) to profit and loss 1.6 - - - - (0.4) 1.2
(Charged)/credited to other
comprehensive income - (0.4) - 0.5 - - 0.1
At 31st December (52.6) 0.1 1.1 0.5 (1.4) (1.2) (53.5)
Deferred tax assets 0.1 0.1 1.1 1.2 - 0.1 2.6
Deferred tax liabilities (52.7) - - (0.7) (1.4) (1.3) (56.1)
(52.6) 0.1 1.1 0.5 (1.4) (1.2) (53.5)
Deferred tax balances predominantly comprise non-current items. Deferred tax assets and liabilities are netted when the taxes
relate to the same taxation authority and where offsetting is allowed.
Deferred tax assets of US$48.8 million (2016: US$48.7 million) arising from unused tax losses of US$198.2 million
(2016: US$186.7 million) have not been recognized in the financial statements. Included in the unused tax losses, US$165.5
million have no expiry date and the balance will expire at various dates up to and including 2037.
Deferred tax assets of US$1.1 million (2016: US$3.4 million) have not been recognized in relation to temporary differences in
subsidiaries.
The Group has no unrecognized deferred tax liabilities arising on temporary differences associated with investments in subsidiaries
at 31st December 2017 and 2016.
37

Mandarin Oriental International LimitedNotes to the Financial Statements continued
12. Pension Plans
The amounts recognized in the consolidated balance sheet are as follows:
2017 2016
US$m US$m
Fair value of plan assets 73.1 65.6
Present value of funded obligations (68.2) (68.8)
4.9 (3.2)
(0.6) -
4.3 (3.2)
Analysis of net pension assets/(liabilities)
4.9 -
Pension liabilities (0.6) (3.2)
4.3 (3.2)
Pension assets
The Group operates defined benefit pension plans in the main territories in which it operates, with the majority of the plans in
Hong Kong. Most of the pension plans are final salary defined benefit plans calculated based on a members’ length of
service and their salaries in the final years leading up to retirement. In Hong Kong, the pension benefits are paid in one lump
sum. With the exception of certain plans in Hong Kong, all the defined benefit plans are closed to new members. In addition,
although all plans are impacted by the discount rate, liabilities are driven by salary growth.
The Group’s defined benefit plans are either funded or unfunded, with the assets of the funded plans held independently of
the Group’s assets in separate trustee administered funds. Plan assets held in trusts are governed by local regulations and
practice in each country. Responsibility for governance of the plans, including investment decisions and contribution
schedules, lies jointly with the Company and the boards of trustees. The Group’s major plans are valued by independent
actuaries annually using the projected unit credit method.
Present value of unfunded obligations
Net pension assets/(liabilities)
38
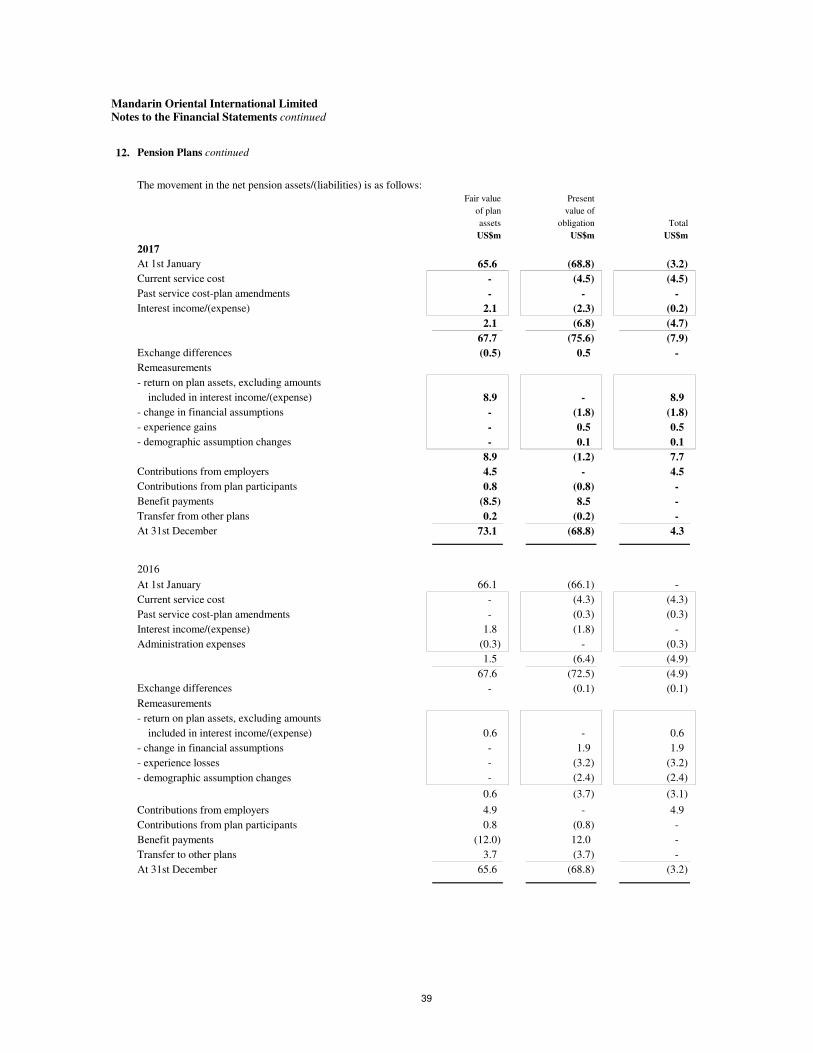
Mandarin Oriental International LimitedNotes to the Financial Statements continued
12. Pension Plans continued
The movement in the net pension assets/(liabilities) is as follows: Fair value Present
of plan value of
assets obligation Total
US$m US$m US$m
2017
At 1st January 65.6 (68.8) (3.2)
Current service cost - (4.5) (4.5)
Past service cost-plan amendments - - -
Interest income/(expense) 2.1 (2.3) (0.2)
2.1 (6.8) (4.7)
67.7 (75.6) (7.9)
Exchange differences (0.5) 0.5 -
Remeasurements
- return on plan assets, excluding amounts
included in interest income/(expense) 8.9 - 8.9
- change in financial assumptions - (1.8) (1.8)
- experience gains - 0.5 0.5
- demographic assumption changes - 0.1 0.1
8.9 (1.2) 7.7
Contributions from employers 4.5 - 4.5
Contributions from plan participants 0.8 (0.8) -
Benefit payments (8.5) 8.5 -
Transfer from other plans 0.2 (0.2) -
At 31st December 73.1 (68.8) 4.3
2016
At 1st January 66.1 (66.1) -
Current service cost - (4.3) (4.3)
Past service cost-plan amendments - (0.3) (0.3)
Interest income/(expense) 1.8 (1.8) -
Administration expenses (0.3) - (0.3)
1.5 (6.4) (4.9)
67.6 (72.5) (4.9)
- (0.1) (0.1)
Remeasurements
- return on plan assets, excluding amounts
included in interest income/(expense) 0.6 - 0.6
- change in financial assumptions - 1.9 1.9
- experience losses - (3.2) (3.2)
- demographic assumption changes - (2.4) (2.4)
0.6 (3.7) (3.1)
Contributions from employers 4.9 - 4.9
Contributions from plan participants 0.8 (0.8) -
Benefit payments (12.0) 12.0 -
Transfer to other plans 3.7 (3.7) -
At 31st December 65.6 (68.8) (3.2)
Exchange differences
39
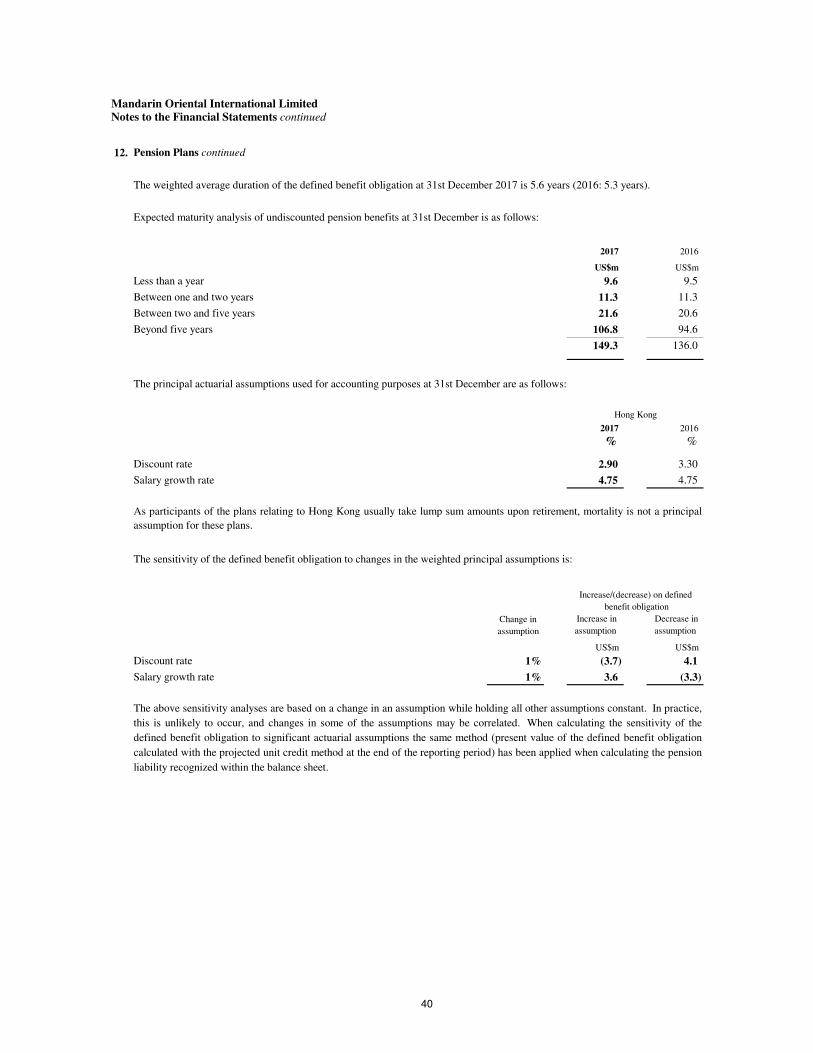
Mandarin Oriental International LimitedNotes to the Financial Statements continued
12. Pension Plans continued
The weighted average duration of the defined benefit obligation at 31st December 2017 is 5.6 years (2016: 5.3 years).
Expected maturity analysis of undiscounted pension benefits at 31st December is as follows:
2017 2016
US$m US$m
Less than a year 9.6 9.5
Between one and two years 11.3 11.3
Between two and five years 21.6 20.6
Beyond five years 106.8 94.6
149.3 136.0
The principal actuarial assumptions used for accounting purposes at 31st December are as follows:
2017 2016
% %
Discount rate 2.90 3.30
Salary growth rate 4.75 4.75
The sensitivity of the defined benefit obligation to changes in the weighted principal assumptions is:
Change in
assumption
US$m US$m
Discount rate 1% (3.7) 4.1
Salary growth rate 1% 3.6 (3.3)
Hong Kong
As participants of the plans relating to Hong Kong usually take lump sum amounts upon retirement, mortality is not a principal
assumption for these plans.
The above sensitivity analyses are based on a change in an assumption while holding all other assumptions constant. In practice,
this is unlikely to occur, and changes in some of the assumptions may be correlated. When calculating the sensitivity of the
defined benefit obligation to significant actuarial assumptions the same method (present value of the defined benefit obligation
calculated with the projected unit credit method at the end of the reporting period) has been applied when calculating the pension
liability recognized within the balance sheet.
Decrease in
assumption
Increase in
assumption
benefit obligation
Increase/(decrease) on defined
40

Mandarin Oriental International LimitedNotes to the Financial Statements continued
12. Pension Plans continued
The analysis of the fair value of plan assets at 31st December is as follows:
Asia North
Pacific Europe America Global Total
US$m US$m US$m US$m US$m
2017
Quoted investments
Equity instruments 5.1 - - - 5.1
Investment funds 16.0 4.4 13.3 10.1 43.8
21.1 4.4 13.3 10.1 48.9
Unquoted investments
Investment funds 0.6 0.5 0.8 21.9 23.8
Total investments 21.7 4.9 14.1 32.0 72.7
Cash and cash equivalents 0.4
73.1
2016
Quoted investments
Equity instruments 5.0 - - - 5.0
Investment funds 10.1 4.1 11.3 7.5 33.0
15.1 4.1 11.3 7.5 38.0
Unquoted investments
Investment funds 0.6 0.3 0.3 21.8 23.0
Total investments 15.7 4.4 11.6 29.3 61.0
Cash and cash equivalents 4.6
65.6
The defined benefit plans in Hong Kong have strategic asset allocation for its closed plans. The closed plans have an equity/debt
allocation of 55/45 split.
The strategic asset allocation is derived from the asset-liability modeling (‘ALM’) review, done triennially to ensure the plans can
meet future funding and solvency requirements. The last ALM review was completed in 2015, with the new strategic asset allocations
adopted in 2015. The next ALM review is scheduled for 2018.
41

Mandarin Oriental International LimitedNotes to the Financial Statements continued
12. Pension Plans continued
Asset volatility
Change in bond yields
Inflation risk
The Group maintains an active and regular contribution schedule across all the plans. The contributions to all its plans in 2017
were US$4.5 million and the estimated amount of contributions expected to be paid to all its plans in 2018 is US$4.8 million.
Investments across the plans are well diversified, such that the failure of any single investment would not have a material impact
on the overall level of assets.
At 31st December 2017, the Hong Kong plans had assets of US$73.1 million (2016: US$65.6 million). These assets were
invested 30% in Asia Pacific, 7% in Europe, 19% in North America with the balance of 44% invested in Global (2016: 26%, 7%,
19% and 48%, respectively). Within Asia Pacific, 30% was invested in Hong Kong equities. In 2017, 67% and 33% of the
investments were in quoted and unquoted instruments respectively. In 2016, the split was 62% and 38% respectively. The high
percentage of quoted instruments provides liquidity to fund drawdowns and benefit payments. Within the quoted equity allocation,
the plan is well diversified in terms of sectors, with the top three being financials, technology and consumer goods with a
combined fair value of US$3.8 million. In 2016, the top three sectors were financials, technology and industrials with a combined
fair value of US$3.4 million.
In Hong Kong, where the Group has closed plans, the assets and liabilities mix are distinct to reduce the level of investment risk to
the plan. In 2017, the closed plans exited from commodities and increased allocations to hedge funds. The plans also reduced
their allocations to global fixed income by holding cash and investing a portion to Asian fixed income to reduce volatility risks.
Management believes the long-term nature of the plan liabilities and the strength of the Group supports a level of equity
investment as part of the Group’s long term strategy to manage the plans efficiently.
The Group ensures that the investment positions are managed within an ALM framework that is developed to achieve long-term
returns that are in line with the obligations under the pension schemes. Within the ALM framework, the Group’s objective is to
match assets to the pension obligations by investing in a well-diversified portfolio that generates sufficient risk-adjusted returns
that match the benefit payments. The Group also actively monitors the duration and the expected yield of the investments to
ensure it matches the expected cash outflows arising from the pension obligations.
The majority of the Group’s plan assets are unaffected by inflation.
A decrease in corporate bond yields will increase plan liabilities, although this will be partially offset by an increase in the value of
the plans’ bond holdings.
The plan liabilities are calculated using a discount rate set with reference to corporate bond yields; if plan assets underperform this
yield, this will create a deficit. The Group’s defined benefit plans hold a significant proportion of equities, which are expected to
outperform corporate bonds in the long term while generating volatility and risk in the short term.
Through its defined benefit pension plans, the Group is expected to be exposed to a number of risks such as asset volatility
changes in bond yields and inflation risk, the most significant of which are detailed below:
42
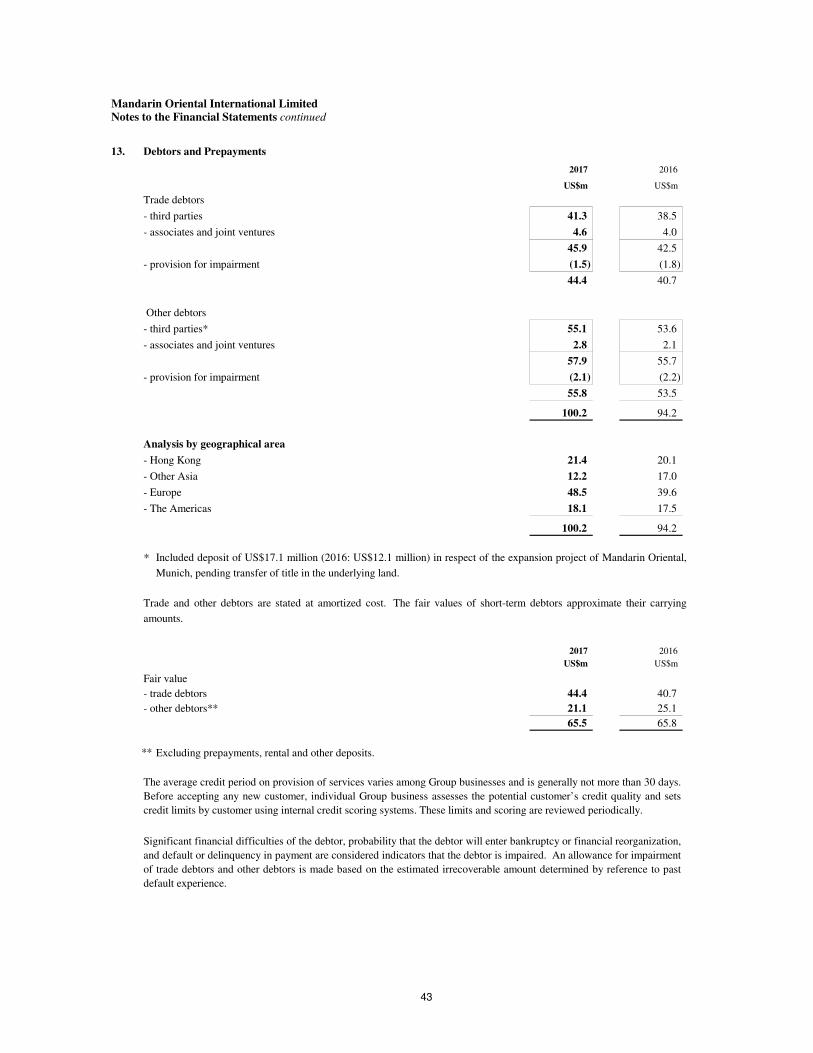
Mandarin Oriental International LimitedNotes to the Financial Statements continued
13. Debtors and Prepayments
2017 2016
US$m US$m
Trade debtors
- third parties 41.3 38.5
- associates and joint ventures 4.6 4.0
45.9 42.5
- provision for impairment (1.5) (1.8)
44.4 40.7
Other debtors
- third parties* 55.1 53.6
- associates and joint ventures 2.8 2.1
57.9 55.7
- provision for impairment (2.1) (2.2)
55.8 53.5
100.2 94.2
Analysis by geographical area
- Hong Kong 21.4 20.1
- Other Asia 12.2 17.0
- Europe 48.5 39.6
- The Americas 18.1 17.5
100.2 94.2
*
2017 2016
US$m US$m
Fair value
- trade debtors 44.4 40.7
- other debtors** 21.1 25.1
65.5 65.8
** Excluding prepayments, rental and other deposits.
Significant financial difficulties of the debtor, probability that the debtor will enter bankruptcy or financial reorganization,
and default or delinquency in payment are considered indicators that the debtor is impaired. An allowance for impairment
of trade debtors and other debtors is made based on the estimated irrecoverable amount determined by reference to past
default experience.
Included deposit of US$17.1 million (2016: US$12.1 million) in respect of the expansion project of Mandarin Oriental,
Munich, pending transfer of title in the underlying land.
The average credit period on provision of services varies among Group businesses and is generally not more than 30 days.
Before accepting any new customer, individual Group business assesses the potential customer’s credit quality and sets
credit limits by customer using internal credit scoring systems. These limits and scoring are reviewed periodically.
Trade and other debtors are stated at amortized cost. The fair values of short-term debtors approximate their carrying
amounts.
43
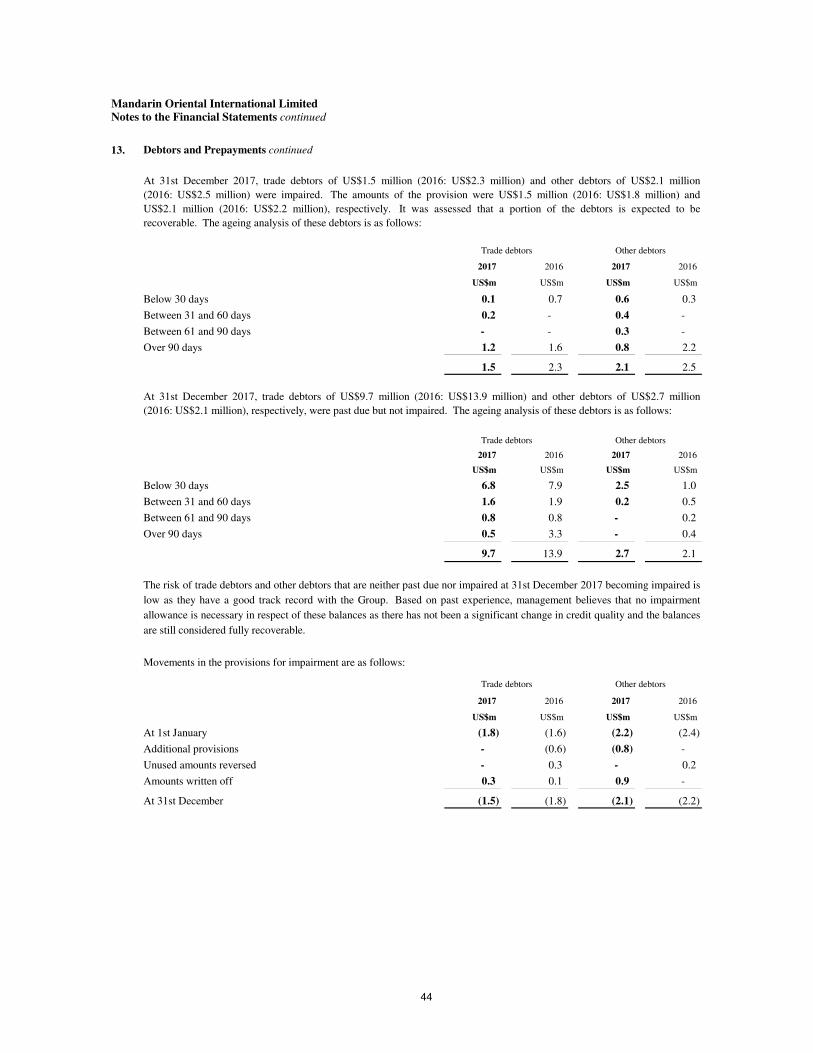
Mandarin Oriental International LimitedNotes to the Financial Statements continued
13. Debtors and Prepayments continued
2017 2016 2017 2016
US$m US$m US$m US$m
Below 30 days 0.1 0.7 0.6 0.3
Between 31 and 60 days 0.2 - 0.4 -
Between 61 and 90 days - - 0.3 -
Over 90 days 1.2 1.6 0.8 2.2
1.5 2.3 2.1 2.5
2017 2016 2017 2016
US$m US$m US$m US$m
Below 30 days 6.8 7.9 2.5 1.0
Between 31 and 60 days 1.6 1.9 0.2 0.5
Between 61 and 90 days 0.8 0.8 - 0.2
Over 90 days 0.5 3.3 - 0.4
9.7 13.9 2.7 2.1
Movements in the provisions for impairment are as follows:
2017 2016 2017 2016
US$m US$m US$m US$m
At 1st January (1.8) (1.6) (2.2) (2.4)
Additional provisions - (0.6) (0.8) -
Unused amounts reversed - 0.3 - 0.2
Amounts written off 0.3 0.1 0.9 -
At 31st December (1.5) (1.8) (2.1) (2.2)
Trade debtors Other debtors
The risk of trade debtors and other debtors that are neither past due nor impaired at 31st December 2017 becoming impaired is
low as they have a good track record with the Group. Based on past experience, management believes that no impairment
allowance is necessary in respect of these balances as there has not been a significant change in credit quality and the balances
are still considered fully recoverable.
Trade debtors
At 31st December 2017, trade debtors of US$1.5 million (2016: US$2.3 million) and other debtors of US$2.1 million
(2016: US$2.5 million) were impaired. The amounts of the provision were US$1.5 million (2016: US$1.8 million) and
US$2.1 million (2016: US$2.2 million), respectively. It was assessed that a portion of the debtors is expected to be
recoverable. The ageing analysis of these debtors is as follows:
At 31st December 2017, trade debtors of US$9.7 million (2016: US$13.9 million) and other debtors of US$2.7 million
(2016: US$2.1 million), respectively, were past due but not impaired. The ageing analysis of these debtors is as follows:
Other debtors
Trade debtors Other debtors
44

Mandarin Oriental International LimitedNotes to the Financial Statements continued
13. Debtors and Prepayments continued
Other debtors are further analyzed as follows:
2017 2016
US$m US$m
Other amounts due from associates and joint ventures 2.8 2.1
Other receivables 18.3 23.0
Financial assets 21.1 25.1
Prepayments 13.8 12.1
Rental and other deposits 20.8 16.2
Other 0.1 0.1
55.8 53.5
No debtors and prepayments have been pledged as security.
14. Bank and Cash Balances
2017 2016
US$m US$m
Deposits with banks and financial institutions 75.0 96.7
Bank balances 107.8 84.9
Cash balances 1.1 1.0
183.9 182.6
Analysis by currency
- Euro 26.9 12.2
- Hong Kong dollar 16.1 16.9
- Indonesian rupiah 13.4 13.8
- Japanese yen 19.0 16.7
- Swiss franc 4.4 3.1
- United Kingdom sterling 15.1 25.6
- United States dollar 81.8 89.0
- Other 7.2 5.3
183.9 182.6
The weighted average interest rate on deposits with banks and financial institutions is 1.1% (2016: 0.9%) per annum.
45
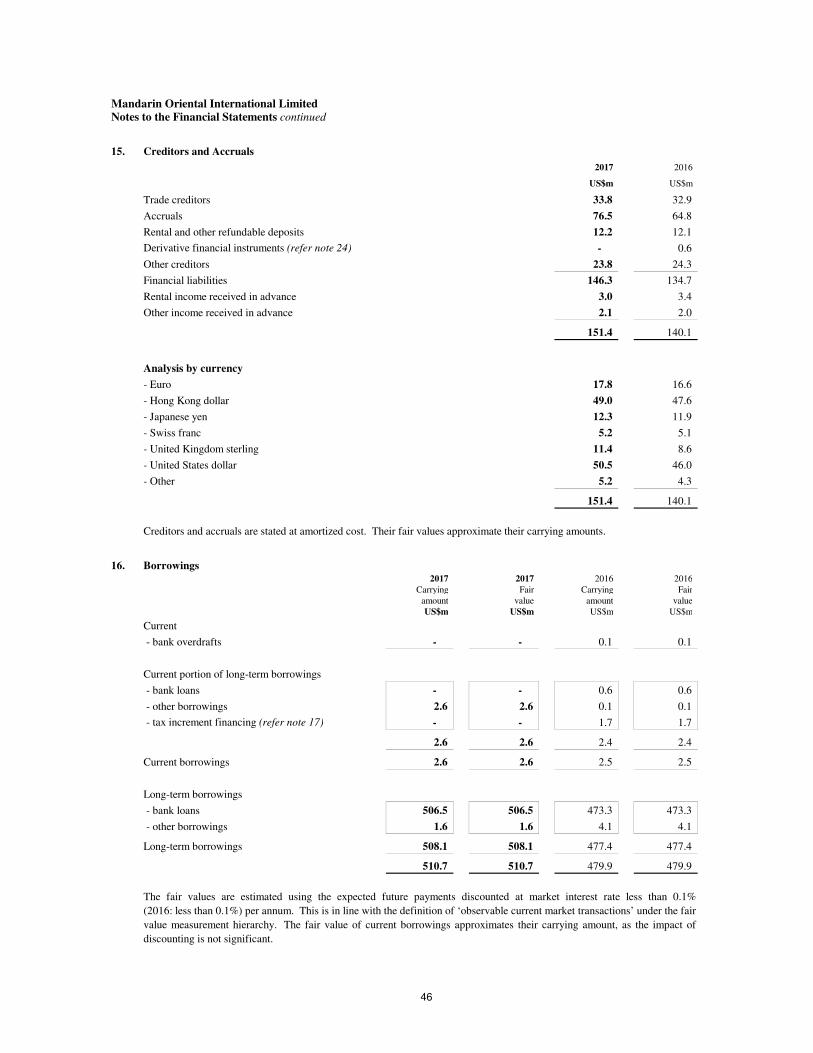
Mandarin Oriental International LimitedNotes to the Financial Statements continued
15. Creditors and Accruals
2017 2016
US$m US$m
Trade creditors 33.8 32.9
Accruals 76.5 64.8
Rental and other refundable deposits 12.2 12.1
Derivative financial instruments (refer note 24) - 0.6
Other creditors 23.8 24.3
Financial liabilities 146.3 134.7
Rental income received in advance 3.0 3.4
Other income received in advance 2.1 2.0
151.4 140.1
Analysis by currency
- Euro 17.8 16.6
- Hong Kong dollar 49.0 47.6
- Japanese yen 12.3 11.9
- Swiss franc 5.2 5.1
- United Kingdom sterling 11.4 8.6
- United States dollar 50.5 46.0
- Other 5.2 4.3
151.4 140.1
16. Borrowings2017 2017 2016 2016
Carrying Fair Carrying Fair
amount value amount value
US$m US$m US$m US$m
Current
- bank overdrafts - - 0.1 0.1
Current portion of long-term borrowings
- bank loans - - 0.6 0.6
- other borrowings 2.6 2.6 0.1 0.1
- tax increment financing (refer note 17) - - 1.7 1.7
2.6 2.6 2.4 2.4
Current borrowings 2.6 2.6 2.5 2.5
Long-term borrowings
- bank loans 506.5 506.5 473.3 473.3
- other borrowings 1.6 1.6 4.1 4.1
Long-term borrowings 508.1 508.1 477.4 477.4
510.7 510.7 479.9 479.9
The fair values are estimated using the expected future payments discounted at market interest rate less than 0.1%
(2016: less than 0.1%) per annum. This is in line with the definition of ‘observable current market transactions’ under the fair
value measurement hierarchy. The fair value of current borrowings approximates their carrying amount, as the impact of
discounting is not significant.
Creditors and accruals are stated at amortized cost. Their fair values approximate their carrying amounts.
46

Mandarin Oriental International LimitedNotes to the Financial Statements continued
16. Borrowings continued
2017 2016
US$m US$m
Secured 508.2 475.6
Unsecured 2.5 4.3
510.7 479.9
The borrowings at 31st December are further summarized as follows:
Weighted Weightedaverage average period Floating rate
interest rates outstanding borrowings Total% Years US$m US$m US$m
2017
Hong Kong dollar 2.7 1.5 118.3 302.5 420.8
Swiss franc 2.6 14.0 1.7 2.5 4.2
United Kingdom sterling 1.5 - - 85.7 85.7
120.0 390.7 510.7
2016
Euro 2.0 0.4 0.6 - 0.6
Hong Kong dollar 2.5 1.5 119.3 305.0 424.3
Swiss franc 2.6 15.0 1.7 2.5 4.2
United Kingdom sterling 1.4 - - 49.1 49.1
United States dollar 6.0 0.3 1.7 - 1.7
123.3 356.6 479.9
2017 2016
US$m US$m
Within one year 390.7 413.8
Between one and two years 118.3 -
Between two and three years - 64.4
Between three and four years - -
Between four and five years - -
Beyond five years 1.7 1.7
510.7 479.9
Fixed rate borrowings
The weighted average interest rates and period of fixed rate borrowings are stated after taking into account of hedging
transactions (refer note 24).
The exposure of the Group’s borrowings to interest rate changes and the contractual repricing dates at 31st December
after taking into account hedging transactions are as follows:
Borrowings of US$508.2 million (2016: US$475.6 million) are secured against the tangible fixed assets of certain
subsidiaries. The book value of these tangible fixed assets at 31st December 2017 was US$477.7 million
(2016: US$457.9 million).
47
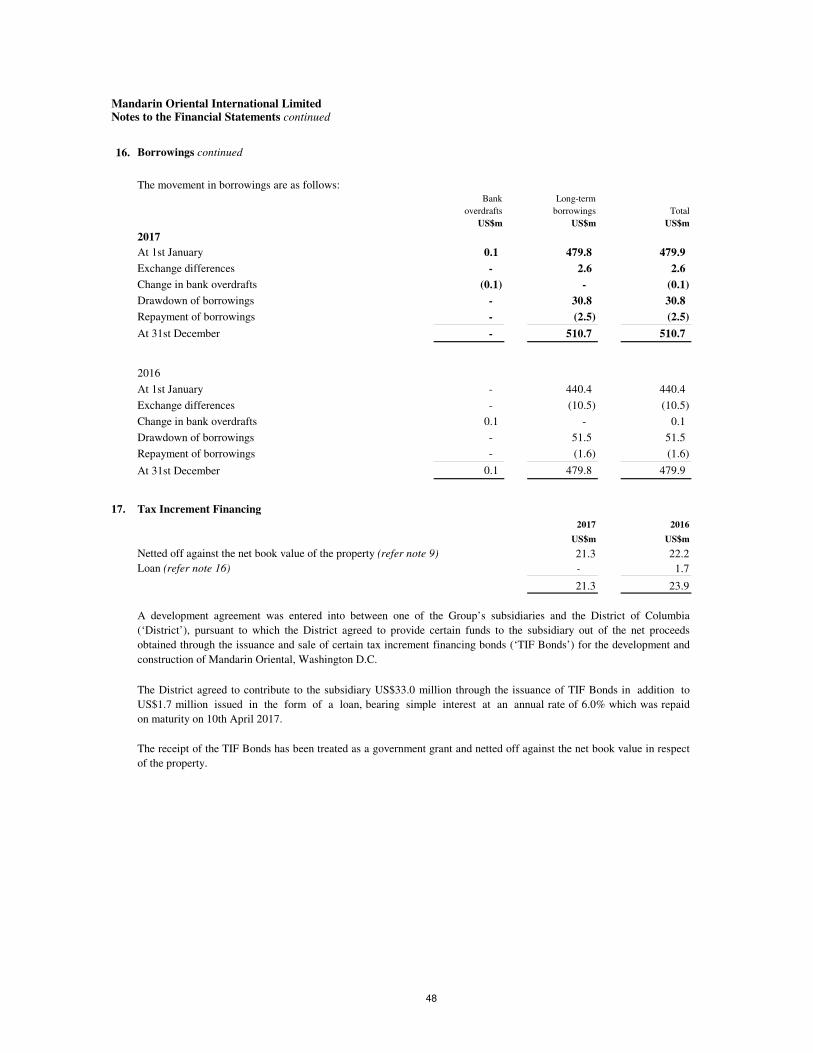
Mandarin Oriental International LimitedNotes to the Financial Statements continued
16. Borrowings continued
The movement in borrowings are as follows:Bank Long-term
overdrafts borrowings Total
US$m US$m US$m
2017
At 1st January 0.1 479.8 479.9
Exchange differences - 2.6 2.6
Change in bank overdrafts (0.1) - (0.1)
Drawdown of borrowings - 30.8 30.8
Repayment of borrowings - (2.5) (2.5)
At 31st December - 510.7 510.7
2016
At 1st January - 440.4 440.4
Exchange differences - (10.5) (10.5)
Change in bank overdrafts 0.1 - 0.1
Drawdown of borrowings - 51.5 51.5
Repayment of borrowings - (1.6) (1.6)
0.1 479.8 479.9
17. Tax Increment Financing
2017 2016
US$m US$m
Netted off against the net book value of the property (refer note 9) 21.3 22.2
Loan (refer note 16) - 1.7
21.3 23.9
The receipt of the TIF Bonds has been treated as a government grant and netted off against the net book value in respect
of the property.
At 31st December
A development agreement was entered into between one of the Group’s subsidiaries and the District of Columbia
(‘District’), pursuant to which the District agreed to provide certain funds to the subsidiary out of the net proceeds
obtained through the issuance and sale of certain tax increment financing bonds (‘TIF Bonds’) for the development and
construction of Mandarin Oriental, Washington D.C.
The District agreed to contribute to the subsidiary US$33.0 million through the issuance of TIF Bonds in addition to
US$1.7 million issued in the form of a loan, bearing simple interest at an annual rate of 6.0% which was repaid
on maturity on 10th April 2017.
48
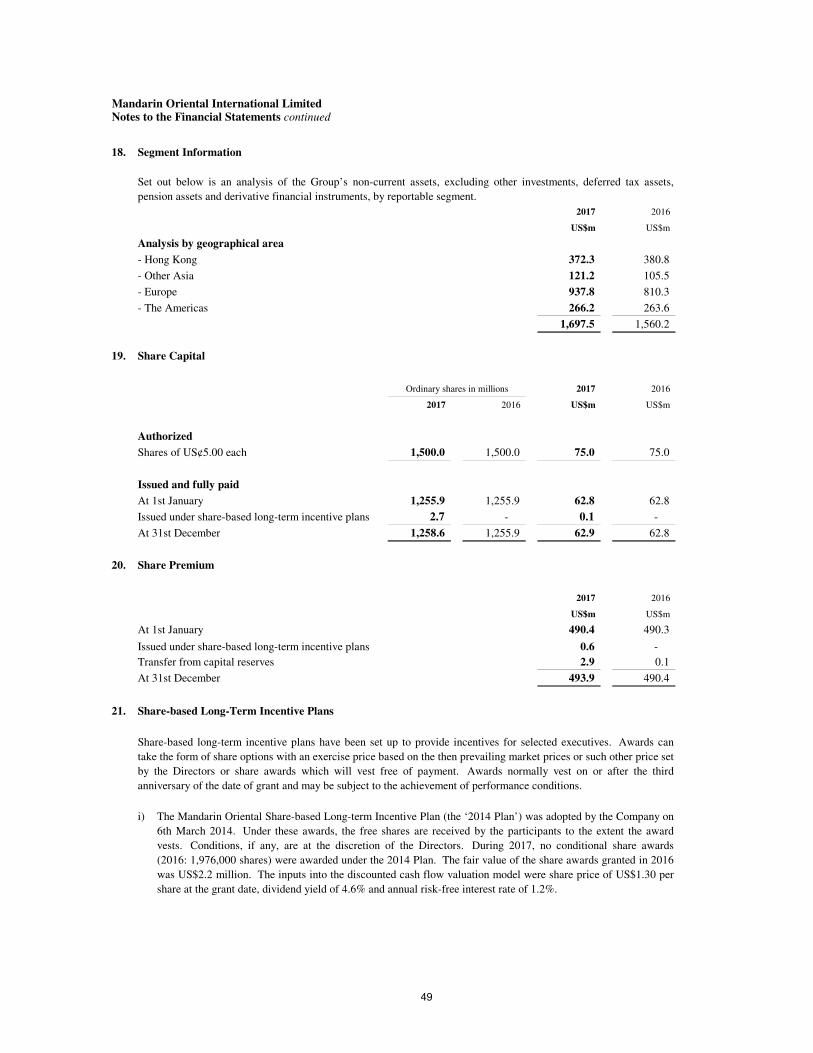
Mandarin Oriental International LimitedNotes to the Financial Statements continued
18. Segment Information
2017 2016
US$m US$m
Analysis by geographical area
- Hong Kong 372.3 380.8
- Other Asia 121.2 105.5
- Europe 937.8 810.3
- The Americas 266.2 263.6
1,697.5 1,560.2
19. Share Capital
Ordinary shares in millions 2017 2016
2017 2016 US$m US$m
Authorized
Shares of US¢5.00 each 1,500.0 1,500.0 75.0 75.0
Issued and fully paid
At 1st January 1,255.9 1,255.9 62.8 62.8
Issued under share-based long-term incentive plans 2.7 - 0.1 -
At 31st December 1,258.6 1,255.9 62.9 62.8
20. Share Premium
2017 2016
US$m US$m
At 1st January 490.4 490.3
0.6 -
Transfer from capital reserves 2.9 0.1
At 31st December 493.9 490.4
21. Share-based Long-Term Incentive Plans
i) The Mandarin Oriental Share-based Long-term Incentive Plan (the ‘2014 Plan’) was adopted by the Company on
6th March 2014. Under these awards, the free shares are received by the participants to the extent the award
vests. Conditions, if any, are at the discretion of the Directors. During 2017, no conditional share awards
(2016: 1,976,000 shares) were awarded under the 2014 Plan. The fair value of the share awards granted in 2016
was US$2.2 million. The inputs into the discounted cash flow valuation model were share price of US$1.30 per
share at the grant date, dividend yield of 4.6% and annual risk-free interest rate of 1.2%.
Set out below is an analysis of the Group’s non-current assets, excluding other investments, deferred tax assets,
pension assets and derivative financial instruments, by reportable segment.
Share-based long-term incentive plans have been set up to provide incentives for selected executives. Awards can
take the form of share options with an exercise price based on the then prevailing market prices or such other price set
by the Directors or share awards which will vest free of payment. Awards normally vest on or after the third
anniversary of the date of grant and may be subject to the achievement of performance conditions.
Issued under share-based long-term incentive plans
49

Mandarin Oriental International LimitedNotes to the Financial Statements continued
21. Share-based Long-Term Incentive Plans continued
Movements of the outstanding conditional awards during the year:
2017 2016
At 1st January 5.3 3.5
Granted - 2.0
Released (1.7) -
Cancelled (0.1) (0.2)
At 31st December 3.5 5.3
Awards vest date 2017 2016
2017 - 1.8
2018 1.6 1.6
2019 1.9 1.9
Total outstanding 3.5 5.3
ii)
Weighted average Weighted average
exercise price Options exercise price Options
US$ in millions US$ in millions
At 1st January 1.61 31.4 1.61 32.5
Exercised 1.45 (7.8) 1.20 (0.3)
Cancelled 1.66 (15.3) 1.82 (0.8)
At 31st December 1.67 8.3 1.61 31.4
The average share price during the year was US$1.78 (2016: US$1.36) per share.
Outstanding options at 31st December:
Exercise
price
Expiry date US$ 2017 2016
2017 - 3.6
2018 1.08-1.63 0.5 6.8
2019 0.66 0.2 1.2
2020 1.36 0.7 3.0
2021 1.99 2.8 4.3
2022 1.61 2.5 6.7
2023 1.57 1.6 5.8
Total outstanding 8.3 31.4
of which exercisable 8.3 31.4
2016
Conditional awards
in millions
Outstanding conditional awards at 31st December:
Ordinary shares
in millions
Ordinary shares
in millions
Prior to the adoption of the 2014 Plan, The Mandarin Oriental International Share Option Plan 2005 provided selected
executives with options to purchase ordinary shares in the Company. The exercise price of the granted options was based
on the average market price for the five trading days immediately preceding the date of grant of the options. Options are
vested over a period of up to three years and are exercisable for up to ten years following the date of grant.
Movements of the outstanding options during the year:
2017
50
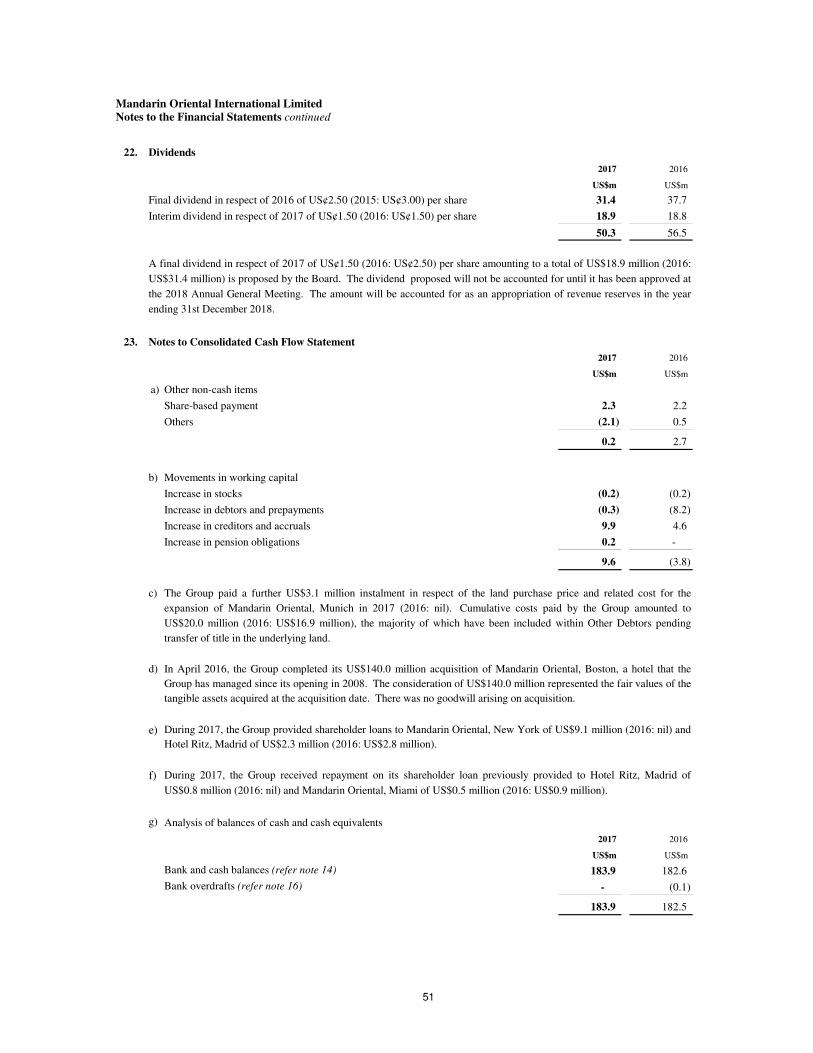
Mandarin Oriental International LimitedNotes to the Financial Statements continued
22. Dividends
2017 2016
US$m US$m
Final dividend in respect of 2016 of US¢2.50 (2015: US¢3.00) per share 31.4 37.7
Interim dividend in respect of 2017 of US¢1.50 (2016: US¢1.50) per share 18.9 18.8
50.3 56.5
23. Notes to Consolidated Cash Flow Statement
2017 2016
US$m US$m
a) Other non-cash items
Share-based payment 2.3 2.2
Others (2.1) 0.5
0.2 2.7
b) Movements in working capital
Increase in stocks (0.2) (0.2)
Increase in debtors and prepayments (0.3) (8.2)
Increase in creditors and accruals 9.9 4.6
Increase in pension obligations 0.2 -
9.6 (3.8)
c)
d)
e)
f)
g) Analysis of balances of cash and cash equivalents
2017 2016
US$m US$m
Bank and cash balances (refer note 14) 183.9 182.6
Bank overdrafts (refer note 16) - (0.1)
183.9 182.5
A final dividend in respect of 2017 of US¢1.50 (2016: US¢2.50) per share amounting to a total of US$18.9 million (2016:
US$31.4 million) is proposed by the Board. The dividend proposed will not be accounted for until it has been approved at
the 2018 Annual General Meeting. The amount will be accounted for as an appropriation of revenue reserves in the year
ending 31st December 2018.
The Group paid a further US$3.1 million instalment in respect of the land purchase price and related cost for the
expansion of Mandarin Oriental, Munich in 2017 (2016: nil). Cumulative costs paid by the Group amounted to
US$20.0 million (2016: US$16.9 million), the majority of which have been included within Other Debtors pending
transfer of title in the underlying land.
In April 2016, the Group completed its US$140.0 million acquisition of Mandarin Oriental, Boston, a hotel that the
Group has managed since its opening in 2008. The consideration of US$140.0 million represented the fair values of the
tangible assets acquired at the acquisition date. There was no goodwill arising on acquisition.
During 2017, the Group received repayment on its shareholder loan previously provided to Hotel Ritz, Madrid of
US$0.8 million (2016: nil) and Mandarin Oriental, Miami of US$0.5 million (2016: US$0.9 million).
During 2017, the Group provided shareholder loans to Mandarin Oriental, New York of US$9.1 million (2016: nil) and
Hotel Ritz, Madrid of US$2.3 million (2016: US$2.8 million).
51
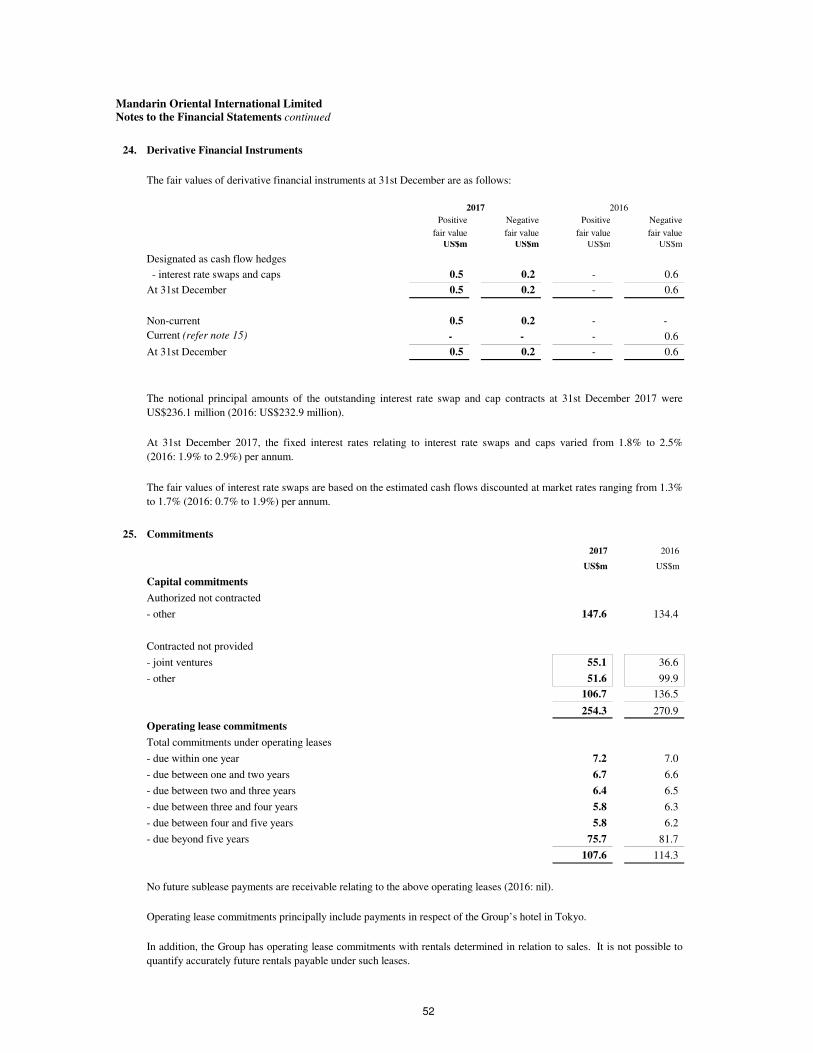
Mandarin Oriental International LimitedNotes to the Financial Statements continued
24. Derivative Financial Instruments
The fair values of derivative financial instruments at 31st December are as follows:
Positive Negative Positive Negative
fair value fair value fair value fair value
US$m US$m US$m US$m
Designated as cash flow hedges
- interest rate swaps and caps 0.5 0.2 - 0.6
At 31st December 0.5 0.2 - 0.6
Non-current 0.5 0.2 - -
Current (refer note 15) - - - 0.6
At 31st December 0.5 0.2 - 0.6
25. Commitments
2017 2016
US$m US$m
Capital commitments
Authorized not contracted
- other 147.6 134.4
Contracted not provided
- joint ventures 55.1 36.6
- other 51.6 99.9
106.7 136.5
254.3 270.9
Operating lease commitments
Total commitments under operating leases
- due within one year 7.2 7.0
- due between one and two years 6.7 6.6
- due between two and three years 6.4 6.5
- due between three and four years 5.8 6.3
- due between four and five years 5.8 6.2
- due beyond five years 75.7 81.7
107.6 114.3
No future sublease payments are receivable relating to the above operating leases (2016: nil).
Operating lease commitments principally include payments in respect of the Group’s hotel in Tokyo.
2017 2016
The notional principal amounts of the outstanding interest rate swap and cap contracts at 31st December 2017 were
US$236.1 million (2016: US$232.9 million).
At 31st December 2017, the fixed interest rates relating to interest rate swaps and caps varied from 1.8% to 2.5%
(2016: 1.9% to 2.9%) per annum.
The fair values of interest rate swaps are based on the estimated cash flows discounted at market rates ranging from 1.3%
to 1.7% (2016: 0.7% to 1.9%) per annum.
In addition, the Group has operating lease commitments with rentals determined in relation to sales. It is not possible to
quantify accurately future rentals payable under such leases.
52
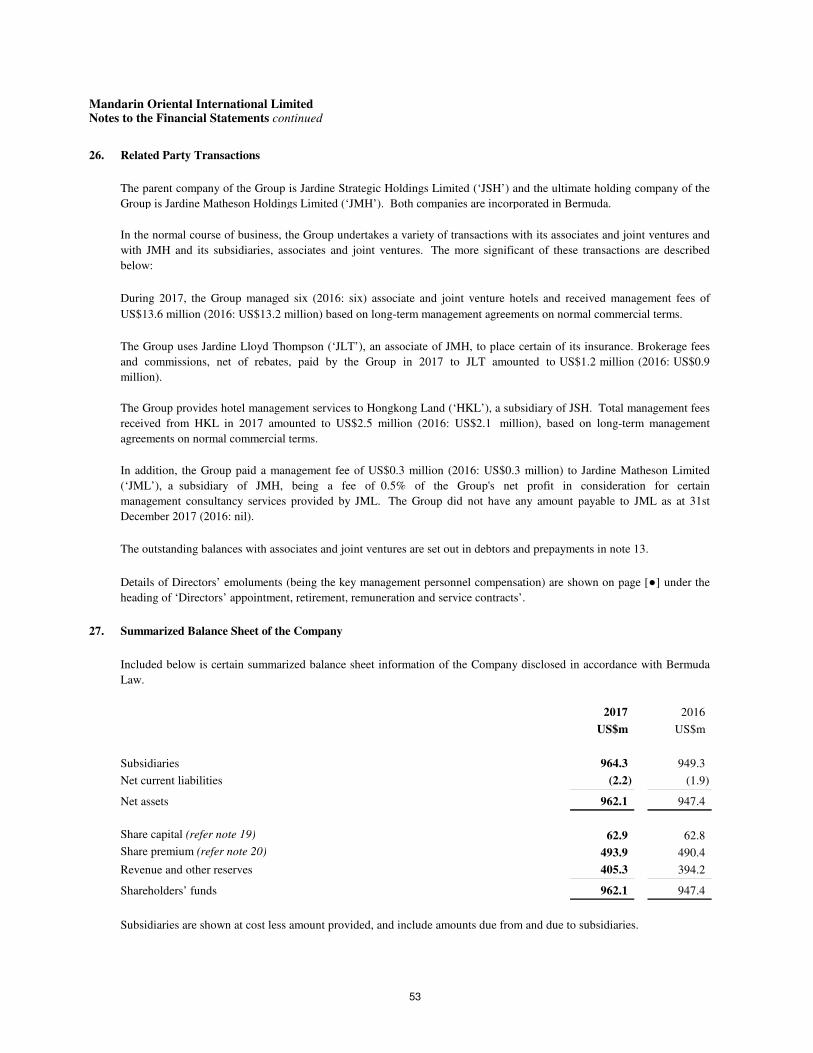
Mandarin Oriental International LimitedNotes to the Financial Statements continued
26. Related Party Transactions
27. Summarized Balance Sheet of the Company
2017 2016
US$m US$m
Subsidiaries 964.3 949.3
Net current liabilities (2.2) (1.9)
Net assets 962.1 947.4
Share capital (refer note 19) 62.9 62.8
Share premium (refer note 20) 493.9 490.4
Revenue and other reserves 405.3 394.2
Shareholders’ funds 962.1 947.4
Subsidiaries are shown at cost less amount provided, and include amounts due from and due to subsidiaries.
The outstanding balances with associates and joint ventures are set out in debtors and prepayments in note 13.
The Group uses Jardine Lloyd Thompson (‘JLT’), an associate of JMH, to place certain of its insurance. Brokerage fees
and commissions, net of rebates, paid by the Group in 2017 to JLT amounted to US$1.2 million (2016: US$0.9
million).
The Group provides hotel management services to Hongkong Land (‘HKL’), a subsidiary of JSH. Total management fees
received from HKL in 2017 amounted to US$2.5 million (2016: US$2.1 million), based on long-term management
agreements on normal commercial terms.
Included below is certain summarized balance sheet information of the Company disclosed in accordance with Bermuda
Law.
Details of Directors’ emoluments (being the key management personnel compensation) are shown on page [●] under the
heading of ‘Directors’ appointment, retirement, remuneration and service contracts’.
The parent company of the Group is Jardine Strategic Holdings Limited (‘JSH’) and the ultimate holding company of the
Group is Jardine Matheson Holdings Limited (‘JMH’). Both companies are incorporated in Bermuda.
In the normal course of business, the Group undertakes a variety of transactions with its associates and joint ventures and
with JMH and its subsidiaries, associates and joint ventures. The more significant of these transactions are described
below:
During 2017, the Group managed six (2016: six) associate and joint venture hotels and received management fees of
US$13.6 million (2016: US$13.2 million) based on long-term management agreements on normal commercial terms.
In addition, the Group paid a management fee of US$0.3 million (2016: US$0.3 million) to Jardine Matheson Limited
(‘JML’), a subsidiary of JMH, being a fee of 0.5% of the Group's net profit in consideration for certain
management consultancy services provided by JML. The Group did not have any amount payable to JML as at 31st
December 2017 (2016: nil).
53

28. Principal subsidiaries, Associates, Joint Ventures and Managed Hotels
The principal subsidiaries, associates, joint ventures and managed hotels of the Group at 31st December 2017 are set out below.
non-
the controlling
Principal Group interests
place of business Name of entity Nature of business 2017 2016 % % Hotel profile
SUBSIDIARIES
Hong Kong Mandarin Oriental Hotel Group Management 100 100 100 - -
International Limited
Hong Kong Mandarin Oriental Hotel Group Limited Management 100 100 100 - -
Hong Kong Mandarin Oriental, Hong Kong Limited Owner: Mandarin Oriental, Hong Kong 100 100 100 - 501 rooms. Lease expiry 2895
Hong Kong Excelsior Hotel (BVI) Limited Owner: The Excelsior, Hong Kong 100 100 100 - 869 rooms. Lease expiry 2842
Japan Mandarin Oriental Tokyo KK Owner: Mandarin Oriental, Tokyo 100 100 100 - 179 rooms. Lease expiry 2035
Indonesia P.T. Jaya Mandarin Agung Owner: Mandarin Oriental, Jakarta 96.9 96.9 96.9 3.1 272 rooms. Lease expiry 2023
United Kingdom Mandarin Oriental Hyde Park Limited Owner: Mandarin Oriental Hyde Park, London 100 100 100 - 181 rooms. Freehold
Switzerland Société Immobilière de Owner: Mandarin Oriental, Geneva 85.3 85.3 85.3 14.7 189 rooms. Lease expiry 2040
Mandarin Oriental (Genèva) SA
Switzerland Société pour ľ Exploitation de 100 100 100 - -
Mandarin Oriental (Genèva) SA
Germany Dinavest International Holdings B.V. Owner: Mandarin Oriental, Munich 100 100 100 - 73 rooms. Freehold
France MOHG Hotel (Paris) Sarl Owner: Mandarin Oriental, Paris 100 100 100 - 138 rooms. Freehold
United States Boylston Street Hotel LLC Owner: Mandarin Oriental, Boston 100 100 100 - 148 rooms. Freehold
United States Portals Hotel Site LLC Owner: Mandarin Oriental, Washington D.C. 83.6 80 83.6 16.4 373 rooms. Freehold
ASSOCIATES AND JOINT VENTURES
Singapore Marina Bay Hotel Private Limited Owner: Mandarin Oriental, Singapore 50 50 50 50 527 rooms. Lease expiry 2079
Thailand OHTL PCL Owner: Mandarin Oriental, Bangkok 47.6 47.6 47.6 52.4 368 rooms. Various freehold/leasehold
Malaysia Asas Klasik Sdn Bhd Owner: Mandarin Oriental, Kuala Lumpur 25 25 25 75 630 rooms. Freehold
Thailand Chaophaya Development Corporation Limited Owner: River City Shopping Complex 49 49 49 51 -
Spain Ritz Madrid, S.A. Owner: Hotel Ritz, Madrid 50 50 50 50 162 rooms. Freehold
United States ICD Columbus Centre Hotel LLC Owner: Mandarin Oriental, New York 25 25 25 75 244 rooms. Freehold
United States Swire Brickell Key Hotel Limited Owner: Mandarin Oriental, Miami 25 25 25 75 326 rooms. Freehold
MANAGED HOTELS
Hong Kong The Landmark Mandarin Oriental, Hong Kong - - - - 111 rooms
Macau Mandarin Oriental, Macau - - - - 213 rooms
China Mandarin Oriental, Sanya - - - - 296 rooms
China Mandarin Oriental, Guangzhou - - - - 263 rooms
China Mandarin Oriental Pudong, Shanghai - - - - 362 rooms
Taiwan Mandarin Oriental, Taipei - - - - 296 rooms
Czech Republic Mandarin Oriental, Prague - - - - 99 rooms
Spain Mandarin Oriental, Barcelona - - - - 120 rooms
Turkey Mandarin Oriental, Bodrum - - - - 129 rooms
Italy Mandarin Oriental, Milan - - - - 104 rooms
Morocco Mandarin Oriental, Marrakech - - - - 63 rooms
United States Mandarin Oriental, Las Vegas - - - - 392 rooms
United States Mandarin Oriental, Atlanta - - - - 127 rooms
Chile Hotel Santiago - - - - 310 rooms
Saint Vincent and Pink Sands Club, Canouan - - - - 38 rooms
the Grenadines
Mandarin Oriental International Limited
Notes to the Financial Statements continued
interest %
at 31st December 2017 held by
shares and voting powers
Proportion of ordinary
Attributable
54