managingthrough change:thepower...
TRANSCRIPT

MANAGINGTHROUGHCHANGE:THE POWEROF ROLLING FORECASTS
INNOVATION IN ACTION
SERIES
AUTHOR: STEVE PLAYER

2
Business never stands still. E-business has broken down natural competitive
barriers, creating new challenges and offering new opportunities. And as
competition heats up, so does demand for resources. Many CFOs and
CIOs are just plain jittery over such trends. And they wonder if their
in-place planning, budgeting, and forecasting tools will really help them
succeed … or even survive.
Steve Player offers good news: Many organizations are finding success by
adopting a rolling forecast to supplement existing approaches or—in
some cases—to replace less-effective alternatives to help their companies
become more agile and more adaptive.
In this paper, Steve reviews the purposes of traditional planning, budgeting,
and forecasting, as well as common associated problems. He highlights
improvements achieved through rolling forecasts and enumerates rolling-
forecast “dos” and “don’ts.”
“Managing Through Change: The Power of Rolling Forecasts” is the
first in a new series of papers written for the Cognos Innovation Center
for Performance Management by Steve Player. Steve is North American
Program Director of the Beyond Budgeting Round Table, CEO of the
Player Group, and an Innovation Center Advisor. He is co-author/editor
of four books on Activity-Based Management, has been featured in major
business publications, and regularly publishes case studies documenting
successful implementation of “beyond budgeting” principles.
Jeff Holker
Associate Vice President
Cognos, an IBM company
Innovation Center for Performance Management

3
Traditional Budgeting—Objectives and Common Problems . . . . . . . . . . . . . . . . . . . . . . . . . . . . 4
Getting Started . . . . . . . . . . . . . . . . . . . . . . . . . . . . . . . . . . . . . . . . . . . . . . . . . . . . . . . . . . . . . 5
Traditional Forecasting. . . . . . . . . . . . . . . . . . . . . . . . . . . . . . . . . . . . . . . . . . . . . . . . . . . . . . . . 7
Pitfalls to Avoid . . . . . . . . . . . . . . . . . . . . . . . . . . . . . . . . . . . . . . . . . . . . . . . . . . . . . . . . . . . . . 8
Pitfall 1 – Forecasting to the Wall . . . . . . . . . . . . . . . . . . . . . . . . . . . . . . . . . . . . . . . 8
Pitfall 2 - Confusing Forecast with Targets . . . . . . . . . . . . . . . . . . . . . . . . . . . . . . . . 10
Pitfall 3 –Insisting on Forecast Accuracy in an Unpredictable World . . . . . . . . . . . . . 10
Pitfall 4 – Forecasting with Spreadsheets . . . . . . . . . . . . . . . . . . . . . . . . . . . . . . . . . 12
Improvement Levers . . . . . . . . . . . . . . . . . . . . . . . . . . . . . . . . . . . . . . . . . . . . . . . . . . . . . . . . . 13
Improvement Lever 1 - Use Today’s Tools to Visualize Results . . . . . . . . . . . . . . . . . 13
Improvement Lever 2 - Focus on Critical Drivers, Avoid Excessive Details . . . . . . . . 14
Improvement Lever 3 - Match Your Forecasts with Your Ability to See. . . . . . . . . . . 15
Improvement Lever 4 - Use Different Time Horizons for Different Decisions,
but Integrate the Systems . . . . . . . . . . . . . . . . . . . . . . . . . . . . . . . . . . . . . . . . . . . 16
Improvement Lever 5 - Move to Advanced Planning Approaches . . . . . . . . . . . . . . . 16
Dos and Don’ts for Rolling Forecasting . . . . . . . . . . . . . . . . . . . . . . . . . . . . . . . . . . . . . . . . . . 17
Summary . . . . . . . . . . . . . . . . . . . . . . . . . . . . . . . . . . . . . . . . . . . . . . . . . . . . . . . . . . . . . . . . . 19
About Cognos, an IBM Company . . . . . . . . . . . . . . . . . . . . . . . . . . . . . . . . . . . . . . . . . . . . . . . 19
For more information . . . . . . . . . . . . . . . . . . . . . . . . . . . . . . . . . . . . . . . . . . . . . . . . . . . . . . . . 19
Request a call. . . . . . . . . . . . . . . . . . . . . . . . . . . . . . . . . . . . . . . . . . . . . . . . . . . . . . . . . . . . . . 19

4
TRADITIONAL BUDGETING—OBJECTIVES AND COMMON PROBLEMS
Budgets have been described as “a financial blueprint of management’s expected plan of action.”1 As such,
they serve at least six key functions.
• Setting targets
• Aligning incentives
• Developing action plans
• Allocating resources
• Coordinating across all functions
• Monitoring and controlling finances
Many see these budget functions as keys to successful management. Yet numerous studies have identified crit-
icisms and complaints. One well-documented issue is that traditional budgeting often creates a fixed perform-
ance contract that limits an organization’s ability to be responsive in today’s ever-changing environment (see
Exhibit 1). The annual budget or plan often has all the elements of a fixed contract, including contract period
(typically one year), fixed targets with pre-determined rewards, allocated resources, and a monthly control
process to track progress to pre-defined targets. The entire process is agreed to through lengthy negotiation
before ultimate sign-off by managers and directors.
1 Charles T. Horngren, “Cost Accounting – A Managerial Emphasis,” Prentice Hall,1st edition 1962; 12th edition with Srikant M. Datarand George Foster, 2006.
Exhibit 1. What is the Budgeting Process?

5
Many believe that this negotiation process is driven by a manager’s desire to reach incentive targets.
Operating managers typically want to negotiate targets that can be easily reached. Senior managers try to
stretch the targets and the budgeting games begin.
The ills of traditional budgeting in large corporations are detailed in a chapter of the recent book Winning
by Jack Welch, former Chief Executive of General Electric. Jack begins Chapter 12 “Budgeting: Reinventing
the Ritual” by saying:
Not to beat around the bush, but the budgeting process at most companies has to be the most
ineffective practice in management. It sucks the energy, time, fun, and big dreams out of an
organization. It hides opportunity and stunts growth. It brings out the most unproductive behav-
iors in an organization, from sandbagging to settling for mediocrity. In fact when companies win,
in most cases it is despite their budgets, not because of them.2
While there are many criticisms of traditional budgeting, the following seven are sources of pain for most
organizations. Most find that budgeting:
• Costs too much
• Takes too long (budgets are out-of-date when published)
• Does not add value in managing the business
• Requires a crystal ball to predict the future
• Slows response time, limiting discussion of innovative ideas to narrow budget preparation window
• Leads to gaming where managers try to negotiate low targets to reach maximum bonuses
• Sub-optimizes results3
2 Jack Welch (with Suzy Welch), Winning, Chapter 12 “Budgeting: Reinventing theRitual” (pp. 189-204). HarperCollins, 2005
3 For a more detailed discussion of these issues, see “Becoming Lean, Adaptive, andEthical: How to Move Beyond Budgeting,” by Robin Fraser, Jeremy Hope, and StevePlayer in Business Performance Management Magazine, November, 2003, and BeyondBudgeting: How Managers Can Break Free from the Annual Performance Trap,” byRobin Fraser and Jeremy Hope, Harvard Business School Press, 2003.
6
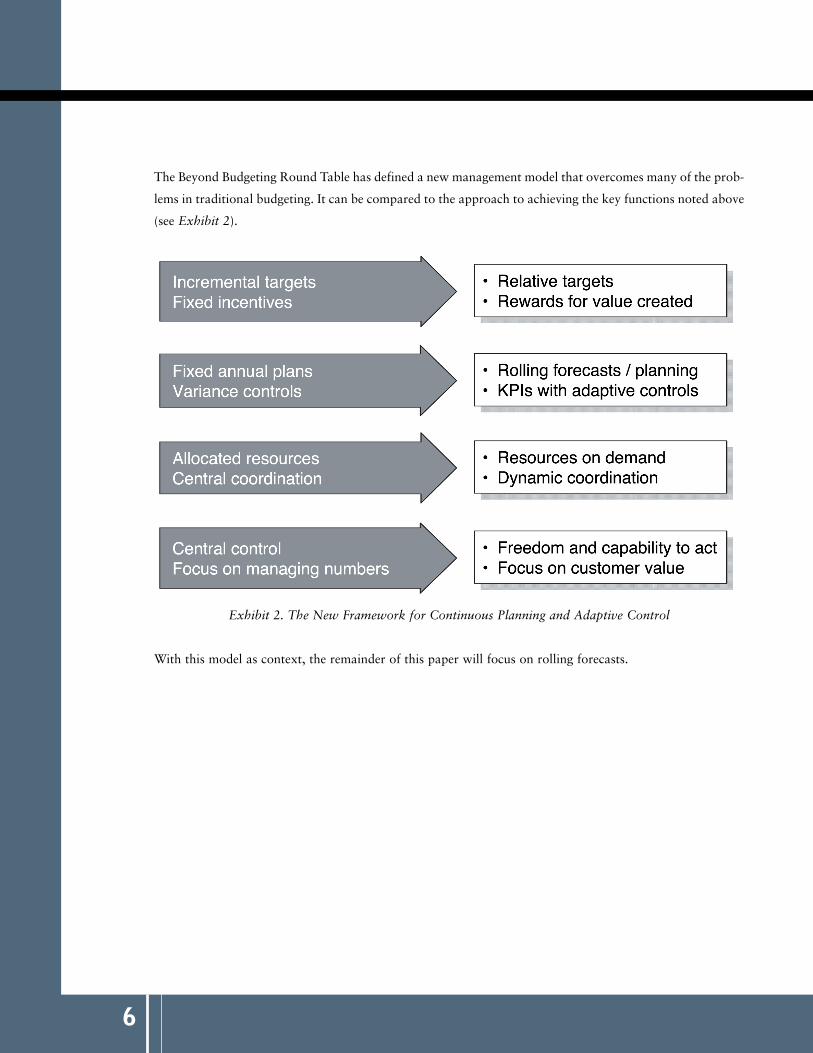
The Beyond Budgeting Round Table has defined a new management model that overcomes many of the prob-
lems in traditional budgeting. It can be compared to the approach to achieving the key functions noted above
(see Exhibit 2).
Exhibit 2. The New Framework for Continuous Planning and Adaptive Control
With this model as context, the remainder of this paper will focus on rolling forecasts.
7
TRADITIONAL FORECASTING
Many organizations seek to mitigate some of the budgeting problems noted above by implementing a form
of forecasting that allows managers to update budgeted numbers with actual results from past periods. The
forecasts are used to predict what may happen in the future, often seeking to confirm whether pre-determined
annual targets will be met.
While financial managers think of forecasting in terms of periodic forecasts, operating managers constantly
adjust plans, including sales estimates, which are converted to operating plans for production and inventory
control levels. Most of these efforts are conducted in discrete systems supporting diverse functional areas. A
great deal of effort is required to integrate and reconcile these differing views of the future.
Financial forecasts are performed on a preset schedule, typically quarterly or monthly. Often, they only fore-
cast to the end of the financial period (a process described as “forecasting to the wall” below).
Publicly held companies usually time the forecasting process to support discussions with investment analysts.
According to David Axson, author of Best Practices in Planning and Management Reporting,4 the average
company takes 14 days to develop a financial forecast. Axson explains that process cycle times are prolonged
due to:
• Difficulty in getting timely information
• High level of required detail taking significant time to forecast each item
• Data in disconnected spreadsheets, making integration a time-consuming process
Many companies use a purely financial process that is disconnected from its specific business drivers—a mere
accumulation of financial trends. Such companies often determine their monthly forecasts by subtracting
actual results-to-date from their annual targets, dividing the gap by the months remaining, and then viewing
the monthly result to see if it is even possible to attain. All their forecasting work focuses on achieving the
pre-defined annual targets, even if their underlying assumptions are incorrect.
The level of detail used often mirrors the annual plan. Some planners forecast at the same level of detail used
for actuals reporting, which can require tremendous efforts in calculating and explaining variances. In some
cases, apparent variances are merely due to timing differences—for example, March sales are lower in a par-
ticular year since Easter falls in April. The downside of excessive detail is that the time spent calculating vari-
ances reduces the time available to review significant items.
4 David A. J. Axson, “Best Practices in Planning and Management Reporting,” JohnWiley & Sons, 2003, page 191. For a full discussion of the best practices in forecastingsee Chapter 8, “Forecasting: Pass the Crystal Ball,” pages 189-206.

8
Such an approach often turns traditional forecasting into a version of traditional budgeting—with its atten-
dant problems. Let’s examine why:
For many organizations, forecasting is a mechanical process that adjusts future run rates upward or down-
ward as necessary so that predetermined annual targets are still met, but ignoring the fact that targets were
set based on various assumptions. What happens when the annual targets are held, but their underlying basis
proves incorrect? The quality guru, W. Edwards Deming, noted that, “[I]f you pay people to hit targets, they
often will, even if it destroys your company.”
PITFALLS TO AVOID
This assortment of “Dos and Don’ts” should help you successfully implement rolling forecasts by identify-
ing some pitfalls to avoid (don’ts) as well as ways to leverage success (dos).
Pitfall 1 – Forecasting to the Wall
The most common pitfall occurs when a company forecasts to the end-of-period, as is illustrated by Exhibit 3.
Exhibit 3. Forecasting to the Wall
When this approach is taken, the purpose of forecasting shifts dramatically. Instead of being a discussion about
organizational direction and the risks and potential opportunities in getting there, the conversation quickly
turns to one of performance evaluation and a revalidation of whether managers still agree to earnings com-
mitments. The conversation cannot be about the future if the future magically ends when the period ends.

9
Some organizations try to make the shift by extending their forecast period into subsequent periods. This
effort is also ineffective if all management review questions continue to focus on the period end. Rather than
coordinating activities for the future, this process is about performance evaluation. In essence, senior man-
agement is asking whether each operating manager can be trusted to deliver her/his share of the earnings
target. This tends to garner cautious responses, particularly for those lagging in performance who want to
project confidence in their ability to catch up, while those running ahead project high future costs to avoid
having their targets raised at mid-year. Top management then faces a maddening game of trying to find the
organization’s true position. This makes calls for forecast accuracy seem like a reasonable response.
What is really needed is an unbiased forecast with a narrowing degree of uncertainty, which would imply
that any occurrences over-forecast would balance out those under-forecast. As Hope points out, “… [T]he
only certainty about a forecast is that it will be wrong. The question is by how much. Narrowing that vari-
ation comes from learning, experience, decent information systems, and ultimately, judgment.”5
To overcome forecasting to the wall, organizations should use a rolling forecast with a consistent period in
each forecast. The objective is visibility across the business cycle.
Exhibit 4. Use Consistent Period Rolling Forecasts
The process goal is coordination of the different parts of the organization using the latest available estimates of what
may likely occur. Action plans to correct negative trends or to exploit positive developments can be included with dis-
cussion of their likelihood of success. These plans can be made dynamic based on the movement of leading indicators.
5 Jeremy Hope, “Use a Rolling Forecast to Spot Trends,” Working Knowledge –Harvard Business School, March 13, 2006

10
Pitfall 2 - Confusing Forecast with Targets
The second key pitfall occurs when managers confuse forecasts with targets. Simply stated, targets are where
a company wants to go. They are typically medium-term aspirations or goals that often get converted into
quantified annual targets. Forecasts, on the other hand, highlight a company’s strategic direction.
The problem occurs when the two points are different. Many organizations use the forecast to “close the
gap.” Managers who are behind on an actual basis can show their organizations catching up in the forecasts.
The problem with this approach is that it blends both current trends with expected results of future action
plans. It obscures the details of what needs to happen and limits discussion of the risks of achieving these
action plans.
This pitfall can be avoided by projecting the current trend line of actual results and overlaying explicit discus-
sion of the corrective action plans management anticipates using to close any gaps (Exhibit 5). This provides
a better view of the risks of achieving initiatives. Organizations that merely provide a single forecast line blend
both trends and action plans which require senior management to “trust them” to reach their goals.
Exhibit 5. Separating Forecast Trends from Targets
Pitfall 3 –Insisting on Forecast Accuracy in an Unpredictable World
Many believe forecasting is about both predicting and controlling the future. Some organizations have a goal
of forecast accuracy even to the point of providing incentives to achieve forecast accuracy. While motivated
by attempts to control the world, such efforts seem highly irrational in today’s volatile and chaotic business
environment.

11
To accurately predict the future, any business would need to forecast the price and availability of key busi-
ness inputs such as labor, transportation (which is likely influenced by oil prices), and interest rates or other
capital costs. Strategic planning also requires forecasting the success of planned improvement actions, the
response of current and future customers, as well as the countering actions of current and future competi-
tors. This is just the beginning of the list.
Ironically, while there is a need to plan and control, the only thing certain about most forecasts is that they
are likely to be wrong. More than 30 years ago, after spending 20 years as a professional economist, Dr. Jan
Wallander (who eventually became CEO of the Swedish bank, Handelsbanken) reached the following con-
clusion: Although it was useful to understand the interactions between various events, the degrees of possi-
bilities made it virtually impossible to accurately predict a specific outcome. His conclusions are illustrated
by the histogram in Exhibit 6.
Exhibit 6. Histogram to Evaluate Ability to Predict Results.

12
The solid lines track actual results, while each broken line shows sales forecasts. Any business using forecast-
ing could develop a similar chart to track its forecast accuracy.
The expense side becomes a little more predictable as many organizations use the annual budget process to
authorize expenditures. This outflow is often authorized regardless of whether the full amounts of related
revenues have been realized. While this chart reflects annual projections, the same approach can be used with
quarterly or monthly forecasts.
However, a major problem with forecasting, when used in a predict-and-control environment, is the natural
tendency to make sure forecast numbers are achieved. Companies typically forecast a conservative net
income that minimizes revenue expectations while it maximizes future expenses, so long as the net total is
acceptable. While considered prudent from a financial management point of view, this approach results in
constant minimizations of opportunities and timid approaches to growth.
Budgeting expert Jeremy Hope notes, “The purpose of forecasting is to inform decision makers to help shape
outcomes, not to predict the future. In reality, forecasting is necessary only because organizations cannot
react instantly to changing events.”6
The focus should be on understanding how to react more quickly and understanding both causes and effects.
The winds will change, how quickly can you trim your sails?
Pitfall 4 – Forecasting with Spreadsheets
For most organizations, forecasting is performed using spreadsheets. Well known as a powerful personal pro-
ductivity tool, the spreadsheet is ill-suited for integrated cross-company communication and collaboration.
While it is possible to do a single pass with spreadsheets, multiple iterations with changing budget assump-
tions are a nightmare to control. Security of key financial data is difficult. Consolidation of results is cum-
bersome. The risk of error is high, with user reviews often the only control mechanisms.
6 Jeremy Hope, “Use a Rolling Forecast to Spot Trends,” Working Knowledge –Harvard Business School, March 13, 2006
13
All of these issues lead to excessive time required to gather the data and validate that what has been received
is the most current and accurate information. A recent benchmarking survey7 by the American Productivity
and Quality Center, a recognized resource for process and performance improvement, notes that companies
that rely heavily on spreadsheets typically take 30 days longer to complete their budgets than those who use
integrated systems. Companies that have moved to continuous planning all have fast, open information
systems. In contrast, using spreadsheets to budget is neither fast nor open.
Reductions in the cost of technology are allowing companies to move away from reliance on spreadsheets.
Enterprise-class solutions such as IBM Cognos TM1 can be implemented quickly, provide real-time, read-
write budgeting, forecasting, planning and analytics, flexible modeling, and scalability. Such tools support
dynamic business workflow and provide views of complex data across multiple dimensions and drill-downs
into specific data. Any organization still using spreadsheets to budget should examine such tools that can
greatly simplify the budgeting process.
In conjunction with the use of a proven technology, many organizations have found key levers to improve
the success in using rolling forecasts. These new solutions include:
• Using today’s tools to visualize results
• Focusing on critical drivers and avoiding excessive detail
• Matching your forecast with your ability to see
• Using different time horizons for different decisions, but integrating systems
• Moving to advanced planning approaches
IMPROVEMENT LEVERS
Improvement Lever 1 - Use Today’s Tools to Visualize Results
Most financial departments continue to present results using tables of data that compare the current period
to the budget or to the prior period. This is usually done for the current period and for the year-to-date
amount. Differences (or variances) are then calculated, usually in both dollars and percentages, with an
explanation included for items over a certain amount.
The problem with this approach is that it focuses on snapshots in time. Normal variations in operations make
trends difficult to identify (e.g., Easter falls in March one year and April the next), and companies focus on
the past, rather than a combination of past and future. Management can get better analysis more quickly by
taking advantage of today’s tools to visualize results.
7 Planning, Budgeting, and Forecasting: A Best Practices Snapshot, AmericanProductivity and Quality Center, 2006
14
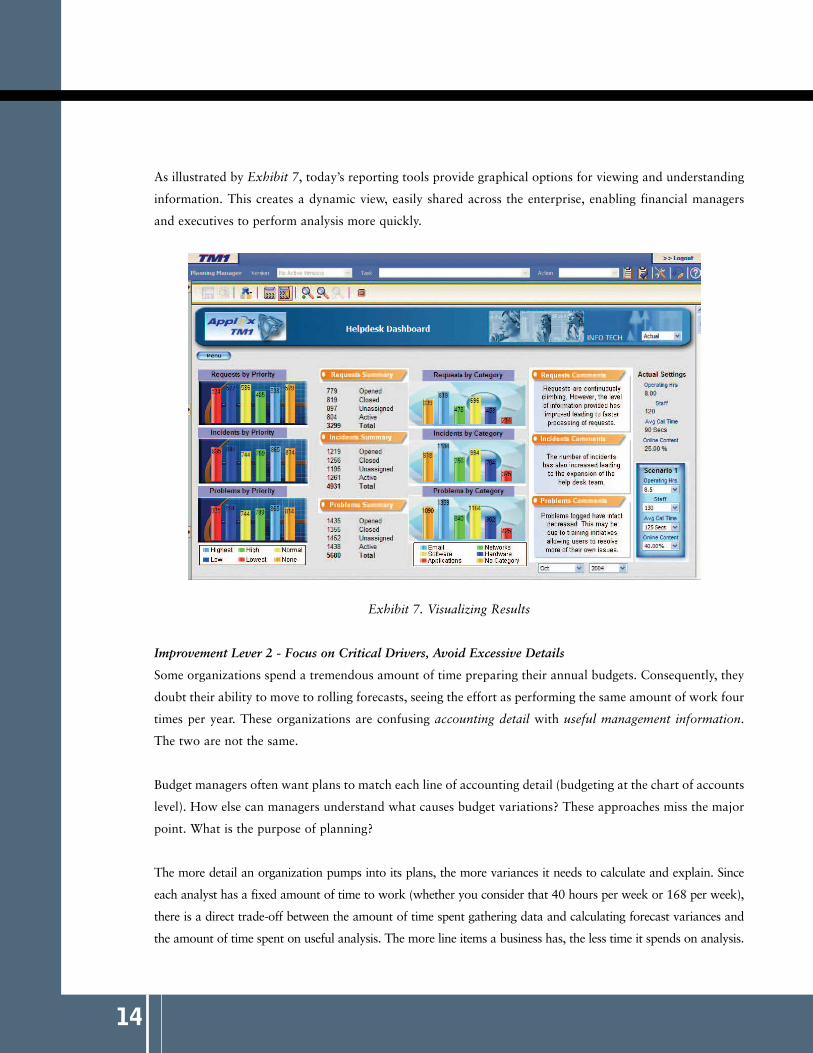
As illustrated by Exhibit 7, today’s reporting tools provide graphical options for viewing and understanding
information. This creates a dynamic view, easily shared across the enterprise, enabling financial managers
and executives to perform analysis more quickly.
Exhibit 7. Visualizing Results
Improvement Lever 2 - Focus on Critical Drivers, Avoid Excessive Details
Some organizations spend a tremendous amount of time preparing their annual budgets. Consequently, they
doubt their ability to move to rolling forecasts, seeing the effort as performing the same amount of work four
times per year. These organizations are confusing accounting detail with useful management information.
The two are not the same.
Budget managers often want plans to match each line of accounting detail (budgeting at the chart of accounts
level). How else can managers understand what causes budget variations? These approaches miss the major
point. What is the purpose of planning?
The more detail an organization pumps into its plans, the more variances it needs to calculate and explain. Since
each analyst has a fixed amount of time to work (whether you consider that 40 hours per week or 168 per week),
there is a direct trade-off between the amount of time spent gathering data and calculating forecast variances and
the amount of time spent on useful analysis. The more line items a business has, the less time it spends on analysis.

15
Leading companies focus on the critical drivers that determine whether they will be successful. This requires
managers to determine which factors actually drive their business. While today’s information age provides an
overwhelming number of signals, adopting a driver-based approach to forecasting allows managers to focus. It
also requires a disciplined strategic approach to get management to agree on what will be key to their success.
Improvement Lever 3 - Match Your Forecasts with Your Ability to See
Some organizations try to adopt the best practices of others by directly copying their approaches. They
assume the only type of rolling forecast is a five-quarter rolling forecast. While five quarters seems to be the
most common time-frame for a rolling forecast, it is not the only one, nor is it necessarily the best for all sit-
uations. One of the key benefits of adopting rolling forecasts is that management can focus on understand-
ing the degrees to which they control the future, as well as the external events that force them to react. By
tracking those external factors and understanding the company’s speed of reaction, managers gain a deeper
understanding of how to make their organization more successful.
Leading organizations match their forecasts with their ability to see. At a large competitive exchange carrier,
this translated into requesting that the field prepare rolling six-month forecasts. The planning director at that
organization noted, “When we asked the field how far out they could see, they told us six months was the
maximum. But the forecast we were asking for went out twelve months. We realized any data past six months
was just mathematical extrapolation. We decided we would rather ‘do the math’ at corporate to better under-
stand and control the assumptions in the forecast.”
Similarly, at a large credit card company, the move to continuous planning was driven by a desire to speed
the organization’s ability to optimize their investments and speed new cardmember growth (Exhibit 8).
Exhibit 8. Continuous Planning Example

16
By adopting a 15-month rolling forecast, the credit card provider was able to improve the visibility of invest-
ments in marketing initiatives, customer support systems, and capital expenditures used to drive future
improvements. The ongoing investment optimization decisions greatly accelerated the organization’s ability
to respond to rapidly changing markets. In the first full year of operation, using rolling forecasts to frequently
review investments is credited with increasing the growth in new card-holders by eight percent, which directly
improved the credit card company’s bottom line.
Improvement Lever 4 - Use Different Time Horizons for Different Decisions, but Integrate the Systems
Another key to success with rolling forecasts is realizing that different decisions require different time
horizons. Operational functions are engaged in short-term sales and operations planning to make sure
current orders can be fulfilled in a timely manner. Financial forecasts are used to understand cash flow needs
for the near term and for identifying longer term capital requirements. Organizations with specialized fixed
facilities, such as semiconductor manufacturers, need at least a five-year horizon to determine build-outs
of fabrication facilities. Extraction industries such as coal, petroleum, and other mining companies often need
30-to-50-year plans.
Leading companies use different processes to meet such divergent needs, but they do so by using integrated
systems. Updates to one system feed into others. This integration is one of the latest advances in how leading-
edge planning systems enable companies to manage adaptively.
Improvement Lever 5 - Move to Advanced Planning Approaches
Moving to rolling forecasts allows organizations to utilize advanced planning approaches. This is primarily
driven by available information and available time to move to more advanced states of performance.
A key example is scenario planning (Exhibit 9). Using this approach, management identifies possible future
outcomes as well as the events that might trigger them. The impact of these events is mapped, as well as the
counter-measures that could be taken.
In an example from the same credit card company, the potential effects of a second Gulf War are estimated.
Management then identifies what counter-measures they can take to respond to the negatives. The business
can plan different scenarios and create management “playbooks” that allow the organization to rapidly
respond to developing events.

17
Exhibit 9. Move to Scenario Planning
A summary of risks and opportunities helps managers focus on both positive contingencies as well as negative
trends. This approach shifts planning into looking at what is possible, rather than merely reacting to what
has occurred.
Numerous companies have adopted rolling forecasts. Some of the more advanced firms have even used them
to replace annual budgeting processes. In essence, they are continuously planning and have eliminated the
need for an annual budget event.
DOS AND DON’TS FOR ROLLING FORECASTING
Rolling forecasts need not be as oppressive and unpleasant as the annual budgeting and forecasting cycle. In
fact, if implemented well, a rolling forecast with a performance management platform that streamlines the
process can run like the proverbial well-oiled machine.
GETTING STARTED
Because it is strategic, the rolling forecast should not be implemented with tactical tools. Spreadsheets
may seem up to the task, but they aren’t. To get the most out of rolling forecasting, look at options that
incorporate your overall budgeting, forecasting, planning and strategic management needs. In many
cases, the solution is a performance management application that automates data input, provides real-
time data access, offers a variety of front-end user interface options, and grows with your business.
18
Once you’ve integrated your disparate information systems to yield “a single version of the truth”—that is,
your performance management application can serve up the complex, detailed data you need, you are ready
to move forward with rolling forecasts.
Here are some Dos and Don’ts, provided by a specialty pharmaceutical company employing innovative
strategies for its products through its internal and financial management. These tips come directly from the
CFO and senior director for planning and decision support.
• Do involve the senior management team early.
• Do start with the basics: revenue and P&Ls, and major markets or divisions.
• Do incorporate driver-based forecasts to facilitate top-down KPI and goal setting.
Once you add the driver-based information, the rest of the details are pretty easy to work out mathematically.
• Do increase participation. Rolling forecasting enables more parties to participate in the process and
also facilitates participation.
• Do link accountability to those in control.
• Do train the parties using the system. Training puts you in front of users, enabling you to enhance buy-
in. Training also serves as a forum to discuss user needs and to agree upon common definitions.
• Do make sure there are IT systems in place that can support your implementation and processes. Where
possible, you want to pre-populate the forecast to reduce both the time for manual entry and the pos-
sibility of errors creeping into the forecast.
• Do continually improve your processes to ensure that both user needs and company needs are being
met.
• Don’t underestimate the significance of the change. Many of your team members, colleagues, and exec-
utives have decades of experience with the annual process.
These patterns, as well as your own business processes, are ingrained in the ways people work. Studies have
shown that when corporate processes are changed, one-third of the people will embrace the changes, one-
third will resist the changes, and one-third will leave the organization. You need to understand that this is a
significant change in mind-set. Focus on the value of the activity—greatly reduced effort in the budgeting
process.
• Don’t ask for excessive detail, especially at the initial roll-out. You don’t need actuals—you need infor-
mation for forecasting.
19
SUMMARY
Rolling forecasting is a strategic opportunity, not an onerous task. Implemented correctly, rolling forecasting
can be the single most valuable tool to “trimming those sails,” that is, identifying where changes need to be
made in order to maximize profitability and minimize losses.
By implementing rolling forecast methodology and technology, companies can gain greater visibility into the busi-
ness (alert executives earlier), better anticipate changing business environments, improve focus (deal with key
business drivers vs. data input), reduce focus on current year, and avoid spikes in quarterly and annual efforts.
ABOUT COGNOS,AN IBM COMPANY
Cognos, an IBM company, is the world leader in business intelligence and performance management solutions.
It provides world-class enterprise planning and BI software and services to help companies plan, understand
and manage financial and operational performance. Cognos was acquired by IBM in February 2008. For
more information, visit www.cognos.com.
FOR MORE INFORMATION
Visit the Cognos website at www.cognos.com.
REQUEST A CALL
To request a call or ask a question, go to www.cognos.com/contactme. A Cognos representative will respond
to your enquiry within two business days.
ABOUT THE COGNOS INNOVATION CENTER FORPERFORMANCE MANAGEMENT
The Cognos Innovation Center for Performance
Management is dedicated to transforming routine
performance management practices into “next prac-
tices” that help cut costs, minimize risk, streamline
processes, boost productivity, enable rapid response
to opportunity, and increase management visibility.
22

Copyright © 2008 Cognos, an IBM company.
(05/08)