managing water for all - oecd.org - oecd · · 2016-03-29managing water for all ... blogs,...
TRANSCRIPT

Managing Water for All An oecd perspective on pricing And finAncing Water is a key prerequisite for human and economic development, and for maintaining ecosystems. However, billions of people lack access to water and sanitation services, mainly due to poor governance and inadequate investment and maintenance. The situation is becoming more urgent due to increasing pressure, competition and even conflict over the use of water resources.
The OECD has been working for many years to address these challenges. The results of recent work are summarised in this report, which emphasises the economic and financial aspects of water resources management and water service provision, the need for an integrated approach (including governance considerations) to address these complex policy challenges, and the importance of establishing a firm evidence base to support policy development and implementation.
This report examines: strategic financial planning for water supply and sanitation that balances the key sources of revenues for the water sector – the “3Ts” of taxes, tariffs and transfers; the design and implementation of water pricing strategies that balance financial sustainability with other policy objectives; recent developments in private sector participation in the water sector; and trends and the future outlook of water use in agriculture. It considers both developing and OECD countries and offers concrete recommendations and checklists for action. The report is an invaluable resource for policy makers, academics, NGOs and all others interested in the challenges facing the water sector today.
The full text of this book is available on line via this link: www.sourceoecd.org/environment/9789264050334
Those with access to all OECD books on line should use this link: www.sourceoecd.org/9789264050334
sourceoecd is the OECD online library of books, periodicals and statistical databases. For more information about this award-winning service and free trials ask your librarian, or write to us at [email protected].
www.oecd.org/publishing
isbn 978-92-64-05033-4 97 2009 02 1 p -:HSTCQE=UZUXXY:
Manag
ing W
ater for A
ll An
oe
cd
pe
rs
pe
ct
ive
on
pr
icin
g A
nd
fin
An
cin
g
Managing Water for AllAn oecd perspective on pricing And finAncing
Co-distributed byIWA PublishingAlliance House, 12 Caxton Street,London SW1H OQS, UKTelephone: +44 (0) 20 7654 5500Fax: +44 (0) 20 7654 5555E-mail: [email protected]


Managing Water for All
AN OECD PERSPECTIVE ON PRICINGAND FINANCING
Faux-titre.fm Page 1 Friday, February 6, 2009 1:54 PM
ORGANISATION FOR ECONOMIC CO-OPERATIONAND DEVELOPMENT
The OECD is a unique forum where the governments of 30 democracies work together toaddress the economic, social and environmental challenges of globalisation. The OECD is also at
the forefront of efforts to understand and to help governments respond to new developments andconcerns, such as corporate governance, the information economy and the challenges of an
ageing population. The Organisation provides a setting where governments can compare policyexperiences, seek answers to common problems, identify good practice and work to co-ordinate
domestic and international policies.
The OECD member countries are: Australia, Austria, Belgium, Canada, the Czech Republic,
Denmark, Finland, France, Germany, Greece, Hungary, Iceland, Ireland, Italy, Japan, Korea,Luxembourg, Mexico, the Netherlands, New Zealand, Norway, Poland, Portugal, the Slovak Republic,
Spain, Sweden, Switzerland, Turkey, the United Kingdom and the United States. The Commission ofthe European Communities takes part in the work of the OECD.
OECD Publishing disseminates widely the results of the Organisation’s statistics gathering andresearch on economic, social and environmental issues, as well as the conventions, guidelines and
standards agreed by its members.
Also available in French under the title:
De l’eau pour tousPERSPECTIVES DE L’OCDE SUR LA TARIFICATION ET LE FINANCEMENT
Corrigenda to OECD publications may be found on line at: www.oecd.org/publishing/corrigenda.
© OECD 2009
You can copy, download or print OECD content for your own use, and you can include excerpts from OECD publications, databases and multimedia
products in your own documents, presentations, blogs, websites and teaching materials, provided that suitable acknowledgment of OECD as source
and copyright owner is given. All requests for public or commercial use and translation rights should be submitted to [email protected]. Requests for
permission to photocopy portions of this material for public or commercial use shall be addressed directly to the Copyright Clearance Center (CCC)
at [email protected] or the Centre français d'exploitation du droit de copie (CFC) [email protected].
This work is published on the responsibility of the Secretary-General of the OECD. The
opinions expressed and arguments employed herein do not necessarily reflect the official
views of the Organisation or of the governments of its member countries.
Faux-titre.fm Page 2 Friday, February 6, 2009 1:53 PM

FOREWORD – 3
MANAGING WATER FOR ALL: AN OECD PERSPECTIVE ON PRICING AND FINANCING – ISBN-978-92-64-05033-4 © OECD 2009
Foreword
Sustaining human and economic development, and maintaining ecosystems, requiremore effective management of water resources. This need is becoming more urgent as wewitness increasing pressure, competition, and, in some regions, even conflict over the useof water resources. Poor governance and inadequate investment are resulting in billions ofpeople not having access to water and sanitation services.
The OECD has been working over the last two years to address these challenges,focusing on areas where it can provide value-added. The results are summarised in thisreport, which emphasises: the economic and financial aspects of water management; theneed for a cross-sectoral perspective to address this complex policy challenge; and theimportance of establishing a firm evidence base to support policy development andimplementation.
The report reviews current approaches in the agricultural sector in OECD countries,including market-based mechanisms for allocating water and cost recovery for irrigation.It concludes that we need to implement integrated water resources management moreeffectively. The OECD will strengthen its work in this area by examining a wider rangeof water uses, and the impacts of climate change on this agenda.
The report also explores how to strengthen financing for water supply and sanitation,and the related governance issues. Many OECD countries must replace ageing waterinfrastructure, and ensure that it complies with new environmental requirements.Developing countries face a major challenge to mobilise and allocate financial resourcesin order to provide access to safe water and basic sanitation for their populations.
The report focuses on the ultimate financial sources of investment for the watersector: taxes, tariffs and transfers – the “3Ts”. It underlines the importance of strategicfinancial planning to find the right mix of the 3Ts for achieving water and sanitationtargets, and for leveraging other sources of finance. The report stresses the vital role thattariffs play in achieving sustainable cost recovery while ensuring affordability. Tariffdesign is examined while stressing that keeping tariff levels artificially low for all islikely to harm the poor.
The most recent data on aid flows show an increase in recent years, which isencouraging. Aid flows to the water and sanitation sector should continue to increase andalign with country-owned strategies. The report also examines the changing role ofprivate sector participation in the water sector. Based on international experience, thereport presents an OECD Checklist for Public Action that provides guidance for thosegovernments wishing to engage the private sector.

4 – FOREWORD
MANAGING WATER FOR ALL: AN OECD PERSPECTIVE ON PRICING AND FINANCING – ISBN-978-92-64-05033-4 © OECD 2009
This report, Managing Water for All: An OECD Perspective on Pricing andFinancing, and the companion report, Managing Water for All: An OECD Perspective onPricing and Financing – Key Messages for Policy Makers, have been prepared for the 5th
World Water Forum in Istanbul on 16-22 March 2009. I am delighted that OECD isjoining forces with other international organisations, governments, business and civilsociety to address the water challenge. Good water management is so fundamental tohuman and economic development, and to the maintenance of ecosystems, that we cannotafford to fail.
Angel GurríaOECD Secretary-General
ACKNOWLEDGEMENTS – 5
MANAGING WATER FOR ALL: AN OECD PERSPECTIVE ON PRICING AND FINANCING – ISBN-978-92-64-05033-4 © OECD 2009
Acknowledgements
This report synthesises a two-year OECD Horizontal Programme on Water. Itpresents the main findings and policy recommendations from the programme, and isbased on several analytical reports prepared by several OECD directorates (seeBackground Materials). The Environment Directorate has contributed its expertise onwater pricing and financing in OECD countries and in transition economies, and has co-ordinated efforts from other parts of the Organisation. The Directorate for Co-operationand Development has monitored and analysed official development assistance flows tothe water sector. The Directorate for Financial and Enterprise Affairs has examined howthe “OECD Principles for Private Sector Participation in Infrastructure” could be tailoredto the water sector. The Directorate for Trade and Agriculture has analysed water policiesand the associated support provided to farmers.
The report has been put together by the following individuals of the OECDsecretariat, under the supervision of Brendan Gillespie: Julia Benn, Peter Börkey,Valérie Gaveau, Céline Kauffmann, Naoko Kubo, Xavier Leflaive, Wilfrid Legg,Roberto Martin-Hurtado, Remy Paris, Kevin Parris, Cécilia Piemonte, Florence Poppeand Monica Scatasta. The authors have worked with support from Carla Bertuzzi,Virginia Dagostino and David Kimble. Julie Harris copy-edited and prepared this reportfor publication. The comments from Kumi Kitamori and Lorents Lorentsen, EnvironmentDirector at the OECD, are acknowledged.
Intermediary results have been presented and discussed at the relevant OECDworking parties and committees and at a number of occasions, including an expertmeeting in November 2007 and a Global Forum on Sustainable Development inDecember 2008. Comments received from country delegates and experts areacknowledged.
6 – BACKGROUND MATERIALS
MANAGING WATER FOR ALL: AN OECD PERSPECTIVE ON PRICING AND FINANCING – ISBN-978-92-64-05033-4 © OECD 2009
Background Materials
The main findings and policy recommendations found in this report are based on:
• OECD/WWC (2008), Creditor Reporting System: Aid Activities in Support ofWater Supply and Sanitation - 2001-2006, OECD, Paris.
• OECD (2009), Private Sector Participation in Water Infrastructure: OECDChecklist for Public Action, OECD, Paris, www.oecd.org/daf/investment/water.
• OECD (2009), “Strategic Financial Planning for Water Supply and Sanitation”,OECD internal document, www.oecd.org/water.
• OECD (2009), “Pricing Water Resources and Water and Sanitation Services”,OECD internal document, www.oecd.org/water.
• OECD (2009), “Alternative Ways of Providing Water and Sanitation: EmergingOptions and their Policy Implications”, OECD internal document,www.oecd.org/water.
• OECD (forthcoming), Sustainable Management of Water Resources inAgriculture, OECD, Paris, www.oecd.org/tad/env.
A companion report, Managing Water for All: An OECD Perspective on Pricing andFinancing – Key Messages for Policy Makers, is available at www.oecd.org/water.
TABLE OF CONTENTS – 7
MANAGING WATER FOR ALL: AN OECD PERSPECTIVE ON PRICING AND FINANCING – ISBN-978-92-64-05033-4 © OECD 2009
Table of Contents
List of Abbreviations and Acronyms ......................................................................................... 11
Executive Summary ................................................................................................................... 13
The benefits of strategic financial planning for water supply and sanitation ............................. 14Tariffs: reconciling different policy objectives .......................................................................... 16How to best harness the capabilities of public and private actors for water supply and sanitation services ........................................................................................ 17Economic instruments to promote sustainable water use for agriculture ................................... 18
Notes........................................................................................................................................... 19
Introduction ................................................................................................................................ 21
Overview .................................................................................................................................... 21Structure of the report ................................................................................................................. 21
Notes........................................................................................................................................... 22
Chapter 1. Setting the Stage ....................................................................................................... 23
The economic backbone of water policies ................................................................................. 24Current water policy challenges ................................................................................................. 31The evolution of the policy debate ............................................................................................. 38
Notes........................................................................................................................................... 41
Annex 1.A1. Projected Expenditures on Water and Wastewater Services ................................. 42
Annex 1.A2. A Brief History of International Conferences on Water ....................................... 43
References .................................................................................................................................. 45
Chapter 2. Financing Water and Sanitation Services: Key Challenges and the Way Forward ..................................................................... 47
Financing water supply and sanitation: redefining the perspective on the problem ................... 48Strategic financial planning: policy options to reduce costs ...................................................... 49Strategic financial planning: policy options to increase revenue from the 3Ts .......................... 54Policy dialogue on WSS financing: good practices from OECD and developing countries ...... 65
Notes........................................................................................................................................... 68
References .................................................................................................................................. 70

8 – TABLE OF CONTENTS
MANAGING WATER FOR ALL: AN OECD PERSPECTIVE ON PRICING AND FINANCING – ISBN-978-92-64-05033-4 © OECD 2009
Chapter 3. Water Services: The Central Role of Tariffs ............................................................ 73
The 2007-08 OECD survey: main trends and data limitations ................................................... 74Pricing “water”: the challenge of multiple objectives ................................................................ 79Tariff structures to address the policy trade-offs ........................................................................ 83Pricing sanitation and wastewater management: a special challenge ......................................... 92
Notes........................................................................................................................................... 94
Annex 3.A1. Comparison of Data from GWI Surveys and the World Bank IB-Net Database for EECCA Countries and BRIICS .............................................................. 96
Annex 3.A2. Criteria Matrix for Assessment of Tariff Structures ........................................... 100
References ................................................................................................................................ 102
Chapter 4. Beyond Money: The Roles of Governments and Private Actors in Water Services .................................................................................................... 105
Trends in private sector involvement in water supply and sanitation: new actors, new responsibilities ............................................................................................. 107
Government responsibilities: the need for clarity ..................................................................... 113Beyond public and private roles: the key elements for successful private sector participation ..................................................................................................... 117
Private responsibilities: the elements of responsible business conduct .................................... 120
Notes......................................................................................................................................... 122
References ................................................................................................................................ 124
Chapter 5. Managing Water Resources in the Agricultural Sector .......................................... 127
Recent trends and outlook ........................................................................................................ 129OECD policy experiences and options for sustainable water resource management in agriculture ..................................................................................................... 135
Notes......................................................................................................................................... 145
References ................................................................................................................................ 146
Tables
Table 1.1. Cost of water supply and wastewater infrastructure for centralised systems ............ 27Table 1.2. Coverage of water supply and sanitation services in OECD countries ..................... 39Table 2.1. Per capita investment costs of water supply improvements ...................................... 52Table 3.1. Tariff changes in OECD and selected non-OECD countries ..................................... 80Table 4.1. The diverse nature of the private sector: recent market entrants ............................. 108Table 4.2. Typology of risks..................................................................................................... 111Table 4.3. Typology of contractual arrangements between governments (G)
and private sector (P) ............................................................................................... 112Table 5.1. Agricultural water use ............................................................................................. 131Table 5.2. Irrigated area, irrigation water use and irrigation water application rates ............... 133

TABLE OF CONTENTS – 9
MANAGING WATER FOR ALL: AN OECD PERSPECTIVE ON PRICING AND FINANCING – ISBN-978-92-64-05033-4 © OECD 2009
Figures
Figure 1.1. The vicious circle of underinvestment and unrealised benefits ............................... 29Figure 1.2. Financial flows to water supply and sanitation ........................................................ 30Figure 1.3. People living in areas of water stress ....................................................................... 33Figure 2.1. Shares of official development assistance, national governments
and users in water supply and sanitation finance in various countries .................... 54Figure 2.2. Trends in official development assistance to water supply and sanitation ............... 61Figure 2.3. Aid to water supply and sanitation per capita in relation to the degree
of access to water supply by recipient countries ..................................................... 62Figure 2.4. Aid to water supply and sanitation per capita in relation to the degree
of access to sanitation facilities by recipient countries ............................................ 63Figure 3.1. Domestic price of water and wastewater services, including taxes,
in selected OECD countries ..................................................................................... 76Figure 3.2. Average water and wastewater bills as a share of average net
disposable income ................................................................................................... 87Figure 3.3. Average water and wastewater bills as a share of income of the
lowest decile of the population ................................................................................ 88Figure 4.1. Evolution of investment involved in public private partnership projects
in developing countries, 1991-2007 ...................................................................... 110Figure 4.2. The OECD Checklist for Public Action: encouraging responsible
business conduct .................................................................................................... 121Figure 5.1. Agricultural water use ............................................................................................ 130Figure 5.2. Irrigated area, irrigation water use and irrigation water application rates .............. 132Figure 5.3. Share of agricultural groundwater use in total groundwater use, and total
groundwater use in total water use ......................................................................... 132
Boxes
Box 1.1. Definitions .................................................................................................................... 24Box 1.2. The economic nature of water services: a clarification ................................................ 25Box 1.3. Sustainable cost recovery ............................................................................................. 31Box 1.4. Water agency subsidies in France ................................................................................ 31Box 1.5. Water stress definitions ................................................................................................ 32Box 1.6. Defining access ............................................................................................................ 36Box 1.7. The burden of legacy in EECCA countries .................................................................. 37Box 2.1. Transparency International’s Global Corruption Report 2008 ..................................... 50Box 2.2. The challenge of achieving the water-related MDGs in Moldova ............................... 53Box 2.3. Subsidy policy in Uganda ............................................................................................ 59Box 2.4. Evolution of subsidy policy in Korea ........................................................................... 59Box 2.5. The Philippine Water Revolving Fund (PWRF) .......................................................... 64Box 2.6. Results of strategic financial planning processes in Moldova and Armenia,
using the OECD’s FEASIBLE methodology ............................................................... 66Box 3.1. The 2007-08 OECD survey: difficulties in data collection and solutions adopted ...... 75Box 3.2. Tariff structures: some definitions ............................................................................... 78Box 3.3. Tariff structures: the case of Mexico............................................................................ 79Box 3.4. Elasticity of water demand to marginal price changes vs. tariff regime....................... 84Box 3.5. Tariff policy reforms based on affordability considerations: the case of Portugal ...... 89Box 3.6. The Mumbai Slum Sanitation Project (Water and Sanitation Programme) ................. 89Box 4.1. Alternative models of water and sanitation provision ................................................ 109Box 4.2. Summary of the ADB-OECD regional expert meeting: call for
greater capacity building ............................................................................................ 114

10 – TABLE OF CONTENTS
MANAGING WATER FOR ALL: AN OECD PERSPECTIVE ON PRICING AND FINANCING – ISBN-978-92-64-05033-4 © OECD 2009
Box 4.3. The IMTA-OECD regional expert meeting: setting a high-quality regulatory framework ................................................................................................ 115
Box 4.4. The Chilean experience of involving the private sector ............................................. 116Box 4.5. Regulation and small-scale providers ........................................................................ 117Box 4.6. The Armenian experience of implementing a performance-based contract ............... 118Box 4.7. The affermage contract for urban drinking water in Senegal ..................................... 119
LIST OF ABBREVIATIONS AND ACRONYMS – 11
MANAGING WATER FOR ALL: AN OECD PERSPECTIVE ON PRICING AND FINANCING – ISBN-978-92-64-05033-4 © OECD 2009
List of Abbreviations and Acronyms
3Ts tariffs, taxes, transfersBOT built, operate, transferBRIC Brazil, Russian Federation, India, ChinaBRIICS Brazil, Russian Federation, India, Indonesia, China, South Africacap capitaCBOs community-based organisationsDAC Development Assistance CommitteeDFID Department for International Development (United Kingdom)EAP Task Force The Task Force for the Implementation of the Environmental
Action Programme for Central and Eastern Europe (OECD)FCR full cost recoveryEEA European Environmental AgencyEECCA Eastern Europe, Caucasus and Central Asia (Armenia, Azerbaijan,
Belarus, Georgia, Kazakhstan, the Kyrgyz Republic, Moldova, theRussian Federation, Tajikistan, Turkmenistan, Ukraine andUzbekistan)
EU European UnionFS financing strategy (another term to designate SFP)GDP gross domestic productGRP Government of the Republic of the PhilippinesGWI Global Water IntelligenceGWP Global Water PartnershipIBT increasing block tariffIFI international financial institutionILO International Labour OrganizationIMTA Instituto Mexicano de Tecnologia del Agua (Mexico)INEGI Mexican National Institute of Statistics and GeographyIPCC Intergovernmental Panel on Climate ChangeIWA International Water AssociationJICA Japan International Cooperation AgencyJMP Joint Monitoring Programme (WHO-UNICEF)MC marginal costMDGs Millennium Development GoalsNGO non-governmental organisationNWSC National Water and Sewerage Corporation (Uganda)O&M operation and maintenanceOBA output-based aidODA official development assistanceOECD Organisation for Economic Co-operation and DevelopmentPPP public private partnershipPWRF Philippines Water Revolving Fund

12 – LIST OF ABBREVIATIONS AND ACRONYMS
MANAGING WATER FOR ALL: AN OECD PERSPECTIVE ON PRICING AND FINANCING – ISBN-978-92-64-05033-4 © OECD 2009
RoW rest of the world (countries which are neither OECD nor BRIC)RWSI relative water stress indexSCR sustainable cost recoverySFP strategic financial planningSRMC short range marginal costSTP sewage treatment plantUNCED United Nations Conference on Environment and DevelopmentUNDP United Nations Development ProgrammeUNEP FI United Nations Environment Programme Finance InitiativeUNESCO United Nations Educational, Scientific and Cultural OrganizationUNICEF United Nations Children’s FundUSAID United States Agency for International DevelopmentUTC unwillingness to payWHO World Health OrganizationWRM water resources managementWSP Water and Sanitation ProgrammeWSS water supply and sanitationWSSD World Summit on Sustainable DevelopmentWTP willingness to payWWDR World Water Development ReportWWF World Wide Fund For Nature (formerly World Wildlife Fund)
EXECUTIVE SUMMARY – 13
MANAGING WATER FOR ALL: AN OECD PERSPECTIVE ON PRICING AND FINANCING – ISBN-978-92-64-05033-4 © OECD 2009
Executive Summary
Water is a key prerequisite for human and economic development, and formaintaining ecosystems. Poor governance and inadequate investment, however, areresulting in large populations not having access to the water services they need. Failure tomanage water resources effectively is also resulting in increased pressure on theseresources, mounting competition for their use among different economic activities, and,in some regions, conflict.
Major economic benefits potentially accrue from improved water resourcemanagement and water services, especially for agriculture, industry, and water andsanitation. The World Health Organization (WHO) estimates that the health benefit/costratio for investment in water supply and sanitation (WSS) alone is between 4 and 12. Butthese benefits are not adequately quantified, nor communicated in a way that couldinform public and political debate. This results in water resources managementinstitutions being unable to carry out their functions, and in insufficient funding forinvestment and maintenance of water infrastructure. The outcome is that the potentiallylarge benefits of investing in water are not being realised in practice, and the social costslinked to poor water management continue to increase.
In OECD countries, access to safe water supply and sanitation has largely beenensured following substantial investment over many decades. Access to water byagriculture and industrial users is generally ensured. However, significant investmentswill still be required to rehabilitate existing infrastructure, to bring it into conformity withmore stringent environment and health regulations, and to maintain service quality overtime.
In non-OECD countries, the challenges are more daunting. Large parts of thepopulation have no access and many others suffer unsatisfactory services. Water servicesfor agriculture and industry are also inadequate. The international community iscommitted to achieving the Millennium Development Goals (MDGs) that aim, inter alia,to halve the proportion of people without access to safe drinking water and basicsanitation by 2015. The costs of not meeting these objectives are very significant, and it isimportant to recognise that meeting them would still leave millions of people withoutaccess to adequate services. Inadequate access to water, sanitation and poor hygieneaccount for 1.8 million child deaths per year – the second largest cause of child mortalityafter malnutrition – in addition to having other health impacts.
The challenges of providing access to safe water and basic sanitation are furtherunderlined by increasing demands from other uses of water. The increased demand islinked with a variety of factors: population increase, pressures for food production, rapidurbanisation, degradation of water quality, and increasing uncertainties about wateravailability and precipitation regimes, in part due to climate change. In 2005, 2.8 billionpeople lived in areas under severe water stress.1 By 2030, the OECD Environmental

14 – EXECUTIVE SUMMARY
MANAGING WATER FOR ALL: AN OECD PERSPECTIVE ON PRICING AND FINANCING – ISBN-978-92-64-05033-4 © OECD 2009
Outlook to 2030 estimates that this number will increase by about 1 billion, to 3.9 billion(47% of the world population), without taking climate change into consideration.
Despite strong calls for action at the international level, and considerable efforts atlocal, national and international levels, the world is still off track with respect toachieving internationally agreed water-related targets. Few countries have defined waterresources management strategies, as called for in the Millennium Declaration. Withregard to the water-related MDGs, the 2008 World Health Organization-United NationsChildren’s Fund (WHO-UNICEF) Joint Monitoring Report states that, while the worldglobally is on track to achieve the drinking water target, a number of regions will notreach this goal, and the world as a whole is off track with regards to the sanitation target.
Substantial additional finance is required to meet these challenges. A recent WHOreport2 estimates that USD 18 billion will be needed annually to extend existinginfrastructure to achieve the water-related MDGs, roughly doubling current spending. Butwhat is also growing clear is that the cost of maintaining and modernising existingsystems will grow steeply and already greatly exceeds the annual costs of extending thenetworks. WHO estimates that an additional USD 54 billion per year will be needed justto ensure continued services to the currently served population. This does not include theadditional needs generated by new infrastructure.
Additional financial resources are a necessary, but not sufficient, condition forachieving internationally agreed, and other, water policy objectives. There is alsoconsiderable scope to improve the cost-effectiveness of expenditures on water. These twoissues dovetail each other and are linked to the way institutions are established and theirpolicies are implemented. This is particularly challenging in the water sector as it usuallycuts across the responsibility of several ministries, and requires the involvement ofnational, regional and local authorities. In addition, the implementation of effective waterpolicies is often hindered by political and public opposition to increasing the price ofwater, which impinges on the establishment of effective financing arrangements andefficient system performance.
Thus realising the benefits of improved water policies requires not only more finance,but also improved governance of the sector, as well as effective strategies that canovercome the vested interests and opposition that often block reform. Effectivecommunication of fact-based analysis can contribute to informed policy debates andtransparent decision making.
The benefits of strategic financial planning for water supply and sanitation
The water and sanitation sector is seriously under-financed in many countries. Insome developing and transition economies, this has led to the deterioration and theeventual collapse of infrastructure.
One approach to address these challenges is through strategic financial planning forthe water sector. Such plans should establish realistic policy objectives regarding accessto water and sanitation services that are affordable to public budgets and households.They should consider ways of mobilising more financial resources, reducing excessivedemand, and improving the cost-effective use of resources. Strategic financial planningshould help to reach consensus on policy choices and how they should be achieved.Ideally such planning processes should be led by ministries of finance, in co-ordinationwith other ministries, and engage other relevant stakeholders. This must be done in a way

EXECUTIVE SUMMARY – 15
MANAGING WATER FOR ALL: AN OECD PERSPECTIVE ON PRICING AND FINANCING – ISBN-978-92-64-05033-4 © OECD 2009
that ensures a more rational use of existing financial resources and access to additionalones.
Effective financial planning for the water sector requires finding the right mix ofrevenues from the so-called “3Ts”: tariffs, taxes and transfers (including officialdevelopment assistance [ODA] grants). These are the ultimate sources of revenue for thesector and they need to increase to a level where they allow the recovery of costs. Thiswill help to attract other sources of finance – such as loans (including ODA loans bybilateral donors and international financial institutions), bonds and private investors.These additional sources of finance are important for making the large, upfrontinvestments normally required in the water sector, but they need to be repaid by somecombination of the 3Ts. In addition, the water sector will be able to attract these externalsources of finance only if revenues (the 3Ts) are sufficient and reliable.
Full cost recovery from tariffs which may theoretically be the ideal solution, inpractice remains a distant objective in many countries. However, even very poorcountries can reach important cost-recovery targets at the sub-sector level: such as costrecovery for operation and maintenance (O&M) and investments in urban water supply,or cost recovery for O&M expenditures in rural water supply. Increasing revenue fromtariffs requires a comprehensive approach, which includes reforming tariff levels andstructures and increasing bill collection rates, but also increasing levels of service andputting in place social protection measures.
Where full cost recovery from tariffs cannot be achieved, public budgets and, forpoorer developing countries, ODA will need to play an important role in financing sectorcosts. The water sector should therefore aim to achieve cost recovery from a combinationof financial sources, including user charges, public budgets and ODA, rather than fromtariffs alone – a concept that has been termed “sustainable cost recovery”.3
The latest statistics on ODA indicate a renewed emphasis on the water sector indonors’ aid programmes. In 2005-06, total aid for water rose to USD 6.2 billion whichrepresented 9% of total sector allocable aid. Over the last five years, aid for water wasallocated mostly to Asia (55%) and Africa (32%). However, the share of the region mostin need of improved access to water supply and sanitation, Sub-Saharan Africa, declinedfrom 22% over 2001-04 to 17% in 2005-06 for Development Assistance Committee4
(DAC) members. ODA transfers to the water sector are in the form of both grants andloans with the latter representing almost 40% of the DAC total.
Although from a global perspective ODA provides a relatively small part of revenuesfor the water sector, it can help close the financing gap in poorer countries. Donor supportfor country-owned strategic financing plans can enhance the effectiveness of donor aidfor the water sector, in line with the Paris Declaration on Aid Effectiveness and the AccraAgenda for Action.
Effective strategic financial plans for the water sector should also emphasiseopportunities to reduce costs. This could include improving the operational efficiency ofutilities – though this is largely dependent on local conditions and governance. Improvedcontractual arrangements, better incentives, and clearer roles for utility operators can helpreduce costs. Other important opportunities are linked to policy decisions such asadopting lower cost technologies, accepting lower service levels, extending deadlines forattaining targets, and rationalising construction and environmental standards.

16 – EXECUTIVE SUMMARY
MANAGING WATER FOR ALL: AN OECD PERSPECTIVE ON PRICING AND FINANCING – ISBN-978-92-64-05033-4 © OECD 2009
Tariffs: reconciling different policy objectives
Tariffs often provide the major share of financing for the water sector, though this isusually well short of the theoretical goal of “full cost recovery”. A number of obstaclesconstrain a fuller role for tariffs, including lack of awareness of the broader economicbenefits of water supply, and particularly sanitation, and concerns about the impacts onlow-income households. These factors are relevant to a greater or lesser extent in bothOECD and non-OECD countries.
Tariffs have to meet diverging financial, economic, environmental and socialobjectives, some of which may be conflicting. A major challenge therefore is designingtariffs in a way that strikes an appropriate balance among competing objectives. This isultimately a political task and needs to be addressed through a transparent, democratic,participatory process. This requires a debate about the appropriate balance between thevarious policy objectives, assessing the costs and benefits of different tariff levels,examining the distributional impacts of tariff structures, and developing appropriatecompensatory or mitigation measures to avoid affordability problems. Such a debate islikely to be more effective if tariff reforms are considered in combination with issuessuch as the level of service and the efficiency of service provision.
It is especially important that two objectives are met simultaneously: the financialsustainability of the service provider and the affordability of the service for low-incomehouseholds. Two questions need to be addressed. The first concerns the portion of thecosts that should be covered by revenues; and the second, the share that should becovered by different income groups, family types, or different geographical units. Theway in which costs are allocated provides the basis for considering cross-subsidisationacross regions’ user groups.
Affordability limits are better assessed at the local level, and need to take intoconsideration local knowledge on low-income households’ current spending on services,ability and willingness to pay (WTP) for improved services, although caution should beused in interpreting WTP estimates. In the absence of this information, the risk is thatdecisions about tariff levels and structures will be based on exaggerated assessments ofaffordability constraints that underestimate willingness to pay.
In such cases, the result is a vicious circle of underfinanced services, lower thanneeded investment and maintenance, and lack of access to water services. This hurts thepoor most, as they are the first to suffer from low quality services. Moreover, keepingtariffs artificially low prevents the extension of services to the currently unserved and isnot an effective measure to help the poor.
A review of tariff policies for water supply and sanitation in OECD countries revealsa number of trends:
• continued real price increases – at times, substantial – for household service overrecent years, both in OECD and non-OECD countries, which may signal anincreased role of tariffs in cost recovery;
• a continued decline in the use of decreasing block tariffs and flat fee systems forhousehold tariffs, in favour of two-part fixed charge + variable fees with auniform or increasing block volumetric component;
• the limited application of decreasing block tariffs for industrial uses (or for thelarger amongst them) in only a few OECD countries;
EXECUTIVE SUMMARY – 17
MANAGING WATER FOR ALL: AN OECD PERSPECTIVE ON PRICING AND FINANCING – ISBN-978-92-64-05033-4 © OECD 2009
• the increased application of taxes on water bills;
• increasing separation of wastewater from drinking water charges, and chargingfor wastewater on the basis of actual costs thus raising charges, with consequentsubstantial increases in the price of wastewater management services;
• evidence that the response of domestic consumers to marginal price changes maybe limited, while more significant – but possibly temporary – impacts on demandmay follow changes in tariff structure, and especially a shift from flat tovolumetric rates;
• continued attention to social concerns, addressed through innovative tariffstructures or parallel income-support mechanisms.
How to best harness the capabilities of public and private actors for water supplyand sanitation services
Many countries have engaged the private sector in operating, modernising and/orexpanding their water and sanitation infrastructures. Experience has been mixed. Thereare many examples of well-run public and privately operated utilities. The badexperiences can be largely attributed, among other factors, to a misunderstanding of therisks involved and unclear allocation of responsibilities among stakeholders. Debate hasnow moved on from public vs. private ownership, to consider ways in which waterservices can be provided not only safely but also most efficiently, effectively andsustainably, regardless of ownership.
Private actors in the water sector today are more diverse than 10-15 years ago: inaddition to international companies, they include local and regional actors, small-scalewater operators, private sector whose core activity is not water (financiers, big users),joint ventures between public and private companies as well as public companiesoperating abroad (effectively as private entities). Mimicking this diversity, contractualarrangements are also becoming increasingly diverse and context-specific, covering thespectrum from divestiture of assets to non-financial forms of participation.
Governments have taken various measures to improve the stability and predictabilityof their regulatory frameworks for water. However, managing the flexibility required tosustain long-term commitments in a constantly changing environment remains a majorchallenge. Most developing countries find it difficult to make the long-term policydecisions necessary to harness private sector capabilities. The choice of whether or not toengage the private sector should be based on an analysis of costs and benefits and involvecareful definition of contractual arrangements – typically output-based, providing realisticincentives to improve coverage and efficiency and including dispute resolutionmechanisms.
Private sector participation does not relieve governments of their responsibility toensure safe and efficient water services and to prevent the abuse of monopoly position.OECD has developed a Checklist for Public Action5 that can help governments to makethe best use of the capabilities of both public and private actors in the development,maintenance and operation of water supply and sanitation services. It provides a coherentset of policy directions, including the allocation of roles, risks and responsibilities, as wellas the framework conditions necessary to make the best of private sector participation.
18 – EXECUTIVE SUMMARY
MANAGING WATER FOR ALL: AN OECD PERSPECTIVE ON PRICING AND FINANCING – ISBN-978-92-64-05033-4 © OECD 2009
Economic instruments to promote sustainable water use for agriculture
The issue of water resources management should be addressed in a co-ordinatedmanner, looking at the interactions between competing water uses (including pollutionand ecosystem requirements). Integrated water resources management is a holisticapproach that aims to reconcile competing requirements through a negotiated process thatwill inevitably require trade-offs between economic sector users, and between these usersand social and environmental concerns. This analysis lies beyond the scope of this report,which focuses primarily on advancing understanding of the role of pricing and financingissues in different parts of the water sector. By treating them in the same report, however,common principles can be identified. Future work by OECD will address integrated waterresources management issues, particularly their financing and pricing aspects.
To improve water resources management, it is critical to manage the way water isused in agriculture. Agriculture is by far the largest water user and also contributes topollution of surface waters and groundwater. Improving agricultural water management isa key aspect of achieving more sustainable water resources management. Agriculturalwater use needs to be part of an integrated approach. In particular, the report highlightsthe importance of providing the agriculture sector with the right signals to increaseefficiency in water use or to modify production patterns.
Charges for surface water supplied to farms have been increasing in most OECDcountries. But, while the principles of sustainable cost recovery should hold true foragriculture water use as well, often farmers are only covering the operation andmaintenance costs for water supplied, with little or no recovery of capital costs for waterdelivery infrastructure. Water pricing policies rarely take into account social orenvironmental values. Groundwater policies usually involve licenses and other regulatoryinstruments. But illegal connections to surface water distribution systems and illegalgroundwater pumping is difficult to observe or control and remains a major challenge forthe sustainability of farming. Where countries have increased water charges to farmers,the available evidence indicates that it has not led to reduced output.
Agricultural policies linked to production encourage less efficient use of water, leadto off-farm pollution and exacerbate flood damage in many OECD countries. There hasbeen some progress in lowering overall agricultural support levels and in decouplingsupport from production and inputs (including water and energy). This is beginning toencourage more efficient use of water, better adaptation to water scarcity, and lower off-farm pollution. Adoption of improved farm practices can promote the efficient use ofwater and infrastructure for production, help flood mitigation, and provide otherenvironmental benefits, such as wetland conservation. And well-targeted agriculturalsupport can maintain farming systems in those countries where there is an associationbetween farming and the provision of ecosystems. But isolating and quantifying theoverall economic efficiency and environmental effectiveness of agricultural and agri-environmental support on water resources is difficult and further analysis on causation isneeded.
Water reforms are addressing an increasingly complex set of policy objectivesincluding: ensuring robust water entitlements (property rights); achieving cost recoverytargets; developing water charges reflecting cost of service provision; establishing tradingsystems (of water use permits) to enable highest value use of water, and refininginstitutional arrangements to efficiently plan, allocate, manage and regulate water use.These policy reforms need to be underpinned by improved knowledge, research, capacity
EXECUTIVE SUMMARY – 19
MANAGING WATER FOR ALL: AN OECD PERSPECTIVE ON PRICING AND FINANCING – ISBN-978-92-64-05033-4 © OECD 2009
building, and monitoring. The basis for determining water supply costs often lackstransparency. Developing markets for water use permits, and planning water allocationbetween different users and the environment, require detailed monitoring of waterextractions and flows and the ecological outcomes that are sought. Improved informationon the costs and benefits of agriculture’s use of water (e.g. groundwater recharge, wetlandconservation, flood mitigation) would better inform policy decision making. Farmers alsoneed more advice on best practices to adopt.
Many OECD countries are reporting the growing incidence, severity and costs offlood and drought events on agriculture linked to climate change. This is leading to theemergence of mitigation and adaptation policy strategies. These include efforts toimprove food security and water use efficiency by farmers in areas of water scarcity, todevelop new crops or farm practices where climate change alters temperatures andprecipitation, and to alter management practices and systems that can contribute toslowing water transport across farmland and reducing flood damage in urban areas. Theseapproaches are more likely to be effective if they are embedded in longer term strategiesclosely linked with overall agricultural policy reform, risk management policy and marketapproaches.
Notes
1. Where water withdrawals exceed 40% of available water resources.
2. WHO (2008), “Regional and Global Costs of Attaining the Water Supply andSanitation Target (Target 10) of the MDGs”, WHO, Geneva.
3. Sustainable cost recovery is about combining user charges and public transfers in asustainable way, which requires that tariffs are affordable for each category of usersand transfers are predictable, enabling the water utility to count on them to financeinvestment. This concept is acknowledged by the European Union Water FrameworkDirective.
4. The OECD Development Assistance Committee is made up of 23 members:22 OECD countries (among them the most important bilateral donors) and theEuropean Commission.
5. OECD (2009), Private Sector Participation in Water Infrastructure: OECD Checklistfor Public Action, OECD, Paris, www.oecd.org/daf/investment/water.


INTRODUCTION – 21
MANAGING WATER FOR ALL: AN OECD PERSPECTIVE ON PRICING AND FINANCING – ISBN-978-92-64-05033-4 © OECD 2009
Introduction
Overview
Policies related to water can be considered under two inter-related headings:providing water services, especially water supply and sanitation, and managing waterresources. This report focuses on the economic foundation and financial basis forsustainable water service provision and the role of economic instruments in sound waterresource management. A considerable effort has been made to base the analysis on recentexperience in OECD and partner countries. This report examines practical ways to closethe financial gap between the costs of providing water services with the sources offinancing available, in both OECD and non-OECD countries. Closing this financial gap isa prerequisite for ensuring affordable water services for all segments of society. Tariffshave a special role to play in this, but need to remain affordable. This report examinessome of the related governance and institutional issues.
Regarding the management of water resources, this report essentially coversmunicipal and agricultural water uses, two areas which are major water uses (agricultureaccounts for 40% of overall water uses in OECD countries, and 70% globally) and wherethe OECD has accumulated experience. This report considers that these uses (and others,not covered in the report, such as industrial and environmental water uses) interact andshould be addressed in a co-ordinated, if not integrated, manner. In particular, this reportexamines how market-based instruments can enhance agricultural water management.The broader issues of integrated water resources management remain beyond its scope,but will be addressed in future OECD work, particularly with regards to financing andpricing aspects.
Structure of the report
The report has five chapters. Chapter 1 sets the stage. It presents some of the keyprinciples of water economics on which the report relies; in particular it clarifies thatwater is both a natural resource and a service that comes at a cost. Second, it explains themain challenges facing the water sector. Third, it situates this report in the lineage ofdebates in the international community on water finance. These debates have sometimesbeen muddled by some confusion surrounding the key principles of water economics.They need to be revisited in light of the emerging challenges. These elements provide therationale for the OECD Horizontal Water Programme, as was derived in 2006.
The subsequent four chapters focus on specialised issues related to the economic andfinancial bases for sustainable water service provision and sound water management.Chapter 2 takes stock of the experience gained in designing realistic finance strategies forwater supply and sanitation; the analysis draws on 18 country case studies. The focusprimarily is on developing countries and the water-related Millennium Development

22 – INTRODUCTION
MANAGING WATER FOR ALL: AN OECD PERSPECTIVE ON PRICING AND FINANCING – ISBN-978-92-64-05033-4 © OECD 2009
Goals,1 although some lessons are relevant for OECD countries as well. The chapter alsoexamines the role of official development assistance to water supply and sanitation.
Chapter 3 examines the ways tariff levels and structures can be designed to meetvarious objectives such as the financial sustainability of service operators and the accessto, and affordability of, the service for the poor. It builds on an updated survey of currentpractices of water pricing and financing sources in OECD and developing countries,identifying best practices and emerging challenges, such as the need to build socialassessment procedures into pricing policies.
Chapter 4 takes stock of the recent developments in private sector participation inwater supply and sanitation. It elaborates a checklist of policy directions for considerationby governments wishing to effectively harness the capacities of the private sector andother stakeholders. The OECD Checklist for Public Action builds on three regionalworkshops in Africa, Asia and Latin America. This chapter also draws on a backgroundstudy of the opportunities arising from new approaches for providing water supply andsanitation services in urban areas (reusing water; decentralised approaches).
In Chapter 5, the focus is on agricultural water management, specifically the use ofeconomic instruments to increase water productivity. The chapter explores recent trendsand the future outlook for the use of water in agriculture, and explores policy options toaddress the related challenges. The chapter builds on a systematic review of OECDcountry experience in water policies, pricing and financing in the agriculture sector.
Notes
1. This phrase covers both the initial Millennium Development Goal on access to waterand the sanitation-related target from the Johannesburg Plan of Implementation.
1. SETTING THE STAGE – 23
MANAGING WATER FOR ALL: AN OECD PERSPECTIVE ON PRICING AND FINANCING – ISBN-978-92-64-05033-4 © OECD 2009
Chapter 1
Setting the Stage
Water is a resource that has to be managed and a source of services that come at a cost.How can these costs be shared among different categories of users and beneficiaries, andfully covered is essentially a policy issue. As regards water supply and sanitation, costscan ultimately be covered by three sources of finance: tariffs, taxes and transfers. Theappropriate combination will depend on policy objectives and contextual features.
The current context is dominated by three major challenges which are consequential forwater policies, financing needs and possible responses: water scarcity, which resultsfrom the excessive usage of available resources; access to water supply and sanitation indeveloping countries; and rehabilitation of water supply and sanitation infrastructure inOECD countries.
These challenges and related issues emerged on the international policy agenda in the1970s. This report builds on this process to move the dialogue forward.

24 – 1. SETTING THE STAGE
MANAGING WATER FOR ALL: AN OECD PERSPECTIVE ON PRICING AND FINANCING – ISBN-978-92-64-05033-4 © OECD 2009
This chapter has three related objectives. First, it recalls some of the key principles ofwater economics on which the report relies (see Box 1.1 for key definitions). Second, itexplains the main challenges facing the water sector; it highlights the connection of oftenartificially separated issues, e.g. water resource management and water supply andsanitation. Third, it situates this report in the lineage of debates in the internationalcommunity on water finance. These debates have sometimes been muddled by someconfusion surrounding the key principles of water economics; they need to be revisited inlight of the emerging challenges.
Box 1.1. Definitions
In this report:
• Water sector signifies all water-related activities, i.e. water resources managementand the provision of water-related services.
• Water services refer to all services provided through manmade capital.
• Water supply and sanitation (WSS) services refer to the sub-set of water servicesdealing with the provision of drinking water and sanitation services (from basicsanitation to wastewater treatment).
The economic backbone of water policies
Complex issues pervade political debates about water economics. One is the debateabout the public versus private good dimension of different water services and how todeal with the externalities they produce. A second issue is the distinction between waterresources and their management vs. water services and their provision. A related issue ishow to ensure the financing of water resources management and water service provision,and the role of charges on water resources and tariffs for water services as a source ofrevenue and/or for other policy objectives.
The economic nature of water services
Box 1.2 clarifies the economic nature of different water-related services. Theireconomic characteristics need to be taken into consideration when defining waterpolicies, as they affect the effectiveness of different policy instruments as well as theperception of benefits and the willingness to pay for different services by final users.
1. SETTING THE STAGE – 25
MANAGING WATER FOR ALL: AN OECD PERSPECTIVE ON PRICING AND FINANCING – ISBN-978-92-64-05033-4 © OECD 2009
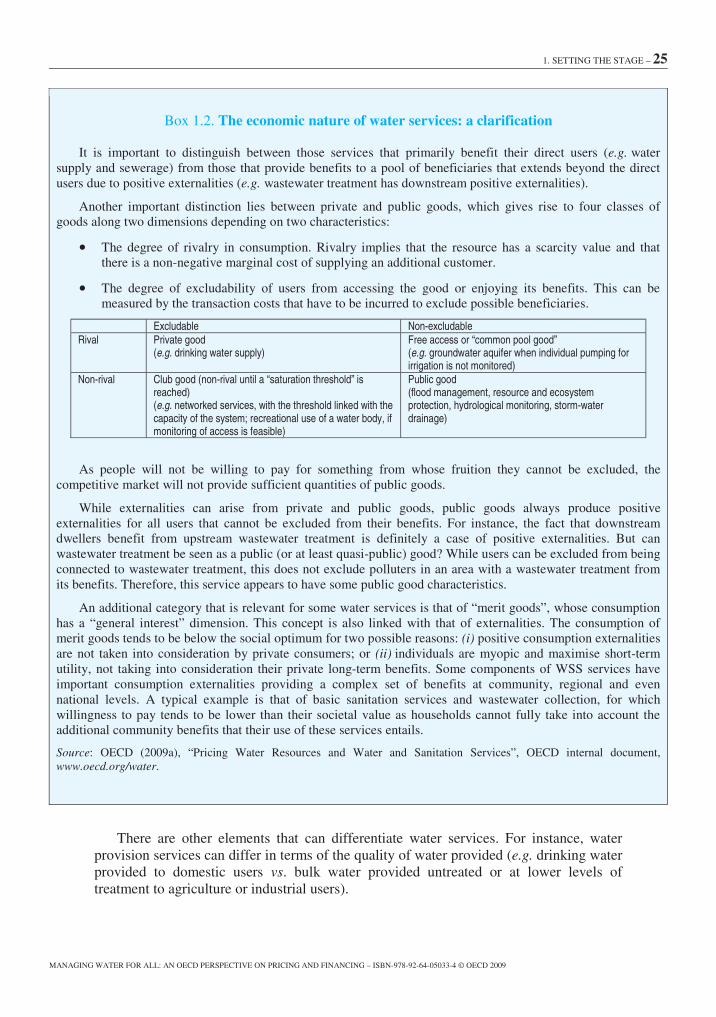
Box 1.2. The economic nature of water services: a clarification
It is important to distinguish between those services that primarily benefit their direct users (e.g. watersupply and sewerage) from those that provide benefits to a pool of beneficiaries that extends beyond the directusers due to positive externalities (e.g. wastewater treatment has downstream positive externalities).
Another important distinction lies between private and public goods, which gives rise to four classes ofgoods along two dimensions depending on two characteristics:
• The degree of rivalry in consumption. Rivalry implies that the resource has a scarcity value and thatthere is a non-negative marginal cost of supplying an additional customer.
• The degree of excludability of users from accessing the good or enjoying its benefits. This can bemeasured by the transaction costs that have to be incurred to exclude possible beneficiaries.
Excludable Non-excludableRival Private good
(e.g. drinking water supply)Free access or “common pool good”(e.g. groundwater aquifer when individual pumping forirrigation is not monitored)
Non-rival Club good (non-rival until a “saturation threshold” isreached)(e.g. networked services, with the threshold linked with thecapacity of the system; recreational use of a water body, ifmonitoring of access is feasible)
Public good(flood management, resource and ecosystemprotection, hydrological monitoring, storm-waterdrainage)
As people will not be willing to pay for something from whose fruition they cannot be excluded, thecompetitive market will not provide sufficient quantities of public goods.
While externalities can arise from private and public goods, public goods always produce positiveexternalities for all users that cannot be excluded from their benefits. For instance, the fact that downstreamdwellers benefit from upstream wastewater treatment is definitely a case of positive externalities. But canwastewater treatment be seen as a public (or at least quasi-public) good? While users can be excluded from beingconnected to wastewater treatment, this does not exclude polluters in an area with a wastewater treatment fromits benefits. Therefore, this service appears to have some public good characteristics.
An additional category that is relevant for some water services is that of “merit goods”, whose consumptionhas a “general interest” dimension. This concept is also linked with that of externalities. The consumption ofmerit goods tends to be below the social optimum for two possible reasons: (i) positive consumption externalitiesare not taken into consideration by private consumers; or (ii) individuals are myopic and maximise short-termutility, not taking into consideration their private long-term benefits. Some components of WSS services haveimportant consumption externalities providing a complex set of benefits at community, regional and evennational levels. A typical example is that of basic sanitation services and wastewater collection, for whichwillingness to pay tends to be lower than their societal value as households cannot fully take into account theadditional community benefits that their use of these services entails.
Source: OECD (2009a), “Pricing Water Resources and Water and Sanitation Services”, OECD internal document,www.oecd.org/water.
There are other elements that can differentiate water services. For instance, waterprovision services can differ in terms of the quality of water provided (e.g. drinking waterprovided to domestic users vs. bulk water provided untreated or at lower levels oftreatment to agriculture or industrial users).

26 – 1. SETTING THE STAGE
MANAGING WATER FOR ALL: AN OECD PERSPECTIVE ON PRICING AND FINANCING – ISBN-978-92-64-05033-4 © OECD 2009
Water: a resource to be managed and a source of services that come at a cost
Water resources are a natural capital that provides useful functions to humans andecosystems. Recital 1 of the European Union (EU) Water Framework Directive states that“Water is not a commercial product like any other but, rather, a heritage which must beprotected, defended and treated as such.” The availability of water resources and thefunctions and services that this natural capital is able to provide over time depend on acycle governed by nature and climate, and affected by human activities.
Water policy is therefore first of all concerned with the allocation of water resourcesamong competing uses1 (including environmental uses) and its protection againstexcessive deterioration. This has led to the concept of an integrated approach to waterresources management (GWP, 2000) that recognises the need for a negotiated process toco-ordinate and adjudicate among competing users to ensure sustainable management ofvaluable water resources; experience indicates that this process works best at the riverbasin level. Water resource management also relates to upstream ecosystems and forests,wetlands and marshes, due to their function of regulating water flows (see OECD, 2003);this is the concept of “nature for water”.
Water services are based on the natural capital of water resources, but their provisionalso needs man-made capital: water needs to be treated to achieve required quality levels(which can differ for different uses) and transported to the point of use; wastewater needsto be removed and treated, and also water resources management activities requirephysical infrastructures (e.g. monitoring networks). All this requires the construction andoperation of storage structures, treatment plants, piped networks, etc. Theseinfrastructures can increase the productivity of a watershed (i.e. the environmental, socialand economic functions obtained from the resource) or mitigate its deterioration overtime.
Water policy, therefore, also deals with the creation, operation and maintenance ofinfrastructures and the operation of water services. Man-made capital is costly, either inmonetary terms or because of negative externalities linked to its use (e.g. negativeimpacts on ecosystems of the construction of a dam). Its cost has three elements:
• Financial or supply costs are directly associated with supplying water andsanitation services to users. They consist of two elements: (i) operation andmaintenance costs, associated with daily running of the water supply system, suchas electricity for pumping, labour, water treatment and repair costs; (ii) capitalcosts, covering both capital for renewal investment of existing infrastructure andnew capital investment costs; the financial cost of servicing debt. Table 1.1 showsestimates of the average costs of water infrastructure in developed countries.Water supply costs do not include large dams or similar infrastructure as these arelocally specific.
• Economic costs are the sum of the supply costs, plus the opportunity costs, whichreflect the scarcity value of the resource and the costs of depriving the nextpossible user, and the economic externalities, consisting of positive externalities(for example the groundwater recharge benefits from irrigation or water re-use)and negative externalities (typically, upstream diversion of water or the release ofpollutants downstream within an irrigation system). It should be noted that thereis an opportunity cost to public finances that are provided for water as well, asthey are not available for alternative purposes.

1. SETTING THE STAGE – 27
MANAGING WATER FOR ALL: AN OECD PERSPECTIVE ON PRICING AND FINANCING – ISBN-978-92-64-05033-4 © OECD 2009
• Full costs include the sum of the supply and economic costs, plus externalitiesassociated with costs to public health and ecosystems, such as salinisation of soilsand pollution of water from farm chemicals used in irrigation.
Cardone and Fonseca (2003) add to this the administrative costs of sustaining theservice, which include the costs incurred in regulating the service, institutional capacitybuilding, and the cost of devising and implementing the policy and enabling environmentfor the sector. Rees, Winpenny and Hall (2008) argue that this should be further extendedto more systematically include the costs associated with water resources managementactivities that are needed for the stewardship of the water resource base, and therefore forthe long-term sustainability of service provision.
An essential aspect of water policies is ensuring that these costs are covered so thatwater-related infrastructure and services continue to perform their functions. This raisesthe question of who should pay for these costs.
Table 1.1. Cost of water supply and wastewater infrastructure for centralised systems (USD)
Sewage disposal
Service Water supply1 Combined sewer1 Separate sanitarysewer1
Separate stormwater
Networks (cost fraction) 85% 90% 88% 100%
Treatment (cost fraction) 15% 10% 12% Storage only
Financing costs2 Up to 40 15-25 10-16 9-15
Maintenance costs2 Up to 45 13-25 8-15 5-13
Operating costs (30% labour)2 15-60 30-40 15-35 12-18
Taxes2/other 3-15 4 2.5 2
Infrastructure cost per head 700-800 average 1 000-1 300 700-900 650-700
For 180-210 l/h/d (min.-max) (450-1 800) (900-2 200) (650-1 400) (970-1 250)
1. Includes centralised treatment system.
2. Costs per 100 m3 per year.
Source: Lee, T., et al. (2001), “Economic and Financial Aspects”, in C. Maksimovic and J.A. Tejada-Guibert (eds.),Frontiers in Urban Water Management – Deadlock or Hope, pp. 313-343, quoted in OECD (2006), Infrastructure to2030: Telecom, Land, Transport, Water and Electricity, OECD, Paris, p. 313.
Financing water services: an essentially political issue
The issue of who should pay for water services is difficult for two reasons. One is thatthe value attached to services by users is not related to the costs of these services.Typically, city dwellers pay more attention to the quality of the water they drink than tothe quality of the wastewater they return to the ecosystem. Consequently, they are morewilling to pay for access to safe and reliable drinking water and removal of wastewaterthan for wastewater treatment, independently of the respective costs of these services.
The other reason why the issue of who should cover the costs of water services isdifficult is that the benefits of water services (or the cost of a lack thereof) do notnecessarily accrue to the users of the service or to the party that pays for this service. Acombination of institutional arrangements, policy choices and market failures results in adifference between the private costs of water services and their social benefits.
28 – 1. SETTING THE STAGE
MANAGING WATER FOR ALL: AN OECD PERSPECTIVE ON PRICING AND FINANCING – ISBN-978-92-64-05033-4 © OECD 2009
For instance, the money that businesses or households allocate for improvedwastewater treatment will benefit health and economic development for the widercommunity, e.g. including downstream users who cannot be excluded from the fruition ofimproved quality of resources. The World Health Organization estimates that each USdollar invested in water supply and sanitation generates between USD 4-12 in healthbenefits alone, depending on the intervention (WHO, 2008).2 Similarly, the moneyinvested by a community to improve water services can increase the value of the landowned by private owners, who will collect rent.
It follows that, for water services, the distinction between public and private goods isless discernable.3 This has consequences for decisions about who should bear the cost ofwater services. With regard to wastewater treatment, for instance, public support could bejustified because it has a public good dimension. On the other hand, (part of) theinvestment in the infrastructure could be covered by property owners, if they can extract arent from the investment. The relative contribution of public and private sources offinance is a political issue, which can be informed, but not determined, by economicanalysis.
Incidentally, the examples above suggest that approaches to finance sanitation candiffer from those financing water supply. Some components of sanitation services,particularly wastewater treatment, generate significant positive externalities and can beseen as having a public good character for some non-connected populations, while others(e.g. wastewater removal) have a merit good character. In both cases, economic theoryindicates that consumers’ willingness to pay would be lower than socially optimal.
Selected pitfalls of financing for water services
Two consequences follow. One is a vicious cycle of underinvestment in water-relatedinfrastructure and water resources management activities (Figure 1.1). Water-relatedinfrastructure requires significant levels of investment and has long payback periods. Thebenefits are not fully recognised, therefore funds are difficult to mobilise, resulting inlower than needed investments and inadequate maintenance of infrastructure and in thedifficulty of attracting good quality resources to the water sector (including management).This in turn results in low quality services, which reinforces the cycle by further reducingtheir value in the eyes of users and governments.

1. SETTING THE STAGE – 29
MANAGING WATER FOR ALL: AN OECD PERSPECTIVE ON PRICING AND FINANCING – ISBN-978-92-64-05033-4 © OECD 2009
Figure 1.1. The vicious circle of underinvestment and unrealised benefits
Funds lost to system:•non –recovery
•corruption•rents
Low servicequality
Infrastructuredegradation
Inadequatemaintenance
Operationalinefficiency
Inadequateinvestment
Low fee revenues and lowwillingness to increase
tax-based water funding
Lowperception of
value
Potential investmentsdriven away byperception of
high risk and low returns
Good quality humanresources driven awayby lack of opportunityand low achievement
Loss of positiveexternalities and
increase ofnegative
externalities
Source: Devised by Jack Moss on the basis of ideas provided by Alain Mathys. This diagram was publishedin a simpler form in Moss et al. (2003), “Valuing Water for Better Governance – How to Promote Dialogueto Balance Social, Environmental and Economic Values”, CEO Panel Business and Industry, 10. March,p. 13, www.wbcsd.org/DocRoot/8d4hpTlQ6FCa4jn7Y5Cl/Valuing_water_report.pdf.
Another consequence of the points discussed above is that water finance relies on amix of financing instruments. The costs of water services can be covered by three sourcesof revenues:
• Tariffs: users of the water services can cover (part of) the costs of these services.Experience shows that tariffs have different impacts on different water services.Chapter 5 indicates that pricing water has only a limited role in stimulatingresource allocation, whereas it is used as an instrument to manage demand forwater supply and sanitation.
• Taxes: beneficiaries from water services can contribute to the costs of theseservices, whether or not they use them. However, deciding upon the precisefrontiers of the “community of beneficiaries” (local, regional, national,international) can be difficult. For water management, countries tend to favour awatershed (or river basin) approach, as the benefits of improved water use tend tomaterialise at this level; but other levels or scales may be appropriate for selectedservices.
• Transfers from international donors or from private charities: ideally, officialdevelopment assistance (ODA) should be assimilated to taxes in the 3Ts (tariffs,taxes, transfers), as aid policies suggest more aid be delivered in the form ofbudget support, which implies that they would be disbursed in much the sameway as national public budget resources. In this report, ODA has been kept undertransfers, as donors are still disbursing most of their aid through projects andprogrammes, rather than through recipient country budget processes. Another

30 – 1. SETTING THE STAGE
MANAGING WATER FOR ALL: AN OECD PERSPECTIVE ON PRICING AND FINANCING – ISBN-978-92-64-05033-4 © OECD 2009
important feature that distinguishes ODA from taxes is that they are levied inforeign countries, rather than nationally and the political and administrativeprocess of securing ODA resources is very different from taxes.
The 3Ts represent who actually pays for water (see Figure 1.2 and Chapter 2).Additional sources of finance (public and private loans, bonds and funds provided bypublic and private investors) can help cover upfront investment costs and thus enablegovernments to leverage available sources of revenues and, hopefully, reduce financingcosts; but they have to be repaid. The 3Ts and the stability of the financial flows theygenerate determine the creditworthiness of water utilities and hence access to additionalsources of finance.
Figure 1.2. Financial flows to water supply and sanitation
Leverage financing vs. sources of revenues
CustomersTariffs
TaxpayersTaxes
Charity, ODA
Transfers
Utility
Regional / localauthority
Nationalgovernments
CAPEX OPEX
IFIs,banks,private
sector(loans, guarantees,bonds,equity …)
Leverage financing
Reimbursements
Inflows
Sources of revenue
Cash in
Cash out
Source: OECD (2009b), “Strategic Financial Planning for Water Supply and Sanitation”, OECD internaldocument, www.oecd.org/water.
Recognising that there are three ultimate sources of finance to cover the costs ofwater services is an important departure from the doctrine (the “full cost recovery”principle, FCR) which holds that all costs should be covered through the revenuegenerated by tariffs. Revenues from these three sources contribute to “sustainable costrecovery” (Box 1.3) which, on the basis of country experience, is now considered a morerealistic and practical policy principle than “full cost recovery”.

1. SETTING THE STAGE – 31
MANAGING WATER FOR ALL: AN OECD PERSPECTIVE ON PRICING AND FINANCING – ISBN-978-92-64-05033-4 © OECD 2009
Box 1.3. Sustainable cost recovery
The concept of “sustainable cost recovery” was formulated by the Camdessus Panel. Thepanel’s report identified three main characteristics of sustainable cost recovery:
• An appropriate mix of the 3Ts to finance recurrent and capital costs, and to leverageother forms of financing;
• Predictability of public subsidies to facilitate investment (planning);
• Tariff policies that are affordable to all, including the poorest, while ensuring thefinancial sustainability of service providers.
Source: Winpenny, J. (2003), “Financing Water for All”, Report of the World Panel on Financing WaterInfrastructure, chaired by Michel Camdessus, www.financingwaterforall.org.
There is no “one size fits all” model to financing. At one extreme, poor countries tendto draw heavily on transfers from ODA and local and international philanthropy to covercapital costs as well as many recurrent costs. At the other extreme, some developedcountries with mature water systems raise all or most of their revenues from water usersthrough tariffs, earmarked taxes and other charges (e.g. England and Wales, France andthe Netherlands; see Box 1.4 for an illustration). The appropriate combination willdepend on policy objectives and a number of contextual features. Consistency andefficiency will be assessed on a case-by-case basis.
Box 1.4. Water agency subsidies in France
France operates a major programme of transfers for municipal water supply and sanitationfunded from earmarked taxes collected at the river basin level through user charges (charges forwater withdrawals or discharges levied by the Agences de Bassin). These transfers, aimed atequalising affordability between urban and rural areas and used mainly to support theachievement of environmental objectives within basins, amount to a total of EUR 8.3 billionover the period 2007-12. In practice, these earmarked taxes are included in water tariffs paid bycustomers.
French “water taxes” are thus, in effect, environmental prices meant to integrateexternal/environmental costs, which are paid as a proportion of water consumed or discharged,and used as an income source for financing water-related investment within the same river basin.
Source: France case study prepared for the OECD Task Team on Water and Sanitation.
Current water policy challenges
This section highlights some of the key challenges for water policies4: (i) waterscarcity; (ii) access to water supply and sanitation in developing countries; and(iii) rehabilitation of water supply and sanitation infrastructure in OECD countries. Itstresses that both OECD and non-OECD countries are facing daunting water-relatedchallenges, albeit of a different nature. These challenges call for adjustments in theinternational water policy agenda.

32 – 1. SETTING THE STAGE
MANAGING WATER FOR ALL: AN OECD PERSPECTIVE ON PRICING AND FINANCING – ISBN-978-92-64-05033-4 © OECD 2009
Water scarcity and possible consequences and responses
This section reports current trends in water scarcity and considers their possibleconsequences for water policies and financing needs, as well as possible policy responses.
Current status and future prospects
Water scarcity is an increasing threat in many countries and regions, as waterpollution and overuse reduce available sources, while populations grow and competitionbetween different uses increases. Global water withdrawals from the environmentdoubled between 1960 and 2000 (WWF, 2006). In particular, groundwater abstraction hasrisen from 100-150 km3 to 950-1 000 km3 per annum since the 1950s. Abstraction inOECD countries has remained largely stable since 1990. Water use is projected toincrease at a much higher pace in developing countries, where agriculture is by far themain user, resulting in a global share of agriculture water use of about 70%.
Scarcity is not a mere physical phenomenon. It results from excessive usage of theavailable resource (see Box 1.5). Currently, 1.4 billion people live in basins where thewater usage rates exceed recharge rates. In some Middle Eastern countries, abstractionsexceed annual resource replenishment by five times (UNDP, 2006).
Box 1.5. Water stress definitions
Two definitions of water stress exist. The first sets a fixed physical quantity per person,setting at 1 700 cubic metres per person as the norm for water availability for all uses belowwhich a country/region is under increasing “water stress”, reaching “scarcity” at 1 000 cubicmetres per person (e.g. Northern China has only 757 cubic metres per person) and “absolutescarcity” below 500 cubic metres per person (Palestine has only 320 cubic metres per person,and the Middle East region as a whole is projected to be below 500 by 2050).
A different definition of water stress uses the ratio of withdrawals to available resources, andis therefore better able to reflect different geographical, economic and cultural circumstances.The 2006 United Nations (UN) World Water Development Report (UNDP, 2006; World Bankand IMF, 2008) presents the Relative Water Stress Index (RWSI), defined as the “ratio of totalwater use (sum of domestic, industrial and agricultural demand) to renewable water supply – available local run-off (precipitation less evaporation) as delivered through streams, rivers andshallow groundwaters” (UNESCO, 2006). Water stress exists for ratios above 40%, whilephysical scarcity is reached for ratios above 75% (UNESCO, 2006).1 This definition isconsistent with OECD’s indicator for water stress, based on the ratio of water withdrawal toannual water availability, which uses the following thresholds: below 10% water stress low; the10-20% range indicates moderate stress, i.e. “water availability is becoming a constraint ondevelopment and that significant investments are needed to provide adequate supplies”; above20% stress is medium and “both supply and demand will need to be managed and conflictsamong competing uses will need to be resolved”; while above 40% stress is severe (OECD,2007).
1. According to UNESCO (2006), 15 countries were in excess of 100% total use of total annual renewablewater resources.
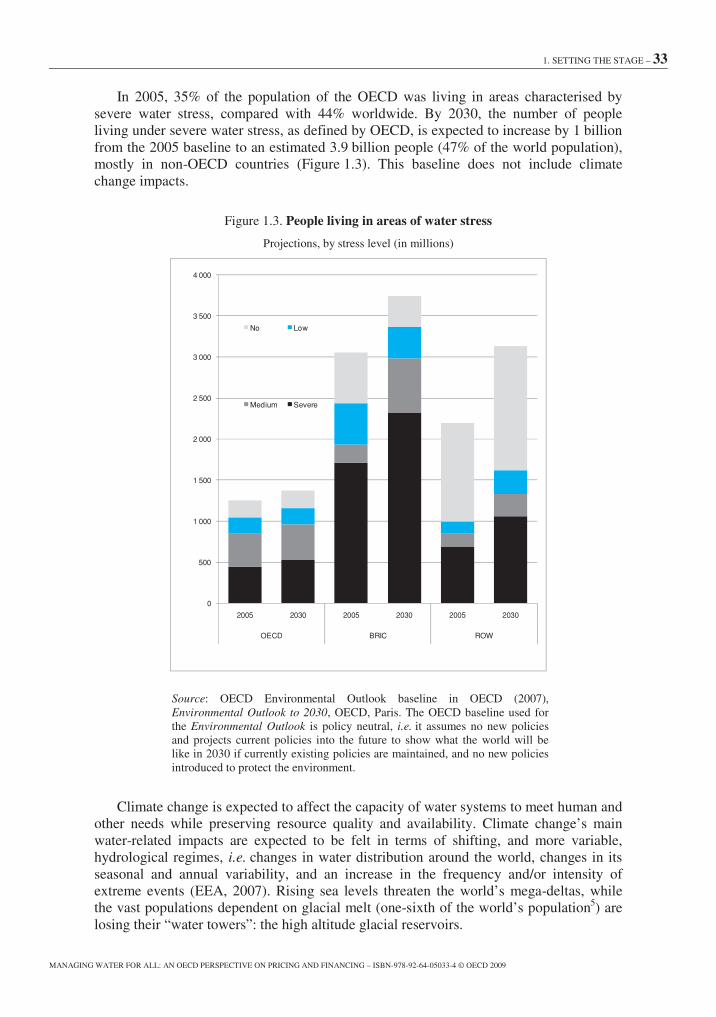
1. SETTING THE STAGE – 33
MANAGING WATER FOR ALL: AN OECD PERSPECTIVE ON PRICING AND FINANCING – ISBN-978-92-64-05033-4 © OECD 2009
In 2005, 35% of the population of the OECD was living in areas characterised bysevere water stress, compared with 44% worldwide. By 2030, the number of peopleliving under severe water stress, as defined by OECD, is expected to increase by 1 billionfrom the 2005 baseline to an estimated 3.9 billion people (47% of the world population),mostly in non-OECD countries (Figure 1.3). This baseline does not include climatechange impacts.
Figure 1.3. People living in areas of water stress
Projections, by stress level (in millions)
0
500
1 000
1 500
2 000
2 500
3 000
3 500
4 000
2005 2030 2005 2030 2005 2030
OECD BRIC ROW
No Low
Medium Severe
Source: OECD Environmental Outlook baseline in OECD (2007),Environmental Outlook to 2030, OECD, Paris. The OECD baseline used forthe Environmental Outlook is policy neutral, i.e. it assumes no new policiesand projects current policies into the future to show what the world will belike in 2030 if currently existing policies are maintained, and no new policiesintroduced to protect the environment.
Climate change is expected to affect the capacity of water systems to meet human andother needs while preserving resource quality and availability. Climate change’s mainwater-related impacts are expected to be felt in terms of shifting, and more variable,hydrological regimes, i.e. changes in water distribution around the world, changes in itsseasonal and annual variability, and an increase in the frequency and/or intensity ofextreme events (EEA, 2007). Rising sea levels threaten the world’s mega-deltas, whilethe vast populations dependent on glacial melt (one-sixth of the world’s population5) arelosing their “water towers”: the high altitude glacial reservoirs.

34 – 1. SETTING THE STAGE
MANAGING WATER FOR ALL: AN OECD PERSPECTIVE ON PRICING AND FINANCING – ISBN-978-92-64-05033-4 © OECD 2009
Similarly, changes in the ecosystems that contribute to water provision (e.g. forests,wetlands and marshes; see the concept of nature for water, as previously mentioned) willalso affect resource availability. It is therefore increasingly important to manage thesesystems as a component of water policy.
These trends, and their associated uncertainties, drive investment needs regardingwater-related infrastructure: resilience of infrastructure becomes a factor of performance;adaptation to climate change will call for alternative plans, technologies, and services (seeOECD, 2006).
Possible policy responses
Four policy responses are anticipated to mitigate and adapt to water scarcity. Theywill have consequences on water policies and the costs attached to them.
One is to preserve or improve the quality of the available resource, through enhancedpollution abatement and wastewater treatment. While most OECD countries have tackledsurface water pollution problems, mainly by regulating discharges from large pointsources and investing in municipal wastewater treatment (reaching a population coveragerate that is about 70%), pollution from diffuse sources continues, particularly fromagriculture. In addition, pollution by new substances (e.g. endocrine disruptors) is anemerging concern. In the European Union, the EU Water FrameworkDirective 2000/60/EC requires that member states address and reduce pollution fromdiffuse sources. Protection of freshwater resources is an even more formidable challengein non-OECD countries, where more than 5 billion people are expected to be without aconnection to public sewerage in 2030, and wastewater treatment facilities are largelynon-existent or poorly functioning.
Another policy response is to allocate the resource to where it adds most value. Thereis a diversity of approaches to water management policies across OECD countries, withdifferent emphasis on water pricing and cost recovery, property rights, quasi watermarkets, taxing pollutants, payments to farmers providing aquatic ecosystem services,acknowledgement of (and rewards for) nature for water services, and other policyapproaches; the EU Water Framework Directive requires that member countries set awater price that contributes to the efficient allocation of the resource. Chapter 5 arguesthat countries where water scarcity is becoming more acute, such as in regions ofAustralia, Spain and the United States, have witnessed a more rapid implementation ofpolicy actions.
Another response is to manage demand. Demand management changes the nature ofneeds for infrastructure. Increasing water productivity and efficiency, and improvingconservation can reduce the need for new and expensive water supply or wastewatertreatment projects. As new water supply projects become more expensive to source waterfrom further distances, the cheapest new source of water has often been water gainedthrough conservation, efficiency, and improved management. In recent years, manyOECD countries have successfully reduced water use per capita and in total, indicatingthat the right policies, those in which appropriate pricing plays a prominent part, can leadto a decoupling of water use from economic and population growth.
Water re-use is part of the answer. Markets for water re-use are booming in emergingeconomies. Experience is more limited in OECD countries; however, Australia, Spain,and some parts of the United States are pioneering these technologies, spurred by seriousconstraints on water resources. Reuse allows for the reduction of new abstractions of

1. SETTING THE STAGE – 35
MANAGING WATER FOR ALL: AN OECD PERSPECTIVE ON PRICING AND FINANCING – ISBN-978-92-64-05033-4 © OECD 2009
water resources and investment in modular, decentralised infrastructure. This, and otherdecentralised ways of providing water and sanitation, create both opportunities andthreats, which require an adjustment of the institutional and regulatory framework (seethe separate module on alternative ways of providing water and sanitation in OECD,2009c).
More generally, water policies can benefit from the impact of institutional innovation,new ways of approaching water and water services, and technological changes on waterdemand and supply needs. New crops, dripped irrigation, and technologies for treatedwater, among others, will all have an impact on the way water services are designed andfinanced.
Access to water supply and sanitation in developing countries
In 2002, acknowledging the strong public interest nature of water supply andsanitation services, the UN Committee on Economic, Social and Cultural Rights formallyrecognised the “right to water” as a human right: “Water is a limited natural resource anda public good fundamental for life and health. The human right to water is indispensablefor leading a life in human dignity. It is a prerequisite for the realization of other humanrights […] The human right to water entitles everyone to sufficient, safe, acceptable,physically accessible and affordable water for personal and domestic uses” (seewww.unhchr.ch/html/menu2/6/cescr.htm). The international community committed to theMillennium Development Goals (MDGs) target of halving the proportion of peoplewithout access (see Box 1.6 for definitions of access) to safe drinking water by 2015; asimilar target was set for access to improved sanitation at the Johannesburg WorldSummit for Sustainable Development. OECD countries are committed to working withdeveloping countries to achieve this.
Progress towards achieving the WSS targets of the MDGs has been disappointing.Overall the target for access to drinking water may be met, but not in allregions/countries, and particularly not in Sub-Saharan Africa; from 2004 to 2006, thenumber of people without access to drinking water declined from 1.1 billion (WHO-UNICEF, 2006) to 880 million people (WHO-UNICEF, 2008), 84% of which in ruralareas. For sanitation, the situation is worse: even taking a longer reference period,i.e. between 1990 and 2006, the number of people without improved sanitation decreasedby only 8% (from 2.6 billion to 2.5 billion people). At the current rate, the world willmiss the MDG sanitation target by over 700 million people; southern Asia and Sub-Saharan Africa are especially off track in terms of sanitation coverage. In addition, it isimportant to recognise that meeting the MDGs would still leave millions of peoplewithout access to adequate water and sanitation services.
The MDG challenge differs in rural and urban areas. The water supply service deficitin urban areas is projected to be 240 million people in 2015, compared with 679 millionpeople in rural areas. For sanitation, it is projected that 692 million urban dwellers and1 698 million rural inhabitants will remain without improved sanitary facilities in 2015(WHO-UNICEF, 2006).

36 – 1. SETTING THE STAGE
MANAGING WATER FOR ALL: AN OECD PERSPECTIVE ON PRICING AND FINANCING – ISBN-978-92-64-05033-4 © OECD 2009
Box 1.6. Defining access
Final users can face a range of water and sanitation services levels – from the network services familiar tomost users in OECD countries to decentralised solutions. Since the definition of the water supply and sanitation(WSS) targets of the Millennium Declaration, the international community has agreed on what counts as“access” in estimating progress. Such definition has evolved over time.
The World Health Organization-United Nations Children’s Fund (WHO-UNICEF) Joint MonitoringProgramme (JMP) defines access to water supply and sanitation in terms of the types of technology and levels ofservice afforded. Access to water-supply services is defined as the availability of at least 20 litres per person perday from an “improved” source within 1 kilometre of the user’s dwelling. An “improved” source is one that islikely to provide “safe” water. In the 2008 report by the JMP, the “ladder” of services looked like this:
Drinking water
• Unimproved drinking water sources. Examples include unprotected dug well, unprotected spring, cartwith small tank/drum, tanker truck, surface water, bottled water.
• Piped water on premises, such as piped household connection located inside the user’s dwelling plot oryard.
• Other improved drinking water sources. These include public taps or standpipes, tube wells orboreholes, protected dug wells, protected springs and rainwater collection.
Sanitation
• Open defecation.
• Unimproved sanitation: excreta disposal systems were considered unimproved if they did not ensurehygienic separation of human excreta from human contact. Examples include: pit latrines without slab orplatform, hanging latrines, bucket latrines.
• Shared sanitation: otherwise acceptable but shared between two or more households. This categoryincludes public toilets.
• Improved sanitation: Facilities that ensure hygienic separation of human excreta from human contact.They include: flush or pour flush toilets or latrines running to: piped sewer system, septic tanks or pitlatrines; VIP latrines (ventilated improved latrines), pit latrines with slabs, composting toilet.
Source: WHO-UNICEF (2008), “Progress on Drinking Water and Sanitation: Special Focus on Sanitation”, report of theJoint Monitoring Programme for Water Supply and Sanitation (JMP), UNICEF, New York and WHO, Geneva.
The Camdessus report (Winpenny, 2003) estimated that meeting the MDG targetswould require extra annual worldwide investment of USD 10 billion, while full water andsewerage connections and primary wastewater treatment for urban areas would requireUSD 17 billion for water and USD 32 billion for sanitation/sewerage (Winpenny, 2003,p. 3). The EU Water Initiative Finance Working Group estimated that an additionalUSD 9-30 billion per annum would be needed on top of current funding flowing to thesector (Cardone, Shah and Waughray, 2005). The benchmark figure most commonly usedestimates that what is needed is a doubling of the annual rate of investment (Winpenny,2003, p. 13; Toubkiss, 2006).
1. SETTING THE STAGE – 37
MANAGING WATER FOR ALL: AN OECD PERSPECTIVE ON PRICING AND FINANCING – ISBN-978-92-64-05033-4 © OECD 2009
These investment requirements regard solely the cost of expanding coverage by watersupply and sanitation services. They do not reflect the costs of operation, maintenanceand renewal. This is a problem as lack of funds for these activities results in deterioratingservices to served populations and in additional investment requirements at a later stage,as infrastructure wears out due to lack of maintenance. In Ethiopia a recent survey(Ethiopian Ministry of Water Resources and other ministries, 2006) of almost 7 000 ruralwater schemes found that 30-40% were non-functional, due in large extent to a shortageof finance for wages, fuel, materials and spare parts. Many Eastern Europe, Caucasus andCentral Asia (EECCA) countries are already confronting the high costs of operating andmaintaining ageing water and wastewater systems (Box 1.7).
In the future, emerging and developing countries will also face an increasing bill astheir systems expand to complete service coverage. The cost of sewerage and wastewatertreatment will escalate (in a mature networked system, these costs normally exceed thatof water supply). It is therefore necessary to consider the full set of financial implicationsof extending first-time access, particularly to networked services.
Box 1.7. The burden of legacy in EECCA countries
In Armenia, the present infrastructure is oversized, needs renovation and much moremaintenance. There is a high cost of operating the system, involving excessive volumes of waterbeing distributed, much of it lost and wasted. There is great scope for efficiency savings. Thereis an urgent need to downscale and optimise the present infrastructure. Investment needed torenovate the existing infrastructure is much greater than that required to extend it to thosewithout services.
In Moldova, the current level of financing is insufficient even to maintain assets at theirpresent low operational levels or to provide adequate levels of service. The financing deficit ismanifested in poor water quality, regular daily shortages, water-related morbidity, pollution ofsurface waters, etc. The baseline scenario used in the new Financing Strategy aims at haltingdeterioration and providing modest improvements. Even this unambitious aim would requireincreased user charges, a sizeable increase in budgetary support, and more international finance.
In Georgia, there has been a clear deterioration in infrastructure and services, causinggrowing public health hazards. Even to preserve the current level of services would requiremajor reforms, since the baseline situation shows a financing gap. These reforms would includeimproving the collection rate of revenue owed, an expansion of metering, better control ofleakage, increasing budgetary transfers, and raising household charges to the highest affordablelevel.
Source: Financial Strategies for the respective countries produced under the auspices of the OECD TaskForce for the Implementation of the Environmental Action Programme for Central and Eastern Europe(“EAP Task Force”).

38 – 1. SETTING THE STAGE
MANAGING WATER FOR ALL: AN OECD PERSPECTIVE ON PRICING AND FINANCING – ISBN-978-92-64-05033-4 © OECD 2009
Rehabilitation of water supply and sanitation in OECD countries
In most OECD countries, 100% of the population have access to safe drinking water.With few exceptions, water supplied to the main centres is bacteriologically safe (OECD,2006). However, in some countries (e.g. Mexico, New Zealand, Poland, Turkey and theUnited States), a part of the population is not yet connected to public water supplies,especially in rural areas (Table 1.2). Moreover, quality monitoring and surveillance ofsmaller drinking water supplies need to be improved (OECD, 2006).
With regards to sanitation, considerable variations exist among OECD countries interms of coverage and of level of treatment (Table 1.2). Some OECD countries are stillcompleting sewerage systems or implementing the first generation of municipalwastewater treatment plants, including Belgium, Mexico, and Turkey, which havehowever all made significant progress. Japan, Korea, Luxembourg, Spain, and the UnitedKingdom exhibit high secondary treatment coverage.6 The countries which have aparticularly high level of tertiary treatment7 include: Austria, Denmark, Finland,Germany, Netherlands, Sweden and Switzerland.
Significant investments will be required to rehabilitate existing infrastructure, bring itinto conformity with more stringent environment and health regulations, and maintainservice quality over time. Annex 1.A1 to this chapter shows the projected investmentsthat would be required to provide and maintain adequate levels of water infrastructureservices for all sectors of a country’s economy and population in OECD and emergingeconomies (Brazil, Russian Federation, India, China). As illustrations, France and theUnited Kingdom will have to increase their water spending as a share of gross domesticproduct (GDP) by about 20% to maintain water services at current levels; Japan andKorea may have to increase their water spending by more than 40%.
The evolution of the policy debate
The policy debate has followed a long route since the emergence of water on theinternational policy agenda in the 1970s. A brief history of the international conferenceson water is found in Annex 1.A2 to this chapter. This report builds on preceding steps, inparticular the Camdessus Panel and the Gurría Task Force. It weaves together issueswhich have, up to this point, only been considered separately.
The evolution of the international consensus on water-related issues
Since the early stages of the international dialogue on water-related issues, theinternational community recognised the existence of the two inter-related but separateaspects of water policy as previously discussed: (i) managing the resource so that it isavailable for human and ecosystem uses for current and future generations; and(ii) providing adequate, sustainable and affordable water services to all, in particularwater supply and sanitation.
While the global policy framework for water can be traced back to 1972 and theStockholm Declaration, the first international forum dedicated to water took place in 1977in Mar del Plata, where the international community called for an integrated approach towater resources management, and started the process that led to the declaration of the1980s as the UN Water Supply and Sanitation (WSS) Decade, aimed at achievinguniversal access to water supply and sanitation by 1990.
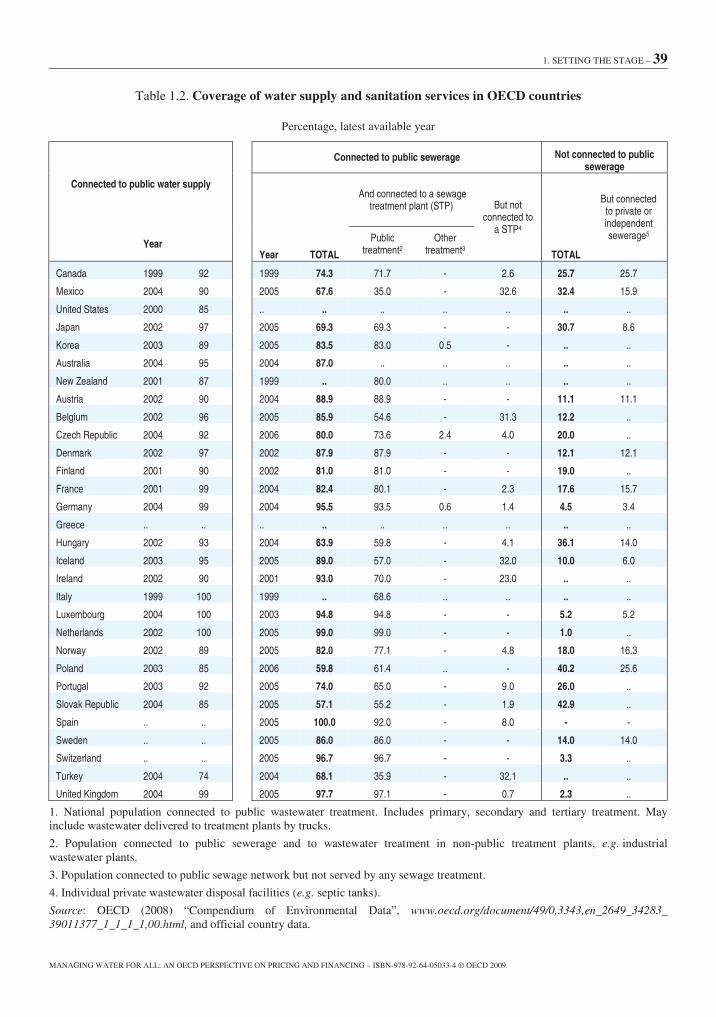
1. SETTING THE STAGE – 39
MANAGING WATER FOR ALL: AN OECD PERSPECTIVE ON PRICING AND FINANCING – ISBN-978-92-64-05033-4 © OECD 2009
Table 1.2. Coverage of water supply and sanitation services in OECD countries
Percentage, latest available year
Connected to public water supply
Connected to public sewerage Not connected to publicsewerage
Year TOTAL
And connected to a sewagetreatment plant (STP) But not
connected toa STP4
TOTAL
But connectedto private orindependentsewerage5
Year Publictreatment2
Othertreatment3
Canada 1999 92 1999 74.3 71.7 - 2.6 25.7 25.7
Mexico 2004 90 2005 67.6 35.0 - 32.6 32.4 15.9
United States 2000 85 .. .. .. .. .. .. ..
Japan 2002 97 2005 69.3 69.3 - - 30.7 8.6
Korea 2003 89 2005 83.5 83.0 0.5 - .. ..
Australia 2004 95 2004 87.0 .. .. .. .. ..
New Zealand 2001 87 1999 .. 80.0 .. .. .. ..
Austria 2002 90 2004 88.9 88.9 - - 11.1 11.1
Belgium 2002 96 2005 85.9 54.6 - 31.3 12.2 ..
Czech Republic 2004 92 2006 80.0 73.6 2.4 4.0 20.0 ..
Denmark 2002 97 2002 87.9 87.9 - - 12.1 12.1
Finland 2001 90 2002 81.0 81.0 - - 19.0 ..
France 2001 99 2004 82.4 80.1 - 2.3 17.6 15.7
Germany 2004 99 2004 95.5 93.5 0.6 1.4 4.5 3.4
Greece .. .. .. .. .. .. .. .. ..
Hungary 2002 93 2004 63.9 59.8 - 4.1 36.1 14.0
Iceland 2003 95 2005 89.0 57.0 - 32.0 10.0 6.0
Ireland 2002 90 2001 93.0 70.0 - 23.0 .. ..
Italy 1999 100 1999 .. 68.6 .. .. .. ..
Luxembourg 2004 100 2003 94.8 94.8 - - 5.2 5.2
Netherlands 2002 100 2005 99.0 99.0 - - 1.0 ..
Norway 2002 89 2005 82.0 77.1 - 4.8 18.0 16.3
Poland 2003 85 2006 59.8 61.4 .. - 40.2 25.6
Portugal 2003 92 2005 74.0 65.0 - 9.0 26.0 ..
Slovak Republic 2004 85 2005 57.1 55.2 - 1.9 42.9 ..
Spain .. .. 2005 100.0 92.0 - 8.0 - -
Sweden .. .. 2005 86.0 86.0 - - 14.0 14.0
Switzerland .. .. 2005 96.7 96.7 - - 3.3 ..
Turkey 2004 74 2004 68.1 35.9 - 32.1 .. ..
United Kingdom 2004 99 2005 97.7 97.1 - 0.7 2.3 ..
1. National population connected to public wastewater treatment. Includes primary, secondary and tertiary treatment. Mayinclude wastewater delivered to treatment plants by trucks.
2. Population connected to public sewerage and to wastewater treatment in non-public treatment plants, e.g. industrialwastewater plants.
3. Population connected to public sewage network but not served by any sewage treatment.
4. Individual private wastewater disposal facilities (e.g. septic tanks).
Source: OECD (2008) “Compendium of Environmental Data”, www.oecd.org/document/49/0,3343,en_2649_34283_39011377_1_1_1_1,00.html, and official country data.
40 – 1. SETTING THE STAGE
MANAGING WATER FOR ALL: AN OECD PERSPECTIVE ON PRICING AND FINANCING – ISBN-978-92-64-05033-4 © OECD 2009
Both international objectives and the consensus on how to achieve them have evolvedover time. International goals have been progressively revised from the initial call foruniversal access to the more targeted objectives of the 2000 Millennium Declaration, andthe subsequent addition of a target for sanitation at the 2002 World Summit onSustainable Development (WSSD).
The importance of financial considerations in turning the global water promises into areality has been explicitly recognised since the 2002 World Summit on SustainableDevelopment. The report of the Camdessus Panel, launched at the 2003 World WaterForum in Kyoto, put the accent on the need to increase the supply of finance to the watersector, calling for the need to recover the costs of water services from users and fromtaxpayers, and a doubling in ODA flows. The Camdessus report also called for theincreased use of financing mechanisms aimed at improving risk management for watersupply and sanitation.
Taking an important step forward, the Gurría Task Force, whose output was unveiledat the 2006 World Water Forum in Mexico City, focused on improving the demand forfinance by strengthening the governance structures of governing bodies and serviceproviders in developing countries, their capacity to absorb additional funds, and theimprovement of projects/programmes so that available finance could be channelled tobeneficial undertakings. The report discussed in particular the key role of localgovernment and local providers and the special challenges they face both in terms ofaccess to finance and in terms of capacity. Finally, the report also emphasised the need toextend the focus beyond WSS to address the financing needs of providing sufficient waterfor food production.
Moving the dialogue forward: this report’s value-added
This report moves the dialogue forward in three directions.
First, the geographical scope is broader, as the focus is both on OECD and developingcountries. While the challenges of reaching the MDG targets for WSS in developingcountries is still central to the discussion, the report also explores the considerablechallenges that OECD countries face in rehabilitating their WSS services. In addition, itdraws lessons from the experience of OECD countries in managing water use inagriculture.
Second, the report attempts to weave together water resources management and watersupply and sanitation. Most discussion focuses on financing the latter, but there is also astrong link between financing and water resources management. There are many strandsto this relationship as discussed by Rees, Winpenny and Hall (2008). This link requiresmore analysis and debate and is at an early stage of development. As a contribution to thedebate, this report focuses on one key aspect of water resources management: themanagement of water used for agriculture, which is by far the biggest user in mostcountries; it deepens the analysis of economic and financial aspects and the use of waterpricing and other economic instruments to encourage sustainable and efficient water usein agriculture. This builds on the Camdessus and Gurría reports and their call foradditional work in the area of financing water for food. While other reports have lookedat both water resources management and service provision challenges (e.g. the UN WorldWater Development Report [WWDR] series, and especially the upcoming WWDRNo. 3), this report focuses on how specific policy instruments – particularly pricingmechanisms and other economic instruments – can be used to address either of them.

1. SETTING THE STAGE – 41
MANAGING WATER FOR ALL: AN OECD PERSPECTIVE ON PRICING AND FINANCING – ISBN-978-92-64-05033-4 © OECD 2009
Third, when considering financing for water supply and sanitation, the reportaddresses both supply- and demand-side considerations, and brings them together in anintegrated approach. It highlights the relevance of strategic financial planning as a processto match supply and demand of finance, while discussing realistic objectives in a nationalpolicy dialogue. This dialogue considers investment needs, not as a given, but as theoutcomes of policy choices (e.g. policy goals in terms of coverage and service levels,environmental and other regulations influencing technology choices, etc.), which have tobe informed by financial realism. In that process, financial considerations are bestfocused on the three fundamental sources of revenue, namely tariffs, taxes and transfers.
Notes
1. They can involve abstraction of water from surface water bodies or aquifers, or be“in-stream”, with in-stream uses including the use of water as a sink for pollutants.Water uses can be consumptive or non-consumptive.
2. For additional information, see www.who.int/water_sanitation_health/economic/en/.
3. Threshold effects add to the complexity of the health benefits of sanitation at thecommunity level: they only materialise after coverage has reached a certain level.
4. Based on OECD (2009a).
5. Estimate from IPCC (2008).
6. Dissolved biological matter is progressively converted into solids by usingindigenous, water-borne micro-organisms.
7. Tertiary treatment means a more stringent treatment of wastewater, aiming at afurther reduction of phosphorus and/or nitrogen. After tertiary treatment, the purifiedwastewater may, in case of special sensitive receiving water-bodies, undergo furthertreatment, e.g. by flocculation and sand filtration and may finally get disinfected.

42 – 1. SETTING THE STAGE
MANAGING WATER FOR ALL: AN OECD PERSPECTIVE ON PRICING AND FINANCING – ISBN-978-92-64-05033-4 © OECD 2009
Annex 1.A1
Projected Expenditures on Water and Wastewater Services
GDP GDP/cap GDPgrowth
Currentexpenditure on
waterinfrastructure
Projected expenditure onwater infrastructure as %
of GDP
Average annualinvestment
(USD billion)
(USD billion) (USD) % (USD billion) By 2015 By 2025 By 2015 By 2025
Australia 602 29 893 2.3 4.515 0.75 1.08 6.86 9.95Austria 254 31 254 2.3 1.905 0.75 0.89 2.59 3.91Belgium 309 29 707 2.3 2.318 0.75 0.69 2.75 4.38Canada 1 050 32 921 2.3 7.875 0.75 0.83 10.27 15.74Czech Republic 187 18 370 2.3 3.553 1.90 0.85 3.12 2.83Denmark 178 3 389 2.3 1.335 0.75 0.89 1.82 2.74Finland 152 29 305 2.3 1.140 0.75 0.69 1.35 2.15France 1 724 27 738 2.3 12.930 0.75 0.83 16.86 25.84Germany 2 391 28 988 2.3 17.932 0.75 0.83 23.38 35.84Greece 224 20 362 2.3 1.680 0.75 0.81 2.17 3.34Hungary 152 15 546 2.3 1.140 0.75 1.37 2.02 2.79Iceland 10 33 269 2.3 0.075 0.75 0.69 0.09 0.14Ireland 152 37 663 2.3 1.140 0.75 0.69 1.35 2.15Italy 1 620 27 984 2.3 12.150 0.75 0.92 16.83 25.23Japan 3 817 29 906 1.9 28.627 0.75 1.26 46.98 63.41Korea 1 030 21 419 2.3 7.725 0.75 1.23 12.76 18.00Luxembourg 28 63 609 2.3 0.210 0.75 0.64 0.24 0.39Mexico 1 006 9 887 2.4 19.011 1.90 0.85 16.78 15.36Netherlands 477 29 332 2.3 3.577 0.75 1.08 5.43 7.88New Zealand 97 23 943 2.3 0.727 0.75 1.13 1.14 1.63Norway 184 405 2.3 1.380 0.75 0.64 1.58 2.55Poland 475 12 452 2.3 9.025 1.90 0.85 7.93 7.18Portugal 194 18 503 2.3 1.455 0.75 0.88 1.96 2.97Slovak Republic 81 1 566 2.3 1.539 1.90 0.85 1.35 1.22Spain 971 23 627 2.3 7.282 0.75 1.06 10.97 15.96Sweden 254 28 205 2.3 1.905 0.75 0.69 2.26 3.60Switzerland 230 31 690 2.3 1.725 0.75 0.64 1.97 3.19Turkey 530 7 503 3.5 10.07 1.90 0.85 9.33 9.66United Kingdom 1 736 28 938 2.3 12.499 0.72 0.86 19.14 27.96United States 11 724 39 496 2.5 87.930 0.75 0.64 101.65 167.63Brazil 1 462 849 2.4 2.924 0.2 1.9 19.8 32.02Russian Federation 1 449 10 179 3.5 4.637 0.32 0.85 11.49 26.41India 3 291 380 4.1 23.366 0.71 2.5 74.8 108.31China 7 334 5 642 5.3 110.01 1.5 1.9 182.1 247.18Total 405 6 212 9 003
Source: OECD (2006), Infrastructure to 2030: Telecom, Land, Transport, Water and Electricity, OECD, Paris, p. 313.

1. SETTING THE STAGE – 43
MANAGING WATER FOR ALL: AN OECD PERSPECTIVE ON PRICING AND FINANCING – ISBN-978-92-64-05033-4 © OECD 2009
Annex 1.A2
A Brief History of International Conferences on Water
International fora Agreed goals and objectivesUnited NationsConference on Water
Mar del Plata, Argentina1977
The first global-scale conference on water.Main objective: to promote a greater sense of awareness of global problems related to water:
• called for an integrated approach to water-resources management;• led to declaration of 1980s as the UN Water Supply and Sanitation Decade, with the objective of providing
drinking water and sanitation for all people by 1990.International Conferenceon Water andEnvironment (ICWE)
Dublin, Ireland 1992
Its main achievement was the development of the Dublin Principles:• Freshwater is a finite and vulnerable resource, essential to sustain life, development and the environment.• Water development and management should be based on a participatory approach, involving users,
planners and policy makers at all levels.• Women play a central part in the provision, management and safeguarding of water for all.• Water has an economic value in all its competing uses and should be recognised as an economic good.
UN Conference onEnvironment andDevelopment (UNCED)
Rio de Janeiro, Brazil1992
Agenda 21, Chapter 18 “Protection of the Quality and Supply of Freshwater Resources: Application of IntegratedApproaches to the Development, Management and Use of Water Resources” dealt with basis for action, objectivesand activities concerning:
• integrated water resources development and management;• water resources assessment;• protection of water resources, water quality and aquatic ecosystems;• drinking water supply and sanitation;• water and sustainable urban development;• water for sustainable food production and rural development;• impacts of climate change on water resources.
Millennium Declaration
New York, United States2000
Millennium Development Goals include the following water-related goals:• “To halve, by the year 2015, the proportion of the world’s people whose income is less than one dollar a
day and the proportion of people who suffer from hunger and, by the same date, to halve the proportion ofpeople without sustainable access to safe drinking water.”
• “To stop the unsustainable exploitation of water resources by developing water management strategies atthe regional, national and local levels, which promote both equitable access and adequate supplies.”
2nd World Water Forum
The Hague, Netherlands2000
The Ministerial Declaration identified the following main challenges:• meeting basic needs – access to safe and sufficient water and sanitation;• securing food supply, particularly for the poor and vulnerable;• protecting ecosystems – ensure the integrity of ecosystems through sustainable water resources
management;• sharing water resources by peaceful co-operation between water users at all levels;• managing risks from floods, droughts, pollution and other water hazards;• valuing water: manage water so that it reflects its economic, social, environmental and cultural values;• governing water wisely, including involving the public and the interests of all stakeholders.
International Conferenceon Freshwater
Bonn, Germany 2001
The focus was on better managing the world’s limited supplies of clean water.The Bonn conference was an input into the 2002 World Summit for Sustainable Development.

44 – 1. SETTING THE STAGE
MANAGING WATER FOR ALL: AN OECD PERSPECTIVE ON PRICING AND FINANCING – ISBN-978-92-64-05033-4 © OECD 2009
International fora Agreed goals and objectivesWorld Summit forSustainable Development(WSSD)
Johannesburg,South Africa 2002
The summit dealt with the following freshwater-related issues:• decentralisation of governance;• community empowerment;• service provision: rural and urban challenges;• information management;• integrated water-resources management;• education and awareness;• financial and economic mechanisms.
Regional challenges were particularly recognised and identified at the summit.A new target was agreed: “To halve, by the year 2015, the proportion of people who do not have access to improvedsanitation.”
3rd World Water Forum
Kyoto, Japan 2003
Forum outcomes included:• a Water and Climate Dialogue, including agreed action points;• a Water and Poverty Dialogue, including agreed action points;• a seminal report on financing water infrastructure;• outcomes from the Dialogue on Food, Water and Environment;• a detailed document on water actions.
Water for Life Decade
2005–15
Launched by the United Nations System, the Water for Life Decade aims to promote efforts to fulfil internationalcommitments made on water and water-related issues by 2015, with special emphasis on the involvement andparticipation of women in these efforts.
4th World Water Forum
Mexico City, Mexico 2006
The ministers at the forum reaffirmed commitments made at the UNCED, WSSD, and the Commission onSustainable Development during 2005, emphasising the following items:
• expedite implementation in water, sanitation and human settlements;• the importance of enhancing the sustainability of ecosystems;• the importance of innovative practices such as rain water management and development of hydropower
projects in some regions;• the involvement of relevant stakeholders, particularly women and youth in planning and management;• improving demand for finance by strengthening governance systems;• the Hashimoto Action Plan.
Source: Adapted from UNESCO (forthcoming). “United Nations World Water Development Report: Water in a ChangingWorld”, WWDR No. 3, www.unesco.org/water/wwap/wwdr/wwdr3/.

1. SETTING THE STAGE – 45
MANAGING WATER FOR ALL: AN OECD PERSPECTIVE ON PRICING AND FINANCING – ISBN-978-92-64-05033-4 © OECD 2009
References
Cardone, R. and C. Fonseca (2003), “Financing and Cost Recovery”, Thematic OverviewPaper No. 7, IRC.
Cardone, R., N. Shah and D. Waughray (2005), “Final Report”, EU Water InitiativeFinance Working Group, DFID, p. 2.
EEA (European Environment Agency) (2007), “Climate Change and Adaptation Issues”,Technical Report No. 2/2007, EEA, Copenhagen.
Ethiopian Ministry of Water Resources and other ministries (2006), “Final Sector ReviewReport of Water Supply, Sanitation and Hygiene, Ethiopia”, Ethiopia, September,p. 18.
GWP (Global Water Partnership ) (2000), “Integrated Water Resources Management”,TEC Background Paper 4.
IPCC (Intergovernmental Panel on Climate Change) (2008), “Climate Change andWater”, IPCC Technical Paper 6.
OECD (2003), OECD Environmental Performance Reviews – Water: Performance andChallenges in OECD Countries, OECD, Paris.
OECD (2006), Infrastructure to 2030: Telecom, Land, Transport, Water and Electricity,OECD, Paris.
OECD (2007), Environmental Outlook to 2030, OECD, Paris.
OECD (2008), “Compendium of Environmental Data”, www.oecd.org/document/49/0,3343,en_2649_34283_39011377_1_1_1_1,00.html.
OECD (2009a), “Pricing Water Resources and Water and Sanitation Services”, OECDinternal document, www.oecd.org/water.
OECD (2009b), “Strategic Financial Planning for Water Supply and Sanitation”, OECDinternal document, www.oecd.org/water.
OECD (2009c), “Alternative Ways of Providing Water and Sanitation: Emerging Optionsand their Policy Implications”, OECD internal document, www.oecd.org/water.
Rees, J. Winpenny and A. Hall (2008), “Water Financing and Governance”, GWP TECBackground Paper 12.
Toubkiss, Jeremie (2006), “Assessing the Cost of Meeting MDG Target 10: AComparative Study of 11 Estimates”, World Water Council, March.
UNDP (United Nations Development Programme) (2006). Human Development Report2006 – Beyond Scarcity: Power, Poverty and the Global Water Crisis, UNDP,New York, p. vi.

46 – 1. SETTING THE STAGE
MANAGING WATER FOR ALL: AN OECD PERSPECTIVE ON PRICING AND FINANCING – ISBN-978-92-64-05033-4 © OECD 2009
UNESCO (United Nations Educational, Scientific and Cultural Organization) (2006),“United Nations World Water Development Report: Water, A Shared Responsibility”,WWDR No. 2, www.unesco.org/water/wwap/wwdr/wwdr2/.
UNESCO (forthcoming). “United Nations World Water Development Report: Water in aChanging World”, WWDR No. 3, www.unesco.org/water/wwap/wwdr/wwdr3/.
WHO (World Health Organization) (2008), Safer Water, Better Health: Costs, Benefitsand Sustainability of Interventions to Protect and Promote Health, WHO, Geneva,www.who.int/quantifying_ehimpacts/publications/saferwater/en/index.html.
WHO-UNICEF (2006), “Meeting the MDG Drinking Water and Sanitation Target: TheUrban and Rural Challenge of the Decade”, Joint Monitoring Programme for WaterSupply and Sanitation (JMP), UNICEF, New York and WHO, Geneva.
WHO-UNICEF, (2008), “Progress on Drinking Water and Sanitation: Special Focus onSanitation”, JMP, UNICEF, New York and WHO, Geneva.
Winpenny, J. (2003), “Financing Water for All”, Report of the World Panel on FinancingWater Infrastructure, chaired by Michel Camdessus, www.financingwaterforall.org.
World Bank and International Monetary Fund (2008), Global Monitoring Report 2008 –MDGs and the Environment: Agenda for Inclusive and Sustainable Development,World Bank-IMF, Washington, DC.
WWF (World Wide Fund For Nature) (2006), “Living Planet Report 2006”, WWF,Gland, Switzerland.
2. FINANCING WATER AND SANITATION SERVICES: KEY CHALLENGES AND THE WAY FORWARD – 47
MANAGING WATER FOR ALL: AN OECD PERSPECTIVE ON PRICING AND FINANCING – ISBN-978-92-64-05033-4 © OECD 2009
Chapter 2
Financing Water and Sanitation Services:Key Challenges and the Way Forward
Substantially more investment is needed in both OECD and developing countries toachieve water and, especially, sanitation policy objectives, and to realise the associatedeconomic, social and environmental benefits. Optimising the need for investment throughdemand-side measures, such as better planning and low-cost technologies, and ensuringan adequate supply of finance will be essential to meet those objectives.
Strategic financial planning that blends the “3Ts” – tariffs and other user contributions,tax-based subsidies and transfers including official development assistance – provides animportant means for agreeing on water- and sanitation-related targets and how they willbe achieved. This requires good information and analysis, policy dialogue amongstakeholders, and appropriate measures to reduce the demand for, and increase thesupply of, finance. This chapter reviews good practices in strategic financial planning inOECD and developing countries and summarises key lessons for policy makers.

48 – 2. FINANCING WATER AND SANITATION SERVICES: KEY CHALLENGES AND THE WAY FORWARD
MANAGING WATER FOR ALL: AN OECD PERSPECTIVE ON PRICING AND FINANCING – ISBN-978-92-64-05033-4 © OECD 2009
Chapter 1 identified the challenges posed by increasing funding requirements to coverinvestment, operation, maintenance and replacement of water supply and sanitation(WSS) infrastructure, both in OECD countries and in emerging and developingeconomies. Based on the work of an OECD Task Team on Sustainable Financing ofWater and Sanitation (OECD, 2009a), this chapter discusses what policy options exist toclose the financing gap and presents good practices in carrying out the policy dialoguethat is required to achieve consensus on these issues. By doing so, it moves the debatebeyond the focus on the supply of financing (Camdessus Panel) and the demand forfinancing (Gurría Task Force), to how to balance the two through an iterative process ofsuccessive adjustments.
Financing water supply and sanitation: redefining the perspective on the problem
Providing more and better WSS services in developing countries is a goal shared byOECD and non-OECD countries alike. However, progress towards this goal will continueto be patchy, slow and unsustainable unless it is accompanied by more economic andfinancial realism. Goals that are set politically and are not matched by real revenuestreams result in major financing gaps and unexecuted plans, with the consequence thatthe poor suffer most through absent or deficient services.
In order to deal with this challenge, governments have to select realistic objectives forthe development of the WSS sector, checked against available resources, and agreed in amulti-stakeholder policy dialogue (a process termed “strategic financial planning”).Country case studies have shown that, in general, the Millennium Development Goals(MDGs) can be achieved if investments are strategically planned and resources allocatedwisely.
In reality, however, sector plans are often developed on the basis of a political visionand not grounded in an understanding of the costs of achieving targets, and how thosecosts will be met. For instance, Ethiopia has adopted a Universal Access Programme,which foresees improving access to improved drinking water sources from 22% in 2006to 98% in 2012, but it is unclear how this policy would be financed. In some cases,donors share responsibility for lack of realism, for instance when they require the use ofbest available wastewater treatment technologies that may not be affordable if scaled upbeyond the project level.
There are essentially three options for closing the existing financing gap:
• Cost savings through efficiency improvements. Operation and maintenance costsare inflated by current high energy consumption, large water losses in thedistribution network of water utilities, and oversized infrastructures. There isroom for substantial cost savings. Utilities therefore need to target scarcemaintenance and re-investment funds to achieve such cost savings.
• Cost savings by adapting service levels. Technological choices, in particular inthe context of network rehabilitation and extension, have to be backed by realisticassumptions on the sustainability of the operation of these technologies.
• Increased supply of finance, in particular from the ultimate sources of revenues(Figure 1.2 in Chapter 1), i.e. tariffs, taxes and transfers. These “3Ts” are the onlyfunds that can fill the financing gap.

2. FINANCING WATER AND SANITATION SERVICES: KEY CHALLENGES AND THE WAY FORWARD – 49
MANAGING WATER FOR ALL: AN OECD PERSPECTIVE ON PRICING AND FINANCING – ISBN-978-92-64-05033-4 © OECD 2009
While improved planning will be effective only if sector governance systems thatensure the execution and implementation of such plans are improved in parallel,experience in OECD and non-OECD countries has shown that policy dialogue onnational or regional strategic financial plans for water supply and sanitation can help tojustify and motivate such reforms. Such policy dialogues can also produce a number ofother useful outcomes that can support the financial sustainability of the water supply andsanitation sector.
Strategic financial planning: policy options to reduce costs
The starting point in a reflection on strategic financial planning is the existence of aclear statement of a country’s policy objectives for WSS. This could include expandingservice coverage, protecting the poor, ensuring sustainable use of water resources,reducing fiscal deficits, etc. There will commonly be trade-offs between these objectives.These need to be assessed along with the respective costs and benefits of the variousinitiatives, so as to gauge their feasibility and financial realism. If a financing gap exists,planners have a number of policy options in front of them; the first that needs exploring iswhether system costs can be reduced.
Reducing costs: improve the efficiency of operations
The operational efficiency of water utilities can be very low compared to best practicebenchmarks. For instance, leakage, which in well-run water utilities in the OECD isusually in the range of 10-20% of water production, frequently exceeds 40%, andsometimes reaches 70% in developing country utilities (as shown in OECD, 2009b; seealso Chapter 4). This means that significantly more water needs to be produced andtransported than finally reaches the consumer, therefore having a negative impact oninvestment and production costs: infrastructure is oversized and operating costs, both inabsolute terms and per unit of water sold, rise.
Similarly, electricity and chemical consumption per unit of water produced is oftenwell in excess of best practice standards and may represent a significant share ofproduction costs (in some utilities in the former Soviet Union as much as 50-70% of totalproduction costs). This situation is usually due to the poor efficiency of outdated waterpumps, as well as the poor design of water systems.
Corruption is another problem that is affecting the operational efficiency of waterutilities world wide. Transparency International estimates that corruption may inflate thecosts of water services by as much as 30% (Box 2.1).

50 – 2. FINANCING WATER AND SANITATION SERVICES: KEY CHALLENGES AND THE WAY FORWARD
MANAGING WATER FOR ALL: AN OECD PERSPECTIVE ON PRICING AND FINANCING – ISBN-978-92-64-05033-4 © OECD 2009
Box 2.1. Transparency International’s Global Corruption Report 2008
The 2008 Global Corruption Report from Transparency International provided a firstassessment of the extent to which corruption in WSS adds to the cost of infrastructure andservices. The methodology that was used to calculate the figures is being widely debated, so thatestimates should be taken with some caution. For developing countries, the report indicates thatcorruption may raise the price of connecting a household to a water network by as much as 30%,potentially inflating the cost of achieving the MDGs on water and sanitation by billions ofdollars.
More important than the estimate of the additional burden imposed by corruption in thesector are the indications of how this may materialise. A manifestation of corruption in the sectoris the tendency to over-build, as the construction phase is often the one where most funds can be“diverted”. This can contribute to excessive investment costs and the choice of inappropriatesolutions. Another corrupted practice is when users bribe meter readers to reduce their waterbills.
Source: Transparency International (2008), “Global Corruption Report”, Transparency International,Berlin.
As a consequence, ministers of finance, as well as donor agencies, expect significantimprovements of productivity before more public budget funds are spent in the sector.They are likely to be just as interested in where the money is going as in where themoney is coming from.
Inefficient operation and insufficient revenue collection will generally result ininadequate operation and maintenance (O&M) of infrastructure and eventually in reducedquality of services. Users will be unwilling to pay tariffs for poor services or if theybelieve that they are being charged to cover for the inefficiencies in the system.
In many cases the operational efficiency of water utilities can be significantlyimproved through low-cost measures. For instance, the Yerevan water utility in Armeniaachieved a 50% reduction in electric energy consumption through a string of measures,including the redesign of the distribution system and the shutdown of excess pumpingstations. Similarly, measures that help to develop the capacities of workers and other staffin water utilities can achieve significant productivity improvements. Therefore, muchcould be achieved if utilities had sufficient cash flow available to invest in such measures,as well as the incentives to improve their efficiency. In the Yerevan water utility, whichinvolves a private operator in a management contract, performance targets linked to anincentive payment included the reduction of energy consumption and water leakage (EAPTask Force, 2008a).
Some countries actively embrace benchmarking between WSS providers as a form ofcoercive comparison. In the Netherlands (publicly owned) drinking water companies areobliged by law to report their performance against various benchmarks which arepublished to act as an efficiency incentive. In England and Wales, the performance ofprivate WSS companies is benchmarked and the results are used for comparativeassessments by OFWAT, the economic regulator of the industry.1 In Asia, Africa, LatinAmerica and Eastern Europe, Caucasus and Central Asia (EECCA), the collection ofcomparative performance indicators for WSS utilities helps to define good practice andindicates the scope of efficiency gains for specific utilities.2 Experience suggests that the

2. FINANCING WATER AND SANITATION SERVICES: KEY CHALLENGES AND THE WAY FORWARD – 51
MANAGING WATER FOR ALL: AN OECD PERSPECTIVE ON PRICING AND FINANCING – ISBN-978-92-64-05033-4 © OECD 2009
“threat” of private sector participation has improved the performance of the public sector(e.g. in North America). The reverse is also true: the “threat” of returning to publicprovision of the service can spur the performance of private operators (also seeChapter 4).
Revising investment plans and adapting service levels
Policy objectives, which may result from domestic political commitments, sometimesin response to urgings of the international community, often allow for considerablelatitude in the way they are “translated” and implemented locally. This gives some scopefor more realistic strategies to emerge.
Infrastructure development targets to achieve the MDGs need to be realisticallytranslated at the national and local levels, based on consideration for local conditions, soas to make them affordable for the population and for public budgets, as well as desirablefor local users. The definition of the water-related MDGs leaves considerable latitude forinterpretation in relation to levels of service (see Box 1.7 in Chapter 1) and thetechnological solutions to achieve them. Ethiopia’s Universal Access Programme is anexample of the choice of standards which the government deems appropriate and realisticin order to achieve the desired level of service coverage. Service standards are acombination of several elements:
• the type of facility specified or approved (e.g. WC toilet, “improved” latrine,public standpipe, individual house water tap);
• the quality of household or communal water supplied; the acceptable quality ofeffluent, implying a standard of wastewater collection and treatment;
• the standard of daily service (water pressure, regular availability of supply,attention to leakage and consumer complaints);
• accessibility levels (in-house service, public standpipes or toilets, number ofpeople sharing, distance to travel for water source, time waiting, e.g. for publictoilet).
Choice of hardware and technologies also can make a big difference to costs. The percapita costs of different options for meeting the MDGs have recently been estimated(WHO, 2008; as set out in Table 2.1). Clearly, a change in the relative weights ofdifferent options in the overall programme can greatly affect total costs. When assessingthe cost of different technological solutions, their full life cycle cost should be considered,including annual recurrent costs of each option (which, depending on the type of serviceand other factors, could fall on individual households or public authorities) and the cost offuture replacement and upgrading, which will depend also on the longevity of differentsolutions, and how far future upgrading (e.g. from latrines to indoor toilets) should beprogrammed in. Neither aspect is taken into consideration in Table 2.1.
The scale and scope of water supply and sanitation services are important cost driversand can determine the choice of hardware and technology (see OECD, 2009c) design canoptimise economies of scale and avoid diseconomies, but the appropriate answer willdepend on how the components of water services (including water supply for potable andnon-potable uses, wastewater collection and treatment, storm water collection, water re-use) are combined (scope effect).
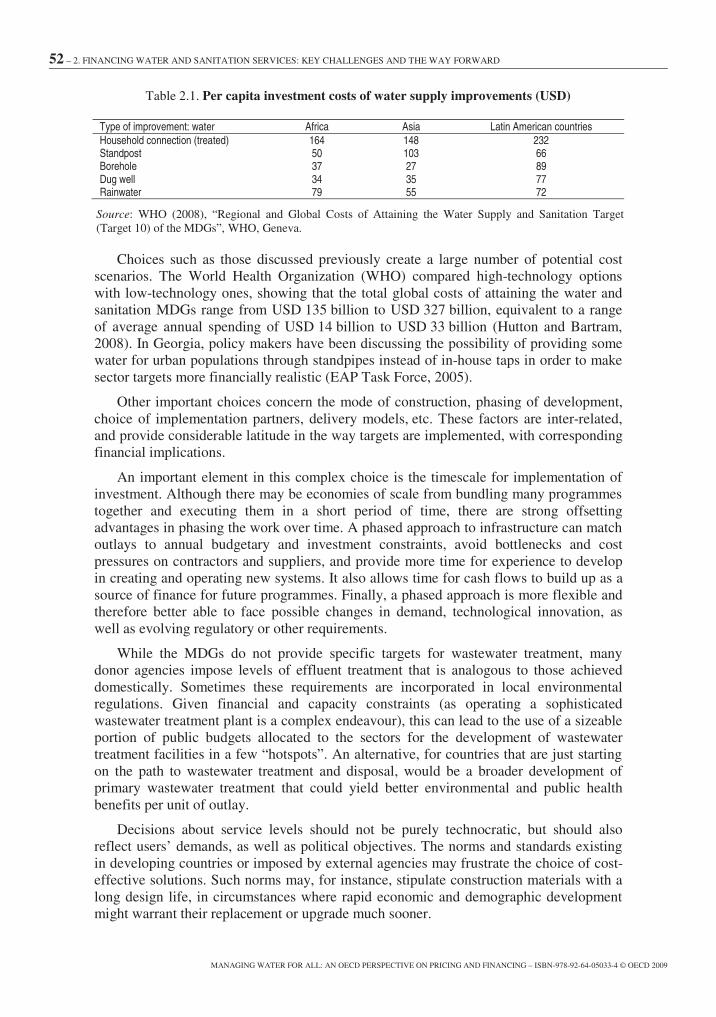
52 – 2. FINANCING WATER AND SANITATION SERVICES: KEY CHALLENGES AND THE WAY FORWARD
MANAGING WATER FOR ALL: AN OECD PERSPECTIVE ON PRICING AND FINANCING – ISBN-978-92-64-05033-4 © OECD 2009
Table 2.1. Per capita investment costs of water supply improvements (USD)
Type of improvement: water Africa Asia Latin American countriesHousehold connection (treated) 164 148 232Standpost 50 103 66Borehole 37 27 89Dug well 34 35 77Rainwater 79 55 72
Source: WHO (2008), “Regional and Global Costs of Attaining the Water Supply and Sanitation Target(Target 10) of the MDGs”, WHO, Geneva.
Choices such as those discussed previously create a large number of potential costscenarios. The World Health Organization (WHO) compared high-technology optionswith low-technology ones, showing that the total global costs of attaining the water andsanitation MDGs range from USD 135 billion to USD 327 billion, equivalent to a rangeof average annual spending of USD 14 billion to USD 33 billion (Hutton and Bartram,2008). In Georgia, policy makers have been discussing the possibility of providing somewater for urban populations through standpipes instead of in-house taps in order to makesector targets more financially realistic (EAP Task Force, 2005).
Other important choices concern the mode of construction, phasing of development,choice of implementation partners, delivery models, etc. These factors are inter-related,and provide considerable latitude in the way targets are implemented, with correspondingfinancial implications.
An important element in this complex choice is the timescale for implementation ofinvestment. Although there may be economies of scale from bundling many programmestogether and executing them in a short period of time, there are strong offsettingadvantages in phasing the work over time. A phased approach to infrastructure can matchoutlays to annual budgetary and investment constraints, avoid bottlenecks and costpressures on contractors and suppliers, and provide more time for experience to developin creating and operating new systems. It also allows time for cash flows to build up as asource of finance for future programmes. Finally, a phased approach is more flexible andtherefore better able to face possible changes in demand, technological innovation, aswell as evolving regulatory or other requirements.
While the MDGs do not provide specific targets for wastewater treatment, manydonor agencies impose levels of effluent treatment that is analogous to those achieveddomestically. Sometimes these requirements are incorporated in local environmentalregulations. Given financial and capacity constraints (as operating a sophisticatedwastewater treatment plant is a complex endeavour), this can lead to the use of a sizeableportion of public budgets allocated to the sectors for the development of wastewatertreatment facilities in a few “hotspots”. An alternative, for countries that are just startingon the path to wastewater treatment and disposal, would be a broader development ofprimary wastewater treatment that could yield better environmental and public healthbenefits per unit of outlay.
Decisions about service levels should not be purely technocratic, but should alsoreflect users’ demands, as well as political objectives. The norms and standards existingin developing countries or imposed by external agencies may frustrate the choice of cost-effective solutions. Such norms may, for instance, stipulate construction materials with along design life, in circumstances where rapid economic and demographic developmentmight warrant their replacement or upgrade much sooner.

2. FINANCING WATER AND SANITATION SERVICES: KEY CHALLENGES AND THE WAY FORWARD – 53
MANAGING WATER FOR ALL: AN OECD PERSPECTIVE ON PRICING AND FINANCING – ISBN-978-92-64-05033-4 © OECD 2009
Transitional countries in the EECCA region face a different and possibly morechallenging dilemma. Typically, they have high rates of service coverage for both waterand sanitation, particularly in urban areas, but their infrastructure is failing to maintainexisting levels of service. Much of it is old and oversized for its present needs, and it isill-suited to present economic and demographic realities. A number of these countries canill afford to maintain even existing services in their present form, and face an unenviablechoice of how much to lower standards for the sake of affordability (Box 2.2 provides theexample of Moldova).
Design specifications and service standards can evolve rapidly, which argues forsystems that are flexible and capable of being upgraded to meet demand. Norms andstandards should be challenged, with the aim of developing the most pragmatic andeffective approaches to achieving the MDGs. While the reform of norms and standardswill often be difficult and time-consuming (as a broad range of institutions andstakeholders needs to be involved in their definition), a number of countries (e.g. Estoniaand Viet Nam) have shown that with the right political will, it can be achieved.
Box 2.2. The challenge of achieving the water-related MDGs in Moldova
A European Union (EU) Water Initiative Policy Dialogue on the financing of urban and rural water supplyand sanitation in Moldova took place in 2006 and 2007 with support from the OECD EAP Task Force.
Using the FEASIBLE financial model, the initiative assessed annual cash flow needs for different WSSinfrastructure development targets and the available financial resources from user charges, public budgets andofficial development assistance (ODA) under certain assumptions. The so-called “baseline scenario” essentiallyassumes the maintenance and rehabilitation of existing, extensive Soviet-built WSS infrastructure, with noextension of service to previously not connected populations. To achieve financial sustainability it has beenassumed that user charges would increase to an average of 5% of household income (with social protectionmeasures to support the poorest who would have to pay much more than this average). Even with this very heavyburden on consumers, user charges would only generate about 50% of cash flow needs for the foreseeable future,eventually covering up to 95% in 2028. Hence, significant public budget and ODA resources would be needed toclose the financing gap.
More ambitious sector targets, including the achievement of the water-related MDGs by extending servicesto poor populations in rural areas, or better wastewater treatment levels to approximate requirements of the EUWater Framework Directive, would cost more and reduce the share of funding that can reasonably be expectedfrom tariffs further. Achieving the MDGs would require additional financial resources and even larger infusionsof public budget and ODA resources, or, if this is not possible, decisions to lower service levels in some areasthat have coverage (typically in urban areas) so as to free up resources for expansion.
In Moldova, various alternative policy targets have been costed:
Target strategy Total 20-year spending(in EUR millions)
1. Baseline: Halt deterioration of existing infrastructure and provide modest improvements. Improved operationand maintenance.
1 320
2. Baseline + meeting MDGs: For rural areas, investment in non-piped supplies and on-site sanitation, modestimprovements in simple piped water supply.
1 820
3. Baseline + key EU Directives: As for Baseline, plus water supply for 95% of urban population, wastewaterconnections for 90% of urban population, water and wastewater treatment.
1 840
4. Baseline + MDGs + critical wastewater treatment plants (WWTPs): As for 2 above, plus full rehabilitation ofseven WWTPs.
1 910
5. Baseline + MDGs + EU Directives 2 3406. Government Water Sector Strategy 2 845
Source: EAP Task Force (2007a), “Facilitating Policy Dialogue and Developing a National Financing Strategy for Urban andRural Water Supply and Sanitation in Moldova”, OECD, May.
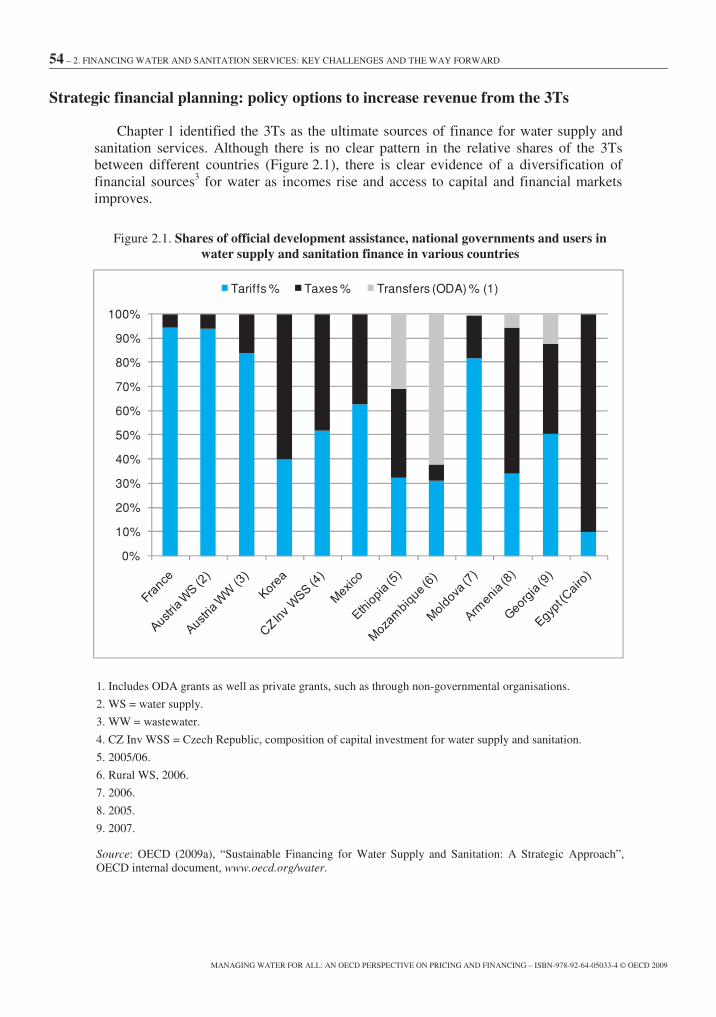
54 – 2. FINANCING WATER AND SANITATION SERVICES: KEY CHALLENGES AND THE WAY FORWARD
MANAGING WATER FOR ALL: AN OECD PERSPECTIVE ON PRICING AND FINANCING – ISBN-978-92-64-05033-4 © OECD 2009
Strategic financial planning: policy options to increase revenue from the 3Ts
Chapter 1 identified the 3Ts as the ultimate sources of finance for water supply andsanitation services. Although there is no clear pattern in the relative shares of the 3Tsbetween different countries (Figure 2.1), there is clear evidence of a diversification offinancial sources3 for water as incomes rise and access to capital and financial marketsimproves.
Figure 2.1. Shares of official development assistance, national governments and users inwater supply and sanitation finance in various countries
0%
10%
20%
30%
40%
50%
60%
70%
80%
90%
100%
Tariffs % Taxes % Transfers (ODA) % (1)
1. Includes ODA grants as well as private grants, such as through non-governmental organisations.
2. WS = water supply.
3. WW = wastewater.
4. CZ Inv WSS = Czech Republic, composition of capital investment for water supply and sanitation.
5. 2005/06.
6. Rural WS, 2006.
7. 2006.
8. 2005.
9. 2007.
Source: OECD (2009a), “Sustainable Financing for Water Supply and Sanitation: A Strategic Approach”,OECD internal document, www.oecd.org/water.

2. FINANCING WATER AND SANITATION SERVICES: KEY CHALLENGES AND THE WAY FORWARD – 55
MANAGING WATER FOR ALL: AN OECD PERSPECTIVE ON PRICING AND FINANCING – ISBN-978-92-64-05033-4 © OECD 2009
Several trends can be noted:
• As countries develop, there tends to be a shift towards more use of commercial,increasingly local, finance, reimbursed ultimately by growing cash flows fromuser charges. The case studies of Austria and Korea clearly show such aprogression.
• There is increasing use of pollution charges4 as sources of finance, a longstandingfeature of the French and Dutch systems, also evident in Korea.
• There is greater reliance on sub-national fundraising by municipal bonds andother means, as evident in India and South Africa.
• There is initial reliance on a dedicated water financing agency. This may persist(e.g. Dutch Water Bank, Turkey’s Iller Bankasi), or may lessen in relativeimportance over time (e.g. India’s HUDCO bank, Mexico’s BANOBRAS bank),or be superseded (Austria’s Water Management Fund).
Arriving at a sustainable financing strategy for WSS requires the appropriatecombination of the ultimate sources of revenue, in light of each country’s circumstancesand options. Governments need to recognise, however, that the effectiveness of watersector spending may be sensitive to the sources of funds, and to the modalities of theirdelivery. In the United States for instance, public subsidies were provided in the form ofgrants for the construction of water facilities in the 1980s and converted to subsidisedloans with long tenures and low interest rates in the 1990s. There is clear evidence thatthis change has brought about significantly improved capital investment efficiency. Themix of the 3Ts and the way in which this revenue is delivered to the water sectortherefore requires careful consideration by governments.
The remainder of this section reviews the potential for raising financial resourcesfrom each of the basic revenue sources: tariffs, taxes, and transfer/solidarity instruments.
Increasing revenues: tariffs
The conventional wisdom regarding cost recovery through tariffs is that water tariffsshould be sufficient to cover all the direct economic and financial costs of water supplyand sanitation, including the capital costs of replacing and expanding the networkinfrastructure, and ultimately its scarcity value and externality costs as well (seeChapter 1 for their description). This principle is evoked by the EU Water FrameworkDirective, which requires member states to take account of the principle and ensureadequate contributions by all users.
In reality, very few countries, developed or developing, practice full cost recovery(FCR) through tariffs, even if this definition is limited to direct economic and financialcosts. The EU Water Framework Directive, for instance, allows member states to divergefrom full cost recovery after accounting for the social impacts of cost recovery. In theUnited States, a system of annual federal grants underpins state revolving funds forlending to local authorities for WSS, and bond issues have the additional attraction ofbeing interest-free. Amongst developing countries, Senegal, which claims to be in“financial equilibrium” since 2003, funds practically all its investment from ODA. TheNational Water and Sewerage Corporation (NWSC) in Uganda had its government debtconverted to equity in order to improve its balance sheet to increase its creditworthiness.In the majority of developing countries the assumption – and practice – of policy makers
56 – 2. FINANCING WATER AND SANITATION SERVICES: KEY CHALLENGES AND THE WAY FORWARD
MANAGING WATER FOR ALL: AN OECD PERSPECTIVE ON PRICING AND FINANCING – ISBN-978-92-64-05033-4 © OECD 2009
is that WSS investment costs will be met from government grants and soft loans, and/orfrom ODA.
In most contexts it would be reasonable to expect tariffs to fully cover O&M andrenewal costs for water supply. But the practical answer to this will depend on a numberof factors.
Different cost recovery mechanisms for different water services
First of all, as discussed in Chapter 1, water services differ as to their economicnature, and their value is perceived differently by final users. This has implications on theusers’ willingness to pay for different WSS services. For instance, it is important todistinguish between drinking water provision, a private good for which willingness to payis generally high, and some components of sanitation services, such as wastewatertreatment, for which willingness to pay may be lower due to their externalities and theirquasi-public good nature (see Chapter 1).
In urban settings, FCR for drinking water service provision can be a realisticobjective, and it is desirable as it would release scarce public funding for the supply ofpublic goods. In rural communities, FCR may be a more distant prospect, though even inrural areas there are many cases of users paying the cost of O&M and renewal of waterinfrastructure, though rarely the full cost of investments.
Sanitation is a different matter. As the benefits of sanitation also accrue at thecommunity level (or even at regional level for wastewater treatment) and not only at thehousehold level, there is generally a lower willingness to pay for sanitation services thanjustified by their value to society, while investment costs tend to be much larger than fordrinking water. This provides a rationale for public intervention, including the use ofpublic subsidies, in the provision of sanitation and wastewater management services.
Affordability constraints
Probably the main obstacle to full cost recovery water pricing has been its perceivedsocial impacts, and their political consequences. In many of the poorest countries,household affordability issues seriously constrain the contribution of tariff revenue tosector finance (see Box 2.2). However, the question has sometimes also been used toavoid adjusting tariffs for political expediency. This is not to say that politicians shouldnot give consideration to social concerns, but rather a call for a more careful localassessment of actual affordability constraints and to consumers’ willingness to pay beforepolitical decisions are made (see Chapter 3).
Nevertheless, there are often significant opportunities to move progressively towardshigher levels of cost recovery through tariffs, while ensuring that poor and vulnerablegroups have access to water services. Indeed, there is probably no alternative given thelimitations of other sources of revenue that will be discussed later.
A widespread practice in developing countries is a refusal of public enterprises andinstitutions to pay their bills. Politicians and other people of influence often avoid payingtheir utility bills. In some countries bribery exacted by meter readers diverts revenues intoprivate pockets, leaving the utility short. As a result, the collection of user charges fromhouseholds and other consumer groups is often as low as 60-70% of billed amounts. InGeorgia, recent figures indicate that collection has fallen as low as 34% for householdcustomers (EAP Task Force, 2006a); in Cairo this figure stands at about 50% across

2. FINANCING WATER AND SANITATION SERVICES: KEY CHALLENGES AND THE WAY FORWARD – 57
MANAGING WATER FOR ALL: AN OECD PERSPECTIVE ON PRICING AND FINANCING – ISBN-978-92-64-05033-4 © OECD 2009
different consumer groups (OECD, forthcoming a). Strengthening the payment disciplinehas been shown to generate substantial additional funding and should be contemplatedbefore actual increases of tariffs are considered.
Water charges are not a significant burden on most households in OECD countries;typically they account for less than 1% of household income (see Figure 3.2 inChapter 3). The same holds true for a number of emerging economies; for example inEgypt, even the poorest households pay significantly less than 2% of their income forwater services (OECD forthcoming b). However, in many of the poorest developingcountries, water bills may represent a more significant portion of the income, and this isalso the case in some OECD countries (see Figure 3.3 in Chapter 3).
Donors and international financial institutions (IFIs) often use a benchmark of 3-5%of household income for water tariffs when they plan water infrastructure investmentprojects and assess their affordability. While such estimates may be a useful rule ofthumb in a first approach, they are also disconnected from local situations and need to becomplemented by more detailed analyses of how projected tariff levels would impactdifferent income groups.5 For example, projected tariffs may be less than 4% of averagehousehold income, but for the poorest 25% of the population they might represent 5-20%of income. A social assessment of water sector reform policies in the city of Yerevan,Armenia, carried out in 2004, showed that the 20% of the population with the lowestincome would have to pay about 8% of their income if water prices were increased closeto levels that allow the recovery of operational and maintenance costs, and almost 50% ofthe population would have to pay more than 4% of their income (EAP Task Force, 2004).
Subsidies are therefore often justified in terms of keeping services affordable for poorhouseholds, but there is mounting evidence that they are often not well targeted and notvery effective. Instead of benefiting the poor (who are frequently not connected to waterdistribution and sanitation networks), such subsidies often benefit richer people who arecapable of paying the full costs of water services. The effectiveness of public spending onwater infrastructure could be much increased if subsidies were restructured and bettertargeted. A variety of approaches has been developed to mitigate the impacts of increasedtariffs on the poor (see Chapter 3).
Regardless of whether there are affordability problems or not, and of whetheralternative sources of revenue can be tapped, it is important to ensure that the watersystems that are being built can realistically be financed. To do so, the analysis has tomove away from tariff levels and structures and focus on the factors that determine tarifflevels, and particularly investment cost, and the operational efficiency of utilities,including their collection rate. The regulator or other authority presiding over theapproval of tariff changes should be able to assess whether the costs whose recovery isbeing proposed are reasonable, while being adequate to ensure financial sustainability.
Process matters: gradual tariff increases
The path to improved cost recovery may involve a phased approach, with tariffsincreasing in stages to cover O&M costs, and thereafter depreciation of assets, newinvestment and, eventually – where relevant – environmental and resource costs of water.Where tariffs are extremely low relative to FCR or sustainable cost recovery (SCR), agradual approach may not be sufficient and more drastic action may be called for.6
Particularly if a phased approach is adopted, the tariff-setting process becomes a vitalconsideration. Many countries have decentralised responsibilities for services, including

58 – 2. FINANCING WATER AND SANITATION SERVICES: KEY CHALLENGES AND THE WAY FORWARD
MANAGING WATER FOR ALL: AN OECD PERSPECTIVE ON PRICING AND FINANCING – ISBN-978-92-64-05033-4 © OECD 2009
those for tariff setting. This can delay tariff reform and the regular adjustments necessaryto account for inflation. In some countries the central government determines the tariffstructure and level, for the local governments to implement. A realistic central-localbalance of obligations and responsibilities is the key to tariff reform. Where centralgovernment requires local administrations to follow unaffordable tariff policies, theyshould be prepared to provide fiscal help (e.g. social welfare payments to needyconsumers or programmed help to the utility, subject to performance contracts) (OECD,2009d).
Increasing revenues: taxes
In some of the poorest countries, where there are severe constraints on householdaffordability, public budget spending will need to play a significant role for theforeseeable future in order to help the water and sanitation sector deal with thereconstruction of deteriorated assets or to allow an expansion of water systems to meetthe water-related MDGs (see the Moldova example in Box 2.2). Even in OECD countries,where affordability for households is less of a problem, public budgets sometimesrepresent an important share of revenue for the sector (see Figure 2.1).
While public funds are limited by budgetary constraints and multiple demands fromdifferent sectors, in some countries, there appears to be considerable scope for increasingpublic budget spending. For instance, Moldova only spends 0.5% of its public budgetexpenditure on the water sector, while other countries of similar population and grossdomestic product (GDP) level in the region spend about four times more.
Just as there is a solid case for setting an economic tariff, there are sound argumentsto justify a subsidy in certain cases (also see the section on alternative cost allocationmechanisms for sanitation services in Chapter 3):
• to compensate for market failures, by rewarding WSS providers for supplyingpublic goods (public health) and external benefits (amenity, avoidance ofgroundwater depletion);
• to promote the consumption of merit goods (meritorious goods and serviceswhose value consumers may not fully realise, e.g. household sanitation andhygiene);
• as a transitional measure to enable tariffs to rise gradually and in order to addressconcerns about the affordability of higher charges;
• to provide services at below normal cost to vulnerable consumer groups, e.g. thevery poor, large families, those with certain medical conditions.
In order to be efficient and effective, subsidies of this kind should be transparent,targeted and – ideally – taper off over time. They should also be intentional (i.e. definedex ante and well planned, as opposed to announced ex post as a political gesture, oravailable de facto, as when tariffs are not actually collected). An example of a clearlystated WSS subsidy policy is given in Box 2.3.

2. FINANCING WATER AND SANITATION SERVICES: KEY CHALLENGES AND THE WAY FORWARD – 59
MANAGING WATER FOR ALL: AN OECD PERSPECTIVE ON PRICING AND FINANCING – ISBN-978-92-64-05033-4 © OECD 2009
Box 2.3. Subsidy policy in Uganda
For urban water, there is in principle no subsidy, though in practice donor funds lower thecost of capital. Tariffs are intended to recover the full cost of O&M. For small towns, a fullcapital subsidy is available and some subsidy is also available to operating costs through theO&M conditional grant. For rural water supply, around 2% community contribution is expectedfor capital items. In principle no subsidy is offered for O&M though full cost recovery is rare inpractice. For sanitation, no subsidy is offered to households, but school toilets, public latrinesand hygiene promotion are fully subsidised. For sanitation O&M, no subsidy is available forhouseholds, whereas schools and promotional programmes are fully subsidised.
Source: Uganda case study prepared for the OECD Task Team on Water and Sanitation.
The form of subsidy probably most widespread among OECD and developingcountries alike is capital expenditure. This is usually provided in the form of grants, long-term subsidised loans or sovereign guarantees. It is usually expected that utilities shouldrecover O&M costs from tariffs and then gradually move towards full recovery of capitalcharges as affordability rises.
From an economic viewpoint, however, there is no strong reason for subsidisingcapital rather than O&M; both are components of the total cost of providing the serviceand in the long run cash flow is required for both. Subsidising capital may also producedistortions (such as over-engineered, capital-intensive solutions). It is preferable fornominal tariffs to reflect full (marginal) costs, and to adjust for affordability in other ways(see below). While this may represent good practice, countries tend to be highlypragmatic in their use of public money for WSS. The experience of Korea is typical ofmany (Box 2.4).
Box 2.4. Evolution of subsidy policy in Korea
Direct subsidies are available from the central government to local governments or serviceproviders. The proportion of subsidy to the cost of each project depends on the size of the cityand the type of facility. Different subsidies are available for construction and operation.Typically, water source development in rural areas attracts subsidies of 50-80%, and localwaterworks improvements 50%. Wastewater treatment is eligible for a 50% grant, and sludgetreatment for loans of 30-70% of costs.
For water supply run by municipalities, revenue from water tariffs covers an increasingshare of production costs, rising from 69.4% in 1997 to 82.8% in 2005. For regional watersupply systems full cost recovery was achieved by 2004. In the case of sewerage treatment, therevenue from tariffs falls short of the actual total cost. Over the period 1997-2004, the centralgovernment paid 53% of the total investment costs for sewerage treatment, using proceeds fromthe national liquor tax.
The funding scheme for the provision of infrastructure has varied according to thestatus/stage of economic development or urbanisation. At earlier stages of economicdevelopment and urbanisation, the central government supported the provision of infrastructurethrough several subsidies and administrative assistance. As the economy developed, the portionof central government support has decreased and the cost of environmental service has beentransferred to polluters, users and local governments.
Source: Korea case study prepared for the OECD Task Team on Water and Sanitation.

60 – 2. FINANCING WATER AND SANITATION SERVICES: KEY CHALLENGES AND THE WAY FORWARD
MANAGING WATER FOR ALL: AN OECD PERSPECTIVE ON PRICING AND FINANCING – ISBN-978-92-64-05033-4 © OECD 2009
However, in a decentralised sector, municipalities, which usually own the assets,often lack the financial means to support these efforts themselves. In the OECD and manydeveloping countries, a significant share (about 25% in OECD and up to 50% or more inmany developing countries) of local government budgets are provided through fiscaltransfers from central budgets. It is therefore crucial that such transfers are provided in away that ensures an effective contribution to the long-term sustainable financing of thewater sector. Experience gained in the OECD and in countries of Central and EasternEurope shows that two important criteria should be taken into account when organisingthese transfers (see EAP Task Force, 2006a; 2006b).
First, intergovernmental transfers should generate stable revenues, which can beincorporated in the medium-term financial strategies of municipalities. Schemes in use insome countries, which allow for extensive revision of the amounts to be transferred,generate uncertainties in sub-sovereign governments’ revenues, and run counter to theneeds of a sector that is capital intensive and involves long-living assets.
Second, the procedure should be designed in accordance with one of two objectives:
• Either to ensure that national targets are reached, e.g. to ensure the efficiency ofWSS operations, or to support the implementation of environmental or otherstandards. Funds can then be transferred on a non-permanent basis, as transfersshould be stopped once the target is achieved. Earmarking can be an option, as itfacilitates monitoring of the allocation of the funds.
• Or to allow municipalities to allocate funds according to their own priorities. Thisoption is economically justified, if local governments can establish that they havethe capacity to elaborate sound and realistic plans, to implement them, and to befully accountable for their implementation. Under such circumstances, generalpurpose grants have proved to be the most flexible and efficient means of transfer,as in the case of the “Sub-National Governments Financial Support Fund” in theRussian Federation.
When designed according to these criteria, intergovernmental transfers createincentives for improved financial sustainability and creditworthiness of localjurisdictions, thereby eventually helping to decrease demands on central budgets.
In addition, environmental administration and local governments should allocate theirbudget resources in a way to leverage other sources of finance. All things being equal, theaim should be to minimise the contribution of public financial resources and to maximisethe contributions of alternative sources of finance. Public funds should not crowd outprivate financing for projects that are commercially viable. Where possible, publicfinance, including loans from bilateral donors and international financial institutions,should be channelled through (or complemented by) commercial banks in order to buildcapacity to support investments in water supply and sanitation.
Increasing the supply of finance: transfers (i.e. ODA)
Official development assistance7 and other forms of aid (i.e. private charities, etc.)have a role to play to help close the financing gap.8 The share of ODA to water andsanitation varies across recipient countries. In some countries ODA subsidises mostinvestments, while in other it plays a more marginal role. Nevertheless, ODA has animportant role to play both as a source of finance and of capacity development for theprovision and financing of water services. If the MDG targets are to be achieved, the

2. FINANCING WATER AND SANITATION SERVICES: KEY CHALLENGES AND THE WAY FORWARD – 61
MANAGING WATER FOR ALL: AN OECD PERSPECTIVE ON PRICING AND FINANCING – ISBN-978-92-64-05033-4 © OECD 2009
increasing levels of ODA to the water sector need to be sustained, together with increasedmobilisation of financial resources within developing countries.
While the bulk of ODA is extended in the form of grants, loans constitute a largeshare of ODA to certain sectors. About half of ODA to water supply and sanitation in2001-06 was in the form of loans. In the context of an analysis that distinguishes betweenthe ultimate sources of revenue (tariffs, taxes and transfers) and other financial means, thedifferent roles of ODA grants and loans need to be borne in mind.
ODA grants consist of “transfers” and are considered as ultimate sources of revenue.ODA loans lower the cost of capital and are useful in helping water utilities “bridge” thefinancing gap that is created by the need for large upfront infrastructure investment.
Aid for water supply and sanitation has been rising again since 2001, after atemporary decline in the second part of the 1990s. In 2005-06, DAC9 members’ bilateralannual aid commitments to the water and sanitation sector rose to USD 5 billion, doublethe amount of years 2001-02 in real terms. Taking into account multilateral agencies’outflows, which rose by 21% in 2002-06, ODA amounted to USD 6.2 billion(Figure 2.2).10
Figure 2.2. Trends in official development assistance to water supply and sanitation
1973-2006, commitments, 5-year moving averages and annual figures, constant 2006 prices1
0 000
0 500
1 000
1 500
2 000
2 500
3 000
3 500
4 000
4 500
5 000
1971 1976 1981 1986 1991 1996 2001 2006
USD million
DAC countries, annual figures
DAC countries, moving average
Multilateral agencies, moving average
Multilateral agencies, annual figures
1. Figures based on five-year moving averages take into account commitments’ volatility, thus facilitating theanalysis of long-term trends.
Source: OECD/WWC (2008), Creditor Reporting System: Aid Activities in Support of Water Supply andSanitation - 2001-2006, OECD, Paris.
DAC members dedicated 9% of their total sector allocable aid to projects andprogrammes in the water sector (including water resources management activities) over

62 – 2. FINANCING WATER AND SANITATION SERVICES: KEY CHALLENGES AND THE WAY FORWARD
MANAGING WATER FOR ALL: AN OECD PERSPECTIVE ON PRICING AND FINANCING – ISBN-978-92-64-05033-4 © OECD 2009
the last two years. This illustrates a renewed prioritisation of the water sector in members’aid programmes in 2005-06, after a drop to 6-7% in 2001-04.
Among DAC members, the largest contributors over 2005-06 were Japan (on averageUSD 1.6 billion per year), the United States (USD 903 million) and the EuropeanCommission (USD 730 million). The bulk of Japanese aid related to ODA loans forinfrastructure projects is in China, Costa Rica, India, Indonesia and Malaysia. On theirown, these projects represented one-fourth of total DAC members’ aid for water.Reconstruction projects in Iraq by the United States also made up a significant proportion(15%) of the total.
Main recipient regions were Asia (55%) and Africa (32%) over 2001-06. The regionthe most in need, both in terms of access to water supply and sanitation, Sub-SaharanAfrica, received a significant share of total aid (24%) although this share decreased inrecent years (from 22% in 2001-04 to 17% over 2005-06 for DAC members). The otherregion suffering the most from a lack of sanitation services, South Asia, was also arelatively large recipient of aid for water (South and Central Asia received 19% of totalaid for water).
However, an analysis of aid allocations in relation to the degree of current access towater and sanitation of recipient countries (see Figures 2.3 and 2.4) reveals that numerouscountries with low levels of access receive little aid (e.g. Angola, Central AfricanRepublic, Republic of Congo, Somalia, Togo receive less than USD 0.5 per capita) whilecountries with higher levels of access receive significantly more (e.g. Albana, Costa Rica,Iraq, Jordan, Lebanon, Malaysia received at least USD 13 per capita).
Figure 2.3. Aid to water supply and sanitation per capita in relation to the degree of accessto water supply by recipient countries
Burkina FasoEgypt
Iraq
Malaysia
0
5
10
15
20
25
30
20 30 40 50 60 70 80 90 100
OD
A p
er c
apita
, 200
5-06
ave
rag
e, U
SD
Proportion of population using an improved drinking water source, 2004, %
AlbaniaBenin
Jordan
Lebanon
Mozambique
AfghanistanZambia
Nicaragua
EthiopiaSomalia
Chad
LesothoCosta Rica
Gambia
Source: OECD/WWC (2008), Creditor Reporting System: Aid Activities in Support of Water Supply andSanitation - 2001-2006, OECD, Paris.

2. FINANCING WATER AND SANITATION SERVICES: KEY CHALLENGES AND THE WAY FORWARD – 63
MANAGING WATER FOR ALL: AN OECD PERSPECTIVE ON PRICING AND FINANCING – ISBN-978-92-64-05033-4 © OECD 2009
Figure 2.4. Aid to water supply and sanitation per capita in relation to the degree of accessto sanitation facilities by recipient countries
AlbaniaBenin
Burkina Faso
Costa Rica
Egypt
Gambia
Ghana
Iraq
Jordan
Lebanon
LesothoMalaysia
MauritiusNicaragua
Niger
Tunisia
0
5
10
15
20
25
30
0 10 20 30 40 50 60 70 80 90 100
OD
A p
er c
apita
, 200
5-06
ave
rag
e, U
SD
Proportion of population using an improved sanitation facility, 2004, %
Chad
Eritrea
Source: OECD/WWC (2008), Creditor Reporting System: Aid Activities in Support of Water Supply andSanitation - 2001-2006, OECD, Paris.
Aid resources are scarce. They need to be spent strategically, so as to maximise theirleveraging capacity and effectiveness. Experience suggest that aid is more effective whenpartner countries exercise strong and effective leadership over their development policiesand strategies, as set out in the Paris Declaration on Aid Effectiveness and recentlyemphasised in the Accra Agenda for Action.
Areas where the use of ODA could have a catalysing effect include:
• Reducing bottlenecks in the sector – particularly reducing the capacity bottlenecksfaced by both public authorities, especially local ones, and local operators.
• Supporting the financial planning process by helping to develop relevant capacity,by aligning assistance with the resulting financing strategies, by participating inthe policy dialogue and contributing to better co-ordination, and by supportingparallel capacity development at the local level. Donors can also draw on theirdomestic experience of planning the financing of the water sector and share thisexperience with developing countries that wish to follow such approaches.
• Ensuring access to services by the poor, through tailored, targeted grant-deliverysystems (e.g. output-based aid11).
• Supporting the development and use of risk-management mechanisms that couldhelp attract private funding (and especially private local funding) to the sector(see Box 2.5 for an example).

64 – 2. FINANCING WATER AND SANITATION SERVICES: KEY CHALLENGES AND THE WAY FORWARD
MANAGING WATER FOR ALL: AN OECD PERSPECTIVE ON PRICING AND FINANCING – ISBN-978-92-64-05033-4 © OECD 2009
Box 2.5. The Philippine Water Revolving Fund (PWRF)
The Philippines Financing Reform combines the judicious use of ODA (United States Agency forInternational Development [USAID]), with a focus on improving the “fundamentals” of the sector and financialingenuity. The main challenges the Philippines face with regard to the water supply and sanitation sector are:80% of the population has access to water supply, but only 44% have piped connection; 84% have access tolatrines and septic tanks, but only 4% of the population has access to sewerage systems, and infrastructure forwastewater treatment is missing. In the past, progress in expanding and improving services has been slow. Interms of financing, public resources can cover only half of the investment requirement to meet MDG targets andnil for wastewater treatment facilities. Internal revenues and ODA have been the traditional sources of financingfor water utilities. Both have been declining over the past decade – a trend that is expected to continue. Thegovernment thus became interested in attracting private finance (particularly from local financial markets) to thesector, as a way to bridge the financing gap.
The Philippine Water Revolving Fund (PWRF)1 is one of several innovative financing mechanisms. It hasthe following objective: blending public and private resources to offer affordable financing to utilities withoutdistorting market terms. Initially, the idea was to establish a fund similar to the US State Revolving Funds.However, there were two major constraints in setting up the scheme. First, no government grants were availableto be used as collateral, due to the very tight fiscal position of the Filipino Government (GRP). Moreover, privatefinancing institutions were not familiar with utilities. On the other hand, there were opportunities. If GRP wouldprovide a sovereign guarantee, public banks could borrow ODA money directly. ODA funding could then beused to leverage private funds. The positive aspect of the Filipino financial market was the presence of highliquidity and the prevalence of low interest rates. Finally the creditworthy utilities were able to afford market-based rates, but needed longer maturities than were offered by local banks.
Responding to this, the PWRF was designed as a co-financing facility, blending concessional loans from theJapan International Cooperation Agency (JICA) (borrowed and on-lent by the Development Bank of thePhilippines) with funds of local private commercial banks. Donors’ development agencies also contributed in asecond way: a domestic guarantee corporation backed by a co-guarantee from USAID Development CreditAuthority will provide the credit risk enhancement for private lenders. Moreover, commercial loans thatcurrently have maturities of ten years at the most will be supported by a standby credit line from governmentfinancing institutions to lengthen the amortisation period. The revolving nature of the Fund comes from thelonger grace periods of the JICA loan (ten years) and the shorter grace period of the loans to water utilities (twoto three years). Their early principal repayments will be put in a ring-fenced account and dedicated to lending fornew water projects or enhancing future capital market-based instruments. The fund became operational on30 September 2008.
Early gains: The new government water policy and the dialogue between public and private financinginstitutions stimulated interest in financing WSS projects before the creation of the Revolving Fund. Since 2007private banks have originated ten loan transactions for WSS projects with a total value of USD 23 million. Theseprojects will provide piped water to some 720 000 Filipinos.
1. USAID and JICA have been assisting the Philippine Government from conceptualisation, feasibility assessment anddesign, and currently execution of the PWRF.
Source: Philippine Financing Reform Case Study received from DAI for USAID; Moore, D. (2006), “Developing SustainableFinancing for Water Supply and Sanitation: Philippine Water Revolving Fund”, presented at the 4th World Water Congress,14 September 2006, Beijing, China.

2. FINANCING WATER AND SANITATION SERVICES: KEY CHALLENGES AND THE WAY FORWARD – 65
MANAGING WATER FOR ALL: AN OECD PERSPECTIVE ON PRICING AND FINANCING – ISBN-978-92-64-05033-4 © OECD 2009
Policy dialogue on WSS financing: good practices from OECD and developingcountries
Informing policy choices: the value of strategic financial planning
One approach that can help countries address the challenge of sustainable financingfor the water supply and sanitation sector is that of strategic financial planning. Strategicfinancial planning is a multi-stakeholder policy dialogue process that attempts to developnational consensus on what water supply and sanitation services a country can or shouldafford in the next 20-30 years, and how it will pay for them. At present, policy decisionsare rarely based on such comprehensive long-term analyses. The alarming evidence ofcurrent underfunding, and the looming costs of future development lend urgency to theseexercises.
In this report, the terms “strategic financial planning (SFP)” and “financing strategies(FSs)” are used interchangeably. Some countries undergo a formal process of dialogueand stakeholder consultation, prior to the production of a written Financing Strategy,based in some cases on a financial model such as FEASIBLE or SWIFT.12 Othercountries evolve their financing strategies over time through the development of relevantpolicies and institutions, and SFP is embedded in routine public financing andexpenditure processes.
SFP/FS have several objectives. They provide a structure for a policy dialogue to takeplace, involving all relevant stakeholders including ministries of finance, with the aim ofproducing a consensus on a feasible future WSS. They illustrate the impact of differentobjectives and targets from a long-term perspective, linking sector policies, programmesand projects. They also serve the important aim of facilitating external financing,providing clear and transparent data on financing requirements.
Based on the experience reviewed in this chapter, a number of outcomes can beexpected (Box 2.6 shows some examples): a shared understanding of issues; consensus onrealistic WSS infrastructure targets; more objective discussion of tariff policy; reflectionof the realism of social and environmental objectives; the opportunity to improvedialogue with the Ministry of Finance; and the possibility of incorporating results into thenational Medium-Term Expenditure Framework and into Poverty Reduction StrategyPapers (which may be a condition of donor support).
Through these country-led processes donors support the development of the water andsanitation sector in a way that is consistent with the Accra Agenda for Action and theParis Declaration on Aid Effectiveness. This entails both financial and capacitydevelopment support.

66 – 2. FINANCING WATER AND SANITATION SERVICES: KEY CHALLENGES AND THE WAY FORWARD
MANAGING WATER FOR ALL: AN OECD PERSPECTIVE ON PRICING AND FINANCING – ISBN-978-92-64-05033-4 © OECD 2009
Box 2.6. Results of strategic financial planning processes in Moldova and Armenia, using theOECD’s FEASIBLE methodology
In order to support the policy dialogue processes that underlie strategic financial planning, the OECD, withthe support of the Government of Denmark, has developed a decision-support tool called FEASIBLE. The basicapproach underlying FEASIBLE is to collect detailed technical data on existing infrastructure, select publicpolicy targets in water supply and sanitation – usually the Millennium Development Goals – determine costs andtimetables for achieving them, and compare the schedule and volume of expenditure needs with availablesources of finance. This reveals any financial deficits likely to arise along the way. FEASIBLE can be used todevelop various scenarios to determine how the gaps might be closed, such as identifying ways to help achievethe targets at lower cost or to mobilise additional finance; setting less ambitious targets, or rescheduling theprogramme. To date, the FEASIBLE tool has been used in more than 15 countries, mainly in the former SovietUnion and with the support of the OECD EAP Task Force.
In Moldova, policy dialogue to develop a financing strategy for water supply and sanitation took place overan 18-month period, and was led by the Minister for Local Public Administration. It provided important input tothe National Water Strategy, initiated by the president. The process helped to inject realism into these plans andled to a demand to translate the financing strategy into an action and investment plan and to link it into theMedium-Term Expenditure Framework.
In Armenia, policy dialogue on water supply and sanitation sector financing has been going on for severalyears under the leadership of the State Water Committee and with strong involvement of the Ministry of Finance.The dialogue and analysis that it produced led the Ministry of Finance to recognise the sector’s need forprolonged public subsidies and to an extension of public subsidies that were meant to be phased out. Thedialogue also identified realistic policy objectives for minimal water supply standards in rural areas. A lawincorporating these conclusions is in the process of adoption.
The FEASIBLE tool is currently being applied in a number of countries in the former Soviet Union(Moldova, Georgia, Kyrgyzstan), but also in Egypt (with support from the OECD and the MediterraneanComponent of the EU Water Initiative), in Lesotho (with support of the OECD and EU Water Initiative FinanceWorking Group), and Cambodia (with support from the Water and Sanitation Programme).
Source: EAP Task Force (2007b), “Implementation of a National Finance Strategy for the Water Supply and Sanitation inArmenia”, OECD; EAP Task Force (2008b), “National Policy Dialogue on Financing Strategy for Rural Water Supply andSanitation in Armenia”, OECD; EAP Task Force (2008c), “Financing Water Supply and Sanitation in Moldova”, OECD.
Making strategic financial planning work: basic principles from lessons learned
SFP is no panacea, nor is it an effortless process. The recent experience of developingcountries is that it can be a difficult and time-consuming exercise, yielding partialsuccesses from considerable effort. It is still well worth doing. It should be recalled thatdeveloped countries have taken decades to evolve their present financing systems forWSS, and sometimes key reforms have only been prompted by catastrophes and internalfinancial crises.
Actors and stakeholders
SFP needs ownership and championing by key actors and stakeholders. Thesecrucially include political leaders and officials from the national financial community,including ministries of finance. Stakeholders should be of sufficient seniority to carryweight within the community they represent and to be able to deliver the support of their

2. FINANCING WATER AND SANITATION SERVICES: KEY CHALLENGES AND THE WAY FORWARD – 67
MANAGING WATER FOR ALL: AN OECD PERSPECTIVE ON PRICING AND FINANCING – ISBN-978-92-64-05033-4 © OECD 2009
constituents. Some of these will be outside the water sector, as is normally construed.Donor agencies and other external partners should lend judicious support.
Process
The process involved in SFP involves substantial dialogue and consultation with allmajor parties (stakeholders). Assembling information, clarifying goals and negotiatingoptions are just as important for the FS as the eventual production of a document ormodel. It is important to start with a clear understanding of objectives and their relativeimportance, since this will determine the tools used, the stakeholders involved and theexpectations that are raised. All of this takes time (at minimum, a year) and plans shouldbe periodically revisited to ensure that they remain realistic.
The ambition of SFP hinges on how the scope of the sector, and the sub-sectors itincludes, is viewed. A FS can be confined to a single coherent sub-sector (such as ruralWSS) or it could be widened to include urban areas, water resources management andinstitutional reforms. The strategy can be limited to the public sector or could also includethe contributions from charities, civil society, the private sector and individualhouseholders. SFPs can be developed at the national or regional level, depending on thegovernance structures. It involves an iterative process, in which different targets andfinancial requirements are successively tested against available resources until a balanceis reached.
Analytical base
The credibility of SFP rests on the quality of the data on which it is erected. If amodel is used, it should be robust and its structure should be intuitively and intellectuallyclear to its ultimate users. Different countries have different needs from SFP and there isno “one size fits all”. There has to be a balance between simplicity (making the FS easyto implement) and credibility, which may demand a more sophisticated and rigorousapproach. Models should be designed to support decisions, not to replace them, andshould be easy to update.
Capacity
Investing in the development of capacity for SFP can have high returns. Creating aneffective dialogue between water sector experts and financial specialists entailscommunicating in language intelligible to the other side, and in terms which have mutualresonance. Water professionals need to understand more about finance: finance specialistsshould acquire a better understanding of water. The ambition and modalities chosen forSFP should reflect local needs, expectations and implementation capacities.
WSS champions need to present a more effective case to ministries of finance for itsproper share of budgetary allocations, against a background where politicians,particularly at local levels, have an insufficient awareness of WSS and its needs. Thisaffects the low priority they often give it compared to other sectors, and hinders theircapacity to give it effective support.
The “absorptive capacity” of WSS for financial resources needs to grow: it is oftenlimited due to weak project preparation and poor capacity for implementation. It is alsodetermined by the predictability of funds and their timely arrival. Related to this, essential

68 – 2. FINANCING WATER AND SANITATION SERVICES: KEY CHALLENGES AND THE WAY FORWARD
MANAGING WATER FOR ALL: AN OECD PERSPECTIVE ON PRICING AND FINANCING – ISBN-978-92-64-05033-4 © OECD 2009
data on the status and performance of WSS is often lacking, insufficient and unreliable,thereby hindering credible sector planning.
Role of donors
International donors can be the midwives of SFP. They are in a position to promotethe concept to their development partners, provide material support for capacitydevelopment, harmonise their procedures in line with their partner’s needs, and offer theirown national experiences where relevant. However, they should avoid hijacking or short-circuiting the process, which would be counter-productive to its long-term success.
Notes
1. OFWAT has periodically vetoed proposed mergers between companies on thegrounds that this would reduce the scope of benchmarked competition.
2. For example, through the World Bank’s IB-Net, the former Water Utility Partnershipfor Africa (now taken over by the Water and Sanitation Programme [WSP] and theWater Operators Partnership), the Asian Development Bank’s Water Utilities DataBooks, reports of the Environmental Action Programme Task Force (for EECCAcountries), and various utility and professional networks in Latin America.
3. Recall the important distinction between the ultimate sources of revenue (tariffs, taxesand transfers) and other financial means that can defray immediate costs (loans,bonds, equity) but which have to be eventually repaid from one or other of theultimate sources of revenue. In that context, ODA grants are considered as ultimatesources of revenue while ODA loans need to be paid back by water users or publicbudgets.
4. This can be regarded either as a user charge or an earmarked tax.
5. In addition, as will be discussed in Chapter 3, even in poor countries, lower incomepeople may be willing to pay higher portions of their income for improved services;thus, international thresholds should only serve as a general indication.
6. In such situations presenting tariff increases in percentage terms, as critics often do,will be misleading, since a 100% increase in a trivial sum still leaves a trivial sum.Even after a tenfold increase in tariffs in the Czech Republic, the share of averagehousehold incomes required to pay the water bill is about 1% (Czech case studyprepared for the OECD Task Team on Water and Sanitation).
7. Comprehensive statistics on ODA for water supply and sanitation are provided inOECD/WWC (2008).
8. ODA figures measure flows transferred to recipient countries. As an ultimate sourceof revenue for the water sector, ODA is therefore kept under “transfers” in this report.ODA funds delivered in the form of budget support are managed in accordance withthe recipient’s budgetary procedures, in the same way as other government resources

2. FINANCING WATER AND SANITATION SERVICES: KEY CHALLENGES AND THE WAY FORWARD – 69
MANAGING WATER FOR ALL: AN OECD PERSPECTIVE ON PRICING AND FINANCING – ISBN-978-92-64-05033-4 © OECD 2009
obtained through “taxes”. In this case ODA becomes part of the recipient “publicbudget spending”, but the political and administrative process of securing ODAresources is still very different from “taxes”.
9. The OECD Development Assistance Committee, founded in 1961, is made up of23 members: 22 OECD countries (among them the most important bilateral donors)and the European Commission.
10. This includes both grants and concessional loans. If a loan satisfies the ODA criteria,the whole amount is recorded as ODA and not just the grant element. The grantelement is not used to discount the face value of a loan in DAC reporting.Repayments of the principal of ODA loans count as negative flows, and are deductedto arrive at net ODA, so that by the time a loan is repaid, the net flow over the periodof the loan is zero (interest is recorded, but is not counted in the net flow statistics).
11. Output-based aid (OBA) focuses on using development aid to support the delivery ofpublic services in developing countries using targeted performance-related subsidies.
12. FEASIBLE is a strategic financial modelling tool that has been developed by theOECD with the support of the government of Denmark. SWIFT has been developedby the Water and Sanitation Programme at the World Bank.

70 – 2. FINANCING WATER AND SANITATION SERVICES: KEY CHALLENGES AND THE WAY FORWARD
MANAGING WATER FOR ALL: AN OECD PERSPECTIVE ON PRICING AND FINANCING – ISBN-978-92-64-05033-4 © OECD 2009
References
EAP Task Force (2004), “Consumer Protection in Urban Water Sector Reforms inArmenia: Ability to Pay and Social Protection of Low Income Households”, OECD,www.oecd.org/dataoecd/32/48/35052145.pdf.
EAP Task Force (2005), “Financing Strategy for the Urban Water Supply and SanitationSector in Georgia”, OECD.
EAP Task Force (2006a), “Financing Water Supply and Sanitation in Eastern Europe,Caucasus and Central Asia”, OECD.
EAP Task Force (2006b), “Intergovernmental Transfers for Environmental Infrastructure:Lessons from Armenia, the Russian Federation, and Ukraine”, OECD.
EAP Task Force (2007a), “Facilitating Policy Dialogue and Developing a NationalFinancing Strategy for Urban and Rural Water Supply and Sanitation in Moldova”,OECD, May.
EAP Task Force (2007b), “Implementation of a National Finance Strategy for the WaterSupply and Sanitation in Armenia”, OECD.
EAP Task Force (2008a), “Promoting the Use of Performance-Based Contracts betweenWater Utilities and Municipalities in EECCA – Case Study: Lease Contract for theYerevan Water Supply Company”, OECD.
EAP Task Force (2008b), “National Policy Dialogue on Financing Strategy for RuralWater Supply and Sanitation in Armenia”, OECD.
EAP Task Force (2008c), “Financing Water Supply and Sanitation in Moldova”, OECD.
Hutton and Bartram (2008), “Global Costs of Attaining the Millennium DevelopmentGoal for Water Supply and Sanitation”, Bulletin of the World HealthOrganization 86(1), January.
Moore, D. (2006), “Developing Sustainable Financing for Water Supply and Sanitation:Philippine Water Revolving Fund”, presented at the Fourth World Water Congress,14 September, Beijing, China.
OECD/WWC (2008), Creditor Reporting System: Aid Activities in Support of WaterSupply and Sanitation - 2001-2006, OECD, Paris.
OECD (2009a), “Strategic Financial Planning for Water Supply and Sanitation”, OECDinternal document, www.oecd.org/water.
OECD (2009b), Private Sector Participation in Water Infrastructure: OECD Checklistfor Public Action, OECD, Paris, www.oecd.org/daf/investment/water.
OECD (2009c), “Alternative Ways of Providing Water and Sanitation: Emerging Optionsand their Policy Implications”, OECD internal document, www.oecd.org/water.

2. FINANCING WATER AND SANITATION SERVICES: KEY CHALLENGES AND THE WAY FORWARD – 71
MANAGING WATER FOR ALL: AN OECD PERSPECTIVE ON PRICING AND FINANCING – ISBN-978-92-64-05033-4 © OECD 2009
OECD (2009d), “Pricing Water Resources and Water and Sanitation Services”, OECDinternal document, www.oecd.org/water.
OECD (forthcoming a), “Financing Water Supply and Sanitation in the Greater CairoArea”, OECD internal document, www.oecd.org/water.
OECD (forthcoming b), “Affordability of Water Services in Egypt”, OECD internaldocument, www.oecd.org/water.
Transparency International (2008), “Global Corruption Report”, TransparencyInternational, Berlin.
WHO (2008), “Regional and Global Costs of Attaining the Water Supply and SanitationTarget (Target 10) of the MDGs”, WHO, Geneva.


3. WATER SERVICES: THE CENTRAL ROLE OF TARIFFS – 73
MANAGING WATER FOR ALL: AN OECD PERSPECTIVE ON PRICING AND FINANCING – ISBN-978-92-64-05033-4 © OECD 2009
Chapter 3
Water Services: The Central Role of Tariffs
Well-designed tariffs are crucial for sustainable cost recovery and provide incentives touse water efficiently. Nevertheless, even in OECD countries, tariffs rarely cover the fullcosts of water services. This stems partly from an unawareness of broader economicbenefits of water and sanitation, but also from legitimate concerns about impacts onpoorer households.
But financial sustainability and affordability of services are not necessarily incompatible.Artificially low tariffs for all customers may in fact hurt poor households the most,particularly when they prevent extending services to communities that are paying muchmore from alternative sources.
Reconciling different policy objectives is a political task and should entail a transparent,democratic, participatory process. This chapter discusses how tariff levels and structurescan be defined to meet different objectives while taking into account local circumstances,and how the tariff setting process can be improved by linking the debate on tariffs withthat on service quality and efficiency of service provision.
74 – 3. WATER SERVICES: THE CENTRAL ROLE OF TARIFFS
MANAGING WATER FOR ALL: AN OECD PERSPECTIVE ON PRICING AND FINANCING – ISBN-978-92-64-05033-4 © OECD 2009
Chapters 1 and 2 made it clear that revenues from tariffs1 are an important source ofsustainable finance for water supply and sanitation (WSS). However, financialsustainability of WSS services is only one of several objectives of water policies.Therefore, tariff setting for WSS needs to reconcile a variety of objectives (e.g. economicefficiency, affordability of services for lower income households).
This chapter will consider in more depth how this difficulty can be addressed. Inparticular, it will discuss the pros and cons of a variety of tariff structures, arguing thatthese are more than just technical issues. Tariffs are core instruments of water policiesand should be considered as such. Setting tariffs requires an informed and transparentdebate about the acceptable balance between potentially conflicting objectives and aboutthe appropriate compensatory measures that may be needed to achieve such a balance.
The objectives of this chapter are to:
• clarify the multiple objectives that policy makers face when designing a tariffpolicy, the potential conflicts between them, and how tariffs can be designed tobalance different policy considerations;
• discuss the possible difficulties in reconciling the role of tariffs as part of asustainable cost recovery strategy and other objectives, particularly affordabilityconsiderations;
• indicate what factors may influence the choice of tariff levels and what drawbacksmay derive from suppressing them (discussed in part in Chapter 2);
• show how different tariff structures respond to different objectives and may helpfind a balance between them;
• discuss the peculiarities of different components of WSS services, which mayrequire the design of specific pricing mechanisms;
• highlight the importance of the tariff-setting process.
The 2007-08 OECD survey: main trends and data limitations
In 1999, OECD carried out an extensive review of water pricing practices in OECDcountries (OECD, 1999; partly updated in OECD, 2003). In 2007-08, the review ofOECD country experiences was updated (see Box 3.1) to test how well some of the trendsidentified in 1999 had stood the test of time and whether new trends were emerging. Theanalysis was extended to include experiences in non-OECD countries. The survey did notcover the pricing of water in agriculture, as this was the object of another component ofthe Horizontal Water Programme of which this work is part and will be discussedseparately in Chapter 5.

3. WATER SERVICES: THE CENTRAL ROLE OF TARIFFS – 75
MANAGING WATER FOR ALL: AN OECD PERSPECTIVE ON PRICING AND FINANCING – ISBN-978-92-64-05033-4 © OECD 2009
Box 3.1. The 2007-08 OECD survey: difficulties in data collection and solutions adopted
For OECD countries, a first round of data collection and analysis on pricing levels and structures was carriedout based on publicly available data. Information gaps were identified and a questionnaire was sent to membercountries. Country experts were given two options: they could compile data at the national level, clarifying themethodology followed for their aggregation) or provide disaggregated data collected directly from local serviceproviders (or a sample thereof, to be defined by the national expert). This choice recognises the fact that pricing,cost and other relevant WSS data is fundamentally local and that extreme care should be taken in proposingcross-country comparison on such variables.
The difficulties encountered in data collection, as well as the discussion with a number of country experts,provided valuable information concerning: (i) limitations in data availability on key aspects of the WSS sectorsat the national level, and difficulties in mobilising such information from the relevant local entities; and(ii) possible future work aimed at improving data collection, and reducing inconsistencies, in view of creating aset of core indicators that may allow meaningful comparability on policy-relevant variables across OECDcountries.
In parallel to the OECD survey, two surveys on pricing levels and structures were launched with GlobalWater Intelligence (GWI) in 2007 and 2008. These covered over 150 cities in all OECD countries, and 100 citiesin non-OECD countries on all continents, including key emerging economies (Brazil, China, India, Indonesia,South Africa) and Eastern Europe, the Caucasus and Central Asia (EECCA) countries.
Additional empirical evidence came from the data collected biennially by the International WaterAssociation (IWA), and that contained in the IB-net database managed by the World Bank. Relevant informationon topics on which data collection was expected to be difficult (e.g. cost recovery, demand elasticities) wasderived from case studies collected as part of the Horizontal Water Programme work on strategic financialplanning, those presented at an expert meeting held in Paris on 14-15 November 2007, those on EECCAcountries carried out under the EAP Task Force, and a review of recent literature carried out by a consultant.Specific studies were launched to address the recent experiences with specific “social” tariff structures and theissue of cost recovery and financial sustainability of service providers.
The following list highlights a few of the key trends for OECD countries that the2007-08 survey identified as compared to those identified in 1999. These and otherresults from the survey will be discussed in the following sections to illustrate the mainmessages that emerge from the work:
• continued real price increases – at times, substantial – for household service overrecent years, both in OECD and non-OECD countries, which may signal anincreased role of tariffs in cost recovery;
• continued decline in the use of decreasing block tariffs and flat-fee systems forhousehold tariffs, in favour of two-part fixed charge + variable fees with auniform or increasing block volumetric component (see Box 3.2 for definitions);
• limited application of decreasing block tariffs for industrial uses (or for the largeramongst them) in only a few OECD countries;
• increased application of taxes on water bills;
• increasing separation of wastewater from drinking water charges, and chargingfor wastewater on the basis of actual costs thus raising charges, with consequentsubstantial increases in the price of wastewater management services;

76 – 3. WATER SERVICES: THE CENTRAL ROLE OF TARIFFS
MANAGING WATER FOR ALL: AN OECD PERSPECTIVE ON PRICING AND FINANCING – ISBN-978-92-64-05033-4 © OECD 2009
• evidence that the response of domestic consumers to marginal price changes maybe small, while more significant – but possibly temporary – impacts on demandmay follow changes in tariff structure, and especially a shift from flat tovolumetric rates;
• continued attention to social concerns, addressed through innovative tariffstructures or parallel income-support mechanisms.
Tariff level data and their interpretation
Figure 3.1 shows the price per cubic metre of water and wastewater services faced bya household consuming 15 m3 per month in different OECD countries. 2 Data for selectednon-OECD countries are presented in Annex 3.A1. As this indicator shows the “price ofwater” perceived by final (domestic) users, data were adjusted using purchasing powerparities for private consumption. Its choice over other possible measurements of “averagetariffs” was driven by the intention to ensure comparability across countries, given theextreme variability of tariff levels and structures not just across countries, but acrossdifferent providers within each country.
Figure 3.1. Domestic price of water and wastewater services, including taxes, inselected OECD countries
USD/m3 adjusted for consumption purchasing power parity
0.690.82
1.20 1.201.38 1.45
1.66 1.691.89 1.99 2.05
2.78 2.79 2.82 2.933.10 3.15 3.16 3.25 3.27
4.41
9.45
0
1
2
3
4
5
6
7
8
9
10
Source: OECD (2009a),”Pricing Water Resources and Water and Sanitation Services”, OECDinternal document, www.oecd.org/water.

3. WATER SERVICES: THE CENTRAL ROLE OF TARIFFS – 77
MANAGING WATER FOR ALL: AN OECD PERSPECTIVE ON PRICING AND FINANCING – ISBN-978-92-64-05033-4 © OECD 2009
Water and wastewater bills differ between OECD countries, although clusters ofcountries can be identified, with ten countries falling below USD 2/m3 (two of whichwere below the USD 1 mark), nine anchored around USD 3/m3, and Denmark andScotland presenting much higher values. These two countries have made efforts toincorporate as much of the economic and other costs of WSS provision and use into theirtariffs.
But one should refrain from going too far in drawing conclusions from comparisonsof water pricing levels across countries, which may in fact be of little use, as averagingout local pricing levels can lead to a distorted picture of reality. Within and acrosscountries, prices might differ widely because costs differ, depending on the quality ofavailable natural resources and other circumstances, e.g. the possibility to use gravityinstead of electricity to pump water in the pipes or the existence of different regimes ofindirect taxation of services. Therefore, differences in prices cannot immediately beinterpreted as a sign of poor cost recovery, of efficiency gaps, of a “predatory” provideror of an ineffective regulator.
If tariff levels tell us little about their capacity to cover costs, could the solution be tocollect information directly on cost-recovery levels? In reality, this is precisely the issueon which it was harder to collect reliable information. In addition, even when suchinformation was available, its interpretation proved arduous, reducing its usefulness inassessing the contribution of tariffs to the financial sustainability of the WSS sector. First,it is very difficult to properly aggregate cost-recovery levels at the national level. Inaddition, financial sustainability depends on how free cash flows compare with the freecash needs; in order to assess this, it is not advisable to rely on a water company’saccounts, since it is almost always impossible to derive correct information on capitalcosts using these.3
The conclusion from this is that WSS pricing and its impacts should be assessedlocally. National comparisons can help give a general idea of overall trends and orders ofmagnitude, but for future work, efforts initiated with the 2007-08 OECD survey shouldcontinue and data collection at the level of local providers should be encouraged, as wellas a reflection on appropriate ways to aggregate such information so that comparability ofmeaningful indicators is possible.

78 – 3. WATER SERVICES: THE CENTRAL ROLE OF TARIFFS
MANAGING WATER FOR ALL: AN OECD PERSPECTIVE ON PRICING AND FINANCING – ISBN-978-92-64-05033-4 © OECD 2009
Tariff structures: definitions and recent trends
Box 3.2. Tariff structures: some definitions
Water and wastewater bills generally contain the following components:
• a one-time connection fee, to gain access to the service;
• a recurrent fixed charge (sometimes known as a standing charge or flat fee) that can beuniform across customers or linked to some customer characteristic (e.g. size of supplypipe or meter flow capacity; property value; number of water-using appliances);
• if a metering system is in place, a volumetric rate, which when multiplied by thevolume(s) of water consumed in a charging period gives rise to the volumetric chargefor that period;
• in some circumstances, a minimum charge is paid for each period, regardless ofconsumption.
Different forms and combinations of the recurrent elements above (with or without aconnection charge) give rise to the following tariff structures:
• Uniform vs. differentiated flat rates: In a non-metered environment, customers pay aflat rate regardless of their consumption. This can be uniform or differentiated based oncustomer characteristics, season, etc.
• Single volumetric rates with/without uniform or differentiated fixed charges: In ametered environment, a single rate per cubic metre is applied regardless of volumeconsumed. This can be charged with or without a recurrent fixed charge. The fixedcharge can also be negative (a coupon). Fixed charges and coupons can be uniform orvary according to customer characteristics.
• Increasing block tariffs (IBTs): The volumetric charge changes in steps withincreasing volumes consumed.
• Adjusted IBTs: Either the volumetric rates applied at each block or the size of theblocks is adjusted based on specific customer characteristics (e.g. family size, income).
• Decreasing block tariffs: Volumetric rates decline with successive higher consumptionblocks.
In OECD countries, with regard to household tariffs, on the sample of 184 utilities inthe GWI survey: no flat fees were found; 90 used single volumetric tariffs, of which 60coupled this with a fixed charge; 87 used increasing block tariff system, of which 2 alsoapplied a fixed charge; while 7 still resorted to decreasing block tariffs (all of them in theUnited States). The use of flat fees, however, is still reported in Canada, Mexico, NewZealand, Norway and the United Kingdom.
In a number of OECD countries, the diversity of structures applied is extreme. InCanada and the United States, most tariff structures are represented, and in countrieswhere IBTs prevail, there are often large variations in terms of the number and size ofblocks, as is the case in Italy, Mexico (Box 3.3) and Portugal.

3. WATER SERVICES: THE CENTRAL ROLE OF TARIFFS – 79
MANAGING WATER FOR ALL: AN OECD PERSPECTIVE ON PRICING AND FINANCING – ISBN-978-92-64-05033-4 © OECD 2009
Box 3.3. Tariff structures: the case of Mexico
In Mexico, tariff structures are set by each municipality, according to the specific laws thatapply to each of the federal states of the country. In most of the cases IBTs are used, usuallywith a fixed charge and a minimum consumption. level. The number of blocks varies, but it isusually high (more than five). In the case of Monterrey, one of the major cities in Mexico, thetariff structure is a parabola and the tariff is published for each cubic metre. In Mexico City(Distrito Federal), there are 14 blocks, in Tijuana, 12 blocks. Industrial tariffs are usually higherthan household tariffs. According to a census of water utilities conducted in 2004 by theNational Institute of Statistics and Geography (INEGI), 52% of the households connected to thenetwork had a meter in 2003. There are still some cases where a flat rate is used. Usually thetariffs do not explicitly indicate the amount that corresponds to water supply and the amount thatcorrespond to sanitation. A few years back some municipalities started charging a percentage ofthe tariff to cover sanitation costs. In the case of Monterrey, 25% of the tariff is for sanitation.But in Mexico City, sanitation is not considered.
Source: Mexico’s Comisión Nacional del Agua (CONAGUA) response to the OECD Water Pricing Survey,October 2008.
In non-OECD countries, in the GWI sample of 94 utilities, only 3 practiced flat fees,while the majority (57) used single volumetric rates with no fixed charges; 2 added afixed charge to that; and the remaining 31 were almost evenly split between increasingblock tariffs with – vs. without – fixed charges.
Pricing “water”: the challenge of multiple objectives
Pricing as a cornerstone of a sustainable cost recovery strategy …
Tariffs account for the lion’s share of recurrent expenditure in both OECD anddeveloping countries. In recent years, there have been considerable increases in revenuesfrom tariffs, both in OECD and non-OECD countries, as shown in Table 3.1.
The capacity to increase revenues from users is paramount to ensuring the financialsustainability of WSS services. As discussed in Chapter 2, a service provider will haveaccess to external sources of finance, such as loans, only if a sufficient and reliable streamof revenue is ensured. The role of tariffs is therefore especially important because theyconstitute the source of revenue that service providers should control better, comparedwith taxes and transfers.
The actual level of predictability of tariff levels, however, depends on the governancestructure of service provision in a country, and especially on the independence fromarbitrary political interference of the entities in charge of regulating tariffs and on theircapacity to understand the values and costs that lie behind a tariff. Only suchunderstanding will enable a tariff regulator to strike the right balance between protectingfinal users against excessive requests on the part of services providers and ensuring thefinancial viability of services. Of special importance is the way in which governancestructures deal with the process of tariff adjustment over time. The flexibility of revenuesto face unpredictable events (e.g. devaluation) is paramount. It is therefore important todefine clear procedures for tariff revisions (including data requirements, agreed-uponformulas, administrative procedures, consultation processes, etc.).

80 – 3. WATER SERVICES: THE CENTRAL ROLE OF TARIFFS
MANAGING WATER FOR ALL: AN OECD PERSPECTIVE ON PRICING AND FINANCING – ISBN-978-92-64-05033-4 © OECD 2009
Table 3.1. Tariff changes in OECD and selected non-OECD countries
Australia 2003-07 2.69 1.85 2.24 EECCA
Belgium (Wallonia) 2005-06 1.98 17.42 5.37 Armenia 2000-05 20.7
Canada 1999-04 -0.32 5.58 2.18 Azerbaijan 2000-02 12.4
Czech Republic 2000-07 3.31 1.33 3.41 Belarus 2002-06 24.6
Denmark 2000-06 .. 1.67 1.67 Georgia 2000-05 13.3
Finland 2000-08 1.26 2.29 1.88 Kazakhstan 2000-06 10.3
France 2000-05 0.07 4.29 2.12 Kyrgyz Republic 2000-05 -7.8
Germany 2000-07 -0.63 .. .. Moldova 2000-06 7.2
Greece 2000-06 -0.96 -0.52 -0.82 Russian Federation 2003-05 26.8
Hungary 2000-05 2.65 5.82 4.10 Tajikistan 2000-05 2.9
Italy 2005-07 2.44 4.41 3.33 Ukraine 2000-07 14.5
Korea 2000-06 1.23 7.39 2.79 Uzbekistan 2003-07 0.3
Luxembourg 1994-99 0.34 .. .. BRIICS
Mexico 2006-07 .. .. 3.43 Brazil 2002-06 18.7
Netherlands 2000-07 -1.33 .. .. China 2003-07 11.7New Zealand1
2003-07 -6.11 -6.52 -6.37 India n.a.
Portugal 2004-07 0.14 -0.36 0.00 Indonesia 2001-04 22.1
Spain 2000-06 0.74 10.24 3.37 Russian Federation 2000-04 38.7
United Kingdom South Africa 2002-06 17.1
England and Wales 2001-06 2.73 2.98 2.87
Scotland 2004-07 1.33 1.28 1.31
Real average annual tariff changes (%)
Country Period Water WastewaterWater andwastewater
Nominal average annual unit revenue changes (%)
Country PeriodWater andwastewater
1. OECD estimates based on data of the Metrowater Utility only (Auckland population: 420 000).
Source: OECD (2009a), “Pricing Water Resources and Water and Sanitation Services”, OECD internal document,www.oecd.org/water.
However, full cost recovery through tariffs alone is far from the norm in mostcountries, even when considering supply costs alone. Even fewer are the cases wherecountries have attempted to cover full economic and environmental costs in water prices.The cost of “institutional” components, proposed by Cardone and Fonseca (2003), arealso generally not covered through the tariff.
So what are the reasons for the difficulties policy makers have to use tariffs for costrecovery? And can tariffs be designed so as to resolve some of these difficulties? Whatfollows discusses factors that policy makers need to consider before making a decisionabout tariff levels and tariff structures.
… but also so much more, and therein lies the challenge
Water pricing represents much more than a source of finance, both for policy makersand for public perception. One of the difficulties faced by decision makers in their designand implementation is reconciling the different policy objectives and dealing with thepublic’s opposition to tariff increases. A clearer understanding of the potential conflictsbetween policy objectives, and appropriate communication with the public regardingthese, can also help reduce opposition to reform.
3. WATER SERVICES: THE CENTRAL ROLE OF TARIFFS – 81
MANAGING WATER FOR ALL: AN OECD PERSPECTIVE ON PRICING AND FINANCING – ISBN-978-92-64-05033-4 © OECD 2009
The multiple objectives pursued by water policy can be structured around fourdimensions:
• Ecological sustainability: As a scarce and vulnerable natural resource, watershould be used so as to protect the basic ecological functions of natural capitaland preserve it for future generations. Water savings are part of this objective,which requires avoiding wasteful uses that put unnecessary pressure on theresource (use efficiency). But a reduction in water use is not an objective per se.What matters is the capacity of available resources to provide the desiredecological functions over time. It may be possible to do so even with decliningwater resources, so long as man-made capital (e.g. more efficient irrigationtechnologies, technologies for wastewater re-use) can compensate for a reductionin water availability.
• Economic efficiency: As a valuable economic good, water should be allocated tothe uses that maximise overall benefits to society (allocation efficiency). In thiscontext, uses to preserve ecological functions should be given the same status asother uses. Efficient allocation should apply to other economic resources as well.This means that unnecessary investment should be avoided if the value of theservices or functions they provide is lower than their cost. There is a clear synergybetween this objective and the ecological sustainability objective, as reducing thewasteful use of water will lead to lower requirements for investment in theexpansion of water supply. This objective also supports financial sustainability ofservice provision. The role of regulation (both of resource allocation and of costlevels) is paramount in this area.
• Financial sustainability: As activities requiring investment in costlyinfrastructures, water resources management and WSS service provision shouldbe kept viable over time and should be able to attract capital, skills andtechnology by adequately compensating them. What matters for financialsustainability is the level of tariffs, the reliability of their automatic adjustments(e.g. to inflation) and their flexibility in adjusting to changing circumstances(e.g. changes in cost structure). Thus, not only their level will matter, but also thetransparency and stability of the tariff-setting process, which needs to be informedby reliable data on cost levels and dynamics at the local level. As discussed inChapter 2, the minimisation of lifecycle costs of infrastructures (cost efficiency) isalso key. Again, regulation is crucial to ensure that cost recovery is only forefficient costs.
• Social concerns: As a public interest good, acceptable levels of WSS servicesshould be accessible and affordable to all, including to lower-income groups. Theregulator will need to avoid that water pricing becomes a way for providers,which generally operate in a natural monopoly situation, to capture monopolyrents in terms of excess profits or reduced operational inefficiency. When dealingwith social concerns, the focus is primarily on how to protect vulnerable groupsand ensure that they have access to water services that remain affordable overtime. In this context, it is not the average tariff level that matters, but the way inwhich costs are allocated across different groups through tariff structures.

82 – 3. WATER SERVICES: THE CENTRAL ROLE OF TARIFFS
MANAGING WATER FOR ALL: AN OECD PERSPECTIVE ON PRICING AND FINANCING – ISBN-978-92-64-05033-4 © OECD 2009
Choices concerning policy objectives
Given the multidimensional nature of water values, the policy objectives describedabove may sometimes be in conflict with one another. These conflicts (or “trade-offs”)need to be better understood, as some of them may not be as stark as they appear at firstsight, while other “hidden” conflicts may go unnoticed. Striking a balance betweendifferent objectives then translates into specific challenges for the design of water-pricingpolicies (Massarutto, 2007). “Striking a balance” when designing tariffs does not meanthat it may be possible or advisable to meet one objective at the detriment of the other,but rather that the tariff alone may not be able to achieve all objectives at the same time.Additional instruments may have to be used alongside tariffs.
An example of such conflicts is social demands and environmental sustainability.Available ecological functions of water resources are constrained by physical scarcity,depending on hydrologic factors and by the set of institutional rules, property rights andshared cultures that, in any given historical context, frame the spectrum of availablealternatives. To a certain extent, availability can be incremented by adding manmadecapital (e.g. by investing in building new reservoirs or reducing losses in the system).This has a cost and takes time to implement. A mismatch can arise in this context: (i) ifthe community expressing the demand is too poor to afford covering these costs, andother communities are unwilling to cross-subsidise the low-income community throughhigher taxes or higher water prices; or (ii) if these costs are higher than the value of therequired environmental functions (contradicting the efficiency objective).
The trade-offs, and the capacity of institutional and physical systems to deal withthem, evolve over time. Income improvements may enable a community to face the costsneeded to obtain previously unaffordable services; technological improvements mightrender its provision cheaper; more effective governance institutions might emerge; sociallearning processes might generate new cultural frameworks enabling the community toaccept previously unacceptable solutions.
But in the short run, water resources may face a carrying capacity limit imposing anupper limit to the societal water needs that can be met; the effectiveness of managementsystems is crucial in determining whether a solution can be found. The institutionalsetting imposes a constraint on which governance issues can be solved in the short-to-medium term (Saleth and Dinar, 2004). Resolving institutional failures, including theability to implement appropriate water pricing, is therefore crucial and confirms theimpact of improved governance on financing for the water sector.
Implications for water pricing
To define water-pricing strategies, policy makers need to: (i) have an informed andtransparent debate on the synergies and possible conflicts between objectives; (ii) make adecision (based on a democratic and inclusive process) about the acceptable balancebetween them, taking into consideration specific local conditions; and (iii) decide whichcombination of policy instruments to use and the role played by pricing mechanisms inthis “policy mix”, as tariffs alone may not be able to achieve all objectives.
To reach different policy objectives, there is a need to consider three aspects of tariffsetting: their average level, their structure and the process for setting and adjustingtariffs. The focus now is on the way in which each of them is relevant in achievingdifferent objectives. The analysis is based on data and case studies collected from OECDand non-OECD countries, as well as on the most recent literature.

3. WATER SERVICES: THE CENTRAL ROLE OF TARIFFS – 83
MANAGING WATER FOR ALL: AN OECD PERSPECTIVE ON PRICING AND FINANCING – ISBN-978-92-64-05033-4 © OECD 2009
Tariff structures to address the policy trade-offs
Financial sustainability vs. economic efficiency: the “hidden” trade-off
One trade-off that is seldom recognised is the one between financial sustainability andeconomic efficiency. In situations of water scarcity or infrastructures nearing capacity,economic efficiency requires volumetric pricing based on the marginal cost (MC) ofproviding water. Neoclassical economics tells us that water prices should reflect themarginal cost of supplying an additional unit of water (including its scarcity value and thevalue of its negative vs. positive externalities, e.g. negative environmental impacts vs. thebenefits to the community as a whole of improved sanitation for one household4). Thiswould bring users to balance the benefits they perceive from each additional unit ofconsumption against its MC to society, and the resulting allocation would maximisesocietal economic benefits. The theory states that MC pricing would also provideincentives for optimal decision making regarding investment in infrastructure.
But there are numerous limitations with the use of MC pricing for retail WSSservices:
• It requires volumetric pricing, which presupposes that consumption is metered (ormeasured by an indicator that is a close proxy to actual consumption), which isnot always the case.
• It requires that each user faces a price that reflects the MC of providing thatspecific user – a difficult task, requesting considerable amounts of data, even ifthe calculation were limited to pure supply costs.
• MC pricing would require tariffs to change as the water scarcity changes (overtime and space).
• Similarly, it would require tariffs to change based on how close waterinfrastructure is to being used to its maximum capacity. Water infrastructure ischaracterised by significant lump-sum investment. Its average cost is high, butgenerally declining due to economies of scale and, as long as it is working belowcapacity, its MC is low. MC pricing would thus generate extreme oscillations intariffs, with significant increases as infrastructures approach capacity and largereductions after an additional, lump-sum investment has been made; andsignificant decreases when demand from a single major user drops. This is notonly impractical, but also generates financial instability for service providers.Average incremental cost5 has been proposed as an alternative pricing rule toaddress this concern.
• WSS services are characterised by high fixed recurrent costs (e.g. meter-reading).A pure variable tariff based on a MC pricing rule would not be able to cover forthese, requiring the use of a two-part tariff to cover them through a fixedcomponent of the bill. The fixed charge maybe so large as to trump the incentiveeffect of the volumetric, MC-based charge.
• Specific requirements of water systems make MC pricing even more complex,e.g. the need to design infrastructure to meet the peak output, or the requirementfor fire fighting.

84 – 3. WATER SERVICES: THE CENTRAL ROLE OF TARIFFS
MANAGING WATER FOR ALL: AN OECD PERSPECTIVE ON PRICING AND FINANCING – ISBN-978-92-64-05033-4 © OECD 2009
These points indicate how the best tariff-setting rule from the point of view ofeconomic efficiency may be inconsistent with sustainable cost recovery.
Another aspect to take into consideration is the impact on financial sustainability of achange in tariff regime, meaning the introduction of a different tariff structure (e.g. fromflat to volumetric rates) or the substantial change in some of its parameters (e.g. asignificant increase in the marginal rate of an IBT structure). Such significant changesmay lead to a large, but possibly temporary, reduction in consumption that may havenegative effects on revenues. This has been observed in a number of cases, e.g. in eastBerlin (see Naumann and Wissen, 2006), and in most EECCA countries. The most recentevidence of users’ responses to price changes is summarised in Box 3.4.
Thus, while the objective of financial sustainability is compatible with many differenttariff structures, the security and predictability of cash flows is higher the more tariffschedules are based on fixed charges rather than variable charges. This is particularly truein the initial phases of the introduction of volumetric charges or of a large increase in themarginal tariff rate.
Box 3.4. Elasticity of water demand to marginal price changes vs. tariff regime1
Price elasticity of demand measures the responsiveness of demand to price changes, definedas the percent change in demand that would be expected from a small percent increase in price.
Low price elasticity of drinking water demand by urban households: The estimatesfound in European research in the last 35 years consistently report a low responsiveness ofdemand to marginal price changes. Elasticity ranges of -0.1/-0.25 for yearly average demandsprevail, i.e. for any 10% increase in price, a 1%-2.5% decrease in demand would be expected.Including Australia and United States, these would stretch the range to –0.1/-0.4 (Herrington,2006).
Larger effects of tariff structure changes (Herrington, 2007, pp. 21-22): Evidence wasfound in the United States and the city of Barcelona, where shifts from simple volumetric ratesto increasing block tariff (IBT) structures2 (or the addition of an extra block to the structure)have been associated with average demand reductions of 10% to 14%. Interpretation of this datais difficult, however, since in most of the case studies either a seasonal tariff or a general waterconservation campaign were being simultaneously introduced, while no attempts were made todisentangle the demand effects due to different “initiatives”, which can be significant, as shownby US evidence on seasonal tariffs and surcharges. The National Metering Trials in the UnitedKingdom (1988-92) estimated the effect of introducing metering in areas where previously flatrates were charged. In the six summer months since the introduction of metering, demanddeclined by 20% in two trial areas with summer tariffs, 62% and 54% higher than winter rates,respectively. In seven other areas, reductions in summer demands were estimated at about 10%.Winter-month reductions were very similar.3
Please note that, when metering is voluntary, the data need to be interpreted carefully, as itmay be that only households who know they are consuming less than assumed by the flat ratemay volunteer to start metering their consumption.
1. For details, see OECD (2009a).
2. All IBTs in the case studies, save those of Barcelona, were of the traditional variety.
3. These results are also explained in Section 3 of Herrington (2007).
3. WATER SERVICES: THE CENTRAL ROLE OF TARIFFS – 85
MANAGING WATER FOR ALL: AN OECD PERSPECTIVE ON PRICING AND FINANCING – ISBN-978-92-64-05033-4 © OECD 2009
Financial sustainability and affordability: how to achieve both through tariffsand other measures
The potential conflict that most often sparks controversy is that between financialsustainability and social concerns. The “user pays” or “polluter pays” principles that areso often quoted as the guiding principles for water pricing (as enshrined in the EU WaterFramework Directive of 2000, for instance) are seen by some, and may sometimes be, atodds with the need to protect social rights and manage water resources as a common good(Hoekstra, 1998). And yet, fulfilling the two objectives simultaneously may actually beeasier than for other trade-offs.
In this context, not only the levels of average tariffs, but especially the tariffstructure and the choice of cross-subsidisation mechanisms – as well as the use of othersupport measures – play a role. A major challenge is therefore to understand whetherpricing strategies can be designed to achieve both objectives (to different degrees) andwhat issues other than price are relevant in achieving the desired level of both objectives.
The importance of objective measures of affordability
When addressing affordability concerns through tariffs, it is paramount to base thedebate on the precise definition and actual measurement of affordability constraints. Todetermine whether an affordability constraint exists, it is necessary to: (i) collect reliabledata on income distribution and current/projected water use in an area; and (ii) have anopen debate and to decide what levels of income can be acceptably spent on WSSservices in that area. In the absence of such objective bases, there is a risk that the processbe driven by “political affordability”.
Keeping tariffs artificially low for all customers may result in a vicious circle ofunderfunded service providers, insufficient investment, collapsing infrastructure anddeteriorating services that further reduce the benefits that users receive from them andtherefore their willingness to pay (see Figure 1.1 in Chapter 1). Collapsing water systemscan hurt lower-income users the most, and especially those who currently do not haveaccess to water services, as low tariffs (in the absence of reliable transfers that may makeup for the missing revenues) may prevent extensions of networks to poorer communities,forcing them to continue paying much higher prices to obtain water that may be ofinferior quality to piped water from other sources, including informal providers.
Affordability for society as a whole vs. affordability for vulnerable groups
To address affordability, policy makers need to answer two questions.
The first is what portion of the costs of providing the service should be coveredthrough revenues from tariffs. The answer to this question should take into considerationthe affordability of the (lifecycle) costs of providing services for society as a whole, and afirst step is therefore to compare the bill resulting from proposed tariff levels withaverage household incomes. If the average bill represents an unacceptable burden for thepopulation as a whole, either the amount of costs to be recovered through tariffs or thecosts themselves need to be reassessed. This question is best addressed as part of astructured policy dialogue on strategic financial planning for the WSS sector (seeChapter 2), which also discusses cost drivers and complementary sources of finance. Inpractice, such a decision requires reliable data on costs at the local level. As previouslymentioned, in many countries (including OECD countries, as revealed by the difficulty in
86 – 3. WATER SERVICES: THE CENTRAL ROLE OF TARIFFS
MANAGING WATER FOR ALL: AN OECD PERSPECTIVE ON PRICING AND FINANCING – ISBN-978-92-64-05033-4 © OECD 2009
completing the OECD survey questions on these issues) such data are not easilyavailable, making it difficult to come to any conclusion regarding the “appropriateness”of costs to be covered by tariffs. The answer to this question helps define the tariff levelin a country or region.
The second question is how tariff revenues should be generated across differentincome groups, household types, etc. – i.e. “who should pay for what?” Once overallaffordability for society is assessed, the attention should shift to access to services andaffordability for lower-income groups. This is the concept of “micro-affordability”, whichmeasures affordability for vulnerable groups and may require specific measures tosupport them. Levels of cross-subsidisation across regions in a country and across usergroups (e.g. different sectors, water use levels, or income levels) derive from the answergiven to this question. The answer to this question will help define the appropriate tariffstructure and possibly indicate the need for the creation of special non-tariff income-support mechanisms for the poorest populations.
Figures 3.2 and 3.3 show that in OECD countries, while average water andwastewater bills do not represent a considerable burden for the average household, theywould represent a considerable share of disposable income for poorer families innumerous countries, particularly in Poland and Turkey.6 This is why many countries haveintroduced “social tariffs”.
Affordability needs to be assessed locally
Affordability needs to be assessed locally for two reasons.
First, an assessment of the impacts on poorer households at the national level, asreflected in Figure 3.3, may conceal localised situations of vulnerability, which mayrequire the design of appropriate, local solutions, as demonstrated in the case of Portugal(Box 3.5).
The other aspect of affordability that needs to be decided locally is the appropriate“threshold” beyond which households should receive support, rather than relying oninternational limits (3%-5% of household income is an often-quoted figure). The latter donot take account the current shares of income currently spent on water and sanitation byhouseholds, which could be much higher (e.g. when unserved households need to rely oninformal vendors who often charge prices that are orders of magnitude higher than thosefor network services). In these cases, providing a service whose tariff generates a bill thatis above international thresholds would still represent a substantial improvement. Theyalso ignore actual willingness to pay for improved services of local populations. This maybe higher than indicated by international affordability thresholds, particularly indeveloping countries where the poor may be willing to pay more than expected for betterservices even for sanitation services, as demonstrated by the Mumbai Slum SanitationProject (see Box 3.6).
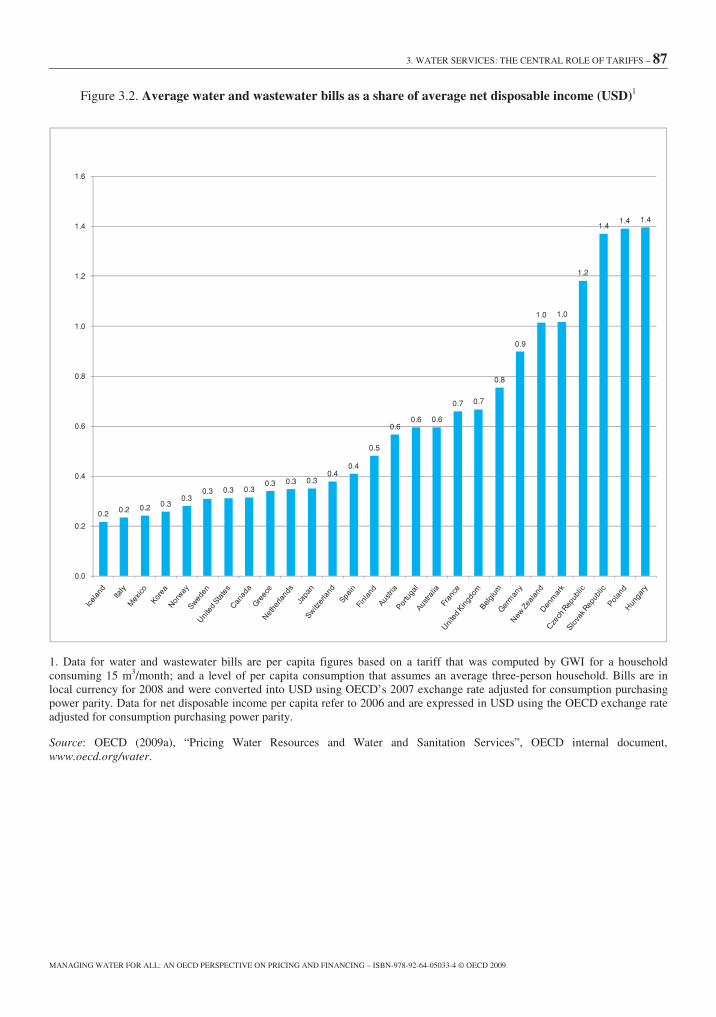
3. WATER SERVICES: THE CENTRAL ROLE OF TARIFFS – 87
MANAGING WATER FOR ALL: AN OECD PERSPECTIVE ON PRICING AND FINANCING – ISBN-978-92-64-05033-4 © OECD 2009
Figure 3.2. Average water and wastewater bills as a share of average net disposable income (USD)1
0.2 0.2 0.2 0.30.3
0.3 0.3 0.30.3 0.3 0.3
0.40.4
0.5
0.60.6 0.6
0.7 0.7
0.8
0.9
1.0 1.0
1.2
1.41.4 1.4
0.0
0.2
0.4
0.6
0.8
1.0
1.2
1.4
1.6
1. Data for water and wastewater bills are per capita figures based on a tariff that was computed by GWI for a householdconsuming 15 m3/month; and a level of per capita consumption that assumes an average three-person household. Bills are inlocal currency for 2008 and were converted into USD using OECD’s 2007 exchange rate adjusted for consumption purchasingpower parity. Data for net disposable income per capita refer to 2006 and are expressed in USD using the OECD exchange rateadjusted for consumption purchasing power parity.
Source: OECD (2009a), “Pricing Water Resources and Water and Sanitation Services”, OECD internal document,www.oecd.org/water.
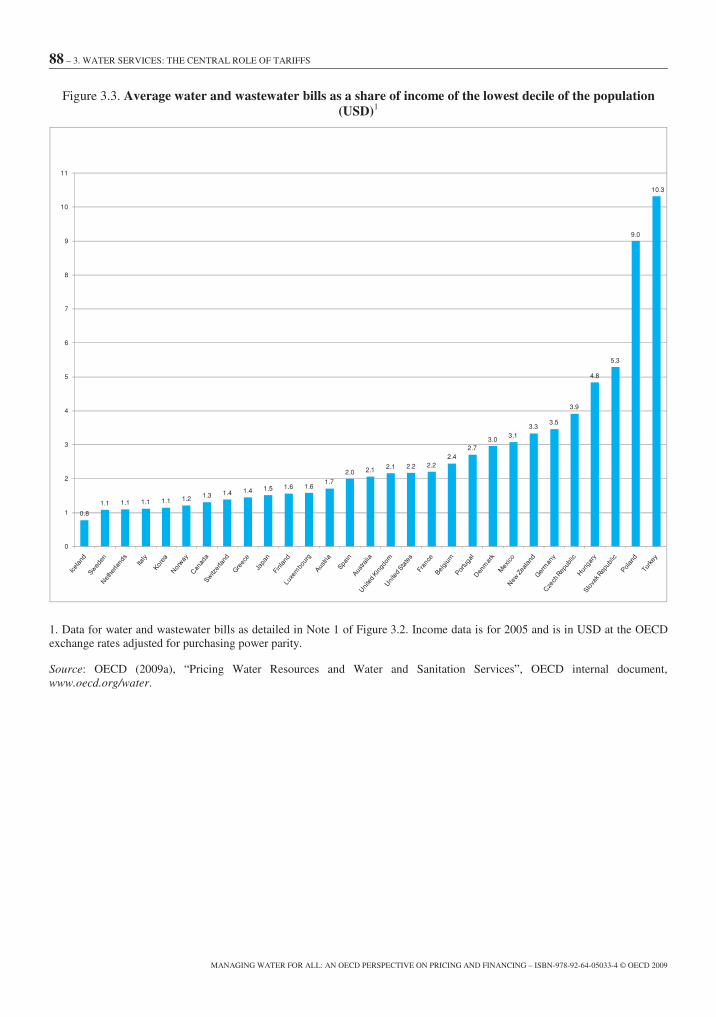
88 – 3. WATER SERVICES: THE CENTRAL ROLE OF TARIFFS
MANAGING WATER FOR ALL: AN OECD PERSPECTIVE ON PRICING AND FINANCING – ISBN-978-92-64-05033-4 © OECD 2009
Figure 3.3. Average water and wastewater bills as a share of income of the lowest decile of the population(USD)1
0.8
1.1 1.1 1.1 1.1 1.2 1.3 1.4 1.4 1.5 1.6 1.61.7
2.0 2.1 2.1 2.2 2.22.4
2.73.0
3.13.3
3.5
3.9
4.8
5.3
9.0
10.3
0
1
2
3
4
5
6
7
8
9
10
11
1. Data for water and wastewater bills as detailed in Note 1 of Figure 3.2. Income data is for 2005 and is in USD at the OECDexchange rates adjusted for purchasing power parity.
Source: OECD (2009a), “Pricing Water Resources and Water and Sanitation Services”, OECD internal document,www.oecd.org/water.

3. WATER SERVICES: THE CENTRAL ROLE OF TARIFFS – 89
MANAGING WATER FOR ALL: AN OECD PERSPECTIVE ON PRICING AND FINANCING – ISBN-978-92-64-05033-4 © OECD 2009
Box 3.5. Tariff policy reforms based on affordability considerations: the case of Portugal
As part of the process leading to the design of its proposed tariff reform, the economic regulator of WSSservices in Portugal, IRAR, carried out an affordability study. This identified geographically concentratedclusters of population that would fall below the affordability threshold, which had been set at 3% of householddisposable income. While over 19% of Portuguese households fell below the income threshold of one minimumwage, only 10.5% faced bills in excess of the affordability criteria. These were concentrated in 60 out of309 municipalities in the North and Tagus Valley regions, where 15-30% of households would face unaffordablebills. The affordability study, however, also showed that WSS services do not pose an affordability problem forsociety as a whole, as they represent a very small portion of overall expenditure by households on utility services(including electricity, gas, etc.) and are also much smaller than other expenditure categories (e.g. the yearly waterbill is less than half the average annual expenditure on tobacco products).
The design of the tariff reform considered these results by: (i) allowing flexible solutions in differentmunicipalities to address geographically localised affordability problems; (ii) including support from IRAR tolocal service providers on ways to manage the transition to financial sustainability; and (iii) structuring acommunication plan to the public to clarify the real situation with regard to the weight of WSS costs forPortuguese households.
Source: Pires, J.S. (2007), “Consumer Tariffs in Practice: The Portuguese Experience”, presented at the OECD ExpertMeeting on Water Pricing and Financing, 14-15 November 2007, Paris, available at www.oecd.org/water.
Box 3.6. The Mumbai Slum Sanitation Project (Water and Sanitation Programme)
Challenges/opportunities
• 6.2 million out of 11.5 million of Mumbai’s population live in approximately 2 000 slums, cramped in8% of the city’s area.
• Most slum households cannot have individual toilets; roughly two-thirds of community toilet blockswere in disrepair.
• Estimated 1 in 20 people compelled to defecate in the open.
The bases for the approach in designing the project
• Extensive preparation: Required by the use of a demand-responsive participatory approach based oncommunity mobilisation – wherever possible through existing community-based organisations (CBOs).
• Local participation in financing and management: With incentives for private contractors, CBOs andnon-governmental organisations (NGOs) to partner, and requiring household contributions formembership.
• Professional service provision: Operation and maintenance (O&M) managed by CBOs based on aMemorandum of Understanding with the municipality and high technical standards forconstruction/service: 24-hour water and electricity, design of disabled and children’s toilets, etc.
• Pricing and finance: Users were required to contribute to capital cost, and O& M cost recovery wasensured through memberships and user fees.
Results
• 330 community toilet blocks constructed with more than 5 100 seats; estimated 400 000 beneficiaries.• Mumbai now allocating USD 10 million/year from its own budget to scale up city-wide.• Approach widely disseminated and incorporated in India’s National Urban Sanitation Policy.
Source: Revels, C. (2007), “Implementing the OECD Water Project – Trends, Opportunities and Challenges: LessonsLearned from Three Projects”, presented at the OECD Expert Meeting on Water Pricing and Financing, 14-15 November,Paris, available at www.oecd.org/water.

90 – 3. WATER SERVICES: THE CENTRAL ROLE OF TARIFFS
MANAGING WATER FOR ALL: AN OECD PERSPECTIVE ON PRICING AND FINANCING – ISBN-978-92-64-05033-4 © OECD 2009
In developing countries, it is becoming ever clearer that the sustainability of anyinvestment will depend on the capacity to tap local users for financing, including lower-income users. Evidence from numerous undertakings7 indicates that for this to bepossible, local users need to be extensively consulted in order to assess what solutions areviable and desirable for them.
For an assessment of affordability of solutions at local levels and the design ofappropriate tariff structures, it is becoming more common to carry out beneficiaryassessments to elicit final users’ preferences, e.g. Uganda’s district-level strategies andMozambique’s work in peri-urban areas around Maputo.8 It is therefore paramount thatsufficient funding (from donors if these finance projects/programmes directly, or fromcentral budgets if support is provided on the basis of sector-wide approaches or budgetarysupport) be allocated to participatory project preparation activities, including affordabilityassessments.
Achieving both financial sustainability and affordability: tariff structures andother measures
In both OECD and non-OECD countries, a variety of approaches have beendeveloped to mitigate or offset the impacts of tariff increases on the poorer sections of thecommunity. A recent survey (Smets, 2008) showed that over 45 countries have put inplace targeted measures to address affordability problems, while still trying to movetowards tariff levels that improve cost recovery.
“Social” tariffs have two separate aspirations: (i) to help the poor deal withaffordability constraints by charging “fair and affordable” tariffs; (ii) to ensure“equitable” access for all households to a minimum amount of drinking water at very lowprices or free of charge. Their design need not be at odds with financial sustainabilityobjectives, which can be pursued by resorting to cross-subsidisation across user groups.Different criteria can be used for this: large users subsidising small users, certain usercategories subsidising others, certain areas of a city subsidising others, etc. Compared toincome-support measures, they can be implemented by the utility and do not draw on thecentral government budget if appropriately implemented.
The effectiveness of tariff measures to target the poor can sometimes be questioned.Some tariff structures, such as increasing block tariffs, with a first “subsistence” blockprovided at zero or very low prices, have been seen as meeting both requirements andhave been adopted by a large number of OECD and non-OECD countries alike. Theassumption behind their adoption was that they would enable poor households to haveaccess to a basic level of water services for free or at low cost, while at the same timecontributing to cost recovery by providing a cross-subsidy from larger water users andproviding an incentive to conserve water. But the actual experience with theirimplementation has shown that IBTs are regressive in countries with incompletenetworks, where the poor are generally not connected and therefore do not benefit fromthe consumption subsidy by definition. Even with complete networks, a number ofauthors (see Boland and Whittington, 2000; Whittington, Boland and Foster, 2002;Komives et al., 2005) found that IBTs are rarely better than neutral (i.e. than a situationwhere subsidies are randomly distributed with no regard for the needs of recipients). Partof this results from the flawed design of IBTs in a number of countries (e.g. the lack ofattention given to their impact on large poor households), but adjustments in their designcan improve their capacity to target the intended population, but cannot completelyovercome the shortcomings.

3. WATER SERVICES: THE CENTRAL ROLE OF TARIFFS – 91
MANAGING WATER FOR ALL: AN OECD PERSPECTIVE ON PRICING AND FINANCING – ISBN-978-92-64-05033-4 © OECD 2009
To support policy makers in their choice of tariff structure, a matrix is available inAnnex 3.A2 which relates a number of prevalent or innovative tariff structures to the fourpolicy objectives identified previously. Two aspects are especially important indetermining the success of tariff structures in addressing both financial sustainability andaffordability considerations. First, for financial sustainability to be respected, a non-marginal number of users will have to pay more than the long-term average cost ofservice provision. In reality, sometimes the “cross-subsidisation” does not take place andtoo many users end up paying subsidised rates, thus eroding the utility’s finances andequating with a subsidy paid by taxpayers (if taxes fill the financing gap) or by futuregenerations if infrastructure is allowed to collapse (see Komives et al., 2005).
A second key aspect is the capacity of tariff structures to appropriately target thepoor. While perfect targeting (in terms of not excluding any user that would qualify toreceive a subsidy and not providing subsidies to any user that does not quality forsupport) is too costly to achieve, there are a few basic considerations that can help.
As the annexed matrix shows, the targeting effectiveness of many tariff structures,including traditional IBTs, hinges on the assumption that lower-income householdsconsume less water than higher-income ones, so that structures that subsidise low levelsof consumption are considered to be progressive. But this is only true if income elasticityof residential water demand – i.e. the expected percent increase in water demand linkedwith a percent increase in income levels – is non-negligible. In this respect, the mostrecent evidence for OECD countries indicates that income elasticities may be rather low.From the analysis of various sources,9 it emerges that a range of +0.2 to +0.3 is the mostreliable in terms of income elasticity of demand for residential water. Komives et al.(2005) confirm that similarly low estimates are valid for developing countries as well. Inthis case, the poor may not necessarily consume less water than the rich.
In reality, poorer households are often larger households, so that they may end upconsuming more than smaller, higher income units. In a number of countries (includingBelgium in the Flanders region, Greece, Luxembourg, Portugal and Spain), tariffstructures were adopted or are being considered that take account of the number of peoplein each household in order to avoid penalising larger families. The difficulty with this andother “adjustments” is the detailed information on occupancy or other householdcharacteristics, which may not be available without additional costs for the administrationor the utility, or which could be met with opposition. In addition, the “social stigma”attached by some households to the fact of having to declare themselves as destituteshould be taken into consideration, as this may reduce the uptake of subsidised options byhouseholds who would otherwise be eligible.
A second factor may reduce the effectiveness of any tariff structure in deliveringsubsidies to the poor: the degree to which poor populations have access to networkservices whose consumption is subsidised. If access is systematically skewed against thepoor, any tariff structure that provides negative incentives (or insufficient funds) for theextension of services to new areas will be regressive. In these cases, subsidising accesshas been demonstrated to be more effective than subsidising consumption. In areas whereaccess is still low, it has been shown that the targeting performance of consumption-basedsubsidies is lower than that of connection subsidies (Komives et al., 2005).
It follows that tariff structures can be designed to achieve both financial sustainabilityand access to affordable services. However, no single structure works in all situations.Different structures can respond to affordability considerations in specific contexts

92 – 3. WATER SERVICES: THE CENTRAL ROLE OF TARIFFS
MANAGING WATER FOR ALL: AN OECD PERSPECTIVE ON PRICING AND FINANCING – ISBN-978-92-64-05033-4 © OECD 2009
(i.e. based on considerations of current/prospective access, social norms, infrastructureavailability, etc.).
In addition to tariff-related measures, solutions include:
• Income support. Measures providing income support aim to compensate poorhouseholds for increases in the prices of services of public interest that are judgedto be unacceptably burdensome. The support may be directly linked to water use,e.g. support may be provided if the water bill is above a certain percentage ofhousehold income, or may be calculated to maintain an absolute level of incomeafter the utility bill is paid. It can be paid either directly by the government to theutility or through a voucher system. Alternatively, the support may not be linkedto water consumption, but to income levels. The people receiving the support canchoose how to spend it – on water or on other goods and services. The cost ofincome support measures can fall on the state budget or on the utility. If combinedwith appropriate water charges, it does not encourage over-consumption of water.What these instruments require, however, is the reliability of data on incomedistribution or the capacity by households to face the transaction costs that may beentailed by voluntary programmes (e.g. Chile, Spain). The data requirement andadministration of such programmes also have a cost and may put strain on thecapacity of public administrations.
It is interesting to note that flat fees are far easier to integrate into social securitysystems than variable tariffs, e.g. they can be easily integrated into housingallowances (as was the case in the United Kingdom before the 1986 reform. Suchmechanisms can radically change the burden of payment on recipients of socialsecurity payments.
• Facilitating payments. In many countries, householders are not disconnectedfrom the water supply system even if they are unable to pay their water bills. Inpart this is because water is essential for life and dignity, but also because of thehigh reconnection costs. In such cases, utilities in many OECD countries workwith consumers to make them aware of how to reduce water consumption, tomanage their budgets by paying water bills at short intervals, and to provide otherforms of advice and assistance to ensure that consumers have access to services.
Pricing sanitation and wastewater management: a special challenge
Chapter 1 pointed out that there are reasons that may justify a different approach tofinancing sanitation services – defined as the set of activities from basic sanitation towastewater treatment, including both centralised and decentralised solutions.
In OECD countries, investment needs in wastewater management are still substantial,due to the need to extend or upgrade wastewater treatment facilities to meet morestringent wastewater treatment standards or to the need to renew and replace agingsewage networks (see Chapter 1). Under specific conditions, innovative approaches to thescale and scope of selected sanitation services (e.g. decentralised solutions coupled withthe possibility of reusing treated wastewater for non-potable uses) may be explored as acost-effective alternative. New payment mechanisms may be established in these cases,but their definition and regulation may not be easy. In some countries, regulations need tobe adjusted for such solutions to become feasible and attractive (see OECD, 2009b).
3. WATER SERVICES: THE CENTRAL ROLE OF TARIFFS – 93
MANAGING WATER FOR ALL: AN OECD PERSPECTIVE ON PRICING AND FINANCING – ISBN-978-92-64-05033-4 © OECD 2009
In many developing countries, extending access to basic sanitation facilities is still amajor challenge. The disposal of waste from diffuse solutions or of wastewater fromnetwork solutions is often inappropriate. Treatment of wastewater is often non-existent.On the other hand, urban sanitation projects that include wastewater treatment andsewerage have often focused on improving services to those already served, but usuallyfailed to serve the slums and peri-urban areas. Serving the slums is difficult for utilitiesdue to land tenure and planning issues and the need to use low-technology, intensiveengagement approaches. Many wastewater treatment plants in developing countries areun- or under-utilised because they are oversized compared to sewerage flows; asinvestment in basic sanitation and wastewater collection investment have not kept up; useinappropriate technologies compared to the type of wastewater that reaches them; and areplagued by low cost recovery and high operating costs.
But there is hope. Examples from developing countries, including from lower-incomeperi-urban areas, show that users may be willing and able to contribute to sanitationsolutions that are deemed appropriate, and in whose design and management they areinvolved (see Box 3.6 for an example).
Given the staggering needs for funds in the sanitation sub-sector, these challengescannot be tackled all at once. A phased approach to investment in sanitation may beneeded and different payment mechanisms may need to be devised to balance thefinancial sustainability of services, social sustainability in terms of access to adequate andaffordable sanitation facilities, and environmental sustainability in terms of adequateprotection of the water resources base.
There are three challenges that are common to most sanitation activities:
• Users’ willingness to pay is generally lower than for drinking water, particularlyfor wastewater management services (while they may be comparable for basicsanitation, as demonstrated by the high private investments that some householdsundertake to build latrines), while investment requirements are often larger.
• The solidarity/fairness issue may include stakeholders other than the serviceusers.
• Sanitation services can be provided by entities that are separate from the onesproviding drinking water, and whose cost structure and basis for pricingcalculations may be completely different. This is particularly true for basicsanitation, when diffuse solutions are chosen (from shared latrines to septictanks). In this case, using a wastewater charge based on volumetric waterconsumption would not make sense, given that the main cost component is linkedwith the emptying of waste collection devices. A pricing structure linked with thenumber of emptying trips per year may be more appropriate.
With regard to the first two issues, in developing countries the high costs of hardwarefor diffuse solution or high connection charges for network solutions may discourageaccess to adequate sanitation. Authorities are faced with a conundrum. Onsite sanitationstructures (e.g. latrines) are considered private goods, and often are legally defined assuch, so that their costs should be borne by single households. However, if lack offinancial support discouraged their construction or use, should subsidies be used toencourage a behaviour that would otherwise have negative health impacts on thecommunity? Should connections or hardware be subsidised?

94 – 3. WATER SERVICES: THE CENTRAL ROLE OF TARIFFS
MANAGING WATER FOR ALL: AN OECD PERSPECTIVE ON PRICING AND FINANCING – ISBN-978-92-64-05033-4 © OECD 2009
The fact that benefits of sanitation accrue not only to the household, but also to thecommunity (or at the regional/national level for wastewater treatment) provides arationale for public intervention in the financing of the sector, including through the useof subsidies to cover investment or other costs (so long as these do not distort investmentdecisions in favour of oversized or costlier solutions, are appropriately targeted andtransparent).
They also open up new possibilities to share costs over a broader pool of“beneficiaries” that enjoy the positive externalities of the service – extending the “userpays principle” beyond the direct “users” of a service. For instance, specific “fees” can beset to apply to all residents whether they are connected to a wastewater treatment plant ornot. In some OECD countries, however, this is not possible. In the case of Italy, forinstance, the judicial system ruled that utilities cannot charge users for wastewatertreatment services that they do not receive.10 Another mechanism would be a paymentsscheme involving transfers from downstream to upstream communities, similar topayment for ecosystem services used in a number of countries to support landmanagement in upper reaches of a watershed that protect water resources (also seeChapter 5).
Notes
1. In this chapter, “tariff” indicates in general terms the price users pay for water andsanitation services. This price can have different structures and include differentcomponents. “Charge” refers to specific components of this tariff. When discussingpricing instruments for water resources management, “charge” can be used to refer tothe price paid for abstraction or pollution of water.
2. This includes the recurrent fixed charges and volumetric charges, as well as anyindirect taxes imposed on the WSS bill. The estimates were based on replies bymembers to the OECD questionnaire concerning the water and wastewater bill facedby a household consuming 15 m3 per month. The choice of 15 m3 per month wasdriven by the fact that most OECD countries use this or amounts close to this as anindicative consumption level, and for comparability with GWI survey data. If no replywas obtained, the estimation was based on publicly available data submitted forvalidation to OECD members, sometimes based on different levels of averageconsumption.
3. In the literature, the most important differences are traced back to: (i) accountingpractices, especially for defining asset values; and (ii) the remuneration of capital,which depends on how the risks are allocated. An attempt is being made, as part ofthis OECD programme, to develop a more useful methodology for assessing costrecovery and long-run financial viability. The method is being applied to a sample ofutilities in Germany, Italy and the United States
4. Although threshold effects may exist, such that below a certain level of sanitationcoverage in a community, no community benefits (e.g. reduced spreading of cholera

3. WATER SERVICES: THE CENTRAL ROLE OF TARIFFS – 95
MANAGING WATER FOR ALL: AN OECD PERSPECTIVE ON PRICING AND FINANCING – ISBN-978-92-64-05033-4 © OECD 2009
when enough households have adequate sanitation and hygiene practices) accruebeyond the private benefits to single households.
5. Incremental costs is defined as the discounted total unit cost of the next investmentprogramme necessary to meet rising demand.
6. It is important to note that cross-country comparisons based on Figure 3.2 andFigure 3.3 may be difficult, as individual consumption can vary across countries. Thismay lead to an overestimation of the weight of bills in household incomes in thosecountries where household consumption is below 15 m3/month or where householdshave more than three members. This last point may be especially relevant forFigure 3.3, as low-income households may tend to be larger, at least in somecountries.
7. For three examples from South Asia, see Revels (2007).
8. Carried out with the support of Agence Française de Développement, the EuropeanInvestment Bank, the ACP-EU Water Facility and the Netherlands’ DevelopmentFinance Company (FMO - Nederlandse Financierings-Maatschappij voorOntwikkelingslanden N.V).
9. For details, see OECD (2009a). Sources include the most recent meta-analysis ofvariations in price and income elasticities of residential water demand, i.e. Dalhuisenet al. (2003), which considered over 100 estimates published in journals over 1963 to2001.
10. The question is whether those who are not connected are receiving a service or not. Ifthey are not, then this would be akin to creating a tax, which is instead a privilege ofparliament. To resolve this issue the question is what is the reason for the payment ofwastewater treatment services. The benefits from the service accrue to all users of thewater that would otherwise receive untreated wastewater – whether they areconnected to the wastewater treatment plant or not. The reason for paying awastewater treatment fee when connected is not that the user is receiving anexcludable private benefit, but rather that the user as a polluter needs to contribute tothe costs of removing this externality of water use, i.e. the “polluter pays” principle.Thus, also those who are not connected, but: (i) pollute; and (ii) receive the benefitfrom the improved quality of resources resulting from the treatment of other users’wastewater could be seen as receiving the service provided by the existing wastewatertreatment plant, as they also receive the benefit of the service. Downstreambeneficiaries would not enter this category, as they do not pollute upstream waters. Ifthis interpretation is not considered valid, an alternative is the creation of a tax on allproperties that will benefit from the creation of a treatment plant.

96 – 3. WATER SERVICES: THE CENTRAL ROLE OF TARIFFS
MANAGING WATER FOR ALL: AN OECD PERSPECTIVE ON PRICING AND FINANCING – ISBN-978-92-64-05033-4 © OECD 2009
Annex 3.A1
Comparison of Data from GWI Surveys and the World Bank IB-NetDatabase for EECCA Countries and BRIICS
Data for non-OECD countries was available from two sources: the 2007 and 2008GWI surveys covering over 100 cities in selected countries, and the World Bank IB-Netdatabase. The figures below compare these data for Eastern Europe, Caucasus andCentral Asia (EECCA) countries and Brazil, Russian Federation, India, Indonesia, China,South Africa (BRIICS) and show the typical discrepancies that can be found whendifferent sources are compared. These can be explained by differences in methodology(GWI computes the water and wastewater bill based on an assumed national consumptionof 15 m3 per month per household and the data reported, while IB-Net data is estimatedfrom information provided by utilities on average revenue per cubic metre, i.e. totalannual revenue divided by the total volume of annual water sales) and in reference years.
Figure 3.A1.1. Average total water and wastewater tariffs in selected non-OECD countries
USD per cubic metre
0.04 0.040.08 0.08
0.22 0.24
0.37
0.44
0.53 0.54
0.75
0.270.23
0.76
0.57
0.35
0.79
0.39
0.45
0.10
0.0
0.1
0.2
0.3
0.4
0.5
0.6
0.7
0.8
0.9
US
D/m
3
EECCA countries
IB-net GWI

3. WATER SERVICES: THE CENTRAL ROLE OF TARIFFS – 97
MANAGING WATER FOR ALL: AN OECD PERSPECTIVE ON PRICING AND FINANCING – ISBN-978-92-64-05033-4 © OECD 2009
0.0
0.2
0.4
0.6
0.8
1.0
1.2
1.4
1.6
1.8
2.0
India Russian Fed. China Indonesia South Africa Brazil
US
D/m
3
BRIICS
IB-net GWI
0.7
0.9
1.2
1.61.7
2.2
2.6
0.0
0.5
1.0
1.5
2.0
2.5
3.0
US
D/m
3
Central and South-East Europe, 2008
Source: GWI, 2008.

98 – 3. WATER SERVICES: THE CENTRAL ROLE OF TARIFFS
MANAGING WATER FOR ALL: AN OECD PERSPECTIVE ON PRICING AND FINANCING – ISBN-978-92-64-05033-4 © OECD 2009
0.0 0.1 0.1 0.2 0.2 0.3 0.3 0.40.6
0.7 0.8
3.4
0.0
0.5
1.0
1.5
2.0
2.5
3.0
3.5
4.0
US
D/m
3
Asia, 2008
Source: GWI, 2008.
0.00.1 0.1
0.2
0.40.5 0.5
1.2
1.7
1.9
0.0
0.2
0.4
0.6
0.8
1.0
1.2
1.4
1.6
1.8
2.0
US
D/m
3
Latin America, 2008
Source: GWI, 2008.

3. WATER SERVICES: THE CENTRAL ROLE OF TARIFFS – 99
MANAGING WATER FOR ALL: AN OECD PERSPECTIVE ON PRICING AND FINANCING – ISBN-978-92-64-05033-4 © OECD 2009
0.1
0.30.3
0.4 0.4
0.5
0.6
1.0
0.0
0.2
0.4
0.6
0.8
1.0
1.2
US
D/m
3
Sub-Saharan Africa, 2008
Source: GWI, 2008.
0.0 0.0 0.1 0.1 0.1 0.1
0.5
0.9
1.21.3
1.51.6
2.2
0.0
0.5
1.0
1.5
2.0
2.5
US
D/m
3
Middle-East and North Africa, 2008
Source: GWI, 2008.
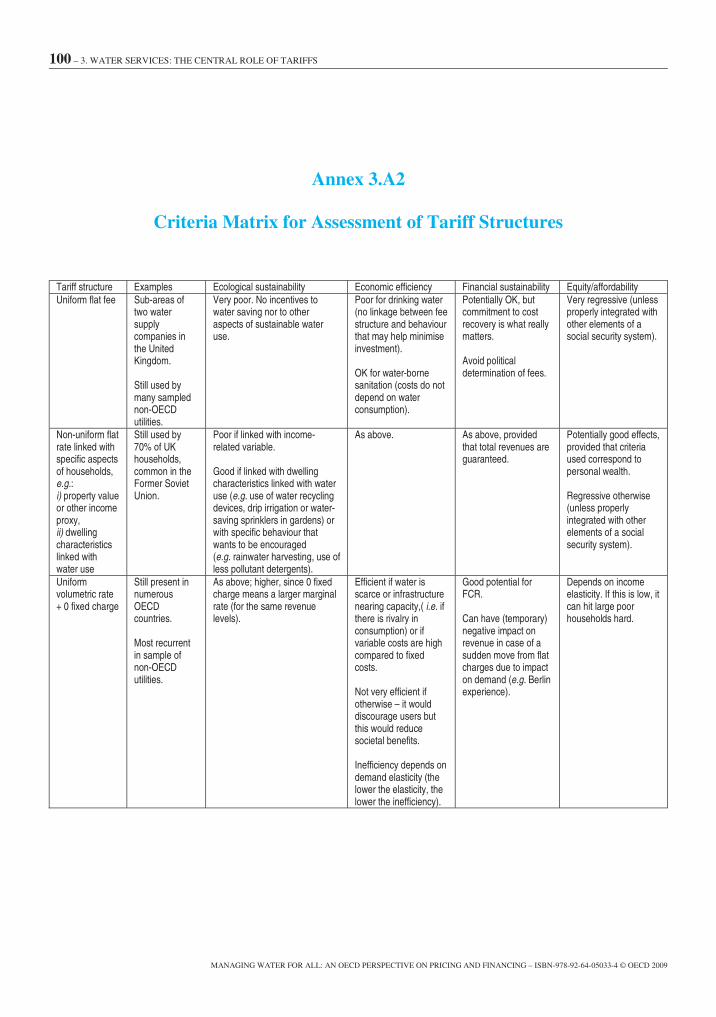
100 – 3. WATER SERVICES: THE CENTRAL ROLE OF TARIFFS
MANAGING WATER FOR ALL: AN OECD PERSPECTIVE ON PRICING AND FINANCING – ISBN-978-92-64-05033-4 © OECD 2009
Annex 3.A2
Criteria Matrix for Assessment of Tariff Structures
Tariff structure Examples Ecological sustainability Economic efficiency Financial sustainability Equity/affordabilityUniform flat fee Sub-areas of
two watersupplycompanies inthe UnitedKingdom.
Still used bymany samplednon-OECDutilities.
Very poor. No incentives towater saving nor to otheraspects of sustainable wateruse.
Poor for drinking water(no linkage between feestructure and behaviourthat may help minimiseinvestment).
OK for water-bornesanitation (costs do notdepend on waterconsumption).
Potentially OK, butcommitment to costrecovery is what reallymatters.
Avoid politicaldetermination of fees.
Very regressive (unlessproperly integrated withother elements of asocial security system).
Non-uniform flatrate linked withspecific aspectsof households,e.g.:i) property valueor other incomeproxy,ii) dwellingcharacteristicslinked withwater use
Still used by70% of UKhouseholds,common in theFormer SovietUnion.
Poor if linked with income-related variable.
Good if linked with dwellingcharacteristics linked with wateruse (e.g. use of water recyclingdevices, drip irrigation or water-saving sprinklers in gardens) orwith specific behaviour thatwants to be encouraged(e.g. rainwater harvesting, use ofless pollutant detergents).
As above. As above, providedthat total revenues areguaranteed.
Potentially good effects,provided that criteriaused correspond topersonal wealth.
Regressive otherwise(unless properlyintegrated with otherelements of a socialsecurity system).
Uniformvolumetric rate+ 0 fixed charge
Still present innumerousOECDcountries.
Most recurrentin sample ofnon-OECDutilities.
As above; higher, since 0 fixedcharge means a larger marginalrate (for the same revenuelevels).
Efficient if water isscarce or infrastructurenearing capacity,( i.e. ifthere is rivalry inconsumption) or ifvariable costs are highcompared to fixedcosts.
Not very efficient ifotherwise – it woulddiscourage users butthis would reducesocietal benefits.
Inefficiency depends ondemand elasticity (thelower the elasticity, thelower the inefficiency).
Good potential forFCR.
Can have (temporary)negative impact onrevenue in case of asudden move from flatcharges due to impacton demand (e.g. Berlinexperience).
Depends on incomeelasticity. If this is low, itcan hit large poorhouseholds hard.

3. WATER SERVICES: THE CENTRAL ROLE OF TARIFFS – 101
MANAGING WATER FOR ALL: AN OECD PERSPECTIVE ON PRICING AND FINANCING – ISBN-978-92-64-05033-4 © OECD 2009
Tariff structure Examples Ecological sustainability Economic efficiency Financialsustainability
Equity/affordability
Uniformvolumetric rate+ fixed charge> 0
Classic,e.g. Germany(structureenshrined inlaw).
High, depending on the marginalrate (impact on demand only if itis high enough) + individualmetering.
Optimal provided thefollowing applies:,volumetric rate = SRMC(short-run marginal cost)and fixed charge = lumpsum.
Particularly suited incase SRMC is constant(e.g. electricity,reagents).
As above. Depends on size of fixedcharge, but tends to beregressive (not so only ifmarginal cost is high andincome elasticity is high – which is rare).
But note: size of fixedcharge can be differentiatedbased on income orproxies.
Uniformvolumetric rate+ rebate (fixedcharge < 0)
No knownapplication. Mayhave beenapplied inmunicipalities inthe UnitedStates.
As above.
Highest if rebates take intoaccount specific circumstances(e.g. use of water recyclingdevices, drip irrigation or water-saving sprinklers in gardens) orwith specific behaviour that wantsto be encouraged (e.g. rainwaterharvesting, use of less pollutantdetergents).
As above.
In turn, could be efficientin combination with apositive fixed fee (idea: r= SRMC; fixed costredistributed including arebate for the poor).
As above. Progressive and useful forreducing impact on poor.
But only if rebate istargeted; otherwise,distributive effect dependingon income elasticity, justlike with IBTs.
Traditional IBT(both blockwidths andprices fixed)+ fixed charge
Italy
Increasingnumber ofdevelopingcountries.
Highest, provided that metering isindividual and marginal rates inthe upper blocks are high.
Potentially the bestsolution provided r =SRMC and fixed charge= lump sum.
Particularly suited incase SRMC isincreasing (e.g. costlyextra supply to bepurchased).
As above. Can be very regressive if:i) low demand elasticity toincome;ii) resulting average tariff isbelow cost recovery levelsand this discouragesextension of network,iii) many householdssharing the same tap.
IBT + fixedcharge+ exactoccupancyamendment
Flanders,Brussels
Malta, somecommunes inLuxembourg
As above, but reduced incentivesfor large families.
Depends on how closelythe resulting averagevolumetric chargereflects SRMC.
Rest as above.
As above. Reduces impact on largefamilies (best ifaccompanied by reductionof leaks and improvedefficiency of appliances).
Depends on correlation ofsize and income ofhouseholds.
Problem (ii) above remains.IBT + fixedcharge+ low-incomehouseholdsmay apply forextension
Proposed SocialTariff Plan inPortugal
As above, but reduced incentivesfor low-income households thatapply for extension of blocks.
Good for reducingdemand in peak periodsand optimising capacityuse.
Uncertainty aboutnumber ofhouseholdsapplying (may bereduced overtime).
Very successful, if alleligible claim and blockwidth reflect consumptionpatterns of the poor.
Problem (ii) above remains.
IBT + fixedcharge+ largerhouseholds(e.g. N>4) mayapply forextension
Many Spanishcities .
Greek DEYA,cities .
Proposed optionin Portugal.
As above, but reduced incentivesfor large families that apply forextension of blocks.
Depends on whetherthere is a fixed chargeor not.
As above. Depends on correlation ofsize and income ofhouseholds.
Problem (ii) above remains.
IBT + fixedcharge+ targetedsubsidies tolow income
Chile Highest, provided that metering isindividual and marginal rates inthe upper blocks are high.
As above. As above. Depends on the capacity totarget the poor.
Problem (ii) above remains.
102 – 3. WATER SERVICES: THE CENTRAL ROLE OF TARIFFS
MANAGING WATER FOR ALL: AN OECD PERSPECTIVE ON PRICING AND FINANCING – ISBN-978-92-64-05033-4 © OECD 2009
References
Boland, J.J. and D. Whittington (2000), “The Political Economy of Increasing BlockWater Tariffs in Developing Countries”, in A. Dinar (ed.), The Political Economy ofWater Pricing, Oxford University Press, Oxford, pp. 215-235.
Cardone, R. and C. Fonseca (2003), “Financing and Cost Recovery”, Thematic OverviewPaper No. 7, IRC.
Dalhuisen et al. (2003), “Price and Income Elasticities of Residential Water Demand: AMeta-Analysis”, Land Economics, Vol. 79, May.
Herrington, P. (2006), Critical Review of Relevant Research Concerning the Effects ofCharging and Collection Methods on Water Demand, Different Customer Groups andDebt, UKWIR, London.
Herrington, P. (2007) “Waste Not, Want Not: Water Tariffs for Sustainability”, Report toWWF-UK, September, www.wwf.org.uk/filelibrary/pdf/water_tariffs_report01.pdf.
Hoekstra, A. (1998), “Appreciation of Water: Four Perspectives”, Water Policy, Vol. 1,pp. 605-662.
Komives, K., et al. (2005), Water, Electricity, and the Poor — Who Benefits from UtilitySubsidies?, World Bank, Washington, DC.
Massarutto, A. (2007), “Water Pricing and Full Cost Recovery of Water Services:Economic Incentive or Instrument of Public Finance?”, Water Policy, Vol. 9, pp. 591-613.
Naumann, M. and M. Wissen, (2006), “Infrastructural Commercialization and UnevenDevelopment: The Case of East Germany”, in B. Barraqué, T. Katko, A. Tejada (eds.),Urban Water Conflicts, UNESCO, International Hydrological Programme.
OECD (1999), The Price of water: Trends in OECD Countries, OECD, Paris.
OECD (2003), Social Issues in the Provision and Pricing of Water Services, OECD, Paris
OECD (2009a), “Pricing Water Resources and Water and Sanitation Services”, OECDinternal document, www.oecd.org/water.
OECD (2009b), “Alternative Ways of Providing Water and Sanitation: Emerging Optionsand their Policy Implications”, OECD internal document, www.oecd.org/water.
Pires, J.S. (2007), “Consumer Tariffs in Practice: The Portuguese Experience”, presentedat the OECD Expert Meeting on Water Pricing and Financing, 14-15 November, Paris,available at www.oecd.org/water.

3. WATER SERVICES: THE CENTRAL ROLE OF TARIFFS – 103
MANAGING WATER FOR ALL: AN OECD PERSPECTIVE ON PRICING AND FINANCING – ISBN-978-92-64-05033-4 © OECD 2009
Revels, C. (2007), “Implementing the OECD Water Project – Trends, Opportunities andChallenges: Lessons Learned from Three Projects”, presented at the OECD ExpertMeeting on Water Pricing and Financing, 14-15 November, Paris, available atwww.oecd.org/water.
Saleth, R.M. and A. Dinar (2004), The Institutional Economics of Water, World Bank,Washington, DC.
Smets, H. (2008), De l’Eau potable à un prix abordable : la Pratique des États,Académie de l’Eau.
Whittington, D., J.J. Boland and V. Foster (eds.) (2002), “Understanding the Basics:Water Tariffs and Subsidies in South Asia”, Water and Sanitation Programme – SouthAsia, pp. 1-16.


4. BEYOND MONEY: THE ROLES OF GOVERNMENTS AND PRIVATE ACTORS IN WATER SERVICES – 105
MANAGING WATER FOR ALL: AN OECD PERSPECTIVE ON PRICING AND FINANCING – ISBN-978-92-64-05033-4 © OECD 2009
Chapter 4
Beyond Money: The Roles of Governments and Private Actorsin Water Services
Many developing countries have sought the involvement of the private sector to upgradeand develop their water and sanitation infrastructure and improve the efficiency of watersystems. However, high capital intensity, large initial outlays, long payback periods,immobility and invisibility of assets, and low rates of return generate high risks. Thesefactors, when combined with poor initial information and weak investment environments,constitute important constraints on private sector participation in water and sanitationinfrastructure.
Recognising this, the OECD has developed practical guidance, building on the OECDPrinciples for Private Sector Participation in Infrastructure, to help governments andother stakeholders to assess and manage the implications of involving private actors inthe development and management of water and sanitation infrastructure. The resultingOECD Checklist for Public Action provides a coherent catalogue of policy directions forconsideration by governments. The Checklist addresses the double challenge ofenhancing the enabling regulatory environment for water infrastructure investment, andmaking public-private co-operation work.
106 – 4. BEYOND MONEY: THE ROLES OF GOVERNMENTS AND PRIVATE ACTORS IN WATER SERVICES
MANAGING WATER FOR ALL: AN OECD PERSPECTIVE ON PRICING AND FINANCING – ISBN-978-92-64-05033-4 © OECD 2009
As indicated in Chapter 1, external finance for water supply and sanitation (WSS)will not be mobilised unless the balance between risks and returns of the sector is deemedappropriate by lenders and investors (including private entities). Therefore, achievingsustainable financing for the WSS sector will require a focus on aspects that go “beyondmoney”, and particularly on improvements in the governance of the sector, the allocationof risks and the management of service providers.
Many developing and emerging countries have sought to involve the private sector,either as a source of funds to meet the tremendous needs to expand their infrastructure ina context of tight budgetary constraints, and/or in an attempt to improve the efficiency ofwater systems. Most of the time, however, the responsible public authorities (defined asthe public partner of a public/private partnership contract) remain the owner of the assetsand is responsible for the bulk of investment. Also, the government always remains theenabler and the guarantor of public interest.
Recognising this, the OECD Council approved in March 2007 the OECD Principlesfor Private Sector Participation in Infrastructure (OECD, 2007) and launched a specificapplication of the principles to the drinking water and sanitation sector. The resultingOECD Checklist for Public Action (the “Checklist”) (OECD, 2009a) offers a coherentcatalogue of policy directions and practices to help governments properly assess andmanage the implications of involving private actors in water infrastructure development,and harness more effectively the capacities of all stakeholders.1 The Checklist does notprovide a detailed approach of the steps necessary to engineer a specific partnership, butaims to offer governments a clearer picture of the multiple policy areas in whichdecisions have to be made when private sector participation is considered. While theChecklist focuses on partnerships with the private sector, most of its observations areequally applicable to relationships between public authorities and public partners.
This chapter is based on the analysis and the country practices developed in theChecklist.2 It explores what role the private sector could play in contributing to closingthe financing gap of the sector, either as a financier/investor, or by helping improve the“fundamentals” of the sector as a source of increased efficiency in service provision or ofinnovative, more cost-effective technologies and processes for service provision. It aimsto capture the nature of private sector participation in water and sanitation infrastructure,acknowledging: (i) opening water infrastructure and sector provision to the private sectoris one option that policy makers can choose to adopt among others; and (ii) the sheerdiversity of the actors involved, their activities and the contractual arrangements used toregulate their activity. The chapter highlights the responsibilities of private entitiesinvolved in providing a public service and addresses the framework conditions and keyprinciples of good governance and partnership-building necessary to improve theeffectiveness of the involvement of the private sector in achieving societal goals, andattracting additional external finance to the sector.
More importantly, the chapter aims to move beyond the public vs. private debate andemphasise the aspects of sector governance that need to be improved regardless of theprivate or public nature of asset ownership or service provision, so as to create anenvironment that is conducive to the provision of sustainable services.

4. BEYOND MONEY: THE ROLES OF GOVERNMENTS AND PRIVATE ACTORS IN WATER SERVICES – 107
MANAGING WATER FOR ALL: AN OECD PERSPECTIVE ON PRICING AND FINANCING – ISBN-978-92-64-05033-4 © OECD 2009
Trends in private sector involvement in water supply and sanitation: new actors,new responsibilities
The emerging diversity of the private sector
The drinking water and sanitation sector is fragmented and accommodates a largevariety of private actors along the different segments of provision:3 internationalinvestors, local and regional actors, private sector whose core activity is not water but isan important player (e.g. financier) or user of water (such as beverage, mining andconstruction companies), joint ventures between public and private companies as well aspublic companies operating abroad as private participants in competitive bidding. Inaddition, in most developing countries where the progress of conventional public serviceprovision has barely kept pace with rapid population growth and migration to urban areas,small-scale local actors have usually made up for the deficiencies in public serviceprovision and provide water and sanitation services to large sections of the population(notably to the poorest and most isolated).
Even among the traditional international private operators, the landscape of serviceprovision has diversified over the last ten years. During 1990-97, five operatorsaccounted for 53% of contracts awarded (Agbar, Saur, Suez, Thames and Veolia). Fiveyears later, their share had dropped to 23%. As shown in Table 4.1, new players haveemerged from diverse backgrounds. According to World Bank (2009), the populationserved by private water operators in developing and emerging countries has increasedsteadily, from 96 million in 2000 to some 160 million by the end of 2007, among which40% was receiving services from developing countries’ operators.
Concerns over water resource scarcity and the consequences of climate change insome areas are also supporting the development of opportunities in new technologiessuch as wastewater reclamation and re-use, desalination and the use of advanced filtrationmembranes for water treatment. While these technologies can be adopted by public orprivate operators, they are currently attracting the bulk of private investments in the watersector. Global Water Intelligence (2008) foresees a tripling of water re-use capacitybetween 2008 and 2016 (from 20 million to 60 million cubic metres per day) and adoubling of desalinisation capacity (52 million to 107 million cubic metres per day). It isexpected to translate into respectively some USD 64 billion and USD 47.5 billion worthof transactions in desalinisation plants and water re-use projects.
Namibia presents an example where the private sector has been involved in thedevelopment of innovative technology for water provision. Its capital city, Windhoek, isthe only city in the world that introduced direct recycling of effluent for drinkingpurposes. In order to attract technical and operating know-how, the City of Windhoeksigned a performance-based operation and maintenance contract with WindhoekGoreangab Operating Company (WINGOC: VeoliaWater, Berlinwasser International andWABAG) in 2002 for 20 years.
A number of opportunities also potentially accrue from innovative approaches toproviding water supply and sanitation (Box 4.1). They should however be consideredwith caution as they raise important challenges – such as the cost of regulatingdecentralised activities – and their use carefully assessed against the loss of economies ofscale they may induce. As such, their use might be seen complementarily to moretraditional approaches.
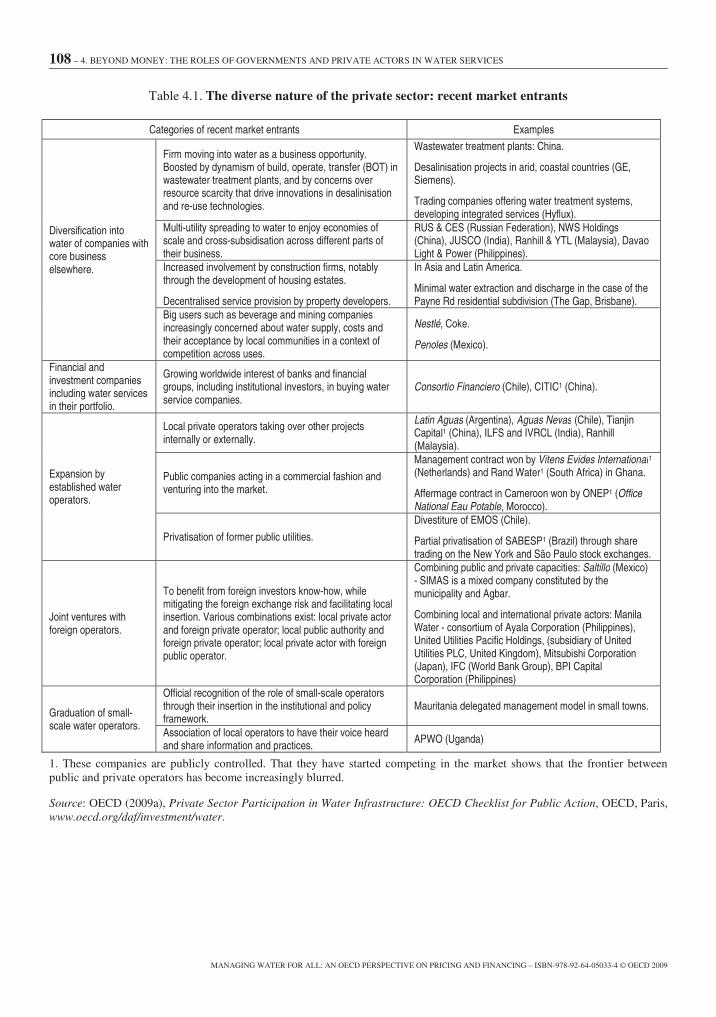
108 – 4. BEYOND MONEY: THE ROLES OF GOVERNMENTS AND PRIVATE ACTORS IN WATER SERVICES
MANAGING WATER FOR ALL: AN OECD PERSPECTIVE ON PRICING AND FINANCING – ISBN-978-92-64-05033-4 © OECD 2009
Table 4.1. The diverse nature of the private sector: recent market entrants
Categories of recent market entrants Examples
Diversification intowater of companies withcore businesselsewhere.
Firm moving into water as a business opportunity.Boosted by dynamism of build, operate, transfer (BOT) inwastewater treatment plants, and by concerns overresource scarcity that drive innovations in desalinisationand re-use technologies.
Wastewater treatment plants: China.
Desalinisation projects in arid, coastal countries (GE,Siemens).
Trading companies offering water treatment systems,developing integrated services (Hyflux).
Multi-utility spreading to water to enjoy economies ofscale and cross-subsidisation across different parts oftheir business.
RUS & CES (Russian Federation), NWS Holdings(China), JUSCO (India), Ranhill & YTL (Malaysia), DavaoLight & Power (Philippines).
Increased involvement by construction firms, notablythrough the development of housing estates.
Decentralised service provision by property developers.
In Asia and Latin America.
Minimal water extraction and discharge in the case of thePayne Rd residential subdivision (The Gap, Brisbane).
Big users such as beverage and mining companiesincreasingly concerned about water supply, costs andtheir acceptance by local communities in a context ofcompetition across uses.
Nestlé, Coke.
Penoles (Mexico).
Financial andinvestment companiesincluding water servicesin their portfolio.
Growing worldwide interest of banks and financialgroups, including institutional investors, in buying waterservice companies.
Consortio Financiero (Chile), CITIC1 (China).
Expansion byestablished wateroperators.
Local private operators taking over other projectsinternally or externally.
Latin Aguas (Argentina), Aguas Nevas (Chile), TianjinCapital1 (China), ILFS and IVRCL (India), Ranhill(Malaysia).
Public companies acting in a commercial fashion andventuring into the market.
Management contract won by Vitens Evides International1(Netherlands) and Rand Water1 (South Africa) in Ghana.
Affermage contract in Cameroon won by ONEP1 (OfficeNational Eau Potable, Morocco).
Privatisation of former public utilities.
Divestiture of EMOS (Chile).
Partial privatisation of SABESP1 (Brazil) through sharetrading on the New York and São Paulo stock exchanges.
Joint ventures withforeign operators.
To benefit from foreign investors know-how, whilemitigating the foreign exchange risk and facilitating localinsertion. Various combinations exist: local private actorand foreign private operator; local public authority andforeign private operator; local private actor with foreignpublic operator.
Combining public and private capacities: Saltillo (Mexico)- SIMAS is a mixed company constituted by themunicipality and Agbar.
Combining local and international private actors: ManilaWater - consortium of Ayala Corporation (Philippines),United Utilities Pacific Holdings, (subsidiary of UnitedUtilities PLC, United Kingdom), Mitsubishi Corporation(Japan), IFC (World Bank Group), BPI CapitalCorporation (Philippines)
Graduation of small-scale water operators.
Official recognition of the role of small-scale operatorsthrough their insertion in the institutional and policyframework.
Mauritania delegated management model in small towns.
Association of local operators to have their voice heardand share information and practices. APWO (Uganda)
1. These companies are publicly controlled. That they have started competing in the market shows that the frontier betweenpublic and private operators has become increasingly blurred.
Source: OECD (2009a), Private Sector Participation in Water Infrastructure: OECD Checklist for Public Action, OECD, Paris,www.oecd.org/daf/investment/water.

4. BEYOND MONEY: THE ROLES OF GOVERNMENTS AND PRIVATE ACTORS IN WATER SERVICES – 109
MANAGING WATER FOR ALL: AN OECD PERSPECTIVE ON PRICING AND FINANCING – ISBN-978-92-64-05033-4 © OECD 2009
Box 4.1. Alternative models of water and sanitation provision
The traditional economies of scale attached to piped water supply and water-borne sewagetreatment in centralised systems are being questioned. On the one hand, regionalisation of waterservices has improved efficiency, cost-effectiveness and watershed management in key areas inCanada, Chile, England, France, Portugal, the United States and Wales: expanding the scope ofservice can improve a water system’s ability to finance needed investments. On the other hand,there are diseconomies of scale attached to large municipal systems, in particular in megacitieswhere high costs are attached to water transport and network maintenance, including work onroads to repair underground infrastructure. Central infrastructures have rigidities which may beproblematic in contexts where the new challenges raised by climate change require adaptation,resilience and flexibility.
In most cases, the optimal scale for potable water and complex water treatment may bedifferent from the one that fits non-potable water uses and storm-water management. It maytherefore be relevant to unbundle and recombine water services in ways that make optimal use ofscale and scope effects. Some governments already explore these directions. Markets for waterre-use and decentralised water and sanitation are booming in emerging economies. Some OECDcountries (Australia, Spain, some states in the United States) are pioneering these approaches,spurred by serious water stress. They have adjusted water-related institutions and regulations, sothat they are not technology driven. Decentralised systems notably include home and landowners financing and building onsite systems for public buildings, and single- or multi-familycomplexes.
Source: OECD (2009b), “Alternative Ways of Providing Water and Sanitation: Emerging Options and theirPolicy Implications”, OECD internal document, www.oecd.org/water.
Poor risk management reduces sector financing
A number of experiences involving the international private sector as an investor(typically under concession contracts) in the 1990s fell short of expectations for all partiesinvolved. This contributed to a restructuring of the private sector landscape and to rapidchanges in the forms of private sector involvement, and notably a trend among“traditional” international players towards shorter, less risky arrangements (Greenfield,ring-fenced projects) and projects involving lower or no investment obligations (such asmanagement contracts). Consequently, although the number of projects involving theprivate sector has increased continuously since the early 1990s, the expected surge ininvestment flows did not materialise, as indicated in Figure 4.1.

110 – 4. BEYOND MONEY: THE ROLES OF GOVERNMENTS AND PRIVATE ACTORS IN WATER SERVICES
MANAGING WATER FOR ALL: AN OECD PERSPECTIVE ON PRICING AND FINANCING – ISBN-978-92-64-05033-4 © OECD 2009
Figure 4.1. Evolution of investment involved in public private partnership projects indeveloping countries, 1991-2007
0
10
20
30
40
50
60
70
0
2 000
4 000
6 000
8 000
10 000
12 000Investment (USD million)Number of projects
Source: World Bank Private Participation in Infrastructure (PPI) Database: http://ppi.worldbank.org.
Suez, the most active international company in concessions during the first phase ofprivate sector involvement in developing countries, is today largely reducing its exposureto risk and withdrawing (except from China). By contrast, Veolia has become the mostactive international operator as of 2005, mostly through development of localpartnerships. Agbar is also developing a strategy of local partnerships, through jointownership with local governments (see the example of Saltillo in Mexico in Table 4.1).Other international players, such as Severn Trent, are concentrating on management andservice contracts, with no capital expenditure obligations. These developments were notparalleled by an uptake of investments from local private actors, which were eitherunwilling or unable to take the risks of investing in the water sector and borrow fromprivate financiers. This also reflected the limited development of local financial marketsand of the financial tools that could contribute to leverage private investment.
The causes behind the difficulties that were encountered by the contracts launched inthe early 1990s were often linked with a poor understanding of the opportunities and risksinvolved by private sector participation in a complex sector as well as inadequateinstitutional framework conditions. As mentioned in Chapter 1, private investment canhelp bridge, as opposed to fill, the financing gap. Private investment needs ultimately tobe repaid through revenues and efficiency gains. Its availability will depend on theexistence of stable revenue flows (tariffs play a key role in ensuring the financialsustainability of water operators as demonstrated in previous chapters), as well as on thebalance between risks and returns perceived by the investors. As defined by the UnitedNations Environment Programme Finance Initiative (UNEP FI), there are mainly fourkinds of water-related risks (Table 4.2).

4. BEYOND MONEY: THE ROLES OF GOVERNMENTS AND PRIVATE ACTORS IN WATER SERVICES – 111
MANAGING WATER FOR ALL: AN OECD PERSPECTIVE ON PRICING AND FINANCING – ISBN-978-92-64-05033-4 © OECD 2009
Table 4.2. Typology of risks
Water-related risksCommercial Tariff affordability and resistance / Project cash-flow profile
Credit risk / Contractual riskPerformance risk / Demand and markets / Inappropriate technologyInformation gaps / Hidden costs / Costs of inputs (including energy)
Political ExpropriationPolitical interferenceSub-sovereign agencies / Local stakeholder actionsForeign exchange risk
Regulatory,legal andcontractual
Weak or arbitrary regulatorWeak legal framework / New standards and directivesContract enforcement
Reputational Local sensitivities and needsCompliance and disclosure pressures
Source: UNEP FI (2006), Financing Water: Risks and Opportunities, www.unepfi.org/publications/water/index.html.
Owing to the characteristics of the water sector, the following components appearparticularly relevant and have thus attracted special attention: the commercial risk(mainly the risk related to revenue), contractual risk, foreign exchange risk, sub-sovereignrisk and arbitrary political interference. If these risks exist in all infrastructure sectors, thewater and sanitation sector differs in that it cumulates most of the constraints that usuallyapply to infrastructure, a combination that in effect tends to deter commercial financing,as was stressed by the Camdessus Panel (Winpenny, 2003). On the other hand, if theseand other governance conditions were addressed, WSS could potentially turn into arelatively safe sector to invest in, characterised by slow technological change, long lifespan of infrastructures and stable revenue streams.
Water and sanitation projects are usually capital intensive. They involve high initialinvestment, long payback periods and low rates of return.4 The resulting infrastructure isvery specific, largely invisible and cannot be used for other purposes or removed from thecountry. This profile generates high contractual and regulatory risk especially in a contextof poor initial information (notably on asset conditions and customer base) and weakregulatory environment. It may also expose the partners to a risk of capture by vestedinterests.
The revenues come mainly from user fees or government subsidies in the localcurrency, exposing investors and lenders to foreign exchange risk if funding is in foreigncurrency, a true constraint for international investors, but also for national operators in acontext of poorly developed local financial markets. The foreign exchange risk iscompounded by the difficulty to index tariffs to foreign exchange variations, owing to thepolitical difficulty of implementing tariff increases.
The commercial risk is essentially related to the variations in demand and revenuesfrom the sales of water and sanitation services. This risk is serious in some OECDcountries, where water consumption tends to decline. It is also serious in developingcountries where tariff affordability and bill collection rates are lower and the revenueflows not easily ring-fenced.
Finally, as a basic need, water has important social and political repercussions. Onone hand, this justifies public involvement in the form of regulation aimed at protectingusers from possible abuse of a monopolistic position on the part of service providers. Onthe other hand, such public involvement has often taken the form of political interference.

112 – 4. BEYOND MONEY: THE ROLES OF GOVERNMENTS AND PRIVATE ACTORS IN WATER SERVICES
MANAGING WATER FOR ALL: AN OECD PERSPECTIVE ON PRICING AND FINANCING – ISBN-978-92-64-05033-4 © OECD 2009
As discussed in Chapters 1 and 2, this has often materialised in incapacity to adjust tariffseven when justified by the evolution of costs, often leading to a deterioration of servicequality. In addition, as the management and supervision of contractual arrangements aregenerally carried out by local entities, it exposes the investors to sub-sovereign risk, in theform of weak management and financial capacities of the sub-sovereign entities.
A wide range of risk-sharing arrangements is available to policy makers (Table 4.3).The appropriate allocation of risk across partners constitutes a key element of the successof private sector participation and should be driven by an assessment of the party bestable to manage it (i.e. best able to influence the probability of its occurrence or to dealwith its consequences) so as to ensure value for money and sustainability of thepartnership (see OECD, 2008a). Simply allocating risks is, however, not enough to ensurethat the parties will effectively bear their responsibilities ex post. This implies that therelevant incentives and monitoring mechanisms are in place. Note that the success of amodel can only be assessed in the long run when sustainability and adaptation to changescan be proved.
Table 4.3. Typology of contractual arrangements between governments (G) and private sector (P)
Service contract Managementcontract
Affermage /lease Concession
Build,operate,transfer(BOT)
Joint venture Divestiture
Assetownership G G G G P/G G/P P
Capitalinvestment G G G P P G/P P
Commercialrisk G G Shared P P G/P P
Operations /maintenance1 G/P P P P P G/P P
Contractduration 1-2 yrs 3-5 yrs 8-15 yrs 25-30 yrs 20-30 yrs Infinite Infinite
Source ofremunerationof operator
Municipality Municipality:fee is fixed orbased onperformance
Operator collectsuser fees.Lease: fee paidby municipalityAffermage:revenue shared
Users Munici-pality
Users Users
Occurrence1991-2007,based onWorld BankPPI data
Not part ofscope
Together: 135 of 608 projects 236 of608 projects
209 of608
projects
Not aseparatecategory
28 of608 projects
Examples Mexico cityChennai
JohannesburgAmman
CartagenaCôte d’Ivoire
Senegal
GabonJakartaManilla
ChinaIndia
MalaysiaMexico
Morocco
CartagenaNetherlandsChongqingSino French
Water Supply
EnglandChile
1. Maintenance investment can lead to significant amounts of finance investments on the part of theresponsible partner.
Source: OECD (2009a), Private Sector Participation in Water Infrastructure: OECD Checklist for PublicAction, OECD, Paris, www.oecd.org/daf/investment/water.

4. BEYOND MONEY: THE ROLES OF GOVERNMENTS AND PRIVATE ACTORS IN WATER SERVICES – 113
MANAGING WATER FOR ALL: AN OECD PERSPECTIVE ON PRICING AND FINANCING – ISBN-978-92-64-05033-4 © OECD 2009
Government responsibilities: the need for clarity
Whatever the ownership of assets or nature of the service providers, the governmentremains the “sector enabler”: it remains in charge of defining and establishing theinstitutional framework, of overseeing its functioning and ultimately bears theresponsibility of meeting its people’s basic needs. In many countries, private participationin the water and sanitation sector has triggered important shifts in the focus of policies, byattracting stronger attention to: (i) the need to measure and monitor efficiency of serviceprovision and quality of service; (ii) the importance of sector organisation and regulation;and (iii) the need for greater involvement of communities in planning and definition ofobjectives.
Public sector as the enabler: commitment, consistency of policy and capacitiesat all levels
Strong political commitment is critical, notably in the fight against corruption, and toaddress lack of access to water and sanitation and service affordability. A major lessonfrom past experience, though, is the need to clarify and separate the different roles for thepublic sector: political function, administration, regulation and operation of servicedelivery.
The need to clarify roles is especially acute in the water and sanitation sector, due tothe segmented nature of its governance. Oversight responsibilities for water resourcemanagement and service provision are often split horizontally across different ministries,and vertically across national, regional and local authorities. This may generate overlapsin functions and/or loopholes on key responsibilities. In addition, the responsibility forwater service provision often rests with local authorities, generally municipalities, whosecapacity in terms of human and financial resources may be limited. Their involvementmay also generate inconsistencies between the national and local legal and regulatoryframeworks.
In particular, the sector is often regulated at both national and local levels. It istherefore important to specify the respective responsibilities of each level of government,e.g. where the national level may set the regulatory framework, while the local leveldefines contractual arrangements and monitors performance at the project level. It is alsoimportant to note that there may be different aspects of the sector that fall under thepurview of different regulators (e.g. in the United Kingdom, there is one regulator for theeconomic aspects of the sector and one for public health and one for environmentalissues. This is even more complex in France: Conseil de la Concurrence et DGCCRF forcompetition issues, Cour des Comptes for public finance and accounting practices, DGSfor quality standards and health-related issues and DRASS for local inspections), callingfor a need to ensure co-ordination across such entities to reduce the complexity ofregulatory requirements.
Preserving consistency across government policies also involves effort atstrengthening co-ordination mechanisms across government levels and building commonunderstanding on the objectives, means and resources for water provision. This could beachieved through the involvement of the different levels of government dealing withwater issues in structured negotiations during the planning process (including strategicfinancial planning as developed in Chapter 2), implementation and monitoring. Inaddition, provided that water and sanitation infrastructure development is closely related
114 – 4. BEYOND MONEY: THE ROLES OF GOVERNMENTS AND PRIVATE ACTORS IN WATER SERVICES
MANAGING WATER FOR ALL: AN OECD PERSPECTIVE ON PRICING AND FINANCING – ISBN-978-92-64-05033-4 © OECD 2009
to other policies such as urban development, energy policy, etc., very often it has to beaddressed as part of an integrated planning that tackles housing, property right tenure andrelocation (where relevant).
In parallel, governments can encourage training – from central government to sub-national entities, across municipalities – in order to build local capacities over the longerrun.5 A call for greater capacity to support regulators and governments byprofessionalising technical capacities was clearly made at the Asian Development Bank(ADB)-OECD regional expert meeting that took place in March 2008 in Manila (seeBox 4.2). Regular monitoring and performance assessment can help better define thecapacity building needs and contribute to a better consistency of government policies.The establishment of a public database in Norway (Kostra6) facilitating the exchange ofinformation across municipalities on public services participated in this effort.
Box 4.2. Summary of the ADB-OECD regional expert meeting: call for greatercapacity building
In March 2008, at the occasion of the ADB-OECD regional expert meeting entitled, “For aBeneficial Private Sector Participation in the Water and Sanitation Sector, Lessons Learnt fromAsian Country Experience”, participants made a strong call for greater capacity building in thefollowing specific areas:
• to develop understanding of the key elements of a public private partnership and theroles and responsibilities of parties throughout the private sector participation process;
• to develop an informed involvement of civil society, communities and consumerassociations;
• to support regulators and governments by professionalising technical capacities to avoidpoliticisation of tariff setting and adjustments;
• to facilitate access to funding.
Source: OECD (2009a), Private Sector Participation in Water Infrastructure: OECD Checklist for PublicAction, OECD, Paris, www.oecd.org/daf/investment/water.
Developing high-quality regulation
The regulatory framework plays a pivotal role in the success of the co-operation ofgovernments with the private sector and, more generally, for improved governance in thesector. Regulation is a key issue in monopolistic sectors, where competitive pressures arelimited; contracts cannot be fully comprehensive (owing to the complexities involved inlong-term agreements); the partnership is multi-stakeholder (with distinct incentives andrequirements across stakeholders); and the relationships are long-term and thus need toadapt to changes. It is also all the more necessary given the need to preserve thewellbeing of users and environmental sustainability, from water extraction to wastewaterdischarge. It is also widely acknowledged today that high-quality regulation is equallycritical to enhance transparency, efficiency and equity of publicly managed waterservices, especially in a context of increased corporatisation of water operators.

4. BEYOND MONEY: THE ROLES OF GOVERNMENTS AND PRIVATE ACTORS IN WATER SERVICES – 115
MANAGING WATER FOR ALL: AN OECD PERSPECTIVE ON PRICING AND FINANCING – ISBN-978-92-64-05033-4 © OECD 2009
As strongly highlighted during the Instituto Mexicano de Tecnologia del Agua(IMTA)-OECD regional expert meeting organised in March 2008 in Mexico (seeBox 4.3), establishing a high-quality regulatory framework requires great technical skillsand the establishment of appropriate institutions, including competent and well-resourcedregulatory bodies that are able to balance different interests and make the necessarydecisions on a professional basis. When badly designed or captured by specific interests,regulation may have unintended consequences on the provision of water and sanitationservices (notably for the poor), by, for instance, limiting technological options orstrengthening the monopoly power of the incumbent utility.
Box 4.3. The IMTA-OECD regional expert meeting: setting a high-qualityregulatory framework
As recognised by the experts in the IMTA-OECD expert meeting, the water and sanitationregulatory framework remains poor in most Latin American countries. It is often complex andimported from abroad without adaptation to local needs. It also often lacks technical basis anddoes not clearly specify the incentives and sanctions mechanisms. Establishing a high-qualityregulatory framework requires political will and great technical skills – involving engineers,lawyers and economists. This necessitates time and progressive improvements. Developing theappropriate institutions also requires establishing a good information system that notablycorrects the information asymmetries between the provider and the regulator.
Source: OECD (2009a), Private Sector Participation in Water Infrastructure: OECD Checklist for PublicAction, OECD, Paris, www.oecd.org/daf/investment/water.
Good regulation, as defined by OECD (1995), should: (i) serve clearly identifiedpolicy goals, and be effective in achieving those goals; (ii) have a sound legal andempirical basis; (iii) produce benefits that justify costs, considering the distribution ofeffects across society and taking economic, environmental and social effects into account;(iv) minimise costs and market distortions; (v) promote innovation through marketincentives and goal-based approaches; (vi) be clear, simple, and practical for users;(vii) be consistent with other regulations and policies; and (viii) be compatible as far aspossible with competition, trade and investment-facilitating principles at domestic andinternational levels.
In the area of drinking water and sanitation, the main activities of regulation pertain toregulation of water quality, environmental regulation, economic regulation to overseemonopolistic markets, monitoring of the sector and consumer protection. Setting the rightincentives for private sector and preventing rent-seeking behaviour are the key elementsof economic regulation in a sector where competition is limited. As shown by theexperience of Chile (Box 4.4), it is done through appropriate risk sharing acrossstakeholders, the establishment of mechanisms to ensure that the risks are effectivelyborne and a tariff setting that contributes to balancing the incentives for efficiency,investments, rent extraction and fairness.

116 – 4. BEYOND MONEY: THE ROLES OF GOVERNMENTS AND PRIVATE ACTORS IN WATER SERVICES
MANAGING WATER FOR ALL: AN OECD PERSPECTIVE ON PRICING AND FINANCING – ISBN-978-92-64-05033-4 © OECD 2009
Box 4.4. The Chilean experience of involving the private sector
The success of Chile in involving the private sector can be attributed to three main factors:the condition of the water sector before the incorporation of the private sector; stability of waterand sanitation policy; and a high-quality regulatory framework. This involved:
• clear separation of roles across the different bodies in charge of regulation andsupervision, and from the activities of service provision of water operators;
• a regulation geared towards ensuring efficiency of operation and investment, includingthrough an appropriate definition of level-of-service provision, at regional rather thanmunicipal level to take into account economies of scale and scope;
• a strong focus on sustainable access (notably through a pro-poor subsidy scheme);
• a monitoring process that includes inspection of operators and considerable penalties incase of default;
• an innovative mechanism to deal with disputes arising between the regulatory authorityand the operators (notably on tariffs adjustment) involving expert panels.
As a result, private capital poured into the sector, wastewater coverage increased from 12%to 82% in ten years and efficiency of water and sanitation systems were improved. This, in turn,led to positive externalities for irrigation, health and tourism.
Source: Magaly Espinosa, Superintendenta de Servicios Sanitarios (Superintendent of Sanitation Services),OECD Global Forum on Sustainable Development, December 2008.
In the past 15 years, many developing countries have increased their efforts todevelop high-quality regulation for the water sector as demonstrated by the establishmentof separate regulatory bodies. According to the information base that underpins theanalysis in the Checklist (see OECD, 2009a), most Latin American countries and 7 of the13 African countries under review have established regulatory bodies since the 1990s.
This development in turn raises important challenges, such as: (i) how to increasetransparency and accountability of the regulatory authorities and ensure their credibility,especially in a context of recent structural reforms, low institutional capacity andimportant information gaps; (ii) how to define the space for regulation, its interface withcontractual arrangements and policy making in order to adequately manage the flexibilityrequired to sustain long-term commitments in a constantly changing environment;(iii) how to extend effective oversight and regulatory functions to a fragmented sector,notably how to reach out to small-scale providers (Box 4.5) and the big users whennational regulatory tools are often ill-suited to decentralised activities; and (iv) how tobuild capacity for monitoring and enforcement, particularly for decentralised regulation.

4. BEYOND MONEY: THE ROLES OF GOVERNMENTS AND PRIVATE ACTORS IN WATER SERVICES – 117
MANAGING WATER FOR ALL: AN OECD PERSPECTIVE ON PRICING AND FINANCING – ISBN-978-92-64-05033-4 © OECD 2009
Box 4.5. Regulation and small-scale providers
Traditional regulatory tools are ill-suited to reach out to small-scale, often informal, privateoperators. Nevertheless, while small-scale providers show very good understanding andflexibility to adapt to low-income customers’ circumstances, there is a need to monitor thequality of the water they provide and to oversee their monopolistic behaviour – and theconsequences of their disparate activities on the environment. Most importantly, providing legalrecognition and protection for small-scale private operators would contribute to improving thequality of service and reducing the risk profile, and potentially improve the access to finance ofoperators (ultimately enabling them to charge lower tariffs).
In that context, Mauritania and Mozambique present two different situations calling fordifferent approaches. In Mauritania, small-scale private actors operate in small towns where lowdensities and limited economies of scale prevent the involvement of larger operators. Thecountry pioneered the delegation of water service delivery in municipalities below 20 000inhabitants in the early 1990s. Consequently, 365 small cities today delegate the management ofthe provision of water services to independent private providers. In the case of Mozambique,small-scale providers operate on the fringes of the activity area of a bigger provider, in the peri-urban areas of Maputo. While, in the first case, the issue is one of professionalising the privateactors – notably through capacity building – the second case raises the main challenge ofregulating the interface between formal and informal providers.
In any case, economic regulation of alternative providers rarely extends beyond abstractionlicensing and tanker truck registration. Very often, when regulatory rules exist (such as pricelimits), they are largely ignored due a lack of enforcement and opacity in the regulatoryframework. Setting regulation for alternative providers faces a trade-off between the adoption ofrules, their enforceability and the flexibility of the market. For instance the banning of a specifictechnology may lead to the bankruptcy of small providers and deprive the users of access in acontext where the main utility may not be in a position to fill the gap in the short term.
Source: OECD (2009a), Private Sector Participation in Water Infrastructure: OECD Checklist for PublicAction, OECD, Paris, www.oecd.org/daf/investment/water.
Beyond public and private roles: the key elements for successful private sectorparticipation
Contractual arrangements with the private sector are typically long term and as suchnot likely to cover all aspects of the complex relationship between the private sector andthe responsible public authority. Moreover, developing countries are particularly prone toshocks – such as currency devaluation – that are difficult to foresee in the contract. Manypast difficulties have also arisen from dispute over the actual state of water systems andthe quality of baseline data. Given the impossibility of eliminating the asymmetry ofinformation that can lead to such disputes, no contract can be comprehensive enough toeradicate all elements of uncertainty.
To work in the public interest, co-operation between public and private partnersshould be rooted in: (i) a clear understanding of the ultimate objectives for serviceprovision and of the contributions that the private sector can make; (ii) strongaccountability mechanisms, including clear and consistent contractual arrangements; and(iii) their relations based on information sharing and on consultation with stakeholders.
118 – 4. BEYOND MONEY: THE ROLES OF GOVERNMENTS AND PRIVATE ACTORS IN WATER SERVICES
MANAGING WATER FOR ALL: AN OECD PERSPECTIVE ON PRICING AND FINANCING – ISBN-978-92-64-05033-4 © OECD 2009
Co-operation between the public and private sectors
Mechanisms exist that may help reduce the uncertainty that comes with long-termincomplete contracts and/or deal with its consequences. They include adoptingperformance-based contractual arrangements with performance targets specified in termsof verifiable infrastructure services to be provided to the public; updating the baselinedata used to develop the business plan before the contract starts; regular reviews ofperformance and providing for clauses and mechanisms to frame the discussions onfuture issues, as well as formal dispute resolution mechanisms (see the experience ofYerevan in implementing a performance-based contract in Box 4.6).
Box 4.6. The Armenian experience of implementing a performance-based contract
The performance-based lease signed in December 2005 with Veolia for the water services inYerevan (Armenia) is generally considered a well-designed and balanced contract that meetsmost international standards. It however raised a certain number of challenges that are typical ofthe difficulties that might be encountered in the water sector. First, there were changes inbaseline information between the tender and the starting date of the contract, such as the increaseby 35% of local employees’ salaries between the tender and the start of the contract. Then a cleardefinition of the base year data for performance indicators was lacking, which resulted in adisagreement between the operator and the Public Services Regulatory Commission over whichdata and what methodology should be used to measure the indicator of continuity of service.Finally, there were difficulties with measuring performance indicators. This led the OECD tooffer the following two main recommendations:
• All the data collected during the tender process and used for calculating key indicatorsin the business plan should be updated before the contract starting date, particularly iftime has elapsed between the starting date and the tender preparation.
• In case of uncertainties or difficulties in obtaining reliable data at the start of thecontract, it is preferable to set annual performance targets as a percentage ofimprovement (calculated on the basis of a baseline to be defined) rather than as fixednumbers (in order to avoid recalculating a fixed figure each year) (this is particularlyrelevant for the indicator on the continuity of service).
Source: OECD (2008b), “Promoting the Use of Performance-Based Contracts between Water Utilities andMunicipalities in EECCA - Case Study No. 1: Yerevan Water Supply Company Lease Contract”,www.oecd.org/dataoecd/25/22/40572658.pdf.
The legal and institutional framework should facilitate the enforcement of a contract.But good faith and goodwill of the parties to co-operate and find solutions remainscrucial. In that context, starting the discussion early when difficulties arise, and beforeconflicts escalate, will help diffuse tension. The case of the affermage contract in Senegalshows the importance of a financial model based on consensus and of mechanisms thatconstitute solid grounds for a continuous dialogue between stakeholders (Box 4.7).

4. BEYOND MONEY: THE ROLES OF GOVERNMENTS AND PRIVATE ACTORS IN WATER SERVICES – 119
MANAGING WATER FOR ALL: AN OECD PERSPECTIVE ON PRICING AND FINANCING – ISBN-978-92-64-05033-4 © OECD 2009
Box 4.7. The affermage contract for urban drinking water in Senegal
The reform of the water sector in Senegal led to the development of a tripartite partnershipin 1995 between the State, SONES and SDE. SONES is a public company in charge of assetmanagement, investment and debt servicing linked to the State by a 30-year concession contract.SDE is a private company, selected by tender, under an affermage and performance contractwith SONES. The state defines the efficiency objectives (e.g. unaccounted-for water, withassociated penalties) and specifies the investment obligations of the two parties.
The success of the Senegalese model, which led to an increase in coverage from 2.8 millionpeople in 1995 to 5 million today, can be attributed to several factors, including appropriate risksharing across the partners; great commitment on the part of public authorities; autonomy ofSONES; performance of SDE; and regular dialogue between the stakeholders. In addition,transparency and accountability were ensured through several mechanisms:
• Regulation through a financial model of the sector shared by all parties involved.
• SDE is under a performance contract based on 18 criteria. Progress is reviewed everysix months and failures incur fines.
• All technical and financial information of the sector are available to all stakeholders.
• Civil society is involved in the regulation of the sector.
Source: Agence Française de Développement and Mouhamed Fadel Ndaw, PEPAM Co-ordinator, OECDGlobal Forum on Sustainable Development, December 2008.
Direct competition, potentially a strong driver for efficiency, cost reduction and aneffective allocation of risks across partners, is limited in the water sector owing toimportant economies of scale and significant sunk costs. Competition for the market,through competitive bidding, can also be undermined by a limited number of bidders,renegotiations7 and competitive advantage acquired from inside knowledge of theinfrastructure by incumbents. Competitive pressures and incentives to improveperformance can however be developed through benchmarking8 – defined as the processof comparing performance between organisations (Rouse, 2007). It involves identifyingand focussing on a small number of key indicators (clear, easy to measure) to lower thecost of information provision and working on improving data availability and reliabilityover time. Benchmarking is however more effective for comparison across operationalefficiency measures (provided the parties agree on a shared methodology), rather thancosts, which include some important site-specific components that may be difficult tomeasure.
Governments can also take steps to strengthen competition for the market, especiallyat times of contract renegotiations by limiting restrictions on entry – e.g. throughdiscrimination on size and ownership for instance – ensuring a level playing field forinternational and domestic companies, state-owned and private businesses, andsmall/larger scale actors; and by limiting the competitive advantage acquired throughinside knowledge through better information flow. Specific issues arise in frontier areas,where the network is little or not developed and the gap is filled by small-scale providersor community-based organisations. There, governments are tempted to grant monopoly inareas of activity to ensure enough revenue to the operator. A restricted number of
120 – 4. BEYOND MONEY: THE ROLES OF GOVERNMENTS AND PRIVATE ACTORS IN WATER SERVICES
MANAGING WATER FOR ALL: AN OECD PERSPECTIVE ON PRICING AND FINANCING – ISBN-978-92-64-05033-4 © OECD 2009
suppliers will also help lower the cost of regulation and oversight. However, theseexclusivity clauses need to be assessed against the efforts to extend the network to theunconnected, as they may in effect provide a strong monopoly power to the incumbent,while depriving the population living in frontier areas of formal alternatives.
Responsiveness to needs and leveraging public participation
Past experiences have shown that effective partnerships in practice are tripartiterelationships between public authorities, operators (public or private) andconsumers/communities. Promoting informed involvement of civil society (non-governmental organisations [NGOs], consumer groups) may contribute to improvingpopulation ownership, better protecting consumer rights, monitoring service provisionand determining model-of-utility management. It may facilitate regulation and strengthenaccountability mechanisms by permitting better information flows and greater adequacyof services to needs. Different levels of engagement exist (OECD, 2001), from a lowlevel of citizen influence on policy making through information to consultation and activeparticipation. However, public involvement should be developed according to theprinciples of clear focus, representation and transparency. It requires time and resourcesand should therefore be organised strategically at important stages of policy making, andpreferably start at projects’ early stages. It may also require providing adequate training.
Countries have had different ways of engaging consumers in the water sector. InSenegal, citizens are members of the administrative board of the water company. InZambia, consumers are involved through Water Watch Groups established by NWASCO,the national regulatory agency, to represent their interest, inform and make them aware oftheir rights and obligations, and collect information on operator performance.9 TheUnited Kingdom has developed consumer consultative committees, and Mexico hasestablished State-Citizen Water Councils. In Bangalore, the use of citizen report cardswas developed to provide agencies with qualitative and quantitative information aboutgaps in service delivery, but also to measure the level of awareness about citizens’ rightsand responsibilities.
However, effective engagement of consumers remains a great challenge in manycountries. It requires that consumers are able to have an informed opinion – implyingavailability of information and capacity to treat that information – and that they have avoice and the capacity to influence decision making. Strengthening government-citizenrelations also requires embedding it in a framework that provides for the setting in whichthe relations evolve – legal rights, institutions and their responsibilities, evaluationmechanisms and capacities.
Private responsibilities: the elements of responsible business conduct
In parallel to public authority responsibility to users and operators, private actors havespecific responsibilities, when involved in the development and management of watersystems, in ensuring sustainable co-operation in the public interest. Water is a vital goodinvolving important economic, social, environmental and political repercussion. Thisrequires strong commitment on the part of private partners to “responsible businessconduct”,10 good faith, fight against corruption, communication with consumers, and anawareness of and responsibility for the social consequences of their actions. TheChecklist deals with these issues in Principles 20-24 (Figure 4.2).
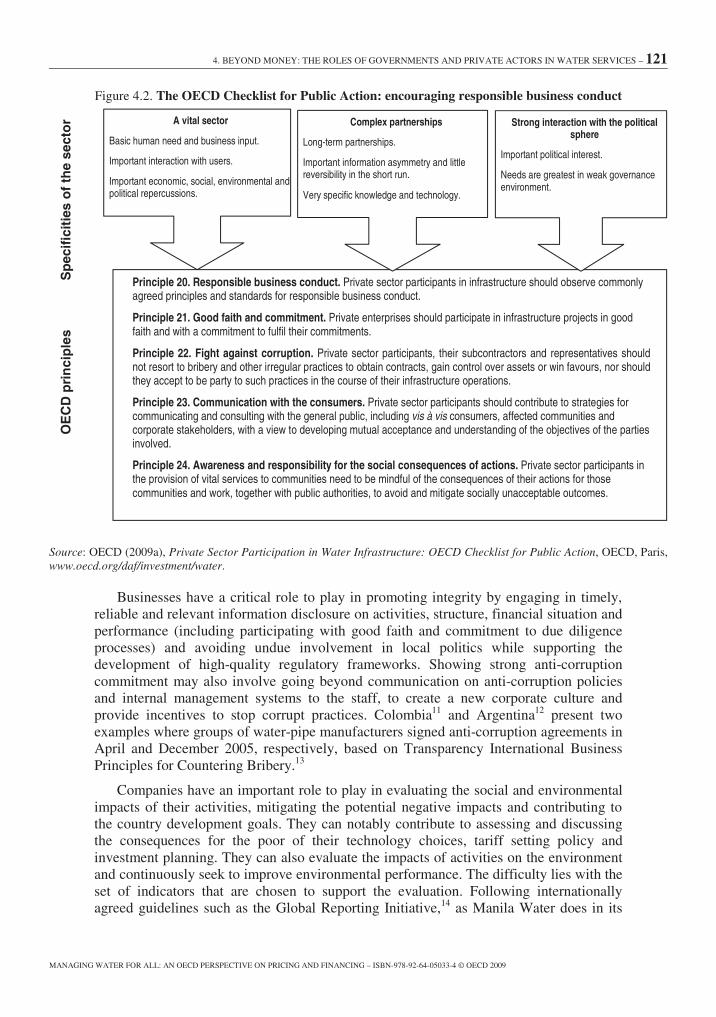
4. BEYOND MONEY: THE ROLES OF GOVERNMENTS AND PRIVATE ACTORS IN WATER SERVICES – 121
MANAGING WATER FOR ALL: AN OECD PERSPECTIVE ON PRICING AND FINANCING – ISBN-978-92-64-05033-4 © OECD 2009
Figure 4.2. The OECD Checklist for Public Action: encouraging responsible business conduct
Source: OECD (2009a), Private Sector Participation in Water Infrastructure: OECD Checklist for Public Action, OECD, Paris,www.oecd.org/daf/investment/water.
Businesses have a critical role to play in promoting integrity by engaging in timely,reliable and relevant information disclosure on activities, structure, financial situation andperformance (including participating with good faith and commitment to due diligenceprocesses) and avoiding undue involvement in local politics while supporting thedevelopment of high-quality regulatory frameworks. Showing strong anti-corruptioncommitment may also involve going beyond communication on anti-corruption policiesand internal management systems to the staff, to create a new corporate culture andprovide incentives to stop corrupt practices. Colombia11 and Argentina12 present twoexamples where groups of water-pipe manufacturers signed anti-corruption agreements inApril and December 2005, respectively, based on Transparency International BusinessPrinciples for Countering Bribery.13
Companies have an important role to play in evaluating the social and environmentalimpacts of their activities, mitigating the potential negative impacts and contributing tothe country development goals. They can notably contribute to assessing and discussingthe consequences for the poor of their technology choices, tariff setting policy andinvestment planning. They can also evaluate the impacts of activities on the environmentand continuously seek to improve environmental performance. The difficulty lies with theset of indicators that are chosen to support the evaluation. Following internationallyagreed guidelines such as the Global Reporting Initiative,14 as Manila Water does in its
Principle 20. Responsible business conduct. Private sector participants in infrastructure should observe commonlyagreed principles and standards for responsible business conduct.
Principle 21. Good faith and commitment. Private enterprises should participate in infrastructure projects in goodfaith and with a commitment to fulfil their commitments.
Principle 22. Fight against corruption. Private sector participants, their subcontractors and representatives shouldnot resort to bribery and other irregular practices to obtain contracts, gain control over assets or win favours, nor shouldthey accept to be party to such practices in the course of their infrastructure operations.
Principle 23. Communication with the consumers. Private sector participants should contribute to strategies forcommunicating and consulting with the general public, including vis à vis consumers, affected communities andcorporate stakeholders, with a view to developing mutual acceptance and understanding of the objectives of the partiesinvolved.
Principle 24. Awareness and responsibility for the social consequences of actions. Private sector participants inthe provision of vital services to communities need to be mindful of the consequences of their actions for thosecommunities and work, together with public authorities, to avoid and mitigate socially unacceptable outcomes.
Complex partnerships
Long-term partnerships.
Important information asymmetry and littlereversibility in the short run.
Very specific knowledge and technology.
A vital sector
Basic human need and business input.
Important interaction with users.
Important economic, social, environmental andpolitical repercussions.
Strong interaction with the politicalsphere
Important political interest.
Needs are greatest in weak governanceenvironment.
Sp
ecif
icit
ies
of
the
sect
or
OE
CD
pri
nci
ple
s
122 – 4. BEYOND MONEY: THE ROLES OF GOVERNMENTS AND PRIVATE ACTORS IN WATER SERVICES
MANAGING WATER FOR ALL: AN OECD PERSPECTIVE ON PRICING AND FINANCING – ISBN-978-92-64-05033-4 © OECD 2009
four annual sustainability reports,15 can facilitate the monitoring and comparison acrosscompanies.
Finally, being responsive to clients’ claims and providing transparent and effectiveprocedures to address complaints can contribute to building mutual understanding andimproving service provision. In that perspective, several companies, such as the SDE inSenegal, have launched surveys to assess consumers’ satisfaction and/or provide freephone numbers for consumer information.
There are many examples of well-run public and privately operated utilities. Theyinclude the Phnom Penh Water Supply Authority and the Public Utility Board ofSingapore, both public companies, that managed to fight corruption and turn around anon-performing utility providing poor services (in the case of Cambodia) through strongcommitment to change from the top.16 These examples clearly show the potential thatexists in sharing and transmitting good practices across operators. This is precisely therole of the recently launched Water Operator Partnerships (WOPs)17 to promotehorizontal co-operation and sharing of knowledge across operators.
The set of responsibilities of different actors and their interactions are complex.Solutions for a successful (tripartite) partnership will often be location- and people-specific, as the human factor remains paramount in determining the success of suchtransactions, particularly when difficulties arise. The OECD Checklist for Public Actionattempts to systematise the approach that policy makers can take to this complex issue.The objective of this analysis and of the use of the Checklist is ultimately to: ensureimprovement in service quality; ensure their efficient and sustainable provision; andimprove the institutional and regulatory setting in which this takes place. Improvementson this front will diminish the risk perception that private investors and financiers have ofthe sector in some countries, and may therefore contribute to increasing the flow offinance to the sector. This, and improvement in the creditworthiness of water utilities,addressed in the preceding chapters, can significantly contribute to sustainable financingfor water and sanitation for all.
Notes
1. The Checklist covers five main areas: (i) deciding on the nature and modalities ofpotential private sector involvement; (ii) providing a sound institutional andregulatory environment for infrastructure investment; (iii) ensuring public andinstitutional support; (iv) making the co-operation between the public and privatesectors work; (v) encouraging responsible business conduct.
2. Regional consultations were organised to discuss and validate the Checklist: inAfrica, through the New Partnership for Africa’s Development (NEPAD)-OECDAfrica Investment Initiative Roundtable organised in Lusaka (Zambia) in November2007; in Asia, through the joint OECD/Asian Development Bank expert meetingorganised in Manila (Philippines) in March 2008; and in Latin America, through the

4. BEYOND MONEY: THE ROLES OF GOVERNMENTS AND PRIVATE ACTORS IN WATER SERVICES – 123
MANAGING WATER FOR ALL: AN OECD PERSPECTIVE ON PRICING AND FINANCING – ISBN-978-92-64-05033-4 © OECD 2009
joint OECD/Mexican Institute of Water Technology meeting organised in Cuernavaca(Mexico) in September 2008.
3. For the purpose of this discussion, water and sanitation infrastructures include allwater delivery systems from upstream facilities, to distribution and seweragenetworks. It involves capture of the natural resource, treatment, transportation(primary network: aqueducts and mains), delivery to users (secondary network:pipelines and taps), wastewater capture and treatment.
4. Estimated by the African Development Bank (2006) between 5% and 10% (comparedto 17-25% in the power sector and 25-30% in telecommunications).
5. In the United Kingdom and Australia, this has notably taken the form of webinterfaces providing tools to assist local governments in developing infrastructureprojects: Partnership UK (www.partnershipuk.org.uk) and the Public PrivatePartnerships Programme of Local Government Association (www.4ps.gov.uk) in theUnited Kingdom and Partnerships Victoria (www.partnerships.vic.gov.au) inAustralia.
6. www.ssb.no/kostra.
7. According to Guasch (2004), in Latin America, renegotiations affected 75% of watercontracts (against 10% in electricity), after 1.7 years (compared to 2.3 years inelectricity).
8. Countries have adopted different benchmarking options. In England and Wales,competition is organised across companies serving different areas and involvesreward. In Chile, competition involves a (theoretical) model company. In thePhilippines and Indonesia, the capital cities (Manila, Jakarta) were split in two serviceareas to allow for within city competition. In Senegal, a performance contractinvolves benchmark performance to which the company has to compare. In addition,in Senegal, both the asset-holding company and the private company share investmentobligations, allowing direct comparison of reported costs.
9. www.nwasco.org.zm.
10. The principles of responsible business conduct are embodied in the OECD Guidelinesfor Multinational Enterprises (OECD, 2000) and the ILO Tripartite Declaration ofPrinciples Concerning Multinational Enterprises and Social Policy (ILO, 1977).
11. www.waterintegritynetwork.net/page/238.
12. www.transparency.org/news_room/latest_news/press_releases/2005/05_12_15_argentina_water_ sector.
13. www.transparency.org/global_priorities/private_sector/business_principles.
14. www.globalreporting.org.
15. www.manilawater.com/files/MWCSusDev07.pdf.
16. Which translated into the development of codes of conduct (see the online SingaporePublic Utility Board Code of Conduct: www.pub.gov.sg) and staff training.
17. Stated in the Hashimoto Action Plan of the United Nation Secretary General’sAdvisory Board on Water and Sanitation (UNSGAB): www.unsgab.org/docs/HAP_en.pdf.

124 – 4. BEYOND MONEY: THE ROLES OF GOVERNMENTS AND PRIVATE ACTORS IN WATER SERVICES
MANAGING WATER FOR ALL: AN OECD PERSPECTIVE ON PRICING AND FINANCING – ISBN-978-92-64-05033-4 © OECD 2009
References
ADB (African Development Bank) (2006), “Study on Financial Instruments to FacilitateInvestment for Water Infrastructures”.
GWI (Global Water Intelligence) (2008), “Global Water Market 2008: Opportunities inScarcity and Environmental Regulation”, www.globalwaterintel.com/GWM2008/.
Guasch, J.L. (2004), “Granting and Renegotiating Infrastructure Concessions: Doing itRight”, WBI Development Studies, World Bank, Washington, DC,http://crgp.stanford.edu/events/presentations/gcr2/Guasch3.pdf.
ILO (International Labour Organization) (1977), “ILO Tripartite Declaration ofPrinciples Concerning Multinational Enterprises and Social Policy”,www.ilo.org/public/english/employment/multi/index.htm.
OECD (1995). “Recommendation of the Council of the OECD on Improving the Qualityof Government Regulation”, OECD, www.olis.oecd.org/olis/1995doc.nsf/LinkTo/OCDE-GD(95)95.
OECD (2000), “OECD Guidelines for Multinational Enterprises”, 2000 revision,www.oecd.org/daf/investment/guidelines.
OECD (2001), Citizens as Partners: Information, Consultation and Public Participationin Policy-Making, OECD, Paris.
OECD (2007), “OECD Principles for Private Sector Participation in Infrastructure”,March, www.oecd.org/daf/investment/ppp.
OECD (2008a), Public-Private Partnerships: In Pursuit of Risk Sharing and Value forMoney, OECD, Paris.
OECD (2008b), “Promoting the Use of Performance-Based Contracts between WaterUtilities and Municipalities in EECCA - Case Study No. 1: Yerevan Water SupplyCompany Lease Contract”, www.oecd.org/dataoecd/25/22/40572658.pdf.
OECD (2009a), Private Sector Participation in Water Infrastructure: OECD Checklistfor Public Action, OECD, Paris, www.oecd.org/daf/investment/water.
OECD (2009b), “Alternative Ways of Providing Water and Sanitation: Emerging Optionsand their Policy Implications”, OECD, Paris.
Rouse, M. (2007), Institutional Governance and Regulation of Water Services: TheEssential Elements, IWA Publishing.
UNEP FI (United Nations Environment Programme Finance Initiative ) (2006),Financing Water: Risks and Opportunities,www.unepfi.org/publications/water/index.html.
4. BEYOND MONEY: THE ROLES OF GOVERNMENTS AND PRIVATE ACTORS IN WATER SERVICES – 125
MANAGING WATER FOR ALL: AN OECD PERSPECTIVE ON PRICING AND FINANCING – ISBN-978-92-64-05033-4 © OECD 2009
Winpenny, J. (2003), “Financing Water for All”, Report of the World Panel on FinancingWater Infrastructure, chaired by Michel Camdessus, www.financingwaterforall.org.
World Bank (2009), Public-Private Partnerships for Urban Water Utilities, World Bank,Washington, DC.


5. MANAGING WATER RESOURCES IN THE AGRICULTURAL SECTOR – 127
MANAGING WATER FOR ALL: AN OECD PERSPECTIVE ON PRICING AND FINANCING – ISBN-978-92-64-05033-4 © OECD 2009
Chapter 5
Managing Water Resources in the Agricultural Sector
As agriculture consumes about 40% of OECD countries and 70% of the world’sfreshwater consumption, it is a key area for water resources management (WRM)policies to achieve greater water use efficiency, while meeting environmental andsocial needs.
WRM in agriculture is complex, covering a diverse range of farming systems,climatic conditions, sources of water, property rights, institutional arrangements,cultural and social contexts. Future policies and actions will be influenced byincreases in population, food demand and climate change.
To address these challenges it will be important for OECD policy makers to:recognise the complexity and diversity of WRM in agriculture; reform institutionalsystems for water management in agriculture; ensure charges for water supplied toagriculture cover delivery costs; enhance agriculture’s resilience to climate changeand variability impacts; improve policy integration between agriculture, water,energy and environment policies; and address knowledge and informationdeficiencies to better guide water resource management.

128 – 5. MANAGING WATER RESOURCES IN THE AGRICULTURAL SECTOR
MANAGING WATER FOR ALL: AN OECD PERSPECTIVE ON PRICING AND FINANCING – ISBN-978-92-64-05033-4 © OECD 2009
Water supply and sanitation need to be addressed along with water resourcemanagement (WRM), both at the sectoral and environmental level. As agricultureconsumes about 70% of the world’s freshwater consumption and over 40% inOECD countries, it is a prime target for WRM policies to achieve greater efficiencyin water resource use. This chapter focuses on agricultural water uses as anessential component of water resource management.1
WRM in agriculture is complex, covering a wide range of farming systems,climatic conditions, and sources of water – surface water, groundwater andrainwater harvesting (IWMI, 2007). Diverse systems of property rights,institutional arrangements, cultural and social contexts exist across and withincountries. WRM is also influenced by many different policies, in particular, relatedto agriculture, water, environment and energy, as well as economic, fiscal, regionaland social policies.
In agriculture WRM mainly concerns irrigation to smooth water supply acrossthe production season. But it also involves water management in rainfedagriculture; management of floods, droughts, and drainage; and restoration andconservation of ecosystems and cultural and recreational values. The links betweenagriculture, WRM and water quality are not directly addressed in this chapter,although variations in water quantities and its management in agriculture can affectwater quality.2
All OECD countries have policy strategies to address broad water managementissues – water resources, quality and ecosystems, as discussed in other chapters ofthis report. With respect to agriculture, OECD countries share a common strategicvision to manage water resources through establishing a long-term plan for thesustainable management of water resources in agriculture, including improvingagriculture’s resilience to climate change and variability impacts; contributing toagricultural incomes and achieving broader rural development goals; protectingecosystems on agricultural land or affected by farming activities; balancingconsumptive water uses across the economy, including for the environment; andimproving water resource use efficiency, management and technologies on-farm,including adequate financing to maintain and upgrade the infrastructure supplyingwater to farms.
Until the 1980s, WRM in the agricultural sectors across most OECD countriesfocused on the physical supply of water, with emphasis on infrastructure “supply-side” technical solutions and harvesting the maximum amount from the resource,within a command and control institutional structure. This technical-based path toWRM is now being complemented by more emphasis on sustainable-based WRM,with greater reliance on “demand-side” economic solutions (Molle and Berkoff,2007). The emerging emphasis is thus on meeting the diverse demands for water(economic, environmental and social); embracing participatory decision makingand institutional structures; and encouraging a greater role for market-basedallocation mechanisms.
Policies addressing WRM in agriculture in the future will be influenced byincreases in population and climate change and variability. The anticipated growthin world population to 9 billion by 2050 will involve a major expansion in demandfor food, which will impact on water use in agriculture. Climate-change projectionssuggest that crop yields could improve in some regions as a result of changes intemperature and precipitation, but in other regions, stress on scarce water resources

5. MANAGING WATER RESOURCES IN THE AGRICULTURAL SECTOR – 129
MANAGING WATER FOR ALL: AN OECD PERSPECTIVE ON PRICING AND FINANCING – ISBN-978-92-64-05033-4 © OECD 2009
could increase (IPPC, 2008; OECD, 2008b). Heightened climate variability in someareas may lead to a greater incidence and severity of flood and drought events,leading to higher economic and human costs on agriculture and the wider economy,and in the case of droughts the increased use of irrigation to overcome watershortfalls.
Recent trends and outlook
Taking into account the complexity and diversity in hydrology and farmingsystems across the OECD, the key trends in OECD countries’ agricultural use ofwater resources since 1990 include (see Figures 5.1, 5.2 and 5.3; Tables 5.1 and5.2):
• Agricultural water use grew by 2% over the period between 1990-92 and2002-04, mainly driven by an increase in the area irrigated, compared to a1% increase for all water uses; however, for some countries in more recentyears this trend is reversing with agricultural water use diminishingcompared to stronger growth in other water-consuming sectors.
• Agriculture accounted for 44% of total water use overall in 2002-04,although for a number of countries the share is over 60%, but farm waterwithdrawals are invariably larger than the fraction consumed, as water isboth recycled and lost through evapotranspiration (i.e. the return ofmoisture to the air through both evaporation from the soil and transpirationby plants).
• The area irrigated rose by 8% compared to a reduction of 3% in the totalagricultural area between 1990-92 and 2002-04, although recently in anumber of countries the area irrigated has been decreasing. Moreover, thearea that is potentially irrigable is normally greater than the actual areairrigated in any given year.
• Agriculture abstracts an increasing share of its water supplies fromgroundwater, and the sector’s share in total groundwater utilisation,although data are limited, was above 30% in one-third of OECD membercountries in 2002.
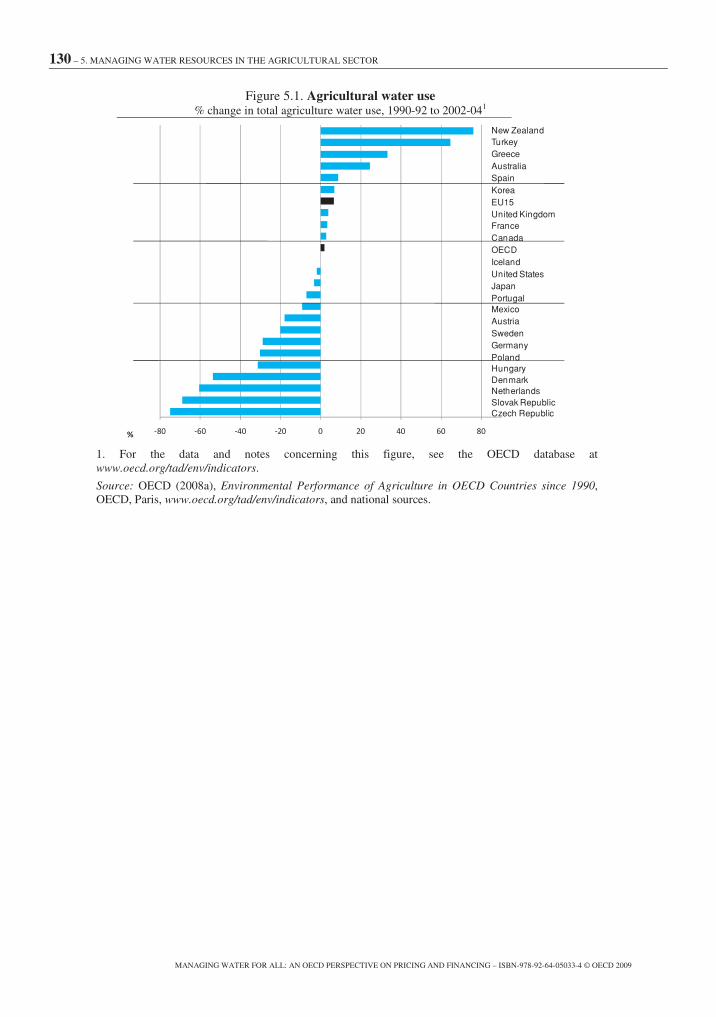
130 – 5. MANAGING WATER RESOURCES IN THE AGRICULTURAL SECTOR
MANAGING WATER FOR ALL: AN OECD PERSPECTIVE ON PRICING AND FINANCING – ISBN-978-92-64-05033-4 © OECD 2009
Figure 5.1. Agricultural water use% change in total agriculture water use, 1990-92 to 2002-041
-80 -60 -40 -20 0 20 40 60 80%
New ZealandTurkeyGreeceAustraliaSpainKoreaEU15United KingdomFranceCanadaOECDIcelandUnited StatesJapanPortugalMexicoAustriaSwedenGermanyPolandHungaryDenmarkNetherlandsSlovak RepublicCzech Republic
1. For the data and notes concerning this figure, see the OECD database atwww.oecd.org/tad/env/indicators.
Source: OECD (2008a), Environmental Performance of Agriculture in OECD Countries since 1990,OECD, Paris, www.oecd.org/tad/env/indicators, and national sources.

5. MANAGING WATER RESOURCES IN THE AGRICULTURAL SECTOR – 131
MANAGING WATER FOR ALL: AN OECD PERSPECTIVE ON PRICING AND FINANCING – ISBN-978-92-64-05033-4 © OECD 2009
Table 5.1. Agricultural water use1
Total agriculture water useChange in total
agriculture wateruse
Change in totalwater use
Share ofagriculture in total
water use
1990-92 2002-041990-92 to2002-04
1990-92 to2002-04
2002-04
(million m3) (million m3) % % %
New Zealand 1 281 2 254 76 56 57Turkey 18 812 31 000 65 43 70Greece 5 694 7 600 33 24 87Australia 13 384 16 660 24 9 77Spain 19 667 21 407 9 4 60Korea 14 700 15 800 7 33 48
EU15 39 638 42 263 7 -6 27United Kingdom 1 347 1 402 4 14 10France 4 901 5 067 3 -12 15Canada 3 991 4 104 3 -6 10OECD 411 046 419 214 2 1 44Iceland 70 70 0 -1 42United States 195 200 191 555 -2 2 40Japan 58 630 56 840 -3 -3 66Portugal 5 547 5 162 -7 -2 61Mexico 62 500 56 811 -9 1 77Austria 100 82 -18 -50 5Sweden 169 135 -20 -10 5Germany 1 600 1 140 -29 -21 3Poland 1 527 1 065 -30 -18 9Hungary 1 032 709 -31 -18 13Denmark 383 177 -54 -39 27Netherlands 230 91 -60 49 1Slovak Republic 188 59 -69 -42 6Czech Republic 93 24 -75 -43 1
Italy .. 20 140 .. 0 36
1. For the data and notes concerning this table, see the OECD database at www.oecd.org/tad/env/indicators.
Source: OECD (2008a), Environmental Performance of Agriculture in OECD Countries since 1990, OECD, Paris,www.oecd.org/tad/env/indicators, and national sources.
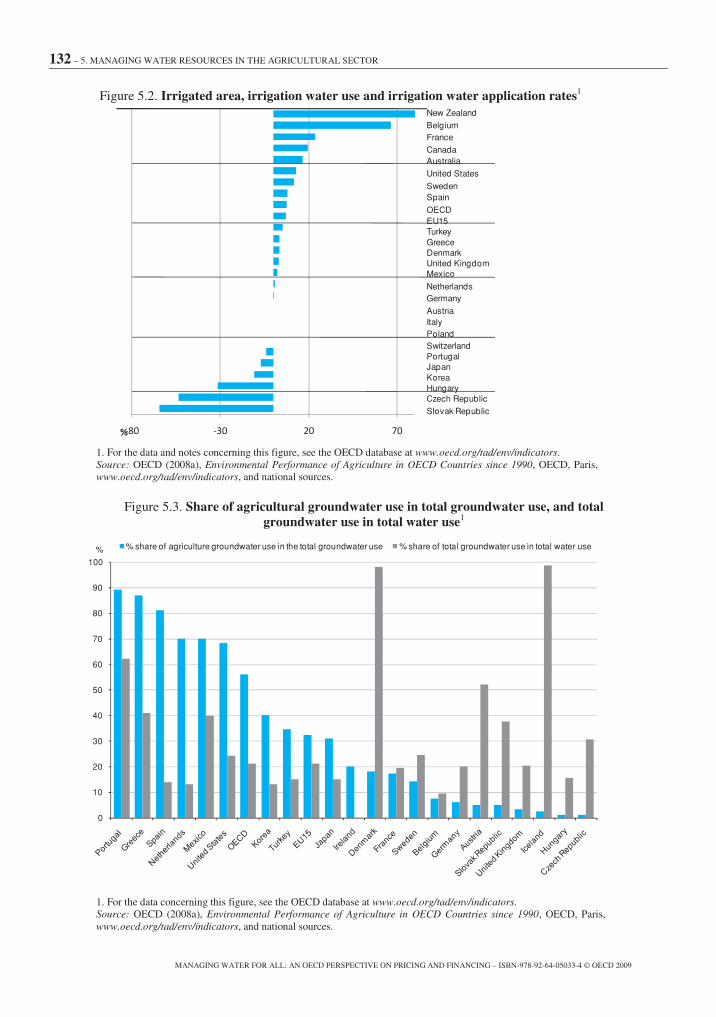
132 – 5. MANAGING WATER RESOURCES IN THE AGRICULTURAL SECTOR
MANAGING WATER FOR ALL: AN OECD PERSPECTIVE ON PRICING AND FINANCING – ISBN-978-92-64-05033-4 © OECD 2009
Figure 5.2. Irrigated area, irrigation water use and irrigation water application rates1
-80 -30 20 70%
New Zealand
BelgiumFrance
CanadaAustralia
United States
SwedenSpain
OECDEU15TurkeyGreeceDenmarkUnited KingdomMexico
NetherlandsGermany
AustriaItalyPolandSwitzerlandPortugalJapanKoreaHungaryCzech Republic
Slovak Republic
1. For the data and notes concerning this figure, see the OECD database at www.oecd.org/tad/env/indicators.Source: OECD (2008a), Environmental Performance of Agriculture in OECD Countries since 1990, OECD, Paris,www.oecd.org/tad/env/indicators, and national sources.
Figure 5.3. Share of agricultural groundwater use in total groundwater use, and totalgroundwater use in total water use1
0
10
20
30
40
50
60
70
80
90
100
% % share of agriculture groundwater use in the total groundwater use % share of total groundwater use in total water use
1. For the data concerning this figure, see the OECD database at www.oecd.org/tad/env/indicators.Source: OECD (2008a), Environmental Performance of Agriculture in OECD Countries since 1990, OECD, Paris,www.oecd.org/tad/env/indicators, and national sources.

5. MANAGING WATER RESOURCES IN THE AGRICULTURAL SECTOR – 133
MANAGING WATER FOR ALL: AN OECD PERSPECTIVE ON PRICING AND FINANCING – ISBN-978-92-64-05033-4 © OECD 2009
Table 5.2. Irrigated area, irrigation water use and irrigation water application rates1
Change in totalagricultural area
Share of irrigated areain total agricultural
area
Share of irrigationwater use in totalagricultural water
use
Irrigation water application rates
% % % Megaliters per hectare of irrigated land
1990-92 to 2002-04 2002-04 2002-04 1990-92 2002-04 % change
New Zealand -3 4 .. .. .. ..
Belgium 2 3 100 0.5 1.0 83
France -3 9 100 2.3 1.9 -17
Canada 1 2 94 3.5 3.6 1
Australia -4 1 100 8.7 4.3 -50
United States -3 5 99 9.4 8.4 -10
Sweden -6 2 70 2.1 1.7 -19
Spain -3 9 100 7.4 7.0 -5
OECD -3 4 .. 8.8 8.1 -9
EU15 -3 10 .. 4.9 5.1 5
Turkey 1 9 .. 5.7 9.5 69
Greece -1 17 100 5.5 5.9 7
Denmark -5 17 96 0.7 0.4 -48
United Kingdom -10 1 7 1.0 0.6 -46Mexico 1 6 97 9.9 8.7 -12
Netherlands -3 29 100 0.4 0.2 -61
Germany -1 3 .. 3.3 0.3 -91
Austria -3 0 5 12.5 2.5 -80
Italy -1 17 100 .. 7.7 ..
Poland -12 0.6 8 3.7 0.9 -77
Switzerland -3 2 .. .. .. ..
Portugal -3 15 100 8.9 8.6 -3
Japan -8 55 99 20.4 21.3 5
Korea -13 46 .. 14.3 .. ..
Hungary -8 2 24 2.1 1.3 -36
Czech Republic 0 0 98 0.7 1.0 36
Slovak Republic 0 4 80 0.5 0.4 -14
.. = not available
1. For the data and notes concerning this table, see the OECD database at www.oecd.org/tad/env/indicators.
Source: OECD (2008a), Environmental Performance of Agriculture in OECD Countries since 1990, OECD, Paris,www.oecd.org/tad/env/indicators, and national sources.
There have been mixed and diverse developments associated with the use ofwater resources by agriculture in OECD countries in recent years. On the positiveside, these include:
• Irrigated agriculture has outperformed dryland farming in terms of highercrop yields, and provides a growing share of the value of farm productionand exports for some OECD countries, as well as supporting ruralemployment in a number of regions.

134 – 5. MANAGING WATER RESOURCES IN THE AGRICULTURAL SECTOR
MANAGING WATER FOR ALL: AN OECD PERSPECTIVE ON PRICING AND FINANCING – ISBN-978-92-64-05033-4 © OECD 2009
• Increases in physical water productivity by agriculture, through bettermanagement and uptake of more efficient technologies, such as dripirrigation and adoption of water-saving farm practices, has contributed tohigher farm production. Overall the OECD average water application rateper hectare irrigated declined by 9% between 1990-92 and 2002-04, whilein most cases the volume of agricultural production increased.
• The adoption of drip irrigation, low pressure irrigation systems, and otherwater-saving technologies and practices, are becoming more widespread,while there are also some improvements in flood irrigation systems(e.g. laser levelling of fields, neutron probes for soil moisture measurement,scheduling of irrigation to plant needs, and faster flow regimes) andirrigation canal networks (e.g. replacing earth with concrete linings forirrigation canals).
• Pollutant discharges from agricultural land into surface water have beendeclining in recent years in many OECD regions, but information on thetrends in pollutants from irrigated land is patchy.
But on the negative side, these include:
• Pressure on water supplies through increased competition for waterresources between farmers and other water consumers, as well as for waterfor environmental purposes and associated recreational, fishing and culturalactivities. Increased competition for water resources, however, couldgenerate positive outcomes if it leads to resource allocation adjustments andhigher economic growth.
• Groundwater use for irrigation above recharge rates in some regions, whichis also undermining the economic viability of farming in affected areas andleading to harmful environmental impacts, such as reduced flows ofconnected surface waters.
• Farming is a major and growing source of groundwater pollution in somecountries and regions, mainly from nutrients, pesticides and salinity. This isof particular concern where groundwater provides a major share of drinkingwater supplies for both human consumption and farming.
• Over-exploitation of surface water resources in certain areas is damagingecosystems by reducing water flows below minimum flow levels in riversand lakes and for wetlands, which is also detrimental to recreational, fishingand cultural uses of these aquatic ecosystems.
• Agriculture is at risk from the growing incidence and severity of floods anddroughts in many OECD countries, leading to higher financial costs boththrough loss of production and damage to farm infrastructure, and the widereconomy in terms of loss of life and damage to property.

5. MANAGING WATER RESOURCES IN THE AGRICULTURAL SECTOR – 135
MANAGING WATER FOR ALL: AN OECD PERSPECTIVE ON PRICING AND FINANCING – ISBN-978-92-64-05033-4 © OECD 2009
While many of these developments are likely to continue into the future, OECD(2008b) projections of agriculture’s use of water resources up to 2030 (seeChapter 1), and the Intergovernmental Panel on Climate Change (IPCC, 2008)projections on climate change and water, highlight a number of new developmentsthat will need to be addressed:
• Global food and non-food demand will continue to increase with the growthin incomes, population and urbanisation. This will chiefly be driven bydeveloping countries, but agricultural production in many of these countrieswill be much more constrained by pressures on the natural resource base,including land and water, notably in China and India.
• With improvements in the physical efficiency of water use, agriculturalwater consumption is expected to gradually decline as a share of total waterconsumption in both OECD and non-OECD countries, but the decline isprojected to be faster in developing countries due to competition fromrapidly increasing non-agricultural water demands.
• OECD agricultural exporting countries are expected to be a continuingsource of increased food and non-food agricultural commodity exports,mainly to Asian, Sub-Saharan African, and Middle Eastern countries. Suchan expansion in OECD agricultural production and exports will necessitateimproving water use efficiency in agriculture if the overall use andpressures on water resources in agriculture are to be reduced.
• The IPCC (2008) report on climate change and water concludes that“observational records and climate projections provide abundant evidencethat freshwater resources are vulnerable and have the potential to bestrongly impacted by climate change, with wide-ranging consequences forhuman societies.” Specifically concerning agriculture the IPCC projects thatchanges in water quantity and quality due to climate change are expected toaffect food availability, stability, access and utilisation. Climate change isalso expected to affect the function and operation of existing waterinfrastructure – including hydropower, structural flood defences, drainageand irrigation systems – as well as water management practices. Moreover,current water management practices may not be robust enough to cope withthe impacts of climate change on water supply reliability, flood risk, health,agriculture, energy and ecosystems.
OECD policy experiences and options for sustainable water resourcemanagement in agriculture
Policies that can contribute to sustainable WRM in agriculture need toemphasise the following six principles.
1. Recognising the complexity and diversity of water resource managementin agriculture
Recognition of the complexity and diversity of WRM in agriculture isimportant from a policy perspective, as it means there is no one-size-fits-all policysolution to improving WRM. Policies addressing WRM need to be tailored and
136 – 5. MANAGING WATER RESOURCES IN THE AGRICULTURAL SECTOR
MANAGING WATER FOR ALL: AN OECD PERSPECTIVE ON PRICING AND FINANCING – ISBN-978-92-64-05033-4 © OECD 2009
targeted to both specific country situations and also regions within countries, takinginto account local climatic conditions and available water resources.
The scope of WRM complexity and diversity in agriculture includes thefollowing issues (Hanemann, 2006; Thompson, 2006):
• Hydrology: mobility of water, in that it flows, leaches, evaporates, and hasthe opportunity to be re-used, makes it distinctive as a commoditycompared to land, for example. Moreover, agriculture can contributepositively to the hydrological cycle, for example, through groundwaterrecharge and water purification functions; it can, however, also contributeto groundwater pollution and through excessive extraction lead to diversionof water from supporting ecosystems.
• Sources: agricultural water sources are varied and not, in general, asreliable as piped supply networks, depending on rainfall and “stored”sources, mainly surface water (rivers and lakes) and groundwater (shallowand deep aquifers). For those regions where competition for scarce waterresources is more intense, there is growing interest in using recycled water,mainly from processed drainage or sewage, and also desalinated water, butthese options currently provide only a very small and highly localisedsupply of water for agriculture.
• Uses: heterogeneity of water in terms of space, quality and variability overtime (seasonal and annual) presents challenges in matching supply anddemand. A given quantity of water is not the same as another available at adifferent location, point in time, quality and probability of occurrence. Theheterogeneity extends to structuring legal and institutional arrangements.Commonly, irrigation systems are a mix of publicly or collectively ownedsystems, and private systems where farmers have their own access togroundwater and/or invest in on-farm dams, reservoirs and irrigationinfrastructure. Depending on how these different systems are managed, theycan have varying consequences for the environment. It should also beemphasised that in periods of severe drought, the agricultural sector willfrequently be the first sector to have to release water to meet other userneeds, especially for urban water consumers.
• Economics: private (extraction) and public good (stewardship)characteristics of water imply different allocation mechanisms. When wateris used on a farm it is a private good, but when left in situ, such as anaquatic habitat, it is a public good for which private markets are absent.Moreover, water is largely used by the private sector (farms, households,industry) but its ownership and delivery is normally in the public domain.
• Institutions: water resources are managed through complex andmultilayered institutional and governance arrangements, often throughnational institutions and governance and, in some cases, cross nationalborders. Water institutions are also embedded in sub-national regional andlocal governments (water user associations), while the governance ofsurface water and groundwater are often separated.

5. MANAGING WATER RESOURCES IN THE AGRICULTURAL SECTOR – 137
MANAGING WATER FOR ALL: AN OECD PERSPECTIVE ON PRICING AND FINANCING – ISBN-978-92-64-05033-4 © OECD 2009
2. Reforming institutional systems for water management in agriculture
The shift in policies with a greater accent on demand rather than supplymanagement policies has brought reforms to the institutional and governancestructure managing water resources. But the progress and path of water policyreforms has been mixed across OECD countries. Some countries have alreadyundertaken major changes in water policies or are in the early stages of reformprogrammes, but for a few countries the progress toward reform has been limited.
Water policy reforms need to be developed as an integrated part of a broaderreform framework, encompassing institutional changes to the way water servicesare delivered; defining water property (access) rights and entitlements; recoveringcosts for the delivery of water to agriculture; and providing a solid base for thefinancing of water delivery infrastructure so that the capital stock is not degraded.Also water policy reform processes should be seen in a longer term perspective asan integral part of the policy functions of government. This is becoming moreimportant as climate change impacts on agriculture, taking the industry intouncharted territory in terms of water available to farmers, and the impact of floodand drought events on their businesses and surrounding areas.
Policy frameworks need to incorporate a high level of intra-governmentministerial co-operation and coherence. Fiscal incentives for those governing waterat the state/provincial or water basin level may be needed – at least in a transitionalphase – to facilitate adjustment by farmers. Where farmers and other users ownwater distribution infrastructure they may be more likely to accept an increase inwater charges and higher rates of cost recovery for water delivered to theirproperties than when they are imposed externally (Parker and Speed, forthcoming).
Water property rights in most OECD countries involve a complex set of rules,where water is often allocated in terms of quantities rather than prices, betweenusers and for environmental needs. As pressures build up to reallocate waterbetween users, this underlines the need for water access rights to become moreflexible and supporting institutions more robust to ensure an economically efficientand environmentally effective allocation of water. But it also emphasises the needto explore innovative water-market solutions as allocative mechanisms.
Simplification of institutional arrangements, water-pricing rules and tradingarrangements for agricultural water use, would improve transparency andaccountability. There are frequently a plethora of institutions involved in managing,allocating and regulating water resources at all levels of government from local tonational. These complexities can result in differing practices and regulations at theriver basin level that create inefficiencies in allocation or trading of water resourcesto the highest value uses.
Progress has been made, however, towards decentralisation of institutionalarrangements concerning water governance, from national/regional governmentlevels to a water-basin level, favouring greater local engagement and involvementof water users in resource management. Some caution is necessary with the processdecentralisation, however, as on occasions basin level management may requirenational involvement to avoid upstream players in a basin securing most of thewater.
Developing stakeholder involvement is crucial to improve water and watershedmanagement, but this takes time. Targeting communities, rather than individuals,

138 – 5. MANAGING WATER RESOURCES IN THE AGRICULTURAL SECTOR
MANAGING WATER FOR ALL: AN OECD PERSPECTIVE ON PRICING AND FINANCING – ISBN-978-92-64-05033-4 © OECD 2009
may be a preferred solution to water governance issues. But transaction costs forstakeholder involvement can be high, especially in the initial phase of pilotprogrammes, which points to the need to translate these pilots to a broader adoptionor implementation at a larger scale so as to streamline the stakeholder engagementprocess. In this context, governments also need to monitor the equity anddistributional effects of water reform policies on different stakeholders, andintroduce appropriate safeguards and mechanisms to address these effects wherethey may be detrimental to both the farmer and wider community welfare.
Water planning and management in agriculture requires funding. Thespecification of water entitlements and developing water markets is often a pre-condition to a well-functioning water planning and management system. Theoperation of irrigation schemes, management of entitlements within them, and thedelivery and pricing of the water under those entitlements occur within frameworksadministered by water-resource agencies, often in the public domain, and whichneed to be adequately resourced. But to the extent that farmers are beneficiaries ofpublic water-delivery systems, then the associated costs should be reflected in theirwater charges.
3. Ensuring charges for water supplied to agriculture cover delivery costs3
Rates of cost recovery, mainly operation and maintenance costs, for irrigationwater delivered to farmers are increasing across most OECD countries, due to acombination of (which varies in importance regionally): changes in publicpreferences regarding water allocation among competing uses includingenvironmental needs; greater budget scrutiny by national and sub-nationalgovernments; high energy prices; and increasing awareness and impact of climatevariability and climate change with the implications for rainfall and the availabilityof water resources.
These issues will likely, in most cases, continue to encourage policy makers tofurther extend water pricing and other market-based incentives to improve cost-recovery rates for water supplies and motivate further improvements in water useefficiency in agriculture. Inevitably farm-level costs will increase (although theshare of water in total farm costs may not in many cases be very significant), butinnovative management and wise use of technology will enable farmers to adjust togenerate greater value from limited water resources.
While water-market formation and the use of water-pricing instruments canbring benefits in improving water use efficiency in agriculture, expectations thatthese approaches alone can adequately address economic, environmental and socialissues related to water are often over-optimistic. This is because there remain manyimpediments to water-market formation related to, for example, issues of equity,incomplete science, specific quantity-related property rights, high transaction costsin creating water markets, and the historical allocation of water.
There are still many farmers in some countries, and regions within countries,who benefit from policies that allow them to forego repaying capital expendituresfor irrigation infrastructure, or to schedule repayment over many years with zerointerest. But the number and proportion of such arrangements is beginning todecline with water-policy reforms. Increasingly governments seem inclined torequire cost recovery for any future irrigation projects and to improve the rate of
5. MANAGING WATER RESOURCES IN THE AGRICULTURAL SECTOR – 139
MANAGING WATER FOR ALL: AN OECD PERSPECTIVE ON PRICING AND FINANCING – ISBN-978-92-64-05033-4 © OECD 2009
cost recovery, as much as possible, from existing projects. There is also an effort toshift from pricing for irrigation water based on the area covered to the volume ofwater used in many countries.
The possibilities of using water markets and pricing as a policy tool to achieveenvironmental objectives in agriculture seems, however, to be more limited. Inaddressing these issues a different mix of policies may be appropriate, such as theuse of well-targeted payments where farmers provide a clearly defined andverifiable public good or service, such as wetland conservation areas. Regulatoryand planning instruments might be most applicable in the case of addressingsustainable use of groundwater resources, although these policy instruments arealso essential for setting the management frameworks for surface water. For a fewcountries, however, they are using water markets to meet environmental objectives,such as purchasing water entitlements to rebalance water consumer andenvironmental needs, and public sector water purchases to supplement watersupplies to wetlands.
Defining, securing and agreeing among stakeholders the quantity of waterneeded in a water basin to sustain environmental outcomes is a key issue for manyOECD countries. This will necessitate enhancing the knowledge and monitoring ofwater flows and interconnections between surface and groundwater flows, and re-examining the concept of “minimum flows” as the sole measure to assessenvironmental needs in rivers and lakes. This is also linked to the need to improvemethods for identifying natural water bodies and aquatic biodiversity that areconsidered to be under threat.
Water policies in many countries also need to address the imbalance betweenthe current focus on surface water and pay greater attention to the overuse andpollution of groundwater and the full water cycle. In addition, policy makers haveto consider a range of mechanisms, including market approaches that can be used toallocate water between different uses, as over-allocation of water to title holderscan lead to economic and environmental damage.
The costs of pumping groundwater can be expected to increase with theanticipated higher levels of energy prices and declining water table levels. OECDgovernments will likely increase their efforts to manage groundwater as scarcityincreases in many areas, and as the public becomes more concerned about theregional economic implications of groundwater overdraft.
Recent increases in public awareness of the potential implications of climatechange and public concerns regarding sustainability will further encourage policymakers to intensify their management of groundwater resources, while alsoenhancing the need for new regulatory measures that might include charges thatreflect scarcity values. But achieving cost recovery for groundwater supplies iscomplex, as is the development of a market for groundwater. The property rightsissue is central in this respect.
Many irrigation areas in OECD countries face the problem of aginginfrastructures and a declining revenue base from which to fund maintenance andrepair activities. The drive toward cost recovery for storage and delivery servicesarising from water reform policies means that both water suppliers and irrigatorsare beginning to consider the strategic evaluation of infrastructure renewal toremain viable. This raises questions as to future sources of finance and asset

140 – 5. MANAGING WATER RESOURCES IN THE AGRICULTURAL SECTOR
MANAGING WATER FOR ALL: AN OECD PERSPECTIVE ON PRICING AND FINANCING – ISBN-978-92-64-05033-4 © OECD 2009
management. The transfer of financial control and investment management mayrequire water user groups to seek public private partnerships to raise capital anddevelop skills in long-term asset management for infrastructure renewal.
4. Enhancing agriculture’s resilience to climate change and climatevariability impacts
Farming systems and water resources have been increasingly vulnerable toclimate change and climate variability, although there is significant regionalvariation within and across OECD countries. The most recent IPCC (IPCC, 2008)assessment and OECD government reports confirm that this trend is expected tocontinue.4
Changes in water availability and temperature, as well as the growing incidenceand severity of floods and droughts, will require high levels of adaptive responsesto address these issues so as to enhance the resilience of agricultural systems toproduce enough food, fibre and fuel in light of these events. However, it should bestressed that in some countries (that are constrained at present in terms ofexpanding agriculture) climate change may lead to benefits and positiveopportunities for agriculture.
Climate change can also have a dual effect on irrigated agriculture. This mayoccur through both higher water demand by agriculture and an expansion of thearea irrigated These developments are due to both general climate change (highertemperatures and lower precipitation) and climate variability leading to an increasein extreme events, especially the frequency of droughts, necessitating therestructuring of irrigation systems.
As the frequency and severity of drought and flood events is increasing, this isleading to rising budgetary costs for governments in supporting affected farmersand the rural community, and higher costs for private insurers (OECD, 2006). Therising cost of flood and drought relief, for agriculture and society as a whole, isexacerbated in some cases by the fragmentation of responsibility and the lack ofpolicy coherence in agricultural, environmental, land and water policies to addressthese problems.
Where farmers are guaranteed government support in times of flood anddrought disasters (moral hazard), this does not always signal the incentives toimprove farmer self-reliance and risk management for adverse events. Hence,greater policy attention and investment will be required in water control (forfloods), water retention (droughts) and farm practices that can reduce economiclosses and lead to better management of water flows and stocks on farmland.
Given the prospect for increasing flood events associated with climate change,farmland is likely to play an important role in mitigation and adaptation strategiesfor flood risk management. Policies that are able to combine flood risk managementwith other objectives, such as for nature conservation, the protection of naturalresources and agricultural production, are likely to offer the best long-termsolutions.
Where particular agricultural land management practices are known to result inserious flood risk, there may be a call for regulation and compliance with “goodpractice”. Moreover, in cases where farmers purposefully manage land to retain and

5. MANAGING WATER RESOURCES IN THE AGRICULTURAL SECTOR – 141
MANAGING WATER FOR ALL: AN OECD PERSPECTIVE ON PRICING AND FINANCING – ISBN-978-92-64-05033-4 © OECD 2009
store potential floodwater to reduce flood risk for the benefit of others, there can bescope for policies to reward them accordingly, although this may be highlylocalised (Morris, Hess and Posthumus, forthcoming).
In many OECD countries the incidence and severity of drought events has alsobeen increasing over recent decades, with the resulting decrease in agriculturalproduction, as has been the case for floods. The expectation is that such events willoccur more frequently in the future due to climate change and climate variability,so improving the resilience of agriculture to drought will also be important.
It is essential in drought-prone areas for agriculture to improve its water useefficiency, in part, to free water for other users and environmental purposes. Thismight be achieved through: reducing leakages in delivery systems; developing on-farm rain harvesting practices and systems (e.g. conservation tillage, fallowrotations); greater use of recycled sewage/drainage water and desalinated water,where appropriate; improving soil moisture measurement; increasing adoption ofmore efficient water application technologies, such as use of nanotechnologies;encouraging greater adoption of drought resistant cultivars; and harnessing waterbanks by recharging groundwater during times of low seasonal demand for water.
But whether these higher water use efficient systems and practices actuallyreduce water demand will depend on the hydrologic conditions of the site or waterbasin and the legal provisions that curb farm/basin consumptive use. Moreover, inmany cases the technologies to make water savings are already known, but it is thebarriers to their adoption that are an important challenge for policy makers.
5. Improving policy integration between agriculture, water, energy andenvironment policies
For many OECD countries policies across agriculture, water, energy andenvironment are formulated without explicitly considering their interrelationship inany comprehensive manner or their unintended consequences. Recognition (andpractical implementation) of policy integration across different scales of decisionmaking – from the farm through to water catchment, national and internationallevels – is a gap in many countries. Policy coherence and integration also relates tobroader national questions of what institutions make decisions to allocate wateracross sectors and for environmental needs.
Some progress, however, is being made toward greater policy coherence andintegration, in particular, in relation to flood plain management, land use and waterpolicies, and also concerning decoupling of agricultural policies and water useefficiency. In the case of links between the support for energy in agriculture and theproduction of biofuels from agricultural feedstocks, however, further progress isrequired to develop policy coherence in the context of improving WRM inagriculture.
More integrated and coherent policy approaches are beginning to take shape ascountries address climate change, such as between previously separated policydomains of climate change, water policy, flood and drought control policies, andagri-environmental policies. For example, the restoration of land in flood plains byplanting trees has helped to reduce impacts of floods, improved water quality, andled to co-benefits such as restoring biodiversity and sequestering greenhouse gases.
142 – 5. MANAGING WATER RESOURCES IN THE AGRICULTURAL SECTOR
MANAGING WATER FOR ALL: AN OECD PERSPECTIVE ON PRICING AND FINANCING – ISBN-978-92-64-05033-4 © OECD 2009
Agricultural and agri-environmental support policies across OECD countriesact to provide an intricate mix of incentives and disincentives toward sustainableWRM. The use of crop and livestock market price support provides incentives tointensify agricultural production, while support for farm inputs, especially water(lowering water charges and for on-farm irrigation infrastructure costs) and energy(for water pumping) misalign farmer incentives and can aggravate overuse andcreate pollution and other environmental damage to water resources, especiallywhere water stress is a serious issue and the value of water is high.
But isolating and quantifying the overall economic efficiency andenvironmental effectiveness of agricultural and agri-environmental support onwater resources is difficult, and further analysis on causation is needed. This isbecause farmers are usually responding to a very complex set of signals in makingwater-management decisions, including institutional constraints (e.g. regulations onwater allocations), or because the change in relative prices associated with reducedoutput-linked payments may cause farmers to switch to previously non-supportedcrops that are more water intensive than those that benefited from coupled supportpayments.
Water use efficiency increases that might derive from shifting to decoupledsupport may also not benefit the environment. Whether and to what extent theenvironment benefits may depend, in part, on the use of the “saved” water. If it isused to expand irrigated land, or to shift to crops that are more water intensive, theenvironment will not necessarily benefit from efficiency improvements. Again, thecomplicated set of water-allocation institutions and property rights will drive thisrelationship. Moreover, some environmental policies have affected the supply ofwater for agriculture, by increasing quantities available for the environment. Evenso, preliminary studies of the EU Common Agricultural Policy reforms, forexample, suggest that the shift to decoupled payments has led to a reduction ofirrigation (especially maize, a water-intensive crop) in areas where water stress isan issue (Garrido and Calatrava, forthcoming).
Agricultural policy reforms across most OECD countries, however, has led toan overall reduction in support levels (as measured by the OECD’s ProducerSupport Estimates) and decrease in the share of support most linked to commodityproduction and unconstrained use of inputs (such as water and energy) (OECD,2008c). The shift to decoupled agricultural policy measures is likely to lead to apositive outcome for water resources and the environment, especially in water-stressed environments. Hence, the increasing adoption of agri-environmentalmeasures by OECD countries has both a direct (e.g. wetland conservation) andindirect (e.g. conservation tillage helping to retain soil moisture) effect onimproving WRM and environmental outcomes.
As long as market support for commodity production remains and water andenergy support to farmers persists, however, this will work against the gains fromdecoupled support measures. But decoupling support from production and inputsdoes provide a basis for improving water efficiency and enhancing environmentalbenefits in agriculture, especially where there is a cross compliance conditionattached to a decoupled payment (e.g. authorisation of water abstractions rights as aprecondition for implementing “good” agri-environmental practices).
The continued use of support for energy in agriculture, both directly throughsupport for diesel and electricity, and indirectly for feedstocks to produce biofuels
5. MANAGING WATER RESOURCES IN THE AGRICULTURAL SECTOR – 143
MANAGING WATER FOR ALL: AN OECD PERSPECTIVE ON PRICING AND FINANCING – ISBN-978-92-64-05033-4 © OECD 2009
and bioenergy, can increase pressure on water resources. This is most evidentwhere support for energy, by reducing pumping costs, is leading in some countriesto excessive extraction of groundwater, and removal of this form of support maycontribute to more sustainable water use in agriculture (OECD, 2008a).
The overall impacts on water balances of supporting agricultural feedstocks toproduce biofuels and bioenergy, however, is complex and remains unclear.5 It is alargely empirical question and needs to be assessed in a way that compares theeffects of alternative uses of resources. However, research suggests that thequantity of water needed to produce each unit of energy from second generationbiofuel feedstocks (e.g. lignocellulosic harvest residues and forestry) is three toseven times lower than the water required to produce ethanol from first generationfeedstocks (such as from maize, sugar cane and rapeseed), although this can varyaccording to the location and practices adopted (Berndes and Borjesson, 2001).
6. Addressing knowledge and information deficiencies to better guidewater resource management
Improving the effectiveness and efficiency of policies to achieve societal goalsrelated to water requires better information at many levels. This is especiallyimportant because water reforms are tending to become more decentralised andcomplex, while management of water in agriculture is highly diverse. Achievingcost recovery targets, developing water pricing and trading mechanisms, clarifyingwater entitlements and changing institutional arrangements, need to be underpinnedby more and reliable information.
A substantial effort is underway across many OECD countries to addressinformation deficiencies to better guide policy making. Encouraging examples arethe monitoring of minimum water flow rates in rivers as part of environmentalplanning. Moreover, comprehensive river basin assessments are being undertaken,for example, in the EU under the Water Framework Directive and in Australiaunder the National Water Initiative. However, considerable information andknowledge gaps still remain.
In five key areas improvements in knowledge, science and monitoring of waterresources in agriculture could help better inform policy makers, stakeholders andthe wider public:
• Improving the knowledge and science of the inter-relationships betweenagriculture and water availability, and between surface water andgroundwater flows.
• Establishing robust databases on trends in water resource availability anduse, including use by agriculture. This includes data on the sources of waterused; improved calculations of the physical and economic efficiency ofwater use in agriculture; and a better understanding of the links between on-farm water use and off-farm environmental impacts.
144 – 5. MANAGING WATER RESOURCES IN THE AGRICULTURAL SECTOR
MANAGING WATER FOR ALL: AN OECD PERSPECTIVE ON PRICING AND FINANCING – ISBN-978-92-64-05033-4 © OECD 2009
• Increasing the quantity and quality of information on cost recovery ratesfor water supplied to agriculture. Considerable caution is required in usingand comparing data on cost recovery rates and agricultural water charges,both within and between countries, because of the (Garrido and Calatrava,forthcoming; Nickum and Ogura, forthcoming):
− Lack of transparency in data related to the financial costs for supplyingwater, especially capital costs. Simplification of water pricing and cost-sharing mechanisms on a system-wide basis would improvetransparency and make it possible to establish more precise estimates ofhow much of total irrigation capital costs are covered by central andlocal governments, co-operatives and private businesses, including farmenterprises.
− Many water distribution networks and storage facilities are often sharedwith multiple users, including agriculture, so allocating financial coststo different water users is complex, while knowing how much water isactually supplied to agriculture undermines efforts to improve costrecovery rates.
− Major publicly funded irrigation projects are often undertaken overmany decades in a piecemeal fashion, making accountancy of theprojects difficult.
− Evaluation of replacement costs over the lifecycle of a dam or reservoiris complex.
• Developing information systems and tools to better inform watermanagement allocation decisions. This applies at the: strategic planninglevel in order to optimise the planning of irrigation infrastructures, such asinformation systems to assist planning decisions in the face of increasingclimatic variability; tactical level, to identify the optimal allocation of waterfor a given period (season, year); and at the operational decision-makinglevel, to optimise water distribution at the farm level. The latter alsorequires improvements in the tools to manage water systems, such asproviding technical information and advice, and offering farmerseducational programmes on best practices to adopt, especially as climate-related change impacting on water may require changes to current farmpractices.
• Greater evaluation of the impacts of policies on environmental andeconomic outcomes in the context of agricultural water resourcemanagement. This would provide a contribution to broader based agri-environmental policy evaluation, such as the need to better understand thelink between agricultural policies and water use efficiency. Aside fromacademic research on these linkages, there is little evaluation bygovernments of the environmental effectiveness and economic efficiency ofagricultural water resource management policies. Quantifying the net costsand benefits of water resource use by agriculture in a sustainabledevelopment framework is a necessary component.
5. MANAGING WATER RESOURCES IN THE AGRICULTURAL SECTOR – 145
MANAGING WATER FOR ALL: AN OECD PERSPECTIVE ON PRICING AND FINANCING – ISBN-978-92-64-05033-4 © OECD 2009
As water policies become more sophisticated when applied to agriculture, theanalysis and evaluation needs to be underpinned by relevant information and soundadministration. Hence, policy implementation and evaluation requires attention tothe “soft” infrastructure – meters, stream gauging networks, hydrologic andscientific support, water reporting systems, farm surveys, and benchmarking ofirrigation businesses (Parker and Speed, forthcoming).
Water entitlements and trading, moreover, require real-time management offlows in rivers and detailed monitoring of extractions. In the longer term, asustainable water entitlement system implies a sound understanding of the(technical) science related to river health and hydrologic performance, and(economic) assessments of the efficiencies of monopoly water businesses and theconsequences of reforming monopoly structures for agricultural production (Parkerand Speed, forthcoming).
None of this information is obtained cheaply or easily, but without it policyreforms will be at a disadvantage and effective water policy decision making,planning and management could be impeded.
Notes
1. This chapter is based on a forthcoming OECD (late 2009) publication,Sustainable Management of Water Resources in Agriculture, OECD, Paris,www.oecd.org/tad/env.
2. The linkages between agriculture and water quality are partly examined inOECD (2008a), but this issue will also form part of a forthcoming OECDproject commencing in 2009.
3. Delivery costs include operation and maintenance costs and capital costs,covering both renewal of existing infrastructure and new capital investmentcosts. This section draws on five forthcoming OECD consultant reportsincluded in OECD (forthcoming) as follows: Cakamak, forthcoming; Garridoand Calatrava, forthcoming, Nickum and Ogura, forthcoming; Parker andSpeed, forthcoming; Wichelns, forthcoming.
4. For a selection of recent OECD country reports on climate change, agricultureand water, see for example: CSIRO, 2008 (Australia); Lemmen, et al, 2007(Canada); European Parliament, 2008 and Portuguese Ministry of Environment,2007 (European Union); USEPA, 2008 (United States).
5. There is a growing research literature on the relationship between agriculturalcultivation of feedstocks for biofuel and bioenergy production and its impact onwater resources and pollution; see for example: Berndes (2008); Berndes andBorjesson (2001); EEA (2008); de Fraiture, Giordano and Liao (2008);Hellegers, Perry and Berkoff (2008); Liao, Giordano and de Fraiture (2007);National Research Council (2008); Varis (2007).

146 – 5. MANAGING WATER RESOURCES IN THE AGRICULTURAL SECTOR
MANAGING WATER FOR ALL: AN OECD PERSPECTIVE ON PRICING AND FINANCING – ISBN-978-92-64-05033-4 © OECD 2009
References
Berndes, G. (2008), “Future Biomass Energy Supply: The Consumptive Water UsePerspective”, Water Resources Development, Vol. 24, No. 2, pp. 235-245.
Berndes, G., and P. Borjesson (2001), “Implications of Irrigation and Water Managementfor the Net Energy Performance of Bioenergy Systems”, Department of PhysicalResource Theory, Chalmers University of Technology and Goteborg University,Sweden.
Cakamak, E. (forthcoming), “Agricultural Water Pricing: Turkey”, OECD consultantreport, www.oecd.org/tad/env.
CSIRO (Commonwealth Scientific and Industrial Research Organisation) (2008), “AnOverview of Climate Change Adaptation in Australian Primary Industries: Impacts,Options and Priorities”, National Climate Change Research Strategy for PrimaryIndustries, CSIRO, Australia.
EEA (European Environment Agency) (2008), “A Review of the Possible Impact ofBiomass Production from Agriculture on Water”, Copenhagen, Denmark,www.eea.europea.eu.
European Parliament (2008), “Climate Change-Induced Water Stress and its Impact onNatural and Managed Ecosystems”, Policy Department, Economic and ScientificPolicy, European Parliament, Brussels, Belgium.
de Fraiture, C., M. Giordano and Y. Liao (2008), “Biofuels and Implications forAgricultural Water Use: Blue Impacts of Green Energy”, Water Policy, Vol. 10,Supplement 1, pp. 67-81.
Garrido, A. and J. Calatrava (forthcoming), “Agricultural Water Pricing: EU andMexico”, OECD consultant report, www.oecd.org/tad/env.
Hanemann, W.H. (2006), “The Economic Conception of Water”, in P.P. Rogers,M.R. Llamas and L. Martinez-Cortina (eds.), Water Crisis: Myth or Reality, Taylorand Francis, London.
Hellegers, P., C.J. Perry and J. Berkoff (2007), “Water Pricing in Haryana India”, inF. Molle and J. Berkoff (eds.), Irrigation Water Pricing: The Gap Between Theoryand Practice, Chapter 8, CABI, Wallingford.
IPCC (Intergovernmental Panel on Climate Change) (2008), “Climate Change andWater”, IPCC Technical Paper VI, Geneva.
IWMI (International Water Management Institute) (2007), “Water for Food, Water forLife: A Comprehensive Assessment of Water Management in Agriculture”, IWMI,Columbo, Sri Lanka.

5. MANAGING WATER RESOURCES IN THE AGRICULTURAL SECTOR – 147
MANAGING WATER FOR ALL: AN OECD PERSPECTIVE ON PRICING AND FINANCING – ISBN-978-92-64-05033-4 © OECD 2009
Lemmen, D.S., F.J. Warren, J. Lacroix and E. Bush (eds.) (2007), “From Impacts toAdaptation: Canada in a Changing Climate 2007”, Government of Canada, Ottawa,Ontario, http://adaptation.nrcan.gc.ca/assess/2007/toc_e.php.
Liao, Y., M. Giordano and C. de Fraiture (2007), “An Empirical Analysis of the Impactsof Irrigation Pricing Reforms in China”, Water Policy, Vol. 9, Supplement No. 1,pp. 45-60.
Molle, F. and J. Berkoff (2007), “Water Pricing in Irrigation: The Lifetime of an Idea”, inF. Molle and J. Berkoff (eds.), Irrigation Water Pricing: The Gap Between Theoryand Practice, Chapter 1, CABI, Wallingford.
Morris, J., T. Hess and H. Posthumus (forthcoming), “Agriculture’s Role in FloodAdaptation and Mitigation: Policy Issues and Approaches”, OECD consultant report,www.oecd.org/tad/env.
National Research Council (2008), Water Implications of Biofuels Production in theUnited States, National Academies Press, Washington, DC,http://books.nap.edu/catalog.php?record_id=12039.
Nickum, J.E. and C. Ogura (forthcoming), “Agricultural Water Pricing: Japan andKorea”, OECD consultant report, www.oecd.org/tad/env.
OECD (2006), Water and Agriculture: Sustainability, Markets and Policies, OECD,Paris.
OECD (2008a), Environmental Performance of Agriculture in OECD Countries Since1990, OECD, Paris, www.oecd.org/tad/env/indicators.
OECD (2008b), OECD Environmental Outlook to 2030, OECD, Paris.
OECD (2008c), Agricultural Policies in OECD Countries at a Glance 2008, OECD,Paris.
OECD (forthcoming), Sustainable Management of Water Resources in Agriculture,OECD, Paris, France, www.oecd.org/tad/env.
Parker, S. and R. Speed (forthcoming), “Agricultural Water Pricing: Australia”, OECDconsultant report, www.oecd.org/tad/env.
Portuguese Ministry of Environment (2007), “Water Scarcity and Drought: A Priority ofthe Portuguese Presidency”, Lisbon.
Thompson, M. (2006), “National Water Initiative – The Economics of WaterManagement in Australia – An Overview”, in Water and Agriculture: Sustainability,Markets and Policies, OECD, Paris, pp. 81-93.
USEPA (US Environmental Protection Agency) (2008), “The Effects of Climate Changeon Agriculture, Land Resources, Water Resources, and Biodiversity in the UnitedStates”, USEPA, Washington, DC.
Varis, O. (2007), “Water Demands for Bioenergy Production”, Water ResourcesDevelopment, Vol. 23, No. 3, pp. 519-535.
Wichelns, D. (forthcoming), “Agricultural Water Pricing: United States”, OECDconsultant report, www.oecd.org/tad/env.

OECD PUBLISHING, 2, rue André-Pascal, 75775 PARIS CEDEX 16
PRINTED IN FRANCE
Printed on paper from a sustainably managed forest
(97 2009 02 1 P) ISBN 978-92-64-05033-4 – No. 56665 2009
Faux-titre.fm Page 3 Friday, February 6, 2009 1:54 PM

Managing Water for All An oecd perspective on pricing And finAncing Water is a key prerequisite for human and economic development, and for maintaining ecosystems. However, billions of people lack access to water and sanitation services, mainly due to poor governance and inadequate investment and maintenance. The situation is becoming more urgent due to increasing pressure, competition and even conflict over the use of water resources.
The OECD has been working for many years to address these challenges. The results of recent work are summarised in this report, which emphasises the economic and financial aspects of water resources management and water service provision, the need for an integrated approach (including governance considerations) to address these complex policy challenges, and the importance of establishing a firm evidence base to support policy development and implementation.
This report examines: strategic financial planning for water supply and sanitation that balances the key sources of revenues for the water sector – the “3Ts” of taxes, tariffs and transfers; the design and implementation of water pricing strategies that balance financial sustainability with other policy objectives; recent developments in private sector participation in the water sector; and trends and the future outlook of water use in agriculture. It considers both developing and OECD countries and offers concrete recommendations and checklists for action. The report is an invaluable resource for policy makers, academics, NGOs and all others interested in the challenges facing the water sector today.
The full text of this book is available on line via this link: www.sourceoecd.org/environment/9789264050334
Those with access to all OECD books on line should use this link: www.sourceoecd.org/9789264050334
sourceoecd is the OECD online library of books, periodicals and statistical databases. For more information about this award-winning service and free trials ask your librarian, or write to us at [email protected].
www.oecd.org/publishing
isbn 978-92-64-05033-4 97 2009 02 1 p -:HSTCQE=UZUXXY:
Manag
ing W
ater for A
ll An
oe
cd
pe
rs
pe
ct
ive
on
pr
icin
g A
nd
fin
An
cin
g
Managing Water for AllAn oecd perspective on pricing And finAncing
Co-distributed byIWA PublishingAlliance House, 12 Caxton Street,London SW1H OQS, UKTelephone: +44 (0) 20 7654 5500Fax: +44 (0) 20 7654 5555E-mail: [email protected]