managing to work differently 19951 and 20002 reports to provide five-year longitudinal information....
TRANSCRIPT

Managing to work differently Results from the RCN Employment Survey 2005
October 2005
Published by the Royal College of Nursing20 Cavendish SquareLondon W1G 0RN
020 7409 3333
The RCN represents nurses and nursing, promotes excellence in practice and shapes health policies
Publication code 003 006
w w w. r c n . o rg . u k
Survey cover_2 10/10/05 17:54 Page 1

Managing to work differently
Results from the RCN Employment Survey 2005
Jane Ball
Geoff Pike
Employment Research Ltd

Managing to Work Differently – RCN Employment Survey 2005 2
Acknowledgements
This report was commissioned by the Royal College of Nursing and conducted by Jane Ball and Geoff Pike from the independent research consultancy Employment Research Ltd.
The authors would like to thank Josie Irwin, Head of RCN Employment Relations, and her team for advising and commenting on all aspects of the project throughout the research process. They would also like to thank the nurses who took part in the survey, and the authors of earlier RCN employment survey reports.
Employment Research Ltd
Employment Research Ltd is a small independent research consultancy formed 11 years ago. The consultancy undertakes a range of research and evaluation, and for the last five years Employment Research Ltd has undertaken the annual RCN Employment survey and conducted the RCN Working Well survey.
For further information:
Employment Research Ltd: 45 Portland Road, Hove, BN3 4LR.
Telephone: 01273 299719
Website: www.employmentresearch.co.uk
Email: [email protected] Published by the Royal College of Nursing, 20 Cavendish Square, London, W1G 0RN © 2005 Royal College of Nursing. All rights reserved. No part of this publication may be reproduced, stored in a retrieval system, or transmitted in any form or by any means electronic, mechanical, photocopying, recording or otherwise, without prior permission of the Publishers or a licence permitting restricted copying issued by the Copyright Licensing Agency, 90 Tottenham Court Road, London W1T 4LP. This publication may not be lent, resold, hired out or otherwise disposed of by ways of trade in any form of binding or cover other than that in which it is published, without the prior consent of the Publishers.

Managing to Work Differently – RCN Employment Survey 2005
3
Preface Any survey is highly dependent on the target research group being sufficiently interested and concerned in the issues raised to participate in the research. It is commendable that so many nurses participate each year in this project. Each survey benefits hugely from the longitudinal research and continuity in methods and questions. The authors have made extensive use of the reports produced by the Institute for Employment Studies between 1987 and 1999, and Employment Research Ltd since 2000. In particular, this 19th survey has used a great deal of the material from the 19951 and 20002 reports to provide five-year longitudinal information.
1 Seccombe I and Patch A (1995) Recruiting, retaining and rewarding qualified nurses in 1995, London: IES/RCN. IES Report 295. 2 Ball J and Stock J (2000) All part of the plan? A stock-take of registered nurses in the year 2000, London: RCN. Publication code 001 365.

Managing to Work Differently – RCN Employment Survey 2005 4
Managing to work differently: results from the RCN Employment Survey 2005 Contents
2005 survey summary __________________________________________________ 6
1. Introduction _______________________________________________________ 10
The 2005 RCN Employment Survey _______________________________________ 10
Context ______________________________________________________________ 10
Method ______________________________________________________________ 12
Respondents’ employment status __________________________________________ 13
Report structure _______________________________________________________ 14
2. Profile ____________________________________________________________ 15
Age profile ___________________________________________________________ 15
Gender and ethnicity____________________________________________________ 17
Length of service profile ________________________________________________ 19
Current job and employer________________________________________________ 22
Key points: chapter 2 ___________________________________________________ 23
3. Rewarding nurses ___________________________________________________ 24
Pay scales and grade distribution __________________________________________ 24
Inappropriate grading ___________________________________________________ 27
Additional jobs ________________________________________________________ 29
Pay satisfaction________________________________________________________ 32
Agenda for Change (AfC) _______________________________________________ 35
Key points: chapter 3 ___________________________________________________ 38
4. Role and job description _____________________________________________ 39
Role content __________________________________________________________ 39
Job descriptions _______________________________________________________ 42
Key points: chapter 4 ___________________________________________________ 45
5. Job change and career intentions ______________________________________ 47
Changing jobs/employer_________________________________________________ 47
Moving up ___________________________________________________________ 50
Future plans __________________________________________________________ 51
Key points: chapter 5 ___________________________________________________ 54
6. Working hours _____________________________________________________ 55
Part-time working______________________________________________________ 55

Managing to Work Differently – RCN Employment Survey 2005
5
Number of hours worked ________________________________________________ 58
Views of working hours _________________________________________________ 61
Working patterns and shift working ________________________________________ 62
Key points: chapter 6 ___________________________________________________ 65
7. Workload and staffing _______________________________________________ 66
Nurse-to-patient ratios __________________________________________________ 66
Effects of changes on workload ___________________________________________ 67
Perceptions of workload _________________________________________________ 68
Key points: chapter 7 ___________________________________________________ 69
8. Professional development_____________________________________________ 70
Participation in CPD activities ____________________________________________ 70
Training and development plans___________________________________________ 73
Key points: chapter 8 ___________________________________________________ 77
9. Morale in 2005 _____________________________________________________ 78
Enthusiasm with work __________________________________________________ 78
Careers in nursing______________________________________________________ 79
Own career ___________________________________________________________ 79
Job security___________________________________________________________ 80
Workload and pressure __________________________________________________ 81
Pay _________________________________________________________________ 81
Training and employer support____________________________________________ 82
10. Appendices _______________________________________________________ 85
Appendix A: survey process
Drawing the sample ____________________________________________________ 85
Response rates ________________________________________________________ 86
Response weighting ____________________________________________________ 87
Appendix B: additional tables __________________________________________ 90
Managing to Work Differently – RCN Employment Survey 2005 6
2005 survey summary
Changing context
The nursing workforce in the UK has expanded in recent years. Government targets set five years ago to increase the number of nurses working in the NHS by 20,000 have been met. But workforce growth has been accompanied by an expansion and development of health care services. At a macro level we know that the volume of care required continues to increase, and that health services are expanding, reconfiguring and changing the way in which they meet that need. But what does this mean for a typical nurse delivering that care?
what has their experience of change been? has the increased number of nurses in the workforce reduced their workload? what are the effects of top–to-toe reform on individual nurses? does their experience highlight how working differently can be best managed?
The survey
The 2005 employment survey aims to address these questions. A 12-page questionnaire was sent to 9,000 RCN members in February 2005. The survey findings are based on 4,975 respondents, who were employed and working in nursing at the time of the survey.
Changing profile
It is not just the services and how they are being delivered that have been changing. The survey results indicate that the profile of the people delivering care has also changed. This year the average age of survey respondents is 42, while in 1987 it was 33. The average age of survey respondents has now been steadily increasing by about six months each year for the last 18 years. The age increase is primarily due to a bulge in the workforce that is gradually getting older. But a second factor driving up the average age of nurses in Britain is that nurses are entering the profession later. In the 1960s the average age on qualification was 21, while over the last five years the average age is 29. A third of recent registrants are over 30 years old. Linked to this demographic, increasing numbers of newly qualified nurses have children. More than a third (36%) of those who qualified in the last five years have children. Mature entrants (who were 30 or older on qualifying) are much more likely than their younger colleagues to have children (67% compared with 21%).
Where and when nurses work
The changed profile has wider workforce implications. It is in the early stage of nurses’ careers that they are most likely to work in NHS hospitals, to work shifts and to work full-time. Three-quarters (76%) of those who qualified in the last five years are employed in NHS hospital settings compared with 35% of those who qualified 30 years ago or longer.

Managing to Work Differently – RCN Employment Survey 2005
7
The proportion of respondents working part-time increased during the 90s, but has remained broadly unchanged since 2000 at just under two-fifths. This year’s survey identified some interesting changes, showing that part-time work is not the preserve of working mothers. More men now work part-time (11% compared with 7% in 2000, and 4% in 1992). Also, larger proportions of nurses with children living at home are now working full-time, while the number of nurses without dependents working part-time has increased since 2000. Added to this, the proportion of older nurses working full-time has also increased. Larger proportions of those who undertake bank or agency work as their main jobs now do so on a full-time basis. For example, five years ago 46% of agency nurses covered by the survey worked full-time. This compares to 66% today. Certain specialties have seen a reduction in full-time working. For example, in 1995 more than two-thirds (68%) of health visitors reported working full-time, but by 2005 fewer than half do (46%). Part-time working has also increased in nurse education. More than half (55%) of all nurses surveyed work shifts – internal rotation is the most common pattern, particularly among NHS hospital nurses (65% of those working shifts work internal rotation). Only 3% of NHS hospital nurses report working some form of flexi-time.
Potential stability?
Assumptions about nursing career paths and the nature of a nursing career may need to be revised. One implication of nurses training later in life is that is that the average potential total career length is shortened. However, this may not mean fewer total years spent nursing. This is because mature entrants are likely to have less interrupted careers since a larger proportion have already had children. Survey results point to signs of increasing workforce stability. For example, in the 2001, 2002 and 2003 surveys, the proportion of respondents who changed jobs and employers in the preceding 12 months was 13%. This year the equivalent turnover figure is 11%. A consistent pattern across the surveys is that highest levels of job/employer change occur in the first five years of a nursing career. Three out of 10 (30%) 2005 respondents who were at this stage in their career had changed jobs in the last 12 months. But, this is less than in the previous survey in 2003, when 38% changed jobs in the first five years. Older new recruits are less likely to have changed employer/job than younger entrants to nursing.
Effects of change on workload
Some health service changes have potentially negative knock-on effects for nurses. For example, half of NHS hospital nurses say that changes in junior doctors’ hours have resulted in an increase in their workload. Likewise, changes in GP contracts are reported to have increased the amount of out-of-hours service provided by nurses. While these factors have clearly had an effect, overall workloads are viewed slightly more positively than two years ago. Patient-to-nurse ratios on NHS hospital wards have stayed virtually the same. But workloads and stress continue to be major sources of frustration. Only 22% of all nurses disagree that they are under too much pressure, fewer still in the NHS (17%). Although job change has reduced slightly, it is a concern to the NHS that 49% of the nurses who left the NHS in the preceding year did so because of stress/workload factors (compared with 29% of all those who changed employer).

Managing to Work Differently – RCN Employment Survey 2005 8
Nurse-to-patient ratios have not changed since they were first measured by this survey in 2001, and the majority of nurses surveyed continue to regard their workloads as too heavy. Are heavy workloads now regarded as the norm? Clearly, the effort involved in nursing work is about more than the numbers of patients cared for by each nurse. The complexity of care and level of ongoing change also contribute to the sense of effort. The survey findings indicate that larger proportions of nurses in 2005 consider that they could be paid more for less effort if they left nursing, than they did 10 years ago (71% compared to 60%). The change is most pronounced among higher grade nurses. For example, 10 years ago 14% of H grade nurses felt that they could be paid more for less effort outside of nursing. Today, 27% of H grades responded in this way.
Supporting changing roles
The majority (63%) of respondents say that their role has changed since they took up their post. In most cases (71%) nurses are satisfied with the change to their role. Over three-quarters (77%) report that the change has had an impact on patient care and has been beneficial to the service. Role change is more likely to be viewed positively if it is reflected in the job description and grade. Respondents who feel inappropriately graded are less likely to express satisfaction with any role change. The more time that has elapsed since the job description has been reviewed, the less likely respondents are to feel satisfied with role change. A higher percentage of nurses who have training and development plans feel satisfied with the way their role has changed (76% compared to 63% of those who do not have personal training and development plans). The survey results suggest that good management is key to changes being regarded positively.
More developed workforce
A larger proportion of respondents hold a degree or higher degree in 2005 (22%) than in 2001 (16%). Employer commitment to training would appear to have improved in the five years since the 2000 survey. More are giving employees access to professional development and continuing education departments. Larger numbers of respondents now have personal training and development plans, and, in particular, many more in all sectors say that their manager is involved in their development.
Changing pay
It’s too early to say what impact Agenda for Change (AfC) will have on pay satisfaction because 90% of NHS staff are still paid on clinical grades. A further 15% have been told which pay band they will be on. But, the process of transferring to AfC may have had some positive knock-on effects. For example, more nurses have up-to-date job descriptions, and 69% of all respondents report that their job description is an accurate reflection of their role. This compares to 57% who said this in 2001. Generally respondents are positive about the AfC process. An encouraging sign is that nurses who have been through the process already are most likely to be positive about it.

Managing to Work Differently – RCN Employment Survey 2005
9
Fewer grade increases were reported in the 12 months prior to this research than was the case in the previous survey. This is likely to be related to the transfer between pay systems where promotions are stalled until the move to the new system is complete. Pay equity also continues to be an issue. Overall 45% of respondents consider that they are not on the appropriate grade. The figure is higher still for black and minority ethnic nurses, where 53% report that they are graded inappropriately. This compares with 44% of white nurses. More than one in four (27%) of nurses have a second job. The survey found that 64% do bank nursing on top of their main jobs, and 15% do agency work. One in 10 nurses work outside nursing. The main reason that nurses take on second jobs is to supplement their income. Few NHS nurses (15%) consider themselves well paid relative to the work that they do. Only 6% believe that nurses are as well paid relative to other professional groups. Bank or agency nursing is the main job for one in 20 nurses. Since 2000 there has been a shift away from agency work and a corresponding increase in bank nursing. The idea that nurses are paid more when they work agency or bank is unfounded. For example, two-fifths of F grades are paid on a lower grade when they work on the nursing bank in their own workplace.
Attitudes to nursing
Despite concern about pay levels and workloads, the majority of nurses surveyed are positive about their jobs and nursing as a career. Most of the attitude items covering these issues have seen positive increases over the last few years. The proportion that would recommend nursing as a career has increased steadily since 1999, from three out of 10 to nearer six out of 10 in 2005. While morale in general seems to be improving, retention remains a key issue. Just under a third (30% of respondents) say that they intend to leave their employer in the next two years. This compares with 27% in 2003. Among respondents aged under 40, the proportion of NHS hospital nurses planning to leave their employer has risen from 32% in 2003 to 36% in 2005. Satisfaction with the role change is significantly related to the intention to stay with an employer. Nurses, who are happy with changes to their role, and how this was managed, are more likely to stay with their current employer.
Managing to Work Differently – RCN Employment Survey 2005 10
1. Introduction The 2005 RCN Employment Survey
This report describes the findings from the 19th RCN employment survey of a sample of RCN members. There are several important reasons why this survey is so valuable:
large sample sizes: this year 9,000 nurses from across the UK were surveyed . This meant that members of important sub-groups of nurses (e.g. practice nurses or nurses from black and minority ethnic origins) could make comments
being part of a longstanding survey series with data collated on a wide variety of issues that allows the RCN to monitor changes in nurses’ views over time. Several questions have been repeated every year since 1992 to provide continuity and to allow changes over time to be explored
good response rates that are typically in the region of 55-65%, depending on the groups being surveyed
the representative nature of the RCN membership means that the results of the survey analysis are reflective of the entire UK nursing population.
The findings in this year’s survey are contrasted with the results from other surveys, particularly the 1995 and the 2000 to 2003 surveys. This provides indicators of how nursing employment and the labour market are changing.
Context
Overall, the nursing workforce in the UK has expanded3. Between 1997 and 2004 the NHS qualified nursing/midwifery workforce across the UK has increased by between 10% in Scotland, and 23% in England. This expansion has been sourced primarily through increases in the numbers of nurses trained, and through recruiting nurses from outside the UK. Internationally recruited nurses (IRNs) represent about 45% of new entrants to the UK register. There has also been a substantial increase in the NHS in use of bank/agency nurses. For example, expenditure on temporary staffing in England tripled between 1998 and 2003. Thus, the NHS plan target set in 2000 to increase the number of nurses working in the NHS in 2004 by 20,000 has been achieved. But, as the recent Healthcare Commission review of ward staffing points out4, services themselves have been expanded and reconfigured, so an increase in the number of nurses does not necessarily mean an increase in staffing levels.
3 Buchan J (2005) UK Labour Market Commentary 2004/5 – interim report, London: RCN. Publication code 002 760. 4 Healthcare Commission (2005) Acute hospital portfolio review. Ward staffing, London: Healthcare Commission.

Managing to Work Differently – RCN Employment Survey 2005
11
But at the same time that the workforce size has increased, so have the range, volume and complexity of care provided. For example, between 1997 and 2004 the number of NHS hospital admissions in England rose by 22%5. The last two years alone have seen an increase of 7%. Hence, despite the growth in the workforce there is little sign that vacancy levels have changed. The government reported that the three-month vacancy rate has remained between 2% to 3% over the last six years (the 2004 figure for England is 2.6%, and in 1999 it was 2.8%). In 2004, an average 9% of NHS hospital ward posts were unfilled.
Change has become a constant in UK health care provision in the last twenty years. But it has reached unprecedented levels more recently as the NHS programme of modernisation drives reform. The changes outlined in the NHS plan6 were described as ‘the most fundamental and far reaching reforms the NHS has seen since 1948’, and that ‘over the next few years the NHS will be modernised from top to toe’. The last five years have seen a period of massive change as both internal and external drivers reshape the health service landscape. A raft of white papers and initiatives have been launched as the NHS strives to become a model employer. Examples of this can be seen in Securing our future health, Every child matters, the establishment of National Service Frameworks, Agenda for Change, and new contracts for doctors.
The twin aims of health service modernisation have been to have more staff, working differently. Developments such as walk-in centres, NHS Direct and nurse prescribing impact on the way in which nurses deliver care. The increase in the number of nurses working in specialised and advanced roles has implications beyond the NHS or individual employers. It has prompted the Nursing and Midwifery Council (NMC) to review what regulation is required to accommodate the new breed of nurses on the register.
Meanwhile, a number of factors are impacting on the health services provided outside the NHS. The relationship between the NHS and independent sector providers has been developing since the proposal of a concordat in 2000. But the level of state funding received by private care homes continues to be a source of tension, creating staffing pressures in many homes7.
Added to this, the demographic profile of the workforce is changing. The average ages of nurses working in the UK has been steadily increasing, as has the age of entrants to nursing. Are health service employers positioned to meet the needs of an increasingly mature workforce?
At a macro level we know that the volume of care required continues to increase, and that health services are expanding, reconfiguring and changing the way in which they meet that need. But, what does this mean for typical nurses delivering that care? What has their experience of change been? Has the increased number of nurses in the workforce reduced workload? Does being part of a top-to-toe reform leave individual nurses feeling battered, or are they more positive about nursing as a career?
What are the effects of change on individual nurses, and do their experiences point to how working differently can be best managed? These are some of the key questions that the 2005 survey addresses.
5 Department of Health (2005) Annual report 2005, London: DH. 6 Department of Health (2000) NHS plan, London: DH. 7 Ball J and Pike G (2004) Survey of nurses in care homes. Impact of low fees for care homes in the UK, London: RCN. Publication code 002 455.
Managing to Work Differently – RCN Employment Survey 2005 12
Method
The approach to the survey has been refined. It was first commissioned in 1987, and questions have altered over the years to reflect changes in nursing. Samples have also increased over this period to allow analysis of small sub-groups of nurses, and separate reports for Northern Ireland, Scotland and Wales.
Sample
In 2005, the annual RCN Employment survey questionnaire was posted to 9,000 RCN members between February and April 2005. Full details of the survey administration are in Appendix A.
The main sample consisted of 6,000 members selected randomly from the RCN membership records. Top up samples of 1,000 members from Wales, Scotland and Northern Ireland allowed country specific data to be analysed and reported separately. Within each strata of the sample members were selected at random, and all cases were removed after selection so that no individual could be selected twice. Before mail-out the demographic profiles of each sample was checked against that of the entire RCN membership.
In summary, the full samples comprised: 6,000 randomly selected
1,000 additional cases from Northern Ireland
1,000 additional cases from Scotland
1,000 additional cases from Wales.
Further details of the sampling process and subsequent weighting applied are provided in Appendix A.
Questionnaire design
To ensure continuity and allow comparisons with previous years, the questionnaire covers core employment and biographical questions including: demographic details; pay and grading; working hours; job change; and various attitude items relating to nurses’ experiences of working life. This year’s survey also included sections looking at the roll-out of Agenda for Change, professional development and workload.
The questionnaire design reflects input from the RCN Employment Relations Department, and builds on earlier surveys by using some previous question formats to make longitudinal comparisons. It was then piloted with several groups of nurses. This ensured, as far as possible, that it is relevant to their working lives, and helped to test the design and layout of the form. Following the pilot, the questionnaire was amended and then reformatted into a 12-page booklet.
Survey process and response
The first wave of the survey was mailed out in early February 2005 to members’ home addresses, and they were given two months to respond. Three reminders were sent in fortnightly intervals, including a postcard, a full reminder (complete with a copy of the questionnaire) and a final letter.

Managing to Work Differently – RCN Employment Survey 2005
13
In total, 9,000 questionnaires were mailed, and when the survey closed at the end of April 2005, 5,073 forms had been returned (56%). This figure compares to 60% of the sample surveyed in 2003. The response rate is slightly lower than previous years, largely, we believe, as a result of survey fatigue. Also, this year the sample was taken from all members, while in the past sections of the sample were drawn from members who had provided employment information, and who had demonstrated a commitment to survey processes. The increased length of the questionnaire may also have had an effect. Added to this, the inclusion of Agenda for Change questions may have alienated some respondents to whom it is not applicable.
In addition, 94 forms had been either returned by the Post Office as not being known at the address given, and 23 forms were returned as inappropriate, predominantly from nurses who had retired.
An overall response rate of just less than 57% was achieved. There was little variation in the response by sample group (see table 1.1).
Table 1.1 Response rates by sample
Total mailed
Post Office returns
Inappropriate Number of responses
Response rate
Main sample 6,000 69 17 3,366 57% Northern Ireland top up
1,000 5 2 538 54%
Scotland top up 1,000 13 2 579 59% Wales top up 1,000 7 2 579 58% Total 9,000 57%
Source: Employment Research/RCN 2005
As in previous years, the response rate for younger nurses is lower, particularly for the 25 to 34–year-old groups, who account for 22% of respondents but make up 28% of the membership. Previous RCN employment surveys demonstrate that age is a key variable in influencing response behaviour, followed by gender and to a lesser extent ethnicity8. As a result of this response discrepancy, a weighting procedure is carried out to rebalance the age profile of respondents and ensure that it is more in line with the membership profile. This is described in Appendix A, which also gives an outline of the precision achieved in the results from using large samples.
The additional cases from Northern Ireland, Scotland and Wales have also been weighted so that every completed questionnaire can be included in the analysis presented. The survey results for each country will be produced in separate reports.
Respondents’ employment status
Not all of the RCN members who responded to the survey are working in nursing. However, because the aim of the employment survey is to look at the conditions of employment in nursing, people who were fully retired, unemployed or working in a job unrelated to nursing (3% in total) were excluded from the data-set.
8 Ball J and Pike G (2001) Time to deliver, London: RCN. Publication code 001 577. See the discussion on sampling and response in Appendix A.

Managing to Work Differently – RCN Employment Survey 2005 14
The report does include respondents who are employed in nursing, but who are on either sick leave (1%) or maternity leave (2%), and those who have retired but are still working (2%). Table 1.2 describes the employment situation of respondents.
Table 1.2 Respondents by employment status – percentages (numbers in brackets)
Main random sample
Northern Ireland
Scotland Wales All
In nursing employment (including maternity and sick leave, and semi-retirement)
3,267 98%
529 99%
562 97%
567 97%
4,975 97%
Not employed (including career breaks and fully retired)
1% (32)
1% (6)
3% (27)
2% (11)
2% (97)
Working in non-nursing jobs 1% (33)
0% (2)
0% (2)
0% (1)
1% (38)
Base N (un-weighted)=100% 3,365 579 579 537 5,073
Source: Employment Research/RCN 2005
Report structure
The findings in the report are based on all respondents (weighted for age and country), who are currently employed in nursing (4,975 cases). The report is structured as follows:
Chapter 2 examines the demographic profile of nurses in 2005 before going on to look at their employment situation. It compares findings from this survey with 1995 and 2000.
Chapter 3 looks at pay and grading in nurses’ main jobs, and then examines the introduction of Agenda for Change.
Chapter 4 considers role content and division of time across different aspects of work, including whether or not roles have changed and consequent respondent satisfaction. We also look at job descriptions and how recently they have been updated and revised.
Chapter 5 summarises patterns of job change, looking at what nurses were doing 12 months prior to the survey compared with current employment. It also gives some data on turnover and progression and reasons given for changing jobs. Finally, we present data on future plans including retirement planning.
Chapter 6 describes working hours and shift patterns.
Chapter 7 explores current workloads and compares findings with 2001 and 2002.
Chapter 8 presents data on continuing professional development (CPD) activities and the nature of employer support for nurses pursuing professional development.
Chapter 9 concludes the report by reviewing morale among nurses in 2005. We ask how have the changes in nurses’ experience of specific aspects of work (described in previous chapters) impacted on nurses’ perceptions of their work-life balance?

Managing to Work Differently – RCN Employment Survey 2005
15
2. Profile
This chapter reviews the demographic characteristics and employment situation of respondents. Demographic data is of key interest in its own right. It monitors the ageing profile of the nursing workforce, and the relationship between demographic characteristics and work situation. For example, Stepping stones9 contrasted the average age of respondents in different employment settings and drew attention to the relationship between the type of work undertaken and age, suggesting a pattern of employment related to career stage. In Valued equally?10 the representation of black and minority ethnic nurses in different areas of work was explored.
In this year’s report we look in particular at the profile of respondents in 2005 and how this has changed over the last few years.
Age profile
One of the key variables in analysing the employment survey is age. In recent years the data set has been weighted to ensure that the profile of the respondents matches the population profile as closely as possible. Figure 2.1 shows the age distribution of all respondents to the survey11. It compares this against the NHS in England and the Department of Health non-medical census data for qualified nurses in England in 2004. The data demonstrate that the RCN NHS membership reflects the age profile for all NHS nurses in England.
9 Ball J and Pike G (2004) Stepping stones: results from the RCN membership survey 2003, London: RCN. Publication code 002 235. 10 Ball J and Pike G (2002) Valued Equally? Results from the RCN membership survey 2002, London: RCN. Publication code 001 937. 11 Note that the respondents’ age profile matches that of all members, since the data are weighted by age.

Managing to Work Differently – RCN Employment Survey 2005 16
Figure 2.1: Age profile of RCN members compared to NHS-qualified nurses in England
0
2
4
6
8
10
12
14
16
18
20
<25 25 to 29 30 to 34 35 to 39 40 to 44 45 to 49 50 to 54 55 to 59
Perc
enta
ge
All qualified nurses (England, NHS) RCN membership (England, NHS)RCN membership (UK all sectors)
Source: Employment Research/RCN 2005/DH non-medical census,2004
Important characteristics of the age profile of the nursing workforce and the respondent profile are:
today 14% of all respondents are aged over 55. In 2000 the equivalent figure was 8%
the average age of nurses responding to the survey has increased from 33 in 1987, 37 in 1995, 41 in 2003 to 42 today. The average (mean) age of the nursing workforce has been increasing by approximately six months every year since 1987
the mean age of men is 41.3 compared to 42.0 for women. But for men the average time since qualification is 14 years compared to 18 years for women
the age at which nurses first register as qualified nurses has also been increasing (figure 2.2 below). Almost all nurses who qualified in the 1960s and 1970s were under the age of 30; indeed most were aged 20-21. However, today a third (33%) of all new registrants are aged over 30. The mean age of nurses who qualified in the 1960s was 21, while in the 2000s the average age on qualification is 29. This has a big impact on the nature of the nursing workforce. It suggests that the total length of nurses’ careers is shorter now than was the case in previous decades. But this may not mean fewer years spent nursing. It is likely that older entrants will already have had children before entering nursing. They are less likely to require maternity leave/career breaks, and may offer more continuous service than could be expected of new recruits in the past.

Managing to Work Differently – RCN Employment Survey 2005
17
Figure 2.2: Age on qualification by decade qualified as registered nurse – percentages
50
55
60
65
70
75
80
85
90
95
100
1960s 1970s 1980s 1990s 2000+
Decade in which qualified
Per
cent
age
Over 3030 and under
Source: Employment Research 2005
Gender and ethnicity
Just over one in 10 of all members responding to the survey are from black and minority ethnic groups (BME). This figure has been slowly growing in recent years, primarily reflecting the increase in numbers of nurses recruited from overseas. In the last few years, entrants from outside the UK have represented 45% of all new entrants to the register12.
Overall, the proportion of men in the membership has remained broadly stable for some time, and at 7% is the same today as it was in 1995. However, figure 2.3 below shows the ethnic and gender profile of members responding to this survey by the decade in which they first qualified as a registered nurse. This suggests that the proportion of new male RCN members is increasing, albeit slowly, while the proportion of BME nurses has increased quite significantly.
12 Buchan J (2005) UK Labour Market Commentary 2004/5 – interim report, London: RCN. Publication code 002 760.

Managing to Work Differently – RCN Employment Survey 2005 18
Figure 2.3: Male and BME density by cohort (decade of qualification) – percentages
0
2
4
6
8
10
12
14
16
1960s 1970s 1980s 1990s 2000+
Perc
enta
ge
Male Black and minority ethnic origin
Source: Employment Research/RCN 2005/DH Non-medical census, 2004
Profile of internationally recruited nurses Six per cent of all respondents are defined as internationally recruited nurses (IRNs)13. This section provides a brief overview of the profile of IRNs in the RCN membership. One in six (16%) of IRNs are from the Philippines, and a further 30% are from elsewhere in the Far East and Asia. Nearly one in five (18%) are from Zimbabwe/South Africa, and a similar proportion (21%) are from elsewhere in Africa. The remainder are from Europe, USA/Canada and Australia/New Zealand. Despite the Department of Health guidelines regarding ethical international recruitment of health staff, 39% of IRNs who have come to the UK since 1999 are from African countries.
In terms of their biographical profile, higher percentages are male and aged under 40. Their mean age is just over 37, which compares to 42 for UK-qualified respondents. Table 2.1 below shows that IRNs are concentrated in certain sectors and areas of work. The main differences between IRNs and UK-qualified nurses are:
more employed in independent care homes/hospitals and bank and agency work often in older people’s nursing
61% employed on D grade compared to 14% of all UK-qualified nurses. More are also employed full-time, despite the fact that equal numbers have dependent children
more work shifts and on an internal rotation format, and 44% work 11 hour or longer shifts compared to 27% of UK-qualified nurses. Also, more have additional jobs to their main nursing role
fewer have a nursing diploma, but larger proportions (23% compared to 18%) have a degree.
13 Defined as obtaining their nursing qualification overseas (non-UK) and started working in the UK in 1999 or later.

Managing to Work Differently – RCN Employment Survey 2005
19
Table 2.1: Profile of IRNs compared to UK-qualified respondents
IRNs UK-qualified Employed in NHS hospital 53% 51% Independent care homes 23% 4% Independent hospitals 7% 3% Bank/agency work 10% 3% Older people nursing 34% 7% Full-time employed 91% 59% D grade 61% 14% Work shifts 87% 52% Internal rotation 59% 42% 11 hour-plus shift lengths 44% 27% Have additional jobs 42% 26% Degree qualified 23% 18% Qualified over 30 17% 12% Men 15% 7% Aged under 40 66% 41% Mean age 37.4 42.2 Weighted cases 748 1,457
Source: Employment Research Ltd/RCN 2005
Length of service profile
This section shows the differences between generations of nurses. The time since qualification variable has been re-banded to present all nurses who qualified in each of the last five decades14. It helps to build on the evidence presented in the 2003 report15 that explored changing employment profiles of nurses through their careers. First, to demonstrate the older profile of entrants to the register we show the average age of RCN members registering as new members16 by the decade in which they first registered.
14 The 1960s band includes a small number of nurses (9) who qualified in the 1950s. 15 Ball J and Pike G (2004) Stepping stones: results from the RCN membership survey 2003, London: RCN. Publication code 002 235. 16 Although this is not the same as age on qualification it acts as a useful proxy.

Managing to Work Differently – RCN Employment Survey 2005 20
Figure 2.4: Mean age at registration by time since registered
15
20
25
30
35
40
More than20 years
ago
15-20 10-15 3-10 2-3 1-2 < 1 year ago
Time since registered (years)
Age
at r
egis
trat
ion
(yea
rs)
Source: RCN Membership records, 2005
Full members who qualified more than 20 years ago typically registered at the age of 24. Today the equivalent figure is 37 and even in the last two years the mean age at which members first registered has increased by a year.
The main points are:
IRNs tend to be more recently qualified
there has been a further small increase in the proportion of respondents who hold a degree or higher degree level qualification (22% compared to 21% two years ago, and 16% in 2001). Of those who qualified since 2000 85% have a degree or diploma qualification. One in three (30%) of those who qualified in the 1990s have a degree or higher degree qualification
each year, as increasing numbers qualify in their mid-20s to mid-30s, more recently qualified nurses have children. So, although only 22% of those aged under 30 have children to care for, 35% of respondents in the first five years of their careers have children. As previous surveys have shown17, this is the stage in their careers when nurses are most likely to work in NHS hospitals. This underlines the importance of flexible working and childcare assistance to this sector
a third (36%) of all respondents who qualified in the last five years have children, but there are big differences between the mature entrants to nursing (67% have children) and those who qualified aged 30 and under (21% have children living at home)
self-evidently the average age of each cohort increases. It is worth reinforcing the data above that shows the average age even of those who qualified in the last five years is over 30 (31.4). This further demonstrates that the older age at qualification is helping to push up the average age of the nursing workforce.
17 Ball J and Pike G (2004) Stepping stones: results from the RCN membership survey 2003, London: RCN. Publication code 002 235.

Managing to Work Differently – RCN Employment Survey 2005
21
Table 2.2: Demographic summary by decade of qualification – percentages Decade in which qualified 1960s 1970s 1980s 1990s 2000+ Total Mean age 59.4 51.2 42.9 35.7 31.6 41.9 Mean age qualified 20.6 21.4 22.5 25.3 28.7 23.9 Men % 3 6 6 8 10 7 Ethnic minority % 5 9 6 13 15 10 Qualified overseas % 4 4 4 10 6 6
Diploma % 12 16 17 39 63 30 Qualification Degree/
higher % 7 16 23 30 22 22
Child % 22 53 74 54 36 55 Dependents
Adult % 29 28 18 11 12 18 Partner/spouse % 76 76 82 77 65 77 Weighted cases 368 883 1,532 1,339 748 4,869
Source: Employment Research Ltd/RCN 2005
Interestingly, there is little difference between respondents in terms of the proportion of household earnings that their income accounts for compared to the decades in which they qualified. Overall, the proportion earning less than half of the household income has reduced since 2003, when it was 33%. In 2005 that figure is 30%.
The average length of service for all respondents is 18 years, and half of this time is spent with their current employer. Respondents have been in their current posts for just under five years, and have been on their current grade for just over four years.
Table 2.2 above profiles the respondents to the 2003 and 2005 surveys who qualified in the five years prior to the surveys. As the table shows, many fewer respondents to the survey this year are aged under 30, and more first qualified as a nurse aged over 30. The average age of nurses in the first five years of their career has also increased significantly since 2003 from 30.3 years to 31.6 years. This shift in the age profile of newly qualified respondents is likely to alter early career patterns, particularly as more have children and other caring responsibilities. These issues are explored in more detail in subsequent chapters of the report.

Managing to Work Differently – RCN Employment Survey 2005 22
Table 2.3: Profile of nurses who qualified in five years prior to the survey – percentages (2005 and 2003) 2005 2003 Mean age 31.6 30.3 Aged under 30 54% 63% Qualified over 30 33% 27% Men 10% 11% BME 15% 14% IRN 6% 5% Have dependent children 36% 34% Other caring responsibilities 12% 10% Live with spouse 65% 66% More than half household income 45% 47% Nursing degree qualified 22% 19% Nursing diploma qualified 63% 65% Weighted cases 748 1,457
Source: Employment Research Ltd/RCN 2005
Current job and employer
The distribution of respondents by sector has barely altered in the last five years or more. Nearly three-quarters (72%) of all respondents report working in the NHS (including management), 8% in GP practice nursing, 14% outside the NHS (in independent and voluntary/hospice sectors), 2% in bank nursing and 2% in agency nursing. The only change since the 2000 survey is that there has been a marginal shift from bank to agency nursing, but numbers are too small to test significance.
Below we look at employment patterns in relation to career stages i.e. time since qualification. Full tables are provided in the Appendix B. The main points are:
three-quarters (75%) of recently qualified nurses work in NHS hospital settings. In contrast, only 35% of those who qualified in the 1960s and 1970s are now working in NHS hospital settings
of those who qualified in the last five years, mature (over 30-years-of-age) entrants to nursing are less likely than their younger colleagues to be currently working in NHS hospitals (69% are compared with 79% of the young entrants). But, they are more likely to work in NHS community settings (12% compared to 7% of younger entrants), and are more likely to work in care homes (6% compared to 2%)
later in their careers nurses are more likely to report working in a GP practice, independent care home and bank/agency settings. Of those who qualified in the 1960s 39% worked in these areas, compared to 7% of those qualifying the last five years
overall, 41% of respondents are staff nurses, 12% sisters/charge nurses, 7% community nurses, 6% senior nurses, 10% clinical nurse specialists/nurse practitioners and 7% practice nurses (see table 2.4)

Managing to Work Differently – RCN Employment Survey 2005
23
82% of nurses who qualified in the last five years are staff nurses compared to 45% of those who qualified in the 1990s, and 30% of those who qualified in the 1960s and 1970s
30% of all nurses work in adult general/critical care, 22% work in primary/community care. Nurses move from adult general/critical care in the early part of their career towards primary and community care and older people nursing in the latter stages of their careers.
There would seem to have been some shift in the distribution of respondents in the early stages of their careers between different sectors. For example, more respondents in 2005, who first registered as a qualified nurse in the past five years, are employed in the NHS than was the case in 2003 (87% compared to 81%). Some possible explanations are provided in Chapter 5.
Further data covering the biographical profile of respondents by employer and job title is provided in Appendix B.
Key points: chapter 2
the average age of the nursing workforce is 42. In 1987 the average age was 33. The average age has been increasing by approximately six months every year for the last 18 years
today 14% of all members are aged over 55. In 2000 the equivalent figure was 8%
nurses now enter the profession later. In the 1960s the average age on qualification was 21, while in the 2000s the average age is 29. A third of new registrants are aged over 30
increasing numbers of newly qualified nurses have children (35% of those who qualified in the last five years)
one in ten of all respondents are from BME groups. IRNs represent 6% of all respondents and have a different biographical profile to UK-qualified nurses
the proportion of men on the register has remained more or less unchanged over the last 10 years at between 7% to 10%
most recently qualified nurses (last five years) work in NHS hospital settings (76%). In contrast, only 35% of those who qualified in the 1960s and 1970s are now working in this setting.

Managing to Work Differently – RCN Employment Survey 2005 24
3. Rewarding nurses
This chapter looks at nurses’ pay and grading, both inside and outside the NHS. This is the first RCN employment survey since Agenda for Change (AfC) was launched in 2004. It provides an opportunity to gauge the progress made in assimilation to the new NHS pay bands, and respondents’ views of the process.
As well as describing which grades/pay bands nurses are on, the survey explores how they viewed their pay and whether they consider their grade to be appropriate. Previous surveys identified a correlation between nurses’ perception of being appropriately graded and their morale. This was revealed through feelings that their work is valued and their plans to stay in nursing.
Pay scales and grade distribution
In early spring 2005 84% of members surveyed reported that they were paid on clinical grades, 5% on AfC pay bands, 3% on managerial pay scales and 9% on other pay scales. In the NHS 91% of all respondents indicated that they are employed on a clinical grade, and 6% (198 respondents) reported being on AfC pay bands (see table 3.1). Of the respondents who indicated that they are on AfC pay bands, only 121 gave their AfC band. A further 21 nurses gave a clinical grade, and the remainder did not give a grade at all. For those that gave an AfC pay band 61% are band 5 or below, 19% band 6 and 20% band 7.
Table 3.1: Nursing pay scales – percentages by sector
Pay scale/band
Clinical grade
Agenda for Change
Managerial pay scale
Other payscale
Weighted cases
NHS hospital 91 6 1 2 2,528 NHS community 92 6 1 1 653 NHS Direct 92 4 4 0 24 NHS other 78 6 14 3 241 GP practice 89 2 0 8 368 Independent hospital 56 3 2 39 140 Independent care home 53 1 11 34 222 Other independent 36 0 5 59 39 Bank/agency 80 0 2 18 157 Higher education 42 0 3 56 36 Hospice/charity 66 1 3 30 157 School 50 2 9 39 46 Health authority/NHS Executive 88 7 4 1 85 Other health employer/prison 62 2 4 33 55
All respondents 84 5 3 9 4,838
Source: Employment Research/RCN 2005

Managing to Work Differently – RCN Employment Survey 2005
25
Table 3.2 below presents the clinical grading by employer group. Overall, there are slightly more G to I grades than was the case in 2003. This applies to most sectors.
Table 3.2: Grading by employer group – percentages by sector
Clinical grade
D E F G H I Weighted cases
% other grades (including AfC)
NHS hospital 23 39 17 14 5 1 2,336 7 NHS community 8 26 13 35 14 3 602 7 NHS Direct 9 9 17 52 13 0 23 8 NHS other 4 11 19 32 23 11 197 17 GP practice 3 12 30 44 9 2 356 3 Independent hospital 18 39 23 16 5 0 127 7 Independent care home 39 35 11 12 3 1 180 17 Other independent 8 19 6 47 8 11 36 5 Bank/agency 48 32 9 10 2 0 151 4 Higher education 0 3 21 10 31 34 29 19 Hospice/charity 23 34 15 14 11 2 143 9 School 8 29 21 24 11 8 38 16 Health authority/NHS Executive 14 39 17 26 3 0 76 10 Other health employer 8 41 20 20 10 0 49 9
All respondents 19 32 17 21 8 2 4,414 8
Source: Employment Research/RCN 2005
Looking at the grade mix by job title (see table 3.3) for NHS nurses there has been a small increase in the grade mix for sisters/charge nurses/ward managers from F to G grade (45% G grade in 2003 to 48% in 2005). A similar movement has occurred for senior nurses/nurse managers and clinical nurse specialists (CNS)/nurse practitioners between G and H grade (31% H grade in 2003 to 36% in 2005 among senior nurses, and 34% to 38% among CNS). Among practice nurses there are fewer F grades (40% in 2003 and 34% in 2005) and slightly more of both G and H grades.
These findings point to a change in the trend of grade relative to job title. Between 1992 and 2002 the RCN employment surveys showed a gradual downward shift in the grading associated with many job titles such as ward managers, practice nurses.

Managing to Work Differently – RCN Employment Survey 2005 26
Table 3.3: NHS grading by job title – percentages
Clinical grade D E F G H I
Other Weighted cases
Staff nurse 32 56 4 0 0 0 7 1,638 Community nurse 14 42 16 19 3 0 7 322 Enrolled nurse 73 24 3 0 0 0 0 71 Sister/charge nurse/ward manager 0 1 47 46 2 0 4 471 Senior nurse/matron/nurse manager 0 3 16 12 36 18 15 169 Clinical nurse specialist 0 2 11 39 38 4 6 311 Nurse practitioner 1 3 20 39 27 7 3 114 District nurse 2 8 7 69 11 0 3 122 Health visitor 0 6 6 78 3 0 6 32 School nurse (including non-NHS) 3 31 37 23 3 0 3 35 Practice nurse 2 11 34 45 5 0 3 315 All respondents 17 30 16 20 7 2 7 3,864
Source: Employment Research/RCN 2005
Grade change in previous 12 months Table 3.4 below highlights the proportion of NHS respondents who have received a grade increase in the year prior to the survey. It shows that in 2005 there has been a significant reduction in the number of respondents across all grades who have achieved a grade increase. It may be that the imminence of transfer to AfC pay bands has stifled some grade change, as employers and employees wait to see where individuals fall in the new system.
Table 3.4: Grade increases in year prior to the survey18 (NHS only) – percentages
1999 2001 2003 2005 Weighted cases 2005
D 10 4 0 3 518 E 21 23 19 15 1,107 F 26 30 30 25 511 G 13 16 22 18 622 H 20 19 29 18 257 I 17 10 32 23 65
All grades 17 18 19 15 3,201
Source: Employment Research/RCN 2005
18 Only those nurses who were employed on a clinical grade both in 2005 and 2004 are included. This means that the 5% of nurses in the NHS who were employed on AfC grades have not been included in the analysis (neither have those on other grades – as in previous years).

Managing to Work Differently – RCN Employment Survey 2005
27
Acting up to a higher grade Respondents were asked to indicate if they are currently acting up to a higher grade.
This year there would seem to have been a small decrease in the proportion of respondents indicating that they are currently acting up to a higher grade. In 2003 approximately 9% said they were acting up to a higher grade. This year the figure is 7% with little difference between types of employer. There is some correlation between acting up and grade. D to F grade nurses are more likely to indicate that they are acting up to a higher grade (8%) compared to G to I grades (4%).
Inappropriate grading
Each year for the last four years, respondents have been asked whether or not they consider their current grade to be appropriate given their role and responsibilities. Since 2002 approximately a half of all respondents do not consider their grade appropriate for their role. This year 45% said that they felt their grade was inappropriate, in 2003 the equivalent figure was 47%. However, there were slightly more nurses who said that they ‘don’t know’ whether or not their grade was appropriate - 7% compared to 5% in 2003.
Interestingly, fewer NHS respondents who indicated being paid on AfC pay bands said that their grade was inappropriate (39% compared to 48% of those who were on clinical grades). But, more of these respondents said that they ‘do not know’ if their grade is appropriate or not (10% compared to 6%).
Figure 3.1 below shows the proportion of respondents in each employer group who feel their grade is either inappropriate for their role and responsibilities, or that they do not know whether it is or it isn’t. The figures are more or less the same for NHS and independent hospital settings, and for independent care home and NHS community settings. Approximately 46% to 48% say that they consider their grade is inappropriate. However, only around one in four nurses working in hospice/charity, bank/agency, NHS Direct or higher education sectors report that their grade is inappropriate.

Managing to Work Differently – RCN Employment Survey 2005 28
Figure 3.1: Grade considered inappropriate by employer group – percentages
0 10 20 30 40 50 60
NHS Direct
Bank/agency
Higher education
Hospice/charity
Other independent
GP practice
Health authority/NHS Exec.
School
Other health employer
NHS community
Independent care home
NHS hospital
Independent hospital
NHS other
All respondents
Percentage
Grade not appropriate Don't know
Source: Employment Research/RCN 2005
Minority ethnic nurses are more likely to report that they are acting up to a higher grade. They are also more likely to consider that their grade is inappropriate for their role and responsibilities. This was highlighted in 2003 when, in particular, BME nurses working in mental health were significantly more likely to say that their grade was inappropriate (80% compared to 49% of white nurses).
Figure 3.2 below shows the differences in responses between BME and white nurses by grade. The difference is most marked for nurses on more senior grades. For example, 64% of minority ethnic nurses on F grades think that their grade is inappropriate compared to 47% of white nurses. Similarly, 53% of BME nurses on G to I grades think that their grade is inappropriate compared to 38% of white nurses. In the NHS these differences are similar, although there is a slightly wider ethnicity gap for D grades in the NHS.

Managing to Work Differently – RCN Employment Survey 2005
29
Figure 3.2: Grade considered inappropriate by grade and ethnicity – percentages
2025303540455055606570
D E F G-I
Grade
Perc
enta
ge
WhiteEthnic minority
Source: Employment Research/RCN 2005
Additional jobs
Overall, one in four (27%) nurses has an additional job. This figure in aggregate remains more or less unchanged over the last five years.
confirming 2003 survey findings, 2005 research shows that BME nurses are more likely to have additional jobs than white nurses at 42% compared to 26%. This fact is independent of other life situation variables such as having children and whether or not they are single, and even if they are working full-time or part-time
more higher grade nurses work excess hours than lower grade nurses, but the converse is true in relation to working in additional jobs
13% have more than one additional job – this figure is more or less the same as in 2003.
Nearly two-thirds of respondents are in bank nursing19 as their additional job (48% with their own employer, and 16% with a different employer). A further 15% do agency nursing, and around 5% have additional jobs in care home nursing, non-NHS hospital nursing, and other nursing work. One in ten nurses are doing second jobs in non-nursing work. Finally, one in ten indicated other health related work such as complementary therapy, counselling and training.
Most NHS nurses (59%) doing additional jobs are working for the bank with their own employer, but 12% work with other banks and 14% worked with agencies. A higher proportion of independent sector nurses work in additional jobs with agencies (22%) and other banks (32%). It is noticeable that there has been a swing away from agency to bank nursing in the last four years. In 2001 40% of all nurses worked on the bank, while today the figure is 48%. There is a corresponding reduction in agency working from 25% to 16%.
19 Bank staff are staff who have trust contracts but work on an as required basis.

Managing to Work Differently – RCN Employment Survey 2005 30
Figure 3.3: Types of second jobs (2001 and 2005) – percentages
0 10 20 30 40 50 60
Non-NHS hospital
NHS nursing/management
Other non-NHS nursing work
Care/nursing home
Non-nursing work
Other
Bank nursing with different employer
Agency nursing
Bank nursing with same employer
Percentage
20052001
Source: Employment Research Ltd/RCN 2005
Looking at NHS only and disaggregating the data by mode of working, a bigger difference still emerges. In 2001, 55% of full-time NHS nurses worked on the bank with their own employer as a second job. In 2005 this figure has increased to 67%. Conversely, the proportion of full-time nurses working with an agency in their second job had decreased from 31% to 17%.
The other major point to note is that there has been a big increase, albeit from small numbers, over this period in the number of NHS nurses who have taken second jobs in non-nursing work, up from 4% to 7%. This increase is even more marked when looking only at part-time NHS nurses, up from 3% in 2001 to 9% today.
Table 3.5: Additional jobs (NHS Full-time/Part-time) – percentages (2001 and 2005)
Full-time Part-time 2001 2005 2001 2005 Bank nursing with same employer 55 67 48 45 Bank nursing with different employer 9 8 17 19 Agency nursing 31 17 14 10 NHS nursing/management 2 1 3 6 Care/nursing home 4 4 5 3 Non-NHS hospital 2 2 3 3 Other non-NHS nursing work 3 2 4 4 Non-nursing work 4 7 3 9 Other 6 7 12 13 Weighted cases 325 612 196 341
Source: Employment Research Ltd/RCN 2005

Managing to Work Differently – RCN Employment Survey 2005
31
Looking at the reasons for taking additional jobs the main driver is to provide additional income. This was mentioned by 72%, which is more or less the same as in 2000 at 70%. One in nine (11%) said that they wanted to maintain nursing skills, 10% wanted to gain experience in other specialties and 8% gave other reasons. The other reasons included wanting to ensure that there are enough staff to provide care, personal interest, wanting a change, and research/study purposes. The reasons cited by nurses for undertaking additional work vary:
younger nurses are more likely to do it to provide additional income (80% of the under 40s compared to 64% of the over 40s). Older nurses are much more inclined to cite maintaining skills (14% compared to 7% of under 40s), to gain experience in other specialties (12% to 8%) and other reasons (11% to 5%)
nurses who earn more than half their household income (81%) are more likely to attach importance to the need to provide additional income compared to 62% of those whose income is less than half the household income
BME nurses are much more likely to have additional jobs, and they too attach more importance to providing additional income (86% to 69% of white nurses), as highlighted in previous surveys.
Grade when working for a bank/agency
Anecdotally, nurses report being paid on a lower grade by their employer when they do bank work, so that in effect employers are getting overtime on the cheap. To explore this, respondents were asked to indicate what grade they are paid on when working either for a bank or agency, in addition to their main jobs. The results varied according to the grade of respondents, as table 3.6 shows. The numbers are small in some cases so differences are not statistically significant in all cases.
Table 3.6: Grade paid for bank/agency relative to current grade – percentages
Grade working on own bank (NHS only)
D E F G/H
Base N=100%
Grade in main job D 96 3 1 0 132 E 17 80 1 2 232 F 9 32 59 0 97 G/H/I 8 29 21 38 101 Grade when working on another bank (all respondents) Grade in main job D 90 8 2 0 48 E 44 50 3 4 78 F 30 42 23 5 57 G/H/I 19 42 21 19 48 Grade when working for an agency (all respondents) Grade in main job D 100 0 0 0 38 E 31 56 9 4 70 F 37 34 20 9 35 G/H/I 36 32 25 7 28

Managing to Work Differently – RCN Employment Survey 2005 32
Source: Employment Research Ltd/RCN 2005
Two-fifths of F grade nurses are paid at a lower grade when they work for the bank in their own workplace.
Contrary to popular conception (although the number of cases involved is small), in general respondents doing agency or work in another bank on top of their main jobs, are even more likely to be paid below their normal grade than those doing bank work in their own workplace. The survey shows that approximately three-quarters are paid below the grade of their substantive post.
These findings raise questions about the reasons why nurses do bank and agency work in addition to their main jobs when the rate is lower than that paid by their main employer. It suggests several possible explanations. Firstly, it points to the level of need. Many nurses need to supplement their income and are prepared to work for less than their grade rate in order to do so. Secondly, it suggests that properly paid overtime is either not an option at all, or is not a feasible option because of the lack of advanced warning. So, staff opt for lower paid work that they can plan into their lives.
Pay satisfaction
For the last 10 years nurses have been asked to indicate the extent to which they agree with a series of statements on pay. The statements included in the 2005 survey are:
I could be paid more for less effort if I left nursing
considering the work I do I am well paid
nurses are paid poorly in relation to other professional groups.
The responses to the statements from NHS nurses are shown in figure 3.4. The statements are reworded so that all three are positively framed, and the bars to the left indicate the proportion holding negative views. Very few nurses (fewer than one in ten) feel well paid relative to other professional groups, and the vast majority (71%) think they would be better paid if they left nursing.
Figure 3.4: Pay satisfaction (NHS only) – percentages
-37
-45
-40-46
10
14
4
2
1
2
-19
-34
-100 -80 -60 -40 -20 0 20 40
I could NOT be paidmore for less effort if I
left nursing
Considering the work Ido I am paid well
Nurses are NOT paidpoorly in relation to other
professional groups
disagree strongly disagree agree strongly agree
Source: Employment Research Ltd/RCN 2005

Managing to Work Differently – RCN Employment Survey 2005
33
There has been little change to the responses to these statements since 1996. Pay questions consistently receive the most negative responses from nurses. Only around 10% to 15% give a positive response to any of the statements. This said, there has been some small improvement in response over the last two years, but it is difficult to say if this is a blip, or part of a longer-term improvement. Further analysis of how attitudes to pay and other issues have altered since 1996 is presented in Chapter 8.
Improvement in satisfaction does not correlate with the introduction of AfC. Here, respondents were no more or less satisfied with their pay than colleagues on clinical grades.
Table 3.7 presents aggregate results by employer group. It shows the percentages who disagree with each of the statements on pay. There is some uniformity of view between employer groups to two of the statements, but responses to considering the work I do I am well paid are markedly different. NHS nurses in both community and hospital settings are significantly more negative in their view than nurses with most other employers.
Table 3.7: Views on pay by employer group – percentages agreeing with each statement
I could be paid more for less effort if I left nursing
Considering the work I do I am NOT well paid
Nurses are paid poorly in relation to other professional groups
Weighted cases
NHS hospital 73 68 88 2,510 NHS community 70 60 83 652 NHS Direct 61 13 87 23 NHS other 69 48 81 244 GP practice 71 52 81 360 Independent hospital 66 55 87 141 Independent care home 54 53 75 253 Other independent 72 46 83 41 Bank/agency 62 52 83 160 Higher education 60 33 76 42 Hospice/charity 70 42 80 156 School 70 50 79 47 Health authority/NHS Executive 66 60 88 85 Other health employer 68 44 83 58
All respondents 70 60 85 4,879
Source: Employment Research/RCN 2005
I could be paid more for less effort if I left nursing The impression gleaned from this analysis is that nurses’ views of their pay in relation to work outside nursing have become more negative. Nearly three-quarters of nurses in the NHS feel that they could be paid more for less effort if they left nursing. In 1995 the equivalent figure was 60%.

Managing to Work Differently – RCN Employment Survey 2005 34
However, the pattern of response to this question has also changed markedly over the last 10 years. Figure 3.5 below shows the proportion of NHS nurses who agree with the statement I could be paid more for less effort if I left nursing by grade in 2005 and 1995.
Across all grades, there has been an increase in the proportion agreeing with this statement. However, higher grade nurses are relatively much more dissatisfied today than they were in 1995. In 1995, there was a wide gap between the views of nurses by grade, with more senior nurses tending to be more satisfied than lower grade nurses. In 1995 36% of D/E grades agreed strongly, compared with 14% of H grades. Today though, the difference is less, with 35% and 27% respectively.
Figure 3.5: I could be paid more for less effort if I left nursing by grade20 – percentages for 1995 and 2005 (NHS only)
20
30
40
50
60
70
80
D E F G H I
Grad e ( N HS o nly)
19952005
Source: Employment Research Ltd/RCN 2005
The first five years in the profession is when reward for effort is viewed most negatively. Newly qualified nurses (i.e. those who qualified in the five years prior to the survey) feel much more strongly than all others, independent of age, that they could be paid more for less effort if they left nursing. Nearly half (45%) strongly agree compared to 28% of all other nurses. There is not much difference in response between the groups with five to 40 years’ experience.
Larger proportions of recently qualified nurses are in lower grade positions. This may explain some of the findings, but it may also relate to the increase in age of qualification. Nurses who qualify later in life are not only more likely to have financial responsibilities (in terms of dependents etc.), but they may also have a better knowledge of work life and pay in other occupations, and the relative effort required to earn that pay.
Considering the work I do I am well paid
Interestingly, given that more nurses today feel that they could be paid more if they left nursing, in the NHS more respondents in 2005 report that considering the work that they do they are well paid. In 1995 nearly 80% disagreed with the statement, today the equivalent figure is 65%, which represents a significant reduction. At first sight this would appear to be something of a contradiction. Although the 1995 result showed a large, and possibly anomalous, increase from the previous two years.
20 In 1995 there was no data for I grade nurses.

Managing to Work Differently – RCN Employment Survey 2005
35
As mentioned above, NHS nurses are least likely to feel that they are well paid for the work they do. But, it is whether or not nurses feel appropriately graded that explains most of the variation in nurses holding this view. Table 3.8 below demonstrates this. Three times as many nurses, who feel that their grade is not appropriate to their role and responsibilities, disagree strongly with the statement, as do nurses who feel appropriately graded.
Also, even though minority ethnic nurses are much less likely to feel appropriately graded, they are no less likely to feel well paid considering the work that they do.
Table 3.8: Considering the work I do I am well paid by whether or not appropriately graded (NHS only) – percentages
Appropriately graded
Inappropriately graded
All respondents
Strongly agree 2 1 1 Agree 24 6 15 Neither 26 12 20 Disagree 38 51 45 Strongly disagree 10 30 19
Weighted cases 1,587 1,593 3,390
Source: Employment Research/RCN 2005
Nurses are paid poorly in relation to other professional groups Here there is almost unanimous agreement with 85% of all respondents agreeing with the statement. There is little difference between the NHS and other sectors. There has been a small reduction in the percentage agreeing with this statement since 2003, but it is still more or less the same result as found in 1995.
Agenda for Change (AfC)
It was reported above that just 5% of all nurses (same for NHS) are currently being paid on an AfC pay band.
In addition to this, respondents were also asked have you been told by your employer which AfC pay band you will be on? Clearly, for many outside the NHS the issue is not applicable, but nevertheless there are a number of nurses, particularly in the independent hospital sector, who report that they have been moved onto AfC pay bands. Among NHS nurses, 15% report that they have been told by their employer which AfC pay band they will be on.

Managing to Work Differently – RCN Employment Survey 2005 36
Table 3.9: Told by employer which AfC pay band will be on (NHS/GP practice only) – percentages
Told by employer which AfC band will be on
Yes No Not applicable Weighted cases
NHS hospital 17 83 0 2,499 NHS community 15 84 1 648 NHS Direct 26 70 4 23 NHS other 10 90 0 240 GP practice 5 78 17 346 School 5 41 54 44 Health authority/NHS Executive 17 82 1 87
All respondents 15 84 1 3,887
Source: Employment Research/RCN 2005
Of the NHS respondents who indicated that they had been told their pay band, 16% reported that they did not know which pay band they would be on, 44% said they would be on Band 5, 19% Band 6 and 10% Band 7 or higher. A further 11% did not answer the question.
Respondents were also asked to indicate their views of the various aspects of the transition to Agenda for Change. More than two-thirds (69%) expressed satisfaction with the information that they had received from the RCN and, interestingly, this view was independent of whether or not respondents had been through the AfC process. Four in ten (42%) are not satisfied with the information that they have had from their employer, and a third feel that the job evaluation process is unfair.
Table 3.10: Views of AfC management and communication (those who have been through AfC process) – percentages (NHS only)
Strongly agree Agree Neither Disagree
Strongly disagree
Weighted cases
Satisfied with AfC information from employer 3 (5) 32 (50) 23 (18) 32 (23) 10 (4) 3,562
(544) Confident job evaluation process is fair 2 (3) 24 (36) 41 (33) 26 (21) 7 (7) 3,544
(544) Understand principles of Knowledge Skills Framework
4 (6) 52 (60) 20 (16) 20 (16) 4 (2) 3,548 (541)
Satisfied with AfC information from RCN 6 (7) 61 (62) 22 (22) 9 (7) 2 (2) 3,573
(546) Would not know who to ask if had queries about AfC
4 (3) 21 (19) 12 (12) 54 (56) 9 (10) 3,568 (545)
Source: Employment Research/RCN 2005

Managing to Work Differently – RCN Employment Survey 2005
37
Of those who had been through the process and been told their AfC pay band, most were satisfied with how it had been handled, particularly with the role of the RCN where less than one in ten (9%) were dissatisfied. Approximately three in ten felt that the job evaluation process was not fair (28%), and a similar proportion were not satisfied with the information from their employer on AfC. One in five (22%) said that they would not know who to ask if they had queries about AfC.
Those nurses who have been through the process and have been allocated a pay band hold more positive views about AfC than NHS nurses who have not completed the process. This is particularly the case in relation to the perceived fairness of AfC, satisfaction with the information supplied by employers, and understanding the principles of AfC (see figure 3.5). For example, 39% of those who have been through the process think it is fair compared with just 24% of the rest of NHS nurses. In terms of employer information about the process, 55% of nurses who have been though the process are satisfied compared to 34% of the rest.
Figure 3.6: Views of AfC management and communication by whether or not told AfC pay band (NHS only) – percentages
0 20 40 60 80
Satisf ied w ith information fromemployer on AFC
Confident Job Evaluation process isfair
Understand principles of Know ledgeSkills Framew ork
Satisf ied w ith information from RCNon AFC
Would know w ho to ask if hadqueries about AFC
Percentage
Not told
Told AfC pay band
Source: Employment Research/RCN 2005
Looking just at the views of those who have been told their AfC pay band, we found that minority ethnic respondents are more likely to perceive the process as fair (45% compared to 37% of white nurses). But, BME nurses are more are likely to say that they would not know who to go to if they had queries about AfC (35% compared to 20% of white respondents). This latter difference seems to be even more marked for IRN minority ethnic nurses, although the numbers are small.
The difference between minority ethnic nurses and white nurses is also striking because nurses who consider their current grade to be inappropriate (more of whom are minority ethnic nurses), generally responded more negatively to all these items. This is particularly the case in relation to fairness of the process. The survey revealed that 44% disagreed, saying they felt it would not be fair, compared to 16% who say that their grade is appropriate to their role and responsibilities.

Managing to Work Differently – RCN Employment Survey 2005 38
Key points: chapter 3
in the NHS more than 90% are still paid on clinical grades. Four per cent of respondents report being paid on AfC pay bands, 3% on managerial pay scales and 9% on other pay scales
at the time of the survey 15% of NHS respondents have been told which AfC pay band they will be on
nurses who are paid on AfC pay bands are more likely to say they do not know if their grade is appropriate or not
respondents, who have been through the AfC process, are more satisfied with the support that they have received and the fairness of the process, than those that have not been through it
there has been a small increase in the grade mix of sisters/charge nurses/ward managers from F to G grade from 45% in 2003 to 48% in 2005
45% of all respondents think that their grade is inappropriate. This figure is slightly lower than in 2003, but more nurses now say that they do not know if their grade is appropriate or not
black and minority ethnic nurses are more likely to say that their grade is not appropriate. This is particularly the case for senior grade nurses
27% of all respondents have a second job. Over the last four years there has been a swing away from agency to bank nursing as a second job
two-fifths of F grades working for their bank are paid at a grade lower than in their main job. Nurses working for agencies or other banks in their second jobs are more likely to be paid below their grade
there has been a significant increase in the proportion of higher grade nurses reporting that they could be paid more for less effort if they left nursing.
Managing to Work Differently – RCN Employment Survey 2005
39
4. Role and job description
Recent changes in the health service have prompted the emergence of new roles and the development and reconfiguration of many old roles. The NHS plan sets out not just to increase the number of nurses working in the NHS, but also to develop new and more flexible ways of delivering care. But, as commentators point out, while numbers can be easily measured, progress towards working differently is much more difficult to gauge. A major impediment is the lack of a clear yardstick – without having data on the proportion of ward managers’ time spent on clinical activity previously, how can we tell how this has changed?
The survey tackles role change issues from several perspectives. Firstly, we capture data on the division between different types of activity (management, education, clinical, research) in the individual’s role. This will form important bench marking data so that in future years we can determine the way in which the balance between these basic categories shifts. But this is a crude level of activity classification. To get a fuller picture of the prevalence of role change, the survey asked respondents directly about their own experience of it. Has their role changed, and if so are they satisfied with the way in which it has changed, and the impact of the role change on patient services?
One of the challenges of evolving roles is that definitions of what the job entails soon become out of date. Yet having an accurate job description is a basic requirement of employment. In the NHS, the arrival of Agenda for Change has underscored the central importance of having an up-to-date job description that is an accurate reflection of the work undertaken. The survey therefore also included questions about job descriptions, their accuracy and when they were last reviewed.
Role content
Members were asked to give details of the proportion of time they spend on different activities. Across all respondents, two-thirds of their time is spent on clinical work (65%), 16% on management, 12% on education, 3% on research and 4% on other activities. In a separate question, respondents were also asked to give the amount of time they spend on clerical/administrative activities. Approximately a quarter of all time (27%) is spent on these activities. These questions will be particularly useful if repeated in future surveys, so that the nature of different jobs and change in the balance between activity types can be monitored over time.
There is some variation by type of employer with nearly 70% of time spent on clinical activity in NHS hospitals, compared to 63% of time for NHS community nurses and 80% for those working in GP practices. As might be expected, nurses working bank/agency spend most time on clinical tasks. Independent sector nurses report undertaking more administrative work than is the case among NHS nurses.

Managing to Work Differently – RCN Employment Survey 2005 40
Table 4.1: Percentage of time spent on different activities – mean percentages
Nature of activity:
Clinical Mgt Educ Research Other Weighted cases
Admin/ clerical
NHS hospital 69 15 11 3 3 2,463 27 NHS community 63 17 12 2 6 641 28 NHS Direct 63 14 11 3 9 22 16 NHS other 46 24 16 5 9 240 29 GP practice 80 8 6 2 4 359 20 Independent hospital 71 16 8 1 3 139 27 Independent care home 55 27 12 2 3 243 34 Other independent 50 21 15 3 11 42 43 Bank/agency 77 11 7 1 3 154 24 Higher education 19 9 46 19 6 41 23 Hospice/charity 61 20 11 3 4 160 27 School 44 20 25 3 7 43 32 Health authority/NHS Executive 60 18 14 3 4 85 28 Other health employer 55 13 13 8 10 57 32
All respondents 65 16 12 3 4 4,787 27
Source: Employment Research Ltd/RCN 2005
Clearly, role content will vary significantly by grade and job title. The following tables highlight some of these differences.
Table 4.2: Percentage of time spent in different activities by job title – percentages (NHS only21)
Nature of activity
Clinical Mgt Educ Research OtherWeighted cases
Admin/ clerical
Staff nurse 77 9 10 1 2 1,587 26 Community nurse 72 10 10 2 6 309 29 Enrolled nurse 79 7 8 1 3 61 28 Sister/charge nurse/ward manager 61 25 11 2 2 469 29 Senior nurse/matron/nurse manager 32 50 10 2 6 165 34 Clinical nurse specialist 59 11 18 6 6 304 22 Nurse practitioner 70 13 14 5 4 80 20 District nurse 57 26 11 1 4 125 30 Health visitor 73 9 11 2 4 56 20 School nurse 57 12 19 3 9 44 27 Practice nurse 80 8 6 1 4 329 20 Manager/director 15 66 11 3 5 73 39 All respondents 66 16 11 3 4 3,432 27
21 School sector and practice nurses include non-NHS employers.

Managing to Work Differently – RCN Employment Survey 2005
41
Source: Employment Research/RCN 2005
Approximately three-quarters of staff nurse and community nurse time is spent on clinical work (77% and 72% respectively). Sisters/ward managers spend slightly less time on clinical work (61%) and more on management (25%). Senior nurses spend half of their time on management.
One key point is that the amount of clerical work reported by nurses hardly varies at all between D to I grades. This said, senior nurses/matrons/nurse managers undertake significantly more clerical work than other nurses. The same can be said for managers who are more likely to be on other pay scales.
Part-time respondents report taking on less administrative work than full-time employees (approximately 24% of their time compared to 29% of full-time nurses). This difference is consistent across all grades/job titles, although the difference is not so marked in the NHS (25% compared to 28% of full-time nurses). It is one of the key variables correlating with reported levels of the volume of clerical/administrative work. In addition, it should be noted that that nurses who are not satisfied with any role change that they have encountered report high levels of clerical work in their roles. This amounts to 33% of all time compared to 26% of time among those who are satisfied with a role change.
Table 4.3: Percentage of time spent on different activities by grade – percentages and means (NHS nurses)
Clinical grade D E F G H I Other All
Clinical activity 82 74 65 58 44 25 54 66
Management 5 10 16 21 27 43 29 16
Education 8 11 13 13 17 19 9 11
Research 2 2 4 3 5 3 2 3
Other activities 3 2 4 5 7 10 5 4
Base N=100% 603 1,085 510 619 257 68 261 3,403
Admin/clerical 25 27 26 28 26 28 29 27
Source: Employment Research Ltd/RCN 2005
As would be expected, there is an inverse relationship between the amount of time spent on clinical work and grade. The opposite is true in terms of management and education.
Looking at field of practice, management accounts for a higher proportion of time among nurses working in older people’s nursing. This is largely due to the higher number of independent care home respondents, many of whom are managers/owners.

Managing to Work Differently – RCN Employment Survey 2005 42
Table 4.4: Percentage of time spent in different activities by specialty – percentages
Nature of activity
Clinical Mgt Educ Research Other Weighted cases
Admin/ clerical
Primary care 71 13 9 2 4 780 25 Community care 66 17 11 2 5 253 26 Older people nursing 59 26 12 2 2 421 31 Mental health 62 20 11 2 6 352 33 Adult critical care 75 12 10 2 2 553 23 Adult general 71 14 10 2 3 886 27 Rehab/longer term 61 18 14 2 5 101 31 Paediatric critical care 75 12 10 1 2 115 19 Paediatrics general 73 12 10 2 2 157 24 Women’s health 71 12 11 3 4 111 28 Learning disabilities 57 25 10 3 5 98 33 Oncology/palliative 67 14 11 4 4 255 24 Education/research 20 8 45 21 6 115 27 Several different fields 44 25 16 5 9 151 29 Total 65 16 12 3 4 4,772 27
Source: Employment Research/RCN 2005
Biographical differences are a product of the different jobs worked in. For example, men spend more time on management activities since a higher proportion of men are employed in management/senior nurse positions. There is little or no difference in terms of ethnicity and, as would be predicted, nurses at the beginning of their careers spend much more time on clinical work than those in the middle of their careers. Nurses approaching retirement age also spend more time on clinical activities. This is partly because more are employed in GP practice and bank/agency work.
Job descriptions
Almost all respondents have a job description (92%, 94% in the NHS). This figure is slightly higher than reported in 2001 when 88% (NHS 92%) of all respondents had job descriptions. Fewer bank/agency staff (63%), GP practice staff (83%) and independent care home staff (88%) have job descriptions. Otherwise the survey shows little difference between employers.
Two-thirds of all nurses (69%, NHS 68%) feel that their job description is an accurate reflection of their role. Again, this figure is higher than in 2001 when 58% (NHS 54%) said it represented an accurate description of their role.
There is not a lot of variation between employer groups. Independent care home, bank and agency, and NHS Direct employees are all more likely to think that their job description gives an accurate reflection of their role (just under 80%). Independent hospital (65%), GP practice (61%) and NHS Executive/health authority (54%) respondents were all less likely to report that their job descriptions are accurate.

Managing to Work Differently – RCN Employment Survey 2005
43
Figure 4.1: Job description is an accurate description of role by employer group – percentages
30 40 50 60 70 80 90
Health authority/NHS Exec.
GP practice
Independent hospital
NHS hospital
School
NHS community
Other health employer
NHS other
Higher education
Other independent
Hospice/charity
Bank/agency
NHS Direct
Independent care home
All respondents
Percentage
Source: Employment Research Ltd/RCN 2005
In the previous chapter it was reported that just under half of all nurses consider that their grade is inappropriate relative to their role and responsibilities. Not surprisingly, those respondents who consider their grade is inappropriate also feel that their job description is not an accurate reflection of their role. Eight in ten (83%) nurses who say that their grade is an accurate reflection of their role also think that their job description is accurate. However, only (52%) of those who feel their grade is not an accurate reflection of their role think that their job description is accurate.
Nurse practitioners (77%) and clinical nurse specialists (82%) are more likely to think that their role is accurately defined in their job description as are H and I grades (83%).
Those nurses who report that their job description is not an accurate description of their role are less likely to have had it revised/updated recently. Nearly one in three (30%) of respondents who say that their job description is not an accurate reflection of their role have not had it updated or revised in the last three years. This compares with 6% of those who say their job description is an accurate reflection of their role (figure 4.2).

Managing to Work Differently – RCN Employment Survey 2005 44
Figure 4.2: Time since job description was last revised/updated by whether or not it is perceived as accurate – percentages
0%
20%
40%
60%
80%
100%
JD accurate JD not accurate Dont know
Perc
enta
ge
More than 3 years ago2-3 years ago1-2 years agoSix months to 1 year agoLess than six months ago
Source: Employment Research Ltd/RCN 2005
Nearly two-thirds of all respondents (62%) say that their role/responsibilities have changed since they took up their post. The only clear differences by employer are that the roles/responsibilities of GP practice nurses are most likely to have changed (78%). Fewer independent care home (47%) and bank/agency staff (37%) have experienced a change in role. A higher proportion of senior nurses (74%), nurse practitioners (76%) and CNS (72%) have experienced a change to their role since they took up their post, particularly in comparison with staff nurses (54%) and health visitors (43%).
Further analysis shows that nurses who regard their grade as inappropriate are also more likely to report that their role has changed since they took up their current post (74% compared to 54% of those who feel their grade is appropriate).
When asked about the impact of role changes, most nurses are both satisfied with the way in which their role has changed and think that it has been beneficial to the service. Across all respondents nearly three-quarters (71%) are satisfied with the change, and more still (77%) think it has been beneficial to the service. Figures for NHS respondents only are slightly lower at 69% and 74% respectively.
GP practice staff are most satisfied with any role change. The survey found that 89% are satisfied and 93% think it has been beneficial to the service (see table 4.5)
nurses in independent care homes were least satisfied with the change (64%)
more nurses who feel inappropriately graded are also not satisfied with the way their role changed (30% compared to 16% of those who feel appropriately graded). Interestingly, they are more positive in relation to how it affected the service. There is less difference between those who feel that their grade is appropriate and those who don’t
those who hold an accurate job description are more likely to report that they are satisfied with the role change than respondents who do not see their job description as accurate (79% compared to 59%)
larger proportions of respondents who are satisfied with the way in which their role has changed have had their job description updated in the last two years (72% compared to 65%).

Managing to Work Differently – RCN Employment Survey 2005
45
Table 4.5: Role change satisfaction and benefit to service by job title – percentages
Satisfied with role change
Beneficial to service
Yes No Yes No Weighted cases22
Staff nurse 69 23 73 15 1,069 Community nurse 61 34 72 18 223 Enrolled nurse 65 31 77 21 54 Sister/charge nurse/ward manager 65 29 71 19 399 Senior nurse/matron/nurse manager 63 31 70 22 194 Clinical nurse specialist 86 11 89 7 255 Nurse practitioner 79 17 89 7 96 District nurse 64 33 61 26 80 Health visitor 71 29 54 29 24 School nurse 67 24 81 19 33 Practice nurse 89 10 92 7 258 Manager/director 76 16 81 14 94 Researcher/lecturer 79 18 86 8 71 All respondents 71 23 77 15 3,017
Source: Employment Research/RCN 2005
Larger proportions of nurse practitioners and clinical nurse specialists view their role change positively and regard it as beneficial to the service. However, the same cannot be said of senior nurses/matron/nurse managers and sisters, as well as community nurses, all of whom responded less positively to role change.
Key points: chapter 4
approximately two-thirds of respondents’ time is spent on clinical activities and 16% on management. This balance varies by grade and job title. Approximately three-quarters of all time of D/E grades is spent on clinical activity compared to 40% of the time of H/I grades
an average of 27% of all time is spent on clerical/administrative activities and this varies little by grade or job title
full-time nurses spend more time on clerical/administrative tasks than part-time, and independent sector nurses spend more time on clerical activities than NHS nurses
almost all respondents have job descriptions and more than two-thirds (69%) think it is an accurate reflection of their role. In 2001 just 57% said their job description was an accurate reflection of their role
nurse practitioners/CNS and higher grade nurses are more likely to report that their job descriptions represent an accurate reflection of their role
22 ‘Don’t knows’ have been excluded, so rows do not add to 100%.

Managing to Work Differently – RCN Employment Survey 2005 46
most respondents (63%) say that their role/responsibilities have changed since they took up their current post. Most (71%) report that they are satisfied with the change to their role and 77% say that it has been beneficial to the service
the more time that has elapsed since the job description has been reviewed the less likely respondents are to feel satisfied with role change
role change is more likely to be viewed positively if changes are reflected in the job description and roles are graded accordingly. Respondents who feel inappropriately graded are less likely to express satisfaction with any role change.

Managing to Work Differently – RCN Employment Survey 2005
47
5. Job change and career intentions
In this chapter we look at job change and career plans. Each year the survey asks respondents what they were doing 12 months previously. The responses are then contrasted with the nurses’ current position to get a sense of the labour dynamics in the nursing workforce. We also ask respondents directly about whether they have changed jobs or tried to change jobs in the preceding 12 months. The results provide an indication of turnover. They can also be used to look at the success rate of respondents in different groups. For example, who were successful in applying for higher grade posts? The questionnaire explores motivating factors such as why have nurses decided to change jobs?
The chapter ends by looking at respondents’ plans to exit nursing. We look at their plans to leave their current employer, the profession and retirement.
Changing jobs/employer
Across all respondents, a smaller proportion report that they changed jobs in the preceding 12 months in 2005 than was the case in 2003 – 24% compared with 26% two years ago. The job change figure varies according to current and previous workplace. Of the nurses who currently work in the NHS, 23% had changed jobs (25% in 2003) compared to 20% of practice nurses, and 35% of those who are currently doing bank/agency nursing. This is the first year since 1998 when the NHS turnover figure has not increased in relation to the previous year’s survey. Some of this slowdown in job movement may relate to the transition to Agenda for Change, and nurses waiting to find out their upgrades once the new system is in place. However, it is too early to say whether this year’s figure represents a temporary change or the start of a trend.
One in nine (11%) nurses report that they changed employer in the last 12 months, which compares with 13% in 2003, 2002, and 2001. This is in line with the Office of Manpower Economics (OME) reported figure of 12%23 in 2004. In addition, we find that turnover has reduced from 14% in 2003. In other words, 47% of those who changed jobs also changed employer. This is a slightly smaller level of employer change than in the last few years when it has been 50% to 52%.
Changing employer is related to what stage nurses are in their career. For example, changes in employer are more frequent earlier on in careers (see table 5.1 below). However, the big change in the last two years is that far fewer nurses in the first five years of their careers have changed jobs/employers than was the case even just two years ago. Only 30% of nurses changed jobs in 2005, which is considerably down on the 38% recorded in 2003. When we asked respondents whether they had changed employers in the first five years of their careers the figure had dropped from 21% in the previous 12 months to 13% in 2005.
23 Office of Manpower Economics (2005) Workforce survey results for nursing staff, midwives and health visitors 2004, London: OME.
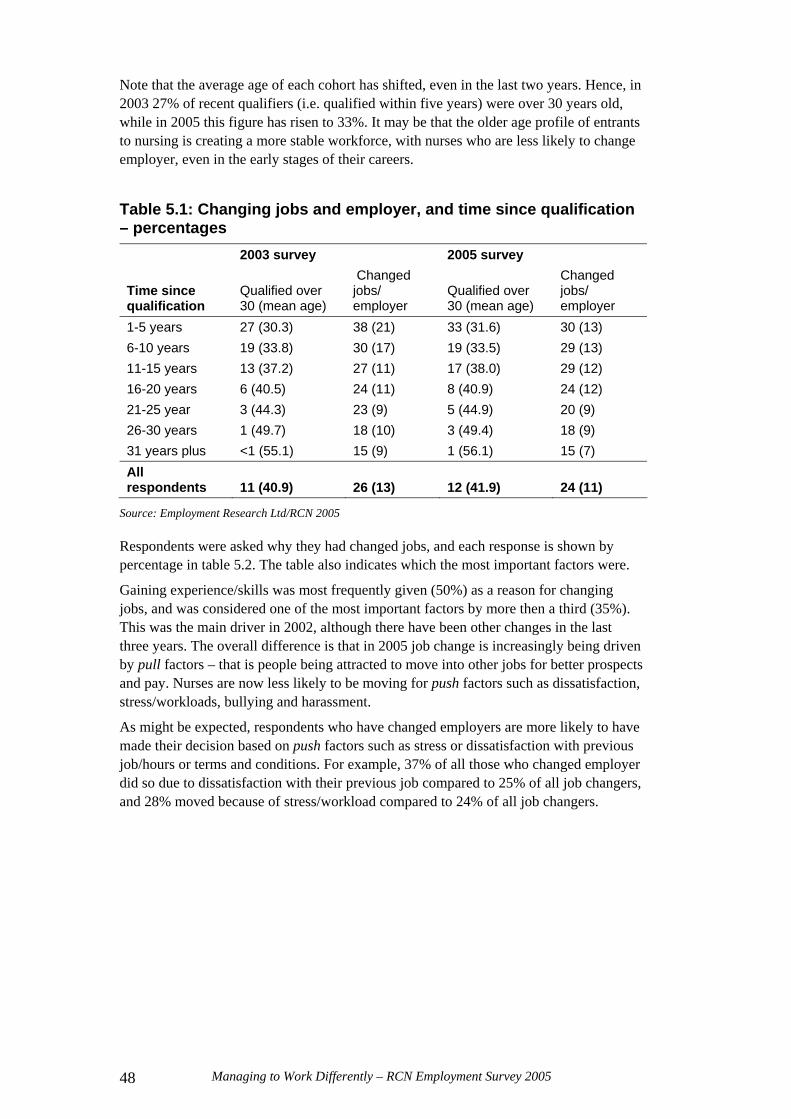
Managing to Work Differently – RCN Employment Survey 2005 48
Note that the average age of each cohort has shifted, even in the last two years. Hence, in 2003 27% of recent qualifiers (i.e. qualified within five years) were over 30 years old, while in 2005 this figure has risen to 33%. It may be that the older age profile of entrants to nursing is creating a more stable workforce, with nurses who are less likely to change employer, even in the early stages of their careers.
Table 5.1: Changing jobs and employer, and time since qualification – percentages 2003 survey 2005 survey
Time since qualification
Qualified over 30 (mean age)
Changed jobs/ employer
Qualified over 30 (mean age)
Changed jobs/ employer
1-5 years 27 (30.3) 38 (21) 33 (31.6) 30 (13) 6-10 years 19 (33.8) 30 (17) 19 (33.5) 29 (13) 11-15 years 13 (37.2) 27 (11) 17 (38.0) 29 (12) 16-20 years 6 (40.5) 24 (11) 8 (40.9) 24 (12) 21-25 year 3 (44.3) 23 (9) 5 (44.9) 20 (9) 26-30 years 1 (49.7) 18 (10) 3 (49.4) 18 (9) 31 years plus <1 (55.1) 15 (9) 1 (56.1) 15 (7) All respondents 11 (40.9) 26 (13) 12 (41.9) 24 (11)
Source: Employment Research Ltd/RCN 2005
Respondents were asked why they had changed jobs, and each response is shown by percentage in table 5.2. The table also indicates which the most important factors were.
Gaining experience/skills was most frequently given (50%) as a reason for changing jobs, and was considered one of the most important factors by more then a third (35%). This was the main driver in 2002, although there have been other changes in the last three years. The overall difference is that in 2005 job change is increasingly being driven by pull factors – that is people being attracted to move into other jobs for better prospects and pay. Nurses are now less likely to be moving for push factors such as dissatisfaction, stress/workloads, bullying and harassment.
As might be expected, respondents who have changed employers are more likely to have made their decision based on push factors such as stress or dissatisfaction with previous job/hours or terms and conditions. For example, 37% of all those who changed employer did so due to dissatisfaction with their previous job compared to 25% of all job changers, and 28% moved because of stress/workload compared to 24% of all job changers.

Managing to Work Differently – RCN Employment Survey 2005
49
Table 5.2: Reasons for changing jobs
All job changersEmployer changers
% 200224 % 2005 All
% NHS leavers25
% most important 2
Gain different experience/skills 48 50 50 50 35 Better prospects 26 36 40 45 23 Promotion 36 35 22 29 21 Better pay 24 29 31 36 17 Change in working hours 25 26 33 40 16 Dissatisfied with previous job 31 25 37 38 18 Stress/workload in previous job 24 24 28 49 19 Distance to work 11 13 23 17 8 Better terms and conditions - 12 19 28 4 Personal reasons/moving/partner’sjob
13 11 18 12 7
Family reasons - 10 14 16 9 Training reasons - 7 8 6 4 Bullying/harassment 9 6 8 6 6 Health problems - 3 3 7 2 Retirement (semi) - 3 3 6 1 Place of work closed/redundancy 3 2 2 2 1 Dismissed (unfairly/fairly) - 1 1 - <1 Other 12 7 5 5 6 Weighted cases 945 1,070 480 100 829
Source: Employment Research/RCN 2005
Of concern to the NHS is that 49% of all leavers did so because of stress or workload compared to 29% of all those who changed employer in the previous 12 months. Similarly, there were big differences in prospects (45% NHS leavers, and 38% all leavers), pay (36% to 30%) and terms and conditions (28% to 19%).
Other differences included:
a higher proportion of black and minority ethnic nurses changed jobs because of bullying/harassment (10% compared to 6%)
degree and higher degree qualified nurses were more likely to change jobs to get better prospects (46%)
promotion was more frequently cited by NHS nurses (43%), largely as a result of the larger employers having better promotion opportunities
family reasons were more often mentioned by respondents with children (17%).
24 Wording of some of the categories is slightly different. 25 This includes all respondents who changed employer in the last 12 months, were employed in the NHS 12 months prior to the survey and were not employed in the NHS at the time of the survey.

Managing to Work Differently – RCN Employment Survey 2005 50
Table 5.3 plots current employer setting against employer type 12 months ago. The top row indicates where respondents worked 12 months ago, and the left hand column shows their current employment setting. The results show that 84% of NHS job changers stayed in the NHS. Of those respondents who were students a year ago, 2% now work in an agency and 5% are working for a non-nursing employer.
Table 5.3: Movement between sectors (all job changes) Employment status/sector 12 months prior to survey Employer at time of survey NHS GP NHS
bank Indep. hospital
Care home Agency Student
NHS 83% (606)
29% (15)
42% (10)
24% (10)
31% (21)
42% (15)
84% (31)
General practice 4% (32)
56% (29) - -
2% (1)
3% (1)
5% (2)
NHS bank 3% (20) -
29% (7) - - - -
NHS Direct 1% (7) -
7% (2) - - - -
Health authority/ NHS other
2% (11) - - -
1% (1)
14% (5) -
Independent hospital
1% (6)
- - 46% (19)
- 5% (2)
-
Care home 1% (8) -
5% (1)
-
44% (30)
5% (2) -
Agency 1% (4) -
9% (3)
7% (5)
22% (8) -
Non-nursing employer
1% (10)
8% (4)
8% (4)
5% (2)
- 3% (1)
5% (2)
Weighted cases 702 52 24 41 68 37 36
Source: Employment Research/RCN 2005
Moving up
The last few employment surveys have collected data on applications for higher grade posts and respondents’ success. In 2003 26% had applied for a higher grade post, which was lower than in 2002 when 28% had applied. This year the proportion has fallen to 23%, representing a significant reduction.
Nurses early in their career are most likely to apply for higher grade posts, but in a similar pattern to the data presented in table 5.1 above. Applications from nurses in the first five years of their career are significantly lower this year than was the case in 2003 (30% applying compared to 38% in 2003). For all other groups, the differences in percentages applying for higher grade posts are higher, but the difference is not so marked (table 5.4).

Managing to Work Differently – RCN Employment Survey 2005
51
Table 5.4: Applying for higher grade posts and success by time since qualification – percentages 2003 survey 2005 survey
Time since qualification
Applied for higher grade post
Successful in application
Applied for higher grade post
Successful in application
1-5 years 38 76 30 75 6-10 years 33 62 31 66 11-15 years 28 64 28 60 16-20 years 26 67 22 61 21-25 year 24 67 20 64 26-30 years 19 57 17 57 31 years plus 12 55 9 55 All respondents 27 66 22 65
Source: Employment Research Ltd/RCN 2005
Nearly two-thirds (65%) were successful in their application and this is more or less the same as in 2003 (66%). There is also little difference between the two surveys in the proportion of nurses being successful in the first five years of their careers.
Future plans
In recent years each survey has collected information from respondents on their future career intentions – how long they intend to remain with their current employer and in nursing, and, since 2003, their retirement plans.
Leaving current employers Three in 10 (30%) respondents to the 2005 employment survey say that they want to leave their current employer within two years, and 9% say they want to leave within six months. Both these figures are slightly higher than two years ago, and higher still than 2001 (27% and 8%). Nurses in the NHS are no more or less likely to be considering leaving their current employer within the next six months or two years, than those in other employment situations.
Table 5.5: Intention to leave current employer by decade of qualification – percentages Decade in which qualified 1960s 1970s 1980s 1990s 2000+ Total Within 6 months 11 7 8 10 12 9 Within 2 years 36 15 16 22 29 21 Stay for 2-5 years 44 35 35 36 39 36 Stay for 5 years or more 9 42 41 31 20 33 Weighted cases 316 843 1,456 1,306 729 4,650
Source: Employment Research Ltd/RCN 2005
As can be seen in table 5.5 above, nurses who are at the beginning and end of their career are most likely to be considering leaving their current employer, but for different reasons. Reflecting this demographic, nurses without children are more likely to be considering changing employer than those without.

Managing to Work Differently – RCN Employment Survey 2005 52
If we consider only nurses aged under 40 there has been a shift in the intentions between employer groups. In most sectors there has been a reduction since 2003 in the proportions looking to change employer in the next two years. In care homes the proportion has decreased from 67% to 59%, in GP practices it is down from 26% to 19%, but in NHS hospitals the proportion has increased from 32% to 36%.
Here we follow the theme that recurs in this year’s analysis, whether or not a respondent is satisfied with a role change influences their view of working life in a number of different ways. We find that, again, there is a correlation between intention to leave a current employer (and indeed nursing as shown below) and satisfaction with a role change. Figure 6.1 highlights the differences. It shows that 46% of those who have been dissatisfied with a role change want to change jobs in the next two years, compared with 24% of those who have been satisfied.
Figure 5.1: Satisfaction with role change and intention to leave current employer – percentages
0%
10%
20%
30%
40%
50%
60%
70%
80%
90%
100%
Satisfied Not satisfied Don't know
Perc
enta
ge Stay for at least 5 yearsStay 2-5 yearsLeave within 2 yearsLeave within six months
Source: Employment Research Ltd/RCN 2005
Leaving nursing There has been no significant change in the percentage of all respondents who intend to leave nursing within two years. In 2005 it is 12%, and in 2003 it was 11%. Most nurses who intend to leave nursing in the short to medium term are aged 50 plus, with just 8% of the under 40s planning to leave in two years. Looking specifically at the under 40s, there has been a significant reduction in the proportion of nurses aged in this age group who plan to leave nursing within five years (32% today compared to 43% in 2003, 47% in 2002 and 37% in 2001).
This is one of the most marked differences between the 2003 and 2005 results, and suggests a shift in attitude towards nursing as a career (explored further in Chapter 8).
In line with other findings, nurses who say they do not feel satisfied with a role change are significantly more likely to plan to leave nursing within five years (51% compared to 35% of those who are satisfied with their change in role).
Retirement planning In 2003 it was reported that the average age nurses planned to retire was 58, this year the planned retirement age has increased to 59. Respondents’ ideal retirement age has increased from 55 to 56. Part of this change is as a result of the growing average age of the nursing workforce.

Managing to Work Differently – RCN Employment Survey 2005
53
Both the 2003 and 2005 surveys found that nurses’ intended retirement age increases with age. Nurses in their 20s and 30s plan to retire at age 57 while those aged over 55 intend to retire at 62 on average. However, it should be noted that by the age of 60 many nurses will have retired already, leaving only those nurses who either feel more positive towards their work or who need to work.
Age is most strongly correlated with retirement planning. The proportion of household earnings that respondent income accounts for is also a factor. Nurses who are more dependent on their own income indicates a slightly older age at retirement than those where income accounts for less than half of household earnings.
One in six (16%) of all respondents intend to work in nursing after reaching retirement age (age 60), and 10% intend to work beyond retirement in non-nursing work. More than a third (36%) is not sure at this stage whether or not they intend to work beyond retirement age. Clearly, this will be influenced by proximity to retirement as figure 5.2 shows. Indeed, more than one in three (36%) respondents aged 55 to 59 intend working in nursing beyond retirement age. This compares to 23% of the 50 to 54 year old age group.
Figure 5.2: Working after retirement – percentages
0
5
10
15
20
25
30
35
40
45
50
20-29 30-39 40-49 50-59
Age group
Perc
enta
ge Yes, in nursing workYes, in non nursing workNoDon't know
Source: Employment Research Ltd/RCN 2005
Need is an important factor. Households that are more reliant on a respondent’s income are more likely to report that they intend to work in nursing beyond retirement. The figures that 19% would work on compared to 11% where respondent income represents less than half household earnings.
It should be reiterated that the 2003 survey highlighted a feeling that where nurses’ contribution is valued this is the most important factor in encouraging near retirees to remain in nursing. The report also reveals that more than 70% of respondents mentioned that the availability of reduced hours and reduced stress at work were important factors in any decision they may make concerning delaying retirement.
Managing to Work Differently – RCN Employment Survey 2005 54
Key points: chapter 5
since 2003 there has been a small reduction in the proportion of respondents who have changed jobs in the preceding 12 months (23% compared to 26% in 2003)
this change has occurred predominantly among respondents who are recently qualified. In 2003 38% of those who had been qualified for five years or less changed jobs in the previous year, this year the figure is 30%. There has been a similar reduction in the proportion that changed employer (21% in 2003 to 13% in 2005)
more respondents in 2005 than in 2002 cite career prospects and pay as reasons for changing jobs, and fewer have left because of dissatisfaction with a previous job
nurses who have left the NHS in the 12 months prior to the survey are much more likely to mention stress/workload (49% compared to 28% of all employer changes) as a reason for changing jobs
there has also been a reduction in the proportion of respondents who applied for a higher graded post in the previous 12 months (22% compared to 26% in 2003). This reduction is again largely accounted for by changes in the behaviour of recently qualified nurses
more respondents in NHS hospitals are looking to change employer in the next two years than was the case in 2003. But, for other sectors the numbers have reduced, in most cases significantly
46% of respondents who report being dissatisfied with a role change say they want to change employers in the next two years compared to just 24% of those who have been satisfied with a role change
there has been a significant reduction in the proportion of respondents aged under 40 who report wanting to leave nursing within five years (32% compared to 43% in 2003 and 37% in 2001)
one in six respondents intend to continue to work in nursing beyond retirement age, and 10% intend to work outside nursing. Of the 55 to 59 age group 36% intend to continue to work in nursing beyond retirement, and one in four of the 50 to 54 age group intend to.

Managing to Work Differently – RCN Employment Survey 2005
55
6. Working hours
One dimension of working differently relates to the way in which work is undertaken, in terms of working hours and working patterns. Initiatives such as Improving Working Lives have flagged the importance of making working patterns more flexible and better suited to employees’ needs. Research evidence26 based on NHS staff in England shows that achieving a good work-life balance is correlated with job satisfaction, reduced stress levels, lower errors and incidents and improved retention of staff.
While the benefits of work-life balance are recognised, nonetheless other changes in the configuration of services may lead to more, rather than less pressure on nurses’ work schedules. Examples of this include changes in the GP contract or junior doctors working hours. The survey asked respondents directly about the impact of such changes on working hours and workloads, as well as mapping current working hours and workloads.
The changing profile of the nursing workforce, with an increased average age and older entrants to nursing, may also have implications for the patterns of work sought by nurses.
Part-time working
After a period of growth in the 1990s, the proportion of respondents to the RCN annual employment survey who work part-time hours has remained broadly unchanged since 2000 at just under two fifths (39%). This includes job shares or occasional/various hours. In 1989 only 29% of NHS nurses worked part-time, while today the figure is 36%.
However, this aggregate picture hides some interesting changes in patterns of part-time working (see figure 6.1):
the proportion of men working part-time increased in recent years with 13% working part time in 2003. This year the figure is slightly lower at 11%. But, this still represents an increase from 7% of men working part-time in 2000 compared to less than 4% in 1992
part-time working among nurses with dependant children has reduced from 56% to 52%. Conversely it has increased among those without dependants from one in five to one in four nurses (19% to 23%)
for nurses aged under 50 there has been little change in the proportions working part-time or full-time. However, there has been a significant increase in full-time working among nurses aged 50-plus since 2000. For the 50 to 54 year old age group this has increased from 59% to 67%. Among the 55-plus age group it has increased from 40% to 48%.
The previous annual employment survey revealed considerable changes in part-time working by age and domestic circumstances. Although this remains the case in 2005, the data here also demonstrates how the picture is continually evolving.
26 Healthcare Commission (2005) NHS National staff survey 2004, London: Healthcare Commission.

Managing to Work Differently – RCN Employment Survey 2005 56
Table 6.1: Part-time working by decade in which qualified – percentages Decade in which qualified as nurse 1960s 1970s 1980s 1990s 2000s Total Full-time 39 58 52 67 83 61 Part-time 61 42 48 33 17 39 Weighted cases 335 863 1,502 1,322 741 4,763
Source: Employment Research Ltd/RCN 2005
Working full-time is more prevalent among more recently qualified nurses. As table 6.1 shows, 83% of those who qualified in the last five years are currently working full-time. Although mature, recently qualified entrants are much more likely to have children (67% do compared to 21% of their younger colleagues), the vast majority of this group (76%) work full-time. This may explain the decrease noted previously in the percentage of nurses with children working part-time.
Given that a third of newly qualified nurses since 2000 are aged 30-plus, this is an important consideration in delivering working patterns that meet the needs of different nurses.
Figure 6.1: Part-time working by gender, childcare responsibility and age (all respondents) – percentages
0 10 20 30 40 50 60 70
Women
Men
With dependent children
Without dependent children
20-24
25-29
30-34
35-39
40-44
45-49
50-54
55 plus
Percentage
20052000
Source: Employment Research Ltd/RCN 2005
Although there are no more people indicating that they work part-time hours today than was the case five years ago, it is interesting to note that there are more respondents who are working in bank and agency work who now say they are working full-time hours. For agency nurses this has increased from 37% in 1992 to 46% in 2000, and 66% today. For nurses working on a bank, NHS or other, 7% worked full-time in 2000. Now the figure is 14% (see figure 6.2).

Managing to Work Differently – RCN Employment Survey 2005
57
Figure 6.2: Part-time working by sector (all respondents) – percentages
0 20 40 60 80 100
NHS nursing/management
Non-NHS nursing
GP practice nursing
Bank nursing
Agency nursing
Nurse education
All nursing
Percentage
2005
2000
1992
Source: Employment Research Ltd/RCN 2005
These figures suggest that although no more nurses are working part-time hours, more are choosing to work longer hours in settings that enable flexibility.
In nurse education there has been a relatively steep increase in the numbers working part-time, up from 8% in 1992 to 33% today.
Overall, proportionally slightly fewer NHS nurses are working full-time today than was the case in 2000, and many fewer than was the case in 1992. Mode of working has always been strongly correlated with grade. However, the strength of this association is less now than was the case in 2000 and in 1992 (see figure 6.3). In particular, it is noticeable that there have been significant reductions in the percentages working full-time among E, F and G grades. Full-time working among D grades has remained broadly the same.
Figure 6.3: Full-time working by grade (NHS only) – percentages
40
50
60
70
80
90
100
D E F G H I All
Grade
Perc
enta
ge 2005
2000
1992
Source: Employment Research Ltd/RCN 2005

Managing to Work Differently – RCN Employment Survey 2005 58
Reinforcing the data there has also been a significant reduction in the proportion of nurses working full-time in particular jobs. For example, in 1995 68% of health visitors worked full-time compared to 46% today, and 80% of sisters/charge nurses worked full-time in 1995 compared to 75% today.
Number of hours worked
As reported above, just under four in ten nurses are working part-time. These nurses are contracted to work on average 23.7 hours per week, slightly higher than in 2000 (22.9 hours). Full-time nurses are typically contracted for 37.5 hours per week. Five per cent of full-time nurses are contracted to work more than 40 hours per week.
Working excess hours The propensity of nurses to work excess hours has changed little over the last 10 years. In 1995 it was reported that 61% of NHS nurses worked additional hours in their main job during their last full working week. This was up from 57% in 1994, and 58 % in 2000 58%. Today the equivalent figure is 60%. There is little difference here by sector. Other non-NHS nurses are equally as likely to have worked excess hours. In the last 10 years there has been a slight increase in the proportion of NHS nurses who worked 10 or more additional hours in their main job. This is up from 16% to 20% in 2005.
The average number of excess hours in the last full working week worked by nurses who have worked additional hours in the preceding week is 6.5 hours. Across all respondents, one in ten work excess hours every shift, a third (34%) work extra hours several times per week, one in five once a week, 30% less than once a week and 8% never work more hours.
As reported in previous employment surveys, grade accounts for most of the variation in whether or not nurses work excess hours. Higher graded nurses are more likely to have worked excess hours in the previous week. However, it is worth noting that while there has been no change in the tendency of D to F grade nurses to work excess hours (45%, 50% and 65% respectively) since 2000, higher graded nurses are slightly less likely to have worked excess hours in the previous week. This is down from 76% to 71% since 2000.

Managing to Work Differently – RCN Employment Survey 2005
59
Table 6.2: Working excess hours by grade (NHS nurses) – percentages and means
Clinical grade D E F G H I
All NHS
% Working excess hours 46 51 67 71 78 91 60 % Working excess hours at least several times per week 31 35 49 56 69 69 45
Average excess hours (all nurses) 2.6 3.0 4.0 4.4 5.1 7.9 3.7
Average excess hours (those working excess hours) 5.8 5.9 5.9 6.2 6.6 8.7 6.2 % overtime unpaid 18 18 18 26 27 35 22 % overtime paid at less than standard rate 2 2 3 2 1 4 2 % overtime paid at standard rate 30 30 21 13 6 5 22 % overtime paid at higher than standard rate 16 14 10 5 3 5 10 % overtime given as time off in lieu 33 35 45 52 60 50 42 Weighted cases 615 1,085 494 610 253 62 3,375
Source: Employment Research Ltd/RCN 2005
Table 6.2 above highlights clearly how senior nurses in the NHS work excess hours more frequently, for longer hours and are less likely to be paid for doing so. More also have to take time off in lieu or have their time unpaid.
One in five (22%) NHS nurses work unpaid overtime, and get nothing in return. A further one in five (22%) receive overtime pay at the standard rate, and two in five (42%) get time off in lieu.
In addition, nurses whose income accounts for more than half their household income are most likely to have worked excess hours in the last full working week. This means that 63% have worked more hours compared to 54% of those whose income accounts for less than half household earnings.
Excess hours to provide staffing cover When employers want their staff to work extra hours to provide cover, a third of nurses (33%) across all sectors are paid overtime, about two in five (37%) are offered time off in lieu, one in five (19%) are offered bank pay at their full grade, and a further 4% are given bank at a lower grade. Figure 6.3 shows how this varies by employer group. NHS community staff are least likely to be offered paid overtime (20%), but most likely to be given time off in lieu (60%). NHS Direct staff are most likely to be given paid overtime (67%).

Managing to Work Differently – RCN Employment Survey 2005 60
Figure 6.4: Reimbursement of overtime by employer – percentages
0 20 40 60 80 100
NHS community
Bank/Agency
Hospice/charity
NHS hospital
School
Independent hospital
Independent care home
GP practice
NHS Direct
All respondents
Percentage
Paid overtimeBank at full/lower gradeOffer of time off in lieuOther
Source: Employment Research Ltd/RCN 2005
Paid overtime is an option for around a half of all respondents (47% in the NHS). Again grade is a key variable. Approximately 52% of D to F grades have the option of paid overtime, while only about 40% of G to I grades have the option of paid overtime. As above, nurses in the NHS community are least likely to have the option of paid overtime (36%), while three-quarters of practice nurses (75%) and independent hospital nurses (73%) sometimes have the option of overtime pay.
Looking across all hours worked by employer group, including excess hours and hours worked in additional jobs, nurses in independent care homes work the longest hours. Full-time nurses work 47.8 hours, and 29.8 hours part-time, otherwise there is little variation in the total hours worked by employer group.
On average, full-time nurses across all sectors work approximately 44 to 45 hours per week. This is approximately an hour longer than was reported in 2000. For part-time nurses the total hours worked has increased from just over 28 hours to just over 29 hours per week.

Managing to Work Differently – RCN Employment Survey 2005
61
Table 6.3: Hours worked (full-time/part-time) – percentages and means Full-time Part-time Mean contracted hours in main job27 37.5 23.7 Working excess hours in last week (%) 64% 53% Working in excess of contract several times per week or more (%)
50% 32%
Mean excess hours in main job (ALL) 4.4 2.9 Average excess hours in main job (those that worked excess hours)
6.9 5.5
Additional jobs (%) 26% 29% Mean hours worked in additional jobs (ALL) 2.6 2.5 Mean hours worked in additional jobs (those with additional jobs)
13.0 10.0
Mean TOTAL hours worked in last week (2000) (ALL) 44.5 (43.3)
29.1 (28.1)
Weighted cases (all respondents) 3,020 1,930
Source: Employment Research Ltd/RCN 2005
It is also noticeable that the more recently qualified nurses work longer hours than their more experienced colleagues, 45 hours for full-time nurses and 33 hours part-time. Most of this difference is accounted for by working excess hours.
Four in ten respondents work more than 40 hours per week. Looking at full-time nurses this percentage rises to 60%. Furthermore, 20% of full-time nurses work 50 hours or more per week.
Views of working hours
Figure 6.5 below shows that most respondents have a positive outlook on their working hours. This said, there are still between one in five and one in four respondents who are not satisfied with their working patterns. This negative view applies most to the ability of nurses to balance their home and working lives. Part-time nurses are much more likely to feel able to balance their home and working lives than full-time nurses, irrespective of whether or not they have children. Two-thirds (66%) of part-time nurses say that they agree with the statement I feel able to balance my home and work lives, compared to 52% of full-time nurses.
Also, part-time respondents are more inclined to respond positively to the statement concerning the choice they have over the length of shifts worked. The report found that 67% responded positively, compared to 57% of full-time nurses. Interestingly, there is little difference between respondents in relation to the type of shift they work, particularly among full-time respondents. There is some difference among part-time respondents with more of those on day-time shifts (72%) responding positively than those working permanent nights (55%), or internal rotation (60%).
27 Full-time contracted hours have used the median figure as it is clear that in many cases, the hours worked had been given, rather than contracted hours.

Managing to Work Differently – RCN Employment Survey 2005 62
Figure 6.5: Views of working hours – percentages
-5
-6
-6-14
52
50
52
9
7
11
-15
-20
-40 -30 -20 -10 0 10 20 30 40 50 60 70
I am satisfied with thechoice I have over thelength of shifts I work
I feel able to balance myhome and work lives
I am satisfied with myinput in planning my own
off duty/times of work.
Percentage
disagree strongly disagree agree strongly agree
Source: Employment Research Ltd/RCN 2005
Working patterns and shift working
This year the question concerning shift working was altered slightly, although the results are still broadly comparable with previous years. The proportion of nurses working shifts has remained unchanged from 2003 at 55%. However, since 1995 this proportion has increased from 46%. Just under four in 10 nurses work office hours, and 6% work flexi-time/irregular hours.
Shift working is predominantly undertaken by younger nurses. However, the average age of nurses has increased, and the proportion of nurses aged under 30 has declined significantly since 1995 (see Chapter 2). Therefore, it is likely that the average age of nurses working shifts has increased over the last 10 years.
Table 6.5 below shows how working patterns change during the careers of nurses. The vast majority (84%) of nurses who qualified in the last five years work shifts, while only around 40% to 45% of those who qualified more than 15 years ago work this pattern.

Managing to Work Differently – RCN Employment Survey 2005
63
Table 6.5: Working patterns and shift working by decade in which qualified – percentages Decade in which qualified as nurse 1960s 1970s 1980s 1990s 2000s All
Shifts 46 45 42 61 84 55 Office hours 44 48 51 35 13 40
Main pattern of work
Flexi time/irregular 11 7 7 4 2 6
Base N=100% 331 857 1,496 1,318 741 4,743 Internal rotation 18 32 43 60 80 53 Day time shifts 55 53 44 32 18 37
Shift patterns28
Permanent night shifts 27 15 13 8 3 10
Weighted cases 170 430 703 838 635 2,776
Source: Employment Research Ltd/RCN 2005
Looking at NHS nurses, more work shifts with 58% overall, and 86% of those who qualified in the last five years. Of those nurses who report working flexi-time/irregular hours, which is predominantly a form of flexible/variable shift length (71%), 11% indicate that they self-roster or organise their own schedule. About 10% have flexible hours in terms of the day of the week that they work. Flexible working hours are most frequently cited among bank/agency nurses (14%), and independent hospital nurses (15%). Only 3% of NHS hospital nurses report working flexi-time/irregular hours. Nearly nine in 10 practice nurses (87%) work office hours.
Figure 6.6: Working pattern by employer group – percentages
0% 20% 40% 60% 80% 100%
GP Practice
NHS community
Other health employer
Hospice/charity
Bank/Agency
Independent hospital
NHS hospital
Independent care home
NHS Direct
All respondents
Percentage
Shifts
Office hours
Flexi time/irregular
Source: Employment Research Ltd/RCN 2005
28 Of those who worked shifts or flexi-time/irregular patterns.

Managing to Work Differently – RCN Employment Survey 2005 64
More than half (54%) of all nurses working shifts are on a form of internal rotation. A third of respondents (36%) work day time shifts, and one in 10 work permanent nights. The proportion working internal rotation rises to 65% among NHS hospital nurses. This is higher than in 2001 when 54% worked a form of rotation29, and 88% of NHS Direct nurses (see figure 6.7).
Figure 6.7: Shift patterns by employer group – percentages
0% 20% 40% 60% 80% 100%
Independent hospital
Independent care home
NHS community
Bank/Agency
Hospice/charity
Other health employer
NHS hospital
NHS Direct
All respondents
Percentage
Internal rotation
Day time shifts
Permanent night shifts
Source: Employment Research Ltd/RCN 2005
Shift length Nurses responding to the survey work a variety of shift lengths. Approximately 46% of all nurses working shifts work eight hour or shorter shift lengths. About one in five (19%) work nine to 10 hour shifts, a similar proportion work 11 to 12 hour shifts, and 15% work shifts longer than 12 hours. The mean length of shift worked is nine hours.
Table 6.6: Length of shifts by employer group – percentages Length of shift (hours) < 7.5 7.5 - 8 9-10 11-12 > 12
Weighted cases
NHS hospital 3 41 18 18 19 1,868 NHS community 20 49 19 8 5 133 Independent hospital 3 37 23 23 13 115 Independent care home 21 13 19 41 6
207
Bank/agency 16 18 23 38 6 124 Hospice/charity 8 48 23 13 7 112 All respondents 8 38 19 20 15 2,830
Source: Employment Research Ltd/RCN 2005
29 Comparisons are difficult here as the questions concerning shift working have altered slightly in the last few years.

Managing to Work Differently – RCN Employment Survey 2005
65
Nurses who qualified in the last five years are much more likely to work longer shifts. The survey found that one in four (24%) work shifts longer than 12 hours, and one in five (20%) work 11 to 12 hour shifts. In this group, mature entrants are more likely to want to work shorter shifts (17% compared to 13% of younger entrants). Younger entrants are more likely to say that their ideal shift length would be longer (16% compared to 8% of mature entrants).
Nurses working nine to 10 hour shifts are least likely to be happy with the length of shift that they work (53%). Four in ten say that they want a shorter shift, and 8% a longer shift. Shift lengths of nine to 10 hours appear the least popular. The preferred length of shift for nurses is 11 to 12 hour shifts and 12-hour plus shifts. One in four nurses who work shifts of less than seven and a half hours wants a longer shift.
Respondents were also asked what length of shift they would like to work. Responses to this question suggest that most, more than two-thirds (69%), both within and outside the NHS, are working their preferred length of shift. Nurses working in the hospice/charity sector were most likely to be working the length of shift they wanted (82%). Those employed in the independent care home sector were least likely (61%) to be working their preferred shift length. The others were between these two extremes.
Of those who were not working their ideal length of shift at the time of the survey, 23% wanted a shorter shift and 9% wanted a longer shift.
Key points: chapter 6
part-time working has remained at around 40% since 2000 after a period of growth in the 1990s
part-time working has reduced among nurses with dependent children, but increased among those without
full-time working has increased significantly among those aged 50-plus
83% of those who qualified in the five years prior to the survey work full-time
more of those respondents who work bank/agency as their main job work full-time than was previously the case. In 1992 37% of those who worked for an agency worked full-time, now 64% do
working beyond contracted hours has remained broadly stable in the last 10 years at around 60% of all respondents. On average full-time nurses work approximately 44 hours per week, and 20% of all respondents work more than 50 hours per week
overtime is paid for around a third of all respondents, but is an option for a half
55% of respondents work shifts. This figure has not changed in recent years. The average age of nurses working shifts has increased as the average age of newly qualified nurses increases – 85% of nurses qualified for less than five years work shifts
nurses who qualified in the last five years work longer shifts. One in five work 11 to 12 hour shifts, and one in four report working shifts longer than 12 hours.

Managing to Work Differently – RCN Employment Survey 2005 66
7. Workload and staffing
The latest labour market review figures suggest that across the UK the number of nurses has increased. But these top line figures do not tell the whole story in terms of expected changes to workload. Service expansion and development and the introduction of new roles add to demand for staff, while patient acuity and the complexity of care needs means delivering care is increasingly intensive. Added to this, the three sources of labour that are supplementing the established nursing workforce – international recruits, newly qualified nurses and bank/agency staff – do not have the same level of experience or local knowledge of their work environments as the average nurse. The newcomers are, of course, new, and temporary staff are temporary. This compares to the average nurse who has 18 years’ experience, and has been in their current job for four years.
Clearly there is a vast array of factors that will impact on the system at the macro level, but what is the net effect of these changes and influences on individual nurses delivering care? What are their workloads like and have they changed?
Workload is explored from several different perspectives in the 2005 employment survey. Since 1992, the RCN employment surveys have included a series of attitude statements, several of which explore nurses’ perceptions of their workloads and staffing where they work. Along with this data on perception of workload, respondents providing in-patient care (in hospitals or care homes) are asked for details on the number of staff they work with and numbers of patients cared for. This data allow us to calculate a ratio showing the numbers of patients per nurse. Although such a figure is limited because it does not take into account variation in patients’ care needs, and is applicable to inpatient care, nonetheless it does allow some discussion about workload based on a quantifiable measure as opposed to relying solely on perceptions. Additional questions were included in the 2005 survey to establish the impact of changes in junior doctors’ hours and GP contracts on nurses’ workloads.
Nurse-to-patient ratios
Staff were asked for details of the number of staff and patients on their last working shift, in order to get a snapshot picture of staffing. Table 7.1 presents the patient and staffing data for respondents working on NHS and independent hospital wards, and for those working in care homes. The data splits to show responses according to whether the shift referred to was during the day or at night.

Managing to Work Differently – RCN Employment Survey 2005
67
Table 7.1: Average staffing and patient data NHS Wards Independent wards Care homes Day Night Day Night Day Night Number of beds 23.4 22.7 26 - 36.2 38.6 Total number of patients 22 21 20 - 30 34 Occupancy 96% 95% 86% - 94% 92% Number of registered nurses 3.3 2.4 3.9 - 2.0 1.6 Number of HCAs/auxiliaries 2.1 1.3 1.6 - 4.9 2.6 Total staff on duty 5.4 3.7 5.4 - 7.0 4.2 RNs as % of all nursing staff 62% 66% 74% - 32% 42% Patients cared for by individualrespondent (mean) 10.3 13.5 7.8 - 18.1 23.3 Patients per RN (mean across all RNs) 7.7 10.1 5.5 - 17.2 24.6 Patients per member of nursingstaff (mean) 4.4 6.1 3.8 - 4.6 8.8
Weighted cases 822 316 55 14 240 112
Source: Employment Research/RCN 2005
The results suggest that wards in independent hospitals are slightly bigger in terms of the number of beds (26 compared to 23 on average), but they have lower occupancy rates (86% compared to 96%). Hence, NHS wards have a larger average number of patients per ward. Care homes typically have 36 beds and occupancy rates of 94%.
Independent hospital wards are better resourced both in terms of overall staffing levels and in terms of skill mix. Registered nurses (RNs) make up 74% of the staff on duty during a day shift. This compares to 63% on NHS wards. During the day, respondents working on independent hospital wards care for an average of 7.7 patients. The NHS figure is 10.2, and in care homes the corresponding figure is 17.2. There is much greater reliance on health care assistants (HCAs) in care homes. RNs represent less than a third of the staff on duty. Thus the relative paucity of RNs is balanced by having more HCAs. So, in fact the ratio of patients to nursing staff (in total) between NHS wards and care homes is very similar – 4.4 on NHS wards and 4.6 per member of nursing staff in care homes.
This overall figure of the number of patients per member of nursing staff on NHS wards is unchanged since the 2001 and 2002 surveys when it was last calculated. There has been a very slight reduction in the number of patients per RN from 8.0 in 2001 and 2002, to 7.7 in 2005. Fractionally more RNs per ward (3.4 compared to 3.2 in 2002) were reported to be on duty at the time of survey.
Effects of changes on workload
Over half (55%) of respondents working in NHS hospitals reported that changes in junior doctors’ working hours had increased their own workload. Smaller proportions (47%) of D grade NHS hospital nurses report that changes in junior doctors’ hours have had an impact on their workload. This is in contrast to G grades, 61% of whom report that it has increased their workload.

Managing to Work Differently – RCN Employment Survey 2005 68
Changes in the GP contract are reported to have increased the amount of out-of-hours service provided by nurses by 58% working in NHS community and GP practice jobs. More than two-thirds (67%) of district nurses report seeing an increase, while relatively few (27%) GP practice nurses say that they have seen an increase.
Perceptions of workload
The results of the analysis of attitude statements for respondents working in the NHS are presented in figure 7.1.
Figure 7.1: Views of workload and staffing (NHS only) - percentages
-37
-35
-40
-33
-40
-20
-14
16
20
22
30
14
1
2
3
3
2
-17
-22
-24
-80 -60 -40 -20 0 20 40
Workload is NOT tooheavy
Not under too muchpressure
Sufficient staff for goodstandard of care
NOT too busy to providelevel of care would like
Nurse staffing levelshave got better
disagree strongly disagree agree strongly agree
Source: Employment Research/RCN 2005
The results show that in general more respondents are negative about workload issues than positive. Indeed, workload is the group of items causing most dissatisfaction among respondents other than pay. For example, 59% consider that their workload is too heavy, while relatively few (25%) say that there are sufficient staff to be able to provide a good standard of care. Despite the fact that the majority are concerned about their workloads, and half feel under too much pressure, all of the workload items covered in this and the previous year’s survey, show slight improvements. The biggest change is on the item I feel under too much pressure at work. In 2003 56% agreed with this statement, but by 2005 the figure had dropped to 51%. This reflects a slight improvement in views of staffing levels and workload in some areas.

Managing to Work Differently – RCN Employment Survey 2005
69
Outside of the NHS, the better nurse-to-patient ratios described earlier for independent hospitals, are associated with more positive views of respondents about workloads and staffing. For example, just 41% of those working in independent hospitals feel that their workload is too heavy, which compares to 60% of NHS hospital nurses. While the figures reveal that 34% feel under too much pressure compared to 53% in the NHS. Twice as many (57%) in the independent sector than in the NHS (26%) feel that there are sufficient staff to provide a good standard of care. However, the independent sector is far from homogenous. Respondents working in care homes feel as negatively about many aspects of workload as NHS hospital staff. Nearly two-thirds (60%) report that workloads are too heavy, and 53% feel under too much pressure. The difference, however, is how they view staffing. A smaller proportion report that there are sufficient staff to provide care to a good standard compared with independent hospital nurses (49% compared to 57%). But, this is still a much larger proportion agreeing than among NHS staff, 26% of whom consider staffing is sufficient.
Key points: chapter 7
nurse-to-patient ratios in NHS wards have remained constant since 2001, although in 2005 there has been a fractional reduction in the number of patients per registered nurse
more than half of applicable nurses report that changes in GP contracts and junior doctors’ hours have increased nursing workloads
while the majority in the NHS consider that their workloads are too heavy, and few consider that there are sufficient staff, there has been a small reduction in the proportion feeling under too much pressure
workloads are viewed more positively by nurses in independent hospitals, but as negatively among nurses in independent care homes as in NHS hospitals.

Managing to Work Differently – RCN Employment Survey 2005 70
8. Professional development
Changes in the health service and new modes of care delivery have opened up scope for new or altered roles. For example, 11% of respondents in 2005 are clinical nurse specialists or nurse practitioners, compared with 9% in 2003 and 8% in 2002. Across the profession, nursing roles and the posts nurses occupy are changing. To respond to these changes requires a corresponding development in skills and knowledge. In the NHS, this is clearly recognised in the Knowledge and Skills Framework, introduced to accompany the new pay system.
This year respondents were asked about continuous professional development (CPD) activity in the year prior to the survey. They were questioned about the amount of time they had spent on CPD, reasons for undertaking activities and issues concerning training and professional development.
Participation in CPD activities
First we look at the types of activities undertaken by respondents. Table 8.1 below presents the aggregate results by age group. Age was found to differentiate between nurses most in terms of the types of activities that they have done. Although, in many cases, type of job influenced the type of activities undertaken. Study days are most frequently cited by respondents (81%).
Table 8.1: Participation in CPD activities by age group – percentages Age group 20-29 30-39 40-49 50-plus All ages Study days 82 82 80 80 81 In-service session 27 41 51 58 47 Conferences/seminars 32 44 50 51 46 Study based on journals 35 37 46 46 42 Lectures/demonstrations 34 38 42 46 41 Courses 35 31 27 20 28 Internet-based study 24 23 25 21 23 Visit HE institution/library 27 24 24 17 23 Interest group meeting 9 15 21 24 18 Shadowing 13 12 10 6 10 Distance learning 9 9 11 8 9 RCN continuing education articles 5 5 8 14 8 RCN Nursing Update 4 5 6 11 7 Secondments/exchanges 5 4 6 3 4 Other 3 2 2 2 2 Weighted cases 614 1,414 1,643 1,167 4,838
Source: Employment Research Ltd/RCN 2005
Between 40% to 50% mentioned in-service sessions, conferences/seminars, study based on journals, and lectures/demonstrations. Age was found to be significantly correlated with take up of many of these activities. This is particularly true for in-service sessions, interest group meetings, conferences, journal-based study, lectures and courses.

Managing to Work Differently – RCN Employment Survey 2005
71
A similar question was asked in 2000, but with fewer options. By and large there has been little change, although there has been a considerable rise in internet-based study from 6% in 2000 to 23% in 2005. There is a corresponding reduction in literature-based study from 38% to 23% this year, otherwise changes are only marginal.
Higher levels of CPD activity are associated with satisfaction about role change. For example, 78% of those respondents who had been on study days felt satisfied with the way their role had changed. This compares to 67% of those who had not been on study days.
On average respondents spent about 11 days on CPD activities in the last 12 months30. This number of days is identical to the 2000 figure. In the NHS this figure rises to 13 days, while among nurses working in independent care homes it falls to nine days. For bank and agency nurses it is seven days. It is difficult to estimate how many nurses did not spend any time on CPD activities because those who did not complete the question may well have not undertaken any CPD. Figure 8.1 shows the distribution of respondents in relation to time spent on CPD activities.
Figure 8.1: Time spent on CPD activities – percentages
0
2
4
6
8
10
12
1 2 3 4 5 6 7 8 9 10
11-15
16-20
21-25
26-30
31-35
36-40
More th
an 40
Days spent on CPD
Perc
enta
ge
Source: Employment Research Ltd/RCN 2005
There is little to separate nurses in terms of the amount of time spent on CPD by age. Although respondents over 50 spent less time than those under 50 at eight days compared to 12.
Clinical nurse specialists and nurse practitioners spend significantly more time on CPD than other nurses (13 and 16 days respectively), compared to 11 days for all NHS nurses. Senior nurses/matrons/nurse managers spent nine days on CPD last year, which is less time than other NHS nurses.
30 Here we have excluded those who have not done any CPD activity, and those who reported having done 100 days or more (classified here as undertaking full-time study – approximately 1% of respondents).

Managing to Work Differently – RCN Employment Survey 2005 72
Figure 8.2: Reasons for undertaking CPD activities – percentages
0 10 20 30 40 50 60 70 80 90
Other
Part of discussion aboutKSF outline
Prompted byappraisal/review
Encouraged to do so byemployer
To further career
To meet PREPrequirements
Personal interest
Enable me to current jobbetter
To broaden professionalknowledge
Percentage
Source: Employment Research Ltd/RCN 2005
Most nurses undertake CPD activities primarily to broaden their professional knowledge (77%), and to enable them to do their current job better (77%). However, more than two-thirds (68%) do it for personal interest, and 62% adopt a more practical approach to meet PREP requirements. Nearly four in ten (39%) want to further their career by doing CPD activities, and 30% are encouraged to do so by their employer. Higher percentages of respondents working in hospices/charities, NHS Direct, health authorities, and NHS Executive report being encouraged by their employer to undertake CPD activities. Nurses who say that their current grade is not appropriate are less likely to report that their employer encouraged them to undertake CPD activities (25% compared to 35% of those who say their grade is appropriate).
Again, these figures are much the same as reported in 2000, but with a couple of interesting differences. More respondents in 2005 say that they had undertaken CPD activities because they have been encouraged to do so by their employer. This is up from 21% in 2000 to 30% this year. More report that they have been prompted to undertake CPD activity from their appraisal/review. This figure is up from 12% to 18% in 2005.
Furthering their career is much more the focus of the younger nurse in explaining why they undertake CPD activities. In the under 30 age group 54% cite this reason compared to 41% of 40 to 49 year olds, and 19% of those aged over 50. It is interesting to note that more nurses report doing CPD activities to broaden professional knowledge if they are satisfied with the way their role has changed (reported in Chapter 4), that the change has benefited the service (82% compared to 69% of those who are not satisfied), and that it has helped them do their current job better (83% compared to 67%).

Managing to Work Differently – RCN Employment Survey 2005
73
Training and development plans
Just over a half (52%) of all respondents (and 53% of those in the NHS) say that they have a personal training and development plan (PDP). However, only 42% of nurses working in hospices, 38% of those in independent care homes and 25% in bank/agency work say that they have one. Otherwise there is little to separate employer types. Overall, this figure is much higher than reported in 2000 when 36% of respondents said that they had a personal training and development plan (38% in the NHS). Again, it is noticeable that the largest increases are among GP practice nurses up from 29% to 57%.
Type of job is a key variable correlated with having a training and development plan (see figure 8.3). Staff and community nurses are least likely to have training plans (47% and 50% respectively).
Figure 8.3: Have a personal training and development plan by job title – percentages (NHS31 only)
30 35 40 45 50 55 60 65 70
Enrolled nurse
Staff nurse
Community nurse
Nurse practitioner
School nurse
Practice Nurse
Health visitor
Senior nurse/Matron/Nurse Manager
Sister/charge nurse/Ward manager
CNS/Nurse Practitioner
Researcher/lecturer
Manager/Dir
District Nurse
All respondents
Percentage
Source: Employment Research/RCN 2005
Following on from the previous section, a higher percentage of those who have training and development plans feel satisfied with the way their role has changed (76% compared to 63% of those who do not have PDPs). Larger proportions of nurses with higher level qualifications such as a degree/higher degree have personal training and development plans (58%). It is also apparent that more recently recruited international nurses have PDPs than UK-qualified nurses (58% compared to 51%).
Of those respondents with training and development plans, 79% had their manager involved in drawing it up. This is a much higher level of employer involvement than in 2000 when 56% reported that their employers were involved in drawing up their PDPs. Employer involvement in GP practices was up from 46% to 79%.
31 All school nurses, researchers/lecturers and practice nurses.

Managing to Work Differently – RCN Employment Survey 2005 74
Senior nurses/matrons/nurse managers are also more likely to involve their managers (89%), while sisters/charge nurses/ward managers are less likely to have done so (73%).
Once again, a key variable here is satisfaction with role change. So, where a manager has been actively involved in drawing up a training and development plan, more are satisfied with role changes (79%). This compares to 63% of those who have not had their manager involved.
The most common forms of support provided by employers to help their staff meet CPD requirements are study days/seminars (80%), followed by time off (43%). This is the same as it was in 2000. Just 6% of respondents say that their employer did not provide any support to help staff. There was some difference by employer. More nurses in independent nursing homes (14%) and bank/agency nurses (15%) receive no help/support from their employer.
In 2000 30% of respondents mentioned having access to a professional development or continuing education department. Today this figure has increased to 40%, again reinforcing the notion that more employers are providing support for their employees than was the case in 2000. This increase applies across all sectors, but particularly in GP practices and the independent sector.
Figure 8.4: Support provided by employer (all respondents) – percentages
0 10 20 30 40 50 60 70 80 90
Other
Portfolios
None/nothing
Personal prof. profile
Info about KSF
Financial support
Access to prof devt/cont. ed dept.
Time off
Study days/seminars
Percentage
Source: Employment Research Ltd/RCN 2005
Job title is a key to explaining some of the variation in employer support. More clinical nurse specialists get time off and financial support, but fewer get study days/seminars. The same is true for practice nurses. Conversely, fewer staff nurses and enrolled nurses get financial support or time off. Senior nurses are more likely to get time off (see table 8.2).

Managing to Work Differently – RCN Employment Survey 2005
75
Table 8.2: Percentage of time spent in different activities by job title – percentages
Type of support
Study days Financial support Time off Weighted cases
Staff nurse 83 28 32 1,570 Community nurse 82 33 41 306 Enrolled nurse 81 16 28 68 Sister/charge nurse/ward manager 81 42 47 461 Senior nurse/matron/nurse manager 83 55 57 162 Clinical nurse specialist 76 53 58 302 Nurse practitioner 83 56 53 78 District nurse 88 39 42 115 Health visitor 81 34 42 32 School nurse32 72 59 50 46 Practice nurse 69 50 69 327 Other NHS 80 52 50 248 All NHS 82 37 41 3,385
Source: Employment Research/RCN 2005
Once again, nurses who consider that they are inappropriately graded, and/or feel dissatisfied with any role change they have experienced, are more likely to say that their employer has not provided them with any help to meet CPD requirements. For example, nearly twice as many nurses who say that they did not receive any support are not satisfied with their role change than is the case among those who have received help (40% compared to 22%).
Eight in 10 respondents (84%) report that they are maintaining a personal professional portfolio (PPP), more or less the same as in 2000 (88%). Gender appears to explain much of the variation in response to this question with 74% of men saying they are maintaining a PPP compared to 84% of women. It is also worth noting that there is some correlation with age. There are more older nurses maintaining a PPP than younger ones (89% of 50 to 54 year olds compared to 76% of those aged under 25).
Nearly a half (49%) of respondents have met with their manager to discuss their PDP. And again, more of those that have met their managers are satisfied with any role change that they have experienced.
The data in this chapter suggests that where nurses are being provided with training opportunities, have personal training and development plans and have their manager involved, there is a greater likelihood that they will feel satisfied with any changes to their role.
32 School and practice nursing includes non-NHS nurses.

Managing to Work Differently – RCN Employment Survey 2005 76
Looking at the views of respondents in relation to training, three statements cover these issues:
I am unable to take time off for training
the effort I make to update my skills is valued by my employer
my employer provides me with the opportunity to keep up with new developments related to my job.
More than half (50% to 60%) of respondents say that they are able to take time off for training, and that their employer provides them with opportunities to keep up with new developments related to their job. However, fewer (45% NHS) say that their employer values the effort that they make to update their skills and knowledge. There is significant difference by sector in response to this statement though. Much higher percentages of GP practice nurses, hospice, higher education and independent care home respondents say that their employer values the efforts that they make to update their skills.
Looking back 10 years it is clear (see Chapter 9 Training and employer support) that respondents’ views of the support that they get from their employers for training has been getting more positive.
In response to all three statements, the nurses who feel satisfied with any change in role in their job react more positively. Six in 10 respondents (63%) who are satisfied with a role change say that they are able to take time off for training compared to four in 10 (40%) of those who are not satisfied with the change in their role. Similarly, 70% think that their employer provides them with the opportunity to keep up with new developments related to their job, which compares to 43% of those not satisfied with a role change.
Figure 8.5: Views of employer support for training (NHS) – percentages
-16
-21
-23-7
51
41
46
9
5
8
-4
-6
-40 -30 -20 -10 0 10 20 30 40 50 60 70
My employer providesme w ith the opportunity
to keep up w ith newdevelopments related to
my job
The effort I make toupdate my skills is
valued by my employer
I am ABLE to take timeoff for training
disagree strongly disagree agree strongly agree
Source: Employment Research Ltd/RCN 2005
It is clear that implementing role change must be well supported by access to training provision and development opportunities.

Managing to Work Differently – RCN Employment Survey 2005
77
Key points: chapter 8
eight in 10 respondents have undertaken study days in the 12 months prior to the survey (the average number of days was 11). This figure has remained unchanged since 2000. Study days remain the most frequently cited activity, but today many more nurses are using the Internet to undertake CPD activities. This is up from 6% in 2000 to 23% today
older respondents are less likely to have been on courses, visited higher education (HE) libraries, but are more likely to have been to conferences/seminars, in-service sessions and interest group meetings
satisfaction with role change is associated with higher levels of CPD activity. For example, 78% of respondents who had been on study days felt satisfied with the way that their role had changed compared to 67% who had not
half (51%) of respondents have a training and development plan
employer commitment to training would appear to have improved in the five years since the 2000 survey. More are giving employees access to professional development/continuing education departments, more respondents have personal training and development plans and, in particular, many more respondents in all sectors say that their manager is involved in the PDP
a higher percentage of those who have training and development plans feel satisfied with the way their role has changed. For example, 76% compared to 63% of those who do not have personal training and development plans.

Managing to Work Differently – RCN Employment Survey 2005 78
9. Morale in 2005
Each year the survey collates responses on a range of issues connected with nursing employment and working lives. For 10 years now a core range of issues and questions have been covered that allow us to map changes in views and attitudes among respondents. In addition, each year a number of other issues of more immediate and topical concern are addressed.
The results for many of these items in 2005 have already been described in the report (and are tabled in the appendix). In this chapter we present responses to the longitudinal questions showing, in some cases, how views have changed over the last decade, while in other cases how little change there has been to nurses’ views and attitudes. Statements have been grouped into themes in order to provide a more consistent impression of how views have altered33.
Enthusiasm with work
Figure 8.1 below shows how nurses’ views of their working lives have shifted. There has been a gradual and perceptible improvement in enthusiasm levels of approximately 15 percentage points over the 10-year period.
Figure 9.1: Job enthusiasm – percentages 1996-2005 (NHS only)
0
10
20
30
40
50
60
70
80
90
96 97 98 99 00 01 02 03 05
Year
Perc
enta
ge a
gree
ing
Most days I am enthusiasticabout my job
I am not in a dead end job
Source:Employment Research Ltd/RCN 2005
33 It needs to be remembered that the biographical profile of the nursing workforce has changed and this will have altered patterns of response. For example, we know that younger nurses are more likely to hold negative views of their work than older nurses, and given that the average age of the workforce has increased by about five years over this period, it is likely that there are more nurses responding positively than was the case 10 years ago, all other things being equal.

Managing to Work Differently – RCN Employment Survey 2005
79
Careers in nursing
Figure 8.2 below presents responses to a series of questions concerning careers in nursing. There have been significant increases in the number of nurses who think that career prospects in nursing are becoming more attractive. This is up from 7% in 1996 to 32% this year. Similarly, there has been a strong improvement in views of nursing as a career. Twice as many respondents say that they would recommend nursing as a career in 2005 than was the case in 1996. Conversely though, there has been a small increase in numbers who say that they would like to work outside nursing. This is a drop in the positively framed statement I would not want to work outside nursing that suggests that although it can be a worthwhile career, there are costs associated with it. Similarly, there has been little change in the numbers of nurses saying that they would leave nursing if they could.
Finally, three-quarters of respondents say that nursing is a rewarding career, and this percentage has increased since the late 1990s34.
Figure 9.2: Careers in nursing – percentages 1996-2005 (NHS only)
0
10
20
30
40
50
60
70
80
90
96 97 98 99 00 01 02 03 05
Year
Perc
enta
ge a
gree
ing
I think nursing is arew arding career
I w ould not w ant to w orkoutside nursing
I w ould not w ant to leavenursing if I could
I w ould recommend nursingas a career
Career prospects in nursingare becoming moreattractive
Source:Employment Research Ltd/RCN 2005
Own career
Nurses’ views of their own career, as opposed to general views of nursing as a career, have not altered to the same extent. Across all the statements there has been little change. Most improvement is seen in how nurses view their ability to determine the way their career develops and having a sense of knowing where their career is going.
34 In 2002 there was a blip in the response caused by moving the question within the list. Since then all questions have remained in the same order to ensure continuity.

Managing to Work Differently – RCN Employment Survey 2005 80
Figure 9.3: Own career – percentages 1996 to 2005 (NHS only)
0
10
20
30
40
50
60
70
80
90
96 97 98 99 00 01 02 03 05
Year
Perc
enta
ge a
gree
ing
I know w hat I w ant to do inthe future in my career
I can determine the w ay mycareer develops
There is open dialogueabout my career w ith mymanager
I know w here my career innursing is going
Source:Employment Research Ltd/RCN 2005
Job security
As one might expect in an increasingly tight labour market there has been an enormous increase in the number of nurses who believe that they have a secure job for years to come, and who are not worried about being made redundant. In 1996 less than 20% of respondents said that they felt nursing would offer them a secure job for years to come. Today the equivalent figure is just over 70%. There has been a similar reduction in fears of redundancy.
Figure 9.4: Job security – percentages 1996 to 2005 (NHS only)
0
10
20
30
40
50
60
70
80
90
96 97 98 99 00 01 02 03 05
Year
Perc
enta
ge a
gree
ing
I am not w orried that I maybe made redundant
Nursing w ill continue tooffer me a secure job foryears to come
Source:Employment Research Ltd/RCN 2005

Managing to Work Differently – RCN Employment Survey 2005
81
Workload and pressure
Other than pay, nurses’ views of their workload are more negative than on any other of the items covered in this survey. Just 20% of respondents say they do not feel under too much pressure or that their workload is not too heavy. Although fairly entrenched, views did appear to improve marginally this year when compared to 2003.
Figure 9.5: Workload and pressure – percentages 1996 to 2005 (NHS only)
0
10
20
30
40
50
60
70
80
90
96 97 98 99 00 01 02 03 05
Year
Perc
enta
ge a
gree
ing
I don’t feel I am under toomuch pressure at w ork
My w orkload is not tooheavy
Source:Employment Research Ltd/RCN 2005
Pay
Pay is the issue that engenders the most negative response in nurses. It is clearly a significant factor in dissatisfaction that many nurses feel about their working lives. Only around one in eight nurses feel that they could not be paid more for less effort if they left nursing. Almost all respondents say that they are not well paid in relation to other professional groups, and only 16% of all nurses (15% of NHS) say that they are well paid considering the work they do. Similar to the workload section above, these views have been strongly negative for the last decade, but have shown some small signs of improvement in the last couple of years. It remains to be seen whether this is a temporary change or part of a more sustained improvement.

Managing to Work Differently – RCN Employment Survey 2005 82
Figure 9.6: Pay – percentages 1996 to 2005 (NHS only)
0
10
20
30
40
50
60
70
80
90
96 97 98 99 00 01 02 03 05
Year
Perc
enta
ge a
gree
ing
I could not be paid more forless effort if I left nursing
Considering the w ork I do Iam paid w ell
Nurses are paid w ell inrelation to other professionalgroups
Source:Employment Research Ltd/RCN 2005
Training and employer support
Over the last 10 years respondent views of employer support for their training has become more positive. In 1996, 42% of NHS respondents said that their employer provided them with the opportunity to keep up with job-related new developments, and 38% said that they are able to take time off for training. In 2005 these figures had increased respectively to 60% and 53%.
Figure 9.7: Employer support of training – percentages 1996 to 2005 (NHS only)
0
10
20
30
40
50
60
70
80
90
96 97 98 99 00 01 02 03 05
Year
Perc
enta
ge a
gree
ing
I am able to take time off fortraining
My employer provides mewith the opportunity to keepup with new developmentsrelated to my job
Source:Employment Research Ltd/RCN 2005
These charts serve to show the consistency of response over the last decade. Views on the most pressing issues of workload and pay are consistently negative, while there has been some improvement demonstrated by more positive responses concerning job security and views of nursing as a career.

Managing to Work Differently – RCN Employment Survey 2005
83
Table 9.1: Percentage agreeing with positive items – all and NHS-only 2005 (2003)
All 2005 (2003)
NHS 2005 (2003)
25
The quality of care provided where I work is good 86 (85) 86 (85)
* 13
I am NOT worried that I may be made redundant 77 (77) 79 (79)
4 Most days I am enthusiastic about my job 80 (78) 79 (77) 2 I think nursing is a rewarding career 78 (76) 77 (74)* 1
6 I am NOT in a dead end job 73 (69) 73 (70)
8 Nursing will continue to offer me a secure job for years to come 71 (71) 71 (72) 2
3 I am interested in career progression 64 (65) 66 (67)
38
I am satisfied with my input in planning my own off duty/times of work
65 (66) 63 (64)
26
I feel satisfied with my present job 64 (61) 62 (60)
33
I am satisfied with the choice I have over the length of shifts I work 62 (62) 61 (61)
21
My employer provides me with the opportunities to keep up with new developments related to my job
63 (61) 60 (61)
35
Bullying and harassment is not a problem where I work 61 (62) 58 (59)
22
Opportunities for nurses to advance their careers have improved 60 (58) 58 (56)
7 I can determine the way my career develops 60 (58) 57 (55) 3
6 I feel able to balance my work and home lives 59 57
1 I would recommend nursing as a career 58 (51) 56 (50) 6 I know what I want to do in the future in my career 57 (58) 55 (57) 3
4 I feel my work is valued 59 (55) 55 (52)
* 12
I am ABLE to take time off for training 57 (53) 54 (52)
27
I’m proud to work in this organisation 57 (52) 53 (49)
39
I am confident I would be treated fairly if I reported being harassed at work by a colleague
55 (56) 52 (54)
19
I would NOT leave nursing if I could 53 (50) 52 (49)
32
I would find it easy to get another job using my skills 50 (51) 47 (49)
30
The effort I make to update my skills is valued by my employer 50 (49) 46 (47)
24
There is open dialogue about my career with my manager 47 (46) 45 (48)
* 18
I DO know where my career in nursing is going 46 (45) 44 (44)
14
I have a good chance to get ahead in nursing 37 (34) 37 (34)

Managing to Work Differently – RCN Employment Survey 2005 84
17
I would not want to work outside nursing 37 (39) 36 (39)
* 20
Career prospects in nursing are NOT becoming less attractive 35 (29) 33 (28)
31
I am NOT too busy to provide the level of care I would like 37 33
* 11
It will NOT be very difficult for me to progress from my current grade
28 (25) 29 (26)
* 28
Too much of my time is NOT spent in non-nursing duties 31 (29) 27 (26)
29
There are sufficient staff to provide a good standard of care 32 (31) 25 (26)
* 9 I am NOT under too much pressure at work 24 (19) 22 (17)* 5 My workload is NOT too heavy 20 (15) 17 (13) 1
0 Considering the work I do I am paid well 20 (15) 16 (12)
37
Nurse staffing levels have got better in the last year 18 15
* 3 I could NOT be paid more for less effort if I left nursing 12 (12) 11 (11)* 1
5 Nurses are paid WELL in relation to other professional groups 7 (6) 6 (5)
Asterisked (*) statements have been reworded and the score reversed
Source: Employment Research Ltd/RCN 2005
Table 9.1 serves to illustrate both the differences between the NHS responses and all nurses, as well as the change between the 2003 and 2005 surveys. The biggest changes are in the following statements:
I would recommend nursing as a career (up from 51% agreeing in 2003 to 58% in 2005)
career prospects in nursing are NOT becoming less attractive (29% to 35%)
I am proud to work in this organisation (52% to 57%)
considering the work I do I am well paid (15% to 20%)
I am NOT under too much pressure at work (19% to 24%)
my workload is NOT too heavy (15% to 20%).
In terms of differences between the NHS and all nurses, the following are the main differences:
there are sufficient staff to provide a good standard of care (32% of all nurses agree compared to 25% of NHS nurses)
I feel my work is valued (59% to 55%)
I am NOT too busy to provide the level of care I would like (37% to 33%)
the effort I make to update my skills is valued by my employer (50% to 46%)
NOT too much of my time is spent on non-nursing duties (31% to 27%)
considering the work I do I am well paid (20% to 16%).
In all responses the views of NHS nurses are more negative than is the case across all sectors. In particular, this is the case in replies to the statement that there are sufficient staff to provide a good standard of care. This is explored in more detail above in Chapter 7.

Managing to Work Differently – RCN Employment Survey 2005
85
10. Appendices
Appendix A: survey process In previous years the RCN has undertaken the sampling process using instructions from the research team to draw the sample. However, problems in 2002 and 2003 led the RCN to use the research team to draw the sample directly from the full membership records database.
Drawing the sample
The full membership records were provided on 19 January 2005. At this date the database contained 373,075 records.
The annual employment survey sample is selected only from:
1. full category, full newly qualified category and full concessionary category (same as in previous surveys) plus health care assistant (HCA) and HCA concessionary (included this year, not included in the past)
2. those members based in UK, overseas 0.5% and missing 0.2%.
This leaves a population of 317,111 members.
The profile of this sub-group is:
Table A1: membership breakdown (all UK) Type Number of members Percentage Full 283,661 89.5 Full concessionary 10,027 3.2 Full newly qualified 22,455 7.1 HCA 501 0.2 HCA (concessionary) 467 0.1 Gender No. of Members Percentage Female 289,617 91.3 Male 27,494 8.7 Country No. of Members Percentage England 257,186 81.4 Scotland 30,747 9.7 Wales 17,746 5.6 Northern Ireland 10,201 3.2
Source: RCN membership records, January 2005

Managing to Work Differently – RCN Employment Survey 2005 86
Table A2: age bands (all UK) Number of members Percentage (all) Percentage (known) 20-24 5,229 1.6 2.9 25-29 17,675 5.6 9.7 30-34 25,264 8.0 13.9 35-39 28,151 8.9 15.5 40-44 32,998 10.4 18.2 45-49 28,275 8.9 15.6 50-54 19,530 6.2 10.7 55 plus 24,683 7.8 13.6 Missing 135,306 42.7 0
Source: RCN membership records, January 2005
From this sub-population, a sample of 6,000 fully random records was drawn. In addition, 1,000 members (not previously included) were drawn from members living in Scotland, Wales and Northern Ireland.
The survey was mailed on 8 February 2005 with three reminders. The initial pack consisted of a letter from the General Secretary, the questionnaire and a reply paid envelope. The first reminder, mailed on 1March, consisted of a postcard, the second was a full reminder with second questionnaire and reply paid envelope mailed on 10 March, and the final reminder, a letter from Employment Research, was mailed on 23 March.
Response rates
An overall response rate of 57% was achieved. This is slightly lower than in previous years, but is more or less the same when compared with samples drawn from the entire membership records, not including those who have completed their update form, of which there were more cases drawn in previous years.
It is also likely that nurses are experiencing some survey fatigue because they have been surveyed regularly by their employer as part of Healthy Working Lives. In addition, the questionnaire has gradually increased in length over the years, and it is likely that this has reduced response rates too.
Table A3: overall response rates by sample
Total mailed
Post Office returns
Inappropriate Number usable responses
Response rate
Main sample 6,000 69 17 3366 57% Northern Ireland top up
1,000 5 2 538 54%
Scotland top up 1,000 13 2 579 59% Wales top up 1,000 7 2 579 58%
Source: Employment Research Ltd/RCN 2005
As in previous years, the response rate for younger nurses is lower, particularly for the 25 to 34 year old groups. They account for 21.3% of respondents, but make up 26.5% of the survey population (see table A2 above). It has been shown before that age is the main variable influencing the response rate, followed by gender and to a lesser extent ethnicity.

Managing to Work Differently – RCN Employment Survey 2005
87
Response weighting
The data presented in the report is based on weighted data (5,073 cases in all). However, to give an idea of the numbers on which the analysis is based, tables A5 and A6 show the numbers of cases included in the final response set for each country, before and after weighting. Using top up samples, and then weighting the data enables more reliable analysis because there are a larger number of cases. The results produced are more likely to provide an accurate reflection of the experiences and views of the population of RCN members.
Table A4: country worked in35 – cases before and after weighting Before weighting After weighting Cases Percentage Cases Percentage England 3,366 54.6 4,121 81.5 Northern Ireland 538 10.6 163 3.2 Scotland 579 11.4 493 9.7 Wales 579 11.4 284 5.6
All cases 5,062 100 5,062 100
Missing 11 - 11 -
Source: Employment Research/RCN 2005
The procedure was as follows:
1) first a country weight was calculated. This was achieved by looking at the proportion of respondents living in each country both in the population and among respondents. So, for example, England respondents make up just under 82% of the RCN membership, but only 55% of the response set. So each respondent from England is given a weight of roughly 1.2 (that is 81.5 divided by 54.6) to compensate for the bias
2) second, once a weight generated in step 1 above is applied, the age profile was examined. Again the profile among respondents was compared with the membership population36 and a second weight as above was calculated.
35 For the weighting figures this is based on numbers of numbers of nurses living in each country as the membership records do not hold country worked in data. 36 Unfortunately, one drawback of this weighting process is that the membership records do not contain age data on all members, but this is the best proxy that can be used in these circumstances.

Managing to Work Differently – RCN Employment Survey 2005 88
These two weights are multiplied to produce a single weighting figure, and this is applied to each case.
Table A5: age profile – cases before and after weighting Before weighting After weighting Age band Cases Percentage Cases Percentage 20-24 119 2.4 142 2.9 25-29 331 6.7 481 9.7 30-34 605 12.2 688 13.9 35-39 753 15.2 766 15.5 40-44 952 19.2 898 18.2 45-49 834 16.8 770 15.6 50-54 652 13.2 532 10.7 55-plus 703 14.2 672 13.6
All cases 5,073 100 5,073 100
Missing 124 - 124 -
Source: Employment Research/RCN 2005
Sample statistics and confidence for small sub samples A key concern of the survey is to provide an accurate measure of nurses’ experiences and views. Given that some of the statistics produced in the report are based on some relatively small numbers of respondents, it is worth looking at the reliability of the estimates. For the most part though, large samples are used and we can be very confident that the results are reliable estimates of the population of RCN members.
Here we try to give some indication as to the precision of the results given in the substantive parts of the report. The table below gives the approximate margin of error associated with percentage estimates for a 50/50 and 10/90 split for different sample sizes. The worst case in terms of precision of the estimate is for a 50/50 split in the sample.

Managing to Work Differently – RCN Employment Survey 2005
89
Table A6: margin of error for estimating the population proportion to be 50/50 or 10/90 for different sample sizes and for a 95% confidence interval Sample size 200 500 1,000 2,000 5,000 Standard error and (margin for 50% estimate)
3.5 (±7.0%)
2.2 (±4.4%)
1.6 (±3.2%)
1.1 (±2.2)
0.7 (±1.4)
Standard error and (margin for 10/90% estimate)
2.4 (±4.8%)
1.5 (±2.6%)
1.1 (±2.2%)
0.74 (±1.5%)
0.4 (±0.8%)
To put it into words, if we were estimating that 10% of ethnic minority nurses hold a particular view and 500 responded to the question the following applies:
We are 95% confident that between 7.4% and 12.6% of ethnic minority nurses hold this view (10% ± 2.6%).
However, when we are looking at larger sub samples, for example all NHS nurses, a more precise estimate can be provided, say 10% ±1.5%.
Knowledge of the margin of error allows us to specify the likely range of the estimate obtained from the survey data within which the population value lies with a certain level of probability/confidence. It also allows us to say that, when two estimates differ by a certain amount, how confident we can be that they indicate different population values.
Clearly with smaller sub samples variation in the response increases and the level of precision of the data declines. As a result, reporting differences between groups of sub samples becomes more problematic and prone to error. However, we should also note that the main concern of most surveys is to estimate the magnitude of effects. This means that determining strength of opinion about key issues is as important as whether two results are significantly different from one another.

Managing to Work Differently – RCN Employment Survey 2005 90
Appendix B: additional tables
Table B1: employer group and setting by decade of qualification – percentages Decade in which qualified 1960s 1970s 1980s 1990s 2000+ Total NHS hospital 28 40 46 60 76 52 NHS community 9 14 16 13 8 13 NHS Direct 0 1 1 0 0 1 NHS other 5 5 8 4 1 5 GP practice 13 11 9 4 1 7 Independent hospital 2 4 2 3 1 3 Independent care home 14 8 4 4 3 5 Other independent 1 1 1 1 0 1 Bank/agency 11 3 3 3 3 3 Higher education 1 2 1 1 0 1 Hospice/charity 7 4 3 2 2 3 School 1 1 1 1 0 1 HA/NHS Executive 3 2 2 1 2 2 Other health employer 1 1 1 1 1 1 Weighted cases 346 876 110 1,316 723 4,771
Table B2: job title by decade of qualification – percentages Decade in which qualified 1960s 1970s 1980s 1990s 2000+ Total Staff nurse 35 27 29 47 83 42 Community nurse 5 7 9 6 8 7 Enrolled nurse 5 5 3 0 0 2 Sister/charge nurse/ward manager 11 13 14 14 2 12 Senior nurse/matron/nurse manager 8 8 6 4 0 5 Clinical nurse specialist 6 7 10 8 0 7 Nurse practitioner 1 4 3 2 0 2 District nurse 3 3 3 3 0 3 Health visitor 1 2 1 1 1 1 School nurse 1 1 2 1 1 1 Practice nurse 13 9 8 4 1 7 Manager/director 3 4 4 2 1 3 Researcher/lecturer 3 3 3 2 1 2 Other 3 6 5 4 1 4 Weighted cases 346 880 1,513 1,316 728 4,783
Source: Employment Research Ltd/RCN 2005

Managing to Work Differently – RCN Employment Survey 2005
91
Table B3: field of practice by decade of qualification – percentages Decade in which qualified 1960s 1970s 1980s 1990s 2000+ Total Primary care 24 22 19 13 7 16 Community care 6 6 7 5 3 5 Older people nursing 21 14 8 7 6 9 Mental health 4 5 8 6 11 7 Adult critical care 4 7 10 16 20 12 Adult general 10 13 14 24 26 18 Rehab/longer term 3 3 2 2 2 2 Paediatric critical care 1 2 3 2 4 2 Paediatrics general 1 2 3 3 5 3 Women’s health 2 2 2 3 2 2 Learning disabilities 1 2 2 2 3 2 Oncology/palliative 8 4 5 5 5 5 Education/research 3 3 3 2 0 2 Several different fields 5 4 4 3 1 3 Other 5 9 10 6 6 8 Weighted cases 347 878 1,501 1,308 725 4,759
Source: Employment Research Ltd/RCN 2005
Table B4: biographical profile by employer group – percentages
Age (years)
Time since qualified (years)
Ethnic minority %
Male %
Dependent children %
Dependent adults %
Weighted cases
NHS hospital 39.3 15.3 10 8 53 16 2,529 NHS community 42.6 18.9 4 8 64 20 634 NHS Direct 40.9 19.4 11 4 58 22 28 NHS other 43.1 20.7 5 9 61 19 253 GP practice 45.4 23.6 4 0 70 21 354 Indep. Hosp42.8 19.4 14 9 58 15 127 Indep. care home 47.9 23.6 30 6 46 23 265 Other indep. 42.8 20.9 10 38 15 42 Bank/ agency 46.4 22.3 20 10 46 14 164 Higher education 45.4 22.8 7 5 54 24 40 Hospice/ charity 47.2 22.5 4 6 47 26 155 School 45.1 22.2 4 66 35 47

Managing to Work Differently – RCN Employment Survey 2005 92
HA/NHS Executive 46.2 20.5 7 2 60 37 82 Other health employer 42.5 18.9 6 4 56 17 52 Total 41.8 18.1 9 7 56 18 4,873
Source: Employment Research Ltd/RCN 2005
Table B5: biographical profile by job title – percentages
Age (years)
Time since qualified (years)
Ethnic minority %
Male %
Dependent children %
Dependent adults %
Weighted cases
Staff nurse 39.0 14.2 16 7 52 16 2,057 Community nurse 41.8 17.6 3 9 64 21
348
Enrolled nurse 50.3 27.6 2 0 54 31
105
Ward manager 43.0 19.9 8 8 55 17
571
Senior nurse/ matron 45.5 22.3 7 8 48 20
252
CNS 42.3 20.2 2 7 63 20 336 Nurse practitioner 44.3 21.7 3 6 56 20
118
District nurse 44.0 20.5 6 5 62 23 123 Health visitor 45.0 19.6 2 3 62 25 60 School nurse 43.0 19.9 0 2 78 18 51 Practice nurse 45.5 23.4 4 0 69 20
320
Manager/ director 45.6 22.0 4 18 46 21
138
Researcher/ lecturer 43.6 21.8 5 4 59 23
109
Weighted cases 41.8 18.1 9 7 56 18
4,877
Source: Employment Research Ltd/RCN 2005

Managing to Work Differently – RCN Employment Survey 2005
93
Table B6: biographical profile by field of work – percentages
Age (years)
Time since qualified (years)
Ethnic minority %
Male %
Dependent children %
Dependent adults %
Weighted cases
Primary care 44.7 21.7 5 2 66 20 787 Community care 43.0 20.2 3 3 63 22 266 Older people nursing 46.9 22.7 25 7 46 27 458 Mental health 42.4 15.9 15 24 54 17 352 Adult critical care 37.3 13.4 10 12 52 14 577 Adult general 38.7 14.8 12 5 55 17 871 Rehab/longer term 43.0 18.7 7 5 53 18 112 Paeds critical care 39.2 16.0 9 47 9 115 Paeds general 37.2 14.8 2 4 53 14 160 Women’s health 41.2 17.8 6 2 58 22 109 Learning disabilities 42.3 16.1 6 14 54 20 97 Oncology/palliative 42.4 18.5 1 6 52 15 247 Education/research 43.5 21.7 5 2 57 21 115 Several fields 45.1 22.0 2 6 53 25 161 Other 42.2 19.1 5 7 57 17 376 All respondents 41.8 18.1 9 7 56 18 4,854
Source: Employment Research Ltd/RCN 2005

Managing to Work Differently – RCN Employment Survey 2005 94
Table B7: biographical profile by region – percentages
Age (years)
Time since qualified (years)
Ethnic minority %
Male %
Dependent children %
Dependent adults %
Weighted cases
East Midlands 40.8 17.9 9 10 58 18 279 Eastern 41.9 18.2 9 6 61 16 360 London 40.5 15.9 35 11 40 17 281 North West 42.5 17.5 8 8 58 20 409 Northern 43.2 19.0 3 9 53 25 179 South East 43.3 19.3 10 8 57 17 559 South West 42.1 17.9 7 7 50 16 449 West Midlands 41.2 17.2 15 6 58 14 304 Yorkshire and the Humber 41.2 17.5 8 5 55 20 348 Northern Ireland 40.4 18.6 6 6 63 24 277 Scotland 41.9 18.6 2 6 54 18 844 Wales 42.5 18.9 5 6 58 20 477 All UK 41.9 18.2 9 7 56 18 4,766
Source: Employment Research Ltd/RCN 2005
Table B8: field of practice by grade – percentages
D E F G H I Weighted cases
Other grade %
Primary care 10 22 20 38 8 2 753 5 Community care 16 40 9 25 9 2 257 3 Older people nursing 37 33 11 14 3 2 365 12 Mental health 10 37 19 21 10 4 294 14 Adult critical care 25 44 16 11 2 1 551 5 Adult general 31 37 16 12 4 1 829 5 Rehab/longer term 29 32 14 17 7 1 107 4 Paediatric critical care 13 48 19 15 6 0 108 5 Paediatrics general 17 50 17 13 1 1 150 4 Women’s health 18 27 25 21 9 1 102 7 Learning disabilities 20 36 14 17 9 3 86 8 Oncology/palliative 14 33 16 16 18 2 238 4 Education/research 1 8 26 31 22 12 98 13 Several different fields 9 13 16 34 21 7 131 17 Other 10 26 21 28 11 4 337 8 All respondents 20 33 17 21 8 2 4,434 7
Source: Employment Research Ltd/RCN 2005

Managing to Work Differently – RCN Employment Survey 2005
95
Table B9: job title by grade – percentages
D E F G H I Weighted cases
Other grade %
Staff nurse 36 59 5 0 0 0 1,916 6 Community nurse 16 46 15 20 3 0 325 6 Enrolled nurse 75 22 3 0 0 0 96 6 Sister/charge nurse/ward manager 1 5 46 46 2 0 545 4 Senior nurse/matron/nurse manager 2 9 19 20 35 16 205 17 CNS/nurse practitioner 0 1 13 43 39 4 320 6 Nurse practitioner 3 7 20 36 27 6 113 3 District nurse 3 9 8 69 11 0 123 3 Health visitor 13 21 5 59 2 0 56 7 School nurse 9 30 36 23 2 0 47 2 Practice nurse 2 13 34 46 6 0 316 3 Manager/director 3 2 22 23 23 27 60 52 Researcher/lecturer 0 8 29 23 24 17 93 11 Other 5 6 26 42 12 8 153 12 All respondents 20 33 17 21 8 2 4,448 7
Source: Employment Research/RCN 2005

Managing to Work Differently – RCN Employment Survey 2005 96
Table B10: profile of nurses who qualified in five years prior to the survey – percentages (2005 and 2003) 2005 2003 Employed in NHS 87% 81% Part-time employed 17% 14% Applied for higher grade post 30% 38% Changed jobs in previous year 30% 38% Changed employer in last year 13% 21% Recommend nursing as a career 70% 61% Would not leave nursing if could 64% 58% Men 10% 11% Aged under 30 54% 63% More than half household income 45% 47% Have dependent children 36% 34% Live with spouse 65% 66% Other caring responsibilities 12% 10% Degree qualified 22% 19% Diploma qualified 63% 65% IRN 6% 5% BME 15% 14% Planning to leave employer within 2 years 42% 39% Would leave nursing if could 17% 21% Grade changed 2004/2005 28% 30% Qualified over 30 33% 27% Mean age 31.6 30.3 Weighted cases 748 1,457
Source: Employment Research Ltd/RCN 2005

Managing to work differently Results from the RCN Employment Survey 2005
October 2005
Published by the Royal College of Nursing20 Cavendish SquareLondon W1G 0RN
020 7409 3333
The RCN represents nurses and nursing, promotes excellence in practice and shapes health policies
Publication code 003 006
w w w. r c n . o rg . u k
Survey cover_2 10/10/05 17:54 Page 1