managing through economic recovery
TRANSCRIPT

1INVESTMENT STRATEGY BRIEF
April 20, 2021
INVESTMENT STRATEGY BRIEF: Managing Through Economic Recovery
Insights from Stifel’s CIO Office
Michael O’Keeffe, CFA Chief Investment Officer
Jared BrentInvestment Strategist
Nik Eftimov, CFA Senior Investment Strategist
Brian MoodyInvestment Strategist
David Motsonelidze, CFA Director of Macro Strategy
Sneha JoseDirector of Behavioral Finance
2INVESTMENT STRATEGY BRIEF
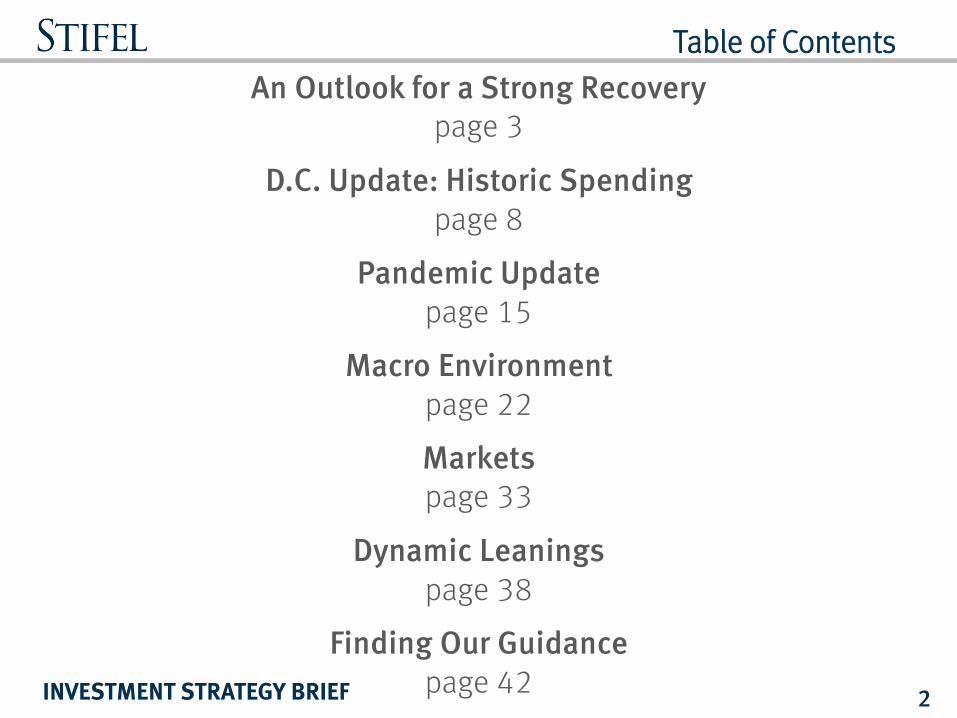
An Outlook for a Strong Recoverypage 3
D.C. Update: Historic Spendingpage 8
Pandemic Update page 15
Macro Environment page 22
Marketspage 33
Dynamic Leaningspage 38
Finding Our Guidancepage 42
Table of Contents

3INVESTMENT STRATEGY BRIEF
An Outlook for a Strong Recovery

4INVESTMENT STRATEGY BRIEF
Our Outlook 2021 – Three Scenarios
Bull Case (15%)• A faster timeline to herd immunity• Back closer to “normal” for Consumers• Even more business spendingBear Case (15%)• A meaningful delay in vaccination efforts• COVID-19 cases continue to surge• Business and economic headwinds remain• “Animal Spirits” impacted
Base Case (70%)• Successful vaccination campaign in the U.S. and abroad • Federal government support of the economy continues• President Biden prioritizes economic recovery • Geopolitical tensions and policy uncertainty decreases
See our Stifel Outlook 2021 report and video.
Our 2021 Outlook

5INVESTMENT STRATEGY BRIEF
Risks to Our Outlook
Risks
Troublesome coronavirus variants• Faster-spreading variants of the virus • Possibly resistant to vaccine• Impact of the boundary of herd immunity
Market Excess• Focused segments of the market are richly valued• Certain market areas are disconnected from fundamentals
Results Are “Too Good”• Heating up inflation• Higher rates
Possible Market Correction• Some possibility of a market correction in the first half of 2021• Pullback as a temporary pause possible even in our Base Case
Slower Global Recovery• Certain countries falling behind vaccination curve

6INVESTMENT STRATEGY BRIEF
Our Outlook 2021 – The Numbers

7INVESTMENT STRATEGY BRIEF
Coronavirus/Major Investment Themes
VIEW REPORT VIEW VIDEO
Productive Competition
Fourth Industrial Revolution
Shifting Demographics
Geopolitical Tensions and Protectionism
Managing Through Economic Recovery

8INVESTMENT STRATEGY BRIEF
D.C. Update – Historic Spending

9INVESTMENT STRATEGY BRIEF
Fiscal Stimulus Package
Source: Stifel Investment Strategy via Committee for a Responsible Federal Budget (CFRB) as of March 12, 2021
Ways & Means ($ in billions) Oversight & Reform Education & Labor
$923 billion
$350 $290Energy & Commerce
$122Transportation & Infrastructure
$90
Financial Services
$71Small Business
$50
What’s in the Stimulus Package?
Stimulus checks……………….$422Extended unemployment…..$246Expanded tax credits…………$143Grants to pension plans…….$58Expand ACA subsidies……….$45Extended paid sick leave……$14Subsidize COBRA coverage..$8Other policies……………………$9Repeal interest expense rule for multinational corporations.-$22
10INVESTMENT STRATEGY BRIEF
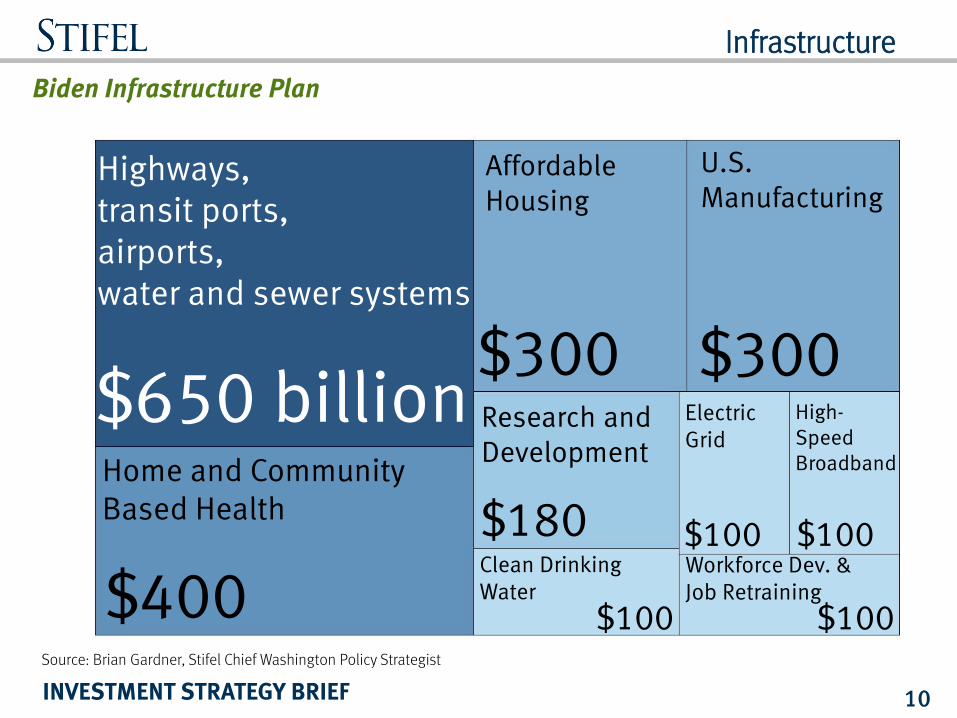
Infrastructure
Source: Brian Gardner, Stifel Chief Washington Policy Strategist
Biden Infrastructure Plan
Highways, transit ports, airports, water and sewer systems
$650 billionHome and Community Based Health
$400
Affordable Housing
$300
U.S.Manufacturing
$300Research and Development
Clean Drinking Water
$100
$180Workforce Dev. & Job Retraining
$100
Electric Grid
$100
High-SpeedBroadband
$100

11INVESTMENT STRATEGY BRIEF
Taxes
• Beat COVID-19
• Jobs and Economic Recovery
• Health Care
• Tax Legislation
• Infrastructure
• Immigration
• “Make it in America” - Semiconductors
Biden Administration Near-Term Agenda BIDEN TAX PLANCorporate Taxes• Raise to 28% from 21%• Minimum 15% tax for
companies with more than $100 million in annual income
• Double the Global Intangible Low-Taxed Income (GILTI)
Individual Taxes • Raise top tax rate to 39.6%
from 37%• Cap itemized deductions at
28% for incomes above $400,000
• Apply payroll tax on income earned above $400,000
Investment and Retirement• Capital gains as ordinary
income for incomes above $1 million
• Eliminate stepped-up basis at death
• Increase estate tax rate to 45%Source: Stifel Investment Strategy as of March 12, 2021

12INVESTMENT STRATEGY BRIEF
Policy
Government interest expenses and 10-year yield
Source: Stifel Investment Strategy via Bloomberg and Federal Reserve Bank of St. Louis, as of April 15, 2021

13INVESTMENT STRATEGY BRIEF
Policy
Federal Finances
Source: CBO, J.P. Morgan Asset Management. Estimates are based on the Congressional Budget Office (CBO) February 2021. Baseline Budget Forecast adjusted to account for the impact of the America Rescue Plan Act of 2021. Other spending includes, but is not limited to, health insurance subsidies, income security and federal civilian and military retirement. Note: years shown are fiscal years. (Oct. 1 through Sep. 30) Forecasts are not a reliable indicator of future performance. Forecasts, projections and other forward looking statements are based upon current beliefs and expectations. They are for illustrative purposes only and serve as an indication of what may occur. Given the inherent uncertainties and risks associated with forecasts, projections or other forward statements, actual events, results of performance may differ materially from those reflected or contemplated. Guide to the Markets – U.S. Data are as of April 14, 2021

14INVESTMENT STRATEGY BRIEF
Policy
Government budget balances and debt
Source: Stifel Investment Strategy via Congressional Budget office, as of February 11, 2021

15INVESTMENT STRATEGY BRIEF
Pandemic Update

16INVESTMENT STRATEGY BRIEF
Coronavirus Monitor
Source: Stifel Investment Strategy via Institute for Health Metrics and Evaluation (IHME), as of April 16, 2021
Source: Stifel Investment Strategy via Bloomberg, as of April 19, 2021
0
50,000
100,000
150,000
200,000
250,000
300,000
350,000
400,000
450,000
Mar-20 Jul-21
Estimated Daily COVID-19
Infections
April 18, 2021

17INVESTMENT STRATEGY BRIEF
Path to Herd Immunity
>3 millionVaccine shots/day
65,000Cases/day
End of Second QuarterTiming for herd immunity?

18INVESTMENT STRATEGY BRIEF
Coronavirus Monitor
Source: Stifel Investment Strategy via Bloomberg, Fundstrat and CDC, as of April 19, 2021; U.S. state and national level data shown in the dots above. *Estimated infection rate equals detected infections times 4. (Source: Fundstrat)

19INVESTMENT STRATEGY BRIEF
Vaccination Progress Globally
Source: Stifel Investment Strategy via New York Times, as of April 15, 2021
Per 100 people Total Vaccinated Fully Vaccinated
World 11 840,719,672 - -
Seychelles 116 112,194 68% 47%
Israel 116 10,298,554 60% 56%
U.A.E. 97 9,295,462 - -
Chile 67 12,496,993 40% 27%
Bahrain 64 1,008,746 37% 27%
Bhutan 63 477,060 - -
U.K. 61 40,496,685 49% 12%
United States 59 194,791,836 37% 23%
Maldives 58 299,029 53% 5%
San Marino 56 18,835 31% 25%
Doses Administered Pct. of populationCountry/Region

20INVESTMENT STRATEGY BRIEF
Israel
Source: Stifel Investment Strategy via Bloomberg and Our World In Data, as of April 15, 2021

21INVESTMENT STRATEGY BRIEF
3.1%Hourly Earnings YoY
212KJobless Claims
Source: Stifel Investment Strategy via Google Mobility Trends, as of April 11, 2021; based on 7-day moving average data.
Mobility Trends

22INVESTMENT STRATEGY BRIEF
Macro Environment

23INVESTMENT STRATEGY BRIEF
MACRO MARKETS THEMES
Market Environment• Increased volatility• Modestly higher returns forward• Exited bear market
Equity Market • Earnings growth recovering, valuations
are up• Longer-term driven by fundamentals• Market is up 90% since its low
Bond Market• Rates fell, curve flattened• Household credit rising but remains
modest relative to GDP• Stretched corporate credit no longer
under pressure
Foreign Exchange & Commodities• Dollar (DXY) up 1.9% YTD on rate
differentials • Gold down 7.1% YTD to $1,763• Oil (WTI) up 29% YTD on supply curbs
and positive vaccine news
Potential Headwinds • Coronavirus pandemic• Inflation and price pressures picking up
faster than expected• Slower U.S. GDP growth• Trade and tariff tensions• Heightened geopolitical risks (Europe,
Iran)
Existing Tailwinds• Massive monetary support• Historic fiscal support• Started crisis with a strong economy• Moderna’s, J&J’s, and Pfizer’s vaccines
are approved• May have hit a pandemic peak
U.S. Economy• Q4 2020 GDP at 4.3%• Peaking jobless claims• Declining unemployment rate• Non-farm Payrolls 539,000 (rolling 3-
month total)• Wage growth, 4.2%• Inflation lower, 1.6% (Core CPI)• V-shaped recovery• $2.3 trillion stimulus package
Central Bank Activity• Carefully rebuilt the tools• Dovish global central banks• Global M2 stable• Federal Reserve (Fed) – unprecedented
measures• Expanding balance sheet
Global Economy• Global manufacturing above pre-COVID
levels• Supportive Global Fiscal Policy • Asia ex Japan GDP, 1.4% in 2020• Japan Real GDP, -4.9% in 2020• Europe core stronger than periphery
Geopolitical Events• Protectionism and trade• 2020 Presidential Election • Gulf tensions• China, Russia, Middle East, North Korea
Themes• Productive Competition• Fourth Industrial Revolution
…and Globalism• Shifting Demographics
…and Millennials• Geopolitical Tensions
…and Protectionism• Managing Through Economic Recovery
Source: Stifel Investment Strategy data via Bloomberg, as of April 15, 2021
Macro, Markets, and Themes

24INVESTMENT STRATEGY BRIEF
Very Positive
Neutral
Very Negative
Source: Stifel Investment Strategy via Bloomberg, as of April 16, 2021
Macro Environment: Economy
The Economy
Unemploym. Rate (%) 6.0 Consumer Confidence 109.7 Pers. Spending (%) (1.0)
Based on a 3-month moving average
Industrial Prod. (YoY) 1.0 Markit Comp. PMI 59.7 NFIB Small Bus. Opt. 98.2
Based on a 3-month moving average
GDPNow (%) 8.3 Inflation (CPI) 2.6 Estimated 2021 GDP (%) 6.2
Annual Rate from prior quarter Year-over-year change Year-over-year change
1 yearlong term 1 year long term 1 year long term
1 year
long term 1 year long term 1 year long term 1 year
long term 1 year long term 1 year long term
25INVESTMENT STRATEGY BRIEF
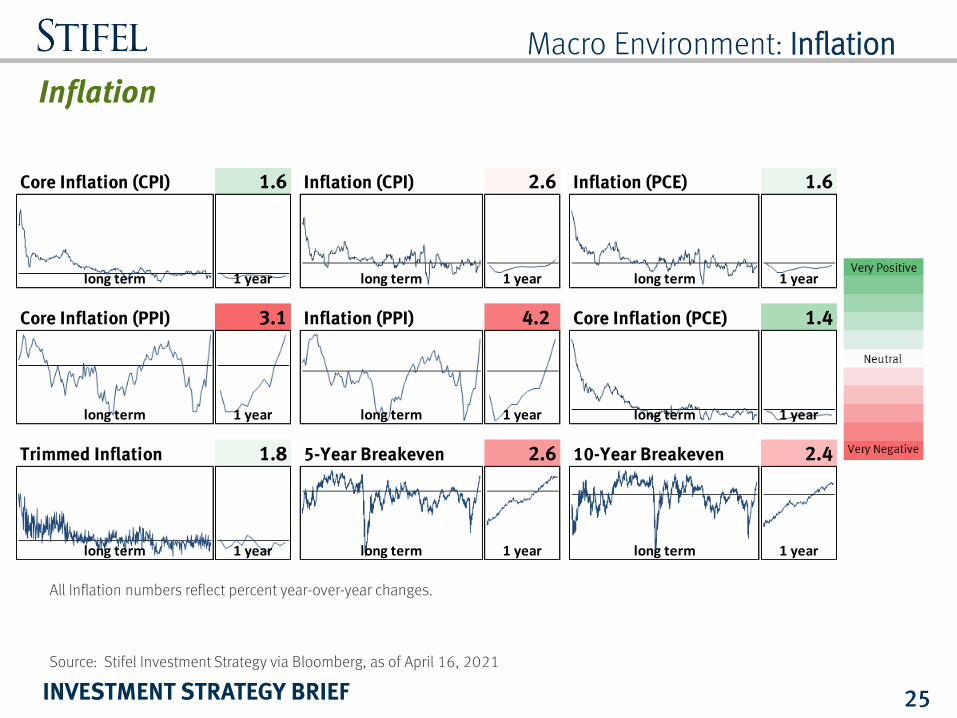
Macro Environment: Inflation
Inflation
Source: Stifel Investment Strategy via Bloomberg, as of April 16, 2021
Core Inflation (CPI) 1.6 Inflation (CPI) 2.6 Inflation (PCE) 1.6
Core Inflation (PPI) 3.1 Inflation (PPI) 4.2 Core Inflation (PCE) 1.4
Trimmed Inflation 1.8 5-Year Breakeven 2.6 10-Year Breakeven 2.4
long term 1 yearlong term 1 year
long term 1 year
long term 1 year
long term 1 year
long term 1 year long term 1 year
long term 1 year long term 1 year
All Inflation numbers reflect percent year-over-year changes.

26INVESTMENT STRATEGY BRIEF
Macro Environment: Employment
Source: Stifel Investment Strategy data via Bloomberg and Bureau of Labor Statistics, as of April 16, 2021
Jobs Lost and Regained by Industry

27INVESTMENT STRATEGY BRIEF
Macro Environment: Fed
FOMC Minutes
Percent
2021 2022 2023 Longer run
Change in real GDP 6.5 3.3 2.2 1.8
December projection 4.2 3.2 2.4 1.8
Unemployment rate 4.5 3.9 3.5 4.0
December projection 5.0 4.2 3.7 4.1
PCE inflation 2.4 2.0 2.1 2.0
December projection 1.8 1.9 2.0 2.0
Federal funds rate 0.1 0.1 0.1 2.5
December projection 0.1 0.1 0.1 2.5
Variable
Median
Source: Federal Reserve, as of March 17, 2021
Summary of Economic Projections
• Stronger GDP growth projections compared to December on vaccination progress
• Employment improved but below pre-pandemic levels• Lower wage workers earning more

28INVESTMENT STRATEGY BRIEF
• Outlook has brightened – long way from fulfilling dual mandate
• Interest rates likely to stay low for some time• Observed that most central-bank officials see rates staying
near zero through 2023
• Asset purchases: “actual progress, not forecast progress” toward Fed’s goals before slowing down pace• Would taper bond purchases first, raise rates later
• Inflation: will look through temporary inflation due to year-over-year base effects • Price pressures due to reopening as transient • Seeks inflation “that is moderately above 2% for some time”
Macro Environment: Fed
Powell Comments

29INVESTMENT STRATEGY BRIEF
Macro Environment: The Consumer
109.7Conference Board
Consumer Confidence(as of March 31, 2021)
13.6%Savings Rate
(as of February 28, 2021)
The Consumer
Over 44 million*
Jobless Claims
6.0%Unemployment Rate(as of March 31, 2021)
27.7%Retail Sales
(as of March 31, 2021)
Source: Stifel Investment Strategy data via Bloomberg, as of April 16, 2021
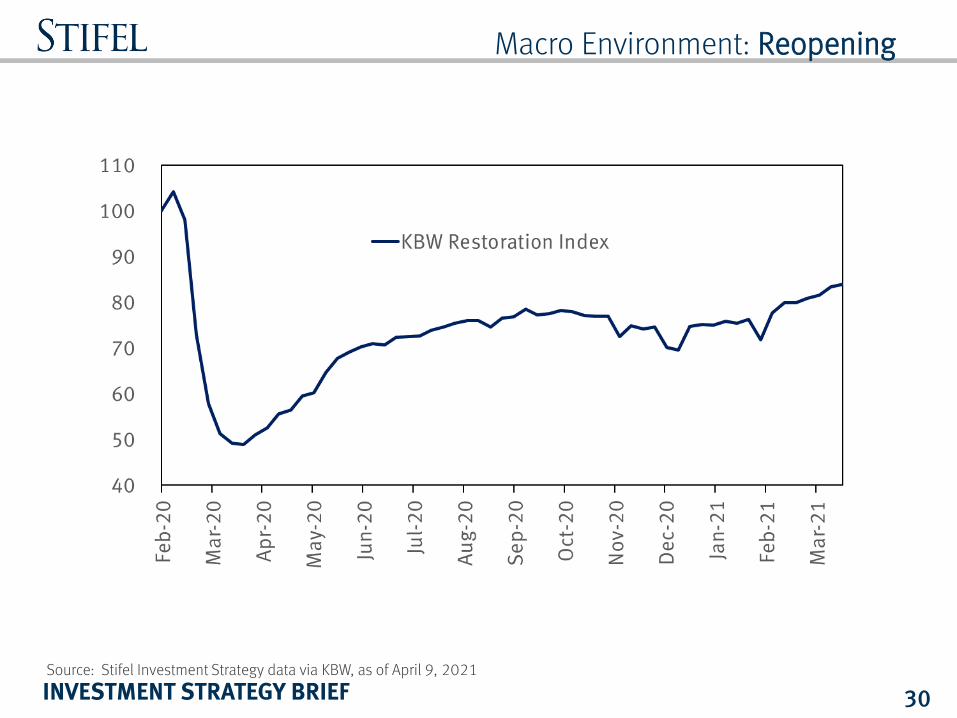
30INVESTMENT STRATEGY BRIEF
Macro Environment: Reopening
Source: Stifel Investment Strategy data via KBW, as of April 9, 2021

31INVESTMENT STRATEGY BRIEF
Macro Environment: GDP Survey
3.1%Hourly Earnings YoY
*Annualized percent change from prior quarter and year-over-year change are shown for quarterly and yearly periods, respectively.**Based on Stifel sell-side Economics department estimates.
Source: Stifel Investment Strategy data via Bloomberg, as of April 16, 2021. Federal Reserve estimates are as of March 17, 2021. Figures in grey areas under “Consensus Estimates” represent reported results.
U.S. GDP Q1 20 Q2 20 Q3 20 Q4 20 Q1 21 Q2 21 Q3 21 Q4 21 2020* 2021* 2022*
Consensus Estimates -5.0 -31.4 33.4 4.3 5.4 8.1 7.0 4.7 -3.5 6.2 4.0
Stifel** -2.6 -28.4 18.0 3.8 7.0 8.2 5.0 4.5 -3.5 6.3 4.2
IHS Markit 3.0 -35.5 33.2 2.9 6.1 8.3 8.1 5.3 -3.6 6.2 4.3
Goldman Sachs -9.0 -33.0 35.0 5.0 7.5 10.5 7.5 6.5 -3.4 7.2 4.9
Pantheon Macro -6.0 -30.0 35.0 6.0 6.0 7.0 14.0 5.0 -3.4 7.0 4.0
Capital Economics -3.5 -30.0 30.0 4.5 7.0 8.5 5.8 3.5 -3.5 6.5 4.0
Strategas 0.0 -33.0 25.0 8.5 10.0 10.0 2.5 4.5 -3.2 6.9 3.3
Julius Baer -4.0 -25.0 29.5 2.0 4.0 9.5 9.3 8.0 -3.7 6.5 4.1
UBS -5.1 -31.7 29.7 4.5 4.0 10.7 8.4 8.7 -3.5 6.6 6.2
Wells Fargo -1.2 -36.8 28.6 4.0 4.8 8.5 9.2 7.2 -3.5 6.4 5.5
Bloomberg Economics 3.0 -37.0 28.0 2.5 6.0 11.0 10.0 4.0 -3.6 7.0 5.1
Barclays -1.5 -31.7 30.0 4.0 3.5 11.5 10.0 6.5 -3.4 6.7 4.0
JPMorgan Chase -10.0 -32.9 34.5 4.8 3.5 9.5 8.3 3.0 -3.4 6.3 4.0
Bank of America ML -7.0 -35.0 33.0 5.0 7.0 10.0 9.0 5.0 -3.5 7.0 5.5
Federal Reserve -2.4 6.5 3.3

32INVESTMENT STRATEGY BRIEF
Risks
Short Term Long TermCoronavirus Debt
Variants Government and Corporate
Herd Immunity Foreign Holders of National Debt
Macro Environment Misallocation of Capital
Money Supply ValuationsInflation “Big-Tech”
Rates Dollar Devaluation
Policy SocialFiscal Stimulus Appetite Inequality
Taxes Climate Change
Regulation Environmental and Health
Fundamentals Economic GrowthValuations Productivity
Earnings Growth Labor Force “Zombie” Companies Policy Intervention
GeopoliticsTrade Tensions
Productive Competition
Technical
Market Breadth
Hedge Fund Leverage

33INVESTMENT STRATEGY BRIEF
Markets

34INVESTMENT STRATEGY BRIEF
Equity Performance
Performance 2020
Source: Stifel Investment Strategy data via Bloomberg, as of April 16, 2021
2021

35INVESTMENT STRATEGY BRIEF
Market Monitor: U.S. Fixed Income
OAS Spread is the measurement of the spread of a fixed-income security rate and the risk-free rate of return, which is adjusted to take into account an embedded option
Rates and Spreads
Source: Stifel Investment Strategy data via Bloomberg, as of April 15, 2021

36INVESTMENT STRATEGY BRIEF
Market Monitor: U.S. Fixed Income
2-10 Spread and Consumer Confidence Measures
Source: Stifel Investment Strategy data via Strategas Research Partners, as of March 31, 2021

37INVESTMENT STRATEGY BRIEF
Market Monitor: Equities
EarningsS&P 500 Earnings
Source: Stifel Investment Strategy via FactSet, as of April 15, 2021; The blended rate combines actual results for companies that have reported and estimated results for companies that have yet to report.*LHS – left hand side, RHS – right hand side.

38INVESTMENT STRATEGY BRIEF
Dynamic Leanings

39INVESTMENT STRATEGY BRIEF
Asset Allocation

40INVESTMENT STRATEGY BRIEF
Allocation Insights

41INVESTMENT STRATEGY BRIEF
Allocation Insights

42INVESTMENT STRATEGY BRIEF
Finding Our Guidance

43INVESTMENT STRATEGY BRIEF
The following summarizes how we deliver our economic and market analysis and corresponding investment guidance, along with some helpful links.
• Each day we broadcast Stifel Investor Insights on iHeartRadio.
• Sight|Lines is a weekly note for clients, along with a video summary and a podcast on Spotify, Apple, Omny, and Google.
• Market Pulse is shared when the S&P 500 Index moves up or down 2%.
• The monthly Investment Strategy Brief video series shares our update on the current economic and market environment. The podcast: Spotify, Apple, Omny, and Google.
• In Conversations Podcast, Stifel’s Chief Investment Officer, Michael O’Keeffe, sits down with leaders at Stifel and in the finance industry to have thought provoking conversations related to the finance industry. Episodes are released monthly.
• The weekly, monthly, and quarterly Market Perspectives provide a recap of the most recent period’s global market results.
• The monthly Favorite 15 shares our favorite 15 slides for the month.
• Stifel’s Allocation Insights provides our dynamic asset allocation leanings quarterly.
• The Stifel 2021 Outlook Report and Video: provide our annual outlook and related articles.
• Stifel's Approach to Asset Allocation summarizes our asset allocation approach and provides a catalogue of various recommended asset mix models.
• The Stifel Financial ID video series provides an overview of our work in behavioral finance and the related Stifel Financial ID model.
Stifel Guidance

44INVESTMENT STRATEGY BRIEF
Past performance is no guarantee of future results.
Index returns include the reinvestment of dividends but do not include adjustments for brokerage, custodian, and advisory fees.
Indices are unmanaged, do not reflect fees and expenses, and are not available for direct investment.
Past performance does not guarantee future results. Investing involves risk, including the possible loss of principal. Asset allocation and diversification do not ensure a profit or protection against loss.
Alternative Investments or Non-Traditional Assets – Alternative investments may include, but are not limited to: Real Estate Investment Trusts (REITs), Commodities, Futures, Hedge Funds, Venture Capital, Limited Partnerships, etc.
Real Estate – When investing in real estate companies, property values can fall due to environmental, economic, or other reasons, and changes in interest rates can negatively impact the performance.
Commodities and Futures – The risk of loss in trading commodities and futures can be substantial. You should therefore carefully consider whether such trading is suitable for you in light of your financial condition. The high degree of leverage that is often obtainable in commodity trading can work against you as well as for you. The use of leverage can lead to large losses as well as gains.
Hedge Funds – Investors should be aware that hedge funds often engage in leverage, short-selling, arbitrage, hedging, derivatives, and other speculative investment practices that may increase investment loss. Hedge funds can be highly illiquid, are not required to provide periodic pricing or valuation information to investors, and often charge high fees that can erode performance. Additionally, they may involve complex tax structures and delays in distributing tax information. While hedge funds may appear similar to mutual funds, they are not necessarily subject to the same regulatory requirements as mutual funds.
Venture Capital – Venture capital investments involve substantial risks. The risks associated with investing in companies in the start-up or expansion stages of development are greater than those of companies in later stages, because the companies’ business concepts generally are unproven and the companies have little or no track record.
Limited Partnerships – Generally, limited partnership investments are suitable only for a narrow class of relatively sophisticated investors. Limited partnership investments may be speculative in nature and be subject to resale restrictions or illiquidity. An investment is appropriate only for investors who have the capacity to absorb a loss of some or all of their investment.
Bonds – When investing in bonds, it is important to note that as interest rates rise, bond prices will fall. High-yield bonds have greater credit risk than higher quality bonds.
Duration – Duration is a measure of the sensitivity of the price -- the value of principal -- of a fixed-income investment to a change in interest rates. Duration is expressed as a number of years.
Standard Deviation – Standard deviation is a measure of the dispersion of a set of data from its mean. It is calculated as the square root of variance by determining the variation between each data point relative to the mean. If the data points are further from the mean, there is higher deviation within the data set.
International and Emerging Markets – There are special considerations associated with international investing, including the risk of currency fluctuations and political and economic events. Investing in emerging markets may involve greater risk and volatility than investing in more developed countries.
Private Equity – Private equity funds are not appropriate for all investors. Investors should be aware that private equity funds may contain speculative investment practices that can lead to a loss of the entire investment. Private equity funds may invest in entities in which no secondary market exists and, as such, may be highly illiquid. The funds are not required to provide periodic pricing or valuation information to investors and often charge high fees that can erode performance. Additionally, they may involve complex tax structures and delays in distributing tax information.
Short Positions – The investor should note that when a short position moves in an unfavorable way, the losses are theoretically unlimited. The broker will demand more collateral and the manager might have to close out that short position at an inopportune time to limit any further losses.
Small Company Securities – Small company securities are typically more volatile and carry additional risks, since smaller companies generally are not as well established as larger companies.
Appendix: Disclosures

45INVESTMENT STRATEGY BRIEF
Bloomberg Barclays U.S. Treasury Bills 1-3 Months Index includes all publicly issued zero-coupon U.S. Treasury Bills that have a remaining maturity of less than three months and more than one month, are rated investment grade, and have $250 million or more of outstanding face value.
Bloomberg Barclays U.S. Corporate IG Index is an unmanaged index considered representative of fixed-rate investment-grade taxable bond debt.
Bloomberg Barclays U.S. Aggregate Corporate Index is an unmanaged index considered representative of fixed-rate investment-grade taxable bond debt.
Bloomberg Barclays U.S. Corporate High Yield is an unmanaged index considered representative of fixed-rate, noninvestment-grade debt.
Bloomberg Barclays U.S. Government Bond Index is an unmanaged index considered representative of fixed-rate, investment-grade US Government debt.
Bloomberg Barclays Global Aggregate This index provides a broad-based measure of the global investment-grade, fixed-rate debt market.
DXY Index is a measure of the value of the U.S. dollar relative to the value of a basket of currencies of the majority of the U.S.'s most significant trading partners.
S&P 500 Index is a capitalization-weighted index of 500 stocks. The index is designed to measure performance of the broad domestic economy through changes in the aggregate market value of 500 stocks representing all major industries.
Russell 1000 Index represents approximately 1,000 of the largest companies in the U.S. equity markets, the Russell 1000 is a subset of the Russell 3000 Index. The Russell 1000 (maintained by the Russell Investment Group) comprises over 90% of the total market capitalization of all listed U.S. stocks and is considered a bellwether index for large cap investing.
Russell 2000 Index measures the performance of the 2,000 smallest companies in the Russell 3000 index.
MSCI EAFE Index captures large and mid cap representation across Developed Markets countries around the world, excluding the U.S. and Canada. With 914 constituents, the index covers approximately 85% of the free float-adjusted market capitalization in each country.
MSCI Emerging Markets (EM) Index captures large and mid cap representation across 23 Emerging Markets (EM) countries. With 837 constituents, the index covers approximately 85% of the free float-adjusted market capitalization in each country.
Morgan Stanley Market implied pace of hikes index (MSPOKE) is the number of Fed rate hikes in the 12 months following the first rate hike implied by the Eurodollar interest rate futures market.
The MSCI World Index is a free float-adjusted market capitalization-weighted index that is designed to measure the equity market performance of developed markets.
Wilshire 5000 Index is a market-capitalization-weighted index of the market value of all stocks actively traded in the United States.
VIX Index shows the market's expectation of 30-day volatility. It is constructed using the implied volatilities of a wide range of S&P 500 index options.
Appendix: Index Descriptions

46INVESTMENT STRATEGY BRIEF
EURO STOXX 50 is a stock index of Eurozone stocks designed by STOXX, an index provider owned by Deutsche Börse Group. According to STOXX, its goal is "to provide a blue-chip representation of Supersector leaders in the Eurozone
Cash & Cash Eq. is represented by the Bloomberg Barclays U.S. Treasury 3-6 months Bill Index, comprised of treasury bills issued by the U.S. government with less than one year to maturity.
U.S. Gov’t Bonds is represented by the Bloomberg Barclays U.S. Government Bond Index, comprised of the U.S. Treasury and U.S. Agency indexes.
U.S. Corp IG Bonds is represented by the Bloomberg Barclays U.S. Corporate Bond Index, comprised of the investment grade, fixed –rate, taxable corporate bond market.
High-Yield Bonds is represented by the Bloomberg Barclays U.S. Corporate High Yield Bond Index, comprised of U.S. Dollar denominated, high-yield, fixed- rate corporate bond market securities.
U.S. LC (Large Cap) equities is represented by Russell 1000 Index, comprised of 1,000 of the largest U.S. securities based on a combination of their market cap and current index membership.
U.S. SC (Small Cap) equities is represented by the Russell 2000 Index, comprised of 2,000 of the smallest U.S. securities based on a combination of their market cap and current index membership.
Dev Int’l Equities is represented by the MSCI EAFE Index, comprised of equity securities that belong to markets outside of the U.S. and Canada.
EM Equities is represented by the MSCI EM Index, comprised of equity securities that belong to emerging markets.
Moderate Bench stands for moderate benchmark portfolio return which is a blended portfolio of stocks (60% weight, represented by MSCI AC World Index) and bonds (40% weight, represented by Bloomberg Barclays U.S. Agg Gov/Credit).
MSCI AC World Index is comprised of equity securities belonging to 23 developed markets and 24 emerging markets countries.
Bloomberg Barclays U.S. Government/Credit Bond Index is comprised investment grade, dollar-denominated, fixed-rate Treasuries, government-related and corporate securities.
Stifel, Nicolaus & Company, Incorporated │Member SIPC & NYSE │www.stifel.com3 Bryant Park │1095 Avenue of the Americas │ New York, New York 10036 0421.3556008.1
Appendix: Index Descriptions