managing the total workforce · 2020-01-30 · 2 workforce diversity is a hot topic for many...
TRANSCRIPT

October 2018 Zachary Chertok Research Analyst, Human Capital Management
KB
MANAGING THE TOTAL WORKFORCE

2
Workforce diversity is a hot topic for many organizations. While most HR departments think of it in traditional terms, the reality is that workforce diversity has more dimensions today than ever before. These dimensions raise a critical question: How do we effectively manage the workforce for desired goals amidst such escalating diversity?
Dimensions of Workforce Diversity
Workforce diversity extends beyond traditional categories of race, gender, ethnicity, and age to include position type, departmental classification, experience levels, educational levels, and other minor demographics.
Figure 1: Top Diversity Types Assessed Across the Employee Lifecycle
Figure 1 shows the top considerations employers have when evaluating employees, from hiring to succession planning. When employers think about diversity and inclusion, the top categories still favor the traditionally defined categories based on employee characteristics. These include elements such as age, gender, race / ethnicity, and experience. In the context of workforce definitions, however, diversity has a new dimension now that employers face the prospect of up to six generations working for them at any given time in several key labor markets. These position-diversity factors demand attention be paid to the position classification itself, including incoming employee experience, average exhibited tenure, and educational level relevant to the requisition. While these latter considerations may seem like job criteria, the reality is that as the former classifications grow in scale, the latter ones grow in significance for measuring how the workforce is distributed inside the organization.
Something to keep in mind is that by 2014, the US Bureau of Labor Statistics (BLS) found that workforce participation for people aged 55 years and older was at 40%. For the first time in history, major portions of the global
50%
37%
23%
7%
18%12%
1%6% 6%
45%
30%
19% 21%14% 16% 14%
10%5%
Position classification
Experience Average tenure Gender Educational level
Departmental allocation
Employee age Race/ ethnicity Other demographics
Best-in-Class All Others N = 508 Source: Abereen, April 2017
Lesser acknowledged considerations for diversity are the top categories that employers consider.
The Aberdeen maturity class framework is comprised of three groups of survey respondents. This data is used to determine overall company performance. Classified by their self-reported performance across several key metrics, each respondent falls into one of three categories: ► Best-in-Class: Top 20% of respondents based on performance ► Industry Average: Middle 50% of respondents based on performance ► Laggard: Bottom 30% of respondents based on performance Sometimes we refer to a fourth category, All Others, which is Industry Average and Laggard combined.

3
workforce, including in the United States, contain six generations of workers. As generational diversity ticks up for economic reasons, employers are being forced to shift gears to handle new risks that are changing the way jobs are classified. There may be a lot of news about how millennials prefer the gig economy, but the reality is that the gig economy and contingent or contracted work originates with employers that are unsure or unwilling to take chances on unproven work quality.
Figure 2: Hiring Trajectory 2006-2015
Figure 2 shows the hiring trajectory from 2006 to 2015. Following the financial crisis in 2008-09, full-time hiring dropped off and contingent hiring rose by almost the same percentage as the full-time drop. The shift is reflective of tightening budgets as companies scaled back operations and reduced bloat. By 2015, the gap between the two hiring types had stabilized, with full-time and comparable hiring still making up the largest segment of the workforce. What changed was that the gap between the two hiring types shrank significantly and did not return to pre-financial crisis values.
The rise of alternative classes of employment into the mainstream presents many problems for employers. For example, Aberdeen has found that more than 40% of companies struggle to reconcile the reasons that employees of various classifications join and stay with the company. These companies separately analyze the different classifications primarily because contingent hiring (whether part-time, full-time, contracted, or temp hiring) is handled by procurement for 34% of companies. Furthermore, more than 35% of contingent positions are back-filled by baby boomers who need to stay in the workforce at least part time. The remainder are filled by younger generations who have no other means to enter the workforce, and who, by extension, receive little incentive to stay with the company because they are at-will.
2006 2007 2008 2009 2010 2011 2012 2013 2014 2015
Empl
oym
ent C
ount
(Agg
rega
ted
BLS,
AS
A, D
OL,
UN
ILO
, USG
AO D
ata)
Year
Other Hiring Contingent Hiring Total Hiring
More than 40% of companies struggle to reconcile the reasons that employees of various classifications join and stay with the company.

4
Strategizing for Managing One Workforce
If the workforce is this multi-dimensional, can it be managed along a singular strategy with one set of internal resources?
The answer may be surprising in that one or the other can be done, but not both. Aberdeen has found that companies either develop two technological infrastructures to manage all employees along the same strategy, or they develop two converging strategies that utilize the same internal resources for labor metrics and management.
Figure 3: Reasons Full-Time Employees Join and Stay with the Company
Figure 3 shows the reasons that full-time employees join and stay with the organization. The top reasons are centered on an employee’s ability to develop a career inside the organization through work that is relevant to the company and through training objectives that match career development to the goals of the organization.
Figure 4: Reasons All Other Employee Types Join and Stay with the Company
By comparison, Figure 4 shows the reasons that all other employee types join and stay with the company. While these reasons also hinge on job growth, they are more short-term focused around the employee’s ability to become a full-time worker and on strong workplace relationships with managers and colleagues.
80% 78% 76% 74% 71% 69% 69%65% 65% 65%
55%61%
68%
51%
Strong alignmentbetween career goals
and managementobjectives
Visible career tracks Mission and visionresonate with career
goals
Training anddevelopmentopportunities
Innovation strategy Comprehensive benefits Work is relevant to theorganization
Best-in-Class All Others N = 274 Source: Abereen, June 2017
50%46%
43%40% 39%
32%29%
33% 34%
28%
22%
35%
27%
19%
Strong (weak) managerrelationships
Potential (no potential)for the job to become
full-time
Strong (weak) co-workerrelationships
Work is (is not) highlyengaging
Pay is (is not)competitive
Benefits are (are not)extended to contingent
employees
Contract runs for a short(long) period
Best-in-Class All Others N = 150 Source: Abereen, October 2017
If the workforce is this multi-dimensional, can it be managed along a singular strategy with one set of internal resources?
5
Figures 3 and 4 represent two very different paradigms in that, while employees of any classification generally have the same goals for joining the organization, they carry them out in different time frames with respect to the type of employment they accept.
When it comes to functionality for managing these two goal sets on different time scales, employers must strategize for engagement, but utilize different resources tracks.
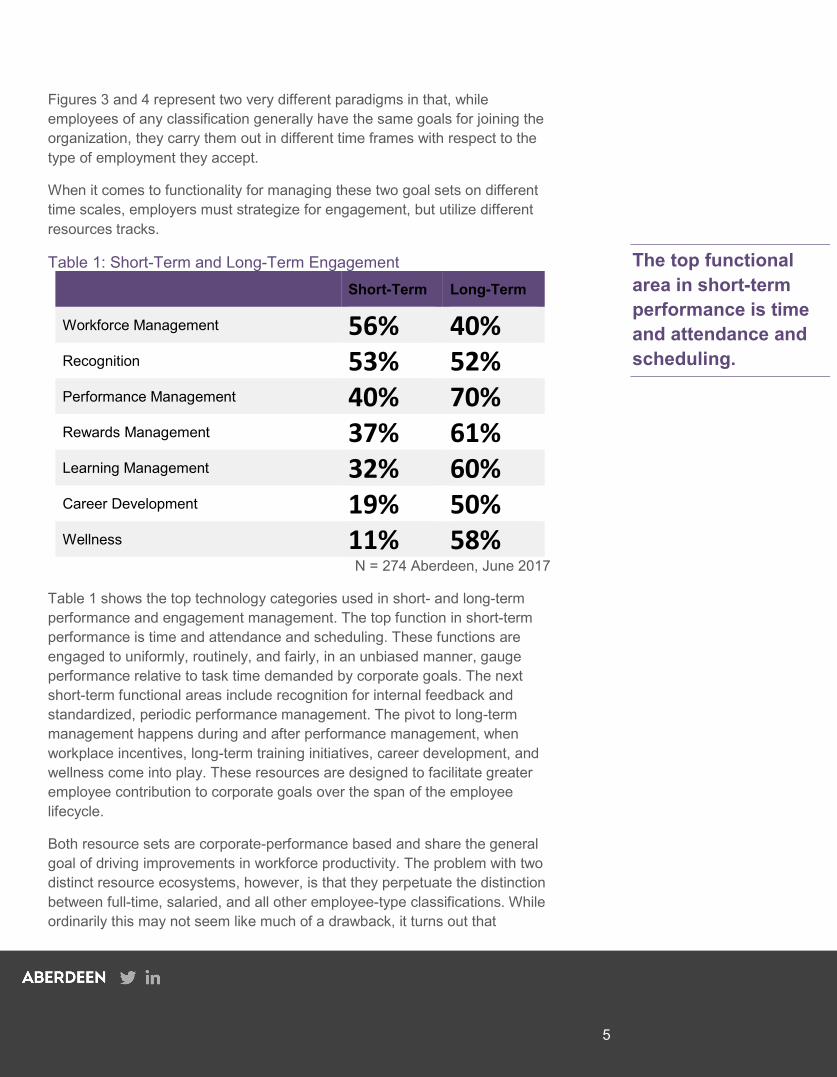
Table 1: Short-Term and Long-Term Engagement Short-Term Long-Term
Workforce Management 56% 40% Recognition 53% 52% Performance Management 40% 70% Rewards Management 37% 61% Learning Management 32% 60% Career Development 19% 50% Wellness 11% 58%
N = 274 Aberdeen, June 2017
Table 1 shows the top technology categories used in short- and long-term performance and engagement management. The top function in short-term performance is time and attendance and scheduling. These functions are engaged to uniformly, routinely, and fairly, in an unbiased manner, gauge performance relative to task time demanded by corporate goals. The next short-term functional areas include recognition for internal feedback and standardized, periodic performance management. The pivot to long-term management happens during and after performance management, when workplace incentives, long-term training initiatives, career development, and wellness come into play. These resources are designed to facilitate greater employee contribution to corporate goals over the span of the employee lifecycle.
Both resource sets are corporate-performance based and share the general goal of driving improvements in workforce productivity. The problem with two distinct resource ecosystems, however, is that they perpetuate the distinction between full-time, salaried, and all other employee-type classifications. While ordinarily this may not seem like much of a drawback, it turns out that
The top functional area in short-term performance is time and attendance and scheduling.
6
employment-type classification is a diversity characteristic; for more than 55% of companies, non-full-time, salaried employees are not treated the same as their full-time, salaried counterparts, often failing to build as strong workplace relationships or failing to get the full advantage of the resources that accompany employment with the organization.
To drive the best results from the combined workforce, Best-in-Class companies are turning to solutions that offer the same resource ecosystem to short- and long-term employees. In the first place, Best-in-Class companies are 6.4x more likely than All Others (32% vs. 5%) to implement a vendor management system (VMS) to handle all their contingent and alternative staff management needs. These needs extend to matching short- and medium-term hiring to internal contract needs, to reviewing time management and running analytics for short-term performance optimization.
The Best-in-Class are also 3.1x more likely than All Others (64% vs. 21%) to link data from talent acquisition to early performance management, and to extend early performance management into learning and development for the entire workforce — not just full-time, salaried employees. Furthermore, while Best-in-Class companies still reserve wellness and well-being resources for long-term employment, they are 29% more likely than All Others (72% vs. 56%) to extend the rewards management ecosystem to the entire workforce to stimulate performance on a goal-by-goal basis.
The Bottom Line
As Best-in-Class companies move to build one strategy for labor management facilitated by two converged technological infrastructures, these industry leaders are realizing several key benefits:
Best-in-Class companies are 5.7x more likely than All Others (86% vs. 15%) to be able to fill more than 50% of the contingent job openings they have.
For short-term hires, the Best-in-Class are 6.6x more likely than All Others (93% vs. 14%) to be able to fill positions more than 50% of the time.
Best-in-Class are 2.6x more likely than All Others (26% vs. 10%) to find that more than 50% of contingent hires have qualified to move into full-time positions.
Best-in-Class are 2.5x more likely than All Others (20% vs. 8%) to find that more than 50% of their contingent workforce has qualified for performance-based raises in line with the full-time workforce.
Best-in-Class companies are 6.4x more likely than All Others to implement a vendor management system (VMS).

7
Best-in-Class companies are 2.7x more likely than All Others (24% vs. 9%) to find that contingent tenure exceeds three years.
20% of the Best-in-Class have found that voluntary employee turnover has dropped, while 82% find that employee tenure exceeds seven years.
About Aberdeen Group
Since 1988, Aberdeen Group has published research that helps businesses worldwide to improve their performance. Our analysts derive fact-based, vendor-neutral insights from a proprietary analytical framework, which identifies Best-in-Class organizations from primary research conducted with industry practitioners. The resulting research content is used by hundreds of thousands of business professionals to drive smarter decision-making and improve business strategies. Aberdeen Group is headquartered in Waltham, Massachusetts, USA.
This document is the result of primary research performed by Aberdeen Group and represents the best analysis available at the time of publication. Unless otherwise noted, the entire contents of this publication are copyrighted by Aberdeen Group and may not be reproduced, distributed, archived, or transmitted in any form or by any means without prior written consent by Aberdeen Group.
17732