managing the physical evidence in insurance industryeuacademic.org/uploadarticle/676.pdf4234 issn...
TRANSCRIPT

4234
ISSN 2286-4822
www.euacademic.org
EUROPEAN ACADEMIC RESEARCH
Vol. II, Issue 3/ June 2014
Impact Factor: 3.1 (UIF)
DRJI Value: 5.9 (B+)
Managing the Physical Evidence in Insurance
Industry
ILEYAS RIZVI Professor and Director (Training & MBA)
R.R. Institute of Modern Technology, Lucknow
Director, Times Institute of Management & Research, Lucknow
India
MAMTA BAJPAI Research Scholar
G.B. Technical University
India
PRIYAKA ANJOR Assistant Professor
Department of Business Administration
I.E.T., Lucknow
India
VARUN KUMAR KASHYAP Research Scholar
Department of Statistics
University of Lucknow
India
Abstract:
As insurance services are intangible, inseparable, variable,
non-standardised products; these characteristics make it difficult for
the insurance service provider to persuade coustomers. In view of this,
insurance service products often need to be tangibilised through the
physical evidence that accompanies the service. Physical evidence
includes aspects such as the service provider’s facilities, staff
appearance, ambience, atmospherics etc. In addition, promotional
materials and branding strategies are all elements of physical evidence
that serve to tangibilise a service offering to a customer. These physical
evidence cues help a potential customer to evaluate service quality.
Ileyas Rizvi, Mamta Bajpai, Priyaka Anjor, Varun Kumar Kashyap- Influence of
Service Quality on Attitudinal Loyalty in Insurance Industry
EUROPEAN ACADEMIC RESEARCH - Vol. II, Issue 3 / June 2014
4235
physical evidence create first impression necessary for
attracting and persuading prospects to become consumers, but it
should be in confirmation to the assumptions of consumers. According
to PZB (1988) ‘physical evidence can be seen as the functional form
that acts as the interface between service provider and consumers.’
This research study focuses on identifying the independent variables of
physical evidence and their role in service quality as well as in
satisfying consumers of insurance services. This study also endeavours
to explain the positive & significant relationship between the physical
evidence and consumers’ overall satisfaction. As the study is
comparative in nature, it measures the discrepancy gap between
consumers’ perception about the factors of physical evidence of LIC
and Bajaj- Allianz respectively.
Key words: Service, Physical Evidence, Consumer Satisfaction,
Service Quality.
1. Introduction
1.1. Intangibility & Physical Evidence: The intangibility of
service products makes it difficult for the marketer to position
new service product offerings. In view of this, marketers often
need to “tangibilize‟ the service offering through the way they
manage the physical evidence that accompanies the service.
Physical evidence includes aspects such as the service
provider’s building/facilities and staff appearance; other aspects
are personal hygiene and uniforms. In addition, promotional
materials and branding strategies are all elements of physical
evidence that serve to tangibilize a service offering to a
customer. These physical evidence cues are what potential
customers use to evaluate accurately or inaccurately things like
service quality.
1.2. Physical Evidence in Service:
As the services are intangible in nature, it becomes difficult for
consumers to evaluate quality of service and value for money,

Ileyas Rizvi, Mamta Bajpai, Priyaka Anjor, Varun Kumar Kashyap- Influence of
Service Quality on Attitudinal Loyalty in Insurance Industry
EUROPEAN ACADEMIC RESEARCH - Vol. II, Issue 3 / June 2014
4236
prior to purchase, hence, customers are left with no options but
to judge the quality of service through physical evidence, it
becomes crucial for attracting the service customer. The service
provider have to make efforts to tangiblise with services
offerings carefully.
The service setting often creates the all-important first
impressions and helps set the tone for the entire service
experience. The interior and exterior physical environment
presents an image to the customer and helps them form an
impression of the organisation and its service offering (Fisk,
Grove and John, 2000).
In services marketing tools like product packaging is not
possible, only physical entities can be employed to describe the
characteristics of service product and its distinguishing
qualities. Managing the physical evidence in the best possible
manner is the only option to attract and impress customers for
the service provider. The marketing potential of physical
evidence is still not fully appreciated by service marketers. The
environment of the service provider’s office, or service facilities
environment, uniform of the employees, brochure or any other
published material containing information about the services,
advertising etc, are tangibles that reflect the reflect and
reinforce the image of the organisation.
In the most basic sense, service consists of the people,
the processes, and the physical evidence of the experience (Titz,
2001). Service encounters include both tangible and intangible
attributes. Designed objects in the service environment are
sometimes referred to as “service evidence” because they are
physical proof of service that has taken place. They are
important components of the servicescapes and undoubtedly a
critical part of service design.
1.3 Role of Physical evidence in insurance industry:
physical evidence may be either Dominate or peripheral, but in
case of insurance service provider, it is a great challenge to

Ileyas Rizvi, Mamta Bajpai, Priyaka Anjor, Varun Kumar Kashyap- Influence of
Service Quality on Attitudinal Loyalty in Insurance Industry
EUROPEAN ACADEMIC RESEARCH - Vol. II, Issue 3 / June 2014
4237
manage the tangible aspect of service quality. Selling insurance
involves least use of physical evidence unlike other insurance
services which are dominated by tangibles like railways,
aviation industry etc.
Even then, a well equip and well organized offices of the
insurance companies reflects the quality of service offered by
them. These tangibles help customers to form an image of the
services and also help them to form expectations. Once
expectations regarding the service quality are formed,
customers are now on the verge of becoming consumers.
Sometimes physical evidence may also compel customers to
form higher and unrealistic expectations. For this companies
must be ready to manage the customer expectations with the
promise based management and most effective and efficient
service delivery process. Rizvi, I. (2013)
2. Literature Review
2.1. Service Environment
The service environment is the place or surrounding in which
services are delivered or performed and it influences the
perception of the customers with indirect silent messages.
‘Physical evidence demonstrated by an organization
must confirm the assumptions of consumers. A financial service
product will need to be delivered in a formal setting while for a
children’s birthday party, a company should adopt a more
relaxed approach.’ (the chartered institute of marketing, 2009).
For example, the interior design of an office should show
prosperity, modernity and reflect efficiency and reliability. As
the environment has tremendous potential to communicate
about the nature and quality of service being provided the
service environment should be designed carefully. (Manjeet,
2012)
A number of researchers have investigated the
multidimensional structure of the service intangibility

Ileyas Rizvi, Mamta Bajpai, Priyaka Anjor, Varun Kumar Kashyap- Influence of
Service Quality on Attitudinal Loyalty in Insurance Industry
EUROPEAN ACADEMIC RESEARCH - Vol. II, Issue 3 / June 2014
4238
construct. For example, McDougall and Snetsinger (1990)
propose that tangibility has both a physical and mental
component. Many services lack a physical component for
consumers to evaluate. Therefore, consumers cannot easily
examine or evaluate the service during the pre-purchase stages
of consumption. Furthermore, mental intangibility describes
the inability of consumers to develop a clear, mentally tangible
representation of the service, especially if the consumer lacks
prior experience with the service (Laroche, Bergeron and
Goutaland, 2003).
In addition, services are characterised by higher levels of
experience and credence attributes and low levels of search
attributes. Search attributes are normally associated with
physical products and include those attributes or qualities of a
product that consumers are able to assess prior to purchase.
For example, consumers are able to assess clothing based on
search attributes such as colour, style, feel, price and fit. On the
other hand, customers can only discern experience attributes
after purchase and consumption of the service, as in the case of
insurance or other financial services. Hence, consumers cannot
assess experience attributes until the service is consumed.
Finally, some services are high in credence attributes, where
consumers find it impossible to confidently judge the service
offering, even after purchase and consumption, as in a medical
procedure or automobile service (Mitra, Reiss and Capella,
1999; Zeithaml, 1981). Zeithaml (1981) concludes that the
unique characteristics of services (intangibility, heterogeneity
and inseparability) all contribute to higher levels of experience
and credence attributes and low levels of search attributes
associated with many service products. Further, there is a high
degree of uncertainty for consumers when purchasing services,
where they are faced with choosing among alternatives that
vary in quality and when the quality is difficult for the
consumer to evaluate (Guseman, 1981). According to Mager,
“Service design addresses the functionality and form of services
Ileyas Rizvi, Mamta Bajpai, Priyaka Anjor, Varun Kumar Kashyap- Influence of
Service Quality on Attitudinal Loyalty in Insurance Industry
EUROPEAN ACADEMIC RESEARCH - Vol. II, Issue 3 / June 2014
4239
from the perspective of clients. It aims to ensure that service
interfaces are useful, usable, and desirable from the client’s
point of view and effective, efficient, and distinctive from the
supplier’s point of view” (Mager, 2007, p.355).
2.2. Service evidence:
Service evidence can be seen as the functional form that acts as
the interface between service provider and consumers. The
importance of service evidence is further supported by the fact
that the well-established SERVQUAL model and measurement
tool of service quality devised by Parasuraman, Zeithaml and
Berry (1988) included service tangibles as one of the five
dimensions for measuring service performance (Parasuraman,
Zeithaml, & Berry, 1994; Oliver, 1996). Other dimensions are
reliability, responsiveness, assurance and empathy. In the
widely used technique of blueprinting for service design
(Shostack, 1982, 1984, 1987, 1992; Bitner, Ostrom, & Morgan,
2007), service evidence is the tangible manifestation of service
that appears above the “line of visibility” in a service blueprint.
2.3. The physical complexity of service evidence:
The physical complexity of service evidence and servicescapes
varies in different types of service. As shown in the typology of
servicescapes (Bitner, 1992), they are designed to be more
elaborate for interpersonal service (such as restaurants, hotels,
hospitals) when compared to self-service (such as kiosks and
automatic teller machines). Berry and Bendapudi (2003) used
the term “evidence management” to emphasize the importance
of offering appropriate tangible cues in servicescapes because
customers look for evidence of desirable service qualities by
processing what they can see and understand. In the words of
Berry and Bendapudi, the key to effective evidence
management is to “clearly identify a simple, consistent
message, and then manage the evidence – the buildings, the
approach to care, even the shoelaces – to support that message,

Ileyas Rizvi, Mamta Bajpai, Priyaka Anjor, Varun Kumar Kashyap- Influence of
Service Quality on Attitudinal Loyalty in Insurance Industry
EUROPEAN ACADEMIC RESEARCH - Vol. II, Issue 3 / June 2014
4240
day in and day out” (Berry & Bendapudi, 2003, p.106). The
scholarly works mentioned above demonstrate the important
role of service evidence in service experiences.
2.4. Servicescape
Servicescape also influences the perception of quality associated
with the service. Consumer often evaluate service quality based
on the physical evidence of a service firm, particularly if they
are inexperienced with the service process or the service
outcomes. The physical tangible clues can make an intangible
service appear more tangible and the tangible elements may
then act as surrogate indicators of quality. Consumers often
evaluate the tangibles, in conjunction with other dimensions to
establish an overall quality perception of the service
organisation. For many services, the social and physical
environment creates favourable or unfavourable impressions
(Belk, 1975) and can be the only cues used by consumer to
evaluate the quality of the service.
Bitner (1992; 2000) likens the servicescape to the
packaging element of tangible products, in that the physical
environment ‘wraps’ the service and conveys an image to the
consumer. Servicescape is described as a ‘visual metaphor’ for
intangible services, critical in forming initial impressions
through the outward appearance of the service organisation. As
service marketers distribute the service they actually produce,
Berry (1980) suggests that service firms have an opportunity to
shape the environment to their specifications. Hence, the
physical elements of the service environment provide marketers
with an opportunity to ‘tell the “right” story’ about the service
offering. When discussing the abstract and intangible nature of
services, Shostack (1977) noted that consumers rely on
peripheral cues where the service ‘realities’ are shaped by the
tangible aspects that can be comprehended with the five senses.
For instance, when a consumer is assessing a service prior to
purchase, s/he does so based on the available tangible cues, or
Ileyas Rizvi, Mamta Bajpai, Priyaka Anjor, Varun Kumar Kashyap- Influence of
Service Quality on Attitudinal Loyalty in Insurance Industry
EUROPEAN ACADEMIC RESEARCH - Vol. II, Issue 3 / June 2014
4241
tangible evidence that surrounds the service. Likewise, Fisk,
Grove and John (2000) state that the physical environment of a
service is often the most important tangible aspect of a service
offering and service firms should strive to ensure that every
aspect of it makes the desired impression on consumers.
3. Research Methodology
3.1 Research design
This chapter defines the research design, hypothesis
development, research objectives, population samples, data
collection procedures and the techniques of data analysis for
examining the factors that affect customer satisfaction and
loyalty with insurance services in insurance industry in India.
This research is exploratory in nature. A survey was designed
to measure the perceptions of consumers for the factors
physical evidence in LIC and Bajaj-Allianz with the help of the
questionnaires and schedules using five point LIKERT scale
having strongly agree-1, agree-2, neutral-3, disagree-4, and
strongly disagree-5.
To collect information / data for the research purpose we
have used quota sampling. The target population, to which
we would like to draw inferences, comprises the consumers of
LIC (government sector) & Bajaj-Allianz (private sector) in
Lucknow, the capital of UP in India, which can be said as
the universe of the study. We know that the population is
heterogeneous in nature which is an advantage for the
sampling, as it reduces the biasness of the data. This research
study is comparative in nature, so the data of consumers from
both the government and private companies have been used.
The survey was conducted of the consumers to collect the data.
The total Sample size was of 300 consumers out of which 150
consumers were of government sector (LIC) and 150 consumers
were of private sector (Bajaj-Allianz). For the analysis of the
data, IBM SPSS STATISTICS 20 version software has been

Ileyas Rizvi, Mamta Bajpai, Priyaka Anjor, Varun Kumar Kashyap- Influence of
Service Quality on Attitudinal Loyalty in Insurance Industry
EUROPEAN ACADEMIC RESEARCH - Vol. II, Issue 3 / June 2014
4242
used to perform chi square analysis, factor analysis, correlation,
and regression analysis.
3.2 Theoretical framework:
This research is an effort to know the perception of consumers
for physical evidence of the LIC and Bajaj-Allianz. The
proposed model of the study is mentioned above.
This study aimed to examine the factors of physical evidence
that affect consumer’ overall satisfaction of insurance service
providers. For the ease of the readers, all the variables of
physical evidence are coded, which are used further in the
study are given below-
PHYSICAL EVIDENCE’S VARIABLES CODE
Brochure of the company contains all the required information V1
Brochure of the company is informative and self explanatory V2
Employees are well dressed and appear neat V3
Office is well organized V4
Office is visually appealing V5
I feel extremely comfortable in the office V6
Atmosphere is very good V7
Proper information about the name, designation, department, contact no of
the top management officials is displayed at the entrance V8

Ileyas Rizvi, Mamta Bajpai, Priyaka Anjor, Varun Kumar Kashyap- Influence of
Service Quality on Attitudinal Loyalty in Insurance Industry
EUROPEAN ACADEMIC RESEARCH - Vol. II, Issue 3 / June 2014
4243
3.3. Research Hypotheses & Objectives
Following research hypotheses & research objectives are
developed to address the research problem.
3.3.1. Research Objectives
Following research objectives are developed to address the
research problem.
Objective-1: To investigate the important variables of physical
evidence in LIC and Bajaj –Allianz.
Objective-2: To investigate the relationship between physical
evidence and customer overall satisfaction in LIC.
Objective-3: To investigate the relationship between physical
evidence and customer overall satisfaction in Bajaj-Allianz.
Objective-4: To assess the discrepancy gap between consumers’
perception about the factors of physical evidence of LIC and
Baja- Allianz respectively.
3.3.2. Hypothesis Development
In this study, the hypotheses have been selected based on the
literature review mentioned above to describe the relationship
between variables of physical evidence that influence customer
overall satisfaction.
Alternate Hypothesis 1-(H1): There are some variables that
play an important role in managing physical evidence in LIC
and Baja –Allianz.
Alternate Hypothesis-2 (H1): There is a positive/significant
relationship between the physical evidence and customer overall
satisfaction in LIC.
Alternate Hypothesis-3 (H1): There is a positive/significant
relationship between the physical evidence and customer overall
satisfaction in Bajaj-Allianz.
Alternate Hypothesis 4-(H1): There is a discrepancy gap
between consumers’ perception about the factors of physical
evidence of LIC and Bajaj-Allianz respectively.
Ileyas Rizvi, Mamta Bajpai, Priyaka Anjor, Varun Kumar Kashyap- Influence of
Service Quality on Attitudinal Loyalty in Insurance Industry
EUROPEAN ACADEMIC RESEARCH - Vol. II, Issue 3 / June 2014
4244
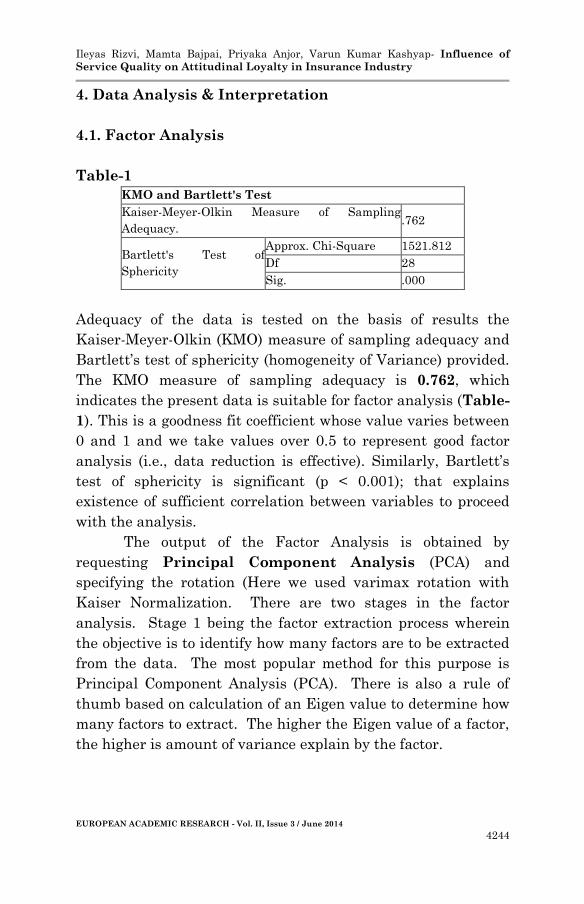
4. Data Analysis & Interpretation
4.1. Factor Analysis
Table-1
KMO and Bartlett's Test
Kaiser-Meyer-Olkin Measure of Sampling
Adequacy. .762
Bartlett's Test of
Sphericity
Approx. Chi-Square 1521.812
Df 28
Sig. .000
Adequacy of the data is tested on the basis of results the
Kaiser-Meyer-Olkin (KMO) measure of sampling adequacy and
Bartlett’s test of sphericity (homogeneity of Variance) provided.
The KMO measure of sampling adequacy is 0.762, which
indicates the present data is suitable for factor analysis (Table-
1). This is a goodness fit coefficient whose value varies between
0 and 1 and we take values over 0.5 to represent good factor
analysis (i.e., data reduction is effective). Similarly, Bartlett’s
test of sphericity is significant (p < 0.001); that explains
existence of sufficient correlation between variables to proceed
with the analysis.
The output of the Factor Analysis is obtained by
requesting Principal Component Analysis (PCA) and
specifying the rotation (Here we used varimax rotation with
Kaiser Normalization. There are two stages in the factor
analysis. Stage 1 being the factor extraction process wherein
the objective is to identify how many factors are to be extracted
from the data. The most popular method for this purpose is
Principal Component Analysis (PCA). There is also a rule of
thumb based on calculation of an Eigen value to determine how
many factors to extract. The higher the Eigen value of a factor,
the higher is amount of variance explain by the factor.

Ileyas Rizvi, Mamta Bajpai, Priyaka Anjor, Varun Kumar Kashyap- Influence of
Service Quality on Attitudinal Loyalty in Insurance Industry
EUROPEAN ACADEMIC RESEARCH - Vol. II, Issue 3 / June 2014
4245
Table-2
Total Variance Explained
Component Initial Eigenvalues Extraction Sums of
Squared Loadings
Rotation Sums of Squared
Loadings
Total % of
Variance
Cumulative
%
Total % of
Variance
Cumulative
%
Total % of
Variance
Cumulative
%
1 3.550 44.373 44.373 3.550 44.373 44.373 3.431 42.886 42.886
2 2.120 26.498 70.872 2.120 26.498 70.872 2.239 27.985 70.872
3 .827 10.332 81.204
4 .575 7.192 88.396
5 .393 4.915 93.310
6 .301 3.758 97.069
7 .124 1.544 98.613
8 .111 1.387 100.000
Extraction Method: Principal Component Analysis.
This Output lists the eigen values associated with each linear
component (factor) before extraction, after extraction and after
rotation. Before extraction, Output has identified 08 linear
components within the data set (we know that there should be
as many eigenvectors as there are variables and so there will be
as many factors as variables). The Eigen values associated with
each factor represent the variance explained by that particular
linear component and output also displays the Eigen value in
terms of the percentage of variance explained. Before rotation,
some factors accounted for considerably more variance, and
some factors accounted for considerably less variance. It should
be clear that the first few factors explain relatively large
amounts of variance (especially factor 1) whereas subsequent
factors explain only small amounts of variance. Then all
factors with Eigen values greater than 1 are extracted,
which leaves us with two factors. According to Kaiser
Criterion, only first 2 factors should be used because
subsequent eigen values are less than 1.
The Eigen values associated with these factors are again
displayed (and the explained) in the columns labeled
‘Extraction Sums of Squared Loadings’. The values in this part
of the table are the same as the values before extraction, except
that the values for the discarded factors are ignored (hence, the

Ileyas Rizvi, Mamta Bajpai, Priyaka Anjor, Varun Kumar Kashyap- Influence of
Service Quality on Attitudinal Loyalty in Insurance Industry
EUROPEAN ACADEMIC RESEARCH - Vol. II, Issue 3 / June 2014
4246
table is blank after the 2 factors). In the final part of the table-
2 (labeled Rotation Sums of Squared Loadings), the Eigen
values of the factors after rotation are displayed. Rotation has
the effect of optimizing the factor structure and one
consequence for this data is that the relative importance of the
2 factors is equalized. But after extraction and rotation, the
two factors explain the following percentage of total variance.
So, factor 1 explains 42.886% of total variance & factor 2
explains 27.985% of total variance.
As evident from the Table-2 (Total Variations
Explained) we find out that from the total 08 components (play
role in physical evidence), two factors are extracted and these
02 factors together account for only 70.872% of the total
variance (Information contained in original 08 variables) hence
we have reduced the number of variable from 08 to 02
underlying factors. But thereby sacrificing around 29.128% of
the total variation. That is high percentage of total variance
(Information is sacrificed).
Table-3
Cartell’s Scree test involves plotting each of the eigenvalues
of the factors and inspecting the plot to find a point at which
the shape of the curve changes direction and becomes
horizontal. This test recommends retaining all factors above the
elbow or break in the plot as these factors contribute the most
Ileyas Rizvi, Mamta Bajpai, Priyaka Anjor, Varun Kumar Kashyap- Influence of
Service Quality on Attitudinal Loyalty in Insurance Industry
EUROPEAN ACADEMIC RESEARCH - Vol. II, Issue 3 / June 2014
4247
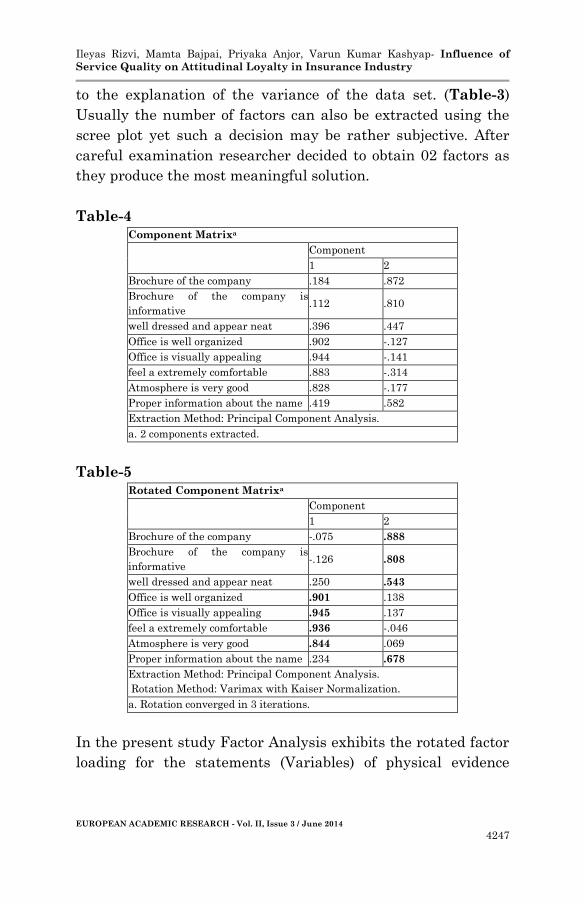
to the explanation of the variance of the data set. (Table-3)
Usually the number of factors can also be extracted using the
scree plot yet such a decision may be rather subjective. After
careful examination researcher decided to obtain 02 factors as
they produce the most meaningful solution.
Table-4
Component Matrixa
Component
1 2
Brochure of the company .184 .872
Brochure of the company is
informative .112 .810
well dressed and appear neat .396 .447
Office is well organized .902 -.127
Office is visually appealing .944 -.141
feel a extremely comfortable .883 -.314
Atmosphere is very good .828 -.177
Proper information about the name .419 .582
Extraction Method: Principal Component Analysis.
a. 2 components extracted.
Table-5
Rotated Component Matrixa
Component
1 2
Brochure of the company -.075 .888
Brochure of the company is
informative -.126 .808
well dressed and appear neat .250 .543
Office is well organized .901 .138
Office is visually appealing .945 .137
feel a extremely comfortable .936 -.046
Atmosphere is very good .844 .069
Proper information about the name .234 .678
Extraction Method: Principal Component Analysis.
Rotation Method: Varimax with Kaiser Normalization.
a. Rotation converged in 3 iterations.
In the present study Factor Analysis exhibits the rotated factor
loading for the statements (Variables) of physical evidence

Ileyas Rizvi, Mamta Bajpai, Priyaka Anjor, Varun Kumar Kashyap- Influence of
Service Quality on Attitudinal Loyalty in Insurance Industry
EUROPEAN ACADEMIC RESEARCH - Vol. II, Issue 3 / June 2014
4248
aspect of service Quality rendered by LIC and Bajaj-Allianz in
Lucknow, U.P., India.
Looking at Rotated Component Matrix (Table-5), we
find out that Factor/Component 1 contains- Office is well
organized (V4), Office is visually appealing (V5), I feel a
extremely comfortable in the office (V6) and Atmosphere is very
good (V7) variables.
While the factor 2 contains- Brochure of the company
contains all the required information (V1), Brochure of the
company is informative and self explanatory(V2), Employees
are well dressed and appear neat (V3) and Proper information
about the name, designation, department, contact no of the top
management officials is displayed at the entrance (V8). So, we
can say that our alternate hypothesis-1 is accepted and our
research objective-1 is fulfilled.
4.2. CORRELATIONS
Table-6 Correlations
SATISFACTION V1 V2 V3 V4 V5 V6 V7 V8
satisfied
with overall
performance
Pearson
Correlation
1 .533** .597** .522** .110 .068 -.043 .052 .340**
Sig. (2-
tailed)
.000 .000 .000 .057 .242 .463 .370 .000
N 300 300 300 300 300 300 300 300 300
Brochure of
the
company
Pearson
Correlation
.533** 1 .637** .383** .070 .074 -.079 -.022 .480**
Sig. (2-
tailed)
.000 .000 .000 .229 .204 .172 .708 .000
N 300 300 300 300 300 300 300 300 300
Brochure of
the
company is
information
Pearson
Correlation
.597** .637** 1 .238** .006 -.024 -.078 .004 .376**
Sig. (2-
tailed)
.000 .000 .000 .920 .676 .175 .944 .000
N 300 300 300 300 300 300 300 300 300
well dressed
and appear
neat
Pearson
Correlation
.522** .383** .238** 1 .314** .313** .116* .170** .215**
Sig. (2-
tailed)
.000 .000 .000 .000 .000 .045 .003 .000
N 300 300 300 300 300 300 300 300 300
Office is
well
organized
Pearson
Correlation
.110 .070 .006 .314** 1 .851** .831** .629** .248**
Sig. (2- .057 .229 .920 .000 .000 .000 .000 .000

Ileyas Rizvi, Mamta Bajpai, Priyaka Anjor, Varun Kumar Kashyap- Influence of
Service Quality on Attitudinal Loyalty in Insurance Industry
EUROPEAN ACADEMIC RESEARCH - Vol. II, Issue 3 / June 2014
4249
tailed)
N 300 300 300 300 300 300 300 300 300
Office is
visually
appealing
Pearson
Correlation
.068 .074 -.024 .313** .851** 1 .854** .759** .289**
Sig. (2-
tailed)
.242 .204 .676 .000 .000 .000 .000 .000
N 300 300 300 300 300 300 300 300 300
feel a
extremely
comfortable
Pearson
Correlation
-.043 -.079 -.078 .116* .831** .854** 1 .736** .149**
Sig. (2-
tailed)
.463 .172 .175 .045 .000 .000 .000 .010
N 300 300 300 300 300 300 300 300 300
Atmosphere
is very good
Pearson
Correlation
.052 -.022 .004 .170** .629** .759** .736** 1 .273**
Sig. (2-
tailed)
.370 .708 .944 .003 .000 .000 .000 .000
N 300 300 300 300 300 300 300 300 300
Proper
information
about the
name
Pearson
Correlation
.340** .480** .376** .215** .248** .289** .149** .273** 1
Sig. (2-
tailed)
.000 .000 .000 .000 .000 .000 .010 .000
N 300 300 300 300 300 300 300 300 300
**. Correlation is significant at the 0.01 level (2-tailed).
*. Correlation is significant at the 0.05 level (2-tailed).
Correlations
Additionally, the correlation between the independent variables
should not be equal or higher than 0.90. Finally, there should
be some correlations between the dependent variable and the
independent variables (Pallant, 2007). The correlation matrix
presented in Table 6 above shows that there is a positive
correlation among the four items of physical evidence SQL
dimension with overall experience. The correlation analysis
shows that four variables are significant at the 0.000 level,
which is lower than the 0.05 confidence level for the study. The
results show that the correlation between satisfied with overall
experience and V1 indicates that there was a significant
correlation between two variables with coefficient correlation r
=.533 at p < 0.00 level. The correlation between V2, V3 AND V8
and satisfied with overall experience indicates that there was a
significant correlation between three variables with coefficient
correlation r = .597 at p < 0.00 level (V2), r = .522 at p < 0.00
level (V3), r = .340 at p < 0.00 (V8) level respectively. The

Ileyas Rizvi, Mamta Bajpai, Priyaka Anjor, Varun Kumar Kashyap- Influence of
Service Quality on Attitudinal Loyalty in Insurance Industry
EUROPEAN ACADEMIC RESEARCH - Vol. II, Issue 3 / June 2014
4250
correlation between V4, V5, V6 and V7 and overall experience,
indicates that there was a insignificant correlation. It is
interesting to see that in factor analysis, items of factor-1 have
significant correlation with overall experience and items of
factor-2 have insignificant correlation with overall experience.
So, we can say that our alternate hypothesis-2 & 3 is
accepted partially, because it is still to be tested with
regression analysis and proved.
4.3. Reliability Test
Reliability refers to the consistency of the item-level errors
within a single factor. Reliability means just what it sounds
like: a "reliable" set of variables will consistently load on the
same factor. The way to test reliability in an EFA is to compute
Cronbach's alpha for each factor. Cronbach's alpha should be
above 0.7; although, ceteris paribus, the value will generally
increase for factors with more variables, and decrease for
factors with fewer variables. Each factor should aim to have at
least 3 variables, and there are eight variables of physical
evidence are there. A reliability test for physical evidence a
dimensions of service quality of LIC and Bajaj-Allianz, was
performed which showed that Cronbach’s alpha coefficients was
0.788.
Table-7
Reliability Statistics
Cronbach's Alpha N of Items
.788 8
4.4. Regression
Table-8 provides the results of MLR. Based on the results, it
seems all the two models for LIC and Bajaj- Allianz, have
worked realistically well in explaining the variation in overall
experience of respective consumers. In model-1 (LIC) the
proportion of explained variance as measured by R-SQUARE

Ileyas Rizvi, Mamta Bajpai, Priyaka Anjor, Varun Kumar Kashyap- Influence of
Service Quality on Attitudinal Loyalty in Insurance Industry
EUROPEAN ACADEMIC RESEARCH - Vol. II, Issue 3 / June 2014
4251
was (.176). In other words 17.6% of variation in satisfied with
overall experience (dependent variable) of consumers of LIC is
explained by items of physical evidence dimension (8
independent variables).
In model-2 (Bajaj-Allianz) the proportion of explained
variance as measured by R-SQUARE was (.161). In other words
16.1% of variation in satisfied with overall experience
(dependent variable) of consumers of LIC is explained by items
of physical evidence dimension (8 independent variables). The
standard error of estimate of a regression is quantitative
measure useful to indicate how precise the prediction of
dependent variable is, based on two or more independent
variables.
Table-8
Model Summary
Name of Company Model R R Square Adjusted R
Square
Std. Error of the
Estimate
LIC 1 .420a .176 .170 .98583
Bajaj 2 .401a .161 .155 .99546
a. Dependent Variable: satisfied with overall performance
b. Independent variable: all the 8 variables of physical evidence.
Analysis of variance test statistics (ANOVA) indicates that both
the models for LIC & Bajaj-Allianz are significant at 0.000.
ANOVA findings shows that the independent variables as a
whole have significant relationships with dependent variable,
satisfied with overall experience of consumers in insurance
industry for mode-1 (LIC) F-value is F=31.613, Sig=0.000 and
for mode-2 (Bajaj-Allianz) F-value is F=28.370, Sig=0.000 .
F value is obtained when mean square regression is
divided by mean square residual. Significant F is the
probability that this F-value could occur by chance. (ex.
Likelihood of the given correlation occurring by chance is less
than 1 in 10,000.) F-statistic is a value used in ANOVA and
regression analysis to determine if the variances between the
means of two populations are significantly different. For

Ileyas Rizvi, Mamta Bajpai, Priyaka Anjor, Varun Kumar Kashyap- Influence of
Service Quality on Attitudinal Loyalty in Insurance Industry
EUROPEAN ACADEMIC RESEARCH - Vol. II, Issue 3 / June 2014
4252
practical purposes, it is important to know that this value
determines the P-value, but the F-statistic number will not
actually be used in the interpretation here. Significance, or P-
value, is the probability that an effect at least as extreme as the
current observation has occurred by chance.
Table-9
ANOVAa
Name of
Company
Model Sum of
Squares
df Mean
Square
F Sig.
LIC 1 Regression 30.724 1 30.724 31.613 .000b
Residual 143.836 148 .972
Total 174.560 149
Bajaj 1 Regression 28.113 1 28.113 28.370 .000b
Residual 146.660 148 .991
Total 174.773 149
a. Dependent Variable: satisfied with overall performance
b. Predictors: (Constant), REGR factor score 1 for analysis 1
Table-10
Coefficientsa
Name of
Company
Model Unstandardized
Coefficients
Standardized
Coefficients
t Sig.
B Std.
Error
Beta
LIC 1 (Constant) 2.118 .123 17.231 .000
REGR factor
score 1 for
analysis 1
.670 .119 .420 5.623 .000
Bajaj 1 (Constant) 3.410 .138 24.639 .000
REGR factor
score 1 for
analysis 1
.765 .144 .401 5.326 .000
a. Dependent Variable: satisfied with overall performance
The standardized regression coefficient is the β value for
standardized scores (z scores) of the independent variables,
which varies between +1 & -1. The β value indicates the
relative influence of the entered variables.
In case of model-1 (LIC), physical evidence has the great
influence on satisfaction (β=0.420), so, we can say that our

Ileyas Rizvi, Mamta Bajpai, Priyaka Anjor, Varun Kumar Kashyap- Influence of
Service Quality on Attitudinal Loyalty in Insurance Industry
EUROPEAN ACADEMIC RESEARCH - Vol. II, Issue 3 / June 2014
4253
alternate hypothesis-2 is accepted and our research
objective-2 is fulfilled.
In case of model-2 (Bajaj-Allianz), physical evidence has
the great influence on satisfaction (β=0.401) as can be seen in
table-10. So, we can say that our alternate hypothesis-3 is
accepted and our research objective-3 is fulfilled.
Multiple regression analysis in Table 10 was employed
to determine whether physical evidence has an effect on
customer satisfaction; the result of regression analysis revealed
that there was significant relationship between physical
evidence and customer overall experience in case of LIC &
Bajaj-Allianz. The values of physical evidence are statistically
significant and it supports the alternate hypothesis -2 &
3.
4.4. Comparative Analysis of Variables of Physical
Evidence
Table-11
Crosstab
Brochure of the company contains all the required
information
Total
strongly
agree
agree neutral disagree strongly
disagree
Name of
Company
LIC Count 7 40 19 55 29 150
% of
Total
2.3% 13.3% 6.3% 18.3% 9.7% 50.0%
Bajaj Count 8 18 18 78 28 150
% of
Total
2.7% 6.0% 6.0% 26.0% 9.3% 50.0%
Total Count 15 58 37 133 57 300
% of
Total
5.0% 19.3% 12.3% 44.3% 19.0% 100.0%
Interpretation: From the above crosstab we can say that in
case of LIC, 4.6% respondents strongly agreed and 26.6%
agreed, 12.6% neutral, 36.6% disagreed and 19.4% strongly
disagreed that ‘brochure of the company contains all the
required information’. While in case of Bajaj-Allianz, 5.4%

Ileyas Rizvi, Mamta Bajpai, Priyaka Anjor, Varun Kumar Kashyap- Influence of
Service Quality on Attitudinal Loyalty in Insurance Industry
EUROPEAN ACADEMIC RESEARCH - Vol. II, Issue 3 / June 2014
4254
respondents strongly agreed and 12% agreed, 12% neutral, 52%
disagreed and 18.6% strongly disagreed on the same.
Hence, we can conclude that most of the consumers of LIC &
Bajaj-Allianz are dissatisfied on this particular dimension of
service quality i.e; brochure of the company contains all the
required information.
Table-12
Crosstab
Brochure of the company is informative and self
explanatory
Total
strongly
agree
agree neutral Disagree strongly
disagree
Name of
Company
LIC Count 10 35 9 73 23 150
% of
Total
3.3% 11.7% 3.0% 24.3% 7.7% 50.0%
Bajaj Count 12 7 19 62 50 150
% of
Total
4.0% 2.3% 6.3% 20.7% 16.7% 50.0%
Total Count 22 42 28 135 73 300
% of
Total
7.3% 14.0% 9.3% 45.0% 24.3% 100.0%
Interpretation: From the above crosstab we can say that in
case of LIC, 6.6% respondents strongly agreed and 23.4%
agreed, 6% neutral, 48.6% disagreed and 15.4% strongly
disagreed that ‘brochure of the company is informative and self
explanatory’. While in case of Bajaj-Allianz, 8% respondents
strongly agreed and 4.6% agreed, 12.6% neutral, 41.4%
disagreed and 33.4% strongly disagreed on the same.
Hence, we can conclude that despite of the neutral
response, most of the consumers of LIC & Bajaj-Allianz are
dissatisfied on this particular dimension of service quality i.e;
brochure of the company is informative and self explanatory.

Ileyas Rizvi, Mamta Bajpai, Priyaka Anjor, Varun Kumar Kashyap- Influence of
Service Quality on Attitudinal Loyalty in Insurance Industry
EUROPEAN ACADEMIC RESEARCH - Vol. II, Issue 3 / June 2014
4255
Table-13
Crosstab
Employees are well dressed and appear neat Total
strongly
agree
agree neutral disagree strongly
disagree
Name of
Company
LIC Count 34 50 30 25 11 150
% of
Total
11.3% 16.7% 10.0% 8.3% 3.7% 50.0%
Bajaj Count 43 56 41 10 0 150
% of
Total
14.3% 18.7% 13.7% 3.3% 0.0% 50.0%
Total Count 77 106 71 35 11 300
% of
Total
25.7% 35.3% 23.7% 11.7% 3.7% 100.0%
Interpretation: From the above crosstab we can say that in
case of LIC, 22.6% respondents strongly agreed and 33.4%
agreed, 20% neutral, 16.6% disagreed and 7.4% strongly
disagreed that ‘employees are well dressed and appear neat ’.
While in case of Bajaj-Allianz, 28.6% respondents strongly
agreed and 37.4% agreed, 27.4% neutral, 6.6% disagreed and
0.0% strongly disagreed on the same.
Hence, we can conclude that despite of the neutral
response, most of the consumers of LIC & Bajaj-Allianz are
satisfied, but consumers of Bajaj-Allianz are more
satisfied on this particular dimension of service quality i.e;
employees are well dressed and appear neat .
Table-14
Crosstab
Office is well organized Total
strongly
agree
agree Neutral disagree strongly
disagree
Name of
Company
LIC Count 0 12 42 43 53 150
% of
Total
0.0% 4.0% 14.0% 14.3% 17.7% 50.0%
Bajaj Count 18 91 41 0 0 150
% of
Total
6.0% 30.3% 13.7% 0.0% 0.0% 50.0%
Total Count 18 103 83 43 53 300
% of
Total
6.0% 34.3% 27.7% 14.3% 17.7% 100.0%

Ileyas Rizvi, Mamta Bajpai, Priyaka Anjor, Varun Kumar Kashyap- Influence of
Service Quality on Attitudinal Loyalty in Insurance Industry
EUROPEAN ACADEMIC RESEARCH - Vol. II, Issue 3 / June 2014
4256
Interpretation: From the above crosstab we can say that in
case of LIC, 0.0% respondents strongly agreed and 8% agreed,
28% neutral, 28.6% disagreed and 35.4% strongly disagreed
that ‘office of the company is well organised’. While in case of
Bajaj-Allianz, 12% respondents strongly agreed and 60.6%
agreed, 27.4% neutral, 0.0% disagreed and 0.0% strongly
disagreed on the same.
Hence, we can conclude that despite of the neutral
response, most of the consumers of LIC are dissatisfied, while
in case of Bajaj-Allianz consumers are highly satisfied on this
particular dimension of service quality i.e; office of the company
is well organised.
Table-15 Crosstab
Office is visually appealing Total
strongly
agree
agree Neutral disagree strongly
disagree
Name of
Company
LIC Count 0 14 48 49 39 150
% of
Total
0.0% 4.7% 16.0% 16.3% 13.0% 50.0%
Bajaj Count 57 74 19 0 0 150
% of
Total
19.0% 24.7% 6.3% 0.0% 0.0% 50.0%
Total Count 57 88 67 49 39 300
% of
Total
19.0% 29.3% 22.3% 16.3% 13.0% 100.0%
Interpretation: From the above crosstab we can say that in
case of LIC, 0.0% respondents strongly agreed and 9.4% agreed,
32% neutral, 32.6% disagreed and 26% strongly disagreed that
‘office of the company is visually appealing’. While in case of
Bajaj-Allianz, 38% respondents strongly agreed and 49.4%
agreed, 12.6% neutral, 0.0% disagreed and 0.0% strongly
disagreed on the same.
Hence, we can conclude that despite of the neutral
response, most of the consumers of LIC are dissatisfied, while
in case of Bajaj-Allianz consumers are highly satisfied on this
Ileyas Rizvi, Mamta Bajpai, Priyaka Anjor, Varun Kumar Kashyap- Influence of
Service Quality on Attitudinal Loyalty in Insurance Industry
EUROPEAN ACADEMIC RESEARCH - Vol. II, Issue 3 / June 2014
4257
particular dimension of service quality i.e; office of the company
is visually appealing.
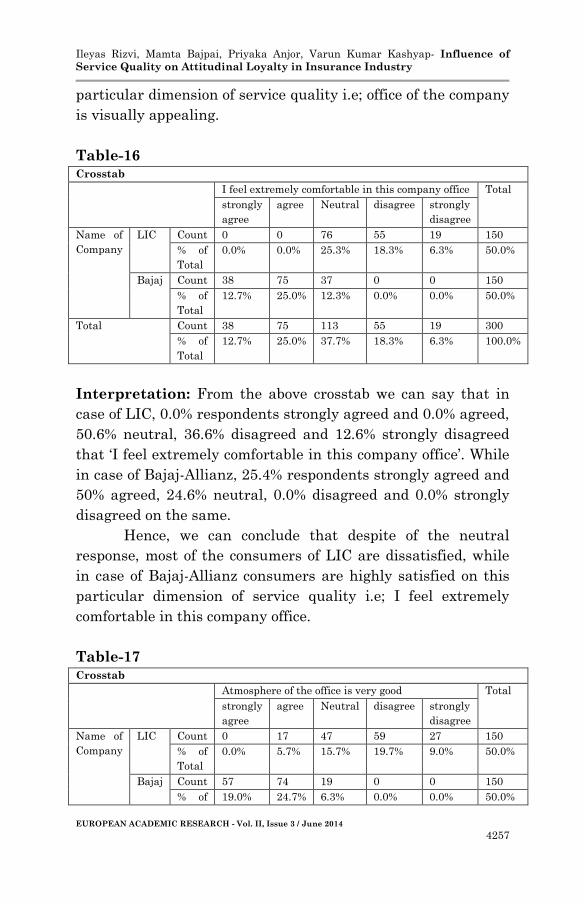
Table-16 Crosstab
I feel extremely comfortable in this company office Total
strongly
agree
agree Neutral disagree strongly
disagree
Name of
Company
LIC Count 0 0 76 55 19 150
% of
Total
0.0% 0.0% 25.3% 18.3% 6.3% 50.0%
Bajaj Count 38 75 37 0 0 150
% of
Total
12.7% 25.0% 12.3% 0.0% 0.0% 50.0%
Total Count 38 75 113 55 19 300
% of
Total
12.7% 25.0% 37.7% 18.3% 6.3% 100.0%
Interpretation: From the above crosstab we can say that in
case of LIC, 0.0% respondents strongly agreed and 0.0% agreed,
50.6% neutral, 36.6% disagreed and 12.6% strongly disagreed
that ‘I feel extremely comfortable in this company office’. While
in case of Bajaj-Allianz, 25.4% respondents strongly agreed and
50% agreed, 24.6% neutral, 0.0% disagreed and 0.0% strongly
disagreed on the same.
Hence, we can conclude that despite of the neutral
response, most of the consumers of LIC are dissatisfied, while
in case of Bajaj-Allianz consumers are highly satisfied on this
particular dimension of service quality i.e; I feel extremely
comfortable in this company office.
Table-17
Crosstab
Atmosphere of the office is very good Total
strongly
agree
agree Neutral disagree strongly
disagree
Name of
Company
LIC Count 0 17 47 59 27 150
% of
Total
0.0% 5.7% 15.7% 19.7% 9.0% 50.0%
Bajaj Count 57 74 19 0 0 150
% of 19.0% 24.7% 6.3% 0.0% 0.0% 50.0%

Ileyas Rizvi, Mamta Bajpai, Priyaka Anjor, Varun Kumar Kashyap- Influence of
Service Quality on Attitudinal Loyalty in Insurance Industry
EUROPEAN ACADEMIC RESEARCH - Vol. II, Issue 3 / June 2014
4258
Total
Total Count 57 91 66 59 27 300
% of
Total
19.0% 30.3% 22.0% 19.7% 9.0% 100.0%
Interpretation: From the above crosstab we can say that in
case of LIC, 0.0% respondents strongly agreed and 11.4%
agreed, 31.4% neutral, 39.4% disagreed and 18% strongly
disagreed that ‘atmosphere of the office is very good’. While in
case of Bajaj-Allianz, 38% respondents strongly agreed and
49.4% agreed, 12.6% neutral, 0.0% disagreed and 0.0% strongly
disagreed on the same.
Hence, we can conclude that despite of the neutral
response, most of the consumers of LIC are dissatisfied, while
in case of Bajaj-Allianz consumers are highly satisfied on this
particular dimension of service quality i.e; I feel extremely
comfortable in this company office.
Table-18
Crosstab
Proper information about the name, designation,
department, contact no. of the top management
officials is displayed at the entrance
Total
strongly
agree
agree neutral Disagree strongly
disagree
Name of
Company
LIC Count 6 5 69 58 12 150
% of
Total
2.0% 1.7% 23.0% 19.3% 4.0% 50.0%
Bajaj Count 9 20 61 46 14 150
% of
Total
3.0% 6.7% 20.3% 15.3% 4.7% 50.0%
Total Count 15 25 130 104 26 300
% of
Total
5.0% 8.3% 43.3% 34.7% 8.7% 100.0%
Interpretation: From the above crosstab we can say that in
case of LIC, 4% respondents strongly agreed and 3.4% agreed,
46% neutral, 38.6% disagreed and 8% strongly disagreed that
‘Proper information about the name, designation, department,
contact no. of the top management officials is displayed at the

Ileyas Rizvi, Mamta Bajpai, Priyaka Anjor, Varun Kumar Kashyap- Influence of
Service Quality on Attitudinal Loyalty in Insurance Industry
EUROPEAN ACADEMIC RESEARCH - Vol. II, Issue 3 / June 2014
4259
entrance’. While in case of Bajaj-Allianz, 6% respondents
strongly agreed and 13.4% agreed, 40.6% neutral, 30.6%
disagreed and 9.4% strongly disagreed on the same.
Hence, we can conclude that despite of the neutral
response, most of the consumers of LIC & Bajaj-Allianz are
dissatisfied on this particular dimension of service quality.
Table-19
Comparative summary of the satisfaction level of consumers for physical
evidence
Variable
No.
Items Consumers
of LIC
(strongly
satisfied
&
satisfied)
Consumers
of Bajaj-
Allianz
(strongly
satisfied
&
satisfied)
Consumers
of LIC
(strongly
dissatisfied
&
dissatisfied)
Consumers
of Bajaj-
Allianz
(strongly
dissatisfied
&
dissatisfied)
V1 Brochure of
the company
contains all
the required
information
Dissatisfied Dissatisfied
V2 Brochure of
the company
is informative
and self
explanatory
Dissatisfied Dissatisfied
V3 Employees
are well
dressed and
appear neat
More
Satisfied
Satisfied
V4 Office is well
organised
Highly
satisfied
Highly
dissatisfied
V5 Office is
visually
appealing
Highly
satisfied
Highly
dissatisfied
V6 I feel a
extremely
comfortable
in the office
Highly
satisfied
Highly
dissatisfied
V7 Atmosphere
is very good
Highly
dissatisfied
Highly
satisfied
V8 Proper
information
about the
dissatisfied Dissatisfied

Ileyas Rizvi, Mamta Bajpai, Priyaka Anjor, Varun Kumar Kashyap- Influence of
Service Quality on Attitudinal Loyalty in Insurance Industry
EUROPEAN ACADEMIC RESEARCH - Vol. II, Issue 3 / June 2014
4260
name,
designation,
department,
contact no of
the top
management
officials is
displayed at
the entrance
It is clearly evident from the results of analyses that there
exists a discrepancy gap between consumers’ perception about
the factors of physical evidence of LIC and BAJAJ ALLIANZ
respectively. Hence we can conclude that our Alternate
Hypothesis 4-(H1) is accepted.
5. Findings, Conclusion and Managerial implications:
Final results of analyses have fulfilled all the research
objectives and a table-20 in this regard, has been given below
to mention the final results of all the hypotheses, on the basis of
which conclusion is drawn and suggestions in form of
managerial implications, are given.
Table-20
HYPOTHESES RESULT
Alternate Hypothesis 1-(H1): There are some variables that play
an important role in managing physical evidence in LIC and Bajaj –
Allianz.
ACCEPTED
Alternate Hypothesis-2 (H1): There is a positive/significant
relationship between the physical evidence and customer overall
satisfaction in LIC.
ACCEPTED
Alternate Hypothesis-3 (H1): There is a positive/significant
relationship between the physical evidence and customer overall
satisfaction in Bajaj-Allianz.
ACCEPTED
Alternate Hypothesis 4-(H1): There is a discrepancy gap between
consumers’ perception about the factors of physical evidence of LIC
and BAJAJ ALLIANZ respectively.
ACCEPTED
This paper is of the view that physical evidence, can provide
assurance through tangiblisation, that can most likely result in

Ileyas Rizvi, Mamta Bajpai, Priyaka Anjor, Varun Kumar Kashyap- Influence of
Service Quality on Attitudinal Loyalty in Insurance Industry
EUROPEAN ACADEMIC RESEARCH - Vol. II, Issue 3 / June 2014
4261
a better service performance. The focus of this study therefore,
was to determine if physical evidence dimensions such
ambience, personnel uniform, brochures, well organized office,
visually appealing office etc substantially correlate with service
performance of LIC & Bajaj-Allianz in Lucknow, capital of
Uttar Pradesh, state of India. Analyses of primary data
revealed that physical evidence is significantly associated with
consumer satisfaction and enhances the service performance in
the insurance industry.
As insurance policy is just a concept and the evidence of
this policy in an insurance service systems design is likely to
win consumers patronage, which leads to increase in sales,
market share and profitability. Also regular training of service
personnel increases their visual appearance and competence to
meet the challenges in the Indian insurance industry. Basically
the role and purpose of physical evidence is to facilitate service
delivery process apart from attracting consumers and image
building. Certainly this will enable the insurance industry
achieve good customer service delivery and thus, avoid
customer defection, help in consumer retention and encourage
consumers to be loyal to the organization.
Analyses have shown that all the four variables of factor
-1 obtained from factor analysis are positively related with
consumers’ overall satisfaction. Our findings are also supported
by Duncan (1996), which maintains that service environment
increases customer satisfaction and that within service
environments customers can be exposed to numerous stimuli
which potentially affect how they act, buy, and their
satisfaction with the service experience. The findings are also
supported by Kotler (1973), which upholds that a good
atmosphere provides discriminative stimuli to buyers that
enable them to recognize service differences as bases for
selecting a service provider.
Regression results in table-8 shows that less percentage
of variance in consumers’ overall satisfaction / experience is

Ileyas Rizvi, Mamta Bajpai, Priyaka Anjor, Varun Kumar Kashyap- Influence of
Service Quality on Attitudinal Loyalty in Insurance Industry
EUROPEAN ACADEMIC RESEARCH - Vol. II, Issue 3 / June 2014
4262
explained by physical evidence, 17.6% in case of LIC & 16.1% in
Bajaj-Allianz. Though physical evidence has positive and
significant relationship with consumers’ overall satisfaction,
even then, physical evidence explains less percentage of
variance. From statistical point of view this finding may seem
to be dissatisfactory result. But, in insurance industry in India,
it is a fact that consumers are more inclined towards other
factors; mainly towards attractive insurance policy, value
pricing, service delivery process etc. Indeed, physical evidence
does not play a vital role in insurance industry; but it means
that physical evidence is important but not as important as
others dimensions of service quality are. Earlier, before the
entry of private companies in India, LIC, the market leader and
the only public sector corporation, never paid attention to its
physical evidence, and it is still lacking the same as evident
from the results of comparative cross tabulation shown in table-
19. After the entry of private insurance companies in joint
ventures with foreign firms, penetrated Indian insurance
market, LIC improved its physical evidence, but, from the
results it can be seen that LIC is unable to compete with Bajaj-
Allianz, a private joint venture, which is ahead of LIC in
physical evidence aspect of service quality and consumer
satisfaction.
6. Limitations and Suggestions for Further Studies
Data that lead us to our findings, were collected from insurance
industry in Lucknow, a city of India; moreover data represent
the perception of LIC & Bajaj-Allianz’s consumers. Thus, the
findings are limited to these two insurance service providers
only. Further studies can be conducted in other service-based
areas such as hospitality, healthcare and other service
industries. Scope of future studies in the same area of physical
evidence may include other dimensions of service quality such
as product policy, service delivery etc.

Ileyas Rizvi, Mamta Bajpai, Priyaka Anjor, Varun Kumar Kashyap- Influence of
Service Quality on Attitudinal Loyalty in Insurance Industry
EUROPEAN ACADEMIC RESEARCH - Vol. II, Issue 3 / June 2014
4263
FUNDING:
We have received financial support from Times Institute of
Management & Research, an institute promoting research in the field
of management.
ACKNOWLEDGEMENT
The authors are grateful to the Dr. Mansoor Ali, Ex Professor, IIT,
Roorkee for his guidance and motivation and unconditional support.
REFERENCES & BIBLIOGRAPHY
Ambler, T. and Kokkinaki, F. 1997. "Measures of Marketing
Success.” Journal of Marketing Management 13: 665-
678.
Ambler, T. and Roberts, J. 2005. “Beware of the Silver Metric:
Marketing Performance Measurement has to be
Multidimensional.” Centre for Marketing working paper.
No. 05-709 (September).
Asiegbu, I.F. and Powei, D.M. 2012. “Sales Force Competence:
Its Nature, Need, and Dimensions in Selling Contexts
for Sustainable Economic Development.” Journal of
Economic and Sustainable Development 3(9): 120-128.
Baker, J., Berry, L. and Parrasuraman, A. 1988. “The
Marketing Impact of Branch Facility Design." Journal of
Retail Banking 10(2): 33- 42.
Baron, S. 1995. Marketing: Text and Cases. Basingstoke,
Hampshire: The McMillam Press Ltd.
Berkowitz, E.N., Kerin, R.A., Hartley, S.W., and Rudelius, W.
2003. Marketing. 6th Edition. Boston: Irwin McGraw-
Hill.
Berry, L. L. 1980. “Services Marketing is Different.” Business
May-June, pp. 24-29.
Gronroos, C. 2000. Service Management and Marketing: A
Customer Relationship Management Approach. 2nd Ed.
NY: Wiley.

Ileyas Rizvi, Mamta Bajpai, Priyaka Anjor, Varun Kumar Kashyap- Influence of
Service Quality on Attitudinal Loyalty in Insurance Industry
EUROPEAN ACADEMIC RESEARCH - Vol. II, Issue 3 / June 2014
4264
Rizvi, I. Autumn, 2013. “Promise management in insurance
industry- a comparative study of LIC & Bajaj-Allianz.”
Aatmbodh, Journal of Rajarshi School of Management &
Technology X(3): 3-10, ISSN-0972-1398.
Kotler, P. 1973. “Atmospherics as a Marketing Tool.” Journal of
Retailing 49(4): 48-64.
Kotler, P. 1997. Marketing Management: Analysis, Planning,
Implementation and Control. 9th ed., Eagle Cliffs. NJ:
Prentice-Hall.
Lovelock, C. and Wirt, J. 2007. Services Marketing: People,
Technology, Strategy. 6th ed. NJ: Prentice Hall.
Martineau, P. 1958. "The Personality of the Retail Store."
Harvard Business Review 36: 47-55.
McDougall, G.H.G. and Snetsinger, D.W. 1990. “The
Intangibility of Services: Measurement and Competitive
Perspectives.” Journal of Services Marketing 4(4): 27-40.
Mittal, B. 2002. “Services Communications: From Mindless
Tangibilization to Meaningful Messages.” Journal of
Services Marketing 16(5): 424-431.
Shostack, L. G. 1977. “Breaking Free From Product
Marketing.” Journal of Marketing 41: 73-80.
Stafford, M. R. 1996. “Tangibility In Services Advertising: An
Investigation of Verbal Versus Visual Cues.” Journal of
Advertising 3: 13-26.
Zeithaml, V.A. and Bitner, M. J. 2003. Services Marketing:
Integrating Customer Focus across the Firm. 3rd Ed. New
York: McGraw-Hill Irwin.
Zeithaml, V.A. and Bitner, M.J. 2000. Services Marketing:
Integrating Customer Focus across the Firms. 2nd Ed.
Boston: McGraw-Hill.