managing the bubble 2014 reportpub/documents/managing the bubble long version... · managing the...
TRANSCRIPT
Managing the Bubble2014 Report
The demographics of crown corporation staff as of December 2014including trends from 2002 to 2014
April 30, 2015 Prepared by:Doug ElliottQED Information Systems Inc.444 19th AvenueRegina, SaskatchewanS4N 1H1Tel: 306-522-5515Cell: 306-536-5131Email: [email protected]: www.sasktrends.ca

Background and Notes
• This is the 2014 version of a series of annual reports documenting research into the demographics of employees in Saskatchewan’s commercial crown corporations. Since the first Managing the Bubble report describing staff in 2001, the employee database has been updated annually to document employee demographics and to monitor trends over time.
• The database measures a) a “snapshot” of employment at the end of the calendar year and b) turnover that has occurred over the year.
• The database has been expanded in stages by adding additional data elements to provide a more comprehensive measure of staff demographics.
• For December 2001, only data for permanent full-time staff were collected.• For December 2002, coop/summer students and non-permanent staff were added to the database. The
occupation (coded to the National Occupational Classification or NOC code) was also included as a data element.
• For December 2003, the place of work was added. • SOCO was added in 2004.• SGC was added in 2007.• ISC was removed in 2013.• The occupational codes (NOC) were converted from the 2006 version to the 2011 version in 2014.
• Virtually all of the statistics in this summary report relate to the thirteen years from 2002 to 2014 when all permanent and non-permanent staff were included in the database.
2April 30, 2015 2014 Managing the Bubble Report

Background and Notes (continued)
• Funding for human resource initiatives in the crowns to help “manage the bubble” (e.g. Gradworks) began in 2004.
• The inclusion of the Saskatchewan Gaming Corporation (SGC) in 2007 means that trends over time need to be interpreted carefully. Employee demographics and turnover at SGC are dramatically different from those at other crowns. To deal with this and the statistical effect of removing ISC in 2013, most trends over time are done separately for:
• the aggregate of all crowns, regardless of which crowns are included or excluded; and • all crowns excluding SGC and ISC to measure consistent trends over time.
• In some instances, the characteristics of crown staff and the positions they occupy are compared with those in the province as a whole. These comparisons use the Statistics Canada monthly Labour Force Survey (LFS) for comparison purposes. The LFS is a monthly telephone survey with a sample size of approximately 4,000 households in Saskatchewan.
• The LFS statistics were derived by the author from survey microdata. • The LFS figures are annual averages whereas the crown data describes the situation at a point in
time, namely December of the year. • Unless otherwise indicated, the LFS data includes the self-employed.• The LFS is not conducted among on-Reserve residents.
• As in previous versions, the crowns were asked to exclude employees who were on long-term disability.
• In some cases, rounding errors mean that percentages do not total exactly 100%.
3April 30, 2015 2014 Managing the Bubble Report

Staffing Categories and Class of Worker
• Not counting students, the total staff complement was 11,778 as of December 2014 with 84.0% as permanent full-time employees with the remaining 16.0% split among:
• 6.4% permanent part-time staff, bringing permanent staff to 90.4% of the total;• 5.4% as contract or term staff; and • 4.2% as “other”, mostly casual, staff.
The crowns typically hire several hundred coop and summer students in any given year although the number was slightly lower in 2014.
• The 11,778 permanent and non-permanent staff represent 2.1% of the 555,000 persons employed in an average month in 2014 in Saskatchewan.
4April 30, 2015 2014 Managing the Bubble Report
as of December 31*2002 2003 2004 2005 2006 2007 2008 2009 2010 2011 2012 2013 2014
Permanent full time 8,908 8,903 8,860 8,940 9,022 9,574 9,658 9,777 9,704 9,694 9,833 9,856 9,898Permanent part time 482 499 479 419 421 894 901 844 786 825 869 795 751Contract/term 807 530 525 560 583 575 636 620 582 603 538 537 638Seasonal/other 340 426 400 404 495 735 681 605 687 537 517 535 491
10,537 10,358 10,264 10,323 10,521 11,778 11,876 11,846 11,759 11,659 11,757 11,723 11,778Coop and summer students during the course of the year
516 515 461 477 485 478 488 500 435 458 428 447 399
* exludes SOCO prior to 2004
Detailed Employment by Crown Corporation
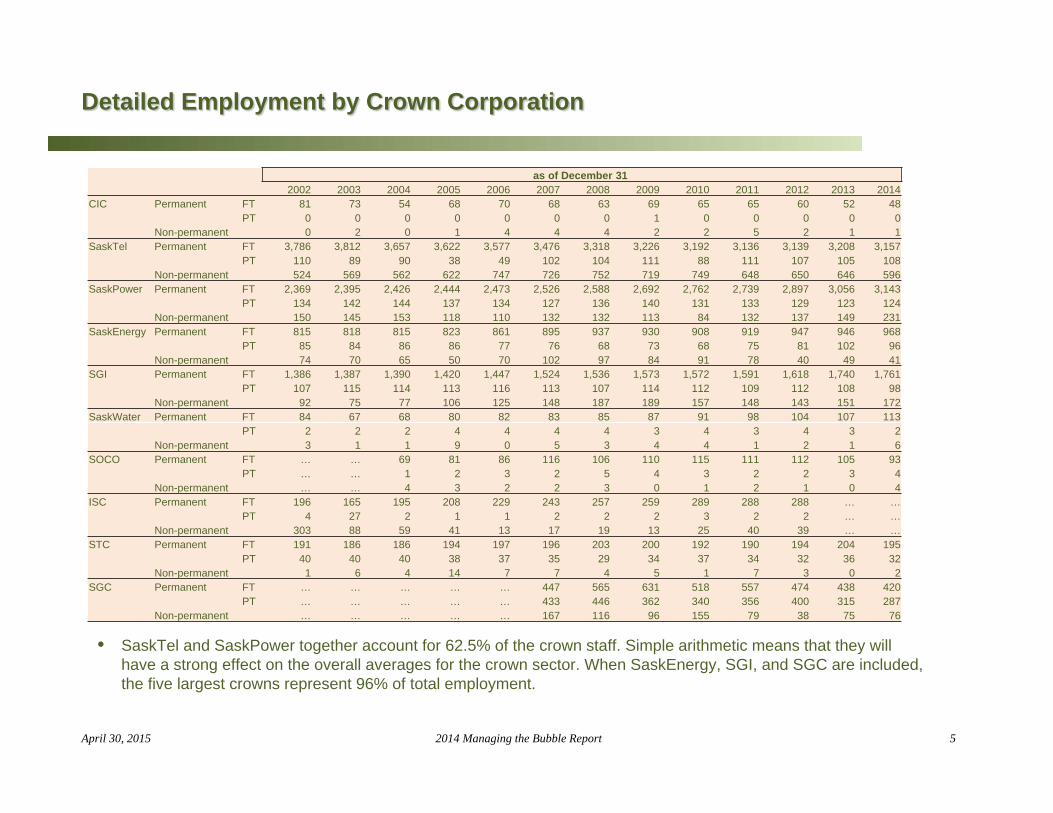
• SaskTel and SaskPower together account for 62.5% of the crown staff. Simple arithmetic means that they will have a strong effect on the overall averages for the crown sector. When SaskEnergy, SGI, and SGC are included, the five largest crowns represent 96% of total employment.
5April 30, 2015 2014 Managing the Bubble Report
as of December 312002 2003 2004 2005 2006 2007 2008 2009 2010 2011 2012 2013 2014
CIC Permanent FT 81 73 54 68 70 68 63 69 65 65 60 52 48PT 0 0 0 0 0 0 0 1 0 0 0 0 0
Non-permanent 0 2 0 1 4 4 4 2 2 5 2 1 1SaskTel Permanent FT 3,786 3,812 3,657 3,622 3,577 3,476 3,318 3,226 3,192 3,136 3,139 3,208 3,157
PT 110 89 90 38 49 102 104 111 88 111 107 105 108Non-permanent 524 569 562 622 747 726 752 719 749 648 650 646 596
SaskPower Permanent FT 2,369 2,395 2,426 2,444 2,473 2,526 2,588 2,692 2,762 2,739 2,897 3,056 3,143PT 134 142 144 137 134 127 136 140 131 133 129 123 124
Non-permanent 150 145 153 118 110 132 132 113 84 132 137 149 231SaskEnergy Permanent FT 815 818 815 823 861 895 937 930 908 919 947 946 968
PT 85 84 86 86 77 76 68 73 68 75 81 102 96Non-permanent 74 70 65 50 70 102 97 84 91 78 40 49 41
SGI Permanent FT 1,386 1,387 1,390 1,420 1,447 1,524 1,536 1,573 1,572 1,591 1,618 1,740 1,761PT 107 115 114 113 116 113 107 114 112 109 112 108 98
Non-permanent 92 75 77 106 125 148 187 189 157 148 143 151 172SaskWater Permanent FT 84 67 68 80 82 83 85 87 91 98 104 107 113
PT 2 2 2 4 4 4 4 3 4 3 4 3 2Non-permanent 3 1 1 9 0 5 3 4 4 1 2 1 6
SOCO Permanent FT … … 69 81 86 116 106 110 115 111 112 105 93PT … … 1 2 3 2 5 4 3 2 2 3 4
Non-permanent … … 4 3 2 2 3 0 1 2 1 0 4ISC Permanent FT 196 165 195 208 229 243 257 259 289 288 288 … …
PT 4 27 2 1 1 2 2 2 3 2 2 … …Non-permanent 303 88 59 41 13 17 19 13 25 40 39 … …
STC Permanent FT 191 186 186 194 197 196 203 200 192 190 194 204 195PT 40 40 40 38 37 35 29 34 37 34 32 36 32
Non-permanent 1 6 4 14 7 7 4 5 1 7 3 0 2SGC Permanent FT … … … … … 447 565 631 518 557 474 438 420
PT … … … … … 433 446 362 340 356 400 315 287Non-permanent … … … … … 167 116 96 155 79 38 75 76

6April 30, 2015 2014 Managing the Bubble Report
Total Staff in the Crowns, 2014
CIC49 0.4%
Sask Tel3,861 32.8%
Sask Power3,498 29.7%
Sask Energy1,105 9.4%
SGI2,031 17.2%
SOCO101 0.9%
Sask Water121 1.0%
STC229 1.9%
SGC783
6.6%
4.2%
Permanent and Non-Permanent Staff, December 2014, by Crown Corporation (Total = 11,778)

Crown Employment Trends
• These figures include both permanent and non-permanent staff.
• Excluding SOCO, ISC, and SGC, the increase from 2011 to 2014 was 672 staff. The bulk of the increase was in SaskPower and SGI.
7April 30, 2015 2014 Managing the Bubble Report
SO
CO
Add
ed
SG
C A
dded
ISC
Rem
oved
9,500
10,000
10,500
11,000
11,500
12,000
12,500
2002 2003 2004 2005 2006 2007 2008 2009 2010 2011 2012 2013 2014
Changes in Total Crown Staff, 2002 to 2014
excluding SOCO, ISC, and SGC

Non-Permanent Staff
• The number of non-permanent staff in the crowns has fluctuated between 900 and 1,300 over the years.
• In 2014, non-permanent staff represented 9.6% of the staff in the crowns.
8April 30, 2015 2014 Managing the Bubble Report
SO
CO
Add
ed
SG
C A
dded
ISC
Rem
oved
600
700
800
900
1,000
1,100
1,200
1,300
1,400
1,500
1,600
2002 2003 2004 2005 2006 2007 2008 2009 2010 2011 2012 2013 2014
Number of Non-Permanent Staff
Characteristics of Employees
• Gender• Aboriginal Identity• Membership in a Visible Minority Group• Reporting a Disability• Age• Tenure• Earliest retirement date

Category of Employment by Gender
• The proportion of crown staff who are women hasn’t changed significantly over time. In 2014, 42.6% of staff were women compared with 43.2% in 2004.
• Women make up the majority of staff in non-permanent positions, accounting for 54% of those in term positions and 58% of those in seasonal positions.
• The proportion of students who are women is not significantly different from the proportion of permanent staff who are women. In 2014, 47% of the students were women.
10April 30, 2015 2014 Managing the Bubble Report
40.4%
53.7%
57.9%
42.6%
0% 10% 20% 30% 40% 50% 60% 70% 80% 90%
Permanent
Term/contract
Seasonal/other
Total (exceptstudents)
Percent of Crown Staff who are Women
2002
2005
2008
2011
2014
Note: SGC is excluded in the 2002 & 2005 figures; ISC is excluded in 2014 but included in previous years.

Crown Corporation Employment by Gender
• Over the twelve years ending in 2014, most crowns report no dramatic changes in the proportion of women among their permanent staff.
• Over time, the proportion of female employees has declined slightly at SaskTel and increased at SaskPower, SGI, and STC.
11April 30, 2015 2014 Managing the Bubble Report
0% 10% 20% 30% 40% 50% 60% 70%
CIC
SaskTel
SaskPower
SaskEnergy
SGI
SOCO
SaskWater
STC
SGC
Percent of Permanent Crown Staff who are Women
2002
2005
2008
2011
2014
Comparison with Saskatchewan
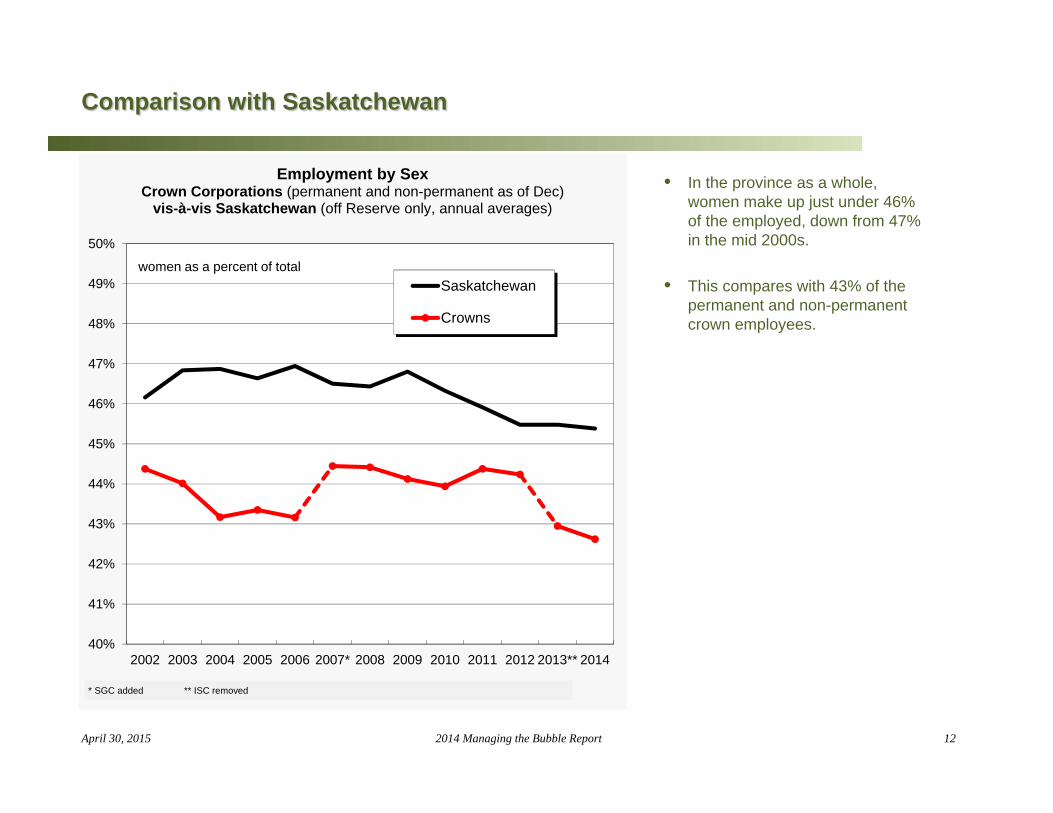
• In the province as a whole, women make up just under 46% of the employed, down from 47% in the mid 2000s.
• This compares with 43% of the permanent and non-permanent crown employees.
12April 30, 2015 2014 Managing the Bubble Report
40%
41%
42%
43%
44%
45%
46%
47%
48%
49%
50%
2002 2003 2004 2005 2006 2007* 2008 2009 2010 2011 2012 2013** 2014
Employment by SexCrown Corporations (permanent and non-permanent as of Dec)
vis-à-vis Saskatchewan (off Reserve only, annual averages)
Saskatchewan
Crowns
women as a percent of total
* SGC added ** ISC removed

Women in the Crowns: Trends Over Time
• Both SGC and ISC employ a relatively high number of women so their inclusion/ exclusion from the totals has a noticeable effect on the overall proportion.
• Removing these two crowns to create a consistent set of statistics lowers the proportion of women working in the crowns from 43% to 42% and shows a gradual downward trend in the proportion of women working in the crowns.
13April 30, 2015 2014 Managing the Bubble Report
40%
41%
42%
43%
44%
45%
46%
47%
48%
2002 2003 2004 2005 2006 2007 2008 2009 2010 2011 2012 2013 2014
Percentage of Crown Staff who are Women (permanent and non-permanent)
Total
Excluding SGC & ISC
women as a percent of total
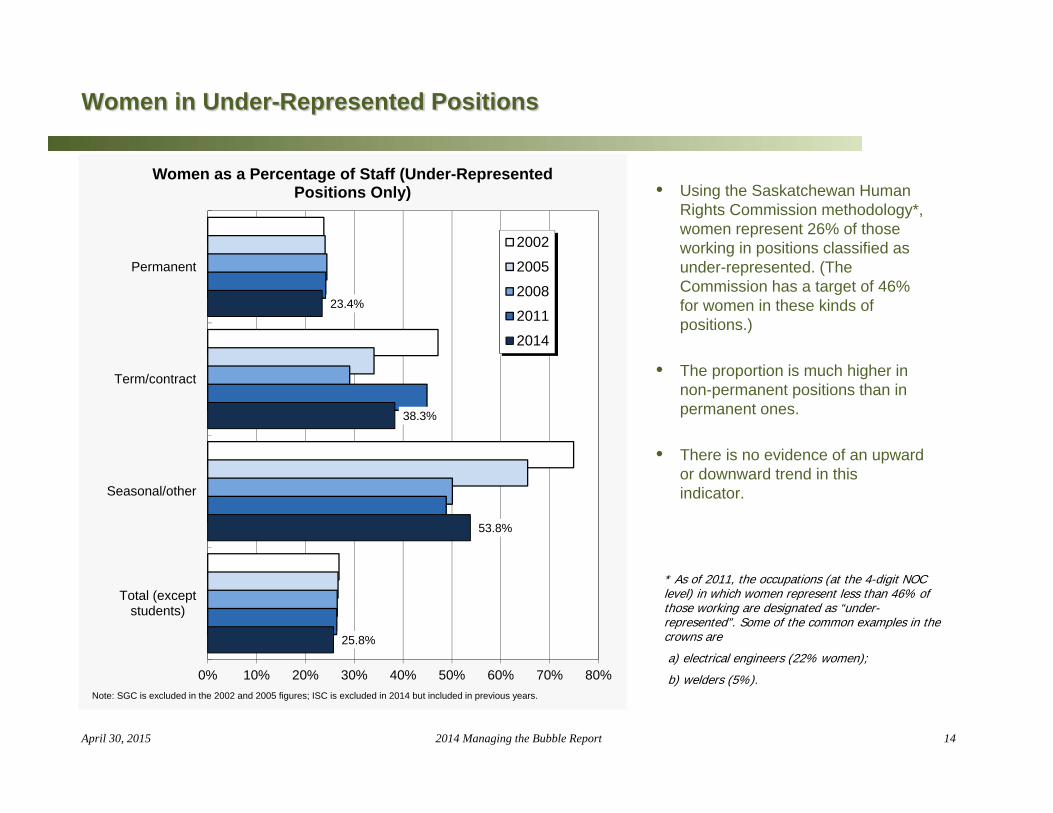
Women in Under-Represented Positions
• Using the Saskatchewan Human Rights Commission methodology*, women represent 26% of those working in positions classified as under-represented. (The Commission has a target of 46% for women in these kinds of positions.)
• The proportion is much higher in non-permanent positions than in permanent ones.
• There is no evidence of an upward or downward trend in this indicator.
14April 30, 2015 2014 Managing the Bubble Report
* As of 2011, the occupations (at the 4-digit NOC level) in which women represent less than 46% of those working are designated as “under-represented”. Some of the common examples in the crowns are
a) electrical engineers (22% women);
b) welders (5%).
23.4%
38.3%
53.8%
25.8%
0% 10% 20% 30% 40% 50% 60% 70% 80%
Permanent
Term/contract
Seasonal/other
Total (exceptstudents)
Women as a Percentage of Staff (Under-Represented Positions Only)
2002
2005
2008
2011
2014
Note: SGC is excluded in the 2002 and 2005 figures; ISC is excluded in 2014 but included in previous years.

Women in Under-Represented Positions, by Crown Corporation
• In absolute terms, the largest number of women working in under-represented positions are employed at SaskTel. However, the largest proportions are working at SaskTel, SGC, and CIC.
• Many crowns, including STC and SaskPower are making steady progress in increasing the number of women who work in under-represented positions but the proportions are still very low.
• There is a downward trend over the twelve years at SaskTel.
15April 30, 2015 2014 Managing the Bubble Report
** insufficient occupational detail provided for CIC in 2004
0% 10% 20% 30% 40% 50% 60%
CIC
SaskTel
SaskPower
SaskEnergy
SGI
SOCO
SaskWater
STC
SGC
Women as a Percentage of Staff (Under-Represented Positions Only), Permanent Staff Only
2002
2005
2008
2011
2014

Trends over Time, Women in Under-Represented Positions
• The proportion of crown positions in which a) women are under-represented and b) which are held by women has fluctuated near 26% for the past twelve years.
• The inclusion or exclusion of SGC and ISC in the statistics has little effect on this indicator.
• The decline in 2014 may be partly the result of the switch from 2006 to 2011 NOC codes and the updating of the positions in which women are under-represented.
16April 30, 2015 2014 Managing the Bubble Report
24%
25%
26%
27%
28%
2002 2003 2004 2005 2006 2007 2008 2009 2010 2011 2012 2013 2014
Women as a Percentage of Staff (Under-Represented Positions Only), Permanent and Non-Permanent
Positions
Total
Excluding SGC & ISC
women as a percent of total
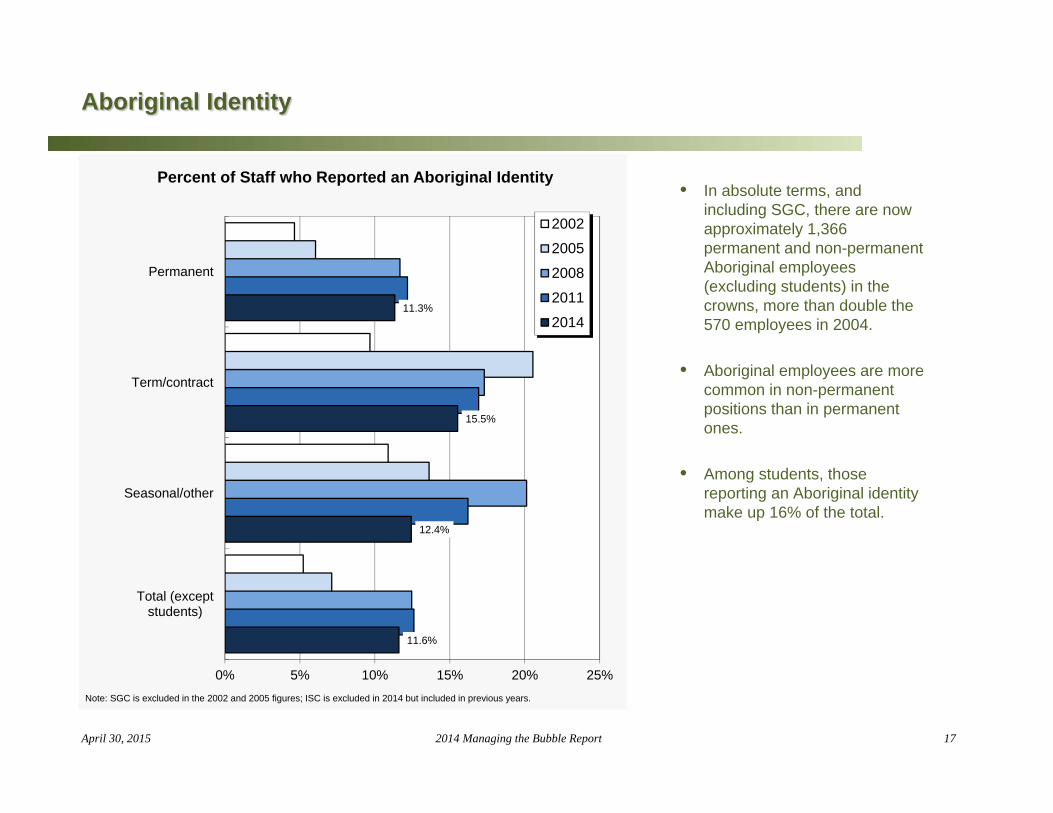
Aboriginal Identity
• In absolute terms, and including SGC, there are now approximately 1,366 permanent and non-permanent Aboriginal employees (excluding students) in the crowns, more than double the 570 employees in 2004.
• Aboriginal employees are more common in non-permanent positions than in permanent ones.
• Among students, those reporting an Aboriginal identity make up 16% of the total.
17April 30, 2015 2014 Managing the Bubble Report
11.3%
15.5%
12.4%
11.6%
0% 5% 10% 15% 20% 25%
Permanent
Term/contract
Seasonal/other
Total (exceptstudents)
Percent of Staff who Reported an Aboriginal Identity
2002
2005
2008
2011
2014
Note: SGC is excluded in the 2002 and 2005 figures; ISC is excluded in 2014 but included in previous years.
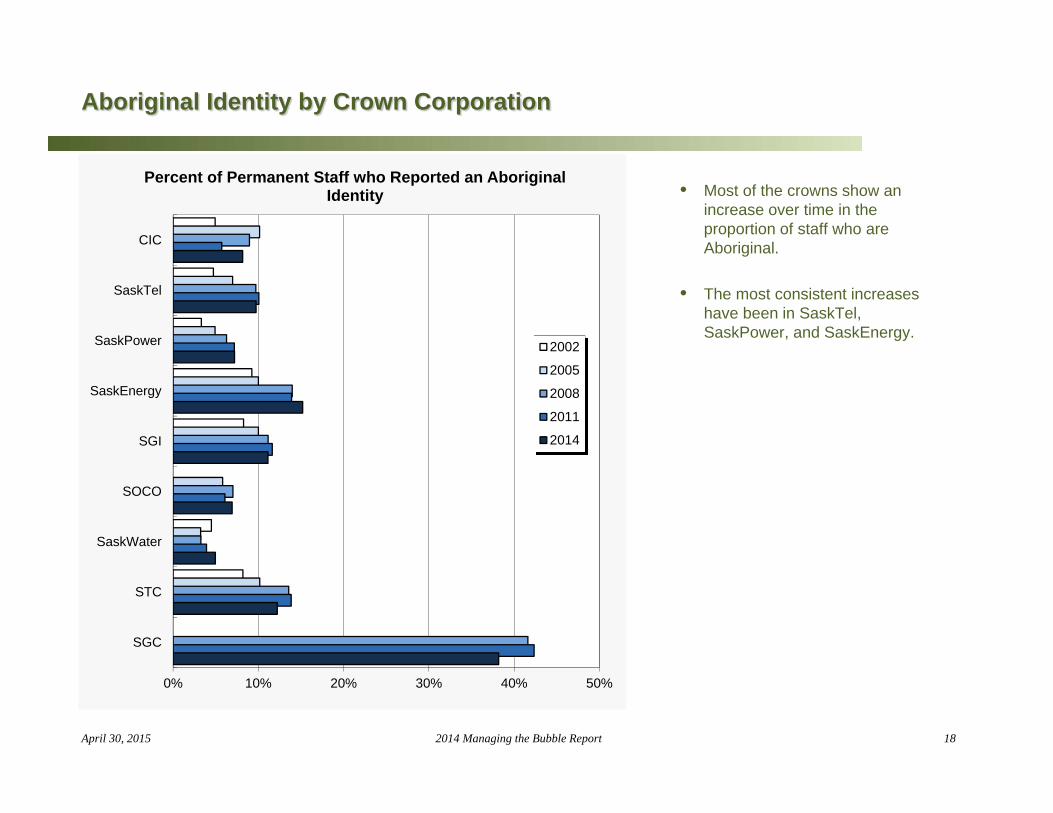
Aboriginal Identity by Crown Corporation
• Most of the crowns show an increase over time in the proportion of staff who are Aboriginal.
• The most consistent increases have been in SaskTel, SaskPower, and SaskEnergy.
18April 30, 2015 2014 Managing the Bubble Report
0% 10% 20% 30% 40% 50%
CIC
SaskTel
SaskPower
SaskEnergy
SGI
SOCO
SaskWater
STC
SGC
Percent of Permanent Staff who Reported an Aboriginal Identity
2002
2005
2008
2011
2014

19April 30, 2015 2014 Managing the Bubble Report
Trends in Aboriginal Identity – the Effect of SGC and ISC
• Excluding SGC and ISC, the proportion of permanent and non-permanent staff who self-identify as Aboriginal has increased from 5.4% in 2002 to 10.0% in 2010 before falling back to 9.7% in 2014.
• Including SGC in 2007, changes the proportion to 11.6%.
• The Saskatchewan Human Rights Commission has a target of 13.1% for Aboriginal employees. The crown sector is at 11.6%.
0%
2%
4%
6%
8%
10%
12%
14%
2002 2003 2004 2005 2006 2007 2008 2009 2010 2011 2012 2013 2014
Percent of Permanent and non-Permanent Staff who Report an Aboriginal Identity
Total
Excluding SGC & ISC

Comparison with Saskatchewan
• Excluding the population living on Reserve (where the Labour Force Survey is not conducted), Aboriginal people make up just under 8% of the employed persons in Saskatchewan.
• This compares with 11.6% of the permanent and non-permanent crown staff in 2014.
20April 30, 2015 2014 Managing the Bubble Report
0%
2%
4%
6%
8%
10%
12%
14%
2002 2003 2004 2005 2006 2007* 2008 2009 2010 2011 2012 2013** 2014
Employment by Aboriginal IdentityCrown Corporations (permanent and non-permanent as of Dec)
vis-à-vis Saskatchewan (off Reserve only, annual averages)
Crowns
Saskatchewan
Aboriginal employmentas a percent of totalemployment
* SGC added ** ISC excluded

Membership in a Visible Minority Group
• As with Aboriginal employees in the crowns, those who are members of a visible minority group are much more common among non-permanent staff and among students than among permanent staff.
• The proportion of permanent staff who are members of a visible minority group has increased steadily from 2.2% in 2004 to 7.2% in 2014.
• The proportion increases to 7.9% if non-permanent staff are included.
• The proportion of 2014 students who were members of a visible minority group was 13%.
21April 30, 2015 2014 Managing the Bubble Report
7.2%
13.9%
15.9%
7.9%
0% 5% 10% 15% 20%
Permanent
Term/contract
Seasonal/other
Total (exceptstudents)
Percent of Staff who are Members of a Visible Minority Group
2002
2005
2008
2011
2014
Note: SGC is excluded in the 2002 and 2004 figures; ISC is excluded in 2014 but included in previous years.
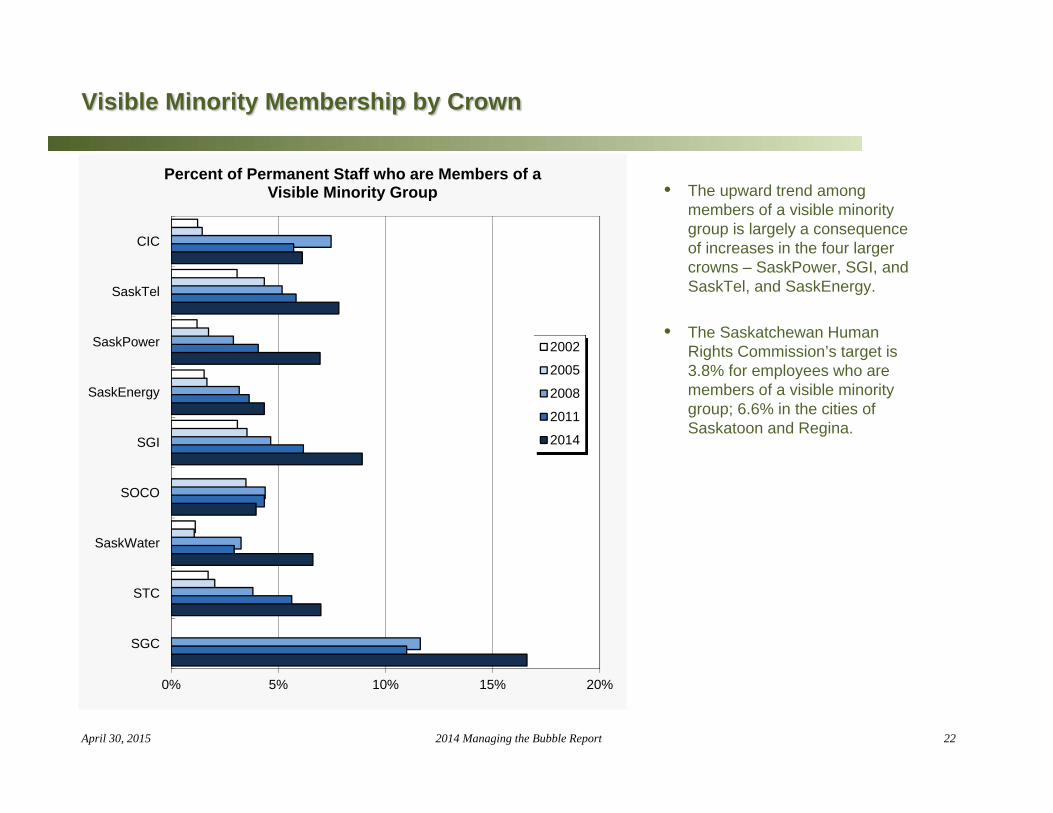
Visible Minority Membership by Crown
• The upward trend among members of a visible minority group is largely a consequence of increases in the four larger crowns – SaskPower, SGI, and SaskTel, and SaskEnergy.
• The Saskatchewan Human Rights Commission’s target is 3.8% for employees who are members of a visible minority group; 6.6% in the cities of Saskatoon and Regina.
22April 30, 2015 2014 Managing the Bubble Report
0% 5% 10% 15% 20%
CIC
SaskTel
SaskPower
SaskEnergy
SGI
SOCO
SaskWater
STC
SGC
Percent of Permanent Staff who are Members of a Visible Minority Group
2002
2005
2008
2011
2014

Trends in the Number of Staff who are Visible Minority Group Members
• Whether or not SGC and ISC are included or excluded, there is a clear upward trend in the proportion of permanent and non-permanent staff who self-identify as members of a visible minority group.
23April 30, 2015 2014 Managing the Bubble Report
0%
1%
2%
3%
4%
5%
6%
7%
8%
9%
2002 2003 2004 2005 2006 2007 2008 2009 2010 2011 2012 2013 2014
Percent of Permanent and Non-Permanent Staff who are Members of a Visible Minority Group
Total
Excluding SGC & ISC

Persons Reporting a Disability
• The proportion of permanent and non-permanent staff who report a disability has grown only slightly, increasing from 4.1% in 2002 to 4.4% in 2014.
• The proportion of 2014 students who reported a disability was 1.3%.
24April 30, 2015 2014 Managing the Bubble Report
4.4%
3.3%
6.1%
4.4%
0% 1% 2% 3% 4% 5% 6% 7% 8% 9%
Permanent
Term/contract
Seasonal/other
Total (exceptstudents)
Percent of Staff who Report Having a Disability
2002
2005
2008
2011
2014
Note: SGC is excluded in the 2002 and 2005 figures; ISC is excluded in 2014 but included in previous years.
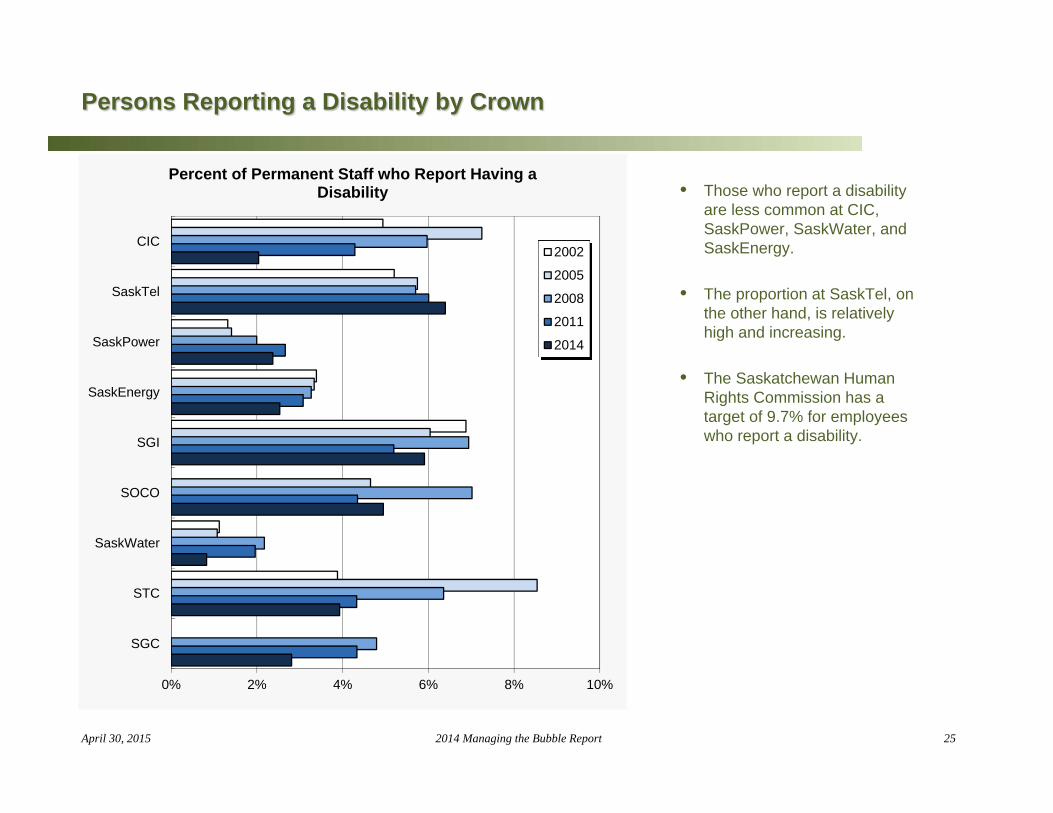
Persons Reporting a Disability by Crown
• Those who report a disability are less common at CIC, SaskPower, SaskWater, and SaskEnergy.
• The proportion at SaskTel, on the other hand, is relatively high and increasing.
• The Saskatchewan Human Rights Commission has a target of 9.7% for employees who report a disability.
25April 30, 2015 2014 Managing the Bubble Report
0% 2% 4% 6% 8% 10%
CIC
SaskTel
SaskPower
SaskEnergy
SGI
SOCO
SaskWater
STC
SGC
Percent of Permanent Staff who Report Having a Disability
2002
2005
2008
2011
2014

Trends in the Proportion of Crown Staff Reporting a Disability
• From 2002 to 2009, there was a gradual but slow upward trend in the proportion of permanent and non-permanent crown staff who report a disability.
• Since then, the trend has reversed and the proportion has declined slightly.
• The decline in 2013 and 2014 is partly because ISC is no longer included in the data. ISC had a relatively large number of employees who reported having a disability.
26April 30, 2015 2014 Managing the Bubble Report
3.0%
3.5%
4.0%
4.5%
5.0%
5.5%
6.0%
2002 2003 2004 2005 2006 2007 2008 2009 2010 2011 2012 2013 2014
Percent of Permanent and Non-Permanent Staff who Report Having a Disability
Total
Excluding SGC & ISC
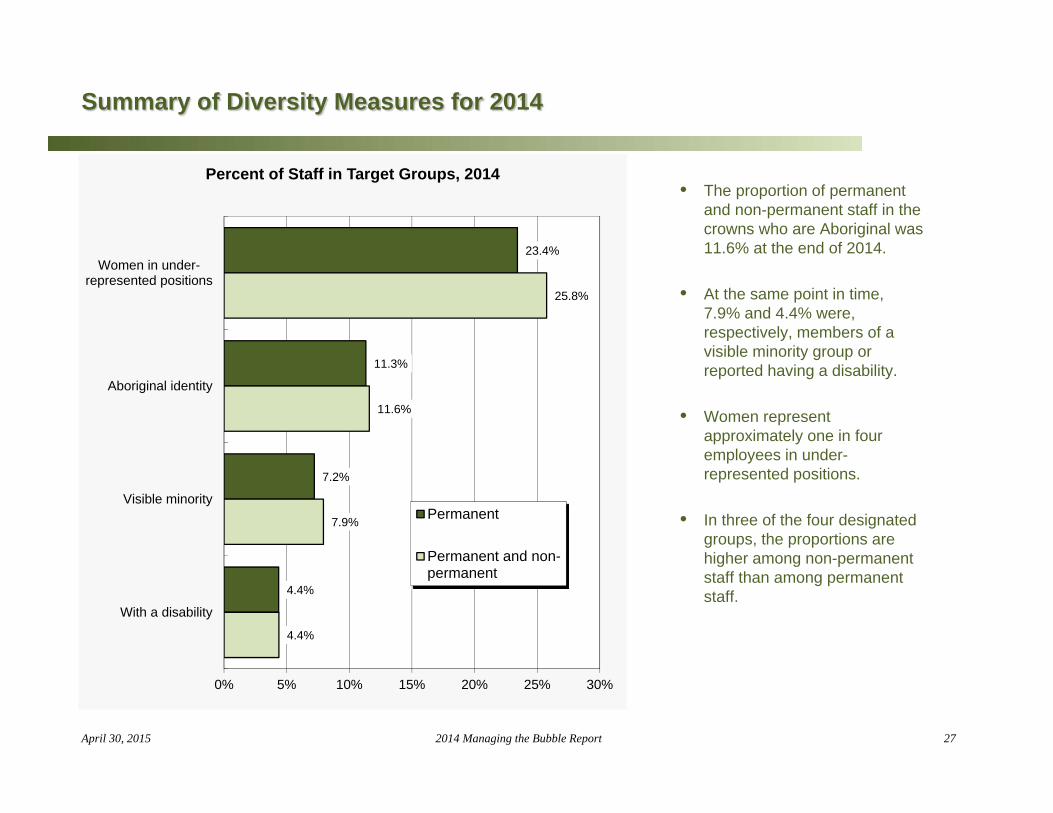
Summary of Diversity Measures for 2014
• The proportion of permanent and non-permanent staff in the crowns who are Aboriginal was 11.6% at the end of 2014.
• At the same point in time, 7.9% and 4.4% were, respectively, members of a visible minority group or reported having a disability.
• Women represent approximately one in four employees in under-represented positions.
• In three of the four designated groups, the proportions are higher among non-permanent staff than among permanent staff.
27April 30, 2015 2014 Managing the Bubble Report
23.4%
11.3%
7.2%
4.4%
25.8%
11.6%
7.9%
4.4%
0% 5% 10% 15% 20% 25% 30%
Women in under-represented positions
Aboriginal identity
Visible minority
With a disability
Percent of Staff in Target Groups, 2014
Permanent
Permanent and non-permanent
Age, Tenure, and Retirements
In many of these statistics about age, tenure, and retirements, SGC is excluded because a) the Crown has only been in existence since 2007 so the staff have abnormally short tenure and b) there are no trends in retirement data.
29April 30, 2015 2014 Managing the Bubble Report
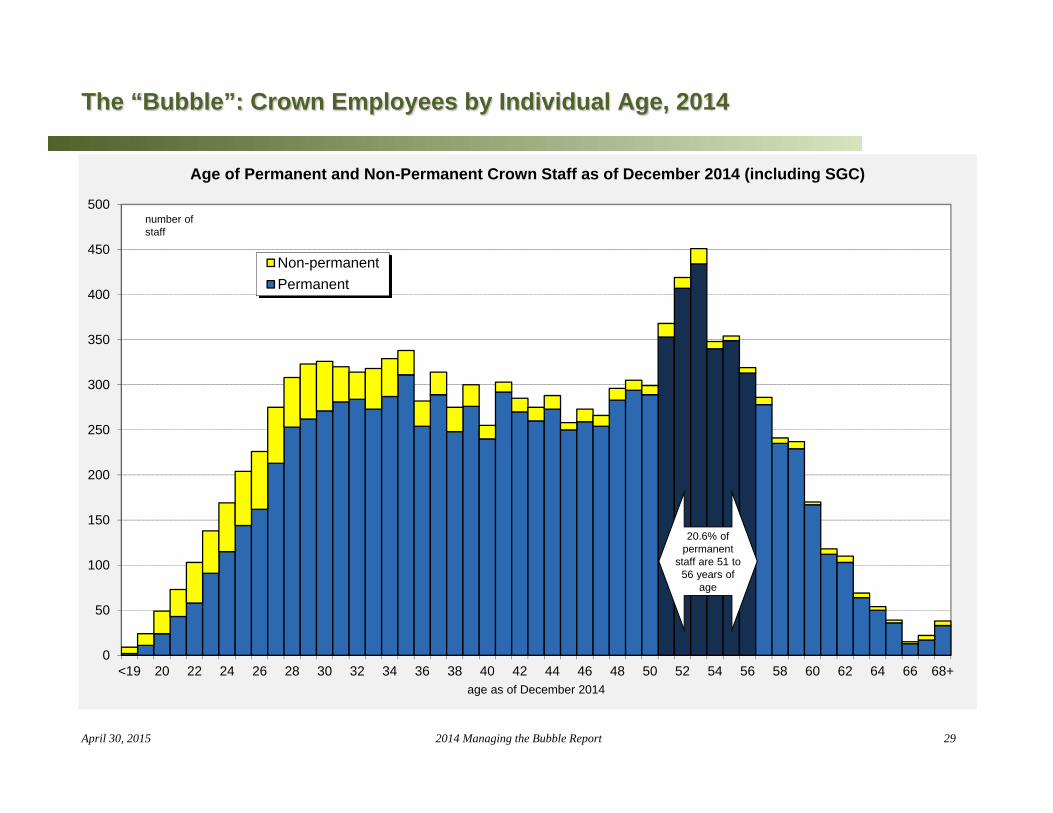
The “Bubble”: Crown Employees by Individual Age, 2014
0
50
100
150
200
250
300
350
400
450
500
<19 20 22 24 26 28 30 32 34 36 38 40 42 44 46 48 50 52 54 56 58 60 62 64 66 68+age as of December 2014
Age of Permanent and Non-Permanent Crown Staff as of December 2014 (including SGC)
Non-permanentPermanent
20.6% of permanent
staff are 51 to 56 years of
age
number of staff

The “Bubble”: Crown Employees Excluding SGC, 2014
30April 30, 2015 2014 Managing the Bubble Report
0
50
100
150
200
250
300
350
400
450
500
<19 20 22 24 26 28 30 32 34 36 38 40 42 44 46 48 50 52 54 56 58 60 62 64 66 68+
age as of December 2014
Age of Permanent and Non-Permanent Crown Staff as of December 2014(excluding SGC)
Non-permanentPermanent
21.3% of permanent
staff are 51 to 56 years of
number of staff

The Bubble Advances
• Over the years from 2004 to 2014, the “bubble” has shifted to the right in the age distribution. The peak has narrowed.
• The general aging of the staff over the years shows as a dramatic decline among those in their forties and a corresponding increase among those in their early fifties.
• That trend is accompanied by a steady increase in the proportion of permanent staff 60 or older.
• The number of permanent staff under 35 is also increasing.
• In 2004, the most common age was 47 to 49 years of age. In 2014, it was 53 years of age.
31April 30, 2015 2014 Managing the Bubble Report
0
100
200
300
400
500
<19 21 24 27 30 33 36 39 42 45 48 51 54 57 60 63 66
Changes in Age Distribution over Time(permanent only, excluding SGC and ISC)
2004
2014

Effect of Crown Sector Human Resource Initiatives
• This chart shows the effect of changes in the age of permanent staff from 2004 to 2014 with the effect of natural aging removed.
• The differences between the lines at older age groups will largely be the result of retirements (including early retirements).
• In younger age groups, the differences are largely from hiring younger staff, net of the relatively high turnover in this age group.
• The net effect of the changes over the period has been to “dampen” the peak which, without interventions, would have led to a very large number of staff in their fifties. Instead, the peak of the “bubble” is at age 53, only a few years older than in 2004.
32April 30, 2015 2014 Managing the Bubble Report
0
100
200
300
400
500
600
<19 21 24 27 30 33 36 39 42 45 48 51 54 57 60 63 66
Effect of Retirement and non-Retirement Turnover, "Managing the Bubble" Initiatives, and New Hirings on the Ages for Permanent Crown Employees (excluding ISC and
SGC)
2004 ten years laterwith no change actual
2014
net effectof retirements
net effectof new
hirings andturnover
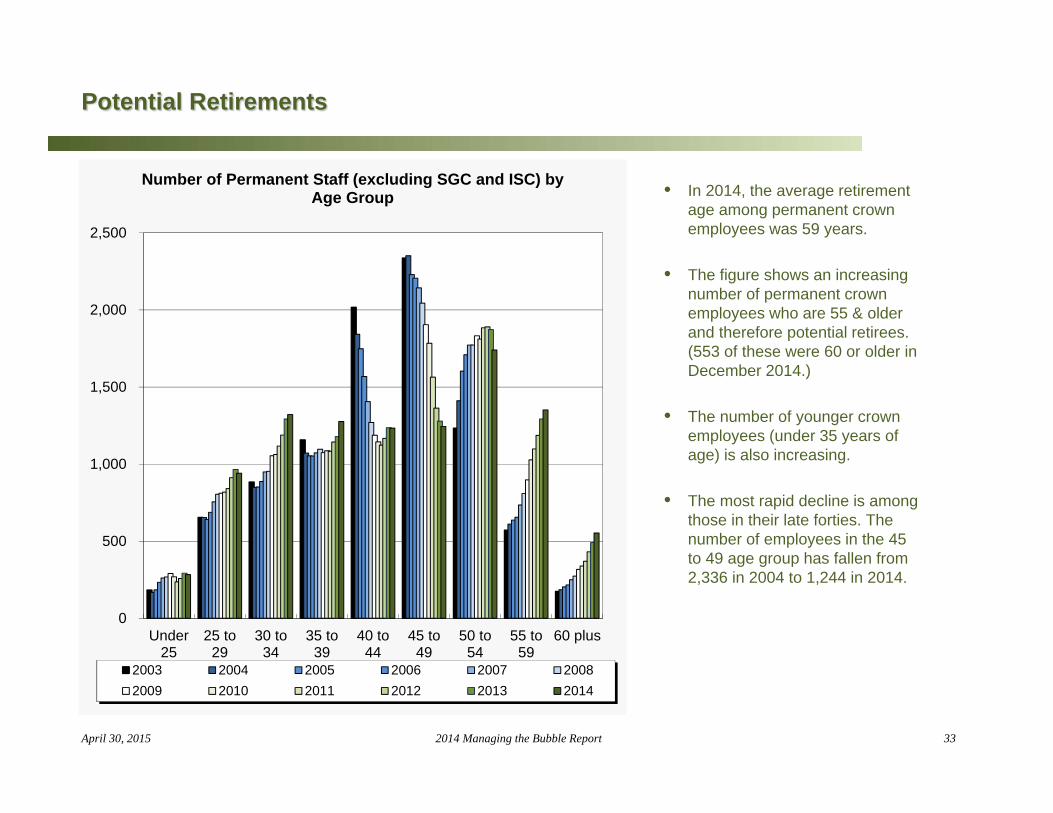
Potential Retirements
• In 2014, the average retirement age among permanent crown employees was 59 years.
• The figure shows an increasing number of permanent crown employees who are 55 & older and therefore potential retirees. (553 of these were 60 or older in December 2014.)
• The number of younger crown employees (under 35 years of age) is also increasing.
• The most rapid decline is among those in their late forties. The number of employees in the 45 to 49 age group has fallen from 2,336 in 2004 to 1,244 in 2014.
33April 30, 2015 2014 Managing the Bubble Report
0
500
1,000
1,500
2,000
2,500
Under25
25 to29
30 to34
35 to39
40 to44
45 to49
50 to54
55 to59
60 plus
Number of Permanent Staff (excluding SGC and ISC) by Age Group
2003 2004 2005 2006 2007 20082009 2010 2011 2012 2013 2014

Changes in the Age of Crown Employees
• This is another view of the same trend, showing that the number of staff in the 30 to 49 age group declined steadily from 2004 to 2012 before starting to increase in 2013.
• Over the same period, the number 50 & older grew steadily before levelling off in 2014.
34April 30, 2015 2014 Managing the Bubble Report
0
1,000
2,000
3,000
4,000
5,000
6,000
7,000
2003 2004 2005 2006 2007 2008 2009 2010 2011 2012 2013 2014
Employment by Age Group, Permanent Staff Only, Excluding SGC and ISC
Under 30 years
30 to 49 years
50 & older

Age by Crown Corporation, 2014 (Permanent Staff Only)
• The proportion of permanent staff who are 55 or older is highest at STC.
• The proportion of staff who are under 30 years of age is highest at SGC and lowest at CIC and SaskTel.
• At least part of the reason for the relatively small number of young people at SaskTel and CIC will be the lack of growth in those crowns in recent years.
• Those in the pre-retirement age group (45 to 54) are most common at CIC, SaskTel and STC and least common at SGC, SaskPower, and SaskWater.
35April 30, 2015 2014 Managing the Bubble Report
8%
7%
16%
14%
13%
15%
10%
16%
22%
13%
33%
37%
41%
39%
37%
41%
46%
27%
39%
39%
42%
35%
26%
29%
29%
31%
27%
33%
25%
30%
17%
20%
17%
18%
21%
12%
17%
24%
13%
19%
0% 20% 40% 60% 80% 100%
CIC
SaskTel
SaskPower
SaskEnergy
SGI
SOCO
SaskWater
STC
SGC
All crowns
Permanent Staff by Age Group and Crown, 2014
Under 30 30 to 44 45 to 54 55 or older

Comparison with Saskatchewan
• Compared with all those employed in Saskatchewan, the crowns have fewer staff in the 55 and older age group –18% compared with 21% – but there is a similar upward trend as in the province as a whole.
• The crowns employ far fewer young people – 16% compared with 27% in the province as a whole. Note that the provincial figures for this age group will include a large number of students working part-time.
36April 30, 2015 2014 Managing the Bubble Report
0%
5%
10%
15%
20%
25%
30%
35%
2002 2003 2004 2005 2006 2007* 2008 2009 2010 2011 2012 2013** 2014
Employment by Age GroupCrown Corporations (permanent and non-permanent as of Dec)
vis-à-vis Saskatchewan (off Reserve only, annual averages)
Crowns (15 to 29 years) Sask (15 to 29)Crowns (55 plus) Sask (55 plus)
as a percent of totalemployment
* SGC added ** ISC excluded

Tenure (years with the same crown)
• Average tenure among permanent staff is gradually stabilizing after declining in the mid 2000s.
• Including SGC, the average tenure in 2014 was 14.0 years compared with 16.7 years in 2004.
37April 30, 2015 2014 Managing the Bubble Report
19%
15%
14%
15%
18%
23%
26%
27%
26%
24%
24%
24%
25%
17%
19%
18%
19%
20%
18%
15%
14%
15%
17%
19%
21%
22%
22%
23%
24%
23%
22%
24%
25%
26%
26%
27%
27%
25%
24%
42%
43%
44%
43%
40%
35%
33%
33%
33%
32%
30%
29%
29%
0% 20% 40% 60% 80% 100%
2002
2003
2004
2005
2006
2007*
2008
2009
2010
2011
2012
2013**
2014
Tenure (years with the same crown) for Permanent Staff
Less than 5 years 5 to 9 10 to 19 20 or more* SGC added ** ISC excluded
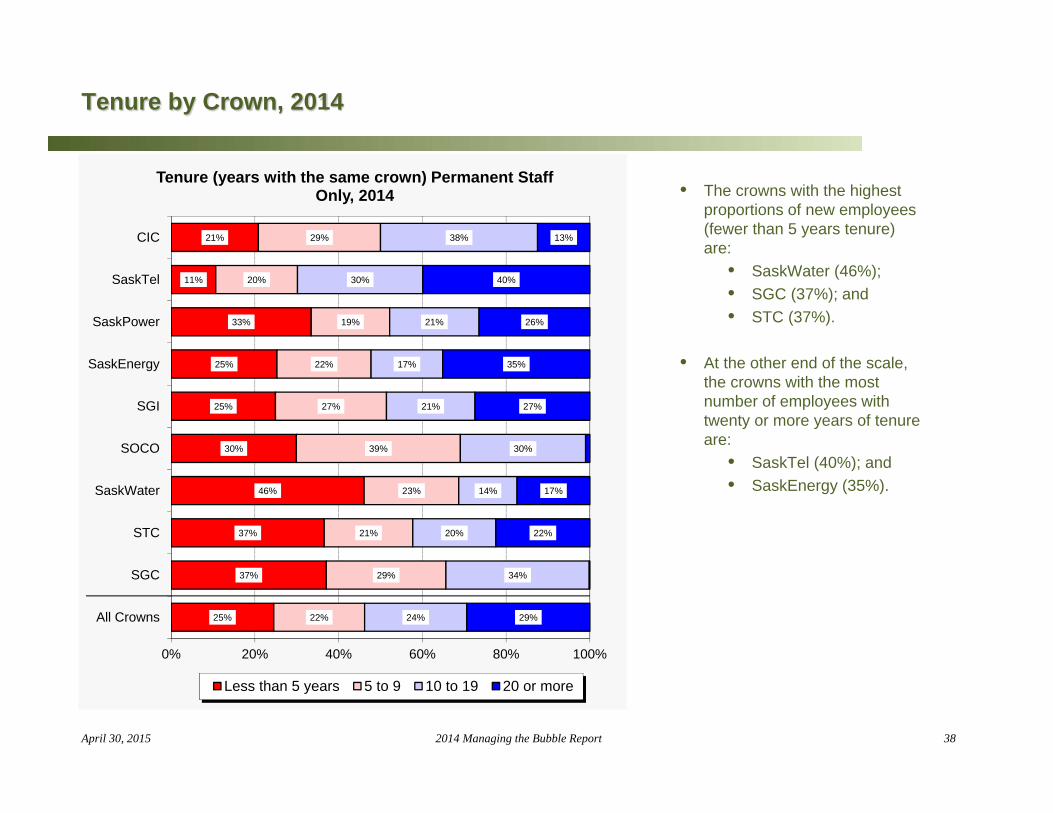
Tenure by Crown, 2014
• The crowns with the highest proportions of new employees (fewer than 5 years tenure) are:
• SaskWater (46%);• SGC (37%); and• STC (37%).
• At the other end of the scale, the crowns with the most number of employees with twenty or more years of tenure are:
• SaskTel (40%); and• SaskEnergy (35%).
38April 30, 2015 2014 Managing the Bubble Report
21%
11%
33%
25%
25%
30%
46%
37%
37%
25%
29%
20%
19%
22%
27%
39%
23%
21%
29%
22%
38%
30%
21%
17%
21%
30%
14%
20%
34%
24%
13%
40%
26%
35%
27%
17%
22%
29%
0% 20% 40% 60% 80% 100%
CIC
SaskTel
SaskPower
SaskEnergy
SGI
SOCO
SaskWater
STC
SGC
All Crowns
Tenure (years with the same crown) Permanent Staff Only, 2014
Less than 5 years 5 to 9 10 to 19 20 or more

Tenure Comparison with Saskatchewan
• The percentage of persons who have been with their current employer for less than five years is over 50% in Saskatchewan.
• This compares with 24% in the crowns.
39April 30, 2015 2014 Managing the Bubble Report
0%
10%
20%
30%
40%
50%
60%
2002 2003 2004 2005 2006 2007* 2008 2009 2010 2011 2012 2013** 2014
Employment by TenureCrown Corporations (permanent and non-permanent as of Dec)Relative to Saskatchewan (off Reserve only, annual averages)
Saskatchewan
Crowns
percent with current employerless than five years
* SGC added ** ISC excluded

Eligibility for Retirement
• Retirement eligibility is defined as the earliest year in which the permanent staff member can retire without penalty.
• Most staff will work well beyond this date because, with the defined-contribution pension plans, this is just the year they turn fifty years of age. Eligibility for retirement may however, affect the employee’s sense of attachment to their employer.
• As of 2014, more than one half of the permanent staff could retire by 2020.
40April 30, 2015 2014 Managing the Bubble Report
35.6%
7.8% 7.3% 7.7% 7.2% 8.0%
26.3%
0%
5%
10%
15%
20%
25%
30%
35%
40%
Alreadyeligible
2015-2017
2018-2020
2021-2023
2024-2026
2027-2029
2030 orlater
Eligibility for Retirement among Permanent Staff

Retirement Eligibility by Crown
• The proportion of staff who are already eligible or soon will be eligible to retire is noticeably lower at SOCO and SGC.
• All of the other crowns are equally at risk of a large number of staff choosing to retire in the short term.
41April 30, 2015 2014 Managing the Bubble Report
56%
51%
38%
43%
45%
23%
37%
53%
30%
43%
0% 10% 20% 30% 40% 50% 60%
CIC
SaskTel
SaskPower
SaskEnergy
SGI
SOCO
SaskWater
STC
SGC
All Crowns
Percent of Permanent Staff Eligible to Retire by 2017

Characteristics of Positions
• Scope• Salary• Location• Occupation and Skill Level

Union Membership
• Although some have very few members, seven different unions are represented among staff in the commercial crowns.
• UNIFOR represents the largest proportion of staff; 38.7% of the permanent and non-permanent crown staff are UNIFOR members.
43April 30, 2015 2014 Managing the Bubble Report
ATU186
1.6%
UNIFOR (formerly CEP)4,559 38.7%
COPE1,661 14.1%
IATSE35
0.3%
IBEW1,721 14.6%
OS3,037 25.8%
PSAC308
2.6%
RWDSU271
2.3%
Union Membership Among Permanent and Non-Permanent Employees, 2014

Trends in Union Membership
• The proportion of crown staff who are in scope has declined slightly over the years. (Note that the vertical scale is compressed in the figure.)
• In 2014, union employees represented 72% of permanent staff compared with 77% in 2004.
• Excluding SGC and ISC has little effect on this statistic.
44April 30, 2015 2014 Managing the Bubble Report
65%
67%
69%
71%
73%
75%
77%
79%
81%
83%
85%
2002 2003 2004 2005 2006 2007* 2008 2009 2010 2011 20122013**2014
Trends in Union Membership (Permanent Staff Only)
All Crowns
Excluding SGC & ISC
in-scope membershipas % of total

Union Membership by Crown
• Not counting CIC or SOCO, in-scope staff are the least common at SaskWater and SaskPower. They are the most common at STC and SGI.
• The gradual downward trend in union membership is evident in most of the crowns.
45April 30, 2015 2014 Managing the Bubble Report
0%
0%
0% 10% 20% 30% 40% 50% 60% 70% 80% 90% 100%
CIC
SaskTel
SaskPower
SaskEnergy
SGI
SOCO
SaskWater
STC
SGC
Percent of Permanent Staff who are Union Members
2002
2005
2008
2011
2014

Comparison with Saskatchewan
• In Saskatchewan as a whole, about 33% of paid workers (i.e. excluding the self-employed) are covered by a collective agreement.
• This compares with 74% at the crowns.
46April 30, 2015 2014 Managing the Bubble Report
0%
10%
20%
30%
40%
50%
60%
70%
80%
90%
2002 2003 2004 2005 2006 2007* 2008 2009 2010 2011 2012 2013** 2014
Employment by Union MembershipCrown Corporations (permanent and non-permanent as of Dec)
vis-à-vis Saskatchewan (off Reserve only, annual averages, excluding the self-employed)
Crowns
Saskatchewan
percent covered by a collective agreement
* SGC added ** ISC excluded
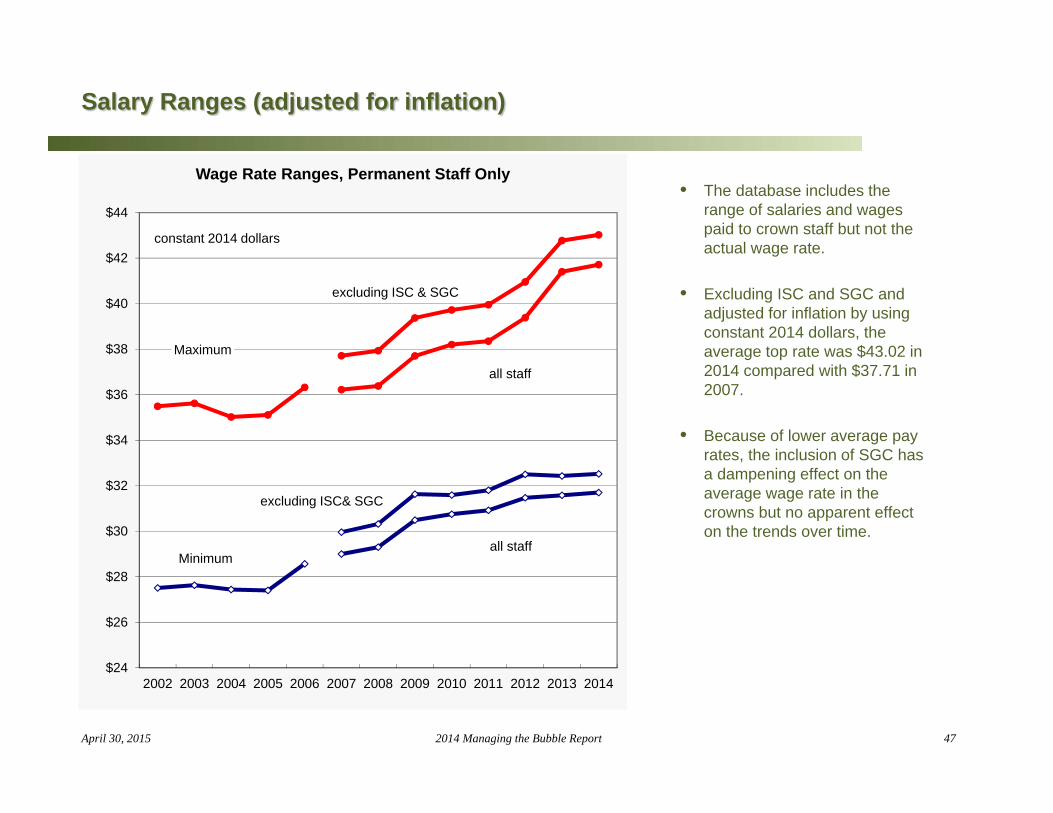
Salary Ranges (adjusted for inflation)
• The database includes the range of salaries and wages paid to crown staff but not the actual wage rate.
• Excluding ISC and SGC and adjusted for inflation by using constant 2014 dollars, the average top rate was $43.02 in 2014 compared with $37.71 in 2007.
• Because of lower average pay rates, the inclusion of SGC has a dampening effect on the average wage rate in the crowns but no apparent effect on the trends over time.
47April 30, 2015 2014 Managing the Bubble Report
$24
$26
$28
$30
$32
$34
$36
$38
$40
$42
$44
2002 2003 2004 2005 2006 2007 2008 2009 2010 2011 2012 2013 2014
Wage Rate Ranges, Permanent Staff Only
Minimum
Maximum
constant 2014 dollars
excluding ISC & SGC
excluding ISC& SGC
all staff
all staff

Salary Ranges (constant 2014 dollars, permanent staff only)
• The increase in the top rate over the past two years is because of a significant increase in the proportion of permanent staff with rates above $40/hour. As a percentage of the total this group has increased from 38% of staff in 2012 to 42% in 2014.
• At the other end of the scale, 22% have a top rate of less than $30.00 (including SGC), the same as in 2012.
48April 30, 2015 2014 Managing the Bubble Report
11%
9%
12%
12%
11%
14%
14%
11%
11%
11%
9%
9%
9%
22%
21%
19%
23%
16%
17%
18%
13%
15%
15%
13%
10%
13%
16%
18%
31%
23%
30%
17%
16%
18%
17%
17%
19%
18%
12%
28%
28%
16%
21%
12%
21%
19%
22%
20%
21%
22%
23%
23%
23%
24%
22%
21%
32%
30%
33%
35%
36%
36%
38%
41%
42%
0% 20% 40% 60% 80% 100%
2002
2003
2004
2005
2006
2007*
2008
2009
2010
2011
2012
2013**
2014
Top Rate of Pay Range, Permanent Staff Only, Constant 2014 Dollars
Under $25 $25 - $29.99 $30 - $34.99 $35 - $39.99 $40 or more
* SGC added ** ISC excluded

Salaries by Crown in 2014
• As of 2014, the average top rate was highest at CIC and SaskPower and lowest at SGC.
49April 30, 2015 2014 Managing the Bubble Report
$54.90
$40.12
$51.01
$40.72
$36.46
$39.34
$42.65
$31.07
$23.43
$41.71
$10 $15 $20 $25 $30 $35 $40 $45 $50 $55 $60 $65
CIC
SaskTel
SaskPower
SaskEnergy
SGI
SOCO
SaskWater
STC
SGC
All Crowns
Average of Top Rates, Permanent Employees Only, 2014

Growth in Salary Ranges by Crown, Permanent Employees Only
• From 2004 to 2014, and adjusted for inflation, the increase in the top rate has been well above the 1.8% average at:
• SaskPower;• STC; and• SaskWater.
• The increases have been lower at:
• SOCO;• CIC; and• SaskTel.
• Note that increases in the average wage rate can occur if:
• there is a general wage rate increase;
• if the number of low-paying positions is reduced; or
• if the number of high-paying positions increases.
50April 30, 2015 2014 Managing the Bubble Report
0.7%
1.2%
3.5%
1.4%
1.4%
0.6%
2.1%
2.4%
1.7%
1.8%
2.8%
3.3%
5.7%
3.5%
3.5%
2.7%
4.3%
4.5%
3.8%
3.9%
0% 1% 2% 3% 4% 5% 6%
CIC
SaskTel
SaskPower
SaskEnergy
SGI
SOCO
SaskWater
STC
SGC (2007 to 2014)
All Crowns (incl SGC& ISC)
Average Annual Increase in Top Rates, Permanent Employees Only, 2004 to 2014
Adjusted for Inflation Nominal
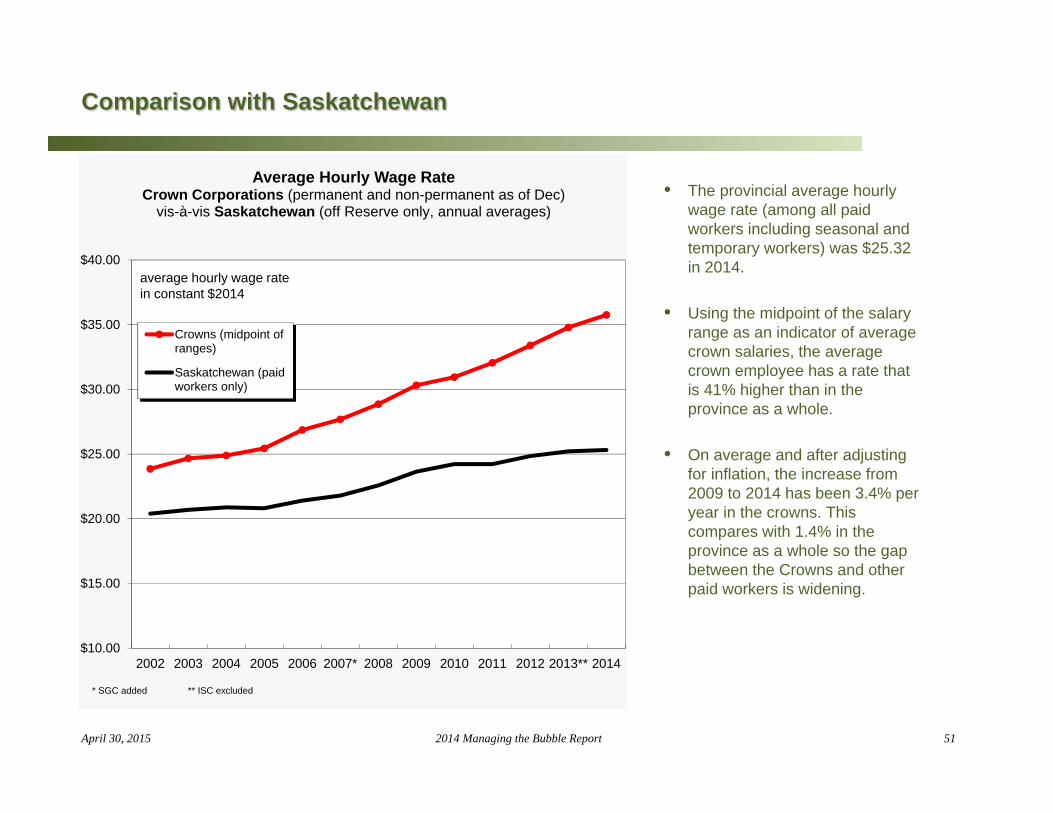
Comparison with Saskatchewan
• The provincial average hourly wage rate (among all paid workers including seasonal and temporary workers) was $25.32 in 2014.
• Using the midpoint of the salary range as an indicator of average crown salaries, the average crown employee has a rate that is 41% higher than in the province as a whole.
• On average and after adjusting for inflation, the increase from 2009 to 2014 has been 3.4% per year in the crowns. This compares with 1.4% in the province as a whole so the gap between the Crowns and other paid workers is widening.
51April 30, 2015 2014 Managing the Bubble Report
$10.00
$15.00
$20.00
$25.00
$30.00
$35.00
$40.00
2002 2003 2004 2005 2006 2007* 2008 2009 2010 2011 2012 2013** 2014
Average Hourly Wage RateCrown Corporations (permanent and non-permanent as of Dec)
vis-à-vis Saskatchewan (off Reserve only, annual averages)
Crowns (midpoint ofranges)
Saskatchewan (paidworkers only)
average hourly wage ratein constant $2014
* SGC added ** ISC excluded

Workplace Location
• In 2014, 57.1% of permanent and non-permanent staff worked in Regina and three-quarters worked in either Regina or Saskatoon.
• Another 18.0% worked in larger communities such as Moose Jaw, Estevan, and Swift Current. The remaining 7.7% of staff worked in the North, a smaller community or out of province.
52April 30, 2015 2014 Managing the Bubble Report
Regina6,724 57.1%
Saskatoon2,021 17.2%
Prince Albert306
2.6%
Moose Jaw345
2.9%
Estevan580
4.9%
Other cities*894
7.6%
North68
0.6%
Other836
7.1%
Employment of Permanent and Non-Permanent Staff by Location, 2014
* Yorkton, Melville, Swift Current, Meadow Lake, Melfort, North Battleford, Weyburn, Lloydminster, Humboldt

Nipawin
La Ronge
Watrous
Biggar
Unity
Tisdale Hudson Bay
Saskatoon
Melfort
Prince AlbertLloydminster
North Battleford
Meadow Lake
Humboldt
Permanent and Non-Permanent Staff100 or more
20 to 995 to 191 to 4
None
Workplace Location - North
The map aggregates data into Rural Municipalities with the far North considered as a single “RM”. The shading represents all of the locations (towns, villages, Reserves, etc.) in the RM.
At least one crown employee works in 71 of the province’s RMs. They are a significant presence (20 or more staff) in 20 RMs and in the Far North.
53April 30, 2015 2014 Managing the Bubble Report

Workplace Location - South
54April 30, 2015 2014 Managing the Bubble Report
Watrous
Moosomin
AssiniboiaShaunavon
Maple Creek
Rosetown
Biggar
Unity
Kindersley
Carlyle
Coronach
Swift Current
Yorkton
Moose Jaw
Melville
Estevan
Regina
Weyburn
SaskatoonHumboldt
Permanent and Non-Permanent Staff100 or more
20 to 995 to 191 to 4
None

Workplace Location by Crown
• CIC and SOCO employees work exclusively in Regina and Saskatoon. Most of the other crowns have at least 80% of their permanent staff in either city. The exceptions are SaskPower, SaskEnergy and SaskWater.
• SaskWater and SaskPower have the largest proportion of staff outside the two major centres – the former because of the head office in Moose Jaw and the latter because of the large number of employees in Estevan and Coronach.
55April 30, 2015 2014 Managing the Bubble Report
84%
57%
69%
82%
28%
91%
86%
74%
0% 20% 40% 60% 80% 100%
CIC
SaskTel
SaskPower
SaskEnergy
SGI
SOCO
SaskWater
STC
SGC
All Crowns
Percentage where the Place of Work is Regina or Saskatoon, Permanent and Non-Permanent Employees,
2014

Sample Occupations by NOC Skill Level
• Each of the permanent positions in the crowns has been assigned a 4-digit NOC (National Occupational Classification) code for purposes of analysis and for comparisons across crowns.
• Most of the NOC coding was done by the crowns but some codes were assigned as part of the bubble research. The latter will be less accurate than the former.
• The NOC coding enables a classification of occupations into four skill levels plus management.
• Management occupations are not assigned a skill level.
• Positions in skill level A typically require a university degree.
• Positions in skill level B typically require a post-secondary certificate or diploma including a trades certificate. Supervisory positions are also classified as skill level B.
• Intermediate positions (level C) typically require a grade 12 certificate and some on-the-job training.
• Positions in skill level D can typically be done with a short on-the-job training period.
56April 30, 2015 2014 Managing the Bubble Report
Skill Level NOC and Occupation Title CountManagerial 0912 Utilities managers 200
0124 Advertising, marketing and public relations managers 1070111 Financial managers 1000213 Computer and information systems managers 900112 Human resources managers 710211 Engineering managers 710711 Construction managers 660131 Telecommunication carriers managers 650601 Corporate sales managers 48
A: Professional (universitydegree)
2171 Information systems analysts and consultants 4592133 Electrical and electronics engineers 1941121 Human resources professionals 1391111 Financial auditors and accountants 1285121 Authors and writers 901112 Financial and investment analysts 692131 Civil engineers 602172 Database analysts and data administrators 43
B: Technical(post-sec) &supervisory
7246 Telecommunications installation and repair workers 5367244 Electrical power line and cable workers 3661312 Insurance adjusters and claims examiners 3629241 Power engineers and power systems operators 2387253 Gas fitters 2112282 User support technicians 2031241 Administrative assistants 1321313 Insurance underwriters 1277311 Construction millwrights and industrial mechanics 1217243 Power system electricians 109
C: Intermediate 1411 General office support workers 4156533 Casino occupations 1531431 Accounting and related clerks 1246541 Security guards and related security service occupations 82
6513 Food and beverage servers 79D: Labour &elemental
6611 Cashiers 668612 Landscaping and grounds maintenance labourers 5

Occupation and Skill Level
• More than three-quarters (79%) of crown positions require a post-secondary education.
• The incorporation of SGC in 2007 added about 250 lower-skilled (skill level D) positions to the permanent staff in the crowns.
• The increase in managerial staff and the decline in the number of staff in Skill Level B in 2014 is probably the result of the switch from the 2006 version to the 2011 version of the NOC codes.
57April 30, 2015 2014 Managing the Bubble Report
0% 10% 20% 30% 40% 50% 60%
Managerial
A: Professional (univdegree)
B: Technical (post-sec) & supervisory
C: Intermediate
D: Labour &elemental
Percent of Permanent Staff by NOC Skill Level
2002
2005
2008
2011
2014
* SGC not included in 2002 and 2005 ISC excluded in 2014 but included in earlier years

Skill Level by Crown
• The crowns with the highest proportion of positions that require a post-secondary education (including managers) are:
• CIC (90%); • SaskTel (94%); and• SaskWater (88%).
• Skill level B positions (those that typically require a non-university post-secondary education) are the most common at SaskWater (53%), and SaskTel (54%).
• SOCO and SGC are the only crowns with a significant number of positions (7% and 10% respectively) that normally require less than grade 12, that is, skill level D positions.
58April 30, 2015 2014 Managing the Bubble Report
31%
21%
12%
14%
10%
21%
22%
13%
5%
14%
29%
19%
23%
12%
18%
11%
13%
5%
18%
29%
54%
48%
44%
44%
47%
53%
15%
21%
46%
10%
6%
16%
28%
29%
13%
12%
65%
60%
20%
7%
10%
0% 20% 40% 60% 80% 100%
CIC
SaskTel
SaskPower
SaskEnergy
SGI
SOCO
SaskWater
STC
SGC
All Crowns
NOC Skill Level for Permanent Employees, 2014
Managerial A: Professional (univ degree)
B: Technical (post-sec) & supervisory C: Intermediate
D: Labour & elemental

Age and Tenure by Skill Level
• Not surprisingly, the highest average ages and the longest tenures are among those employees in management positions. The differences are not, however, dramatic.
• At the other end of the scale, the professional (skill level A) group tends to be younger and have a lower tenure.
59April 30, 2015 2014 Managing the Bubble Report
47
41
44
43
43
43
18
11
15
12
7
14
0 10 20 30 40 50
Managerial
A: Professional (univdegree)
B: Technical (post-sec) & supervisory
C: Intermediate
D: Labour &elemental
All permanent staff
Average Age and Tenure by NOC Skill Level for Permanent Employees, 2014
Average age Average tenure (years)

Skill Level by Gender
• Women in the crowns:• are over-represented in
occupations classified as intermediate;
• account for near one half in professional occupations requiring a university degree; and
• are under-represented in management and technical skill-level occupations.
• The proportion of women in management positions has increased somewhat but the proportion in positions classified as requiring a university degree has declined.
• The addition of SGC has significantly increased the proportion of women in low-skill occupations.
60April 30, 2015 2014 Managing the Bubble Report
0% 10% 20% 30% 40% 50% 60% 70% 80% 90%
Managerial
A: Professional (univdegree)
B: Technical (post-sec) & supervisory
C: Intermediate
D: Labour &elemental
Percent of Permanent and Non-Permanent Staff who are Women, by NOC Skill Level
2002
2005
2008
2011
2014
• SGC not included in 2002 and 2005 ISC excluded in 2014 but included in earlier years
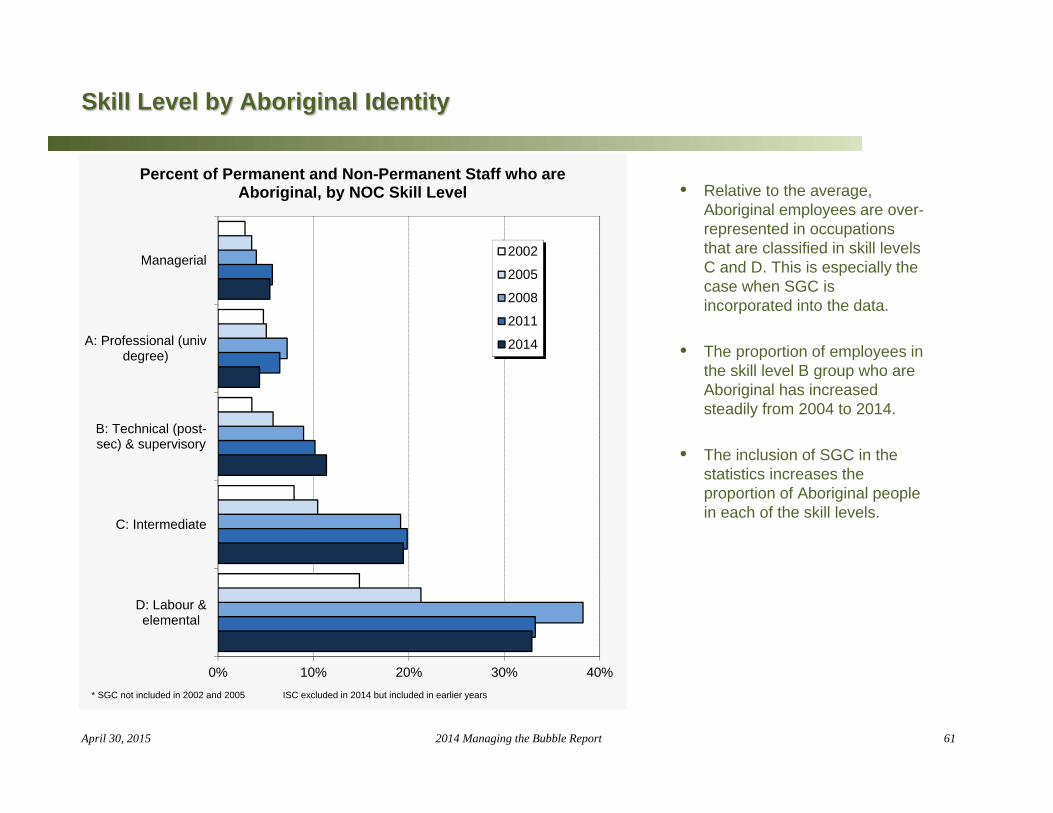
Skill Level by Aboriginal Identity
• Relative to the average, Aboriginal employees are over-represented in occupations that are classified in skill levels C and D. This is especially the case when SGC is incorporated into the data.
• The proportion of employees in the skill level B group who are Aboriginal has increased steadily from 2004 to 2014.
• The inclusion of SGC in the statistics increases the proportion of Aboriginal people in each of the skill levels.
61April 30, 2015 2014 Managing the Bubble Report
0% 10% 20% 30% 40%
Managerial
A: Professional (univdegree)
B: Technical (post-sec) & supervisory
C: Intermediate
D: Labour &elemental
Percent of Permanent and Non-Permanent Staff who are Aboriginal, by NOC Skill Level
2002
2005
2008
2011
2014
* SGC not included in 2002 and 2005 ISC excluded in 2014 but included in earlier years

Skill Level by Aboriginal Identity
• This is another view of the skill levels for Aboriginal employees in 2014.
• More than four out of five (82%) of the 1,334 permanent and non-permanent Aboriginal employees are in either skill level B or skill level C.
• Relatively few are in Managerial and skill level A positions. There are also relatively few in skill level D positions because those low-skill occupations are, except for SGC, rare in the crowns.
62April 30, 2015 2014 Managing the Bubble Report
Managerial836%
A: Professional (univ degree)
867%
B: Technical (post-sec) & supervisory
45243%
C: Intermediate46735%
D: Labour & elemental
725%
Skill Levels for Permanent and Non-Permanent Aboriginal Staff in the Crowns, 2014

Skill Level by Membership in a Visible Minority Group
• Since 2002, there have been increases in the proportion of crown employees who are members of a visible minority group in each of the skill level groups.
• Relative to the average, members of a visible minority group are over-represented in professional occupations and low-skill occupations.
63April 30, 2015 2014 Managing the Bubble Report
0% 2% 4% 6% 8% 10% 12% 14% 16%
Managerial
A: Professional (univdegree)
B: Technical (post-sec) & supervisory
C: Intermediate
D: Labour &elemental
Percent of Permanent and Non-Permanent Staff who are Members of a Visible Minority Group, by NOC Skill Level
2002
2005
2008
2011
2014
* SGC not included in 2002 or 2005 ISC excluded in 2014 but included in earlier years

Persons Reporting a Disability, by Skill Level
• The proportion of staff in each of the skill levels who report a disability has been relatively stable over the past ten years.
64April 30, 2015 2014 Managing the Bubble Report
0% 2% 4% 6% 8% 10%
Managerial
A: Professional (univdegree)
B: Technical (post-sec) & supervisory
C: Intermediate
D: Labour &elemental
Percent of Permanent and Non-Permanent Staff who Report a Disability, by NOC Skill Level
2002
2005
2008
2011
2014
* SGC not included in 2002 or 2005 ISC excluded in 2014 but included in earlier years
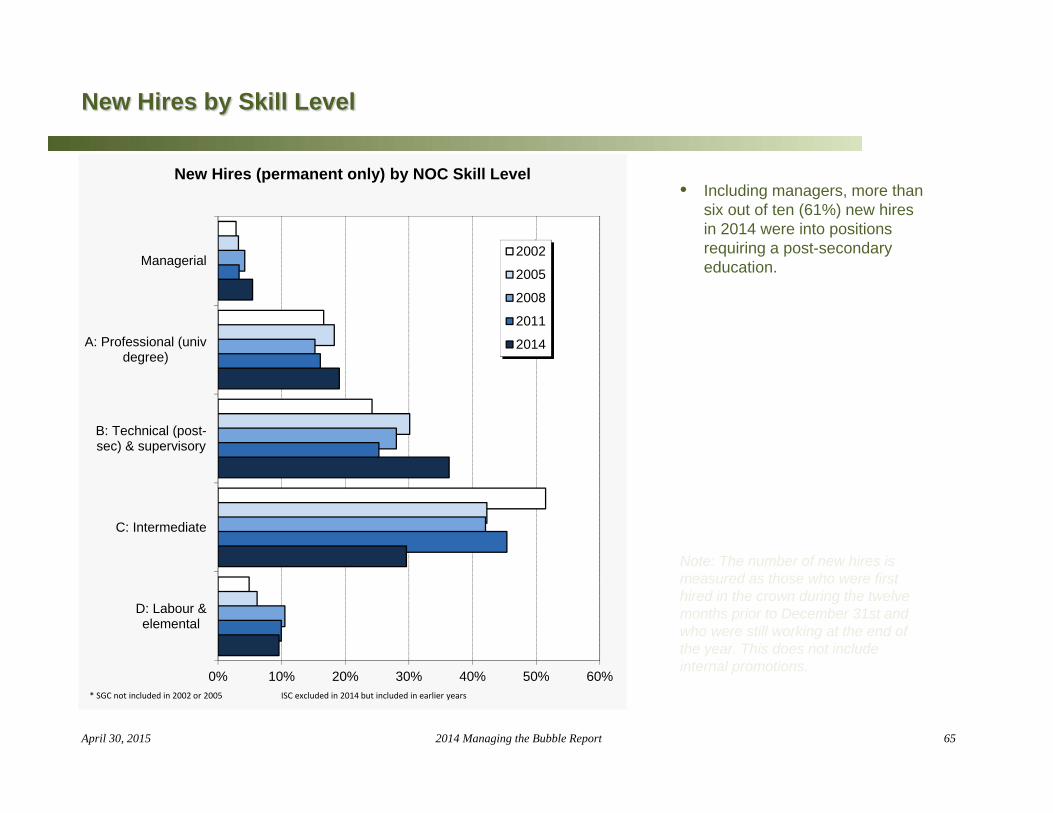
New Hires by Skill Level
• Including managers, more than six out of ten (61%) new hires in 2014 were into positions requiring a post-secondary education.
Note: The number of new hires is measured as those who were first hired in the crown during the twelve months prior to December 31st and who were still working at the end of the year. This does not include internal promotions.
65April 30, 2015 2014 Managing the Bubble Report
0% 10% 20% 30% 40% 50% 60%
Managerial
A: Professional (univdegree)
B: Technical (post-sec) & supervisory
C: Intermediate
D: Labour &elemental
New Hires (permanent only) by NOC Skill Level
2002
2005
2008
2011
2014
* SGC not included in 2002 or 2005 ISC excluded in 2014 but included in earlier years

Departures and Turnover
Number of Departures by Reason
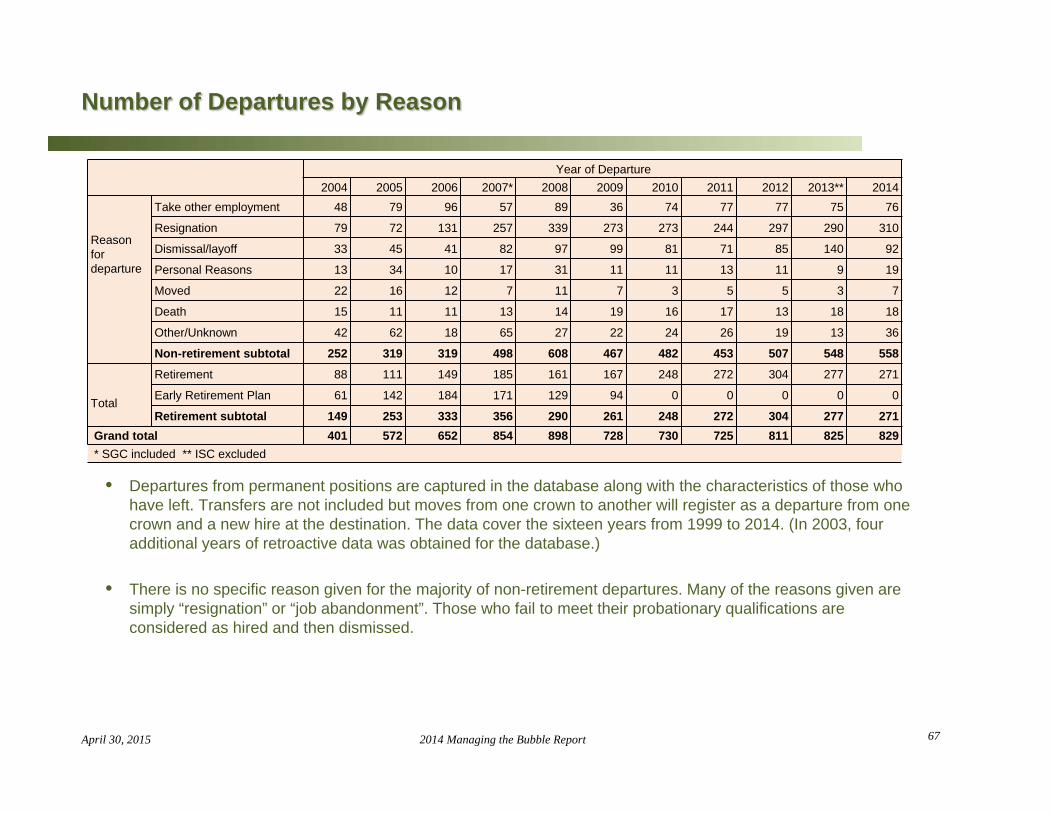
• Departures from permanent positions are captured in the database along with the characteristics of those who have left. Transfers are not included but moves from one crown to another will register as a departure from one crown and a new hire at the destination. The data cover the sixteen years from 1999 to 2014. (In 2003, four additional years of retroactive data was obtained for the database.)
• There is no specific reason given for the majority of non-retirement departures. Many of the reasons given are simply “resignation” or “job abandonment”. Those who fail to meet their probationary qualifications are considered as hired and then dismissed.
67April 30, 2015 2014 Managing the Bubble Report
Year of Departure 2004 2005 2006 2007* 2008 2009 2010 2011 2012 2013** 2014
Reason fordeparture
Take other employment 48 79 96 57 89 36 74 77 77 75 76
Resignation 79 72 131 257 339 273 273 244 297 290 310
Dismissal/layoff 33 45 41 82 97 99 81 71 85 140 92
Personal Reasons 13 34 10 17 31 11 11 13 11 9 19
Moved 22 16 12 7 11 7 3 5 5 3 7
Death 15 11 11 13 14 19 16 17 13 18 18
Other/Unknown 42 62 18 65 27 22 24 26 19 13 36
Non-retirement subtotal 252 319 319 498 608 467 482 453 507 548 558
Total
Retirement 88 111 149 185 161 167 248 272 304 277 271
Early Retirement Plan 61 142 184 171 129 94 0 0 0 0 0
Retirement subtotal 149 253 333 356 290 261 248 272 304 277 271Grand total 401 572 652 854 898 728 730 725 811 825 829* SGC included ** ISC excluded
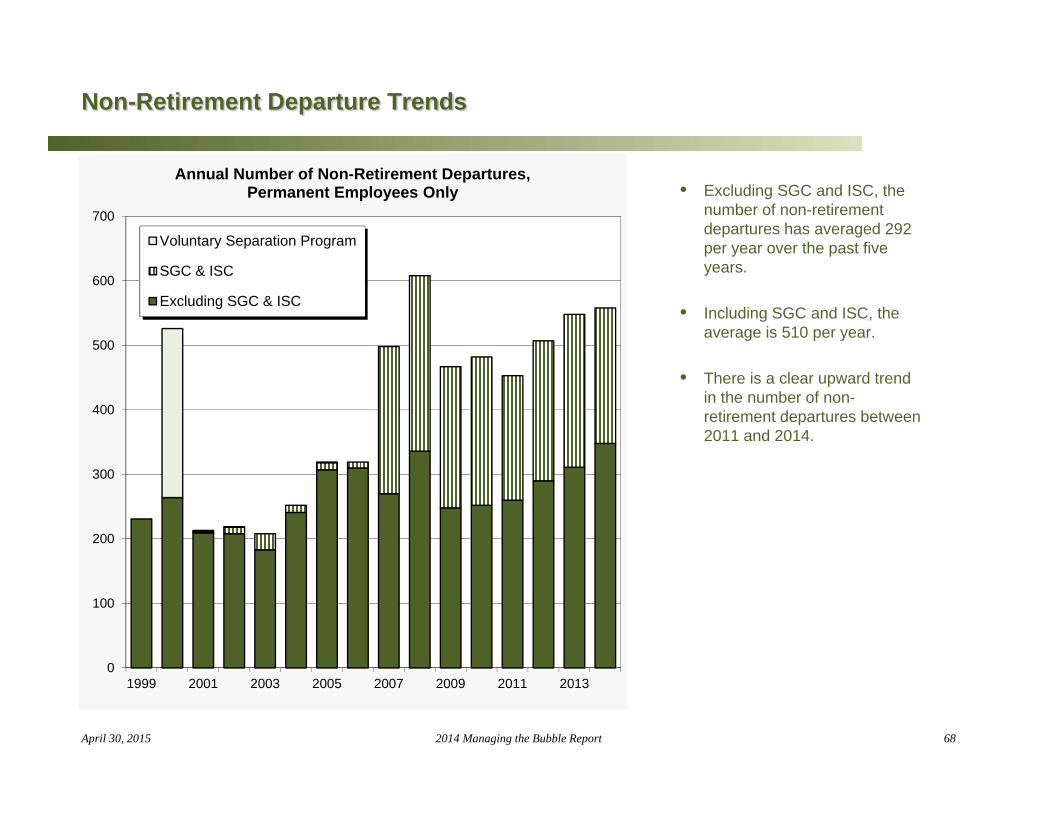
Non-Retirement Departure Trends
• Excluding SGC and ISC, the number of non-retirement departures has averaged 292 per year over the past five years.
• Including SGC and ISC, the average is 510 per year.
• There is a clear upward trend in the number of non-retirement departures between 2011 and 2014.
68April 30, 2015 2014 Managing the Bubble Report
0
100
200
300
400
500
600
700
1999 2001 2003 2005 2007 2009 2011 2013
Annual Number of Non-Retirement Departures, Permanent Employees Only
Voluntary Separation Program
SGC & ISC
Excluding SGC & ISC
Retirement Departure Trends
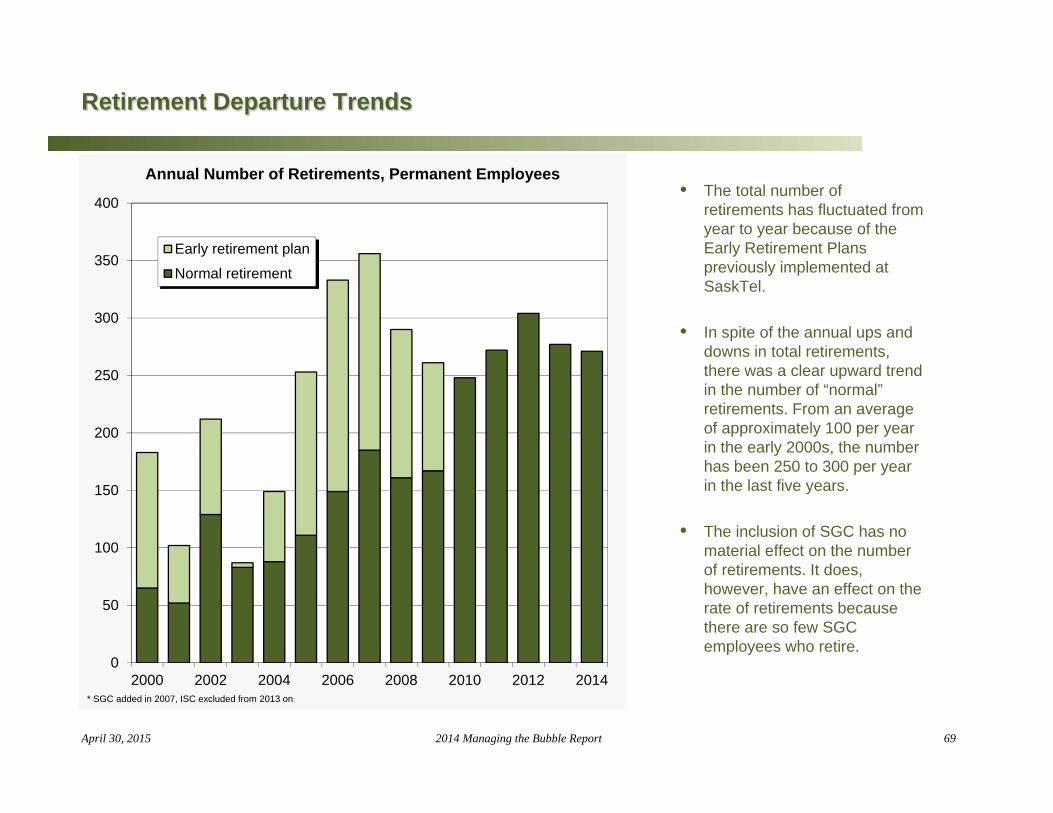
• The total number of retirements has fluctuated from year to year because of the Early Retirement Plans previously implemented at SaskTel.
• In spite of the annual ups and downs in total retirements, there was a clear upward trend in the number of “normal” retirements. From an average of approximately 100 per year in the early 2000s, the number has been 250 to 300 per year in the last five years.
• The inclusion of SGC has no material effect on the number of retirements. It does, however, have an effect on the rate of retirements because there are so few SGC employees who retire.
69April 30, 2015 2014 Managing the Bubble Report
0
50
100
150
200
250
300
350
400
2000 2002 2004 2006 2008 2010 2012 2014
Annual Number of Retirements, Permanent Employees
Early retirement plan
Normal retirement
* SGC added in 2007, ISC excluded from 2013 on
Reasons for Departures, 2014, Excluding SGC
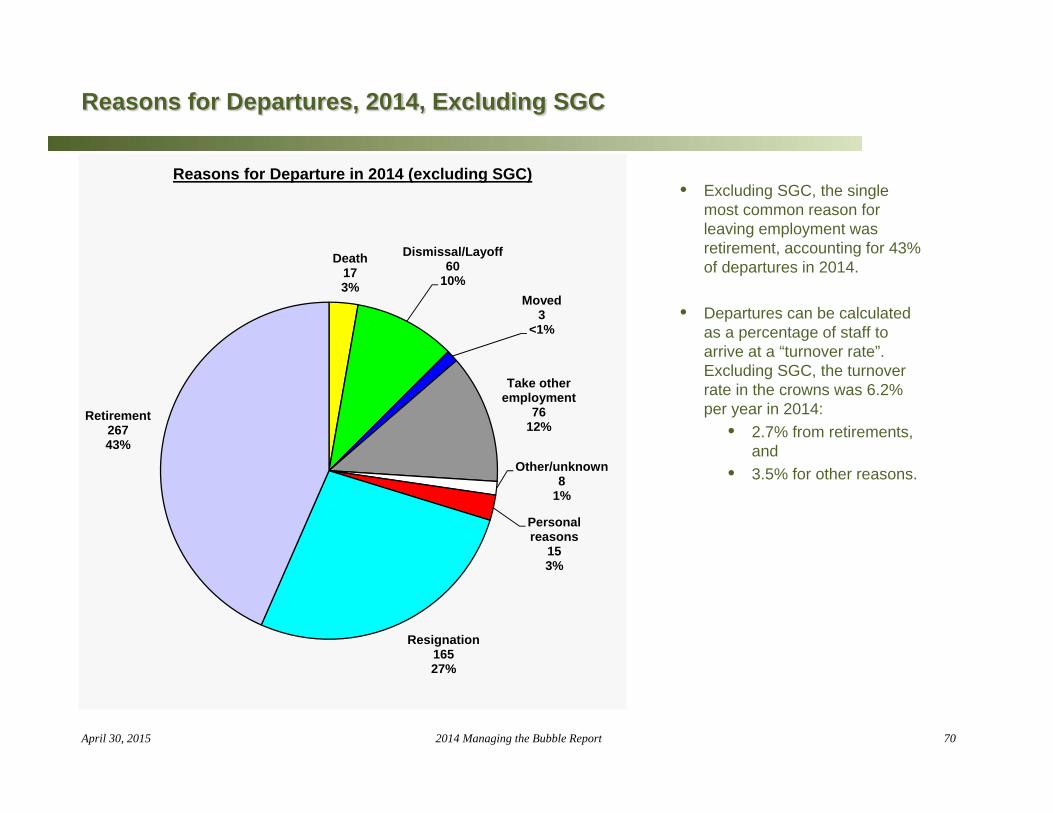
• Excluding SGC, the single most common reason for leaving employment was retirement, accounting for 43% of departures in 2014.
• Departures can be calculated as a percentage of staff to arrive at a “turnover rate”. Excluding SGC, the turnover rate in the crowns was 6.2% per year in 2014:
• 2.7% from retirements, and
• 3.5% for other reasons.
70April 30, 2015 2014 Managing the Bubble Report
Death173%
Dismissal/Layoff60
10%Moved
3<1%
Take other employment
7612%
Other/unknown8
1%
Personal reasons
153%
Resignation16527%
Retirement26743%
Reasons for Departure in 2014 (excluding SGC)

Reasons for Departures, 2014, Including SGC
• Including SGC dramatically increases the number of resignations. (“Job abandonment” is the terminology that is often used at SGC.)
• Including SGC changes the 2014 turnover rate at the crowns from 6.2% to 7.8% overall:
• 2.5% for retirement turnover; and
• 5.2% for non-retirement turnover.
71April 30, 2015 2014 Managing the Bubble Report
Death182%
Dismissal/Layoff92
11%Moved
3<1%
Take other employment
769%
Other/unknown364%
Personal reasons
192%
Resignation31038%
Retirement27133%
Reasons for Departure in 2014 (including SGC)
Turnover Rates by Crown Corporation, 2014
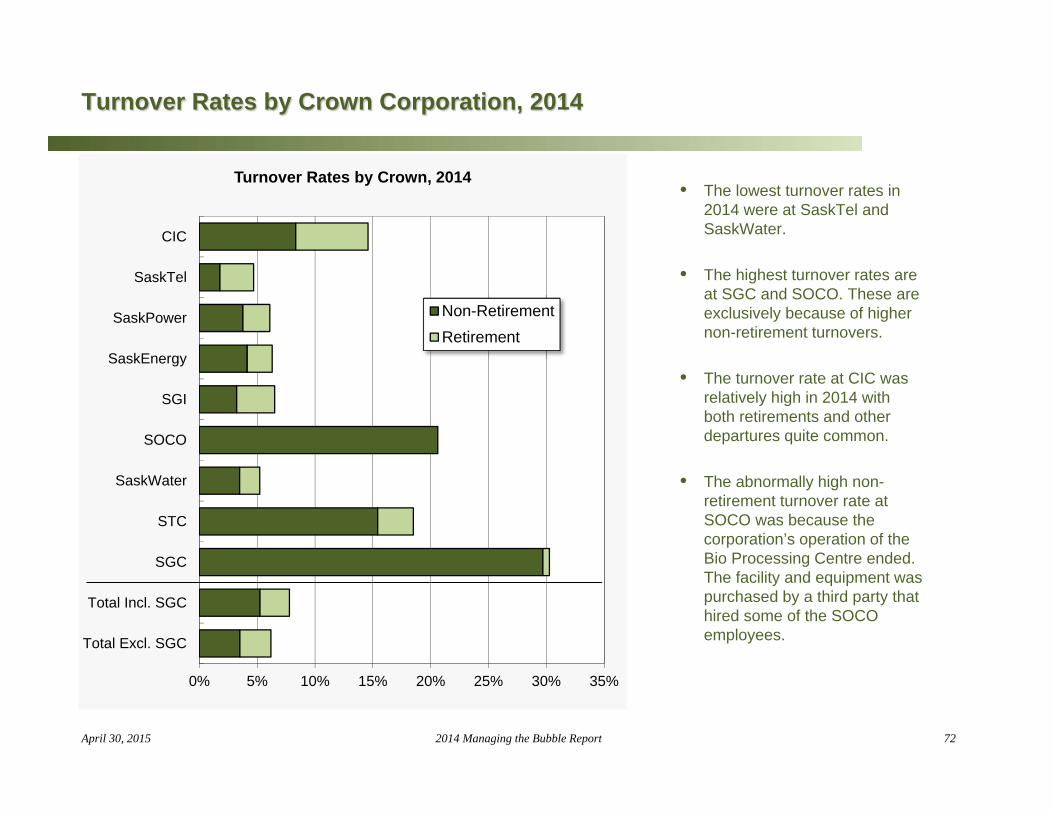
• The lowest turnover rates in 2014 were at SaskTel and SaskWater.
• The highest turnover rates are at SGC and SOCO. These are exclusively because of higher non-retirement turnovers.
• The turnover rate at CIC was relatively high in 2014 with both retirements and other departures quite common.
• The abnormally high non-retirement turnover rate at SOCO was because the corporation’s operation of the Bio Processing Centre ended. The facility and equipment was purchased by a third party that hired some of the SOCO employees.
72April 30, 2015 2014 Managing the Bubble Report
0% 5% 10% 15% 20% 25% 30% 35%
CIC
SaskTel
SaskPower
SaskEnergy
SGI
SOCO
SaskWater
STC
SGC
Total Incl. SGC
Total Excl. SGC
Turnover Rates by Crown, 2014
Non-RetirementRetirement

Changes in Turnover Rates by Crown Corporation
• There is no consistent pattern in the turnover rates by crown.
• Rates are low but increasing in SaskPower, SaskEnergy, and SGI.
73April 30, 2015 2014 Managing the Bubble Report
0% 5% 10% 15% 20% 25% 30% 35%
CIC
SaskTel
SaskPower
SaskEnergy
SGI
SOCO
SaskWater
STC
SGC
Changes in Retirement and Non-Retirement Turnover Rates by Crown
2005
2008
2011
2014

Turnover Rates by Gender, 2014
• With SGC included in the data, both retirement and non-retirement turnover rates are slightly higher among women than among men.
• Excluding SGC, the non-retirement turnover rate for women is the same as for men.
74April 30, 2015 2014 Managing the Bubble Report
5.7%
4.9%
5.2%
3.5%
3.5%
3.5%
3.0%
2.2%
2.5%
3.2%
2.3%
2.7%
8.7%
7.1%
7.8%
6.7%
5.8%
6.2%
0% 2% 4% 6% 8% 10% 12%
Women
Men
Both Sexes
Women
Men
Both Sexes
Incl
udin
g S
GC
Exc
ludi
ng S
GC
Turnover Rates by Gender, 2014
Non-Retirement Retirement

Turnover Rates among Permanent Staff by Age Group, 2014
• In 2014, more than one in ten (13%) of the permanent staff under thirty years of age left their crown employment. Excluding SGC, the percentage is half that rate at 7%.
• In the 30 to 54 age group, turnover rates are very low even if SGC is included.
• Beyond age 55, almost all departures are retirements.
75April 30, 2015 2014 Managing the Bubble Report
13.0%
5.9%
4.8%
12.8%
7.8%
7.1%
4.3%
4.2%
12.6%
6.2%
0% 3% 6% 9% 12% 15% 18%
Under 30
30 to 44
45 to 54
55 or older
All ages
Under 30
30 to 44
45 to 54
55 or older
All ages
Incl
udin
g S
GC
Exc
ludi
ng S
GC
Turnover Rates by Age Groups, 2014
Non-Retirement Retirement

Turnover Rates for Diversity Groups, 2014
• Non-retirement turnover rates among permanent staff are somewhat higher than average for those reporting an Aboriginal identity or for those who are members of a visible minority group.
• SGC has a particularly high turnover rate among its Aboriginal employees. If SGC is included, the Aboriginal turnover rate increases from 5.6% per year to 14.6% per year.
76April 30, 2015 2014 Managing the Bubble Report
7.8%
14.6%
7.7%
8.4%
6.2%
5.6%
5.4%
7.7%
0% 2% 4% 6% 8% 10% 12% 14% 16% 18%
All employees
Aboriginal identity
Members of a visible minority group
With a disability
All employees
Aboriginal identity
Members of a visible minority group
With a disability
Incl
udin
g S
GC
Exc
ludi
ng S
GC
Turnover Rates by Diversity Groups, 2014
Non-Retirement Retirement

Turnover Rates by Tenure, 2014
• Not surprisingly, the non-retirement turnover rate is higher among those with shorter tenure.
(Note: SGC data by tenure was not available because the crown has not been part of the database for long enough.)
77April 30, 2015 2014 Managing the Bubble Report
8.1%
4.1%
3.9%
7.9%
6.2%
0% 2% 4% 6% 8% 10%
Less than 5 years
5 to 9 years
10 to 19 years
20 or more years
All employees
Exc
ludi
ng S
GC
Turnover Rates by Tenure, 2014
Non-Retirement Retirement

Turnover Rates by Union Membership, 2014
• Both retirement and non-retirement turnover rates are lower among out-of-scope employees than among in-scope employees.
• If SGC is excluded, the turnover rates are nearly the same.
78April 30, 2015 2014 Managing the Bubble Report
8.2%
6.7%
7.8%
6.1%
6.3%
6.2%
0% 2% 4% 6% 8% 10% 12%
In scope
Out of scope
All employees
In scope
Out of scope
All employees
Incl
udin
g S
GC
Exc
ludi
ng S
GC
Turnover Rates by Union Membership, 2014
Non-Retirement Retirement

Retirement Age Trends
• The average age at retirement (excluding those who retired early through SaskTel’s plan):
• was approximately 59 years of age between 1999 and 2005;
• declined to approximately 57 years of age in 2008; and
• has been on a gradual upward trend since then.
• In 2014, the average age at retirement was 58.7 years. The median age is 59 years.
79April 30, 2015 2014 Managing the Bubble Report
46
48
50
52
54
56
58
60
62
2000 2002 2004 2006 2008 2010 2012 2014
Average Age at Retirement
Normal Retirement
Early Retirement(SaskTel)

Retirement Age
• The average or median age at retirement is not a particularly good predictor of actual retirements.
• Averaged over the three years ending in 2014, the average age at retirement was 58 but that is not a particularly common age for retirements.
• Instead, there are a relatively large number who retire in their mid 50s and another cluster near 60 years of age and a spike at 65 years of age.
80April 30, 2015 2014 Managing the Bubble Report
0
5
10
15
20
25
30
50 51 52 53 54 55 56 57 58 59 60 61 62 63 64 65 66 67 68+
Age at Retirement, 2012 to 2014 Average
number ofretirees
Comparison with Canada
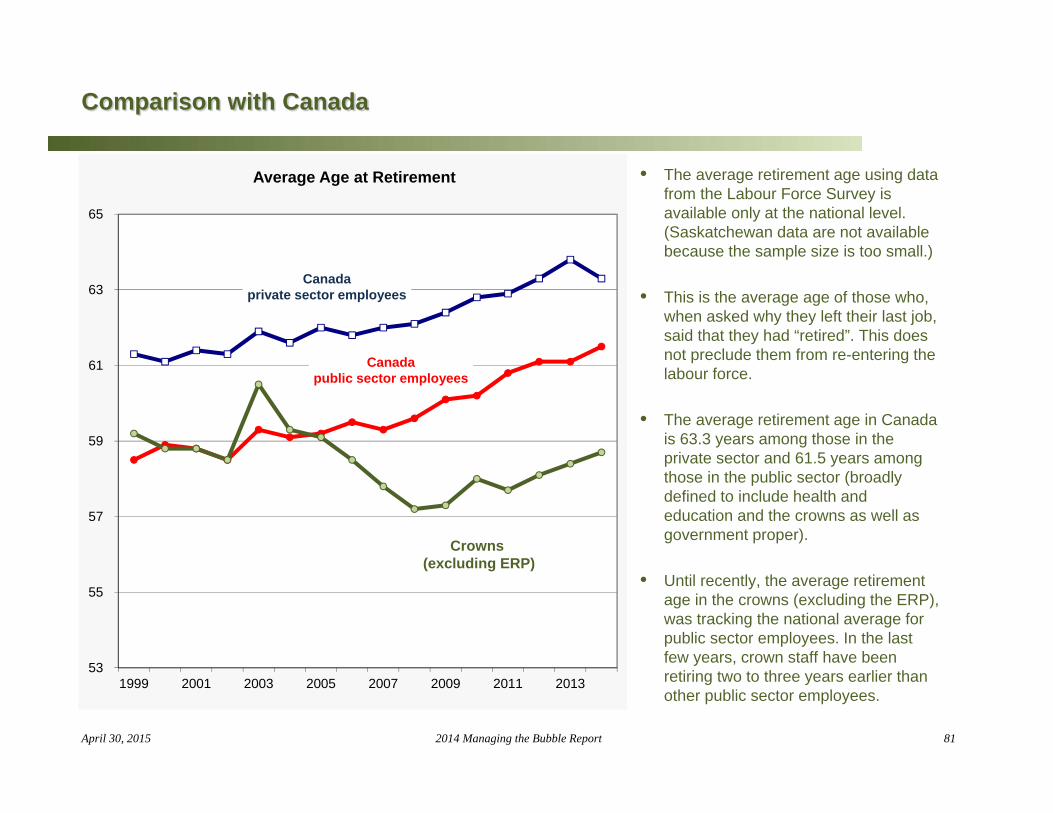
• The average retirement age using data from the Labour Force Survey is available only at the national level. (Saskatchewan data are not available because the sample size is too small.)
• This is the average age of those who, when asked why they left their last job, said that they had “retired”. This does not preclude them from re-entering the labour force.
• The average retirement age in Canada is 63.3 years among those in the private sector and 61.5 years among those in the public sector (broadly defined to include health and education and the crowns as well as government proper).
• Until recently, the average retirement age in the crowns (excluding the ERP), was tracking the national average for public sector employees. In the last few years, crown staff have been retiring two to three years earlier than other public sector employees.
81April 30, 2015 2014 Managing the Bubble Report
53
55
57
59
61
63
65
1999 2001 2003 2005 2007 2009 2011 2013
Average Age at Retirement
Crowns (excluding ERP)
Canadapublic sector employees
Canadaprivate sector employees

Expected Retirements

Three Measures of Retirement
• The expected retirement year for each permanent crown staff member who was employed as of December 2014 is calculated using a model that predicts their retirement date on the basis of the past behaviour of other crown employees with similar characteristics.
• Permanent staff are expected to retire after their earliest possible retirement date (typically at 50 years of age), depending on their age, tenure, gender, skill level, union membership, membership in a visible minority group, and whether they work full-time or part-time.
• Retirement packages or other unforeseen circumstance can change these estimates significantly. The hiring of additional staff and turnover of existing staff will also change the estimates because it changes the demographic mix of “current” staff.
83April 30, 2015 2014 Managing the Bubble Report
0
250
500
750
1,000
1,250
1,500
2014 orearlier*
2015-17
2018-20
2021-23
2024-26
2027-29
2030-32
2033-35
2036-38
Number of Retirements per Year(three measures for current staff)
At Age 59
Expected
At Age 65
* staff who could have or were expected to retire but were still employed on Dec 31 2014

Expected Retirements by Crown Corporation
• Whereas 46% of permanent crown staff will be eligible to retire before 2018, only 20% can be expected to do so.
• Of the 2,116 retirements expected in the next three years (2015 to 2017), the vast majority will occur in the three large crowns - SaskTel, SaskPower, and SGI.
• This estimate is undoubtedly high, being equivalent to more than 700 retirements per year whereas the current number is about 300 per year. It does, however, represent a plausible, if unlikely, scenario
84April 30, 2015 2014 Managing the Bubble Report
8
584
498
173
354
9
17
47
87
0 100 200 300 400 500 600 700
CIC
SaskTel
SaskPower
SaskEnergy
SGI
SOCO
SaskWater
STC
SGC
Expected Retirements Before 2018

Expected Retirements by Skill Level
• In the short term, retirement rates are lower among professionals, namely those in positions that require a university degree.
85April 30, 2015 2014 Managing the Bubble Report
22%
13%
20%
22%
20%
20%
0% 5% 10% 15% 20% 25%
Managerial
A: Professional (univ degree)
B: Technical (post-sec) & supervisory
C: Intermediate
D: Labour & elemental
All skill levels
Expected Retirements Before 2018 by Skill Level (% of staff)

Expected Retirements by Target Group
• Expected retirement rates over the short term do not vary significantly by gender, location, or union membership.
• Compared with the average, however, retirement rates are lower among those who are members of a visible minority group or who report an Aboriginal identity. These staff tend to be, on average, younger than other staff.
86April 30, 2015 2014 Managing the Bubble Report
20%
21%
11%
8%
28%
21%
21%
0% 5% 10% 15% 20% 25% 30%
All Staff
Women
Aboriginal Identity
Member of a VisibleMinority Group
Reporting a Disability
OutsideRegina/Saskatoon
In Scope
Expected Retirements Before 2018 (% of staff), Selected Groups of Permanent Employees