managing seed plan spreadsheet using microsoft excel 2010
TRANSCRIPT

By Peter K. Mulwa

Contents
1. Managing Seed Plan Spreadsheet

Seed Enterprise Management
Institute (SEMIs)
Managing Seed Plan Spreadsheet
Using Microsoft Excel 2010
3/29/2016 By: Peter K. Mulwa – University of Nairobi,
Definition of Terms
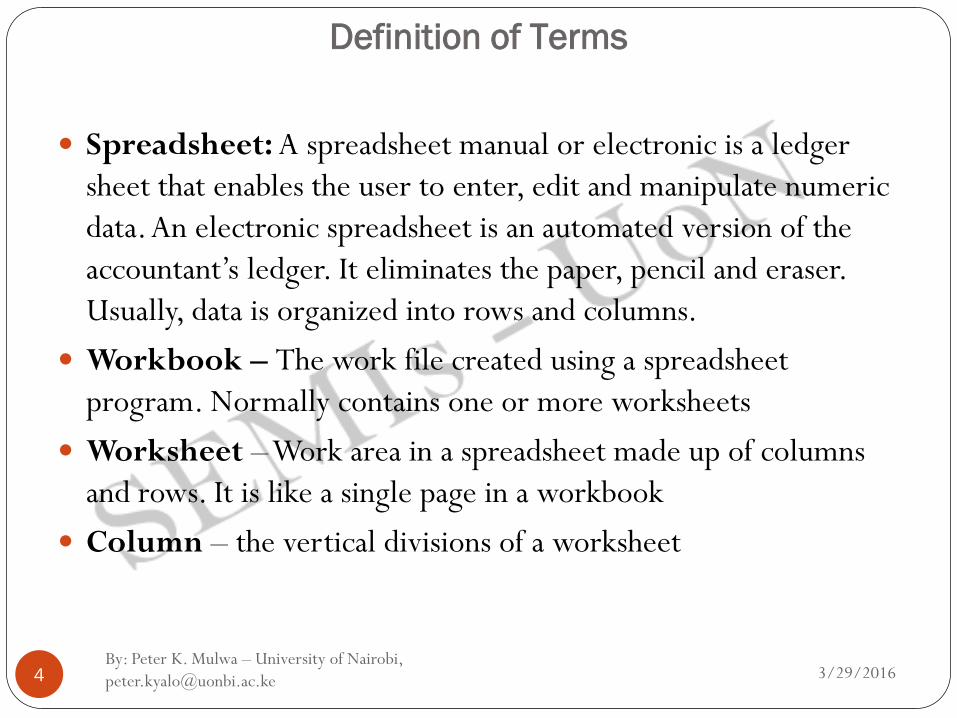
Spreadsheet: A spreadsheet manual or electronic is a ledger
sheet that enables the user to enter, edit and manipulate numeric
data. An electronic spreadsheet is an automated version of the
accountant’s ledger. It eliminates the paper, pencil and eraser.
Usually, data is organized into rows and columns.
Workbook – The work file created using a spreadsheet
program. Normally contains one or more worksheets
Worksheet – Work area in a spreadsheet made up of columns
and rows. It is like a single page in a workbook
Column – the vertical divisions of a worksheet
3/29/2016 By: Peter K. Mulwa – University of Nairobi,

Definition of Terms
Column – the vertical divisions of a worksheet
Row – The horizontal divisions of a worksheet
Cell – The smallest unit that holds data in worksheet and its
made by the intersection between a column and a row
Formula – User define expression for performing calculations
Function – Spreadsheets in-built formula used for performing
simple to complex calculations. The user does not have to
construct the expression when using a formula but only supplies
the function arguments – data references to be acted on.
3/29/2016 By: Peter K. Mulwa – University of Nairobi,
Examples of Electronic Spreadsheet Applications
Microsoft Excel, Quattro Pro, Lotus 1-2-3, VisiCalc
3/29/2016 By: Peter K. Mulwa – University of Nairobi,

Advantages of Electronic spreadsheets
Advantages of electronic spreadsheets over the manual
spreadsheets are;
Spreadsheet final results are neat
Numeric data can be edited and manipulated easily
A large virtual worksheet for data entry and manipulation
Enhanced formatting capabilities
3/29/2016 By: Peter K. Mulwa – University of Nairobi,

Advantages of Electronic spreadsheets
Enhanced formatting capabilities
Built-in functions which enable the user to create powerful
mathematical formulae
Automatic recalculation – The result of a given formula auto-
adjusts when a value used in formula is changed
Advanced data manipulation tools like sorting, filtering, data
validation, Sub-Total, etc.
Data presentations tools like charts
3/29/2016 By: Peter K. Mulwa – University of Nairobi,

What are the disadvantages of using electronic spreadsheets?
Class Activity
3/29/2016 By: Peter K. Mulwa – University of Nairobi,

Introduction to Microsoft Excel 2010
Microsoft Excel 2010 is one of the products in the Microsoft
office 2010 suit. The previous versions of Microsoft Excel
include; Microsoft Excel 97, 2000, XP, 2003 and 2007
3/29/2016 By: Peter K. Mulwa – University of Nairobi,

Starting Microsoft Excel 2010
Double click the Microsoft Excel 2010 shortcut icon from the
desktop
Or
Click on start button from the task bar on the desktop
Point at All Programs from the pull up menu
Point at Microsoft office from the sidekick menu, then click on
Microsoft Excel 2010 from the sidekick menu.
3/29/2016 By: Peter K. Mulwa – University of Nairobi,
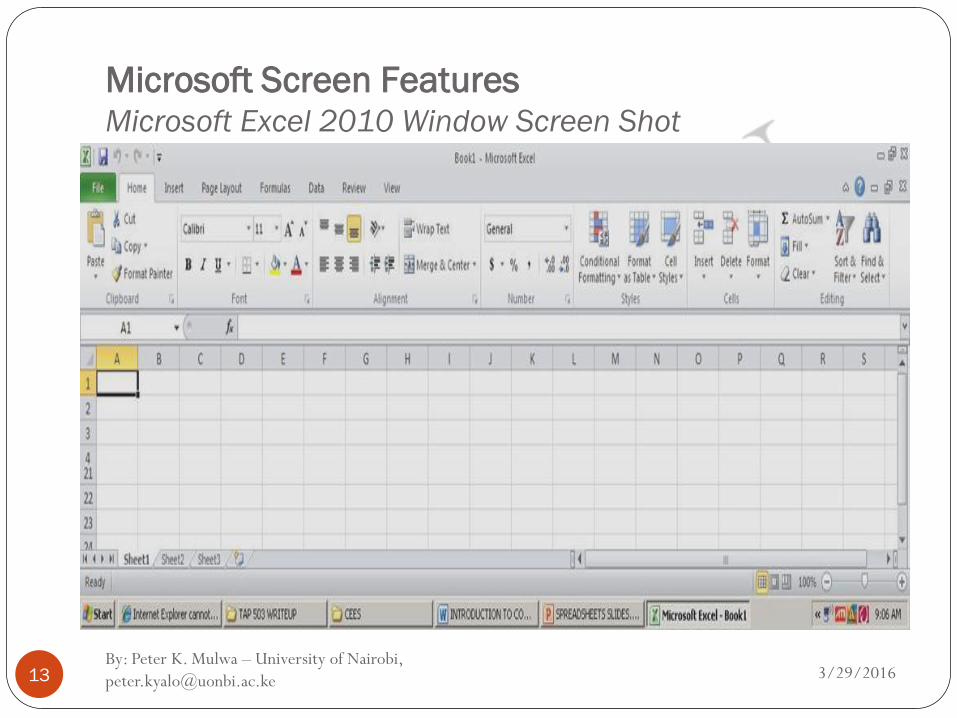
Microsoft Screen Features Microsoft Excel 2010 Window Screen Shot
3/29/2016 By: Peter K. Mulwa – University of Nairobi,
Microsoft Screen Features
Formula bar: Displays the contents of the active cell including
formulas and functions. Also used to enter data into a cell.
• Name box: Displays the active cell, i.e. cell with a dark outline that
indicates where data in the formula bar will be inserted. Used to
name/label cells.
• Workbook: refers to the user file that holds related information
organized in a good manner.
• Worksheet: Blank area made up of rows and columns. Several
worksheets form a workbook. A worksheet consists of:
3/29/2016 By: Peter K. Mulwa – University of Nairobi,

Microsoft Screen Features
Columns are the vertical division of the worksheet. Are labeled
using letters of alphabet from A to XFD
Rows are the horizontal divisions of the worksheet. Are labeled
using numbers from 1 – 1048576.
Cell which is the intersection between a column and a row. Are
referenced using column letter and the row number e.g. A1, B2 etc.
Worksheet tabs – used to select the worksheets. Labeled as
sheet1, sheet2, sheet3, sheet4 etc. there are 3 worksheets at
default.
Worksheet browsers – used for navigating through
worksheets
3/29/2016 By: Peter K. Mulwa – University of Nairobi,

Creating a Workbook and Entering data in a
worksheet
A cell can hold any of the following:
Label: Alphanumeric data that has no numeric significance and can
only provide descriptive information e.g. name of a place, person
etc.
Value: A numeric value (number) that may be used to perform
numeric computations
Formula and Functions: A formula is user defined mathematical
expression that evaluates into a value while a function is an in-built
formula.
3/29/2016 By: Peter K. Mulwa – University of Nairobi,
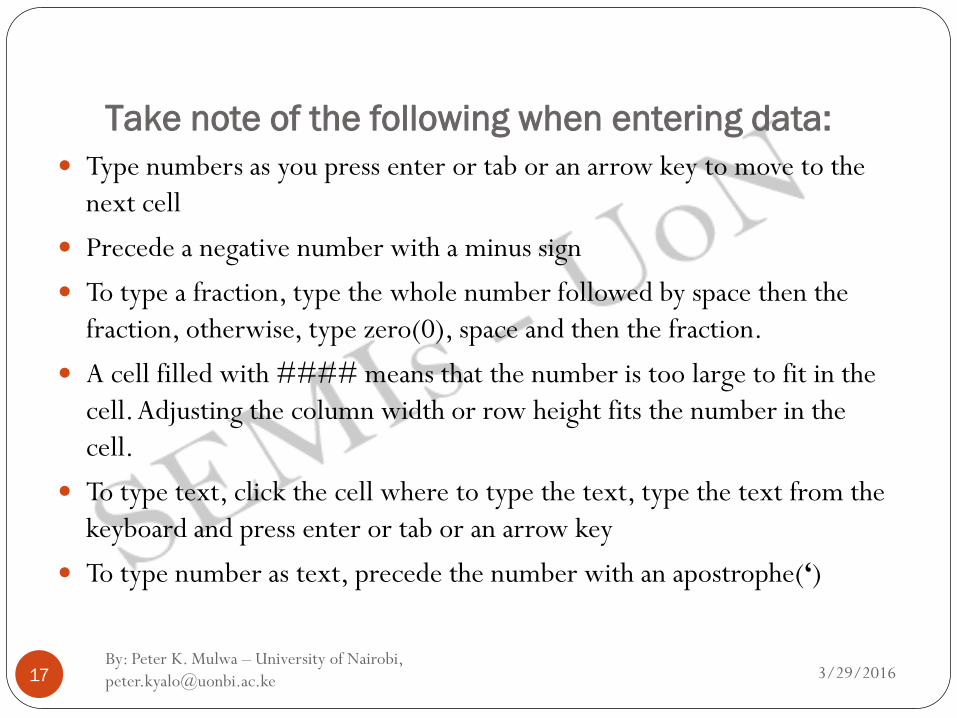
Take note of the following when entering data:
Type numbers as you press enter or tab or an arrow key to move to the
next cell
Precede a negative number with a minus sign
To type a fraction, type the whole number followed by space then the
fraction, otherwise, type zero(0), space and then the fraction.
A cell filled with #### means that the number is too large to fit in the
cell. Adjusting the column width or row height fits the number in the
cell.
To type text, click the cell where to type the text, type the text from the
keyboard and press enter or tab or an arrow key
To type number as text, precede the number with an apostrophe(‘)
3/29/2016 By: Peter K. Mulwa – University of Nairobi,

Take note of the following when entering data:
To enter a new line within a cell, press ALT + ENTER.
To type date and time, type using any of the format valid date and
time format.
To enter data in series e.g. 1, 2, 3…... type the first two data in
the series in two adjacent cells; select the data, point at the
handle at the right bottom end of the cell selector and drag
outward to fill the series or inwards to clear. This uses the auto
fill feature.
Long text data appear truncated meaning it cannot fit within the
cell, hence need to increase the size of the cell/column
3/29/2016 By: Peter K. Mulwa – University of Nairobi,

Activity
Enter the data below in to Microsoft Excel worksheet and save it
as Blue-Chip on the desktop of your computer. Adjust the
column width and row heights to fit all the data. Merger and
Center the cells in the first and second rows to appear as in table
2.6.1 below. To save a workbook, refer to Microsoft Word notes.
3/29/2016 By: Peter K. Mulwa – University of Nairobi,
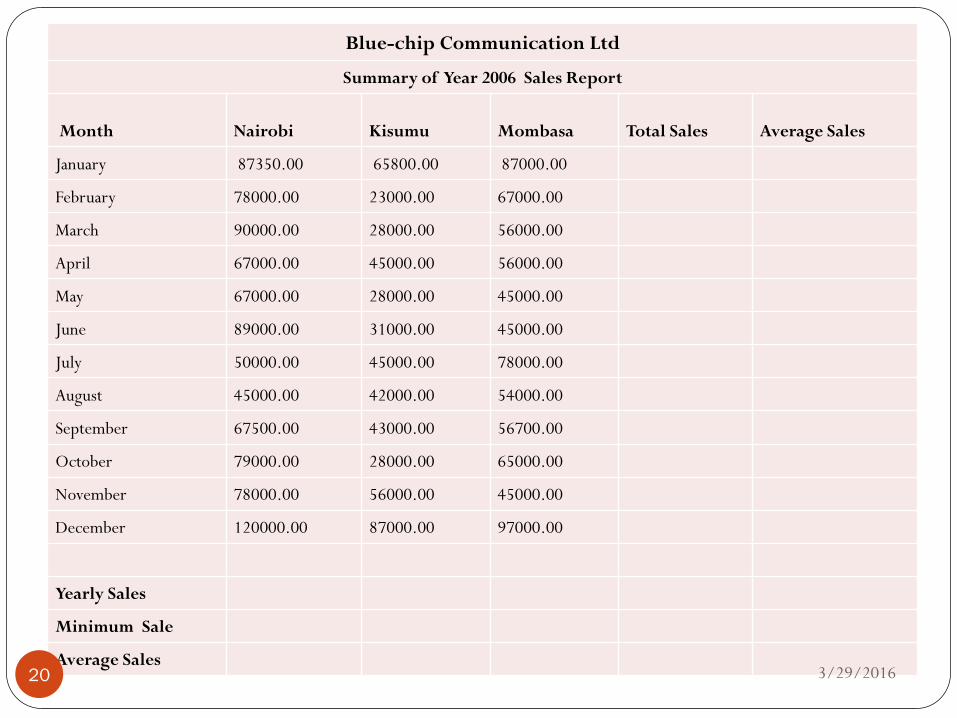
Blue-chip Communication Ltd
Summary of Year 2006 Sales Report
Month Nairobi Kisumu Mombasa Total Sales Average Sales
January 87350.00 65800.00 87000.00
February 78000.00 23000.00 67000.00
March 90000.00 28000.00 56000.00
April 67000.00 45000.00 56000.00
May 67000.00 28000.00 45000.00
June 89000.00 31000.00 45000.00
July 50000.00 45000.00 78000.00
August 45000.00 42000.00 54000.00
September 67500.00 43000.00 56700.00
October 79000.00 28000.00 65000.00
November 78000.00 56000.00 45000.00
December 120000.00 87000.00 97000.00
Yearly Sales
Minimum Sale
Average Sales 3/29/2016 20

Saving a Workbook
Click on the file tab
Click on the Save as submenu from the pull down menu
On the dialog box that appears, choose the location/folder to
save in e.g. desktop
Type the name of the workbook. The default name is Book1 that
can be replaced21
Choose the save as type e.g. Excel Workbook (*.xlsx) for Ms
Excel 2010 and 2007 compatibility o Excel 97-2003 workbook
(*.xls) for Ms Excel 2003 and lower versions compatibility
Click save to save and close the dialog box
3/29/2016 By: Peter K. Mulwa – University of Nairobi,

Editing a Workbook/Worksheet
To edit the contents of a cell,
Either click the cell
click on the formula bar to type new cell contents or double click
the cell and type in the new cell contents
To adjust column width;
Point at the row border. The mouse pointer changes to a cross.
Hold down the left mouse button and drag downwards to increase
the height or upwards to decrease the height or double click the
border to auto fit contents in the column width
3/29/2016 By: Peter K. Mulwa – University of Nairobi,

Editing a Workbook/Worksheet
To insert a column;
Click on the column left of which to insert a new column
Click on the drop down arrow below the Insert option in the Cells
group
Click on Insert Sheets Columns from the drop down list
3/29/2016 By: Peter K. Mulwa – University of Nairobi,
Editing a Workbook/Worksheet
To delete a column or row or a sheet;
Click on the column or row or sheet to delete
Click on the drop down arrow below the Delete option in the Cells
group
Click on what you want to delete.
NB: Use Undo and redo icons to reverse the changes
3/29/2016 By: Peter K. Mulwa – University of Nairobi,

Formatting a Workbook/Worksheet
You can format a worksheet to improve its appearance just as in
Microsoft word.
To change font of data in a worksheet;
Highlight the data to format
Click on the home tab
Click on the format options to apply from the Font group.
For more Font options, click on the arrow next to the Font.
3/29/2016 By: Peter K. Mulwa – University of Nairobi,
Formatting a Workbook/Worksheet
To change alignment of data in a cell,
Highlight the data to format
Click on the home tab
Click on the alignment format options to apply from the
Alignment group. For more alignment options, click on the
arrow next to the Number group to display the format cells
dialog box.
3/29/2016 By: Peter K. Mulwa – University of Nairobi,

Formatting a Workbook/Worksheet
To apply number formats in a cell,
Different numeric data can be formatted to show different
quantities in a worksheet;
Highlight the data to format
Click on the home tab
Click on the number format options to apply from the Number
group.
For more number formatting options, click on the arrow next to
the Number group to display the format cells dialog box.
3/29/2016 By: Peter K. Mulwa – University of Nairobi,

Formatting a Workbook/Worksheet
To format border formatting:
The grids in a worksheet are non-printable until one formats the
borders.
To format the borders;
Select the cell range to format the borders
Click on Home tab then click on the drop down arrow below the
Format option in the Cells group
Click on Format Cells from the drop down list. The Format cells
dialog box below appears;
Click on border tab
Select the line style, color and border type to apply then click ok
3/29/2016 By: Peter K. Mulwa – University of Nairobi,

Cell Referencing
This is the process of addressing or identifying cells in a worksheet
Different methods used include.
Single cell reference – in this the identity of a cell is done by
using the column letter and the row number e.g. A1, B78
3/29/2016 By: Peter K. Mulwa – University of Nairobi,

Cell Referencing
Relative cell referencing – in this, a cell reference changes
relative to the position of the formula. E.g. Consider the formula
=A1+B1 entered in C1. What happens when it is copied into B2
through B10?
3/29/2016 By: Peter K. Mulwa – University of Nairobi,

Cell Referencing
Absolute cell referencing - when a formula is copied to
other cells, the cell references remain unchanged. A dollar sign is
placed before the column letter and the row number by either
typing it or pressing F4 e.g. $B$20.
Mixed cell referencing - either the column or the row is
absolutely referenced but not both e.g. $B20, B$20
3/29/2016 By: Peter K. Mulwa – University of Nairobi,
Performing Calculations using formulae and
functions
a) Using a Formulae
When constructing a formula, it is important to note that;
The formula is typed after clicking on the cell where the
result is to appear
Every formula starts with an equal sign (=)
Cell references are used in the formula other than the actual
values
3/29/2016 By: Peter K. Mulwa – University of Nairobi,

Performing Calculations using formulae and
functions
Math's operators are used depending on the operation being
carried out e.g. + (addition), - (subtraction), / (division, *
(multiplication), ^ (exponentiation)
Parenthesis ( brackets) can be used to supersede the order of
evaluation of the operators
Example of a formula: = B3 * B5
3/29/2016 By: Peter K. Mulwa – University of Nairobi,
Performing Calculations using formulae and
functions
b) Using Functions
Functions are in-built formulas and therefore they are
inserted using the function wizard that guides one through
the process.
There are different categories of functions that include;
Math and trigonometry e.g. sum() etc.
Statistical e.g. average(), count(), rank() etc.
3/29/2016 By: Peter K. Mulwa – University of Nairobi,

Performing Calculations using formulae and
functions
Statistical e.g. average(), count(), rank() etc.
Logical e.g. the IF function
Financial e.g. pmt(), ppmt() etc.
Date and time e.g. now(), today() etc.
To insert a function;
Click on the cell where the result should appear
Click on Formulas tab. The different categories of Microsoft
Excel functions are displayed in the Function Library group
3/29/2016 By: Peter K. Mulwa – University of Nairobi,

Performing Calculations using formulae and
functions
Choose the function to use by clicking on the drop down
triangle below the function category
Specify the function arguments from the function argument
dialog box e.g. the range containing values to be summed
like A2:B2 as shown below then click OK.
3/29/2016 By: Peter K. Mulwa – University of Nairobi,

Performing Calculations using formulae and
functions
Copying a formula
You do not have to type formula in all cells containing
calculated values that use the same formula. You need just to
do type one correct formula and copy it to all other cells. To
do so, you can use the Copy and Paste commands as used to
copy data or you can use the drag and fill method.
To use the drag and fill method;
Click on the cell containing the formula to copy
3/29/2016 By: Peter K. Mulwa – University of Nairobi,
Performing Calculations using formulae and
functions
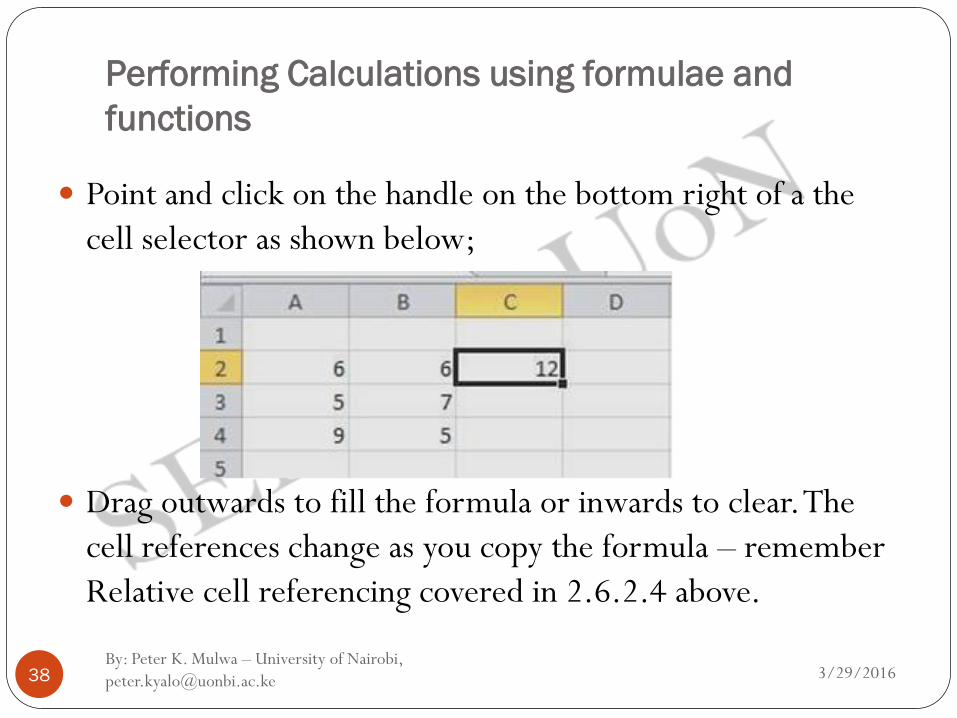
Point and click on the handle on the bottom right of a the
cell selector as shown below;
Drag outwards to fill the formula or inwards to clear. The
cell references change as you copy the formula – remember
Relative cell referencing covered in 2.6.2.4 above.
3/29/2016 By: Peter K. Mulwa – University of Nairobi,
Data Management
a) Sorting
This means to arrange data in a particular order which could be in
either ascending or descending order e.g. sorting a list of names of
students alphabetically or marks in descending order from the
highest to the lowest. To sort data in Microsoft Excel 2011;
Highlight or click on the data to sort
Click on the Data tab then click on Sort option from the Sort &
Filter group
Click on the checkbox labeled My Data Has Headers as shown below;
3/29/2016 By: Peter K. Mulwa – University of Nairobi,

Data Management
Select column or header name by which to sort the data by
in the sort by box
Specify the sort order then click OK.
3/29/2016 By: Peter K. Mulwa – University of Nairobi,

b) Filter
Used to display data that meet a user defined criteria. Can be
auto filter or advanced filter.
Follow the following steps for auto filter:
Click on data tab
Click on the filter icon under sort and filter group
Click on the drop down arrows added on the fields and
choose the criteria to be met
NB: Click on the same arrow show all to display all data after a
filter action
3/29/2016 By: Peter K. Mulwa – University of Nairobi,

c) Pivot Tables PivotTable reports can help to analyze numerical data
With PivotTable reports, you can look at the same information in different ways with just a few mouse clicks. Data swings into place, answering questions, telling you what the data means.
Select the data to analyze
>Ribbon
>Insert
>Pivot Table Create in New sheet
Add filters (country)
Quarters (Group and show data)
Sort Data
3/29/2016 By: Peter K. Mulwa – University of Nairobi,

d) What If Analysis
What-if analysis is the process of changing the values in cells
to see how those changes will affect the outcome of formulas
on the worksheet.
Three kinds of what-if analysis tools come with Excel:
scenarios,
data tables,
goal seek
3/29/2016 By: Peter K. Mulwa – University of Nairobi,

i. Scenarios A scenario is a set of values that Excel saves and can substitute automatically in cells on a
worksheet.
You can create and save different groups of values on a worksheet and then switch to any
of these new scenarios to view different results.
Ribbon
>Data
>What if Analysis
>Scenario Manager
Add
Name the scenario
Select cell(s) to change
Save
Put in the new values
Save
Show
3/29/2016 44

ii. Data Tables
Data Table is a way to see different results by altering an input
cell in your formula
Put in values to be used in data table, then highlight the
values and the formula for the input
Ribbon
>Data
>What if Analysis
>Data Table
Select the row or column cell
3/29/2016
By: Peter K. Mulwa – University of Nairobi,

iii. Goal Seek A method to find a specific value for a cell by adjusting the value
of one other cell.
When goal seeking, Excel varies the value in a cell that you specify until a formula that's dependent on that cell returns the result you want.
Ribbon
>Data
>What if Analysis
>Goal Seek Set the target cell
Set the target value
Select the cell to be changed
View the results
3/29/2016 By: Peter K. Mulwa – University of Nairobi,
Charts
A chart is a graphical representation of the worksheet data to
shows the relationships between values. The choice of the chart
depends very much on the kind of data you are trying to chart
and how you want to present the data. E.g. Line, pie, column
etc.
To insert a chart in Microsoft Excel 2010;
Click/Select the data to present in a chart
Click on Insert Tab then click on the drop down triangle
below the type of chart to insert from the Charts group
3/29/2016
By: Peter K. Mulwa – University of Nairobi,
Charts
Take note that two chart Tools tab appears at the top of the
ribbon when the chart is inserted or when the chart is
selected. You can use these chart tools to manipulate the
inserted chart for example by changing the chart type, the
location of the chart, add more data etc. For more options
on chart type and subtypes, click on the arrow next to the
Charts group.
3/29/2016 By: Peter K. Mulwa – University of Nairobi,

Protecting a workbook and a worksheet using
passwords
Click on the File button
Point at Info from the pull down menu
Click on Protect Workbook drop down triangle.
Choose the type of protection to apply e.g. Encrypt with
Password, Protect Workbook Structure etc.
Enter the password and click OK then reenter the password and
click OK again
3/29/2016 By: Peter K. Mulwa – University of Nairobi,
Workbook and Worksheet Printing
To produce hardcopies of data created in Microsoft Excel,
you need to print it following the steps below;
Open the Workbook/worksheet to print its data
Click on the File button then click on Print from the pull
down menu
Set the print options as desired e.g. printer, print range,
number of copies and other options from the side list.
Click on the Print button on the top of the side list.
3/29/2016 By: Peter K. Mulwa – University of Nairobi,

Application of Electronic Spreadsheets in
Education
Electronic Spreadsheets can be used in Educational
Institutions to replace the paper-based ledger sheets used in
various aspects of managing educational data. Some of the
practical applications of electronic spreadsheets include;
Time tabling and event scheduling
Analysis and presentation of examination results
Financial management e.g. maintaining electronic ledger books,
balance sheets etc.
As a subject to be taught and examined.
3/29/2016 By: Peter K. Mulwa – University of Nairobi,
References
French, T 2010, Basic Excel 2010 Spreadsheet Tutorial, http://www.about.com/,
accessed on 10/10/2011
Excel 2010 Essential Training, http://www.lynda.com/Excel-2010-
tutorials/essential-training/61219-2.html, accessed on 10/10/2011
Excel 2010 Quick Notes, http://msdn.microsoft.com/en-
us/library/gg607247.aspx accessed on 10/10/2011
Microsoft Excel 2010, http://www.excel-2010.com, accessed on 10/10/2011
Goodwin College, 2010, Microsoft Excel 2010 Tutorial,
http://www.goodwin.edu/computer_resources/pdfs/excel_2010_tuto
rial.pdf accessed on 6/10/2011
3/29/2016 By: Peter K. Mulwa – University of Nairobi,
