managing risk in the real world
TRANSCRIPT

248
Managing risk in the real world
Ben C. BALL, Jr. MIT Enerp Laboratory, Cambridge, MA 02139, and Ball & AssociaIes, Cambridge, MA 02142, U.S.A.
Received June 1982 Revised September 1982
Exploitation by corporate management of what we know about decision analysis and simulation techniques is not limited by an understanding of the relevant analytical frameworks or the availability of the computer programs necessary for data manipulations. Rather, effectively utilizing the power of these concepts is inhibited by our inability to weave them into the fabric of the real management systems and decision-making processes of the firm.
Texts on decision analysis often belabor the unwillingness on the part of management to employ these sophisticated tools. Management, on the other hand, is neither enchanted nor convinced by the ‘black boxes’ (which are perceived as black magic) of the decision analyst. This paper will not argue the merits of where the responsibility lies. Rather, it will present a method for effectively integrating decision and simulation anal- ysis into the real strategic decision-making process that actually exists within the firm. At least, the capability of employing such a method is now under our control; the author argues that if it is effected, then exploitation of these powerful analytical ap- proaches by management can follow.
Specifically, we will deal here with the application of deci- sion analysis to the management of risk and return in petro- leum exploration. This is in itself an important application of great practical significance. However, the principles illustrated through this example are widely applicable to many other areas. It is especially applicable to areas where risks are great and uncertainties are large. Such areas would include research, the marketing of new products, and proposed large capital projects. Therefore, careful attention will be given to the un- derlying principles involved, and to the implications of apply- ing these principles in other areas.
Preface (A relevant note to the reader)
The art and science of decision analysis (or decision theory, or risk analysis, or whatever name you might prefer) is an established and well-known one. It was pioneered by such greats as Raiffa, and then applied to petroleum exploration first by Kaufman and Grayson, and more recently by McCray, Megill, Newendorp, Cozzolino, and others. Von Holstein and his colleagues have de-
North-Holland European Journal of Operational Research 14 (1983) 248-261
veloped the methods of obtaining subjective judge- ments of probability to a high degree. Hertz has been a leader in applying decision analysis to the problems of capital expenditure. The author of this paper is indebted to all of these individuals for their seminal work, and claims to add nothing to fundamental knowledge in the field. If you are looking for new theories or new formulae, then save your time, and stop reading here.
On the other hand, if you are looking for what has been up to this time a missing link that has blocked the acceptance of risk analysis in such obviously applicable fields as petroleum explora- tion, then read further. We discuss here a practi- cal, l-2-3 method whereby the management of a firm can appropriate the potentialities of decision analysis, incorporate it as a part of their total management system, and utilize it to solve a real problem that they perceive themselves as having to deal with. Incidentally, within that last sentence, I reveal my belief as to what are the necessary ingredients for any real change to occur in man- agement practice.
This paper is prepared as if for the interested manager, who would like to know whether or not a new or different aspect of his management system would be appropriate for him to adopt. Therefore, the language is kept as direct as possible, esoteric notions and notations are avoided like the plague, and descriptions and definitions are sprinkled liberally and in terms to which management can relate. In a sense - in addition to discussing a new, innovative, and effective process for the ap- plication of established decision analysis concepts and techniques - this article can be considered something of a tutorial for the management scien- tist or operations researcher in preparation for sharpening his skills is meeting the needs of the managements of firms.
1. Introduction
Conventional analysis (i.e., deterministic analy- sis, whether using discounted cash flow, net pres- ent value, return on investment, net income, or whatever) may well be adequate if risk is not an
0377-2217/83/$3.00 Q 1983, Elsevier Science Publishers B.V. (North-Holland)

B.C. Ball, Jr. / Managing risk m the real world 249
important factor and/or if uncertainties are not great. In the real world of business, industry, and commerce, these conditions are often fulfilled. Such a statement might seem surprising to the observer outside a particular field, but it nevertheless is true in many, if not most, instances. If a firm has been in the same business successfully for a long time, and the nature of the decisions in that business have been stable, or have evolved smoothly over time, then the management has become familiar with the risks and uncertainties, even though they might be neither articulated nor quantified. There is no intrinsic reason to think that conventional analysis may not be entirely appropriate.
However, if risks are very high, or if uncertainty is particularly great, then conventional analysis, though not unimportant, may simply be inade- quate to inform management about the relevant issues surrounding a decision. Perhaps no better example of such a situation can be found than that of the exploration for oil and gas, especially for a small to medium sized firm, or for one just enter- ing the business.
1.1 Risks in Exploration for oil and gas
The risks in this business are known to be high; it is, therefore, not surprising to find that the returns can be high. It is the responsibility of the management of a particular firm to insure that its returns are high. Averages, for such firms, simply have little or no meaning, and analysis based on deterministic evaluations or ‘best guesses’ or ‘most likely’ values have as great a tendency to mislead as they have to inform.
In a business such as exploration for oil and gas, one of the keys to success is the management’s ability to manage risks, avoid surprises, and insure against disaster. The other two key success factors are, I believe, scientific expertise on the part of the geologic/geophysic team, and luck. To a large degree, these three key success factors are in- terchangeable. The methods developed here and presented in this paper are directed at firms where the management is not expert at the sciences of geology and geophysics, and where the manage- ment is willing neither to let good scientists ‘do their thing’ nor to trust to luck. There is now an alternative.
1.2. Issues in managing risk
Practising petroleum geologists and geophysi- cists are, in fact, first and foremost scientists. This is certainly intended as no slur, nor is intended to disparage any expertise they may have in the field of business. They practice only in the world of commerce, and it certainly is an applied science. I only emphasize that their success comes not out of competitive struggles or financial battles; rather, their success is wrestled out of a war between man and nature - between knowledge of their science and the unknown of the earth and what lies be- neath its surface. And, they do so against great odds.
It is not surprising, therefore, to find that prac- ticing geologists and geophysicists are optimists - you wouldn’t want one who wasn’t. I have yet to meet one who drilled a dry hole on purpose. This, in the face of the fact that some nine out of every ten wildcats are dry holes. Before drilling, ask him if he thinks he will find oil on this one, he is likely to reply, “I wouldn’t drill if I didn’t believe there was oil there”. They, in fact, gamble their fortune, their career, their self-esteem, and their sacred honor.
1.3. Management’s choices in dealing with risk
The choices available to the management of an oil and gas exploration activity are really quite limited. Of course, the first is to become a scientist (i.e., expert geologist and geophysicist)-unless he already happens to be one. In such an event, he will then be able to follow the data analysis, interpretation, synthesis, and judgements of the practicing geologists and geophysicists, and thereby internalize the risks implied by alternative courses that are open. Unfortunately, this option is availa- ble only to managers of relatively small en- terprises; one man can only review so many pros- pect evaluations, regardless of his competence.
The second, and by far the most popular choice is for the manager to bet on the competence and performance of other people. This might come about in a number of different ways: it could be the result of confidence growing out of a success- ful track record, or it could be the pragmatic self-disciplining arrangement of a partnership where “you make the decisions, but put up some of your own money to ride beside mine”. This
250 B.C. Ball, Jr. / Managing risk in the real world
choice seems to work well for many large and/or old firms, where the confidence has had both time and breadth to mature. It seems to work well for adjunct or non-organic relationships, such as those between active and passive investors. However, its acceptability has severe limitations, especially for significant or organic relationships, or for relation- ships where the non-scientist is unwilling to be completely passive. This limitation is that it intrin- sically assumes that all parties have the same propensity for risk; in fact, this is usually a very bad assumption, and the arrangement is therefore built on a very poor foundation.
1.4. The management of risk
The third possibility, and the one on which we will focus here, is for the business management to focus on the management of risk, and for the scientists (i.e., geologists, and geophysicists) to focus on the collection, analysis, and interpreta- tion of scientific data, together with their judge- ment as to the relevant probabilities of various significant events based on their studies of this data.
This separation of responsibilities is what I would call a ‘strategic division of labor’. It has nothing to do with hierarchical issues, or the rela- tive importance of the different areas of responsi- bility. Rather, it has to do with the assignment of decisions to those who can make them most effec- tively, when viewed from the criterion of the per- spective of the decision maker.
This particular strategic division of labor is particularly appropriate to oil and gas exploration in a number of instances. For example, it works well for a firm that has decided to diversify into oil and gas exploration, and has either acquired an organization for that purpose, or is building one internally. It also is effective for a small firm headed by a ‘scientist’, who knows one particular area very well, but who desires to move into other geologic or geographic areas unfamiliar to him. In the first instance, it is easier for a non-petroleum management to learn and adopt risk management than it is for them to learn and apply geology. In the second instance, it is easier for the geologist to learn risk management than it is for him to learn the geology of a new area. And, in both instances, it is a viable alternative to the more popular
approach of simply betting on the people you acquire or hire.
2. Summary
2.1. Financial analysis and risk analysis
Financial analysis (i.e., DCF, etc.) measures return. Risk analysis measures risk. One view of the principal task of management is the manage- ment of the relationship between these two factors. It seems self-evident that knowledge of each factor based on measurements of both of them would greatly facilitate the management of their relation- ship.
Few if any firms operate without quantification of return. On the other hand, risk-in most firms - is discussed with a waving of the arms. I argue here that risk-at least in some businesses, such as oil and gas exploration-is at least as important as return. Management needs a knowledge of both, and a system for managing their relationship. This, to some degree, is a key success factor in any business. It is especially true in any new, growing, or dynamic business. It is certainly true in one of the riskiest businesses known: oil and gas explora- tion.
It is worth acknowledging here the first re- sponse usually encountered from management when the subject of risk analysis is mentioned. That is, that risk analysis is theoretical, mathe- matical, and conceptual. I would only like to point out that so is financial analysis! Certainly, risk analysis draws on some of the laws of statistics, and many of the formulae appear threatening. However, the difference between financial and risk analysis is in familiarity, not complexity. Most executives, for example, are familiar with net pres- ent value as a tool of financial analysis, but could not write (or perhaps even recognize) the formula by which it is calculated. Net present value is a concept resulting from a theoretical approach and using rather sophisticated mathematical formulae, no more or less than are the factors involved in risk analysis. A manager using risk analysis needs no more to be a mathematician than one using financial analysis. One is no more esoteric than the other; the primary difference, rather, is one of familiarity.
In addition, management need no more blindly

B.C. Bull, Jr. / Munuging risk in the real world 251
accept risk analysis, and use it in a rote fashion than it need do so with financial analysis. It needs only to understand both, including their strengths, limitations, and purposes. The point is that management needs to become neither statistician nor geologist to fulfill its primary responsibility of managing the risk/return relationship of the oil and gas exploration effort.
2.2. Filling the need
The geological and geophysical evaluation of a prospect is highly technical and involves great uncertainty. Exploratory drilling is extremely ex- pensive, and is only pursued for financial goals; these financial rewards must be-and in fact can be-quite large, in view of these risks. The need is for a practical but rigorously sound process for linking these two dimensions for petroleum ex- ploration, which are intrinsically different: the sci- ence of geology and the art of managing for profit.
It is simpler and more effective for the business- man to learn, adopt, and use this linking process, than for him to learn geology. His only alternative is to ‘have faith’. On the other hand, the explora- tion geologist is always seeking improved methods for ranking his prospects. The process must also be communicable to him, as well as to prospective investors.
The process can be viewed from the strategic perspective. That is, the quality of business deci- sions and the profitability of favorable results improve if each decision can be made in view of all possible decisions, the expected consequences of each, and the risks involved in each. This is essentially all there is to so-called ‘portfolio deci- sion making’, and is at the heart of any kind of strategy. It is the ‘menu’ approach, as contrasted with the sequential ‘cafeteria’ approach.
This contrast is critical in petroleum explora- tion where uncertainties are large, much is at stake, and investors, managers, and businessmen need a common language through which they can effectively communicate with geologists and ex- plorationists.
The analytical framework is tried and true -some twenty years old, in fact. The new and critical ingredient is the practical embodiment of these quantitative relationships in a corporate management system. This takes what has been for two decades an interesting but little-used disci-
pline and turns it into a powerful tool for manag- ing exploratory risk in the real world of the busi- ness managers’ investment decision.
3. The process
3.1. Subjective probability
The first concept management must appreciate is that of the subjective assessment of probability. A very practical example can be used to demon- strate this principle. The one I like to use is as follows: Swiss Air Flight No. 170 is scheduled to arrive tonight in Geneva at 1O:OO pm. When will it arrive? Assume that ‘arrival’ means the first per- son through the door into the Geneva airport waiting room, from the plane designated by that flight number and on this date. Further, assume that no arrival (e.g., it is cancelled) equals in- finitely late. Then, determine from an individual his ‘cumulative probability distribution’ for this event. (See Fig. 1). That is, obtain from him his judgement as to the probability of the flight arriv- ing at 9:45 pm or later, 10:00 or later, lo:15 or later, lo:30 or later, etc. (Obviously, instead of or in addition to obtaining probabilities on ‘or later’, one could obtain probabilities on ‘or earlier’.) The
_._ , 10:00 10:30 11:oo 11:30
Arrival Time
Fig. I. Subjective assessment of probabilities.
12:00

252 B.C. Ball, Jr. / Managing risk in rhe real world
resulting curve is a display of all he knows about the arrival of this flight. The event is still an uncertain one, but we have now quantified this uncertainty, so that we can deal with it objectively and systematically.
This kind of example is powerful, in that it illustrates a number of important points. In addi- tion, we are all somewhat familiar with the un- derlying dynamics, but relatively detached emo- tionally from their substance. Illustrated points include the fact that we could get better data, at some cost; for example, we could determine the track record for this flight over the last few weeks. Also, it illustrates the fact that the uncertain event must be defined very explicitly for the data to have any useful meaning.
It should be obvious that the process of obtain- ing subjective probability judgements can be ap- plied with equal directness to any uncertainty. In fact, this is fundamentally a very natural and human process that we all employ subconsciously when we consider issues involving any significant uncertainty. All we have done here, in a sense, is to systematize, objectify, and articulate that proc- ess.
The example itself can be useful in practice. For instance, if we were to be obligated to meet some person arriving on that flight, we might suffer some ‘cost’ (whether psychic or otherwise) if we were not there when he arrived. On the other hand, we might suffer some opportunity cost for the time we spent at the airport awaiting his arrival. The data collected and displayed in Fig. 1 would be very helpful in weighing these two costs.
The process employed in this example is no different from the process utilized in determining all the geologist knows (no more and no less) about porosity or thickness of pay of a possible hydro- carbon deposit.
3.2. All we know-no more and no less
We emphasize here that we need to determine all the geologist knows, no more and no less. The emphasis is needed because we have grown so accustomed to deterministic estimates. The point is that deterministic estimates do not tell us all we know, or all we need to know.
For example, on the basis of the ‘most likely’ estimates of five critical variables (e.g., price, costs, field sizes, etc.), the uctual return depends on
whether these estimates are correct. If each of the five estimates has a 60% chance of being correct, there is only an 8% chance all five will be correct (0.6 x 0.6 x 0.6 x 0.6 x 0.6 = 0.08) - a rather un- likely coincidence. A deterministic return depends on an unlikely specific combination of a great many variables.
The decision-maker needs to know a great deal more about the other values used to make each of the five estimates, and what he stands to gain or lose from various combinations of these values. ‘Precise’ numbers simply do not tell the story he needs.
3.3. The simulation process
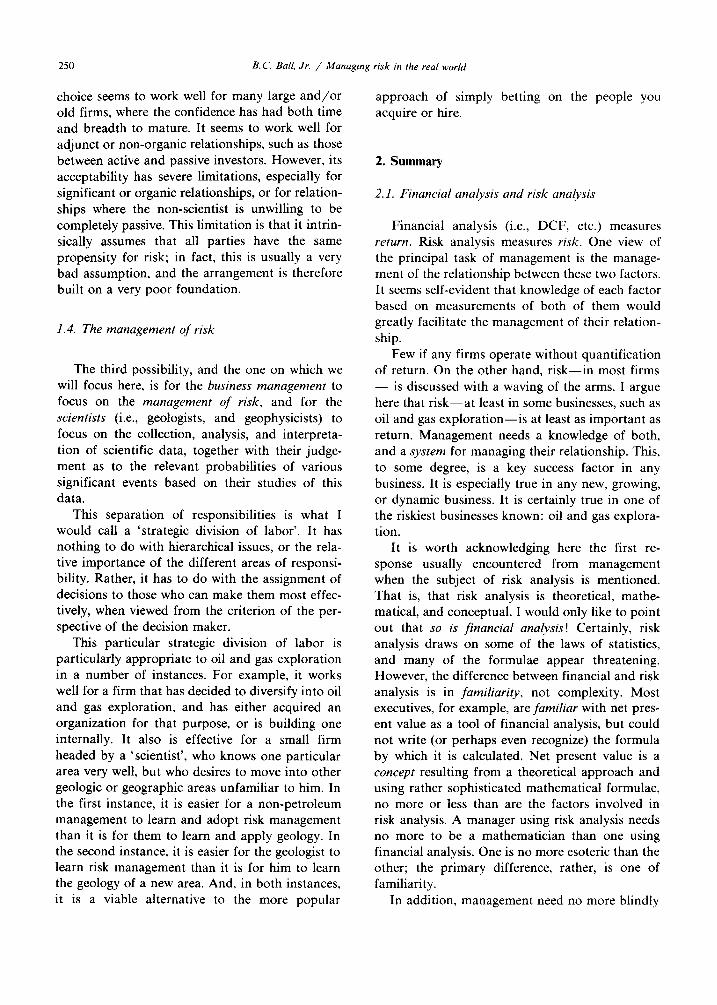
It is important for management to understand that the simulation process, by which the subjec- tive judgements of the probabilities of important uncertainties is utilized, is based on exactly the same understandings and relationships that a de- terministic, conventional, financial analysis would be based on. Let us consider an example where these understandings and relationships are highly oversimplified for the sake of clarity. Let us say that value = (price x field size) - cost. A con- ventional, deterministic financial analysis would substitute our best estimate for each factor into this equation to obtain the best estimate of value. Risk analysis would use exactly the same variables and exactly the same equation. The only difference would be that we would first obtain our judgement about the probability of various values for each variable, and use those various values for each variable in the very same equation. The ‘simula- tion process’ is the process employed for using various values for each variable, as illustrated in Fig. 2.
First, we construct the uncertainty profile for each key input factor (Price, field size, and cost), exactly as we did for the airplane example. Next, we select a value from the profile of each input factor; the key function of the simulation process is to ensure that the probability of selecting any particular value is proportional to the probability of occurrence of that value of the factor, as de- termined from the uncertainty profile. Then, we combine each of these individual values for each input factor, by substituting them in the same formula we would use for a deterministic analysis. Then, we repeat the steps listed in this paragraph many (several hundred) times.
B.C. Ball, Jr. / Managing risk in the real world 253
2. Computer simulator selects one value from the Protlle Of each factor. I” ,*lsllon to me Chance each “a,“* has occ”rrlnp. (SelectIon p,ocess Is llke throwl”~ a dart at a spi”“i”g wheel.)
Fig. 2
P,lCR WEbI.
3. Combtnes “al”*s selected to determIne a ne, pr*Se”t “Sl”B 1or tlla PBrtiCUtar comb,ns,,o” of YS,WS (e.2.. $2MM).
PWCX”tage Of S,,“a,lo”s (Probablllty cl Occ”rrance)
C”m”tstl”e Probability
4MM ,.a 5MM 6 5
2MM to 4MM 20 25
0 lo 2MM 40 85
-lMM ,.a 0 35 too
‘The results of the calculations described in the preceding paragraph (in our example, these results would be several hundred values for percent re- turn) are listed, from highest to lowest. Then, we determine the percent of the total number of the results that fall within a given range of percent returns. This gives us the cumulative probabilities of the results (percent returns).
Several things need to be emphasized about the cumulative probability curve resulting from the simulation process: First, it looks like the curve representing our subjective judgements about un- certain data, but it is different. It, rather, repre- sents the probability of results, based on our sub- jective judgements about the data. Second, as we shall soon see, it is the shape of this curve that is all-important, rather than the value of any particu- lar point along it. For example, the ‘expected value’ of our percent return can now be calculated from the shape of the curve, and is not the percent return corresponding to the 50% probability ordinate.
This curve represents all we know about the proposed expenditure-no more and no less. Soon, we shall deal with the important issue of how it can actually be used in corporate decision-making. However, it is most helpful if management deals
first with a couple of preliminary issues. The first of these is to agree on some terminology.
3.4. Some enabling terminology
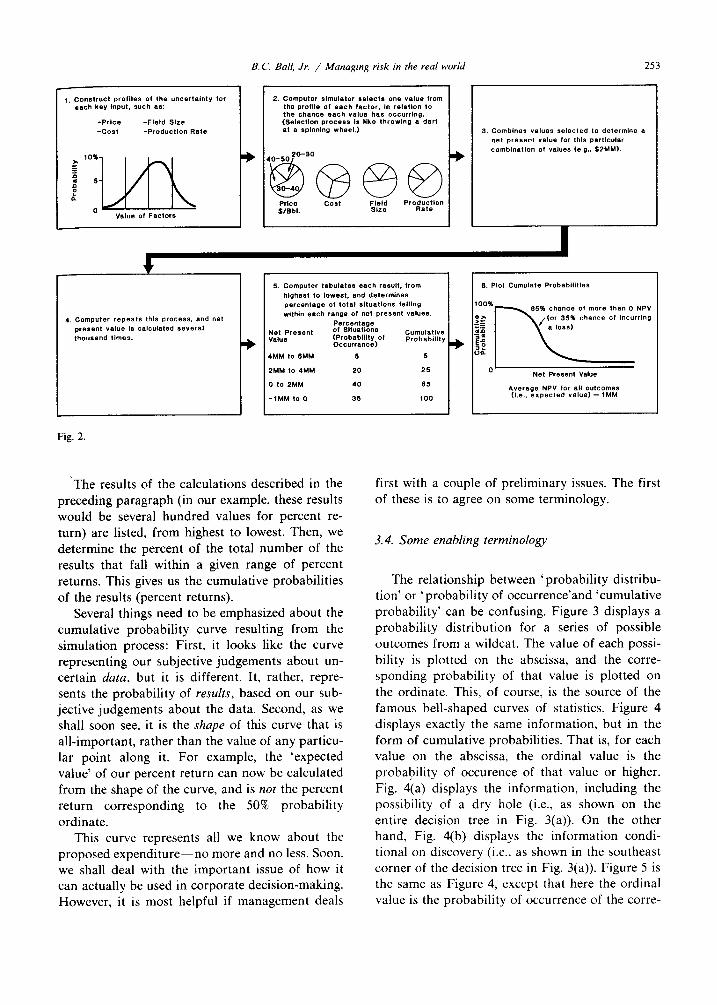
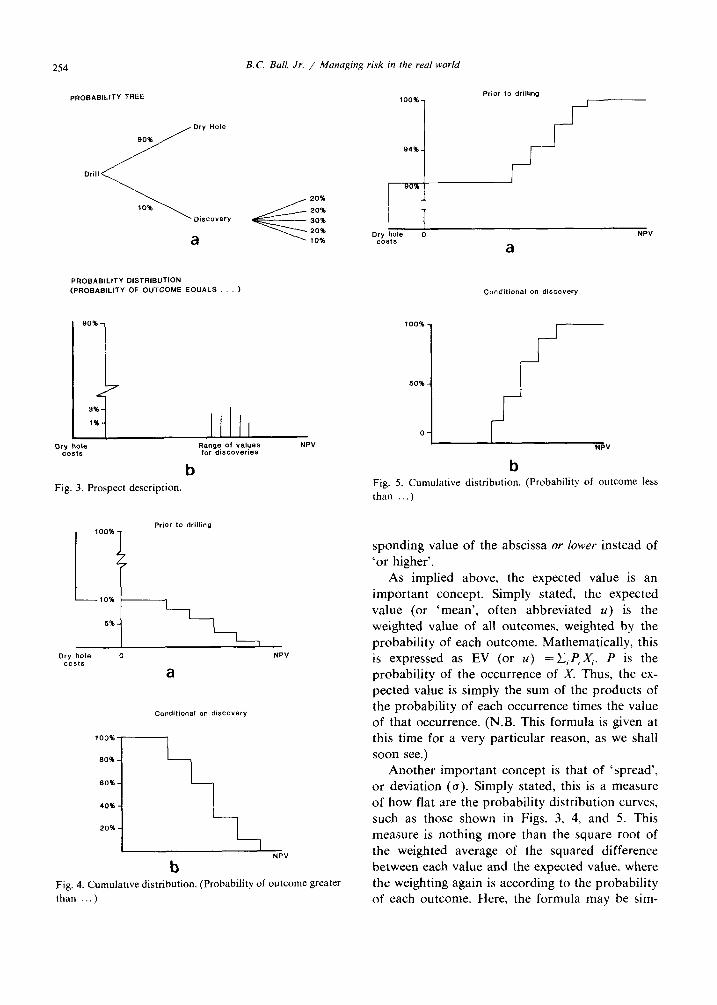
The relationship between ‘probability distribu- tion’ or ‘probability of occurrence’and ‘cumulative probability’ can be confusing. Figure 3 displays a probability distribution for a series of possible outcomes from a wildcat. The value of each possi- bility is plotted on the abscissa, and the corre- sponding probability of that value is plotted on the ordinate. This, of course, is the source of the famous bell-shaped curves of statistics. Figure 4 displays exactly the same information, but in the form of cumulative probabilities. That is, for each value on the abscissa, the ordinal value is the probability of occurence of that value or higher. Fig. 4(a) displays the information, including the possibility of a dry hole (i.e., as shown on the entire decision tree in Fig. 3(a)). On the other hand, Fig. 4(b) displays the information condi- tional on discovery (i.e., as shown in the southeast corner of the decision tree in Fig. 3(a)). Figure 5 is the same as Figure 4, except that here the ordinal value is the probability of occurrence of the corre-
254 B.C. Ball, Jr. / Managing risk rn the reul world
PROBABILITY TREE
Drill
<
Dry Hole
90%
10%
Discovery
a
PROSAElLlTY DlSTRlSUTlON (PROEASILITY OF OUTCOME EQUALS. 1
90%
LL 3%
1%
*
20%
20%
30%
20%
10%
Range Of values NP” for discoveries
b Fig. 3. Prospect description.
Prior to drilling
I 100% 1
Cmdifional on discovery
b NPV
Fig. 4. Cumulatwe distribution. (Probability of outcome greater than )
lOO%- Prior lo drilling
9496 -
T Dry hole 0 NPV
costs
100%
50%
0
a
I’ b
NP”
Fig. 5. Cumulative distribution. (Probability of outcome less than )
sponding value of the abscissa or lower instead of ‘or higher’.
As implied above, the expected value is an important concept. Simply stated, the expected value (or ‘mean’, often abbreviated U) is the weighted value of all outcomes, weighted by the probability of each outcome. Mathematically, this is expressed as EV (or u) = &P, X,. P is the probability of the occurrence of X. Thus, the ex- pected value is simply the sum of the products of the probability of each occurrence times the value of that occurrence. (N.B. This formula is given at this time for a very particular reason, as we shall soon see.)
Another important concept is that of ‘spread’, or deviation (a). Simply stated, this is a measure of how flat are the probability distribution curves, such as those shown in Figs. 3, 4, and 5. This measure is nothing more than the square root of the weighted average of the squared difference between each value and the expected value, where the weighting again is according to the probability of each outcome. Here, the formula may be sim-

B.C. Ball, Jr. / Managing risk in the real world 255
pler than the explanation: spread (or deviation,
a) = 7 zjP, (X, - EV) . Now, here is the payoff.
3.5. The payoff
When management even begins to think about any quantification of risk or uncertainty, or about any systemic or objective approach to dealing with it, the hue and cry goes up. “I have a good idea about the expected value, but I have no way to estimate the ‘spread’.” Now, carefully compare the two expressions given above, the one for expected value and the one for spread. They both contain exactly the same elements. Therefore, if .you cannot estimate the spread, then neither can you estimate the expected value. This is not just a mathematical trick. Rather, the person who says this has very simply not thought about uncertainty and ex- pected values in the kind of disciplined way that we wish to pursue here. The person who says this simply needs to be offered, for example, the struc- ture illustrated in the airline example as a way of approaching the issues of expected value and spread.
3.6. Management’s tasks
Many managers will say that their major task is to minimize risk and maximize return. Even if this is true, it is not stated in operational terms, for-at best-minimizing risk implies reducing return, and maximizing return implies increasing risk. There- fore, a more operational statement might be that a management’s major task is to maximize expected returns for a given level of risk tolerance, and to
EFFICIENT PORTFOLIO OPPORTUNITIES
Fig. 6.
- s Pre‘erred to A - c Preferred to A -6 7 c
minimize risk for a targeted expected return level. This, then breaks down into two very specific tasks. The first (Fig. 6) is to identify the portfolios of opportunities, arranged according to their risk/return relationships. As shown on this figure, both b and c are both clearly preferable to a. One always wants to be as far southeast on this dia- gram as is possible. But, how does one choose between b and c? This choice, of course, is de- termined by management’s attitudes toward risk. Therefore, the second specific task is to choose the ‘efficient’ portfolio (an efficient portfolio is any point along the curve of Fig. 6) that best fits the organization’s objectives.
3.7. Which efficient portfolio?
A little later, we will deal specifically with the issue of how to select among the efficient portfolios available. And, perhaps to the disappointment of the serious decision analyst, operations researcher, or management scientist, we will do so without resorting to utility or preference theory. We do this without apology, for, at least in the experience of the writer, attempting to incorporate utility theory with decision analysis has been a major reason for the early demise of the latter in many corporate settings. We have now found that utility considerations are simply not needed in order to deal with the issue at hand; therefore, its use can be postponed until management senses a need for it. When that happens, it can be added to the process in a very straightforward manner.
3.8. Why a ‘portfolio?’
In the meantime, it is appropriate to explain why we refer to each point on the efficient frontier as a ‘portfolio’. We mean by portfolio the mix of individual prospects that makes up a point on the efficient frontier. Given any specific set of availa- ble prospects, they could be combined in a large variety of ways. Each ‘way’ we are calling here a portfolio. If all of these ways were plotted, risk versus return, and a curve drawn through the southeast-most points, then the curve would repre- sent the efficient frontier, and the points on the curve would represent the efficient portfolios (of prospects) available to management. It is from among these portfolios that management must choose, as is illustrated on Fig. 7.

256 B.C. Bail, Jr. / Managing risk in the real world
Fig. I.
3.9. Management task No. 1: Determining the risk and return characteristics of each prospect
As previously indicated, in evaluating a pros- pect, we need to know everything the geologist/ geophysicist knows about the prospect-no more and no less-but in a useable way. We do this by having him determine his subjective judgement about the probability of each of the important and uncertain scientific factors, as in the airplane ex- ample, and then relating them to results (e.g., recoverable hydrocarbons) as described under the simulation process. The only new steps here are the use of probabilistic data rather than determin- istic data, and the addition of the simulation pro- cess to the conventional physical relationships, in order to utilize the probabilistic dimension of the data. The output might well look like Fig. 8, which then could be given to the petroleum and reservoir engineers, who could convert it to production pat- terns through the life of the field, and to those who deal with future prices and costs, who could con- vert it first into cash flow patterns through the life of the field and then into net present value-each and all related to probability. In other words, a final result in terms of net present value would look just like Fig. 8.
It is worthwhile pointing out that risk analysis can be employed equally effectively and simply at each stage of the prospect evaluation. For exam- ple, if one considers future oil prices somewhat
Oil Potential Variables Conditional Probability of Greater Than or Equal to
*ma of closure 1.0 10.0 t*.ll 23.0 26.0 33.0 50.0 Reservon thickness 10.0 14.0 22.0 40.0 50.0 70.0 90.0 Porosrty .08 .*o .*1 .12 .I4 .I5 16 Trap fill .05 .lO .2 .5 .6 17 Recovery factor
:h
Wster sstwstion .25 Shrinkage .7 Gas fraction .5
x oil fraction x reeovery
Probability of greater than or equal to
I
I Economic Analysis w
I Expected Returns
Fig. 8.
uncertain, then subjective judgements about the probabilities of various price levels could easily be incorporated into the evaluation.
3. IO. The benefits of diversification
Before management can consider the prospects available, they must first be converted into portfolios. Hopefully, this seems like the next logical step, flowing naturally out of the argument made here up to this point. However, it is important to note that in practice, this step is not followed by most firms engaged in oil and gas exploration. In fact, it is impossible if deterministic data (even with sensi- tivity analysis) is used in conducting the prospect evaluation. The implication is that the firm em- ploying risk analysis obtains thereby an inherent competitive advantage over the firms who do not. If a firm uses deterministic prospect evaluations, this in itself prevents it from considering portfolios; it is left with the necessity of considering prospects individually or sequentially. In order to appreciate

B.C. Bail, Jr. / Managing risk in the real world 251
the importance of this implication, management needs first to understand five facts about the world of uncertainty. Some of these facts are less intui- tive than others; in fact, some lead to entirely counterintuitive results. All are important.
3.11. The first fact of uncertainty: More prospects -+ lower risk portfolio
Let us assume you have two choices. Choice A is a large prospect with a given dry-hole cost, dry-hole risk, and expected value. Choice B is an investment in ten prospects, each with one-tenth the dry-hole cost and expected value of A, and with the same dry-hole risk. The fact is that al- though the expected value of the two choices is identical, and the spread (deviation) of A is identi- cal to the spread of each prospect in B, the spread of B is lower than the spread of A; that is, A and B have equal expected values, and B is less risky. Therefore, most investors would select B: it is to the southeast of A. It might be well to recognize in passing that a risk-prone individual might, never- theless select A, since it does have a better proba- bility of ‘making a killing’.
3.12. The second fact of uncertainty: High risk prospects * high risk portfolios
Let us assume you have two choices. Choice C is 100% interest in each of 10 wells. Choice D is 5% interest in each of 25 wells. D is riskier, with a higher dry-hole cost. Both choices have the same expected value per dollar invested, and both re- quire the same investment. Which do you choose? The answer is, there is simply not enough data given to make a logical choice. The reason is that the increased diversity of D tends to offset its increased riskiness. If all of the appropriate data is given, then direct application of the binomial theo- rem quickly yields an analytical comparison. The
Table 1 3 groups of prospects; Budget = $1000000
Prospect Expected Spread of Total
group value outcomes investment
A $100000 * 200 000 $1000 000 B $200 000 * 200000 $1000000 C $200 000 f 300 000 $1000000
Table 2
(1) Minimize variance, subject to Expected Value = chosen value
(2) Variance = S,’ VA + SiV, + Sf Vc EV = S,EV, + S,EV, + S,EV, &=I-s,-s,
(3) For example Portfolio z: (a)EV=0.2=100S,=200S,=200(1-S,-S,)
s, = 0 (b) Variance = 40000 Si +90000(1- S,)’
(c) Minimum g = 0 R -,
0=80000s,-180000(1-s,) S, = 0.69
point is, if one selects his portfolio by selecting the lowest risk prospects, he is likely to fall far short of reaching the efficient frontier. That is to say, he will be taking a higher risk for a given return, or will receive a lower return for a given risk, than one who utilizes risk analysis.
3.13. The third fact of uncertainty: The best individ- ual prospects + the best portfolio
Consider now three choices, as shown in Table 1. How would you invest $1000 OOO? I have asked this question at dozens of seminars of ex- plorationists, managers, and even a few OR and MS types, offering at each a crisp, new $20 bill for a correct answer. I still have my original $20. Although there are a range of ‘correct’ answers, the simplest one is 69% B, 31% C, and none of A. To determine an efficient portfolio, we must make the optimum tradeoffs between risk, expected value, and diversity. This can only be done ana- lytically. The results of the analytics for the Table 1 example are given in the bottom curve on Fig. 9. Therefore, correct answers would include X, y, or z. (See also Table 2.)
3.14. The fourth fact of uncertainty: Diversification does not change expected value
Here we will switch examples, for the sake of clarity. Dice are being rolled, and you are to bet $100 on snakeyes. Which has the higher expected value: one $100 bet on one roll, or ten $10 bets on ten rolls? The answer, of course, is that the ex- pected value of the two choices is identical. As we have seen before, the spreads are different, but
258 B.C. Ball, Jr. / Managing risk in the real world
Table 3 $100 to bet on snakeyes; Comes up once in 36 rolls; Payout = $30 per $ bet
P(snakeyes) X payout
= E(payout) per bet x # of bets
= E(payout) - Amount of bet
= EV
One $100 bet
l/36 x 3000
3000/36 Xl
3000/36 -100
- 600/36
Ten $10 bets
l/36 x300
300/36 x 10
3000/36 - 100
- 600/36
their expected values are not, as demonstrated in Table 3. Diversification of prospects in a portfolio does not change or improve the expected value.
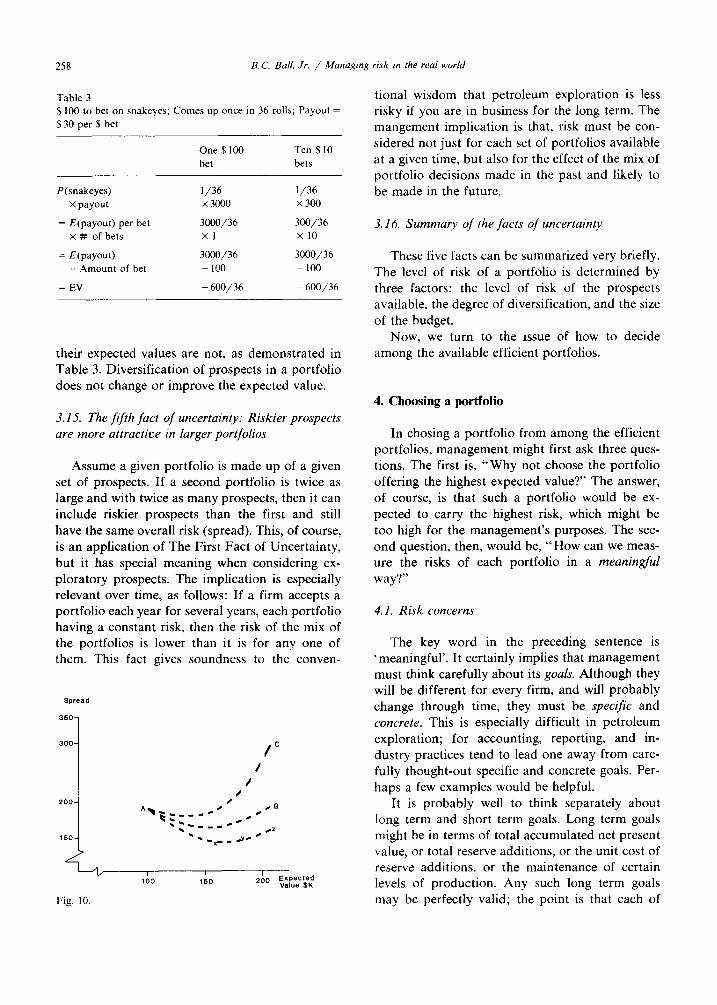
3. I.5. The fifth fact of uncertainty: Riskier prospects are more attractive in larger portfolios
Assume a given portfolio is made up of a given set of prospects. If a second portfolio is twice as large and with twice as many prospects, then it can include riskier prospects than the first and still have the same overall risk (spread). This, of course, is an application of The First Fact of Uncertainty, but it has special meaning when considering ex- ploratory prospects. The implication is especially relevant over time, as follows: If a firm accepts a portfolio each year for several years, each portfolio having a constant risk, then the risk of the mix of the portfolios is lower than it is for any one of them. This fact gives soundness to the conven-
Spread
tional wisdom that petroleum exploration is less risky if you are in business for the long term. The mangement implication is that, risk must be con- sidered not just for each set of portfolios available at a given time, but also for the effect of the mix of portfolio decisions made in the past and likely to be made in the future.
3.16. Summary of the facts of uncertainty
These five facts can be summarized very briefly. The level of risk of a portfolio is determined by three factors: the level of risk of the prospects available. the degree of diversification, and the size of the budget.
Now, we turn to the issue of how to decide among the available efficient portfolios.
4. Choosing a portfolio
In chasing a portfolio from among the efficient portfolios, management might first ask three ques- tions. The first is, “Why not choose the portfolio offering the highest expected value?” The answer, of course, is that such a portfolio would be ex- pected to carry the highest risk, which might be too high for the management’s purposes. The sec- ond question, then, would be, “How can we meas- ure the risks of each portfolio in a meaningful way?”
4. I. Risk concerns
The key word in the preceding sentence is ‘meaningful’. It certainly implies that management must think carefully about its goals. Although they will be different for every firm, and will probably change through time, they must be specific and concrete. This is especially difficult in petroleum exploration; for accounting, reporting, and in- dustry practices tend to lead one away from care- fully thought-out specific and concrete goals. Per- haps a few examples would be helpful.
It is probably well to think separately about long term and short term goals. Long term goals might be in terms of total accumulated net present value, or total reserve additions, or the unit cost of reserve additions, or the maintenance of certain levels of production. Any such long term goals may be perfectly valid; the point is that each of

B.C. Bali, Jr. / Managing risk in the real world 259
those given as illustrations are different, and hard choices must be made.
Short term goals might include net cash flow, effect on taxes, effect on book net income and/or balance sheet, or market value of reserve additions compared to cash expenditures. Again, any of these may be valid, but they differ dramatically from each other. Management must make hard choices.
4.2. Risk measures
As one would expect, there are a number of analytical methods for measuring the risk of a portfolio. The most useful ones will be described here. After management has articulated its long and short term goals, it is the easier task to select the appropriate measures from among those availa- ble.
The most straightforward risk measurements are the probability of missing the target, P (-c Target), the probability of not breaking even on a value basis, P( < 0), and the expected loss, given that a loss occurs (on a value basis), E(Loss/Lose). These measures are direct, focus on major manage- ment concerns, and can be applied as either short or long term measures. On the other hand, any one of them does not reflect a full range of risk con- cerns, and therefore could be misleading. Of course, ‘targets’ (or even zero, for that matter), are arbi- trary. Perhaps a principal limitation of these meas- ures is the difficulty in their application to several different targets.
A more general, but still straightforward risk measurement is loss potential, which is the product of the probability of a loss times the expected size of a loss, given a loss, P(Loss) x E(Loss/Lose). (A corresponding measure of shortfall potential would be P( < Target) X E(Shortfall/Shortfall.) This measure has the same kinds of limitations men- tioned above, but is significantly less likely to mislead.
The confidence level (spread, deviation, or vari- ance), i.e., the range of outcomes to be expected some given percentage of the time, considers a broader range of concerns. Even though it is some- what esoteric, it is not very difficult to understand conceptually, but is more difficult to apply in practice. The result is that it gives minimal gui-
dance to management on how to compare portfolios, and would require the use of implicit, if not obscure decision rules.
The key element is this: Match very carefully management’s short and long term goals and risk concerns with the available analytical methods for measuring risk. The important elements manage- ment needs to understand is the relationships be- tween the measurements and their concerns: how each measurement deals with their concerns, and how each of their concerns are dealt with.
For example, a mix of risk concerns (which, of course, is not unusual), complicates decision mak- ing, and suggests an iterative approach. Say, for mangement in the short term is over receiving value (e.g., market value of reserve additions) in relation to current cash expenditures. In the long term, its primary concern is over creating a target amount of wealth on a present value basis. Then its decision process might be as follows: Select the efficient portfolio with the highest net present value, limited by management’s tolerance for the corresponding probability of missing its target. Then, check for short term risk by considering the short term loss potential; if this is too high for comfort, then a less risky portfolio (and one with a lower expected net present value) must be accepted.
4.3. Real world complications
The process conceived here must, to be practi- cal, recognize the complicating factors implicit in the real world of petroleum exploration. None of these become more complicated because of the use of risk analysis, per se. However, it is worth men- tioning some of the more important of these com- plicating factors, just to recognize that they must and can be included in the process.
There are, in the commercial world, a multitude of leasehold and joint venture possibilities availa- ble. For any given lease, those that are available need to be identified, and each then considered as if it were a separate prospect (with care, of course, not to permit chasing the same lease twice, each under a different arrangement).
The diversification of geological risk (i.e., among different basins) needs to be treated differently than simple prospect diversification. As mentioned before, non-geological uncertainties-such as price, taxes, and regulations-need to and can be dealt with in the analysis.

260 B.C. Ball, Jr. / Managing risk in the real world
The concept of ‘prospects’ needs to be main- tained in a dynamic context. The availability of prospects can change rapidly with time, as can the information available about particular prospects.
4.4. The first of two final factors: The budget
The absolute size of the exploratory budget has an effect on the selection of the efficient portfolio with the appropriate risk characteristics, but in a way that can not be determined a priori. Consider this: Assume a budget level has been set, and the corresponding portfolio selected. Then, it is desired to consider the effect of increasing the budget. A new efficient frontier would then be determined, with each efficient portfolio now larger in absolute size, corresponding to the higher budget. Will the new efficient frontier have moved southeasterly or northwesterly? That is, relative to return, has risk been increased or decreased? One can not know the answer without conducting the analysis.
Two opposing factors are at work here simulta- neously. The first, and favorable one, is diversifi- cation. A larger number of prospects can be in- cluded, which would tend to decrease risk relative to return. On the other hand, the added prospects will tend to be the less desirable ones, measured by the criterion of their risk/return relationship, since one would expect the more desirable ones to have been selected at the lower budget level; this factor, of course, would tend to increase the risk of the portfolio. Therefore, the size of the exploratory budget is an important variable in selecting the portfolio.
4.5. The final factor: Accountability for implementa- tion
As in any management system, a system of accountability is critical to its success. And, as in most management systems, accountability is usu- ally omitted in practice from attempts to deal articulately with risk. The usual reason given for omitting accountability from risk management sys- tems is, in fact, based on a fallacy.
The common wisdom is that risk analysis, risk management, decision analysis, or whatever, is ap- propriate only if a firm has a very large distribu- tion of prospects in which it is investing. In fact, quite the contrary is true. If a firm invests regu- larly in a very large number of prospects (say, a la
Exxon), then it realizes for that reason alone most of the advantages of diversification of risk, and an articulated analysis is likely to add only marginally to improve the risk/return relationship of its portfolio. On the other hand, if a firm invests in only a few prospects, then the value that can be added by an articulated risk management analysis can be significant indeed. Stated simply, if you invest everywhere, then your portfolio probably is pretty good. If you only invest in a very few places, then the selection of those particular places is everything, and any assistance in making a wise set of choices can be vital!
The logical extension of this argument is that, if you can only drill a few prospects, then by all means manage the risk. And, a few prospects is all that is needed for effective accountability, espe- cially if the motivation system for those responsi- ble for prospect evaluation is tied to the accounta- bility system.
Implicit in the portfolio chosen by management are the specific prospects which make up that portfolio. For accountability purposes, the risk characteristics of this portfolio are displayed as a cumulative probability distribution, plotting, say, the percent of wildcat dollars spent for wells with reserve additions of various size ranges, including 0 to represent the dry holes. Then, after the selected prospects have been drilled, the actual results can be displayed on the same basis, and compared with the information based on the a priori pros- pect evaluations.
Such a comparison will achieve two important results. First, it serves as a discipline on the a priori prospect evaluations (i.e., the probabilistic geologic data), since the evaluator knows he will be measured against its statistical reliability. The second is to inform management as to how closely the selected risk profile is being followed. This latter point implies that management would have equal interest in knowing if the actual exploration was either more or less risky than they had in- tended, independent of the actual deterministic results, say, in terms of reserve additions per wildcat dollar.
Of course, in addition to this accountability for prospect evaluation and risk profile, management would also be interested in these more usual de- terministic results.
These two final factors now permit an overview of the process as a whole.
B.C. Ball, Jr. / Managing risk in the real world 261
5. The essential steps References
Now we can summarize briefly the steps we have outlined in managing petroleum exploratory risk. First, the geologists, geophysicists, engineers, etc., evaluate on a probabilistic basis the various prospects that are available. These evaluations in- clude the economic dimensions, i.e., the values are expressed in dollars. Each expert contributes his subjective judgements on the probabilities of the various relevant factors within his area of exper- tise. These probabilistic values are combined using traditional relations, e.g., between the geologic variables and recoverable hydrocarbons.
Management then determines from these pros- pect evaluations the efficient portfolios available, depending on the size of the exploratory budget. It selects the appropriate portfolio, using the decision criteria and risk measurements that reflect its stated goals and risk concerns.
The chosen portfolio is decomposed into the mix of prospects which make it up. This is the mix of prospects which is then exploited by the opera- tional division of the organization.
Actual results are compared with those that were anticipated by management. More im- portantly, the actual risk to which management was exposed is compared to the risk to which they were led to believe they would be exposed, as was implicit in the portfolio selected. Finally, the geol- ogists, geophysicists, engineers, etc., who identified and evaluated the prospects comprising the selected portfolio are rewarded on the basis of these com- parisons.
[II
PI
I31
[41
151
[61
171
PI
191
[lOI
[Ill
[I21
iI31
iI41
B.C. Ball, Jr., Managing risk in the real world, The In- stitute of Management Sciences, Lausanne, Switzerland, (1982). J.M. Cozzolino, Management of Oil and Gas Exploration Risk (Cozzolino Associates, Inc., W. Berlin, NJ, 1977). J.M. Griffin and D.J. Teece, OPEC behavior and the long run price of oil, University of Houston and Stanford University Working Paper. C.J. Grayson, Decisions under uncertainty: drilling deci- sions by oil and gas operators, Harvard Business School, Boston, MA (1960). D.B. Hertz, Investment policies that pay off, Harvard Business Rev. (January-February, 1968). D.B. Hertz, Risk analysis in capital investment, Harvard Business Rev (September-October 1979). G.M. Kaufman, Statistical Decision and Related Tech- niques in Oil and Gas Exploration (Prentice-Hall, En- glewood Cliffs, NJ 1963). R.E. Megill, Exploration Economics (PennWell Books, Tulsa, OK, 1979). R.E. Megill, An Introduction to Risk Analysis (PennWell Books, Tulsa, OK, 1977). A.W. McCray, Petroleum Evaluations and Economic Deci- sions (Prentice-Hall, Englewood Cliffs, NJ, 1975). P.D. Newendorp, Decision Analysis for Petroleum Explora- tion (The Petroleum Publishing Co., Tulsa, OK, 1975). H. Raiffa, Decision Anai$sis (Addison-Wesley, Reading, MA, 1968). D.J. Teece, OPEC behavior: An alternate view, Stanford University Research Paper No. 626 (1981). C.A. Von Holstein, S. Stael and J.E. Matheson, A Manual
for Encoding Probability Distributions (SRI International, Menlo Park, CA, 1979).
If a man will begin with certainties he will end with doubts, but if he will be content to begin with doubts he shall end in certainties.
Francis Bacon (1561- 1626)