managing our carbon emissions - guildford … our carbon emissions.pdf · usina santa elisa mill in...
TRANSCRIPT

Managing our Carbon Emissions
Dr Bill Kyte OBE
Talk given to GEF 26 April 2017
or
How can we be made to do so?
Scope of Presentation
• Targets • What do they mean? • What is the scale of the problem? • Some options to illustrate scale
• International scene • Intergovernmental Panel on Climate Change (IPCC) • UN Framework Convention on Climate Change (UNFCCC)
• Tools for governments • Voluntary, Command & Control, Economic Instruments
• EU Emissions Trading Scheme (EU-ETS) • Past, present & future • Brexit

Assumptions
• For this talk I will assume that:
• Enhanced Global Warming (Climate change) is real
• Climate change is caused by mankind’s actions
• There is a need to restrict temp rise to 2o C (1.5oC)
• There is a need for local, national, regional & global action
• The Paris agreement will hold
Targets

What should be targeted?
• Emissions of greenhouse gases (GHG)
• Concentration of GHGs in atmosphere
• Temperature rise

It is not simple

What is the Target
• 2o C has been identified as a ‘threshold’ above which there is a significant increase in ‘dangerous’ impacts and therefore has been adopted as a political target.
• Many would argue that 1.5o C is more appropriate.

CO2 emissions stock and average temperature

What does 2oC imply?
• International • 1,000 Gt C total carbon budget
• Emissions peak by 2020
• Only 50% of 1990 global emissions by 2050
• EU • 40% by 2030 of 1990 emissions – legally binding
• 80-95% by 2050 - aspiration
• UK • 57% by 2030 of 1990 emissions – legally binding
• 80% by 2050 - legally binding

GHG Emissions by Sector
Emissions Sector Percentage
Transportation 14
Electricity & Heat 25
Industry 14
Fossil fuel production 14
Land use change 18
Agriculture 14
Waste 4

What is the Scale of the Problem?
In 2004 two US academics came up with a concept of how to stabilise emissions through the use of ‘wedges’ as a strategy whereby each wedge would reduce carbon emissions rising from zero to 1 gigaton of carbon/year in 50 years time.
This would give a cumulative reduction of 25Gt over 50 years.


Options for change – enabling technologies
A further shift
to natural gas
Nuclear
power
Renewables Bio-products Carbon capture
and storage
Mass
transportation
Road
transport
Buildings Low energy
appliances
Doing things
differently
Energy conservation and efficiency
Emission reduction

Effort needed for
1 wedge:
• 1,400 new gas fired
power stations
• ~2 per month
Natural Gas for Power Generation
Current proven reserves of natural gas ~ 65
years
Increased shift to gas would reduce this
Challenge is to discover new reserves of
natural gas, and equally importantly, bring
this gas to markets
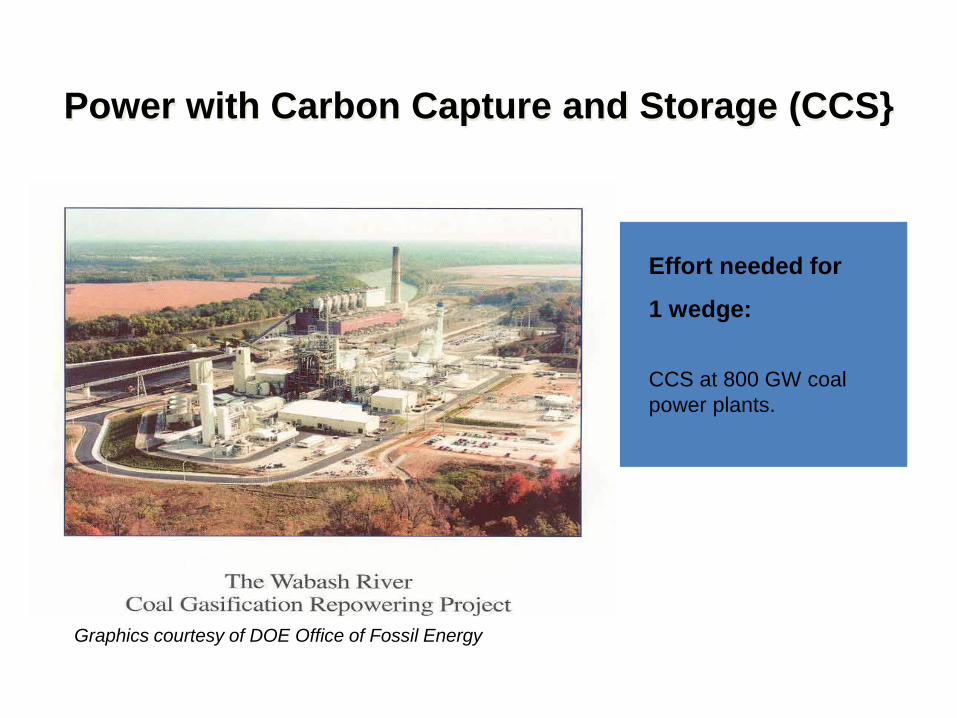
Power with Carbon Capture and Storage (CCS}
Graphics courtesy of DOE Office of Fossil Energy
Effort needed for
1 wedge:
CCS at 800 GW coal
power plants.

Carbon Storage
Effort needed by 2054 for 1 wedge:
3,500 Sleipners
A flow of CO2 into the Earth equal to the
flow of oil out of the Earth today
Graphic courtesy of Statoil ASA
Start now to gain experience with
the permitting of storage sites.

Effort needed by 2054 for 1 wedge:
Add 700 GW (twice current capacity):
fourteen 1-GW plants/year.
Nuclear Electricity
Graphic courtesy of NRC
Plutonium (Pu) produced by 2054, if fuel cycles
are unchanged: 4000 t Pu (and another 4000 t
Pu if current capacity is continued).
Compare with ~ 1000 t Pu in all current spent
fuel, ~ 100 t Pu in all U.S. weapons.
10 kg ~ Pu critical mass. Potential Pitfalls:
Nuclear proliferation and terrorism
Nuclear waste, NIMBY

Wind Electricity
Effort needed for
1 wedge:
400,000 5 MW windmills
Needs: 2,000 GW
Today: 433 GW
Land cover 30 million
hectares (size of
Germany)
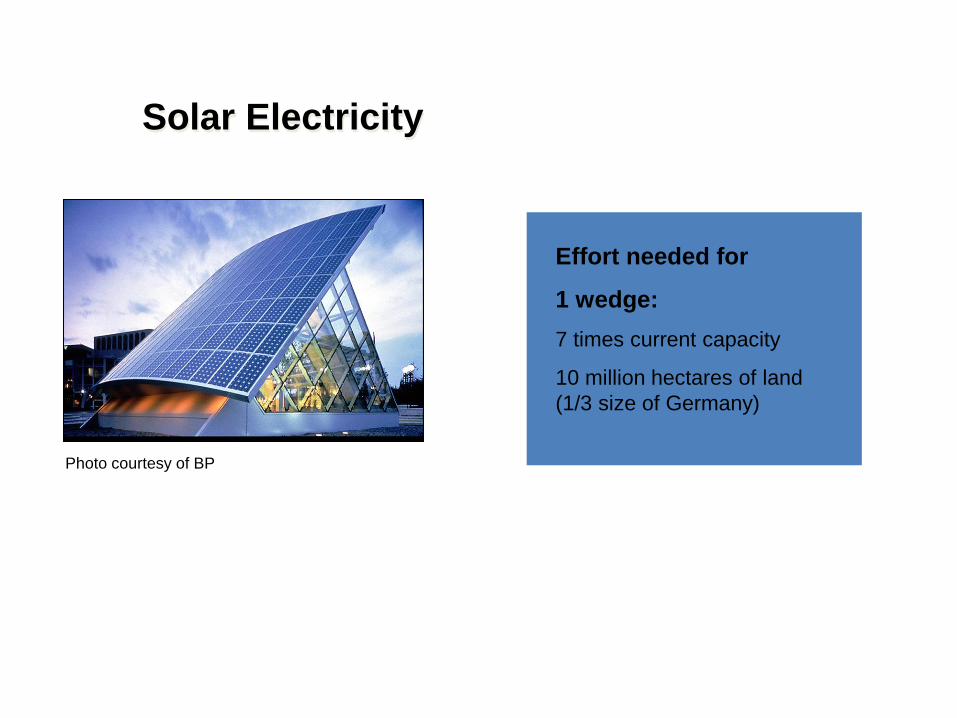
Solar Electricity
Effort needed for
1 wedge:
7 times current capacity
10 million hectares of land
(1/3 size of Germany)
Photo courtesy of BP

Biofuels
Effort needed
1 wedge:
Two billion 60 mpg cars
running on biofuels
250 million hectares of
high-yield crops (one
sixth of world cropland).
Usina Santa Elisa mill in Sertaozinho, Brazil
(http://www.nrel.gov/data/pix/searchpix.cgi?getrec=5691971&display_type=verbose&search_reverse=1_

Effort needed for
1 wedge:
Mass transportation replaces half of
projected road travel
Mass Transportation
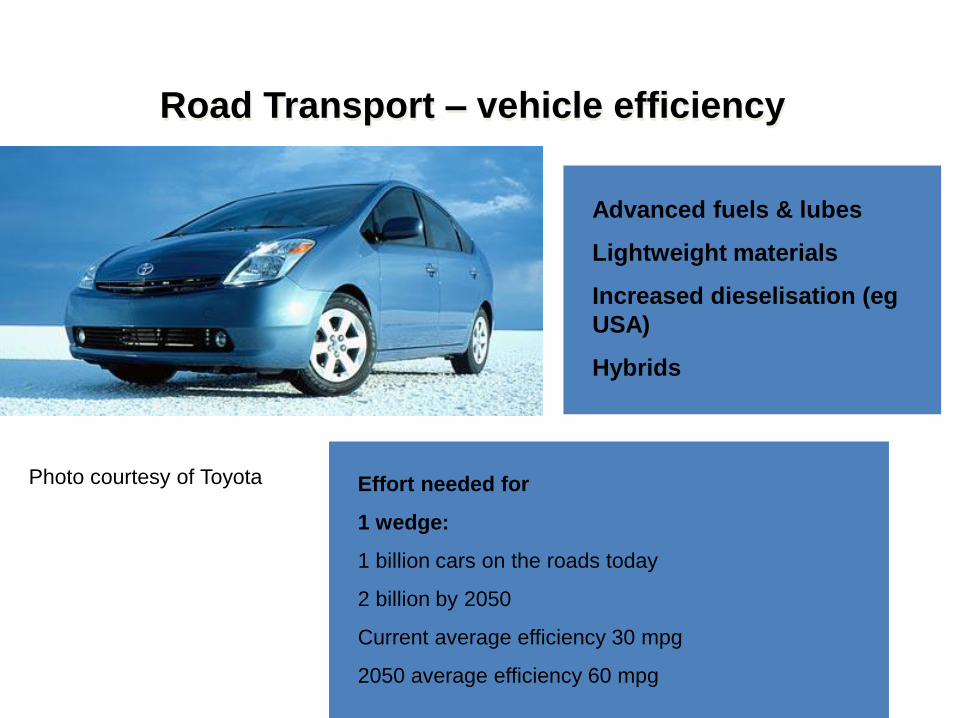
Road Transport – vehicle efficiency
Effort needed for
1 wedge:
1 billion cars on the roads today
2 billion by 2050
Current average efficiency 30 mpg
2050 average efficiency 60 mpg
Advanced fuels & lubes
Lightweight materials
Increased dieselisation (eg
USA)
Hybrids
Photo courtesy of Toyota

Buildings / Low Energy Appliances
Space heating/cooling
Water heating
Lighting
Appliances
Effort needed for
1 wedge:
Buildings emit 3.9 Gt/yr carbon = 20% of total
Cutting emissions by 25% from 2050 BAU =
1 Gt/yr C
More than half the potential in developing
regions
Example:
10 billion incandescent lamps today
50 billion by 2050
Full replacement with efficient bulbs would
reduce 0.5 Gt/yr C in 2054, assuming existing
carbon intensity of power generation
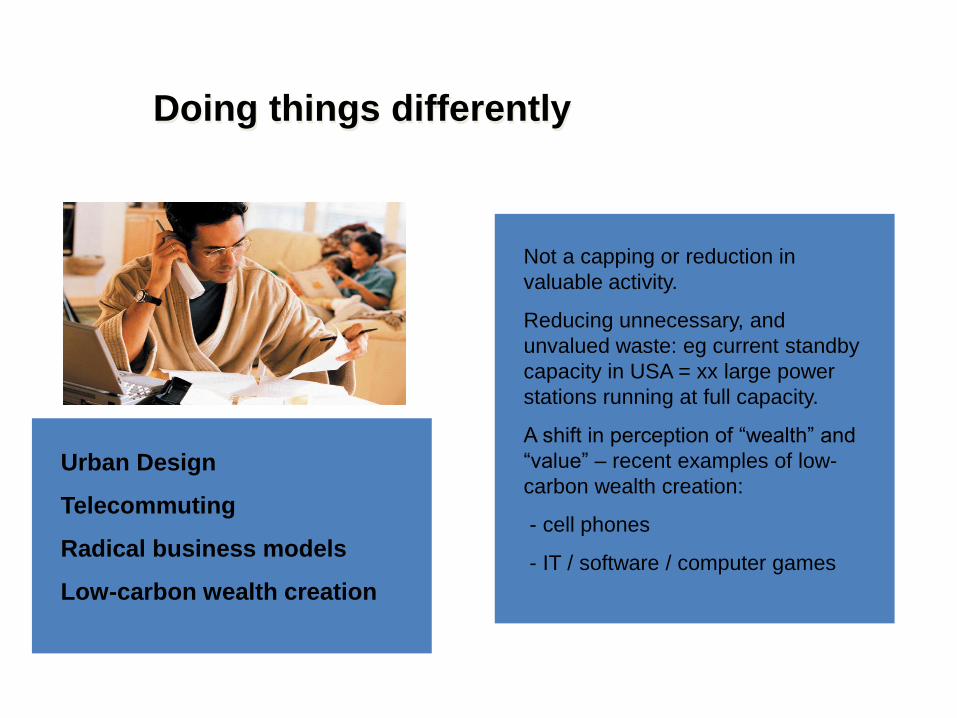
Doing things differently
Not a capping or reduction in
valuable activity.
Reducing unnecessary, and
unvalued waste: eg current standby
capacity in USA = xx large power
stations running at full capacity.
A shift in perception of “wealth” and
“value” – recent examples of low-
carbon wealth creation:
- cell phones
- IT / software / computer games
Urban Design
Telecommuting
Radical business models
Low-carbon wealth creation

2004 - Humanity Already has the Tools
• Emissions rise can be balanced by wedges reduction
• AVAILABILITY: Most wedge technologies are already deployed somewhere at commercial scale.
• PORTFOLIO: No single wedge technology can do the whole job, or even half the job.
• CHOICE: Not every wedge technology is needed.

* UPDATE Emissions are now 9.8 Gt C (2015)
*

More wedges
• Use renewables to generate hydrogen for: • Fuel cells for transport
• Injection into gas mains (10% possible without adaption)
• Halt deforestation coupled with reforestation • Reforestation about half the size of Australia
• Employ conservation tillage on all cropland • No ploughing
• Use sequestration from fossil fuel plants for: • Synfuels
• Hydrogen

2017 - Humanity Still has the Tools
• Emissions are rising much faster than wedge reductions
• AVAILABILITY: All wedge technologies are already deployed somewhere at commercial scale.
• PORTFOLIO: No single wedge technology can do the whole job, or even a substantial fraction of the job.
• CHOICE: Every wedge technology is needed.

International Scene
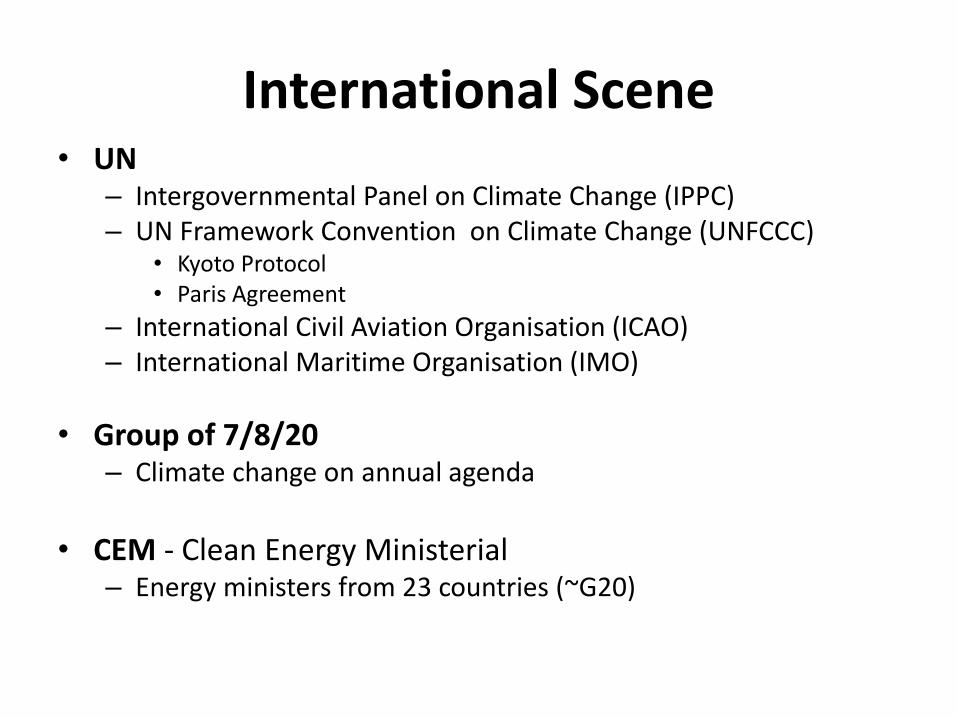
International Scene • UN
– Intergovernmental Panel on Climate Change (IPPC) – UN Framework Convention on Climate Change (UNFCCC)
• Kyoto Protocol • Paris Agreement
– International Civil Aviation Organisation (ICAO) – International Maritime Organisation (IMO)
• Group of 7/8/20 – Climate change on annual agenda
• CEM - Clean Energy Ministerial
– Energy ministers from 23 countries (~G20)

International Panel on Climate Change (IPCC)

International Issues
• Equity
– Common but Differentiated Responsibilities
– Historical/Future Emissions
• Finance
• Market/Non-market instruments
• Mitigation/Adaptation

Different ways of ranking emissions % of global emissions
Emissions per capita
Carbon intensity per GDP
Cumulative 1850-2012
Estimated 2030 Gt CO2e
China 24.0 Qatar 51.7 Iraq 3.21 US 366 China 15.4
US 17.7 Kuwait 34.1 Uzbekistan 2.01 EU 329 India 7.2
EU 12.1 Net Antilles 32.3 Qatar 1.67 China 150 US 7.1
India 5.4 UAE 30.8 Mongolia 1.63 Russia 103 EU 4.3
Russia 5.2 Bahrain 29.7 N Korea 1.56 Germany 85 Russia 2.7
Japan 3.8 Trin/Tob 27.9 Net Antilles 1.53 UK 70 Japan 1.2
Germany 2.6 Aruba 23.1 Kazakhstan 1.49 Japan 51 Brazil 0.7
Canada 1.8 Luxemb’g 22.7 Trin/Tob 1.43 India 38 S Africa 0.5
UK 1.8 Brunei 19.4 Bahrain 1.32 UK 0.4
S Korea 1.6 Falkands 19.4 Jamaica 1.32
Mexico 1.5 US 19.1 Turkm’n 1.19
Australia 17.6 UAE 1.15
TOP 4 – 59%
TOP 6 – 68%
TOP 15 – 81%

Carbon Flows through trade

The lifetime of energy infrastructure
5 10 15 20 25 30 35 40 45 50 55 60 65 70 75 80 ++
The rate of technological change is closely related to the lifetime of the relevant capital stock and equipment
Motor vehicles 12 – 20 years
Nuclear 30 – 60 years
Coal power 45+ years
Hydro 75+ years
Gas turbines 25+ years
Buildings 45+++ years
Source WBCSD

Early Meetings
• 1972 First Earth Summit, Stockholm – Main focus on air, land & water pollution
• 1979 Long Range Transboundary Air Pollution – Focus on SO2, NOX & Ozone, mention of climate
• 1988 IPCC formed by WMO & UNEP – Gather facts for Assessment Reports
• AR1(1990), 2(1995), 3(2001), 4(2007), 5(2014), 6(2021) • WG1(Science), WG2(Impacts), WG3(Mitigation), SPM
• 1990 World Climate Conference, Geneva • 1992 Rio Convention at Earth Summit

UN Framework Convention on Climate Change (UNFCCC)
• 1992 Rio Convention – UNFCCC
• 1997 Kyoto Protocol – binding national targets for Annex 1 countries of -5.2% by 2012 from 1990
– Kyoto 1 (2005-2012) – ratified 2004, in force 2005
– Kyoto 2 (2013-2020) – agreed in 2012, not yet ratified
• 2015 Paris Agreement – pledge & review – Intended National Determined Contributions (INDC)

Why is international agreement so slow?
• 197 Parties (countries) involved – 2,000+ negotiators from environment ministries
• All decisions by ‘consensus’
• Negotiating blocks with differing agendas – Mitigation/Adaptation/Sinks
• Limited negotiation time
• ‘Nothing is agreed until everything is agreed’
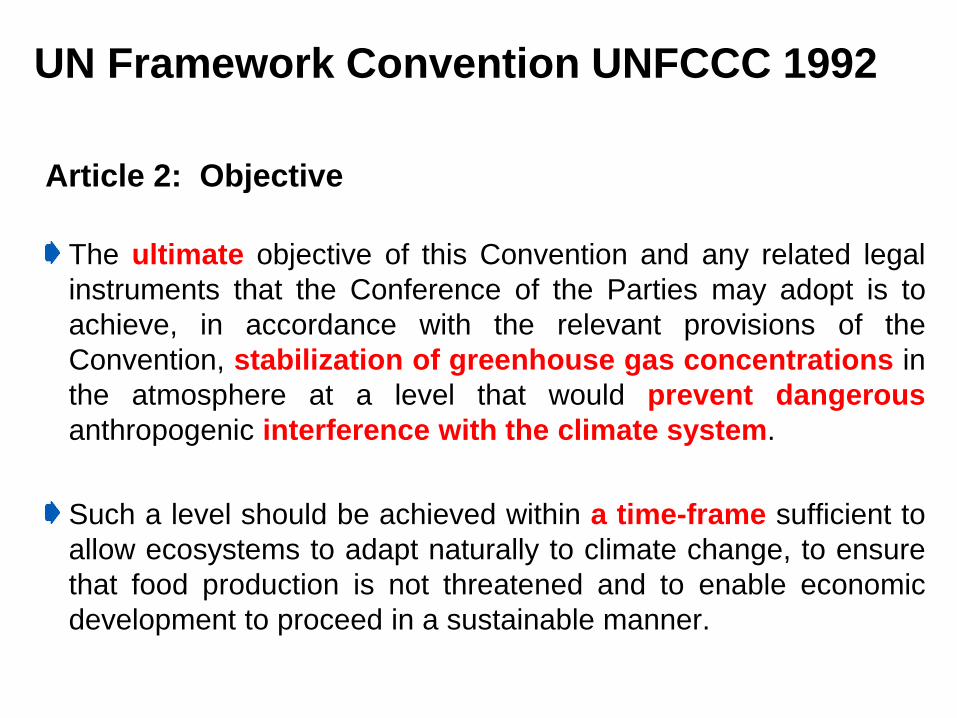
UN Framework Convention UNFCCC 1992
Article 2: Objective
The ultimate objective of this Convention and any related legal
instruments that the Conference of the Parties may adopt is to
achieve, in accordance with the relevant provisions of the
Convention, stabilization of greenhouse gas concentrations in
the atmosphere at a level that would prevent dangerous
anthropogenic interference with the climate system.
Such a level should be achieved within a time-frame sufficient to
allow ecosystems to adapt naturally to climate change, to ensure
that food production is not threatened and to enable economic
development to proceed in a sustainable manner.

The climate negotiationing cycle

International Climate Negotiations
1992 – 1st Earth Summit in RIO
• Adoption of Climate Convention (UNFCCC)
1995 - COP-1 in BERLIN
• The bifurcation point – CBDR
1996 - COP-2 in GENEVA
• The Ministerial Declaration calls for ‘legally binding quantified
emissions reduction targets’ for developed countries (and market
flexibility - US)
1997 - COP- 3 in KYOTO
• The first historic decision on internatonial regulation of
greenhouse gas emissions reduction – Annex 1 countries
only

International Climate Negotiations
2000 – COP-6 in The Hague
• Should have completed the implementation decisions but
failed because of non-agreement between EU and US -
reconvened as COP-6 bis (summer 2001)
2001- COP-7 in Marrakech
• Marrakech Accords for CDM & JI
2005 - COP-11 in Montreal
• Kyoto Protocol operational + Launch of International Dialogue
2007- COP- 13 in Bali
• The road to Copenhagen : the Bali Action Plan ( 2 years )

International Climate Negotiations
2009 – COP-15 in Copenhagen
• Copenhagen Accord noted but not adopted, but in fact a
breakthrough in the process – move from top-down to
bottom-up
2010 - COP-16 in Cancun
• Taking back of trust on board and first business dialogue
2011 - COP-17 in Durban
• Solidifying Cancun decisions on TEC/CTCN and GCF and launch of
the Durban Platform, as a single negotiating body
2015- COP- 21 in PARIS
• The Paris Agreement - the second historic decision on
internatonial regulation of greenhouse gas emissions
reduction (+ adaptation and resilience) – all countries

The heart of the Paris Agreement Parties to the Paris text agree :
To hold increase in global average temperature to “well below”
2°C and “pursue efforts” to limit increase to 1.5°C
National Commitmrnts to limit temperature increase. “The efforts
of all parties will represent a progression over time.” New NDCs
every five years
To aim to reach a global peaking of emissions “as soon as
possible.” Aim for balance between emissions and sinks post
2050
Developed countries to lead emission reduction efforts
Compliance committee reports on countries’ progress annually
Progress check : “global stocktake” every 5 years from 2023


Impact of INDCs on global emissions
30
35
40
45
50
55
60
65
70
75
80
2015 2020 2025 2030 2035 2040
GtCO2-e
Copenhagen Paris SubsequentCycles
Copenhagen
INDCs Paris
IPCC Window for 530-580 ppm CO2-e (1,000 Gt C)

INDCs - The landscape of regulation : references to carbon tax, ETS and International market mechanisms
Planned / possible use of int'al market mechanisms
No specific references or no INDC yet
Domestic ETS and carbon taxes

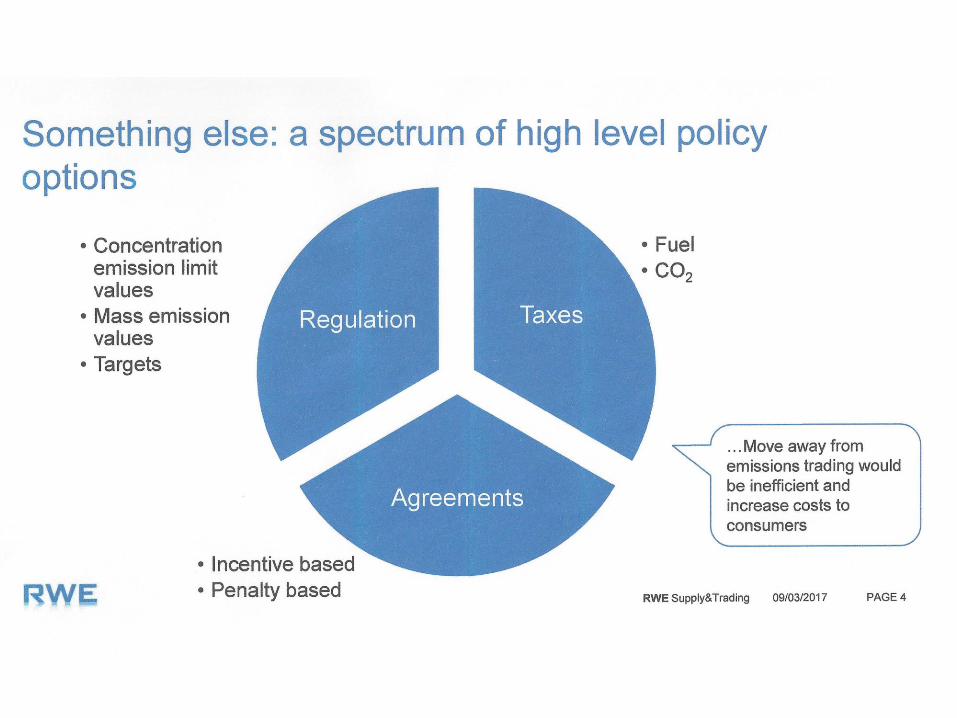
Tools for Governments

What are the tools?
• Policies to:
– Reduce emissions
– Invest in clean technologies
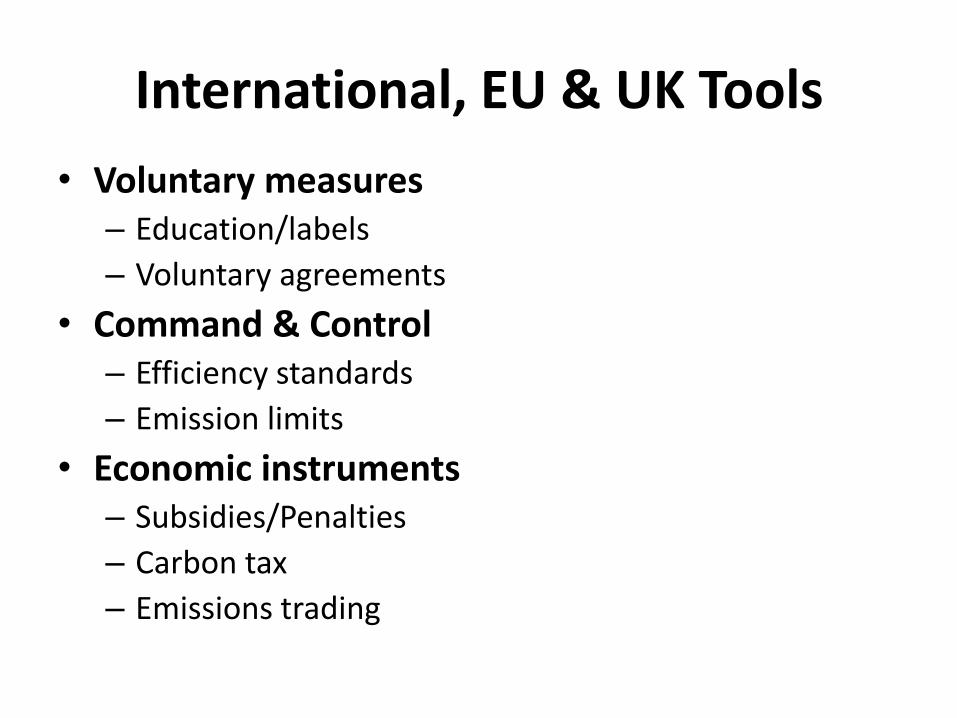
International, EU & UK Tools
• Voluntary measures – Education/labels
– Voluntary agreements
• Command & Control – Efficiency standards
– Emission limits
• Economic instruments – Subsidies/Penalties
– Carbon tax
– Emissions trading

Economic Instruments
• Subsidies • Kick-starting technologies, should be short term
• Carbon Tax • Carbon price known but emissions reduction unknown
• Emissions trading • Emissions reduction known but price unknown
• In theory, a carbon tax and an emissions trading scheme deliver the same result
• In practice, there are significant differences
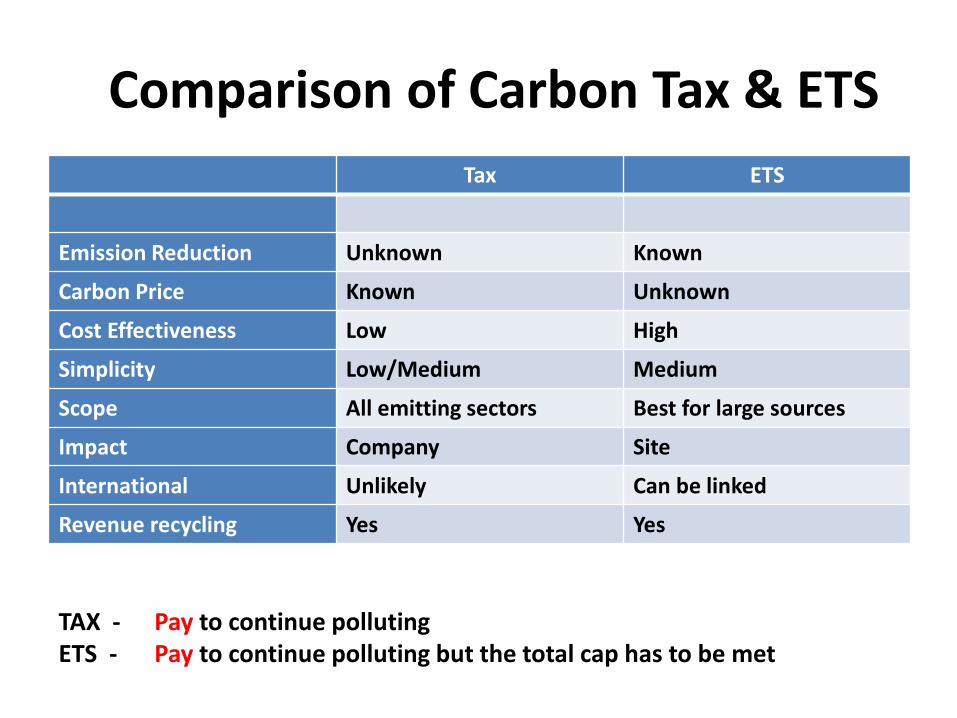
Comparison of Carbon Tax & ETS
Tax ETS
Emission Reduction Unknown Known
Carbon Price Known Unknown
Cost Effectiveness Low High
Simplicity Low/Medium Medium
Scope All emitting sectors Best for large sources
Impact Company Site
International Unlikely Can be linked
Revenue recycling Yes Yes
TAX - Pay to continue polluting ETS - Pay to continue polluting but the total cap has to be met

Emissions Trading – Cap & Trade
• Define sectors to be capped
• Set up cap – can decrease over time
• Set up MRV and compliance rules
• Set up non-compliance penalties
• Allocate allowances to covered sites • Grandfather, benchmark,auction
• Allow market to find least cost reductions

Emissions Trading - Cap & Trade
Both ‘A’ & ‘B’ have an initial limit of 50 units (100 total cap)
A B
50 50
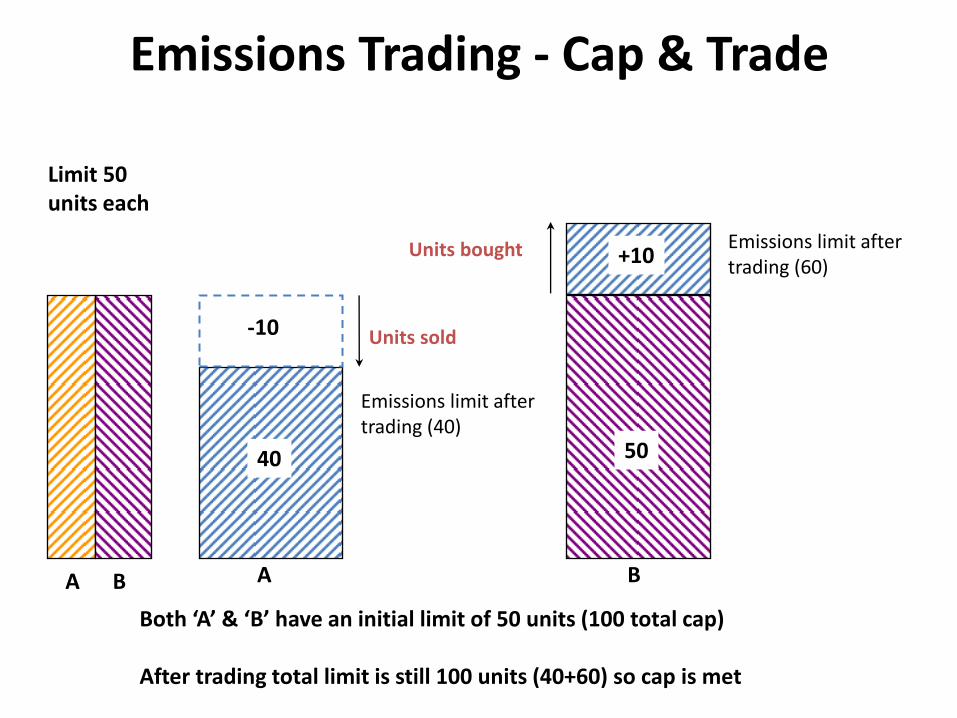
-10
40
+10
Units sold
Emissions limit after trading (40)
Units bought
A B
Emissions limit after trading (60)
50
Emissions Trading - Cap & Trade
Both ‘A’ & ‘B’ have an initial limit of 50 units (100 total cap) After trading total limit is still 100 units (40+60) so cap is met
Limit 50 units each
A B
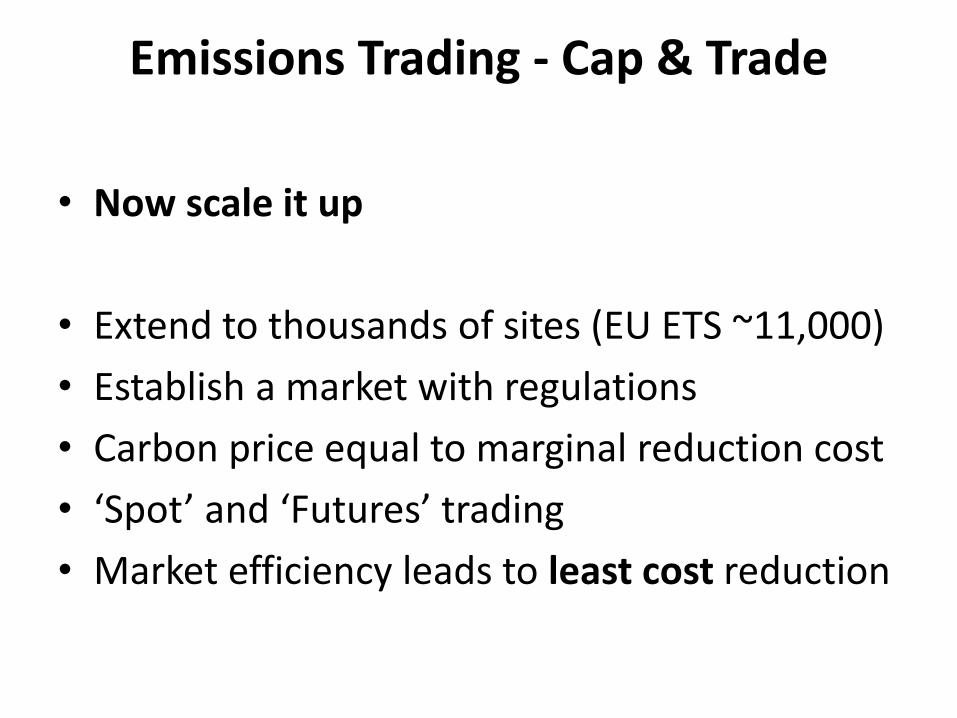
Emissions Trading - Cap & Trade
• Now scale it up
• Extend to thousands of sites (EU ETS ~11,000)
• Establish a market with regulations
• Carbon price equal to marginal reduction cost
• ‘Spot’ and ‘Futures’ trading
• Market efficiency leads to least cost reduction


EU Emissions Trading Scheme
The EU Emissions Trading Scheme
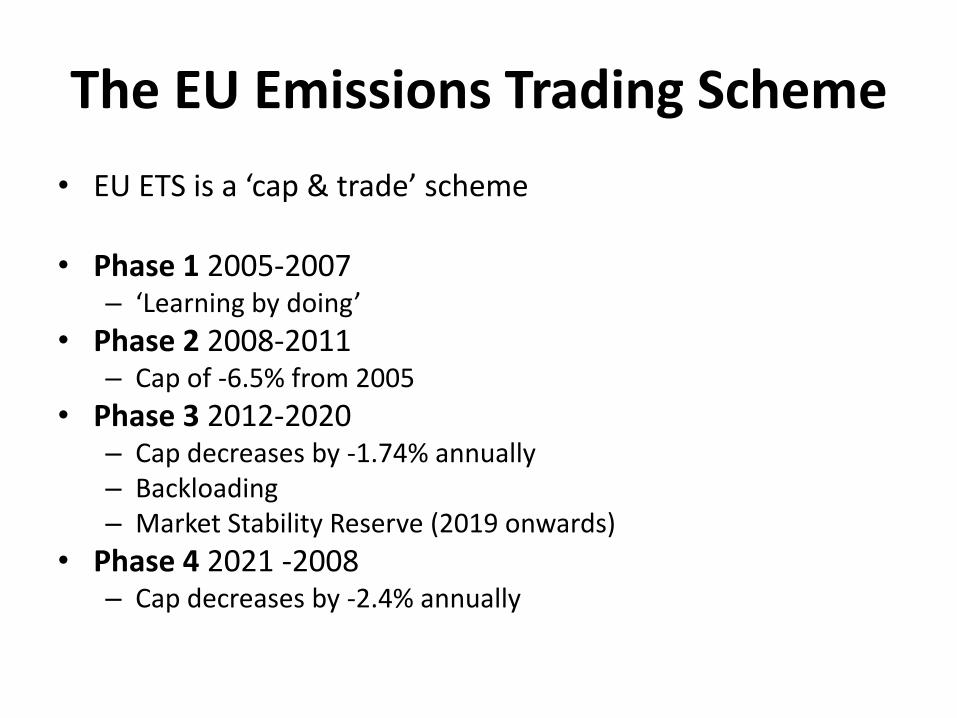
• EU ETS is a ‘cap & trade’ scheme • Phase 1 2005-2007
– ‘Learning by doing’
• Phase 2 2008-2011 – Cap of -6.5% from 2005
• Phase 3 2012-2020 – Cap decreases by -1.74% annually – Backloading – Market Stability Reserve (2019 onwards)
• Phase 4 2021 -2008 – Cap decreases by -2.4% annually
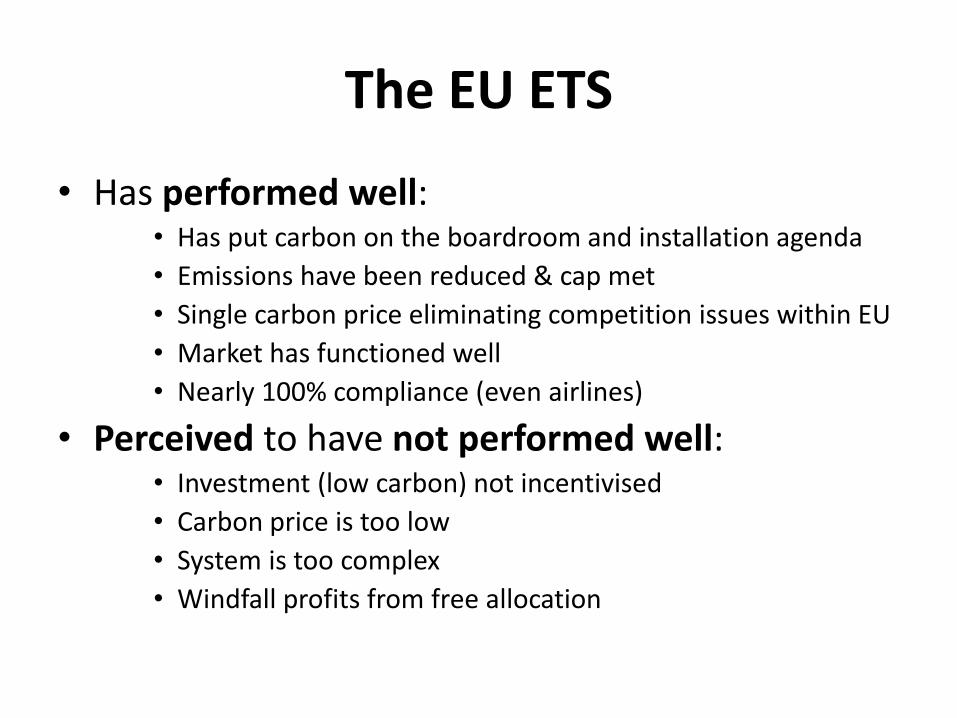
The EU ETS
• Has performed well: • Has put carbon on the boardroom and installation agenda
• Emissions have been reduced & cap met
• Single carbon price eliminating competition issues within EU
• Market has functioned well
• Nearly 100% compliance (even airlines)
• Perceived to have not performed well: • Investment (low carbon) not incentivised
• Carbon price is too low
• System is too complex
• Windfall profits from free allocation

Reasons & Remedies • Reasons
– Overlapping policies – CDM & JI imports – Recession – Continued free allocation to avoid carbon leakage
• Remedies • Ideal
– Revise cap to align with 2oC and with auctioning for all – Better analysis & integration of overlapping policies – Remove subsidies from technologies that are competitive
• Proposed for EU ETS Phase 4 – Increase annual reduction factor from -1.74% to -2.4% – More focussed benchmarks and free allocation rules – Market Stability Reserve from 2019

17 Carbon markets worldwide International Emissions Trading

New Zealand
Tokyo &
Saitama
RGGI
California
Beijing
Tianjin
Shanghai
Chongqing
Hubei
Shenzhen Guangdong
EU ETS
South Korea Switzerlan
d
Washington
Rio de Janeiro
Sao Paulo
Kazakhstan
Taiwan
Vietnam
South Africa
Mexico
China US
Canada
Alberta Ontario
ETS in place
Subnational ETS in place
ETS Being Designed
Carbon Tax with Offsets
Being designed or in place
Linkages
Trinidad and Tobago
Ukraine
Hybrid Carbon Pricing
British
Columbi
a
Australia
Thailand
Oregon
Quebec
Nova
Scotia
Carbon markets cover +40% of global GDP and 12% of gIIlobal CO2 emissions International Markets


Brexit

Brexit & UK Climate Policy
• UK has commitments:
– Carbon Budget
– Paris Agreement
• The UK will need a range of policies probably including an ETS

Post Brexit Options

Fuel Poverty
Affordable
Warmth
Scheme
DTI & Trans
Co £20m
Domestic
Company
Cars
Tax relief
related to
emissions
Tax on Work
Parking
To
encourage
use of public
transport
New Deal
for
Transport
DETR on
transport
Transport
Fuel Duty
May be
increased
Transport Integrated
Transport
Strategy
Actions to meet Kyoto (-12.5% GHG)
Emissions Trading
Scheme
Green Tariff
Endorsement
by Energy
Savings Trust
CHP and Renewables
Areas Not Tackled Directly
•Agriculture
•Landfill
•Electricity Production
•Oil industry
•Aviation
Industry
Other
International
Emissions
Trading
Projects
Avoidance
of emissions
Voluntary
Agreement
Reduce emissions
Actions to meet Government Target (-20%
CO2)
Assumed
Power
Station Mix
DTI projections
Enhanced
Capital
Allowances
Energy efficiency
measures
Climate
Change
Levy
Actions
involving
only Energy
Industry
CCL
Exemption
Renewables
& CHP
Promote
Renewables
& CHP
Use revenue
from CCL
NFFO
PES
obligation
Supplier
Renewable
Obligation
Green
Certificate
Trading
Meet supplier
obligation
CCL
Agreements
Fuel efficiency
or emission
targets for CCL
reduction
Promote
Energy
Efficiency
Revenue from
CCL for energy
efficiency in
business
EESoPs
Energy Eff
Stndrd Perform.
Home
Energy
Efficiency
Scheme (HEES)
£330m DETR
Green
Trading
International
Flare
Consents
Scheme
Aviation
Emissions
Scheme
Build
CHP?
10GW(e)
Installed
CHP capacity
Branding
Perceptions
Local
Agenda 21
Public sector
energy efficiency
IPPC
BAT
& energy
efficiency
Export Credit
Guarantee
Application must
include environmental
assessment
EU Emissions
Trading
Scheme
FFL
Income
10%
supply from
renewables
Car Tax
Relate to
car emissions
EU
22-23%
renewable
supply directive
Market Trans.
Measures
Investment
energy eff.
Electricity
Association
Fuel poverty
task force
UK Climate &
Energy Policies

Thank You