managing international development projects: evidences from … · 2013-10-10 · managing...
TRANSCRIPT
1
Managing International Development Projects: Evidences from an international survey
Matteo Falgari Università degli Studi di Bergamo
Ruggero Golini
Università degli Studi di Bergamo
Matteo Kalchschmidt ([email protected]) Università degli Studi di Bergamo
Paolo Landoni
Politecnico di Milano
Abstract This paper provides an analysis and discussion of the evidences from an international survey administered to almost 500 project managers working in the International Development field. The survey, as well as the analysis, aims at evaluating the adoption of methodologies and tools among project managers. Moreover, it assesses the impact of the adoption of project management practices on performance achieved by project managers. The results indicate that the adoption of project management tools is an important factor to project success, both in the short and in the long term. This indicates that the organizations that invest more on these methods are capable to improve their performance, thus it is important to increase both the awareness and the knowledge of these tools among nongovernmental organizations. Keywords: nongovernmental organizations, international development projects, survey Introduction Every year, international cooperation provides aid to developing countries. During 2011, the members of the Development Assistant Committee (DAC) alone contributed for more than US $496 billion1. Most international assistance provided by governmental or NGOs is provided via projects (Diallo and Thuillier, 2005). By consequence, International Development (ID) projects are gaining increasing importance in the field of international aid to developing countries. Differently from emergency projects, ID projects have the objective to provide immediate assistance to populations hit by wars or natural disaster and they usually take place in more stable contexts with the aim to improve living
1 Total official and private flows. Source: OECD Statistics
2
conditions in terms of economy, education or health. For these reasons, ID projects are sometimes less visible to the society, but statistics confirm a growing trend of money and human capital employed in ID projects (Diallo and Thuillier, 2005; OECD, 2008, 2009). Despite the importance and the peculiar critical success factors of ID projects (Hermano et al., 2012; Ika et al., 2012), limited attention has been devoted in the literature to the best practices, approaches and management techniques in this field. As a matter of fact, several authors suggested the need for additional research (Youker, 2004) in particular regarding project management tools and approaches (Khang and Moe, 2008). Generally speaking, in the project management literature there are very few studies about the diffusion of standards and methodologies inside organizations (Ahlemann et al., 2009), even private ones. This represents a gap that researchers and practitioners are trying to fill and that overtime brought to extensions of project management standards adapted to specific contexts (Besner and Hobbs, 2008). In fact, despite the universalistic nature of project management methodologies, different contexts show different approaches towards project management (Hanisch and Wald, 2012). This is particularly true for ID projects that present very peculiar characteristics (e.g., not-for-profit nature, high stakeholders involvement) (e.g., Golini et al., 2012; Youker, 2004). In fact, some specific approaches for ID projects have been introduced (e.g. Baum’s “project cycle” and the Logical Framework) (Baum, 1970), but the analysis of the usefulness of these tools and their integration with other project management techniques is still at the outset. The need for a deeper analysis is witnessed by the empirical evidence that shows how ID projects often lack of efficiency and effectiveness (Ika, 2012; Lovegrove et al., 2011). Because of that, by means of an international survey, in this paper we study the diffusion of project management tools and methodologies in NGOs dealing with ID projects. Moreover, we related the adoption of such tools and methodologies with the performance achieved, both at the internal (i.e., project) and external (i.e., the context) levels. Results show that there is a progressive adoption of project management tools, starting from the logical framework towards more sophisticated tools. We also found that with a basic set of tools NGOs can achieve good project performance, but the adoption of more tools allows to improve also positive long-term impacts. Literature review and research question Project management practices vary significantly from one type of project to another (H Payne and Rodney Turner, 1999). In fact, different tools, techniques and approaches are applied to different types of projects even within the same organization, in order to adapt the project management methods to the specific needs of each project (Crawford et al., 2005). This is particularly true for ID projects that present very peculiar characteristics and specific peculiarities that led to the development of dedicated methodologies. ID projects, in fact, face specific challenges concerning for example how objectives are defined and managed, how stakeholders are involved and how priorities are set. In order to overcome this gap, in recent years, some project management guidelines have been created for NGOs managing ID projects. The two most known are: PMDPro (developed by PM4NGO) and PM4DEV. These guidelines are quite known among practicioners and they are considered a good alternative or integration to the standard methodologies (e.g.,

3
PMBOK by PMI or IPMA competence baseline). However, a comparison made by Golini et al. (Golini et al., 2012) shows how there is a significant overlap in terms of tools among these guidelines witnessing that ID project management can also benefit from the practices developed in business environments and vice versa. Therefore, our interest is not related to the methodologies employed, but rather on the tools. When considering adoption project management tools it is common experience that some tools are more known and their use is more spread, while others are more sophisticated. For instance, Besner and Hobbs (2008) found in their survey that some tools are used extensively (e.g. work breakdown structure) while others have a very limited adoption (e.g. project evaluation and review technique).This can depend on the industry, but also the same organization can follow a maturity curve from a basic user to an advanced one. This idea of maturity of project management is not new in the literature, and several papers have been written on the topic comparing different industries and companies (Cooke-Davies and Arzymanow, 2003; Grant and Pennypacker, 2006; Ibbs and Kwak, 2000). However, all these studies are focused on business sectors while the development sector has been quite neglected and no information is available on NGOs. Because of that, our first research question is: RQ1. What is the extent and the profiles of adoption of project management tools among ID project managers working in NGOs? Next, both academic literature and managerial experience highlight that the proper use of specific methodologies and tools is critical to manage projects successfully (e.g. Ika et al., 2010; Papke-Shields et al., 2010). The general suggestion given to project managers is that the effort in implementing proper methodologies is justified by the benefits achieved by these tools and significant evidences have been provided in different managerial fields. Certification bodies, managerial and academic literature, general practice support that companies willing to succeed in managing projects need to be complaint with certain rules and practices. The empirical evidence of these considerations is vast and diffused. There is yet limited empirical evidence in support of a similar impact in the case of ID projects (Diallo and Thuillier, 2004; Khang and Moe, 2008). On the contrary, some tools as the logical framework, have been criticized to be ineffective (Smith, 2000). In conclusion, very little has been said about the way project managers should manage successfully ID projects (Diallo and Thuillier, 2004, 2005; Ika et al., 2012; Khang and Moe, 2008). In particular, there is a significant lack of structured evidence concerning the impact of project management tools adoption on performance achieved by ID project managers. For this reason, ID project managers are often unaware of what makes a project successful and this is demonstrated by the high project failure rate found in these contexts (Hermano et al., 2012). Failure in ID projects means to only to face problems, delays and extra costs (i.e., internal performance) but also to miss the long-term goals and their impact on the society (i.e., external performance) (Ika et al., 2012). While some studies have found that the level of use of PM practices is related to project success (Papke-Shields et al., 2010), to the specific case of ID projects very little evidences have been provided to the specific case of ID projects (Ika et al., 2010).

4
Because of that, we aim at identifying which methods contribute most at improving the performance achieved by project managers. Thus, the second research question we investigate is: RQ2. Which sets of tools contribute most at enhancing the internal and external performance achieved by project managers? Methdology In order to answer to the above research questions, an international survey was designed and administered. The research involved project managers of NGOs operating in the International Development field and belonging to different continents and areas of application. It was decided to conduct the research globally, to avoid biases related to single countries (e.g. diffusion of specific methodologies, cultural biases) and to support generalizability. The project manager surveyed work for different NGOs and they have managed on average 7 projects in the last 2 years (5 months is the median duration) of which 60% were international projects. Project managers operating in NGOs were contacted directly using information found in public databases and associations of NGOs. Contacts also with NGOs’ networks were very important to increase the size of the sample and also to avoid sample biases. NGOs were contacted by email and phone when possible in order to increase the response rate. Contacts were searched and managed globally to avoid limiting our considerations to a specific area or country. In the end, 496 NGOs provided useful information for the purpose of this research. As it has been estimated that about 30.000 email and phone contacts have been made in order to set up the sample, a response rate of 1.5% has been obtained. We checked for late respondent and non-respondent bias and we did not find significant biases. Table 1 provides a description of the considered sample. We can see that the sample is distributed among all continents with a vast majority operating in Europe and Africa. The size of the considered NGOs is rather variable. A significant amount of the sample is made of small organizations (57% of the sample is characterized by less than 20 employees), but still the data considers also larger organizations (i.e. more than 500 employees).
Table 1 – Descriptive statistics
Continent % N. employees (NGO) % Average project
size (USD) % Type of projects %
Africa 27 1-20 57 x<100.000 35.9 Delivery and integration of equipment 1.7
America 11 21-50 18 100.000<x<200.000 23.6 Construction of infrastructures 5.5
Asia 21 51-100 11 200.000<x<500.000 17.2 Develop of services (education, finance, etc.) 58.0
Europe 40 101-500 9 x>500.000 20.7 Awareness rising (human rights,…) 22.7
Oceania 1 >500 5 Missing 2.6 Other 10.3 Missing 1.7 Total 100 Total 100 Total 100 Total 100

5
We measured the level of adoption of project management tools by asking project managers to provide the percentage of projects in which each tool was employed (measures were based on a 1-5 Likert scale where 1 represents 0% of the projects, 2 represents 1-25%, 3 represents 26-50%, 4 represents 50-75% and 5 represents 75-100%). Tools were selected on the basis of a review of the major reference guides in both project management in general (e.g. PMI’s PMBOK) and in the ID project field (e.g., PM4DEV, PM4NGOs). In order to measure the performance achieved we considered different performance measures related both to internal project results (e.g. compliance with budget) and external project results (e.g. satisfaction of the local community). Table 2 provides the different measures that were collected. Project managers were asked to assess these performance on a 1-5 Likert scale where 1 represents “Very Low” and 5 “Very High”.
Table 2 – Project performance measures
Type of performance Performance measures Internal project performance Comply with the budget
Comply with the expected time Comply with the quality (deliver exactly the output expected)
External project performance Obtain long term project impact (outcome/goal) Stakeholder/Partners involvement Ownership extension of the project to the local community Monitoring and reporting to the stakeholders Economic sustainability after the end of the project Satisfaction of the local community
Results Project management tools adoption (RQ1) In order to answer to the first research question, we performed a two-step cluster Analysis by considering the variables that measure the adoption of each tool, so that natural groupings (or clusters) within the dataset could be revealed. First, hierarchical cluster analysis, based on Euclidean distance and the Ward method was used to identify the most suitable number of clusters and the cluster centroids. The hierarchical cluster analysis suggested four clusters. Next, the K-means clustering algorithm was used to iteratively assign each firm to a cluster (Ketchen and Shook, 1996). Table 3 provides a description of the four identified cluster. First of all, we can see that the extent of adoption of the different tools is largely variable. Some tools are much adopted (e.g. logical framework and progress report) whilst others are almost neglected (e.g. EVMS, Issue log). Project managers grouped within the first cluster appear to adopt only a very limited set of basic tools (i.e. logical framework and progress report). Within cluster number 2, the adoption of these basic tools significantly increases, as well as the adoption of other well-known tools (i.e. Gantt diagrams, cost accounting and risk analysis and management). However, more structured and complex tools, as in the first cluster, are still overlooked. On the other hand, project managers grouped within the third cluster start to manage their projects using a wider set of tools, especially all the resource management tools (Scope management, OBS, RAM, Stakeholder matrix), although they still overlook some important control and time/cost planning tools. Finally, project managers grouped within the fourth cluster, the outer one, adopt the widest range of tools.
6
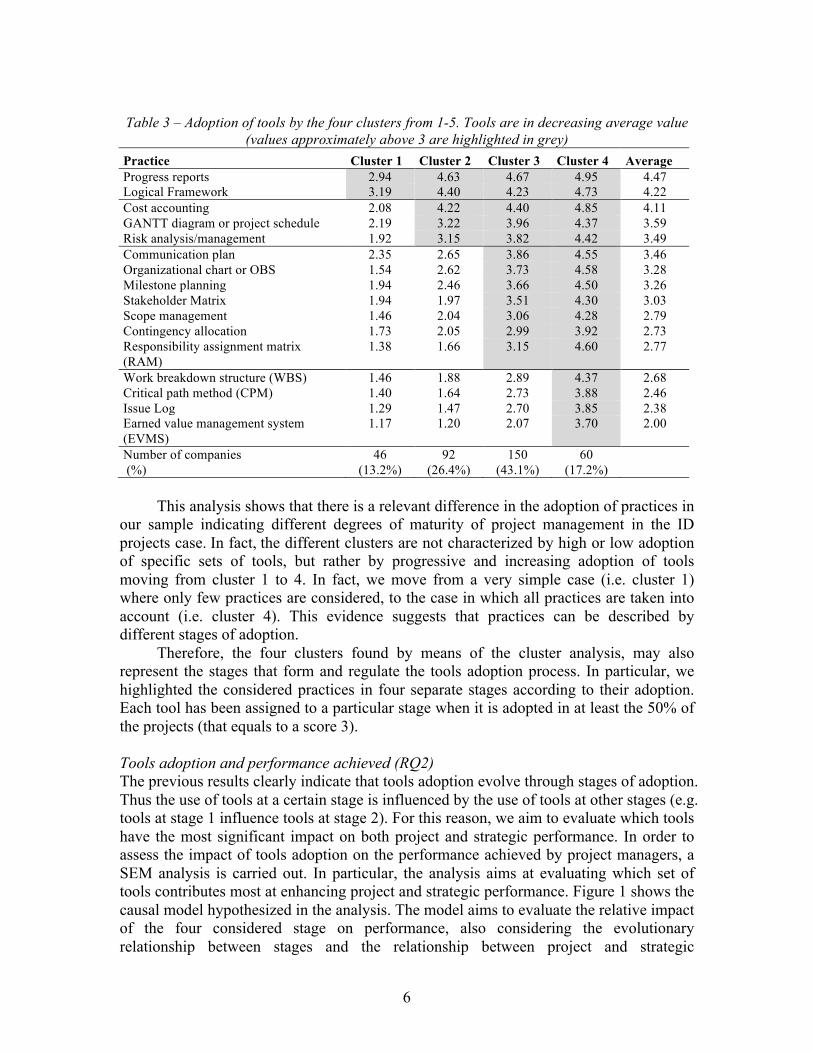
Table 3 – Adoption of tools by the four clusters from 1-5. Tools are in decreasing average value
(values approximately above 3 are highlighted in grey) Practice Cluster 1 Cluster 2 Cluster 3 Cluster 4 Average Progress reports 2.94 4.63 4.67 4.95 4.47 Logical Framework 3.19 4.40 4.23 4.73 4.22 Cost accounting 2.08 4.22 4.40 4.85 4.11 GANTT diagram or project schedule 2.19 3.22 3.96 4.37 3.59 Risk analysis/management 1.92 3.15 3.82 4.42 3.49 Communication plan 2.35 2.65 3.86 4.55 3.46 Organizational chart or OBS 1.54 2.62 3.73 4.58 3.28 Milestone planning 1.94 2.46 3.66 4.50 3.26 Stakeholder Matrix 1.94 1.97 3.51 4.30 3.03 Scope management 1.46 2.04 3.06 4.28 2.79 Contingency allocation 1.73 2.05 2.99 3.92 2.73 Responsibility assignment matrix (RAM)
1.38 1.66 3.15 4.60 2.77
Work breakdown structure (WBS) 1.46 1.88 2.89 4.37 2.68 Critical path method (CPM) 1.40 1.64 2.73 3.88 2.46 Issue Log 1.29 1.47 2.70 3.85 2.38 Earned value management system (EVMS)
1.17 1.20 2.07 3.70 2.00
Number of companies (%)
46 (13.2%)
92 (26.4%)
150 (43.1%)
60 (17.2%)
This analysis shows that there is a relevant difference in the adoption of practices in
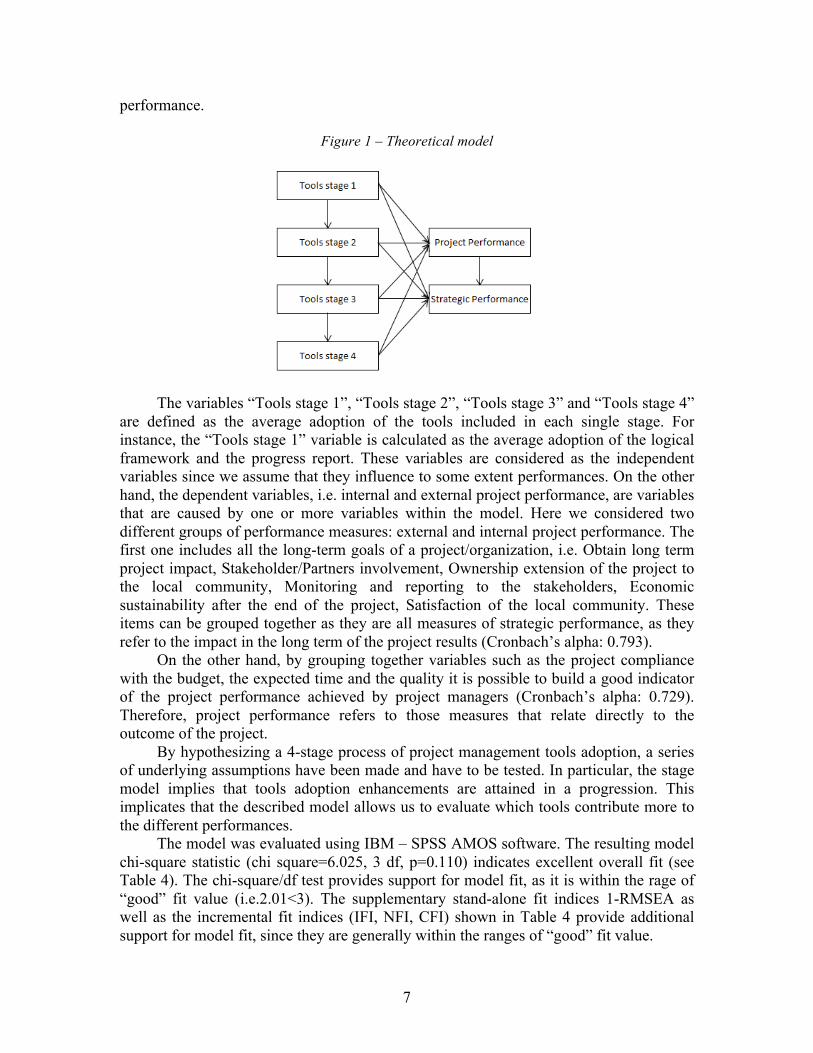
our sample indicating different degrees of maturity of project management in the ID projects case. In fact, the different clusters are not characterized by high or low adoption of specific sets of tools, but rather by progressive and increasing adoption of tools moving from cluster 1 to 4. In fact, we move from a very simple case (i.e. cluster 1) where only few practices are considered, to the case in which all practices are taken into account (i.e. cluster 4). This evidence suggests that practices can be described by different stages of adoption. Therefore, the four clusters found by means of the cluster analysis, may also represent the stages that form and regulate the tools adoption process. In particular, we highlighted the considered practices in four separate stages according to their adoption. Each tool has been assigned to a particular stage when it is adopted in at least the 50% of the projects (that equals to a score 3). Tools adoption and performance achieved (RQ2) The previous results clearly indicate that tools adoption evolve through stages of adoption. Thus the use of tools at a certain stage is influenced by the use of tools at other stages (e.g. tools at stage 1 influence tools at stage 2). For this reason, we aim to evaluate which tools have the most significant impact on both project and strategic performance. In order to assess the impact of tools adoption on the performance achieved by project managers, a SEM analysis is carried out. In particular, the analysis aims at evaluating which set of tools contributes most at enhancing project and strategic performance. Figure 1 shows the causal model hypothesized in the analysis. The model aims to evaluate the relative impact of the four considered stage on performance, also considering the evolutionary relationship between stages and the relationship between project and strategic
7
performance.
Figure 1 – Theoretical model
The variables “Tools stage 1”, “Tools stage 2”, “Tools stage 3” and “Tools stage 4” are defined as the average adoption of the tools included in each single stage. For instance, the “Tools stage 1” variable is calculated as the average adoption of the logical framework and the progress report. These variables are considered as the independent variables since we assume that they influence to some extent performances. On the other hand, the dependent variables, i.e. internal and external project performance, are variables that are caused by one or more variables within the model. Here we considered two different groups of performance measures: external and internal project performance. The first one includes all the long-term goals of a project/organization, i.e. Obtain long term project impact, Stakeholder/Partners involvement, Ownership extension of the project to the local community, Monitoring and reporting to the stakeholders, Economic sustainability after the end of the project, Satisfaction of the local community. These items can be grouped together as they are all measures of strategic performance, as they refer to the impact in the long term of the project results (Cronbach’s alpha: 0.793). On the other hand, by grouping together variables such as the project compliance with the budget, the expected time and the quality it is possible to build a good indicator of the project performance achieved by project managers (Cronbach’s alpha: 0.729). Therefore, project performance refers to those measures that relate directly to the outcome of the project.
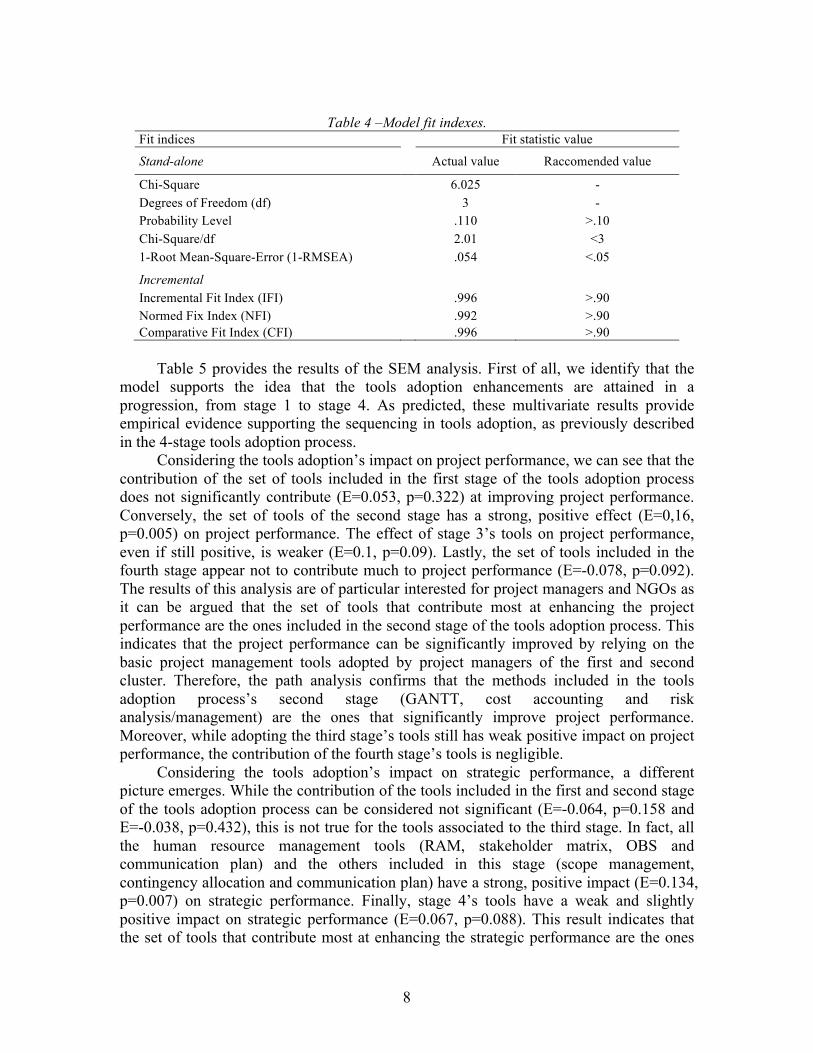
By hypothesizing a 4-stage process of project management tools adoption, a series of underlying assumptions have been made and have to be tested. In particular, the stage model implies that tools adoption enhancements are attained in a progression. This implicates that the described model allows us to evaluate which tools contribute more to the different performances. The model was evaluated using IBM – SPSS AMOS software. The resulting model chi-square statistic (chi square=6.025, 3 df, p=0.110) indicates excellent overall fit (see Table 4). The chi-square/df test provides support for model fit, as it is within the rage of “good” fit value (i.e.2.01<3). The supplementary stand-alone fit indices 1-RMSEA as well as the incremental fit indices (IFI, NFI, CFI) shown in Table 4 provide additional support for model fit, since they are generally within the ranges of “good” fit value.
8
Table 4 –Model fit indexes.
Fit indices Fit statistic value
Stand-alone Actual value Raccomended value
Chi-Square 6.025 - Degrees of Freedom (df) 3 - Probability Level .110 >.10 Chi-Square/df 2.01 <3 1-Root Mean-Square-Error (1-RMSEA) .054 <.05 Incremental Incremental Fit Index (IFI) .996 >.90 Normed Fix Index (NFI) .992 >.90 Comparative Fit Index (CFI) .996 >.90
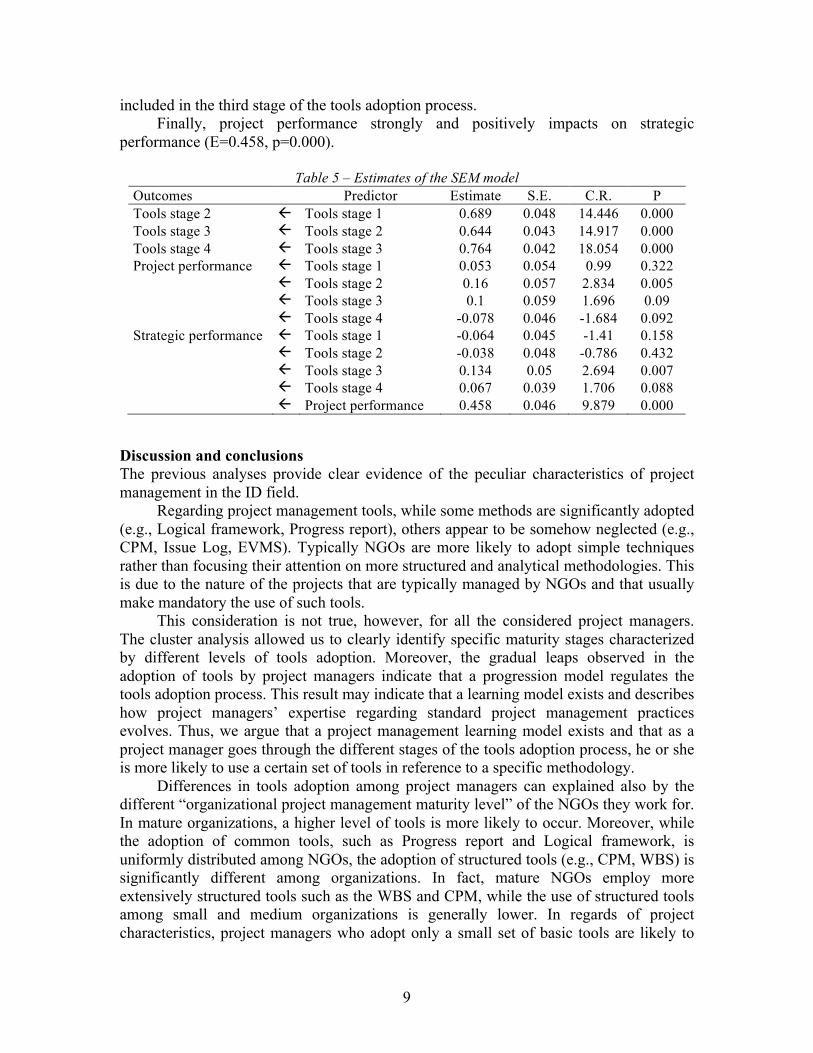
Table 5 provides the results of the SEM analysis. First of all, we identify that the model supports the idea that the tools adoption enhancements are attained in a progression, from stage 1 to stage 4. As predicted, these multivariate results provide empirical evidence supporting the sequencing in tools adoption, as previously described in the 4-stage tools adoption process. Considering the tools adoption’s impact on project performance, we can see that the contribution of the set of tools included in the first stage of the tools adoption process does not significantly contribute (E=0.053, p=0.322) at improving project performance. Conversely, the set of tools of the second stage has a strong, positive effect (E=0,16, p=0.005) on project performance. The effect of stage 3’s tools on project performance, even if still positive, is weaker (E=0.1, p=0.09). Lastly, the set of tools included in the fourth stage appear not to contribute much to project performance (E=-0.078, p=0.092). The results of this analysis are of particular interested for project managers and NGOs as it can be argued that the set of tools that contribute most at enhancing the project performance are the ones included in the second stage of the tools adoption process. This indicates that the project performance can be significantly improved by relying on the basic project management tools adopted by project managers of the first and second cluster. Therefore, the path analysis confirms that the methods included in the tools adoption process’s second stage (GANTT, cost accounting and risk analysis/management) are the ones that significantly improve project performance. Moreover, while adopting the third stage’s tools still has weak positive impact on project performance, the contribution of the fourth stage’s tools is negligible. Considering the tools adoption’s impact on strategic performance, a different picture emerges. While the contribution of the tools included in the first and second stage of the tools adoption process can be considered not significant (E=-0.064, p=0.158 and E=-0.038, p=0.432), this is not true for the tools associated to the third stage. In fact, all the human resource management tools (RAM, stakeholder matrix, OBS and communication plan) and the others included in this stage (scope management, contingency allocation and communication plan) have a strong, positive impact (E=0.134, p=0.007) on strategic performance. Finally, stage 4’s tools have a weak and slightly positive impact on strategic performance (E=0.067, p=0.088). This result indicates that the set of tools that contribute most at enhancing the strategic performance are the ones
9
included in the third stage of the tools adoption process. Finally, project performance strongly and positively impacts on strategic performance (E=0.458, p=0.000).
Table 5 – Estimates of the SEM model Outcomes Predictor Estimate S.E. C.R. P Tools stage 2 ß Tools stage 1 0.689 0.048 14.446 0.000 Tools stage 3 ß Tools stage 2 0.644 0.043 14.917 0.000 Tools stage 4 ß Tools stage 3 0.764 0.042 18.054 0.000 Project performance ß Tools stage 1 0.053 0.054 0.99 0.322
ß Tools stage 2 0.16 0.057 2.834 0.005
ß Tools stage 3 0.1 0.059 1.696 0.09
ß Tools stage 4 -0.078 0.046 -1.684 0.092 Strategic performance ß Tools stage 1 -0.064 0.045 -1.41 0.158
ß Tools stage 2 -0.038 0.048 -0.786 0.432
ß Tools stage 3 0.134 0.05 2.694 0.007
ß Tools stage 4 0.067 0.039 1.706 0.088
ß Project performance 0.458 0.046 9.879 0.000
Discussion and conclusions The previous analyses provide clear evidence of the peculiar characteristics of project management in the ID field. Regarding project management tools, while some methods are significantly adopted (e.g., Logical framework, Progress report), others appear to be somehow neglected (e.g., CPM, Issue Log, EVMS). Typically NGOs are more likely to adopt simple techniques rather than focusing their attention on more structured and analytical methodologies. This is due to the nature of the projects that are typically managed by NGOs and that usually make mandatory the use of such tools. This consideration is not true, however, for all the considered project managers. The cluster analysis allowed us to clearly identify specific maturity stages characterized by different levels of tools adoption. Moreover, the gradual leaps observed in the adoption of tools by project managers indicate that a progression model regulates the tools adoption process. This result may indicate that a learning model exists and describes how project managers’ expertise regarding standard project management practices evolves. Thus, we argue that a project management learning model exists and that as a project manager goes through the different stages of the tools adoption process, he or she is more likely to use a certain set of tools in reference to a specific methodology. Differences in tools adoption among project managers can explained also by the different “organizational project management maturity level” of the NGOs they work for. In mature organizations, a higher level of tools is more likely to occur. Moreover, while the adoption of common tools, such as Progress report and Logical framework, is uniformly distributed among NGOs, the adoption of structured tools (e.g., CPM, WBS) is significantly different among organizations. In fact, mature NGOs employ more extensively structured tools such as the WBS and CPM, while the use of structured tools among small and medium organizations is generally lower. In regards of project characteristics, project managers who adopt only a small set of basic tools are likely to

10
manage only few small projects. These differences in tools adoption among NGOs would not be of particular concern if they had no impact on projects’ outcomes. Even if, overall, project managers that participated to the research declared, on average, medium-high performance, there are significant differences in terms of achieved performance among different clusters of project managers. In fact, project managers that adopt a wider range of tools are more likely to achieve higher strategic and project performance. This indicates that those organizations that invested more on these methods were capable to improve their performance thus it is important to increase both the awareness and the knowledge of these tools among NGOs. Moreover, this finding confirms that the project managers’ learning model impacts on performance. In particular, the progressive adoption of standard methods is the factor that contributes to a learning curve that measures the rate at which performance improves. This factor is characterized as induced learning, as it represents a conscious effort by project managers to enhance their managerial expertise regarding standard tools. The SEM analysis provides evidence of this pattern. First of all, the model’s results provide empirical evidences confirming the validity of the four-stage tools adoption process. This underlines that tools adoption enhancements are attained in a progression. Secondly, the analysis highlights that the methods included in the second stage of the tools adoption process (GANTT, cost accounting and risk analysis/management) are the ones that significantly improve project performance. This result is not surprising because these tools are the ones that specifically address project management issues such as budget and time compliance. Moreover, as previously discussed, since several ID projects’ peculiarities can be addressed by using these tools, projects are more likely to result successful. Furthermore, also the adoption of the tools included in the third stage has a positive, but weaker, influence on project performance. This positive contribution mostly comes from tools such as WBS, contingency allocation, scope management and milestone planning that are able to address project management criticalities such as managing project scope, time, cost, and risk. When strategic performance measures are considered, the analysis shows that the methods that significantly contribute at enhancing project performance are different to the ones that influence strategic performance. In particular, strategic performance can be significantly improved by adopting the set of tools included in the third stage of the tools adoption process. Once again, this is due to the nature of the methods considered: tools such as stakeholder matrix, RAM, OBS and communication plan can address specific human resource management and strategic performance issues such as monitoring and reporting to the stakeholders and managing their involvement. In fact, typical ID projects’ peculiarities, such as complex stakeholder management and difficulty in using project management techniques in the context of other cultures, can be addressed by adopting these methods. The other methods included in the third stage of the tools adoption process (i.e., WBS, milestone planning, contingency allocation and scope management), even if they focus at addressing short-term, project related issues, they might indirectly, positively contribute at enhancing long-term performance. Finally, as the path analysis highlights that project performance strongly and positively impacts on the strategic performance, confirming that achieving good internal performances are pre-requisite for improving external performance.

11
Appendix
Cluster 1 Cluster 2 Cluster 3 Cluster 4 Sample Average
Kruskal-Wallis
sig. Internal project performance (1-5) 3.74 3.98 4.18 4.25 4.08 0.000 External project performance (1-5) 3.61 3.67 3.89 4.23 3.86 0.000 Size of the NGO (n°employee) 15.23 24.88 30.67 41.25 29.08 0.019 Number of projects per year performed by the NGO 5.21 6.23 7.61 5.28 6.52 0.096
Projects managed in the last 2 years by the project manager 6.60 6.88 8.69 6.92 7.64 0.483
Number of international projects managed in the last 2 years by the project manager
2.54 4.21 5.08 3.38 4.22 0.098
Average project duration (months) 11.44 19.96 19.13 21.45 18.87 0.000 Average size of the managed projects in the last 2 years: (1- x<100.000 2- 100.000<x<200.000 3- 200.000<x<500.000 4- x>500.000)
1.69 2.33 2.32 2.30 2.23 0.004
References Ahlemann, F., F. Teuteberg, K. Vogelsang. 2009. Project management standards-Diffusion and application in Germany and Switzerland. International Journal of Project Management, 27(3): 292-303. Baum, W. C. 1970. The project cycle. Finance and Development, 7(2): 2-13. Besner, C., B. Hobbs. 2008. Project management practice, generic or contextual: A reality check. Project Management Journal, 39(1): 16-33. Cooke-Davies, T. J., A. Arzymanow. 2003. The maturity of project management in different industries: An investigation into variations between project management models. International Journal of Project Management, 21(6): 471-478. Crawford, L., B. Hobbs, R. Turner. 2005. Project categorization systems: Aligning capability with strategy for better results. Diallo, A., D. Thuillier. 2004. The success dimensions of international development projects: the perceptions of African project coordinators. International Journal of Project Management, 22(1): 19-31. Diallo, A., D. Thuillier. 2005. The success of international development projects, trust and communication: an African perspective. International Journal of Project Management, 23(3): 237-252. Golini, R., P. Landoni, D. Mozzi. 2012. International Development Projects By Non-Governmental Organizations: Peculiarities And Methodologies. Paper presented at the PMI Research Conference, Limrick (Ireland). Grant, K. P., J. S. Pennypacker. 2006. Project management maturity: an assessment of project management capabilities among and between selected industries. Engineering Management, IEEE Transactions on, 53(1): 59-68. H Payne, J., J. Rodney Turner. 1999. Company-wide project management: the planning and control of programmes of projects of different type. International Journal of Project Management, 17(1): 55-59. Hanisch, B., A. Wald. 2012. A bibliometric view on the use of contingency theory in project management research. Project Management Journal, 43(3): 4-23. Hermano, V., A. Lopez-Paredes, N. Martin-Cruz, J. Pajares. 2012. How to manage international development (ID) projects successfully. Is the PMD Pro1 Guide going to the right direction? International Journal of Project Management. Ibbs, C. W., Y. H. Kwak. 2000. Assessing project management maturity. Project Management Journal, 31(1): 32-43.
12
Ika, L. A., A. Diallo, D. Thuillier. 2010. Project management in the international development industry: The project coordinator's perspective. International Journal of Managing Projects in Business, 3(1): 61-93. Ika, L. A. 2012. Project Management for Development in Africa: Why Projects Are Failing and What Can Be Done About It. Project Management Journal. Ika, L. A., A. Diallo, D. Thuillier. 2012. Critical success factors for World Bank projects: An empirical investigation. International Journal of Project Management, 30(1): 105-116. Ketchen, D. J., C. L. Shook. 1996. The application of cluster analysis in strategic management research: an analysis and critique. Strategic Management Journal, 17(6): 441-458. Khang, D. B., T. L. Moe. 2008. Success criteria and factors for international development projects: A life cycle based framework. Project Management Journal, 39(1): 72-84. Lovegrove, N., B. Gebre, T. Lee, R. Kumar. 2011. McKinsey-Devex survey results: Practitioners see need for new approaches to system-wide reform: McKinsey-Devex. OECD. 2008. OECD annual report 2008. Paris, France. OECD. 2009. Development Co-operation Report 2009. Papke-Shields, K. E., C. Beise, J. Quan. 2010. Do project managers practice what they preach, and does it matter to project success? International Journal of Project Management, 28(7): 650-662. Smith, P. 2000. A comment on the limitations of the logical framework method, in reply to Gasper, and to Bell. Public Administration and Development, 20(5): 439-441. Youker, R. 2004. The nature of international development projects. World Bank.