managing finance and budgets lecture 4 financial statements (3)
TRANSCRIPT

Managing Finance and Budgets
Lecture 4
Financial Statements (3)

Session 4 - Financial Statements (3)
Learning outcomes:Understand the role and limitations of financial statements in relation to SMEs, VCOs and large organisations Manipulate and use financial statements to inform decision-making in situations typically found in SMEs and VCOs
Key concepts:Analysing accounts Ratios
Session 4 - Financial Statements (3)
Content: A: Analysing Accounts B: The different types of Ratio
1. Profitability Ratios2. Liquidity Ratios3. Financing Ratios (Gearing)4. Efficiency Ratios5. Investment Ratios
C: Example of Analysis
A: Analysing Accounts

Analysing Accounts - Key Points
When making an analysis of a business through its accounts, we should take into consideration:
The nature of the business Changes in the nature of the business over time Comparisons to similar businesses The management of the business - marketing, operations,
personnel, finance The interpretation and presentation of figures Other non-financial information, such as seasonal and
other trends, the weather, political climate etc.
Factors affecting analysis
Our analysis may be affected by some or all of the following: Incomplete or imperfect information Subject to distortion by individual events Changes or differences in accounting policies Inflation Window dressing and manipulation Snapshot nature of the Balance Sheet Investment in business compared to returns to
shareholders and/or directors Conglomeration of different types of activity in one set of
figures

The Use of Ratios (1)
Ratios are analytical tools designed to provide a single summary figure which gives a snapshot of a particular type of activity or answers a particular question.
Normally, a ratio compares one figure with another, or gives a percentage.
Most ratios are straightforward, easy to understand with names which convey what they actually do,
for example, one of the ratios from last week was:
Average Stockholding Period = Average stock level x 365
Cost of Sales

The Use of Ratios (2)
Ratios: Can be used as basis of comparison - e.g. other
companies, other periods, targets or forecasts Allow comparisons between and within firms Enable trends to be identified Enable comparisons to be made where scale is different

Sample Ratios
Retail Sales per square metre Sales Cost per £1000 loaned Food cost per patient % Bed Occupancy % of sales spent on advertising (or anything) Cost of water (electricity) per kilo manufactured Average number of students per class Expenditure on books per student Cost per outcome for different departments

Activity One
Discuss the following:
Imagine you are the proprietor of a hotel and restaurant. Identify a series of key ratios which would help you to monitor on a day to day basis how well the hotel is performing.
Activity One - Solutions
Key ratios to monitor how well a hotel is performing.
These might include: % Room occupancy Average customer payment Reservations as a % of total occupancy Cleaning Costs per room Average direct cost per room occupancy Total Overheads bill per day’s operation Total Salaries as a percentage of turnover % food wastage per day
… and many more!
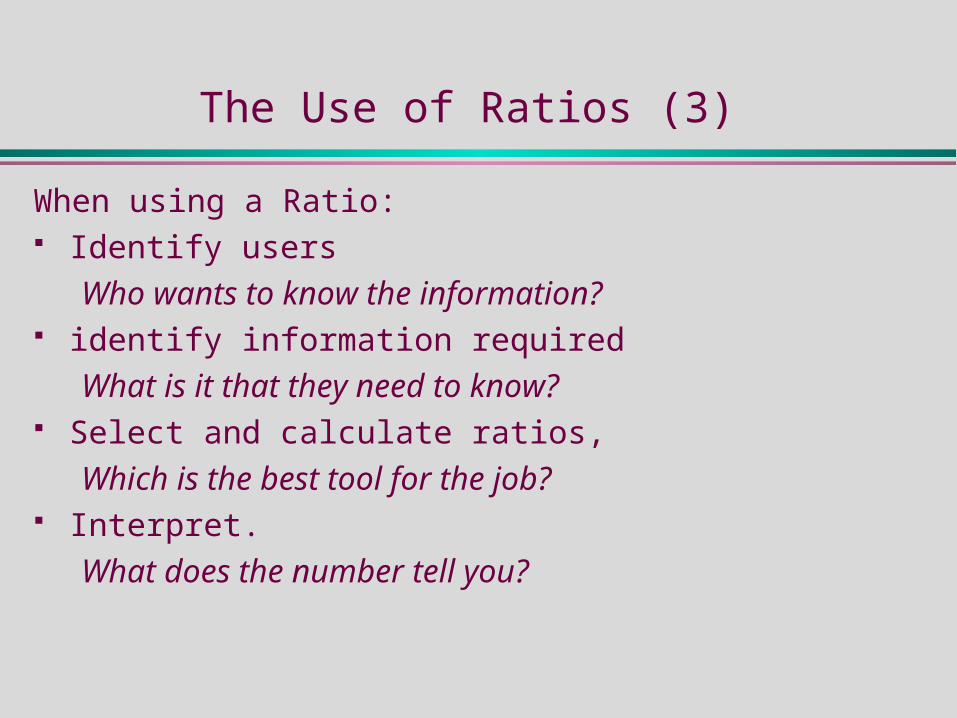
The Use of Ratios (3)
When using a Ratio: Identify users
Who wants to know the information? identify information required
What is it that they need to know? Select and calculate ratios,
Which is the best tool for the job? Interpret.
What does the number tell you?
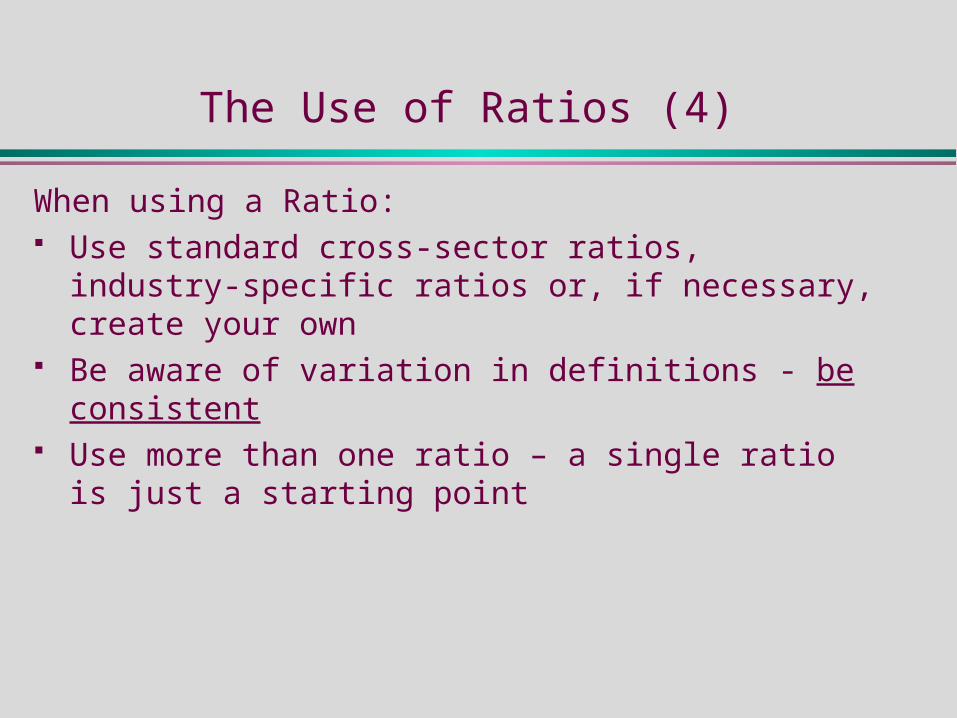
The Use of Ratios (4)
When using a Ratio: Use standard cross-sector ratios, industry-specific ratios
or, if necessary, create your own Be aware of variation in definitions - be consistent Use more than one ratio – a single ratio is just a starting
point

B: The Different Types of Ratio
The Different types of Ratio
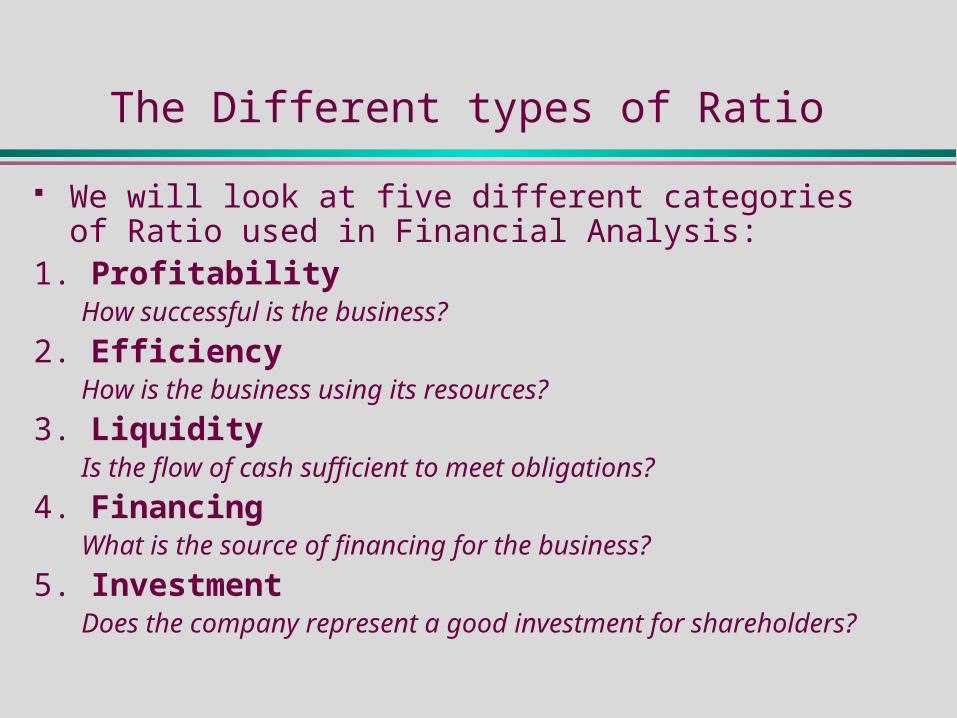
We will look at five different categories of Ratio used in Financial Analysis:
1. ProfitabilityHow successful is the business?
2. EfficiencyHow is the business using its resources?
3. LiquidityIs the flow of cash sufficient to meet obligations?
4. FinancingWhat is the source of financing for the business?
5. InvestmentDoes the company represent a good investment for shareholders?

The Different Types of Ratio
1. Profitability

Profitability Ratios
The first set of ratios we will look at, attempt to measure profitability; that is, whether or not the business is financially successful.
Note that just looking at the the amount of of profit made by a company in a particular year may give a distorted picture of the company’s position.
A £1.5m profit generated on a turnover of £10m, can look very good. The same profit on a turnover of £100m looks poor.
However there may be reasons why the first company has generated so much profit; there could be a one-off sale of assets, for example, which have increased in value.

Four Profitability Ratios
There are four important ratios:______________________________________________________________________________________________________________________________________________
Gross Margin% = Gross Profit x 100 Sales______________________________________________________________________________________________________________________________________________
Net Margin% = Net Profit before tax & interest x 100 Sales______________________________________________________________________________________________________________________________________________
Return on Ordinary Shareholders Funds (ROSF) =Net Profit after tax and preference dividends x100
(Share Capital + Reserves) ______________________________________________________________________________________________________________________________________________
Return on Capital Employed (ROCE) = Net Profit before tax and interest x100
(Share Capital + Reserves+ LT Loans)

Activity Two
Calculate and comment on profitability ratios for the two years shown:
YEAR 1 YEAR 2
SALES 2,240,000 2,681,200
COST OF SALES 1,745,400 2,072,000
OVERHEADS 252,000 362,800
INTEREST 24,000 6,200
TAX 60,200 76,000
DIVIDENDS 40,200 60,000
SHARE CAPITAL 300,000 334,100
RESERVES 198,300 302,500
LONG TERM LOANS 200,000 60,000

Activity Two – Example Spreadsheet
The Spreadsheet mfb4.exe gives the full set of examples and the details of the calculations carried out.
We will look at one example of each type of calculation
Managing Finance & Budgets - Ratio Analysis
Profitability (Activity 2) Year 1 Year 2 Profitability (Activity 2) Year 1 Year 2
Sales 2,240,000 2,681,200 Gross Margin% 22.1% 22.7%Cost of Sales 1,745,400 2,072,000 Net Margin% 10.8% 9.2%
Gross Profit 494,600 609,200 ROSF 31.8% 25.8%Overheads 252,000 362,800 ROCE 34.8% 35.4%Net Profit 242,600 246,400
Interest 24,000 6,200Tax 60,200 76,000
Dividends 40,200 60,000Net profit after tax and dividends 118,200 104,200
Share Capital 300,000 334,100Reserves 197,500 301,700LT Loans 200,000 60,000
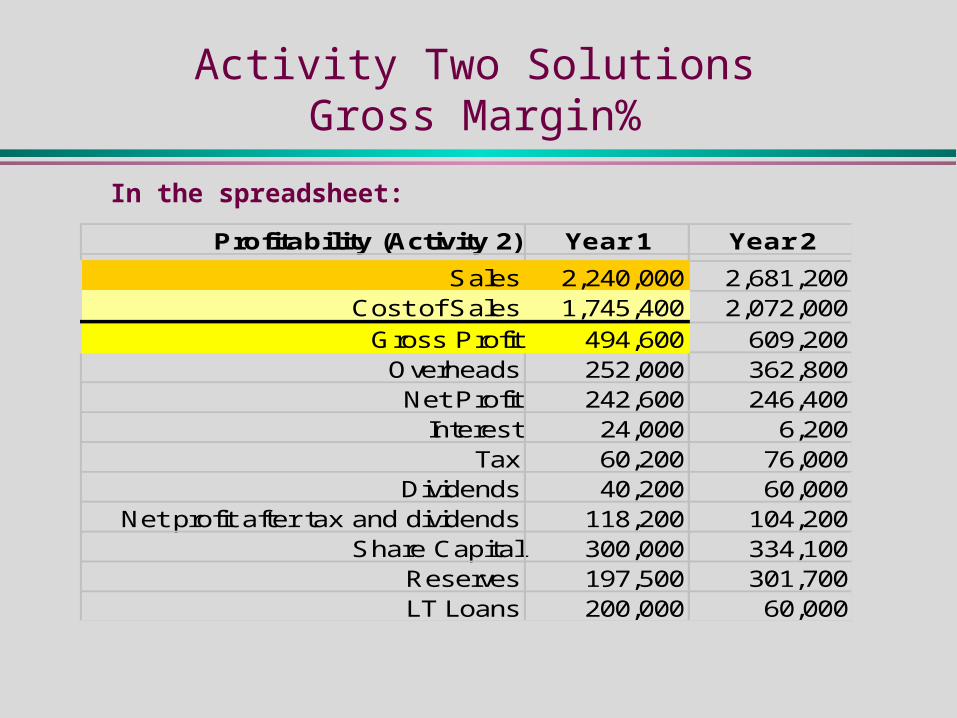
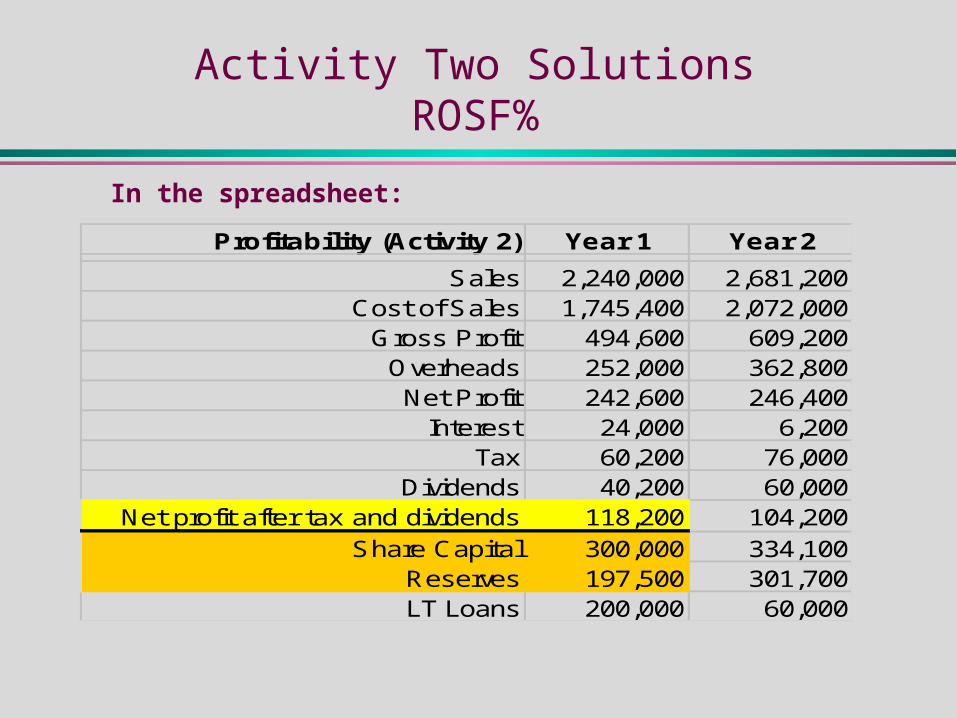
Activity Two SolutionsGross Margin%
In the spreadsheet:
Profitability (Activity 2) Year 1 Year 2
Sales 2,240,000 2,681,200Cost of Sales 1,745,400 2,072,000
Gross Profit 494,600 609,200Overheads 252,000 362,800Net Profit 242,600 246,400
Interest 24,000 6,200Tax 60,200 76,000
Dividends 40,200 60,000Net profit after tax and dividends 118,200 104,200
Share Capital 300,000 334,100Reserves 197,500 301,700LT Loans 200,000 60,000

Gross Margin%
The P & L Account Shows: Sales £2,240,000 Gross Profit £494,600
(NB Gross Profit = Turnover – Cost of Sales)
Gross Margin% = 494600 x 100 = 22.1%
2240000The company makes 22p for every £1 it brings in. This can be used to pay overheads etc.
The company makes 22p for every £1 it brings in. This can be used to pay overheads etc.

Activity Two SolutionsNet Margin%
In the spreadsheet:
Profitability (Activity 2) Year 1 Year 2
Sales 2,240,000 2,681,200Cost of Sales 1,745,400 2,072,000
Gross Profit 494,600 609,200Overheads 252,000 362,800Net Profit 242,600 246,400
Interest 24,000 6,200Tax 60,200 76,000
Dividends 40,200 60,000Net profit after tax and dividends 118,200 104,200
Share Capital 300,000 334,100Reserves 197,500 301,700LT Loans 200,000 60,000

Net Margin%
The P & L Account Shows: Sales £2,240,000 Net Profit after Tax and Dividends £118,200
(NB
Net Profit = Turnover – Cost of Sales- Overheads)
Net Margin% = 118200 x 100 = 10.8%
2240000After paying all outstanding costs, the company makes 11p for every £1 it brings in.
After paying all outstanding costs, the company makes 11p for every £1 it brings in.
Activity Two SolutionsROSF%
In the spreadsheet:
Profitability (Activity 2) Year 1 Year 2
Sales 2,240,000 2,681,200Cost of Sales 1,745,400 2,072,000
Gross Profit 494,600 609,200Overheads 252,000 362,800Net Profit 242,600 246,400
Interest 24,000 6,200Tax 60,200 76,000
Dividends 40,200 60,000Net profit after tax and dividends 118,200 104,200
Share Capital 300,000 334,100Reserves 197,500 301,700LT Loans 200,000 60,000

ROSF%
The P & L Account Shows: Net Profit after Tax and Dividends £118,200
Share Capital £300,000 Reserves £197,500
£497,500
ROSF% = 118200 x 100 = 31.8%
497500The company is making 32p for every £1 invested by shareholders.
The company is making 32p for every £1 invested by shareholders.

Activity Two SolutionsROCE%
In the spreadsheet:
Profitability (Activity 2) Year 1 Year 2
Sales 2,240,000 2,681,200Cost of Sales 1,745,400 2,072,000
Gross Profit 494,600 609,200Overheads 252,000 362,800Net Profit 242,600 246,400
Interest 24,000 6,200Tax 60,200 76,000
Dividends 40,200 60,000Net profit after tax and dividends 118,200 104,200
Share Capital 300,000 334,100Reserves 197,500 301,700LT Loans 200,000 60,000
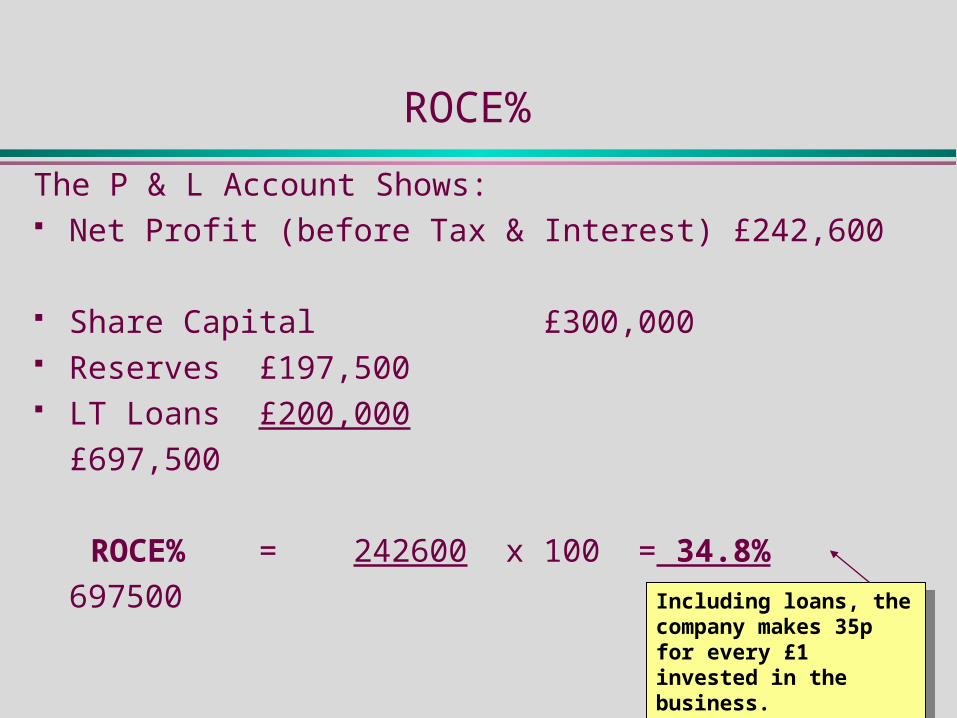
ROCE%
The P & L Account Shows: Net Profit (before Tax & Interest) £242,600
Share Capital £300,000 Reserves £197,500 LT Loans £200,000
£697,500
ROCE% = 242600 x 100 = 34.8%
697500 Including loans, the company makes 35p for every £1 invested in the business.
Including loans, the company makes 35p for every £1 invested in the business.

The Different Types of Ratio
2. Liquidity
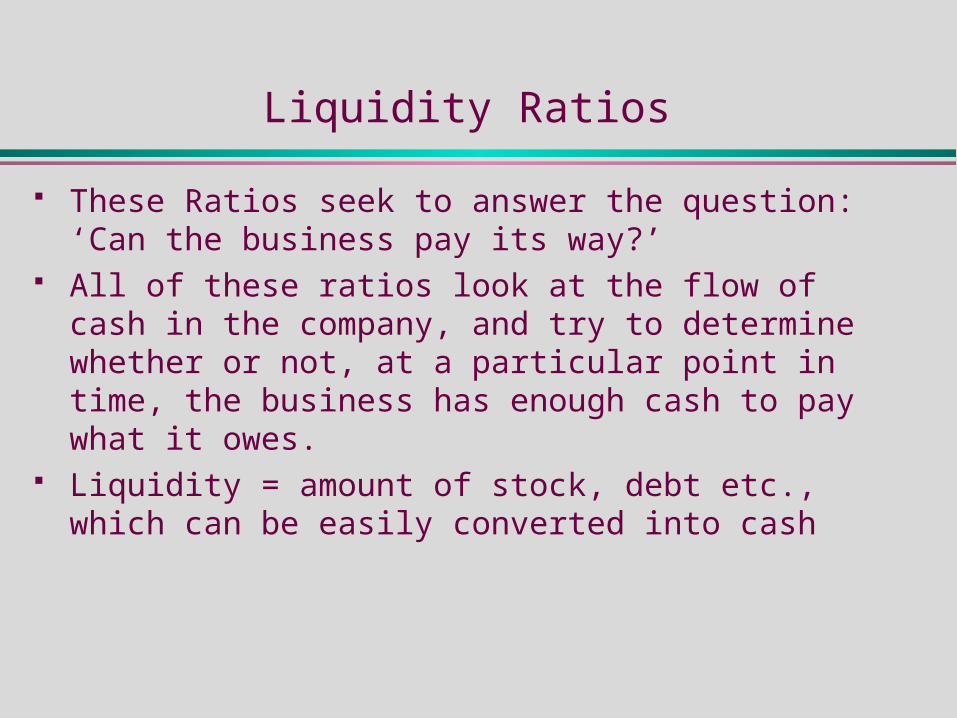
Liquidity Ratios
These Ratios seek to answer the question: ‘Can the business pay its way?’
All of these ratios look at the flow of cash in the company, and try to determine whether or not, at a particular point in time, the business has enough cash to pay what it owes.
Liquidity = amount of stock, debt etc., which can be easily converted into cash

Ratios - Liquidity
We look at three ratios:______________________________________________________________________________________________________________________________________________
Current ratio = Current Assets (Over 1 for solvency)
Current Liabilities
e.g. Current ratio of 1.5 = £1.50 owned for every £1 owed______________________________________________________________________________________________________________________________________________
Acid test = Current Assets excluding stock
Current Liabilities______________________________________________________________________________________________________________________________________________
Operating Cash Flow to Maturing Obligations =
Operating Cash Flows
Current Liabilities

Activity Three
Calculate and comment on liquidity ratios for the two years shown:
YEAR 1 YEAR 2
DEBTORS 240,800 210,200
BANK ACCOUNT 33,500 41,000
OPENING STOCK 241,000 300,000
CLOSING STOCK 300,000 370,800
TRADE CREDITORS 221,400 228,800
DIVIDENDS OWING 40,200 60,000
CORPORATION TAX OWING 60,200 76,000
CASHFLOW FROM OPERATIONS 231,000 251,400

Activity Three
The ratios in this section refer to the items in the second part of the spreadsheet mfb4.exe
Liquidity (Activity 3) Year 1 Year 2 Liquidity (Activity 3) Year 1 Year 2
Trade Debtors 240,800 210,200 Current Assets 574,300 622,000Bank Account 33,500 41,000 Current Liabilities 321,800 364,800
Opening Stock Value 241,000 300,000 Current Ratio 1.8 1.7Closing Stock Value 300,000 370,800 Acid Test 0.9 0.7
Trade Creditors 221,400 228,800 Cashflow to Obligations 0.7 0.7Dividends owing 40,200 60,000
Corporation tax owing 60,200 76,000Net Cashflow from Operations 231,000 251,400
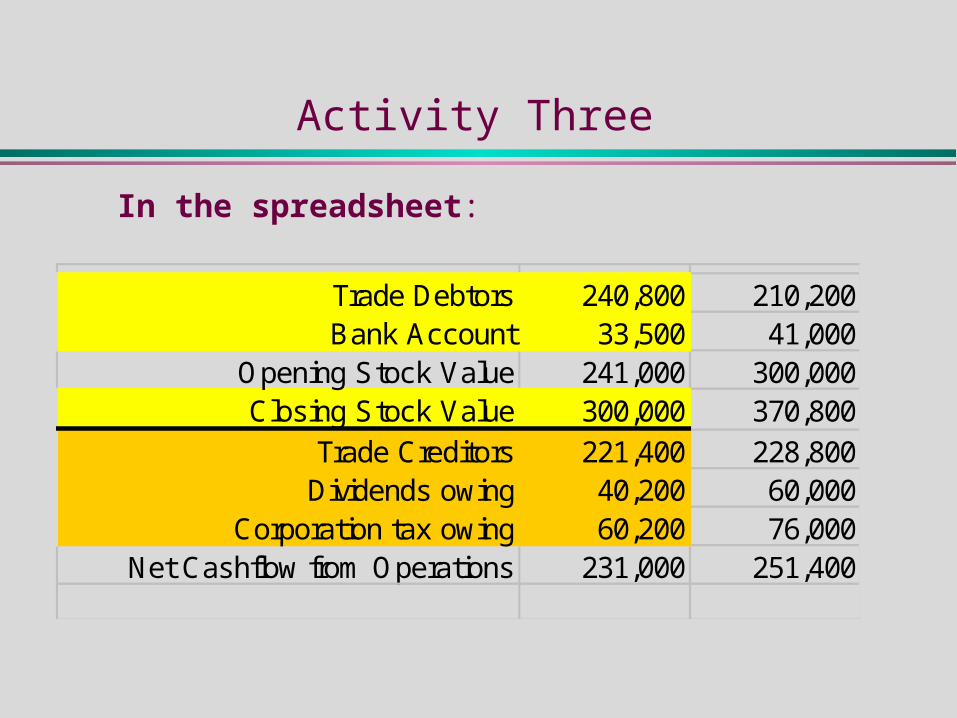
Activity Three
In the spreadsheet:
Trade Debtors 240,800 210,200Bank Account 33,500 41,000
Opening Stock Value 241,000 300,000Closing Stock Value 300,000 370,800
Trade Creditors 221,400 228,800Dividends owing 40,200 60,000
Corporation tax owing 60,200 76,000Net Cashflow from Operations 231,000 251,400
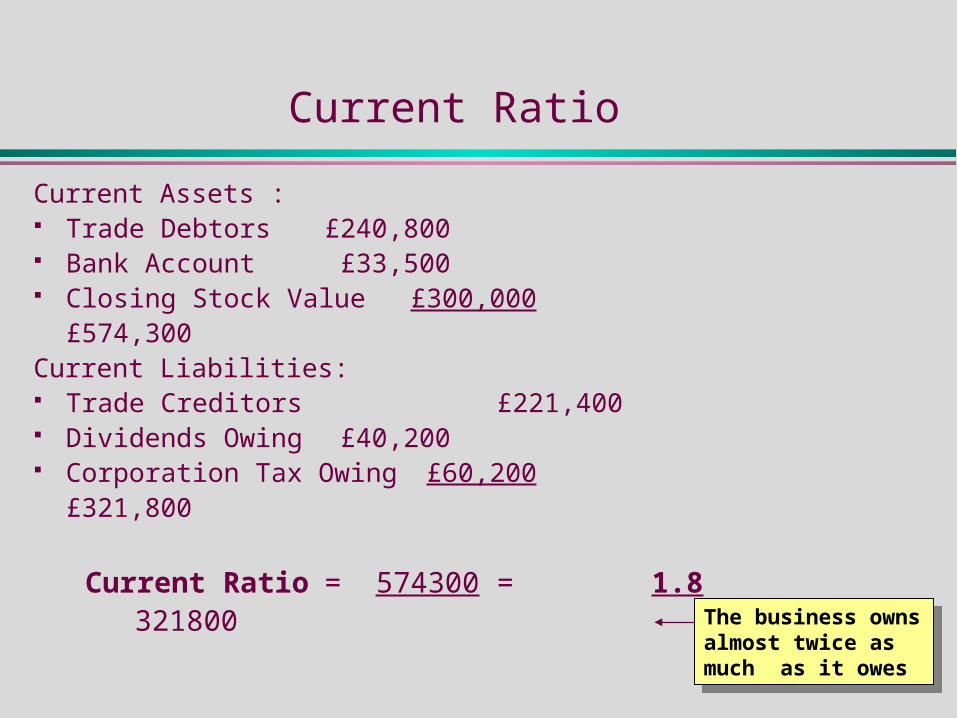
Current Ratio
Current Assets : Trade Debtors £240,800 Bank Account £33,500 Closing Stock Value £300,000
£574,300Current Liabilities: Trade Creditors £221,400 Dividends Owing £40,200 Corporation Tax Owing £60,200
£321,800
Current Ratio = 574300 = 1.8 321800 The business owns
almost twice as much as it owes
The business owns almost twice as much as it owes
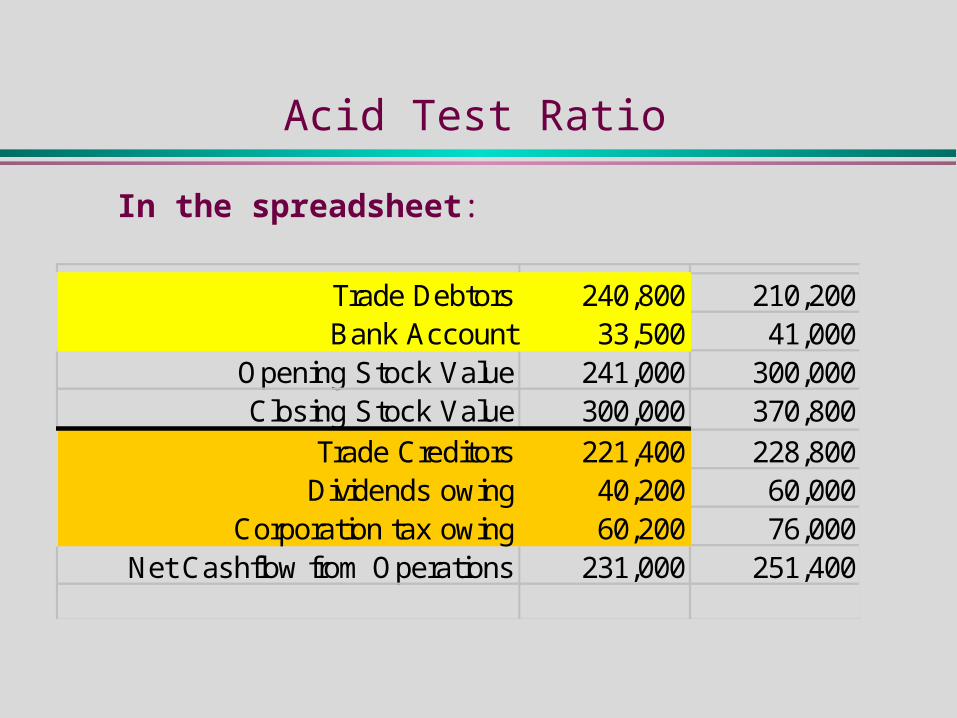
Acid Test Ratio
In the spreadsheet:
Trade Debtors 240,800 210,200Bank Account 33,500 41,000
Opening Stock Value 241,000 300,000Closing Stock Value 300,000 370,800
Trade Creditors 221,400 228,800Dividends owing 40,200 60,000
Corporation tax owing 60,200 76,000Net Cashflow from Operations 231,000 251,400

Acid Test Ratio
Current Assets excluding Stock : Trade Debtors £240,800 Bank Account £33,500
£274,300Current Liabilities: Trade Creditors £221,400 Dividends Owing £40,200 Corporation Tax Owing £60,200
£321,800
Acid Test Ratio = 274300 = 0.9 321800
Excluding stock, the business owns almost as much as it owes..
Excluding stock, the business owns almost as much as it owes..

Cash-Flow to Obligations Ratio
In the spreadsheet:
Trade Debtors 240,800 210,200Bank Account 33,500 41,000
Opening Stock Value 241,000 300,000Closing Stock Value 300,000 370,800
Trade Creditors 221,400 228,800Dividends owing 40,200 60,000
Corporation tax owing 60,200 76,000Net Cashflow from Operations 231,000 251,400

Cash-Flow to Obligations Ratio
Net Cash-Flow from Operations £231,000
Current Liabilities: Trade Creditors £221,400 Dividends Owing £40,200 Corporation Tax Owing £60,200
£321,800
Cash-Flow to Obligations = 231,000 = 0.7
Ratio 321800 The currently available cash in circulation is about three-quarters of what is needed to pay current debts
The currently available cash in circulation is about three-quarters of what is needed to pay current debts

The Different Types of Ratio
3. Financing
Financing Ratios
Organisations use external funding because: It may be beneficial tax-wise They may have insufficient funds themselves The return may be higher than the cost of the funding
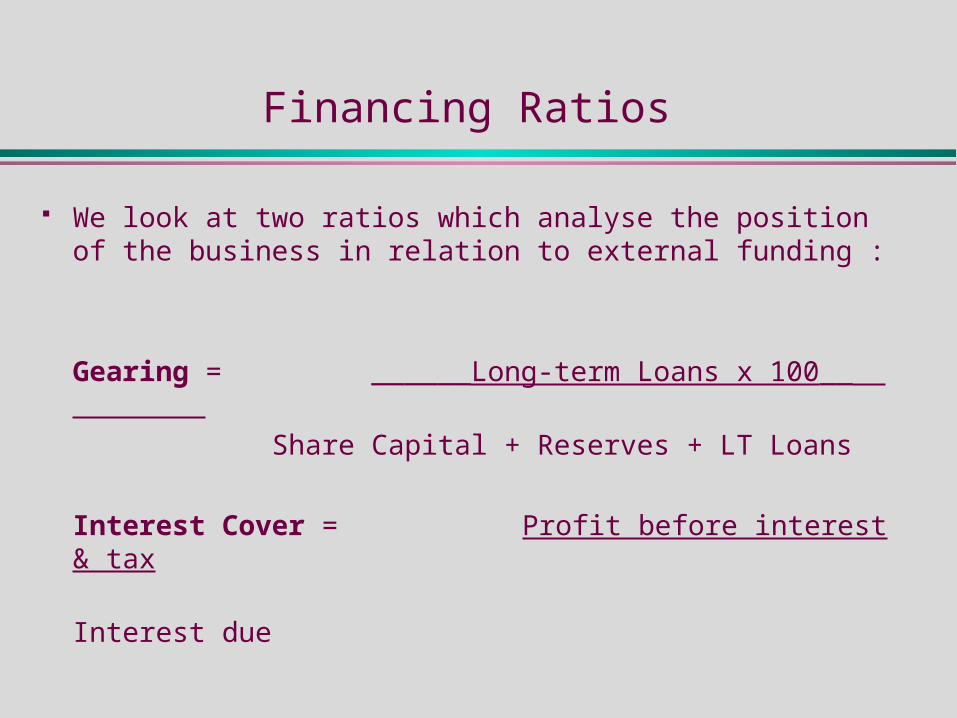
Financing Ratios
We look at two ratios which analyse the position of the business in relation to external funding :
Gearing = ______Long-term Loans x 100__
Share Capital + Reserves + LT Loans
Interest Cover = Profit before interest & tax
Interest due

Activity Four
Use the figures shown in Activity Two to calculate and comment on financing ratios for the two years shown.
Profitability (Activity 2) Year 1 Year 2
Sales 2,240,000 2,681,200Cost of Sales 1,745,400 2,072,000
Gross Profit 494,600 609,200Overheads 252,000 362,800Net Profit 242,600 246,400
Interest 24,000 6,200Tax 60,200 76,000
Dividends 40,200 60,000Net profit after tax and dividends 118,200 104,200
Share Capital 300,000 334,100Reserves 197,500 301,700LT Loans 200,000 60,000

Gearing
In the spreadsheet:
Profitability (Activity 2) Year 1 Year 2
Sales 2,240,000 2,681,200Cost of Sales 1,745,400 2,072,000
Gross Profit 494,600 609,200Overheads 252,000 362,800Net Profit 242,600 246,400
Interest 24,000 6,200Tax 60,200 76,000
Dividends 40,200 60,000Net profit after tax and dividends 118,200 104,200
Share Capital 300,000 334,100Reserves 197,500 301,700LT Loans 200,000 60,000
Note:
‘Long Term Loans’ appears in both the Numerator and the Denominator of the Ratio
Note:
‘Long Term Loans’ appears in both the Numerator and the Denominator of the Ratio
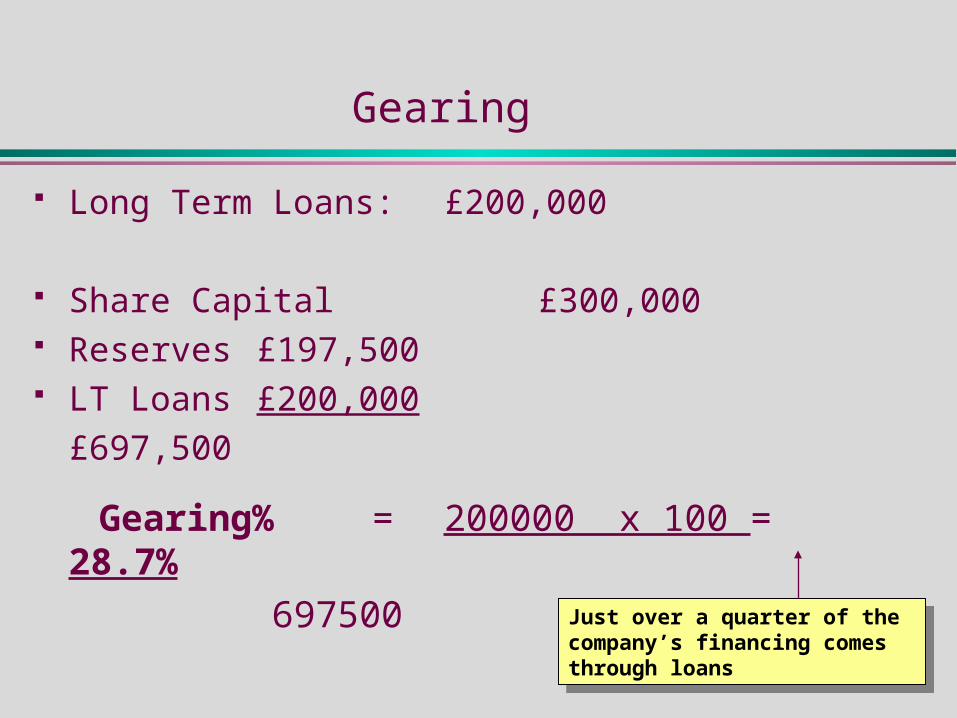
Gearing
Long Term Loans: £200,000
Share Capital £300,000 Reserves £197,500 LT Loans £200,000
£697,500
Gearing% = 200000 x 100 = 28.7%
697500Just over a quarter of the company’s financing comes through loans
Just over a quarter of the company’s financing comes through loans

What is gearing?
Financial Gearing occurs when a business is financed in part by outside parties.
This is normally in the form of a long-term loan or overdraft.
The level of gearing is crucial: under healthy trading conditions, companies which have higher gearing give greater returns for shareholders.
…see next slide…

Effect of gearing: Normal Conditions
Company A Company B Equity 100 10Loans - 90
Sales 100 100Direct Costs 40 40Gross Profit 60 60Indirect Costs 50 50Net Profit 10 10Interest @7% - 6.30Tax 3 1.11Profit after tax/int 7 2.59 ROSF 7% 26%
Company A has no gearing; Company B has high levels of gearing
Company A has no gearing; Company B has high levels of gearing
Both companies have the same levels of profitability and costs.
Both companies have the same levels of profitability and costs.
Company B pays out interest on loans, but Company A does not.
Company B pays out interest on loans, but Company A does not.
This is the crucial point: compare the Return on Shareholdings:
Although A makes more profit, B is working on lower levels of capital, and so its ROSF is proportionately much higher(26%) than for A (7%)
This is the crucial point: compare the Return on Shareholdings:
Although A makes more profit, B is working on lower levels of capital, and so its ROSF is proportionately much higher(26%) than for A (7%)

Effect of gearing: Poor Trading Conditions
------ Sales drop by 10% ------ Company A Company B
Equity 100 10Loans - 90
Sales 90 90Direct Costs 36 36Gross Profit 54 54Indirect Costs 50 50Net Profit 4 4Interest @7% - 6.30Tax 1.20 -Profit after tax/int 2.80 2.30- ROSF 2.8% -
Company A have the same levels of gearing as before.
Company A have the same levels of gearing as before.
A downturn in sales means that each company now has a net profit of only £4
A downturn in sales means that each company now has a net profit of only £4
After B has paid interest on the loan, the company is in deficit.
After B has paid interest on the loan, the company is in deficit.
In this case, A is still trading but showing a reduced profit to shareholders, but B is now in dire circumstances, and needs to find additional finance to continue trading.
In this case, A is still trading but showing a reduced profit to shareholders, but B is now in dire circumstances, and needs to find additional finance to continue trading.

Interest Cover
In the spreadsheet:
Profitability (Activity 2) Year 1 Year 2
Sales 2,240,000 2,681,200Cost of Sales 1,745,400 2,072,000
Gross Profit 494,600 609,200Overheads 252,000 362,800Net Profit 242,600 246,400
Interest 24,000 6,200Tax 60,200 76,000
Dividends 40,200 60,000Net profit after tax and dividends 118,200 104,200
Share Capital 300,000 334,100Reserves 197,500 301,700LT Loans 200,000 60,000

Interest Cover
Net Profit: £242,600
Interest due £24,000
Interest Cover = 242600 = 10.1
24000
The company makes 10 times as much as it needs to service its loans
The company makes 10 times as much as it needs to service its loans

The Different Types of Ratio
4. Efficiency

Efficiency Ratios
These ratios are concerned with the way that assets are used in an organisation.
Some of these are useful financial management tools that we have met previously, for example the average stock turnover and the average credit period. As we have already seen, these can be very useful in controlling the flow of cash in an organisation.
Others are concerned with the use of resources, both human and otherwise.
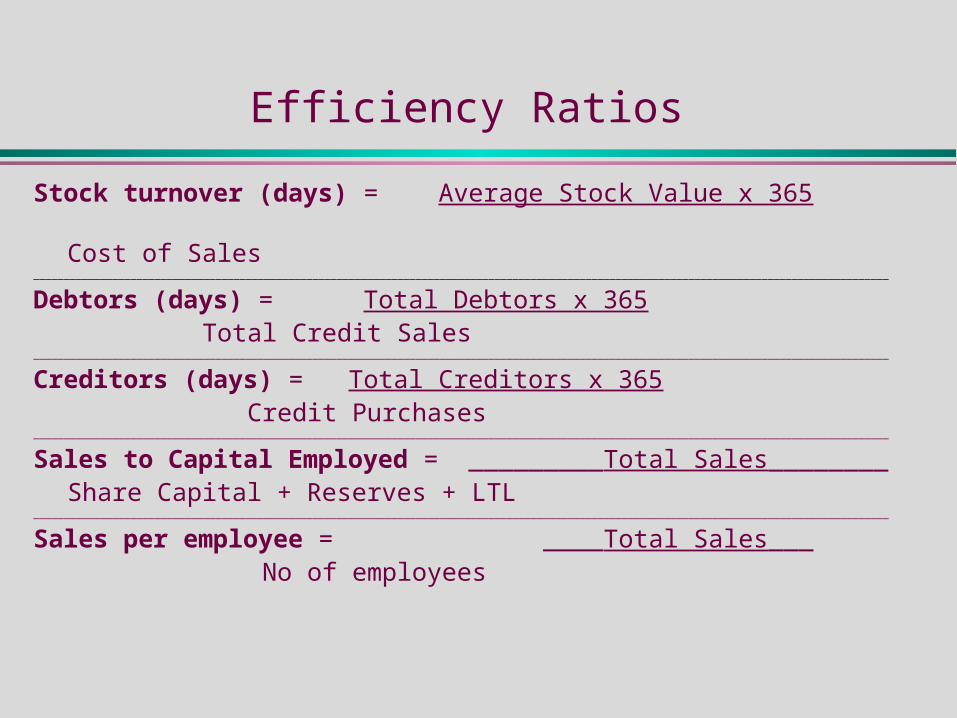
Efficiency Ratios
Stock turnover (days) = Average Stock Value x 365 Cost of Sales_____________________________________________________________________________________________________________________________________________
Debtors (days) = Total Debtors x 365 Total Credit Sales_____________________________________________________________________________________________________________________________________________
Creditors (days) = Total Creditors x 365 Credit Purchases_____________________________________________________________________________________________________________________________________________
Sales to Capital Employed = _________Total Sales________Share Capital + Reserves + LTL
_____________________________________________________________________________________________________________________________________________
Sales per employee = ____Total Sales___ No of employees
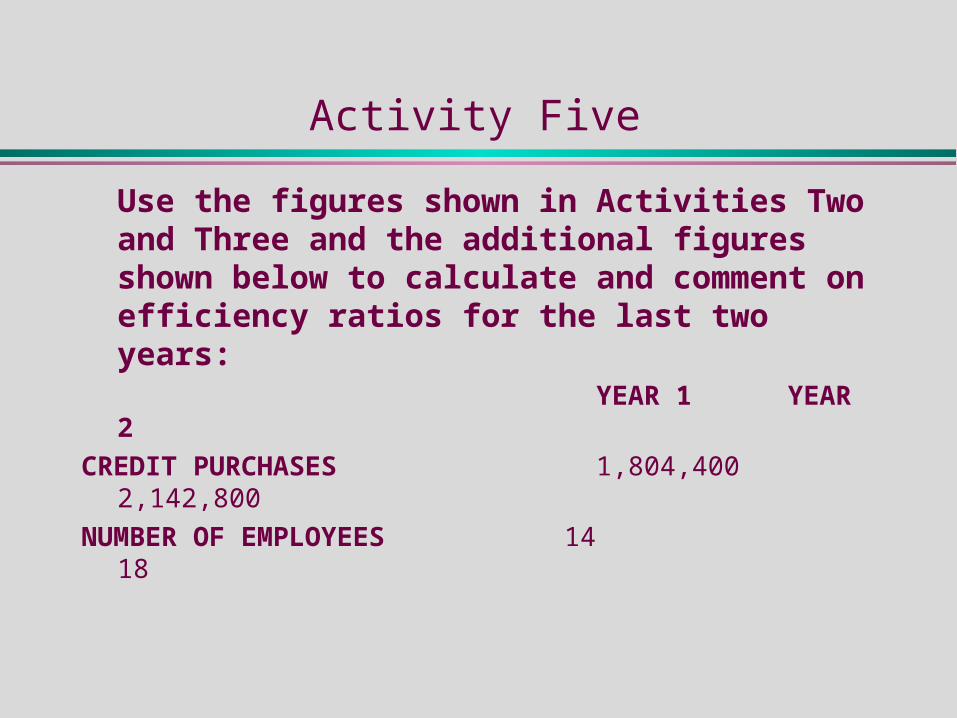
Activity Five
Use the figures shown in Activities Two and Three and the additional figures shown below to calculate and comment on efficiency ratios for the last two years:
YEAR 1 YEAR 2
CREDIT PURCHASES 1,804,4002,142,800
NUMBER OF EMPLOYEES 14 18

Stock Turnover Period
In the spreadsheets:
Liquidity (Activity 3) Year 1
Trade Debtors 240,800Bank Account 33,500
Opening Stock Value 241,000Closing Stock Value 300,000
Trade Creditors 221,400Dividends owing 40,200
Corporation tax owing 60,200Net Cashflow from Operations 231,000
Profitability (Activity 2) Year 1
Sales 2,240,000Cost of Sales 1,745,400
Gross Profit 494,600Overheads 252,000Net Profit 242,600
Interest 24,000Tax 60,200
Dividends 40,200Net profit after tax and dividends 118,200
Share Capital 300,000Reserves 197,500LT Loans 200,000
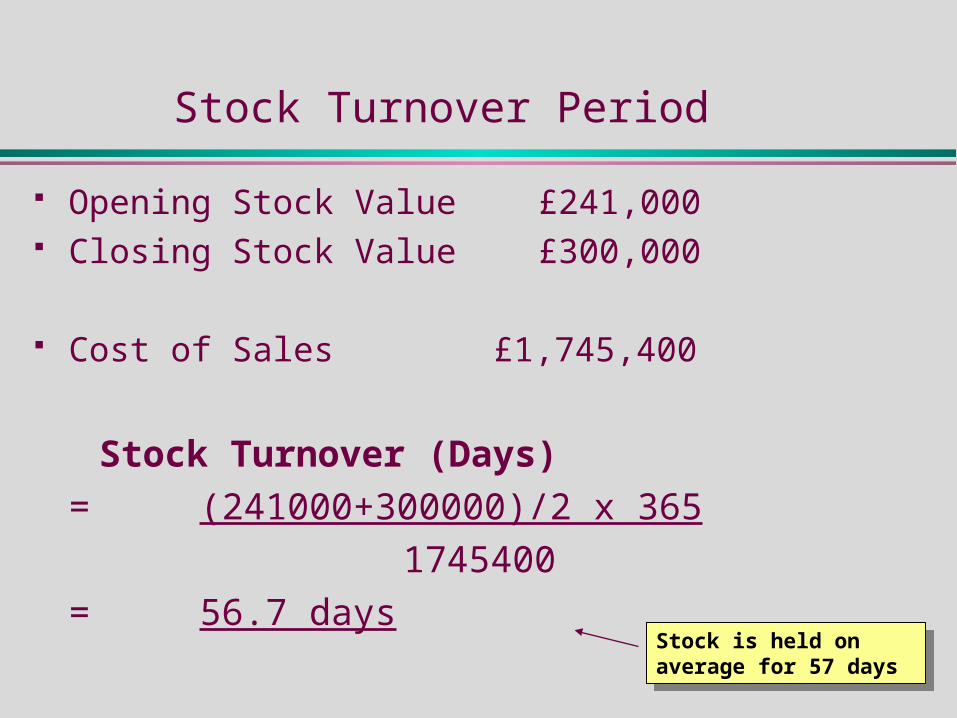
Stock Turnover Period
Opening Stock Value £241,000 Closing Stock Value £300,000
Cost of Sales £1,745,400
Stock Turnover (Days)
= (241000+300000)/2 x 365
1745400
= 56.7 daysStock is held on average for 57 days
Stock is held on average for 57 days

Average Settlement period for Debtors
In the spreadsheets:
Liquidity (Activity 3) Year 1
Trade Debtors 240,800Bank Account 33,500
Opening Stock Value 241,000Closing Stock Value 300,000
Trade Creditors 221,400Dividends owing 40,200
Corporation tax owing 60,200Net Cashflow from Operations 231,000
Profitability (Activity 2) Year 1
Sales 2,240,000Cost of Sales 1,745,400
Gross Profit 494,600Overheads 252,000Net Profit 242,600
Interest 24,000Tax 60,200
Dividends 40,200Net profit after tax and dividends 118,200
Share Capital 300,000Reserves 197,500LT Loans 200,000
We assume here that all the sales were on credit.
We assume here that all the sales were on credit.

Average Settlement period for Debtors
Trade Debtors £240,800
Total Sales £2,240,000
Average Settlement Period = 240800 x 365
2240000
= 39.2 daysDebtors take 39 days on average to pay the money.
Debtors take 39 days on average to pay the money.

Average Settlement period for Creditors
In the spreadsheets:
Efficiency (Activity 5) Year 1
Credit purchases 1,804,400Number of employees 14
Liquidity (Activity 3) Year 1
Trade Debtors 240,800Bank Account 33,500
Opening Stock Value 241,000Closing Stock Value 300,000
Trade Creditors 221,400Dividends owing 40,200
Corporation tax owing 60,200Net Cashflow from Operations 231,000
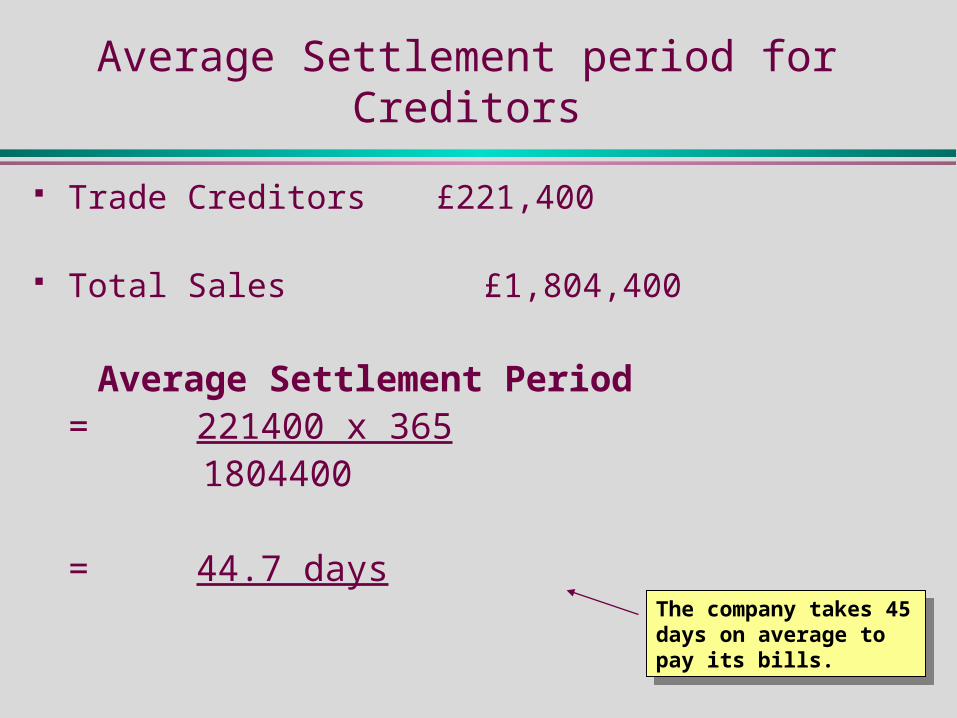
Average Settlement period for Creditors
Trade Creditors £221,400
Total Sales £1,804,400
Average Settlement Period = 221400 x 365
1804400
= 44.7 daysThe company takes 45 days on average to pay its bills.
The company takes 45 days on average to pay its bills.
Sales to Capital Employed
In the spreadsheets:
Profitability (Activity 2) Year 1
Sales 2,240,000Cost of Sales 1,745,400
Gross Profit 494,600Overheads 252,000Net Profit 242,600
Interest 24,000Tax 60,200
Dividends 40,200Net profit after tax and dividends 118,200
Share Capital 300,000Reserves 197,500LT Loans 200,000

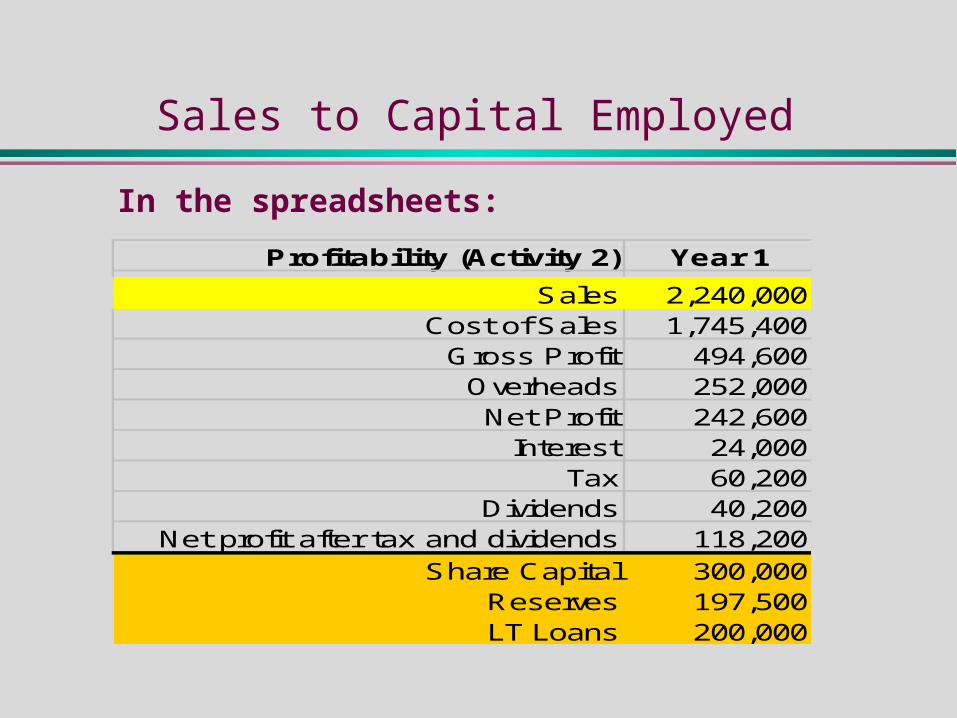
Sales to Capital Employed
Total Sales £2,240,000
Share Capital £300,000 Reserves £197,500 LT Loans £200,000
£697,500 Sales to Capital Employed
= 2240000 697500
= 3.2The turnover of the business is three times the total capital invested in it.
The turnover of the business is three times the total capital invested in it.
Sales per Employee
In the spreadsheets:Profitability (Activity 2) Year 1
Sales 2,240,000Cost of Sales 1,745,400
Gross Profit 494,600Overheads 252,000Net Profit 242,600
Interest 24,000Tax 60,200
Dividends 40,200Net profit after tax and dividends 118,200
Share Capital 300,000Reserves 197,500LT Loans 200,000
Efficiency (Activity 5) Year 1
Credit purchases 1,804,400Number of employees 14
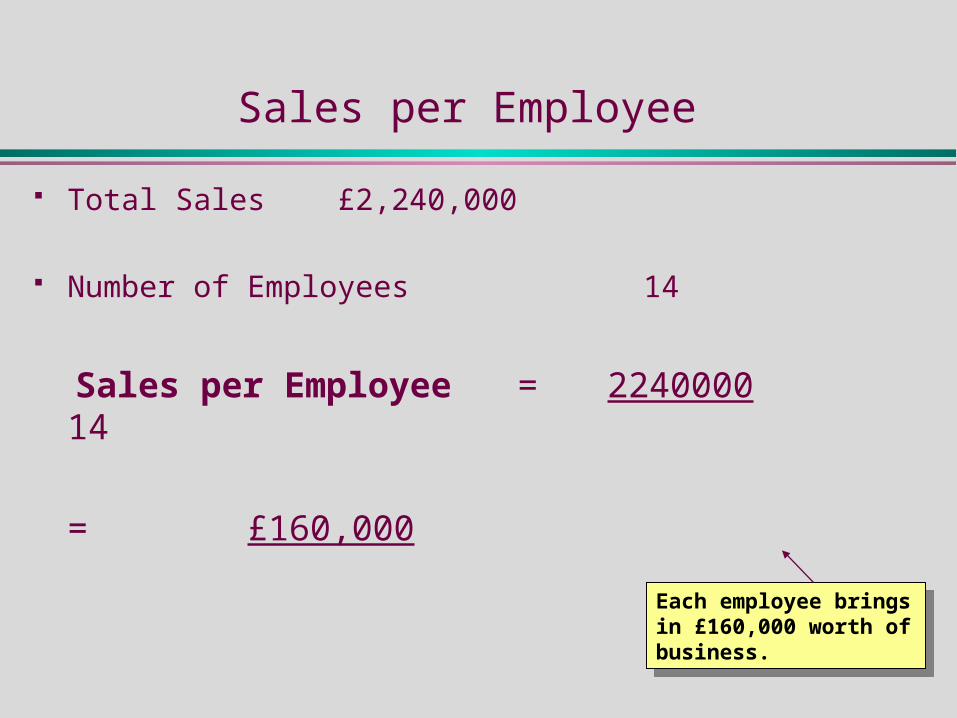
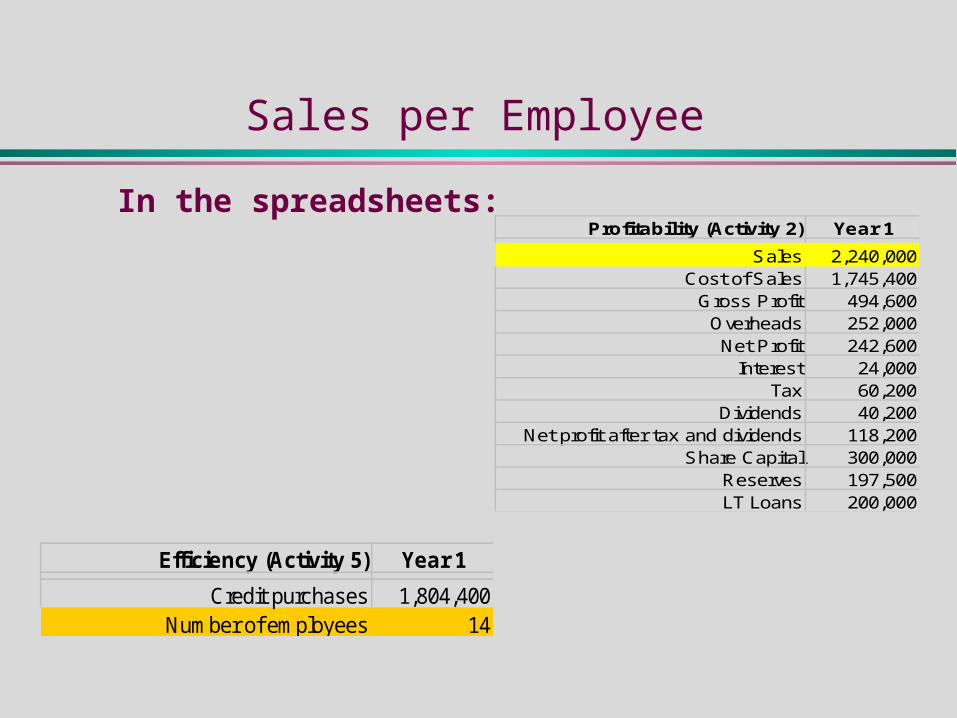
Sales per Employee
Total Sales £2,240,000
Number of Employees 14
Sales per Employee = 2240000 14
= £160,000
Each employee brings in £160,000 worth of business.
Each employee brings in £160,000 worth of business.

The Different Types of Ratio
5. Investment
Investment Ratios
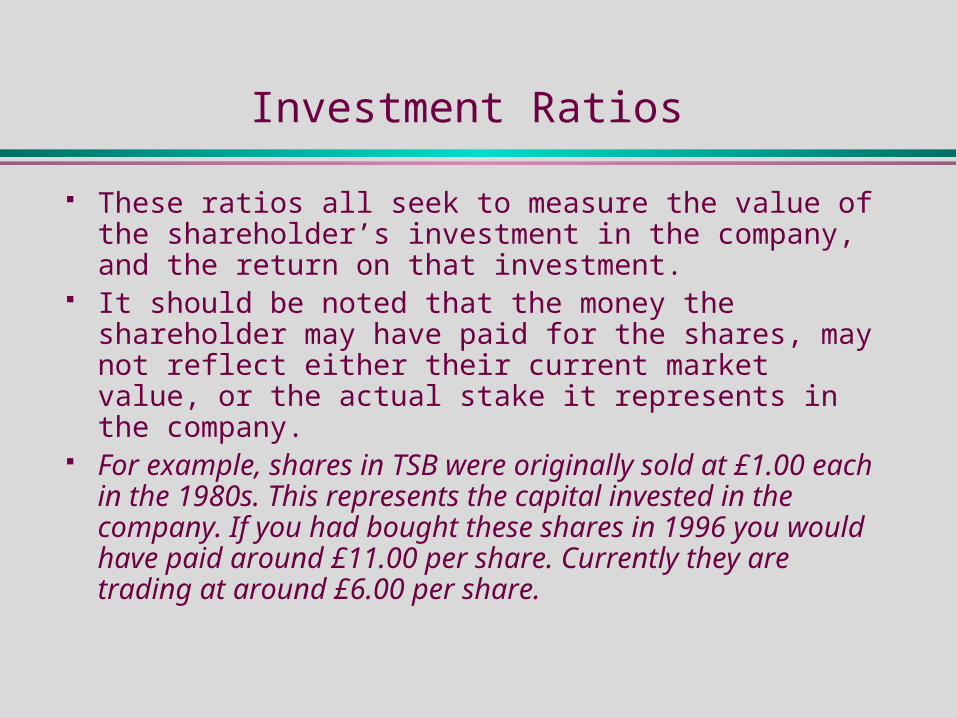
These ratios all seek to measure the value of the shareholder’s investment in the company, and the return on that investment.
It should be noted that the money the shareholder may have paid for the shares, may not reflect either their current market value, or the actual stake it represents in the company.
For example, shares in TSB were originally sold at £1.00 each in the 1980s. This represents the capital invested in the company. If you had bought these shares in 1996 you would have paid around £11.00 per share. Currently they are trading at around £6.00 per share.
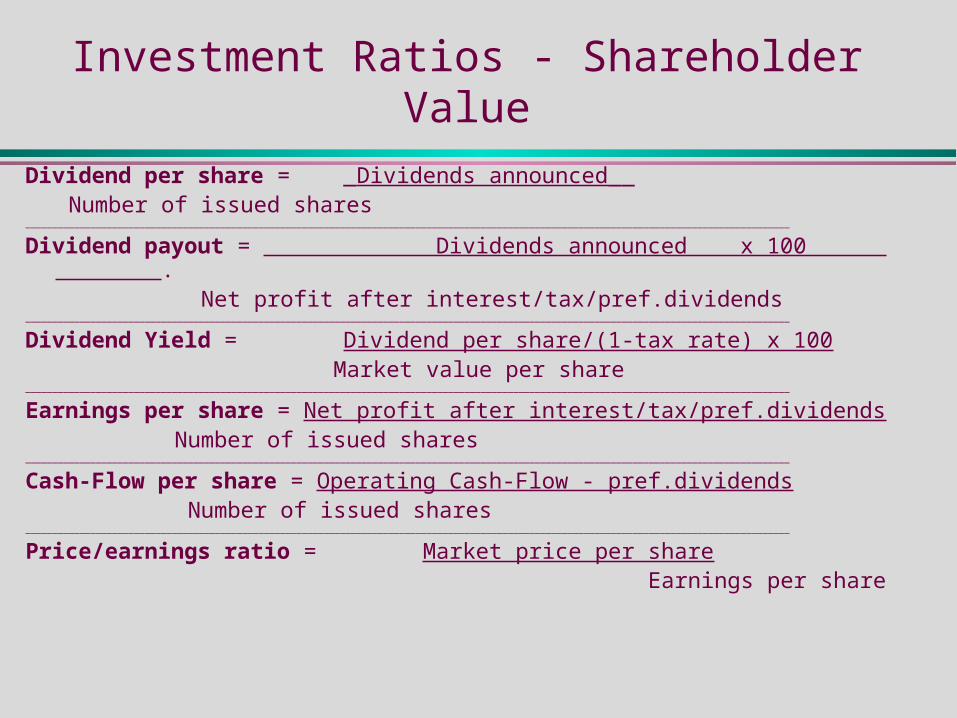
Investment Ratios - Shareholder Value
Dividend per share = _Dividends announced__ Number of issued shares
_____________________________________________________________________________________________________________________________________________
Dividend payout = Dividends announced x 100 . Net profit after interest/tax/pref.dividends
_____________________________________________________________________________________________________________________________________________
Dividend Yield = Dividend per share/(1-tax rate) x 100 Market value per share
_____________________________________________________________________________________________________________________________________________
Earnings per share = Net profit after interest/tax/pref.dividends Number of issued shares_____________________________________________________________________________________________________________________________________________
Cash-Flow per share = Operating Cash-Flow - pref.dividends Number of issued shares_____________________________________________________________________________________________________________________________________________
Price/earnings ratio = Market price per share Earnings per share

Activity Six
Using the figures given in Activities 2 and 3, and the additional figures below, calculate and comment on shareholder value for the two years shown:
YEAR 1 YEAR 2
Number of Ordinary Shares 600,000 668,200
Preference Dividends/Shares NIL NIL
Market Price Per Share 2.50 3.50

Dividend per Share
From the spreadsheets:
(Shareholder Value (Activity 6) Year 1
Number of ordinary shares 600,000Market price per share 2.50
Profitability (Activity 2) Year 1
Sales 2,240,000Cost of Sales 1,745,400
Gross Profit 494,600Overheads 252,000Net Profit 242,600
Interest 24,000Tax 60,200
Dividends 40,200Net profit after tax and dividends 118,200
Share Capital 300,000Reserves 197,500LT Loans 200,000
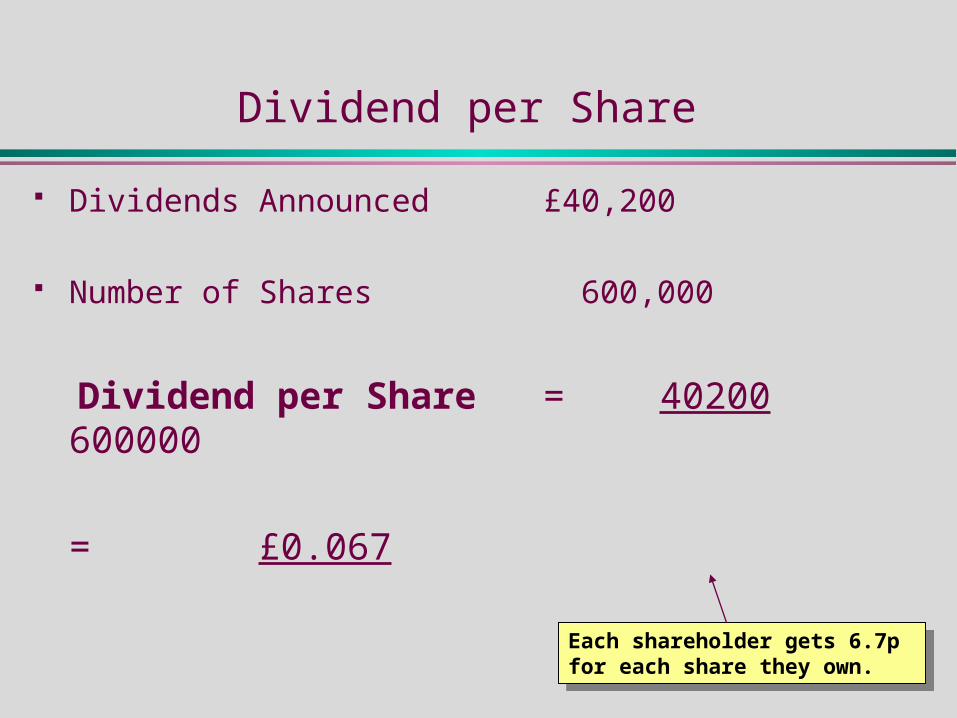
Dividend per Share
Dividends Announced £40,200
Number of Shares 600,000
Dividend per Share = 40200600000
= £0.067
Each shareholder gets 6.7p for each share they own.
Each shareholder gets 6.7p for each share they own.

Dividend Payout
From the spreadsheets:Profitability (Activity 2) Year 1
Sales 2,240,000Cost of Sales 1,745,400
Gross Profit 494,600Overheads 252,000Net Profit 242,600
Interest 24,000Tax 60,200
Dividends 40,200Net profit after tax and dividends 118,200
Share Capital 300,000Reserves 197,500LT Loans 200,000
Here we are assuming that these are ordinary, rather than preferential dividends
Here we are assuming that these are ordinary, rather than preferential dividends

Dividend Payout
Net Profit £242,600 Interest - £24,000 Tax - £60,200 Net profit after interest/tax £158,400
Dividends Announced £40,200 Dividend Payout = 40200 x 100 158400
= 25.4%One quarter of the total profit is paid out in dividends to shareholders.
One quarter of the total profit is paid out in dividends to shareholders.

Dividend Yield
From the spreadsheet and the first example in this section:
(Shareholder Value (Activity 6) Year 1
Number of ordinary shares 600,000Market price per share 2.50
Dividends Announced £40,200 Number of Shares 600,000
Dividend per Share = 40200 600000
= £0.067In addition, we will be assuming a tax rate of 20%
In addition, we will be assuming a tax rate of 20%

Dividend Yield
Dividend per share £0.067 Market Price per Share £2.50 Tax Rate 20%
Dividend Yield = 0.067/(1 – 0.2) x 100 2.50
= 3.35%
NB: 20% = 0.2NB: 20% = 0.2
Shareholders are currently getting a rate of return of 3.35% on their investment at market value (compare Inflation ~ 2%)
Shareholders are currently getting a rate of return of 3.35% on their investment at market value (compare Inflation ~ 2%)

Earnings per Share
From the spreadsheets:Profitability (Activity 2) Year 1
Sales 2,240,000Cost of Sales 1,745,400
Gross Profit 494,600Overheads 252,000Net Profit 242,600
Interest 24,000Tax 60,200
Dividends 40,200Net profit after tax and dividends 118,200
Share Capital 300,000Reserves 197,500LT Loans 200,000
(Shareholder Value (Activity 6) Year 1
Number of ordinary shares 600,000Market price per share 2.50
Here we are again assuming that these are ordinary, rather than preferential dividends
Here we are again assuming that these are ordinary, rather than preferential dividends

Earnings per Share
Net Profit £242,600 Interest - £24,000 Tax - £60,200 Net profit after interest/tax £158,400
Number of shares issued: 600,000 Earnings per Share: = 158400 600000
= £0.264
The company is making about 26p for every share that is held.
The company is making about 26p for every share that is held.

Cash-Flow per Share
From the spreadsheets:
(Shareholder Value (Activity 6) Year 1
Number of ordinary shares 600,000Market price per share 2.50
Liquidity (Activity 3) Year 1
Trade Debtors 240,800Bank Account 33,500
Opening Stock Value 241,000Closing Stock Value 300,000
Trade Creditors 221,400Dividends owing 40,200
Corporation tax owing 60,200Net Cashflow from Operations 231,000
Here we are again assuming that these are no preferential dividends
Here we are again assuming that these are no preferential dividends

Cash-Flow per Share
Operating Cash-Flow £231,000 Number of shares issued:
600,000
Cash-Flow per Share: = 231000 600000
= £0.385There is about 40p for every share in current circulation within the company.
There is about 40p for every share in current circulation within the company.
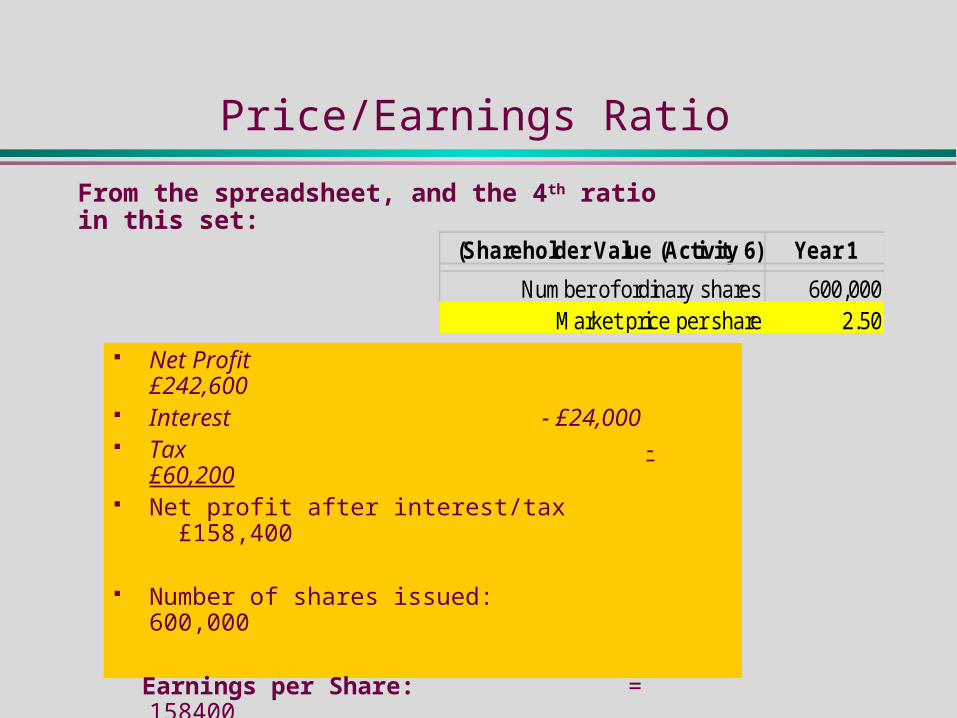
Price/Earnings Ratio
From the spreadsheet, and the 4th ratio in this set:
(Shareholder Value (Activity 6) Year 1
Number of ordinary shares 600,000Market price per share 2.50
Net Profit £242,600
Interest - £24,000 Tax -
£60,200 Net profit after interest/tax
£158,400
Number of shares issued: 600,000 Earnings per Share: = 158400
600000
= £0.264
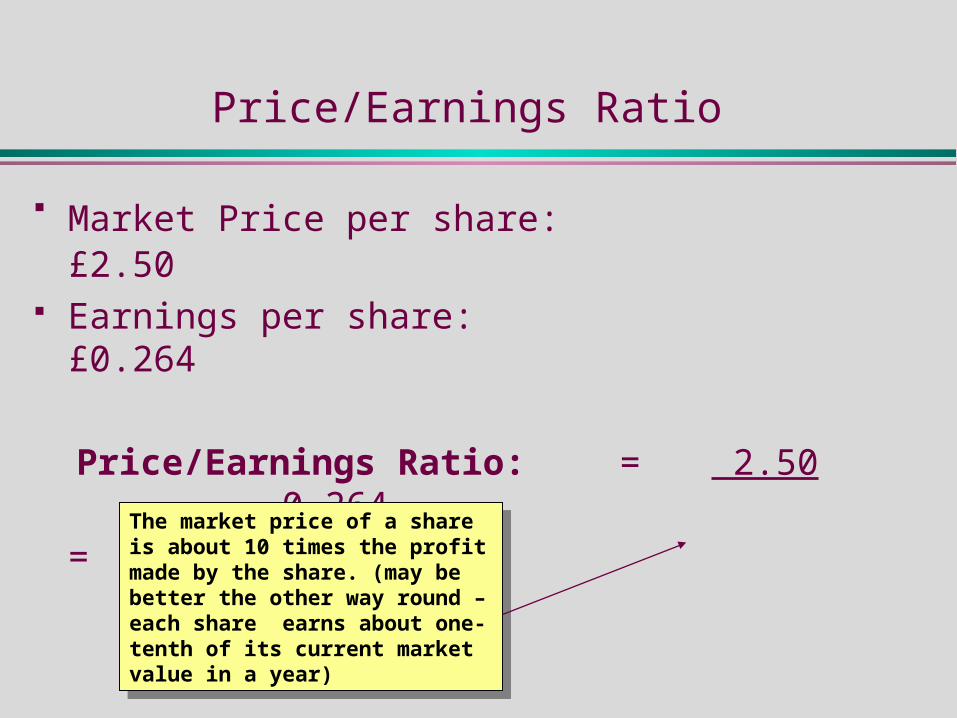
Price/Earnings Ratio
Market Price per share: £2.50 Earnings per share: £0.264
Price/Earnings Ratio: = 2.50 0.264
= 9.45The market price of a share is about 10 times the profit made by the share. (may be better the other way round – each share earns about one-tenth of its current market value in a year)
The market price of a share is about 10 times the profit made by the share. (may be better the other way round – each share earns about one-tenth of its current market value in a year)
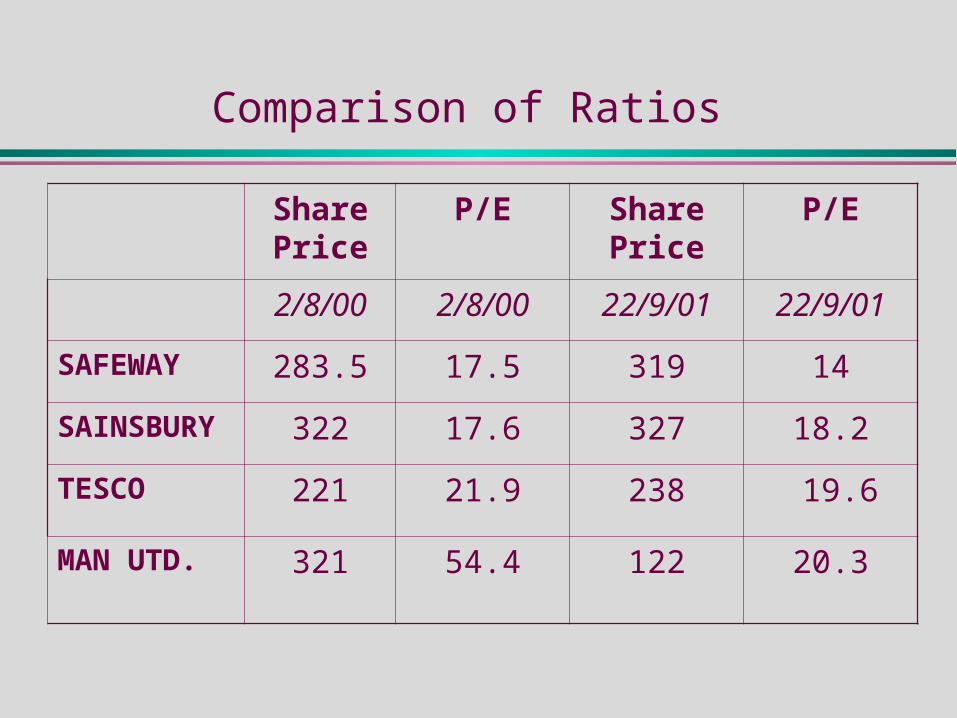
Comparison of Ratios
Share Price
P/E Share Price
P/E
2/8/00 2/8/00 22/9/01 22/9/01
SAFEWAY 283.5 17.5 319 14
SAINSBURY 322 17.6 327 18.2
TESCO 221 21.9 238 19.6
MAN UTD. 321 54.4 122 20.3
C: Example of Analysis

Analysing a Company’s Performance
The next slide shows five different ratios calculated from the published accounts of J. Sainsbury PLC, summarising the company’s performance over the five-year period 1996-2000
As you look through these figures, you should ask yourself: What trends can be detected? Is the company improving its performance? Would you consider investing in the company?
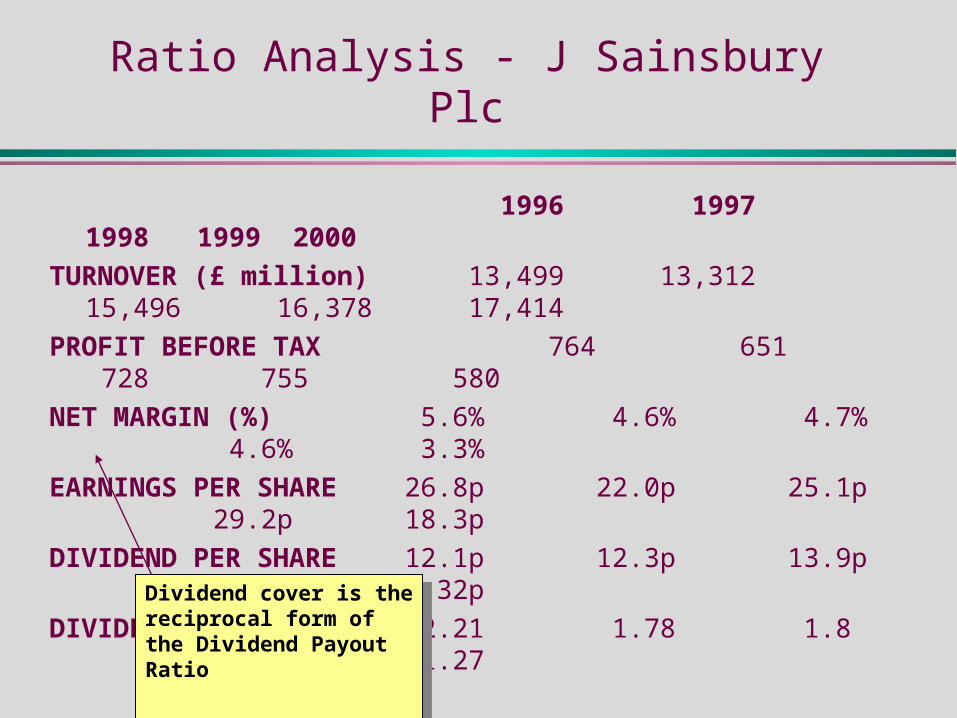
Ratio Analysis - J Sainsbury Plc
1996 1997 1998 1999 2000
TURNOVER (£ million) 13,499 13,312 15,496 16,37817,414
PROFIT BEFORE TAX 764 651 728 755 580
NET MARGIN (%) 5.6% 4.6% 4.7% 4.6% 3.3%
EARNINGS PER SHARE 26.8p 22.0p 25.1p 29.2p 18.3p
DIVIDEND PER SHARE 12.1p 12.3p 13.9p 14.32p 14.32p
DIVIDEND COVER 2.21 1.78 1.8 2.03 1.27
Figures taken from J Sainsbury Plc Website - 2 August 2000
Dividend cover is the reciprocal form of the Dividend Payout Ratio
Dividend cover is the reciprocal form of the Dividend Payout Ratio

Ratio Analysis - J Sainsbury Plc
1996 1997 1998 1999 2000
TURNOVER (£ million)
PROFIT BEFORE TAX
NET MARGIN (%)
EARNINGS PERSHARE
DIVIDEND PER SHARE
DIVIDEND COVER
Axis scales have been modified to enable comparisons to be made:
Axis scales have been modified to enable comparisons to be made:

Comparison of ratios
It can be noted from the previous slides that while the turnover has increased steadily over the five-year period, the profit before tax, fluctuates somewhat, with a sharp downturn in 2000.
The downward trend is even more evident from the net margin, which has down a steady reduction over the 5 years.
On the other hand, the dividend per share rose steadily over the first 4 years, and maintaining this level in 2000. However, the earnings per share shows a much less impressive performance.

The Limitations of Ratios
Analyses which only use ratios only give a limited vision: The quality of base data in financial statements may be
suspect. Ratios can measure relative performance, but do not allow
for scale (see Sainsbury example). They give only a basis for comparison – we need to
compare like with like. Some ratios ( balance sheet - e.g.) measuring at a single
point in time, and not over a period. One off events such as disposal of assets can give rise to
major distortions.

Activity Seven
Discuss the following:
If a business is “overtrading”, do you think the following ratios would be higher or lower than normally expected?
(a) Current ratio
(b) Average stock turnover period
(c) Average settlement period for debtors
(d) Average settlement period for creditors

Activity Seven
In an ‘overtrading’ position, these ratios would be:
(a)Current ratio:
Lower (Liabilities would increase)
(b)Average stock turnover period
Lower (Stock run-outs occur)
(c) Average settlement period for debtors
Higher (if inability to supply means total sales lower)
or Lower (if business chases debt due to shortage of cash)
(d)Average settlement period for creditors
Higher (shortage of cash makes it difficult to pay creditors)

Seminar Four - Activities
Preparation: readChapter 7 (M & A 2nd Edition) Or Chapter 6 (M & A 1st Edition)
Describe key concepts:Analysing accounts Ratios
Exercises: M & A (2nd Ed.) Exercise 7.3 (pages 239-240) and
Exercise 7.5 (pages 241-242) Or M & A (1st Ed.) Exercise 6.3 (pages 215-216) and
Exercise 6.5 (pages 217-218)