managing credit risk and emerging threats: may 19-21, 2021
TRANSCRIPT
www.iacpm.org
Virtual Spring ConferenceMay 19-21, 2021
Managing Credit Risk and Emerging Threats:
Lessons from the Gaps Revealed by the Pandemic
Amnon Levy, Moody’s AnalyticsLibor Pospisil, Moody’s AnalyticsJim Hempstead, Moody’s Investors Service

Presenters for This Session
Amnon Levy Libor Pospisil Jim Hempstead
Managing Director
Moody’s Analytics
Director
Moody’s Analytics
Managing Director
Moody’s Investors Service
San Francisco San Francisco New York
+1 (415) 874-6279 +1 (415) 874-6235 +1 (212) 553-4318
[email protected] [email protected] [email protected]
© IACPM 2

Review the gaps in credit models revealed by the COVID-
19 Pandemic
Live Q&A
Outline a cohesive credit risk framework that assesses
emerging threats, such as cyber risk and supply-chain
disruptions
Review qualitative methods used in fundamental analysis
that overcome data challenges inherent in emerging risks
Goals for This Session
Use alternative data to describe the varying impact of
emerging risks across credit segments
© IACPM 4

- Based on analyst’s expertise
- Considers nuanced aspects of each
counterparty, along with terms and conditions
- Useful in agency and internal ratings
- Naturally incorporate emerging risks through
qualitative overlay
Limitations:
- Difficult to update for portfolios with varying
characteristics
- Difficult to level set across segments
Fundamental
Analysis
- Based on statistical analysis
- Automated and applicable to large portfolios
- Useful as early warning indicator
- Useful with level setting across segments
- Needed for regulatory reporting/accounting
Limitations:
- Generic by their nature
- Challenged when environment deviates
from historical patterns (emerging risks)
Quantitative
Credit Models
Articulating the Impact of Emerging Risks on Credit
An inherent challenge
© IACPM 5

Challenges with Quantifying Emerging Risks
Traditional Expected Credit Loss Models Used in Stress Testing/Impairment
» Economic scenarios are based on models calibrated to experience with broad-brush variables such as unemployment
or GDP, and in of themselves cannot differentiate across credit segments or describe emerging risks
» Credit data often segmented coarsely, not allowing for variation in sensitivity to emerging risks
Lessons from COVID-19
» An overlay anchored to traditional models can account for COVID’s unique cross-sectional impact
» That style of overlay can be applied to other emerging risks
Quantifying the cross-sectional impact of emerging risks requires an assessment of:
Segment Granularity Alternative Data
© IACPM 6

The Pandemic’s Cross-Industry Impact
0%
1%
2%
3%
4%
5%
6%
AIRLINES AUTOMOTIVE
DINE-IN RESTAURANTS FAST FOOD RESTAURANTS
PHARMACEUTICALS
Mean EDFUSA
Empirical patterns lead to new thinking about granularity & data
FAST FOOD RESTAURANTS and DINE-IN
RESTAURANTS are often combined in a single
broader sector.
To model the Pandemic properly, they must be
separated
Granularity of 121 Industry Segments
© IACPM 7

The Pandemic’s Cross-Industry Impact
0%
1%
2%
3%
4%
5%
6%
AIRLINES AUTOMOTIVE
DINE-IN RESTAURANTS FAST FOOD RESTAURANTS
PHARMACEUTICALS
Mean EDFUSA
Empirical patterns lead to new thinking about granularity & data
FAST FOOD RESTAURANTS and DINE-IN
RESTAURANTS are often combined in a single
broader sector.
To model the Pandemic properly, they must be
separated
Granularity of 121 Industry Segments
Cross-Sectional Impact Is Unique to
The Pandemic
While in the beginning, the AUTOMOTIVE and
AIRLINES experienced a similar shock,
AIRLINES suffered longer thanks to continued social
distancing and travel restrictions.
AUTOMOTIVE segment recovered much faster, thanks
to improving consumer sentiment.
Naturally, the Pandemic did not have a substantially
adverse impact on PHARMACEUTICALS
© IACPM 8

Use of Alternative Data to Describe the PandemicCross-Industry and –Country patterns do not follow traditional models
Mean EDF The average levels are aligned.
Average of Travel Industries
DINE-IN REST., AIRLINES, HOTELS
Mean EDF The average levels are aligned.
Canada UK USA Germany France Japan
Unlike in the previous recessions,
industry patterns across countries
are comparable
AUTOMOTIVE Industry Segment
© IACPM 9

Use of Alternative DataTraditional models cannot capture cross-sectional patterns
Mean EDF The average levels are aligned.
Average of Travel Industries
DINE-IN REST., AIRLINES, HOTELS
Mean EDF The average levels are aligned.
Canada UK USA Germany France Japan
Unlike previous recessions, industry
patterns across countries are
comparable through the pandemic
How to differentiate dynamics across industry segments?
Calibrate sensitivities of industry segments to measures of
• Social distancing & the reaction of the population to the
Pandemic… MOBILITY INDEX
• Consumer Sentiment…Proxied by EQUITY INDEX -100
-80
-60
-40
-20
0
20Google Mobility Index - Retail & Recreation
Feb 2020Apr 2021
Canada UK USA Germany France Japan
AUTOMOTIVE Industry Segment
© IACPM 10

AIRLINES
PHARMACEUTICALS
SEMICONDUCTORS
AUTOMOTIVE
DINE-IN RESTAURANTS
LEISURE & RECREATION
Analytics: Cross-Sectional OverlayIncorporating observed patterns into credit risk modeling
Launch-off DateQuarter Quarter Quarter
Macroeconomic Scenario
Unemployment Rate, Equity Market, Oil Price,
House Prices, Credit Spread Index
Google Mobility Index for a country
– state of the pandemic and the
sociological reaction
Initial credit quality
Rating or PD
Event: Pandemic
Calibrated segment-level
parameters using the 2020 data
- Sensitivity to mobility
- Sensitivity to consumer
sentiment
Baseline Anchoring →
Macroeconomic shocks to be anchored to a Baseline
Scenario
PD Projection Under a 96th
Percentile Downturn Scenario
→ Spread of vaccine-resistant
variants
Traditional credit risk model →
Overall impact of the macroeconomic shock on credit risk
Cross-Sectional COVID-19 Overlay →
Varying impact on countries & granular industry segments
Economic recovery →
Are the vaccines effective? When will infections abate?
Pospisil, L., T. Daly, et al., “Incorporating Emerging
Risks within Credit Models: Lessons from Sociological
Reactions to COVID-19” Moody’s Analytics Research
Paper, December 2020.
© IACPM 11

Cross-Sectional Overlays for Past Crises This style of analysis can be applied well beyond the Pandemic
Drivers of cross-
sectional variationCOMPUTER SOFTWARE
experienced an adverse initial shock,
in line with the fall in Nasdaq.
Credit risk of AIRLINES increased
later and recovered faster, in line with
Dow Jones Index.
Nasdaq Dow JonesAIRLINES COMPUTER SOFTWARE
Mean EDF
COMPUTER SOFTWARE REAL ESTATE
Mean EDFUSA
House Price Index
Dow Jones
USA
Dot Com Bust
Financial Crisis Drivers of cross-
sectional variation
REAL ESTATE increased in credit risk
that remained elevated for a prolonged
period, in line with continued low level of
House Price Index
Segments, such as COMPUTER
SOFTWARE experienced an increase
and then a quicker recovery, in line with
Dow Jones Index.
© IACPM 12

Lessons from Previous CrisesOvercoming challenges with modeling emerging risks
Traditional
Quantitative Credit
Models
Models used for loss projections,
IFRS9/CECL, stress testing.
Based on longer time series of data, at
lower frequencies, such as quarterly.
Broad-brush economic variables, unable
to differentiate industry impact.
Fundamental
AnalysisEmerging risks, by their very
nature, are new threats, for
which sufficient historical data
does NOT exist
In many cases, a qualitative
assessment can be applied
consistently across asset classes
and is an indispensable part of
risk analysis
Quantitative Emerging Risks Framework
Credit Risk Data
Higher frequency, name-level data captures cross-sectional patterns by
allowing for empirical analysis with segment granularity descriptive of the
emerging risk
Alternative Data
Mobility Indexes
Consumer Sentiment
Supply chain
Vulnerability to cyber events
Geo-location of climate hazards
Cyber Events Supply-Chain Disruption Trade Disputes Infectious Diseases Natural Disasters
Emerging Threats
© IACPM 13
Technological Geopolitical Societal Enviromental

Fundamental Analysis:
Understand Emerging
Threats

© IACPM 15

© IACPM 16

Four Components to MIS Integration of ESG
New ESG scores will assist in transparently and systematically
demonstrating the impact of ESG on credit ratings
Heat Maps
Is ESG material to credit
quality?
Heat maps provide relative
ranking of various sectors along
the E and S classification of
risks.
ESG Classification
What is ESG?
Our classification reports
describe how we define and
categorize E, S and G
considerations that are material
to credit quality. New
environmental classification
sharpens focus on physical
climate risks.
Credit Ratings & Research
How is ESG integrated into credit
ratings?
ESG factors taken into consideration for
all credit ratings. Greater transparency in
PRs, as well as Credit opinions. Credit
Impact Score (CIS) is an output of the
rating process that indicates the extent, if
any, to which ESG factors impact the
rating of an issuer or transaction.
ESG Scores
How is a specific issuer exposed to
ESG risks/benefits?
Issuer Profile Scores (IPS) are issuer-specific
scores that assess an entity’s exposure to the
categories of risks in the ESG classification
from a credit perspective. IPSs, where
available, are inputs to credit ratings.
ESG
Analytical
Tools
© IACPM 17

….becoming more frequent and disruptive
Attacks on global energy infrastructure
October 2019 –
Attack on India’s largest
nuclear facility breaches IT
network.
March 2020 –
Attack on Europe’s Electric
Network Transmission
Operator breaches IT
network.
April 2020 –
Ransomware attack against
Energias de Portugal
impacts global IT network.
April 2020 –
Attack on Israeli water utility
seek to disrupt water supply
during COVID epidemic.
Feb 2020 –
Ransomware attack on US
natural gas compression
facility.
June 2020 –
ICS-capable SNAKE
ransomware attack
launched against Enel
disrupt corporate networks
February 2021 –
Eletrobras ransomware
attack on IT systems of
nuclear power subsidiary.
May 2021 –
Colonial pipeline halts
operations after
ransomware attack on IT
systems.
© IACPM 18

Oil and gas companies less likely to have completed tabletop simulation exercises than corporate and banking peers, and
less likely to perform cyber assessment on third-party vendors
Moody's Investors Service, self-reported issuer survey results
Cyber Risk
Percent of respondents by sector that have completed tabletop simulation
exercises since May 2020 Percent of respondents by sector requiring cyber assessment of third-party
vendors
0% 20% 40% 60% 80% 100%
Banking
TMT
Retail
Corporate Finance
Real Estate
Gaming
Transportation
Aerospace
Chemicals
Oil and Gas
0% 20% 40% 60% 80% 100%
Banking
Transportation
Business Services
TMT
Retail
Corporate Finance
Gaming
Chemicals
Real Estate
Aerospace
Oil and Gas
© IACPM 19

Oil and gas industry's cybersecurity investment approaching levels of more advanced banking sector
Cybersecurity spend as percentage of IT/OT budget
Source: Moody's Investors Service, self-reported issuer survey results
Cyber Risk
0%
1%
2%
3%
4%
5%
6%
7%
8%
9%
10%
Banking CorporateFinance
Aerospace BusinessServices
Chemicals Gaming Oil and Gas Real Estate Retail TMT Transportation
2018 2019 2020
© IACPM 20

Global cyber risk Issuer survey – series
© IACPM 21
Quantitative Methods for
Describing Emerging
Threats

Large-Scale Event
SolarWinds 2020, WannaCry 2017, Net Petya 2016,
Cyber Events and Their Impact on Credit RiskSelect types of cyber events and sources of the resulting loss
Confidential Data Breach System Failure Malicious Activity Or Ransomware Theft of IP or Technology
A Single Company Event
Equifax 2017, Marriott 2018
Disruption of the company’s core business Recovery costs Legal costs Damaged reputation
© IACPM 23

Large-Scale Event
SolarWinds 2020, WannaCry 2017, Net Petya 2016,
Cyber Events and Their Impact on Credit RiskSelect types of cyber events and sources of the resulting loss
How can cyber events change the creditworthiness of affected companies?
• Impact EDFs
• Contribute to rating reviews
• Lead to corporate bankruptcies
June 2019: Medical testing giants Quest Diagnostics and LabCorp announced…that personal and medical information of about 19.4 million patients had been compromised due to a breach of American Medical Collection Agency (AMCA), their billing collections vendor.
Retrieval-Masters Creditors Bureau Inc., which does business as AMCA, filed for Chapter 11 bankruptcy protectionhttps://www.forbes.com/sites/taylorarmerding/2019/
06/14/more-medical-mega-breaches-thanks-to-
third-party-insecurity/?sh=7ce624216111
https://www.moodys.com/research/Moodys-
places-SolarWinds-ratings-on-review-for-
downgrade-following-announcement--PR_437591December 2020
Confidential Data Breach System Failure Malicious Activity Or Ransomware Theft of IP or Technology
A Single Company Event
Equifax 2017, Marriott 2018
Disruption of the company’s core business Recovery costs Legal costs Damaged reputation
© IACPM 24
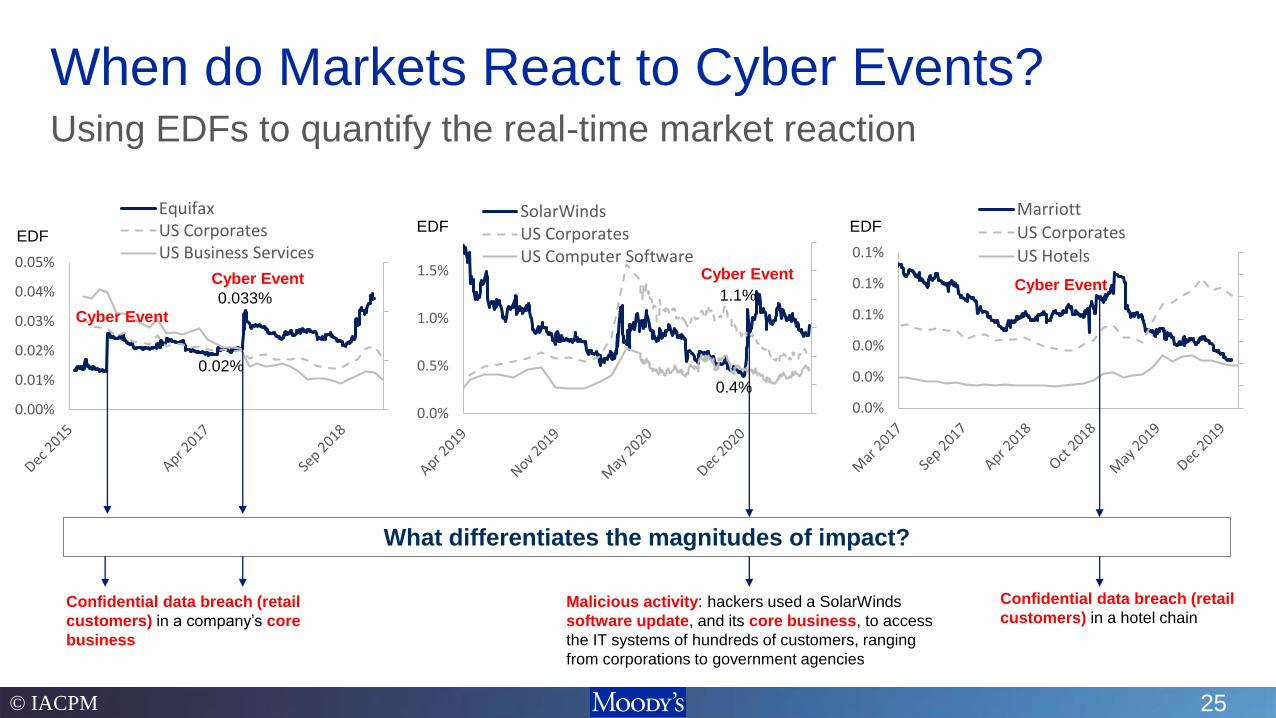
When do Markets React to Cyber Events?Using EDFs to quantify the real-time market reaction
0.00%
0.01%
0.02%
0.03%
0.04%
0.05%
EquifaxUS CorporatesUS Business Services
0.0%
0.5%
1.0%
1.5%
SolarWindsUS CorporatesUS Computer Software
0.0%
0.0%
0.0%
0.1%
0.1%
0.1%
Marriott
US Corporates
US HotelsEDF
EDF EDF
Cyber Event
Cyber Event
Cyber EventCyber Event
What differentiates the magnitudes of impact?
Confidential data breach (retail
customers) in a company’s core
business
Confidential data breach (retail
customers) in a hotel chainMalicious activity: hackers used a SolarWinds
software update, and its core business, to access
the IT systems of hundreds of customers, ranging
from corporations to government agencies
0.4%
1.1%
0.02%
0.033%
© IACPM 25

Quantitative Modeling of a Cyber Event ImpactChallenges: Data sparsity & heterogeneous nature of cyber events
Cyber Event ScenarioType & nature of
the cyber event
Translate the cyber event into a
shock to a credit risk factor
Probabilities of default for a credit
portfolio under the cyber eventProjection
Data & Calibration
EDF / Asset Return Data
Accounting Approach – Losses
Relative to Company Size
Other data: equity prices (used in
academic literature), CDS, Rating
Changes, Defaults
Alternative Data
Segment / company data – past
incidents, surveys, fundamental
analysis
Qualitative Assessment
Quantitative
Credit ModelSensitivity of a company or of an
industry segment to the cyber event
Cross-Sectional
Overlay
© IACPM 26

Industry Segment
Number of Past Cyber Events
Web ApplicationCompromised
Internal Errors
Crimeware Ransomware
Accommodation 18 15 34Administrative 10 2 5Construction 10 0 10Education 65 62 179Entertainment 30 22 35Finance 152 128 63Healthcare 140 163 192Information 162 115 403Manufacturing 107 47 393Mining+Utilities 16 6 21Other Services 39 20 15Professional 139 63 135Public 149 112 800Real Estate 14 6 1Retail 66 21 55Transportation 22 15 24
Alternative Data for Cyber Risk Searching for measures of segments’ sensitivity to cyber events
Verizon Dataset of Cyber Incidents32,000 Incidents Over 2020, Global Dataset.
Industry Segment
Cost per firm-year
Million USD
Financial services 18
Utilities and energy 17
Aerospace and defense 14
Technology and software 13
Healthcare 12
Services 11
Industrial/manufacturing 10
Retail 9
Public sector 8
Transportation 7
Consumer products 7
Communications 7
Life science 6
Education 5
Hospitality 5
Ponemon Survey (2017)Annualized Cost of Cyber Crime, Global
Sample, 254 organizations
MIS – Cyber Risk Heatmap (2019)
Qualitative Assessment
Constructing a segment-level score of sensitivity to cyber events
For challenges of cross-industry
comparisons, see the report
For challenges of cross-industry
comparisons, see the report
© IACPM 27
Cyber
Event
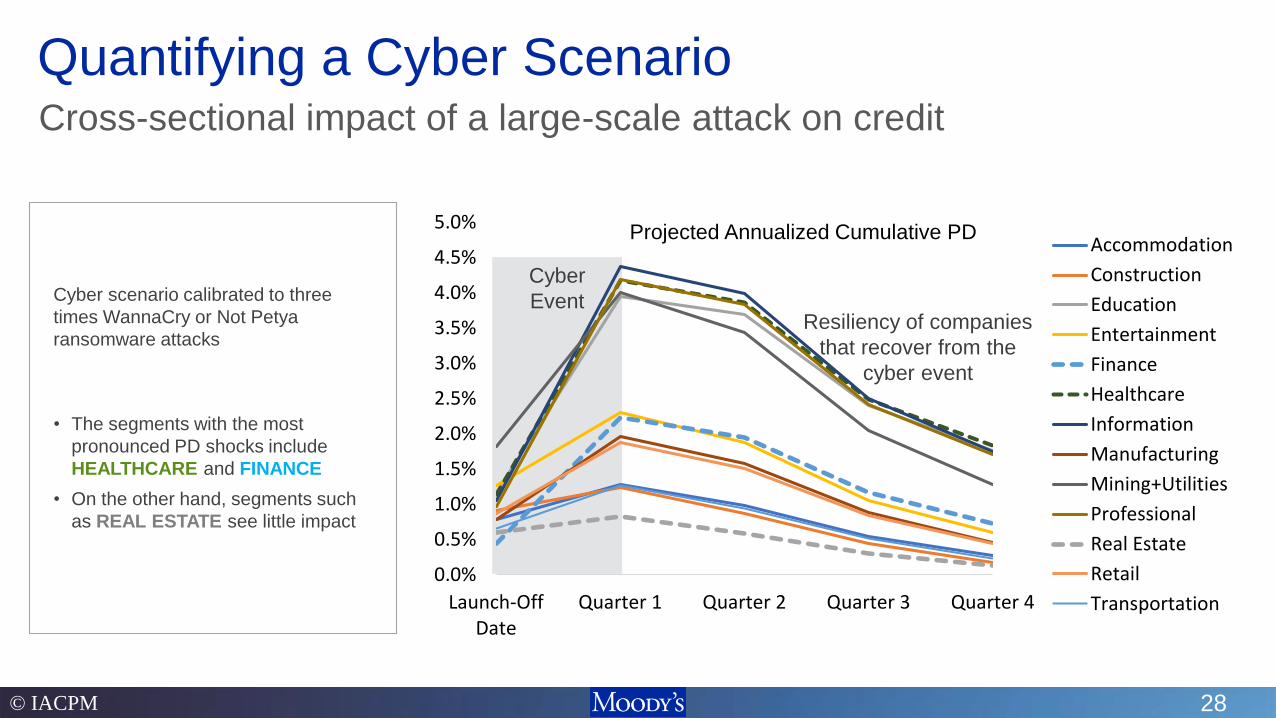
Quantifying a Cyber ScenarioCross-sectional impact of a large-scale attack on credit
Cyber scenario calibrated to three
times WannaCry or Not Petya
ransomware attacks
• The segments with the most
pronounced PD shocks include
HEALTHCARE and FINANCE
• On the other hand, segments such
as REAL ESTATE see little impact
Projected Annualized Cumulative PD
© IACPM 28
Resiliency of companies
that recover from the
cyber event
0.0%
0.5%
1.0%
1.5%
2.0%
2.5%
3.0%
3.5%
4.0%
4.5%
5.0%
Launch-OffDate
Quarter 1 Quarter 2 Quarter 3 Quarter 4
Accommodation
Construction
Education
Entertainment
Finance
Healthcare
Information
Manufacturing
Mining+Utilities
Professional
Real Estate
Retail
Transportation
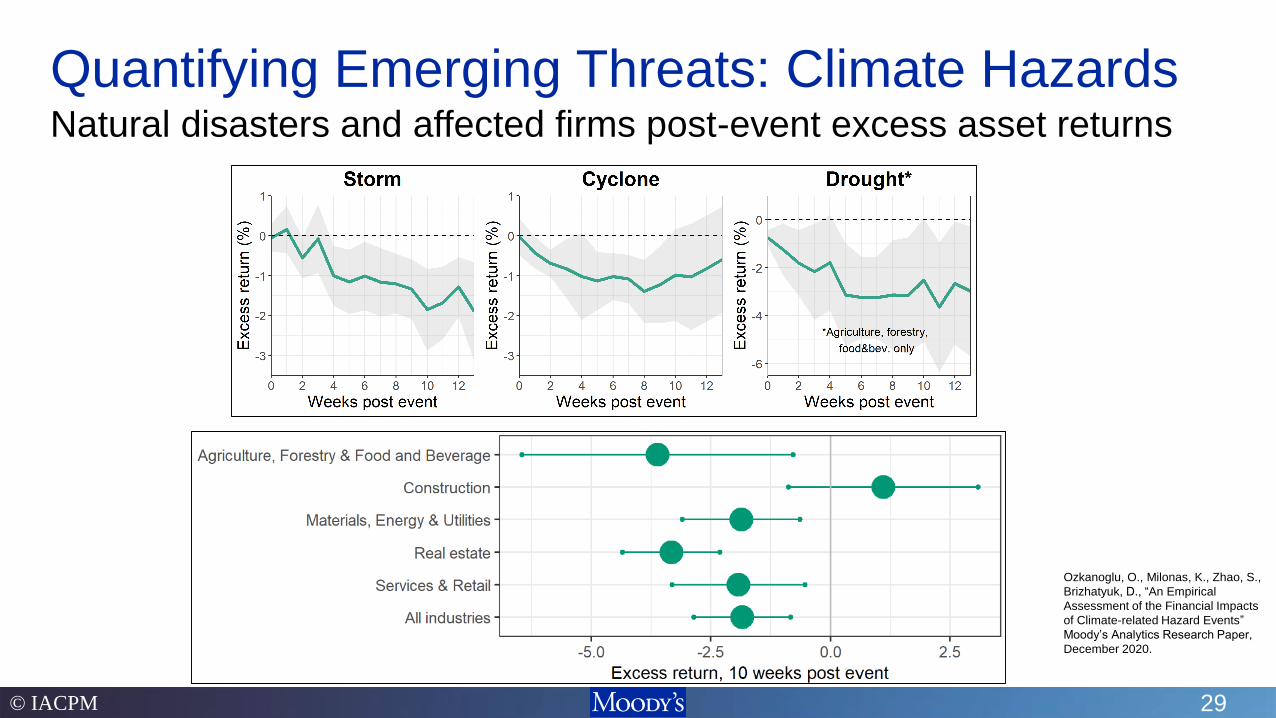
Quantifying Emerging Threats: Climate HazardsNatural disasters and affected firms post-event excess asset returns
Ozkanoglu, O., Milonas, K., Zhao, S.,
Brizhatyuk, D., “An Empirical
Assessment of the Financial Impacts
of Climate-related Hazard Events”
Moody’s Analytics Research Paper,
December 2020.
© IACPM 29
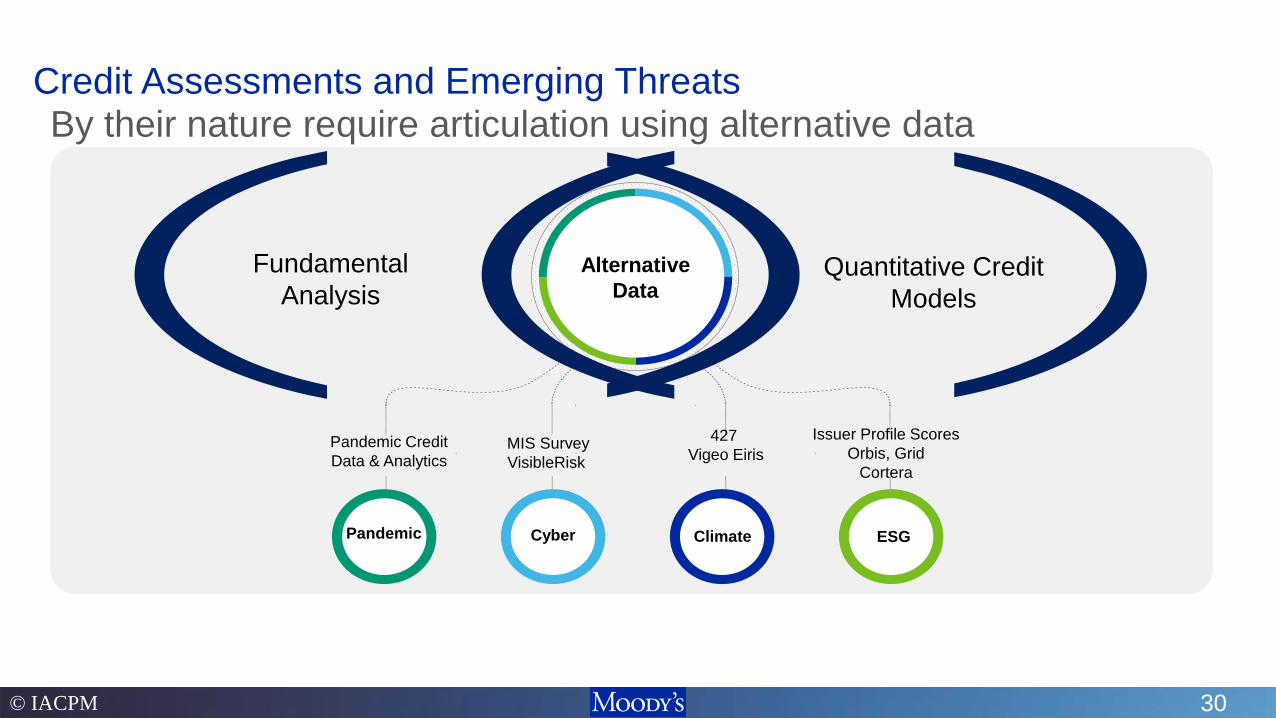
Pandemic Credit
Data & Analytics
Cyber Climate
Alternative
Data
ESG
Credit Assessments and Emerging Threats
Fundamental
AnalysisQuantitative Credit
Models
By their nature require articulation using alternative data
Pandemic
MIS Survey
VisibleRisk
427
Vigeo Eiris
Issuer Profile Scores
Orbis, Grid
Cortera
© IACPM 30

Pandemic Credit
Data & Analytics
Cyber Climate
Alternative
Data
ESG
Credit Assessments and Emerging Threats
Fundamental
AnalysisQuantitative Credit
Models
By their nature require articulation using alternative data
Pandemic
MIS Survey
VisibleRisk
427
Vigeo Eiris
Issuer Profile Scores
Orbis, Grid
Cortera
© IACPM 31
“if you’ve seen one pandemic, you’ve seen …
one pandemic.” Adam Kucharski

Q & A
© IACPM 32

Jim Hempstead Managing Director, North American
Infrastructure & Cyber Risk
Moody’s Investors Service
+1 (212) 553-4318
moodysanalytics.com
Amnon LevyManaging Director, Portfolio and
Balance Sheet Research
Moody’s Analytics
+1 (415) 874-6279
Libor PospisilDirector, Portfolio and
Balance Sheet Research
Moody’s Analytics
+1 (415) 874 6235
© 2021 Moody’s Corporation, Moody’s Investors Service, Inc., Moody’s Analytics, Inc. and/or their licensors and affiliates (collectively, “MOODY’S”). All
rights reserved.
CREDIT RATINGS ISSUED BY MOODY'S INVESTORS SERVICE, INC. AND/OR ITS CREDIT RATINGS AFFILIATES ARE MOODY’S CURRENT
OPINIONS OF THE RELATIVE FUTURE CREDIT RISK OF ENTITIES, CREDIT COMMITMENTS, OR DEBT OR DEBT-LIKE SECURITIES, AND
MATERIALS, PRODUCTS, SERVICES AND INFORMATION PUBLISHED BY MOODY’S (COLLECTIVELY, “PUBLICATIONS”) MAY INCLUDE SUCH
CURRENT OPINIONS. MOODY’S INVESTORS SERVICE DEFINES CREDIT RISK AS THE RISK THAT AN ENTITY MAY NOT MEET ITS
CONTRACTUAL FINANCIAL OBLIGATIONS AS THEY COME DUE AND ANY ESTIMATED FINANCIAL LOSS IN THE EVENT OF DEFAULT OR
IMPAIRMENT. SEE MOODY’S RATING SYMBOLS AND DEFINITIONS PUBLICATION FOR INFORMATION ON THE TYPES OF CONTRACTUAL
FINANCIAL OBLIGATIONS ADDRESSED BY MOODY’S INVESTORS SERVICE CREDIT RATINGS. CREDIT RATINGS DO NOT ADDRESS ANY
OTHER RISK, INCLUDING BUT NOT LIMITED TO: LIQUIDITY RISK, MARKET VALUE RISK, OR PRICE VOLATILITY. CREDIT RATINGS, NON-
CREDIT ASSESSMENTS (“ASSESSMENTS”), AND OTHER OPINIONS INCLUDED IN MOODY’S PUBLICATIONS ARE NOT STATEMENTS OF
CURRENT OR HISTORICAL FACT. MOODY’S PUBLICATIONS MAY ALSO INCLUDE QUANTITATIVE MODEL-BASED ESTIMATES OF CREDIT RISK
AND RELATED OPINIONS OR COMMENTARY PUBLISHED BY MOODY’S ANALYTICS, INC. AND/OR ITS AFFILIATES. MOODY’S CREDIT RATINGS,
ASSESSMENTS, OTHER OPINIONS AND PUBLICATIONS DO NOT CONSTITUTE OR PROVIDE INVESTMENT OR FINANCIAL ADVICE, AND
MOODY’S CREDIT RATINGS, ASSESSMENTS, OTHER OPINIONS AND PUBLICATIONS ARE NOT AND DO NOT PROVIDE RECOMMENDATIONS
TO PURCHASE, SELL, OR HOLD PARTICULAR SECURITIES. MOODY’S CREDIT RATINGS, ASSESSMENTS, OTHER OPINIONS AND
PUBLICATIONS DO NOT COMMENT ON THE SUITABILITY OF AN INVESTMENT FOR ANY PARTICULAR INVESTOR. MOODY’S ISSUES ITS
CREDIT RATINGS, ASSESSMENTS AND OTHER OPINIONS AND PUBLISHES ITS PUBLICATIONS WITH THE EXPECTATION AND
UNDERSTANDING THAT EACH INVESTOR WILL, WITH DUE CARE, MAKE ITS OWN STUDY AND EVALUATION OF EACH SECURITY THAT IS
UNDER CONSIDERATION FOR PURCHASE, HOLDING, OR SALE.
MOODY’S CREDIT RATINGS, ASSESSMENTS, OTHER OPINIONS, AND PUBLICATIONS ARE NOT INTENDED FOR USE BY RETAIL INVESTORS
AND IT WOULD BE RECKLESS AND INAPPROPRIATE FOR RETAIL INVESTORS TO USE MOODY’S CREDIT RATINGS, ASSESSMENTS, OTHER
OPINIONS OR PUBLICATIONS WHEN MAKING AN INVESTMENT DECISION. IF IN DOUBT YOU SHOULD CONTACT YOUR FINANCIAL OR OTHER
PROFESSIONAL ADVISER.
ALL INFORMATION CONTAINED HEREIN IS PROTECTED BY LAW, INCLUDING BUT NOT LIMITED TO, COPYRIGHT LAW, AND NONE OF SUCH
INFORMATION MAY BE COPIED OR OTHERWISE REPRODUCED, REPACKAGED, FURTHER TRANSMITTED, TRANSFERRED, DISSEMINATED,
REDISTRIBUTED OR RESOLD, OR STORED FOR SUBSEQUENT USE FOR ANY SUCH PURPOSE, IN WHOLE OR IN PART, IN ANY FORM OR
MANNER OR BY ANY MEANS WHATSOEVER, BY ANY PERSON WITHOUT MOODY’S PRIOR WRITTEN CONSENT.
MOODY’S CREDIT RATINGS, ASSESSMENTS, OTHER OPINIONS AND PUBLICATIONS ARE NOT INTENDED FOR USE BY ANY PERSON AS A
BENCHMARK AS THAT TERM IS DEFINED FOR REGULATORY PURPOSES AND MUST NOT BE USED IN ANY WAY THAT COULD RESULT IN THEM
BEING CONSIDERED A BENCHMARK.
All information contained herein is obtained by MOODY’S from sources believed by it to be accurate and reliable. Because of the possibility of human or
mechanical error as well as other factors, however, all information contained herein is provided “AS IS” without warranty of any kind. MOODY'S adopts all
necessary measures so that the information it uses in assigning a credit rating is of sufficient quality and from sources MOODY'S considers to be reliable
including, when appropriate, independent third-party sources. However, MOODY’S is not an auditor and cannot in every instance independently verify or
validate information received in the rating process or in preparing its Publications.
To the extent permitted by law, MOODY’S and its directors, officers, employees, agents, representatives, licensors and suppliers disclaim liability to any
person or entity for any indirect, special, consequential, or incidental losses or damages whatsoever arising from or in connection with the information
contained herein or the use of or inability to use any such information, even if MOODY’S or any of its directors, officers, employees, agents, representatives,
licensors or suppliers is advised in advance of the possibility of such losses or damages, including but not limited to: (a) any loss of present or prospective
profits or (b) any loss or damage arising where the relevant financial instrument is not the subject of a particular credit rating assigned by MOODY’S.
To the extent permitted by law, MOODY’S and its directors, officers, employees, agents, representatives, licensors and suppliers disclaim liability for any
direct or compensatory losses or damages caused to any person or entity, including but not limited to by any negligence (but excluding fraud, willful
misconduct or any other type of liability that, for the avoidance of doubt, by law cannot be excluded) on the part of, or any contingency within or beyond the
control of, MOODY’S or any of its directors, officers, employees, agents, representatives, licensors or suppliers, arising from or in connection with the
information contained herein or the use of or inability to use any such information.
NO WARRANTY, EXPRESS OR IMPLIED, AS TO THE ACCURACY, TIMELINESS, COMPLETENESS, MERCHANTABILITY OR FITNESS FOR ANY
PARTICULAR PURPOSE OF ANY CREDIT RATING, ASSESSMENT, OTHER OPINION OR INFORMATION IS GIVEN OR MADE BY MOODY’S IN ANY
FORM OR MANNER WHATSOEVER.
Moody’s Investors Service, Inc., a wholly-owned credit rating agency subsidiary of Moody’s Corporation (“MCO”), hereby discloses that most issuers of debt
securities (including corporate and municipal bonds, debentures, notes and commercial paper) and preferred stock rated by Moody’s Investors Service, Inc.
have, prior to assignment of any credit rating, agreed to pay to Moody’s Investors Service, Inc. for credit ratings opinions and services rendered by it fees
ranging from $1,000 to approximately $2,700,000. MCO and Moody’s investors Service also maintain policies and procedures to address the independence
of Moody’s Investors Service credit ratings and credit rating processes. Information regarding certain affiliations that may exist between directors of MCO
and rated entities, and between entities who hold credit ratings from Moody’s Investors Service and have also publicly reported to the SEC an ownership
interest in MCO of more than 5%, is posted annually at www.moodys.com under the heading “Investor Relations — Corporate Governance — Director and
Shareholder Affiliation Policy.”
Additional terms for Australia only: Any publication into Australia of this document is pursuant to the Australian Financial Services License of MOODY’S
affiliate, Moody’s Investors Service Pty Limited ABN 61 003 399 657AFSL 336969 and/or Moody’s Analytics Australia Pty Ltd ABN 94 105 136 972 AFSL
383569 (as applicable). This document is intended to be provided only to “wholesale clients” within the meaning of section 761G of the Corporations Act
2001. By continuing to access this document from within Australia, you represent to MOODY’S that you are, or are accessing the document as a
representative of, a “wholesale client” and that neither you nor the entity you represent will directly or indirectly disseminate this document or its contents to
“retail clients” within the meaning of section 761G of the Corporations Act 2001. MOODY’S credit rating is an opinion as to the creditworthiness of a debt
obligation of the issuer, not on the equity securities of the issuer or any form of security that is available to retail investors.
Additional terms for Japan only: Moody's Japan K.K. (“MJKK”) is a wholly-owned credit rating agency subsidiary of Moody's Group Japan G.K., which is
wholly-owned by Moody’s Overseas Holdings Inc., a wholly-owned subsidiary of MCO. Moody’s SF Japan K.K. (“MSFJ”) is a wholly-owned credit rating
agency subsidiary of MJKK. MSFJ is not a Nationally Recognized Statistical Rating Organization (“NRSRO”). Therefore, credit ratings assigned by MSFJ
are Non-NRSRO Credit Ratings. Non-NRSRO Credit Ratings are assigned by an entity that is not a NRSRO and, consequently, the rated obligation will not
qualify for certain types of treatment under U.S. laws. MJKK and MSFJ are credit rating agencies registered with the Japan Financial Services Agency and
their registration numbers are FSA Commissioner (Ratings) No. 2 and 3 respectively.
MJKK or MSFJ (as applicable) hereby disclose that most issuers of debt securities (including corporate and municipal bonds, debentures, notes and
commercial paper) and preferred stock rated by MJKK or MSFJ (as applicable) have, prior to assignment of any credit rating, agreed to pay to MJKK or
MSFJ (as applicable) for credit ratings opinions and services rendered by it fees ranging from JPY125,000 to approximately JPY250,000,000.
MJKK and MSFJ also maintain policies and procedures to address Japanese regulatory requirements.
© IACPM34