managing capital flows essons from ... passage of the ghana investment promotion council act in 1994...
TRANSCRIPT

MANAGING CAPITAL FLOWS: LESSONS FROM EMERGING MARKETS FOR FRONTIER
ECONOMIES: POLICY RESPONSES TO CAPITAL INFLOWS IN GHANA
Mr. Millison Narh First Deputy Governor
Bank of Ghana
OUTLINE
Introduction Trends in Capital Flows
Global Emerging Economies Regional
Capital Flows - Ghana Measures to Attract FDIs General Trends Foreign Direct Investment Portfolio Investments (Equities) Portfolio Investments (Government Bonds) Portfolio Investments (Eurobonds) Loans
Measures Aimed at Managing Capital Inflows Sterilization Macroeconomic policies Macro prudential Policies Direct Policies
Conclusion

INTRODUCTION

There have been active debates on the economic benefits of un-bridled capital flows and financial account liberalization
Financial inflows to Ghana have been on the continuous increase since 2006, but have also come with some challenges.
The policy responses have been wide ranging, depending on the nature of the challenge

TRENDS IN CAPITAL FLOWS

FDI FLOWS, BY REGION, 2011–2013 (BILLIONS OF DOLLARS)
In 2013, FDI flows returned to an upward trend. Global FDI inflows
rose by 5 per cent to US$1.41 trillion in 2013. FDI inflows increased in
all major economic groupings − developed, developing, and transition
economies. Global FDI stock rose by 9 per cent, reaching US$25.5
trillion.
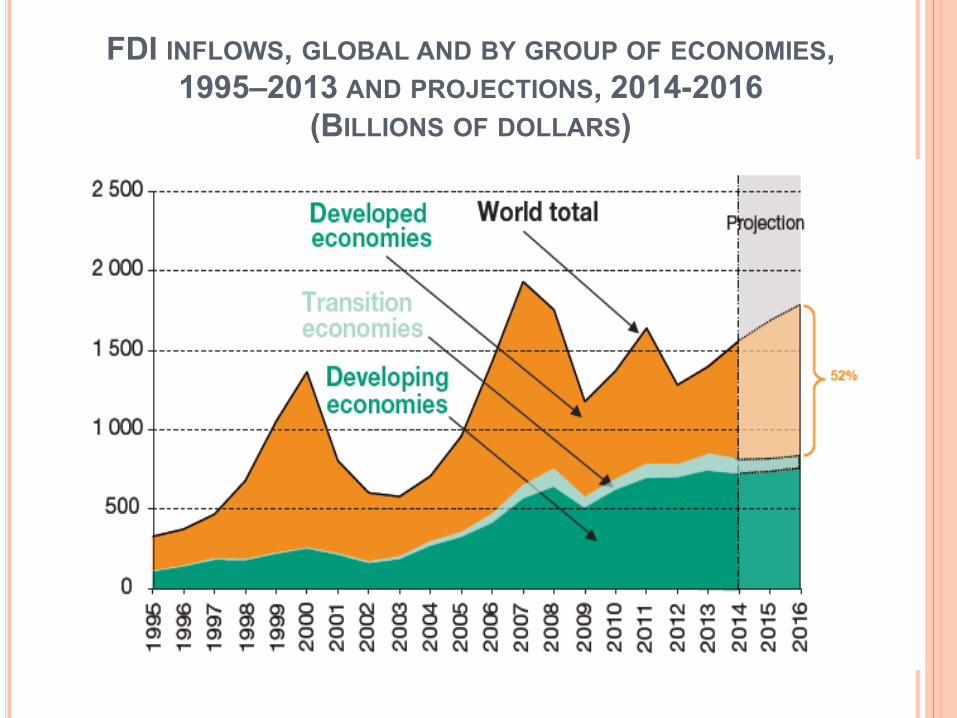
FDI INFLOWS, GLOBAL AND BY GROUP OF ECONOMIES, 1995–2013 AND PROJECTIONS, 2014-2016
(BILLIONS OF DOLLARS)
UNCTAD projects that global FDI flows was about US$1.6 trillion in
2014, and would rise to US$1.75 trillion in 2015 and US$1.85 trillion in
2016.
The rise will be mainly driven by investments in developed economies
as their economic recovery starts to take hold and spread wider.
The fragility in some emerging markets and risks related to policy
uncertainty and regional conflict could still derail the expected upturn in
FDI flows.
EMERGING ECONOMIES
In the aftermath of the 2008 global financial and economic crisis, capital
flows to emerging countries surged again. There had been similar
episodes in the past three decades, including one that culminated in the
1997–98 East Asian financial crisis.
What differs in each episode of surges in capital flows are the
circumstances facing a particular economy. What would be similar is that
policymakers in each country would consider capital controls.
REGIONAL TRENDS
Both push and pull factors contributed to the surge in portfolio
private capital flows to sub-Saharan African frontier markets
between 2011 and 2013.
Push factors included weak economic growth, excess liquidity,
and low bond yields in advanced economies.
Pull factors include the better economic prospects in sub-Saharan
African frontier markets. Improved macroeconomic policy
management, low debt levels, and structural reforms, including
the development of capital and securities markets have
encouraged foreign investment.

REGIONAL TRENDS CONT’D
One important factor—investor risk aversion—is highly
volatile, and can change abruptly in response to political as
well as economic events.
FDI inflows to Africa rose by 4 per cent to US$57 billion in
2013, driven by international and regional market-seeking and
infrastructure investments. Expectations for sustained growth
of an emerging middle class attracted FDI in consumer-
oriented industries, including food, IT, tourism, finance and
retail.

Over the last three years, the frontier market economies of sub-Saharan
Africa have received growing amounts of portfolio capital flows.
Since 2010, continued positive macroeconomic performance, coupled
with unprecedented accommodative monetary policies in advanced
economies, renewed foreign investors’ interest on a much larger scale,
resulting in sub-Saharan African frontier markets becoming more
integrated with international capital markets.

The number of sub-Saharan African countries with international credit
ratings has increased, a large number of countries have issued
sovereign bonds—many of them for the first time—and foreign
investors have become active players in some domestic bond and
equity markets.

CAPITAL FLOWS –GHANA

Measures to Attract FDIs
The passage of the Ghana Investment Promotion Council Act in
1994 established the legal framework for investment inflows Tax holidays, import duty exemptions for foreign investors, improved
remittances of dividends and profits abroad and improved judicial processes are some of the other measures put in place to attract capital.
In 2005, Ghana obtained its first sovereign rating and then gained
access to international capital markets

Security of investment is also provided by the national constitution, as
well as by agreements such as the Multilateral Investment Guarantee and the Investment Promotion Protection Agreements.

TRADE BALANCE, CURRENT TRANSFERS AND NET CAPITAL FLOWS TO GHANA (IN MILLION USD)
2003 2004 2005 2006 2007 2008 2009 2010 2011 2012 2013 2014
Current Transfers 1,244.9 1,579.9 1,794.2 2,248.3 2,043.2 2,211.5 2,078.0 2,322.4 2,597.4 2,405.3 1,939.4 1,878.4 Private transfers (net) 1,017.2 1,287.1 1,549.8 1,644.6 1,833.8 1,970.4 1,788.4 2,122.7 2,368.8 2,147.5 1,859.2 1,868.8Official transfer(net) 227.7 292.9 244.5 603.7 209.4 241.1 289.6 199.7 228.7 257.8 80.3 9.6
Current Account balance 325.4 -303.3 -831.0 -768.7 1,843.4- 3,113.3- 1,687.7- 2,769.7- 3,770.1- 5,168.5- 5,704.1- -3,564.7Capital and Finance Account 494.7 452.6 1,165.7 1,484.9 2,866.6 2,943.3 4,327.6 4,289.5 4,479.3 3,651.3 5,368.2 3,270.1 Financial Account 340.4 201.6 834.5 1,255.0 2,678.5 2,480.0 3,763.8 3,952.1 4,034.3 3,367.9 5,018.9 3,250.2 Direct Investment(net) 110.0 139.3 145.0 636.0 855.4 1,211.6 2,890.2 2,527.4 3,222.2 3,293.4 3,226.3 3,363.4 Portfolio Investments(net) 65.8 289.3 -49.01 -43.64 620.5 117.6 1,121.8 658.9 835.9 Loans 369.8 402.3 501.3 351.2 1,305.8 717.9 1,246.2 1,057.9 888.8 1,341.7 1,765.4 1,151.6
US$. Million

GENERAL TRENDS
Ghana, like many emerging and frontier economies, has
witnessed some substantial inflow of capital in recent past.
It experienced a surge in capital flows from 2009 after the
2008 global financial crisis. The country also relies heavily on
remittances from overseas workers
Ghana also benefitted from FDI inflows when prices of
minerals rose in the period up to 2013. It has also benefited
from rising investment since the 2007 discovery of oil.

TRADE BALANCE, CURRENT TRANSFERS AND CAPITAL FLOWS TO GHANA (IN MILLION USD)

FOREIGN DIRECT INVESTMENT
FDI has risen from a few hundred million US dollars annually
to over US$3.0 billion a year since 2009.

SECTOR DISTRIBUTION OF FOREIGN DIRECT INVESTMENT (US$ MILLIONS)
2010 2011 2012Stock Stock Stock
Book value of equity as at 31st December 4,987.22 5,870.96 13,262.94 Administrative and Support Service Activities 0.72 0.76 0.07 Agriculture, Forestry and Fishing 19.86 17.89 70.43 Arts, Entertainment and Creation 0.01 0.02 0.05 Construction 23.90 24.50 64.90 Electricity, Gas and Air Conditioning Supply 69.30 87.51 245.96 Finance and Insurance Activities 917.05 1,091.02 1,396.12 Information and Communication 370.17 -267.16 638.87 Manufacturing 366.08 417.63 590.68 Mining and Quarrying 3,115.15 4,381.08 9,919.02 Others 0.50 0.42 31.36 Professional, Scientific and Technical Activities 0.01 0.01 0.03 Real Estate Activities 0.79 0.74 0.66 Transportation and Storage 4.63 3.23 3.24 Wholesales & Retail Trade 99.03 113.28 301.55

The major recipient sectors of FDI during the period were mining and
quarrying (which includes the oil sector), Finance and Insurance (which
includes banking), Information &Telecommunications and the
Manufacturing sectors.
At the end of 2012, the stock of FDI in the mining and quarrying sector
was US$9,919.02 million as a result of the oil discovery, Finance and
Insurance (includes banking) received US$1,396.12 million and the
Wholesale and Retail sector was US$301.55 million.

TOP 10 FOREIGN DIRECT INVESTMENTS SOURCE COUNTRIES (US$ MILLIONS)
2011 2012
Stocks StocksUnited Kingdom 2,750.88 2,442.52Ireland 2,315.84 1,684.15Cayman Islands 1,837.92 1,304.91Bermuda 949.12 1,225.52Bahrain 1,012.91 1,224.04Canada 740.37 981.42British Indian Ocean Territory 769.51 785.01China, P.R 486.76 549.91Belgium 234.37 443.72Cameroon 460.46 418.14FDI from Top 10 Countries 11,558.14 11,059.36Total FDI 13,845.95 13,262.94
FDI Source Country

The main sources of FDI in 2012 were United Kingdom, Ireland,
Cayman Islands, Bermuda and Bahrain etc. The top ten countries
jointly accounted for 83.48 per cent and 83.39 per cent of FDI
transactions and stocks in 2012, respectively
PORTFOLIO INVESTMENTS (EQUITIES)
Portfolio investment in resident enterprises is comprised of total equity
(based on the value of individual shareholding of less than 10 percent).
The stock of portfolio investments increased from US$209.18 million in
2011 to US$218.86 million in 2012, attracting net inflows of US$9.68
million during the period.
The Finance and Insurance and Information and Communication
sectors attracted net portfolio inflows of US$33.21 million and
US$13.23 million respectively.
These sectors attracted net inflows from Nigeria, Cayman Islands,
France, Trinidad and Tobago and Luxembourg.

PORTFOLIO INVESTMENTS (GOVERNMENT BONDS) Ghana commenced the issue of medium term domestic sovereign bonds
in 2006, which non-residents could participate in.
Developments in the domestic government bonds market have been
mixed. The highest net inflow from non-residents of US$620.50 million
was in 2010.
However, volatilities in the value of the domestic currency, the cedi, has
kept non-residents’ participation quite chequered, even though the
relatively high yields remain a source of attraction.

PORTFOLIO INVESTMENTS (EUROBONDS) Ghana issued its first Euro bond, a 10-year Eurobond in 2007. The issue,
which raised US$750 million from investors at a coupon of 8.5 percent,
made Ghana the first nation in sub-Saharan Africa after South Africa to
borrow from international capital markets.
In 2013, Government of Ghana floated its second Eurobond. The issue
raised US$1 billion from the international bond market at 8% interest rate
with maturity of 10 years.

PORTFOLIO INVESTMENTS (EUROBONDS) CONT’D
In August, 2014 a third Eurobond was successfully issued.
Government issued 1 billion dollars with a coupon rate of 8.125%.

The inflow of capital to Ghana has not brought in its wake the traditional
Dutch disease and currency appreciations.
Cocoa and gold continue to be very important export commodities despite
the huge investments in the oil sector
Capital inflows also coincided with increases in imports arising from oil
production related activities, increased outflows of services and income
and some amount of fiscal excesses linked to electoral cycles.

GHANA CEDI_ US DOLLAR EXCHANGE RATE

MEASURES AIMED AT MANAGING CAPITAL INFLOWS
1. STERILIZATION Cocoa syndicated loans of US$1.5 billion in 2012, US$1.2 billion in
2013, and US$1.7 billion in 2014 were mobilized to be used to fund cocoa purchases.
To prevent the potential impact of such large amounts of inflows on the domestic currency, all these moneys were sterilized and the disbursements made in tranches to the board for onward payment for cocoa beans.
Beyond serving as ready cash for the payment of cocoa purchased from farmers, the coming in of the loan is timely, as it helps shore up the country's reserves and consequently help stabilize the cedi. The loan also helps improve liquidity in the system.
Similar treatment has also been given to the Eurobond issues.

2. MACROECONOMIC POLICIES
The promulgation of the Bank of Ghana Act by parliament in 2002.
In 2005, Ghana obtained its first sovereign rating
Ghana, the top reformer in Africa, in trade, tax, and property
administration.
3. MACRO PRUDENTIAL POLICIES
The minimum capital of banks in Ghana has been raised twice.
The central bank has extended its supervisory operations to micro
finance institutions
New mandatory reserve requirements of 9 per cent in domestic currency
on both foreign and domestic currency deposits have been introduced.
The reserve balance must be held with the Bank of Ghana.
Daily single foreign currency exposure limit is reduced from 15 to 10
percent of the capital base.
MACRO PRUDENTIAL POLICIES CONT’D
Banks are required to hold 100 per cent domestic currency reserves on
their vostro accounts since they had started holding such monies for
speculative purposes.
The Central Bank has put in place mechanisms for improving financial
operations with the setting up of a collateral registry, and credit
reference bureaux.
The Bank is in the process of putting in place a bank resolution
framework to help in resolving issues of insolvent financial institutions.
Pension funds regulations have also been reviewed to ensure that there
is sufficient domestic capital in both the money and capital markets in
the country.

4. DIRECT POLICIES In Ghana, there are restrictions limiting non -resident purchases of
government securities to longer maturity instruments of three years or
more.
Efforts are also underway to make the secondary market for these
securities more vibrant.
The increased participation of foreigners in the government debt
markets could be an additional source of vulnerability resulting from
rollover risks.
Though the secondary market is rather illiquid, an early redemption or
purchase of not yet matured three-year and five-year bonds is
possible.
Foreign exchange measures to stabilize the cedi.

CONCLUSION
The gradual opening up of the capital account has seen a remarkable
increase in capital flows into the country and also improved the
country’s financing options despite the drying up of official inflows.
It has at the same time increased production related imports and also
coincided with some amount of fiscal excesses.
These developments have brought along current account and
exchange rate pressures which have in turn slowed down the pace of
liberalization.
Going forward, the country hopes to reign in the fiscal excess, begin
reaping the benefits of the inflows and then proceed to full capital
account liberalization.

Thank you for your attention.