managing business risks from the use of it
TRANSCRIPT

8/8/2019 Managing Business Risks From the Use of IT
http://slidepdf.com/reader/full/managing-business-risks-from-the-use-of-it 1/31
Managing Spend onInformation Security andAudit for Better Results
February 2009
IT Policy Compliance Group

8/8/2019 Managing Business Risks From the Use of IT
http://slidepdf.com/reader/full/managing-business-risks-from-the-use-of-it 2/31
Contents
Executive Summary 2
Managing business risks from the use of IT 2
Principal business risks and operational outcomes 2
Financial risks, losses and returns 2
Reducing risks, reducing costs and improving results 4
Managing spending on information security for better outcomes 5Risk-based performance budgeting for information security and audit in IT 5
Recommendations 5
Benchmark Findings 7
Primary business risks from the use of IT 7
Operating outcomes in IT 7
Once a winner, always a winner 8
Information security, assurance and regulatory compliance in IT 9
Size of organization: no influence on outcomes 10
Firms in most industries operate in the norm 11
Financial exposure from risks in IT 11
Risk occurrence rates 12
Annualized financial losses 13
Low self-sustained loss thresholds 14
Financial returns 14
Overspending: the financial risk for regulatory compliance 15
Practices dictate outcomes and financial risks 15
Impact of CISO’s on results 16
Leveraging the organization 16
Actions that reduce risks, reduce costs and improve results 17
Continuous assessment and reporting 18
Controls for managing risk in IT 18Automation reduces risks and costs 19
Information for managing risk in IT 20
Additional tools and methods for managing risk 20
Reports routinely produced to manage risk 21
Risk scoring, assessment and analysis 22
Managing business and financial risks from the use of IT 23
Managing spend on information security for better outcomes 24
Financial returns for managing risks from the use of IT 24
Financial returns for managing audit results in IT 25
Actions and practices delivering better results 25
About the research 27
About IT Policy Compliance Group 28

8/8/2019 Managing Business Risks From the Use of IT
http://slidepdf.com/reader/full/managing-business-risks-from-the-use-of-it 3/31
Managing Spend on Information Security and Audit for Better Results
2
Executive Summary
Managing business risks from the use of ITEvery activity has some risk associated with it, including the use of IT. However, the principal businessand financial risks from the use of IT differ by size of company. Appropriately managing the principalbusiness risks and reducing overspending depend on specific organizational practices, that if notimplemented will result in higher costs, larger financial exposure and more frequent loss.
Much like an insurance deductible, all organizations are willing to sustain some level of financial lossfrom the loss or theft of customer data and business downtime from disruptions occurring in IT. However,compared to the financial exposure and losses being experienced, the losses organizations are willing tosustain are exceedingly low, and the returns for making improvements are extraordinarily high.
Almost all organizations have significant financial incentive to improveresults, including:
Significantly lowering financial exposure and loss
Substantially reducing audit expenses, by one-third to one-half annually
The benchmarks conducted by the IT Policy Compliance Group show almost all organizationshave financial incentives easily exceeding 100 percent to make improvements to reduce financialrisk from data loss, downtime and regulatory audit. This report, covering ongoing and recent benchmarks,include findings covering 1) the principal business and operational outcomes being experienced byorganizations; 2) financial risks, losses and returns; and 3) the practices making the most differenceto control risks, reduce costs, and improve results.
Principal business risks and operational outcomesThe primary business and financial risks from the use of IT are directly related to how well, or poorly,organizations are managing the confidentiality, integrity and availability of information and IT assets.These are directly related to the controls and procedures implemented to protect sensitive information,maintain the integrity of information and audit controls, and the availability of IT services.
Specifically, the primary business and financial risks are due to losses, or lapses that are occurringin three areas:
Confidentiality, or protection, of sensitive information
Integrity of information, assets and controls in IT
Availability of IT services
These three – the loss of confidentiality, integrity and availability — areranked as the top business risks by organizations, well ahead of other possible risks, including those from outsourced IT projects, systemsand information, delays to critical IT projects, and shortages of IT skills. Although these are theprimary business risks, outcomes being experienced by organizations for these three principalrisks vary considerably.
Operational outcomes varyOngoing IT PCG benchmarks measure three key performance results occurring among organizations:1) the loss or theft of customer data; 2) the incidence and extent of business downtime from failuresand disruptions occurring in IT; and 3) deficiencies in IT that must be corrected to pass audit.
Worst outcomes: Approximately two in 10 organizations — 19 percent — are experiencingthe worst outcomes, the highest data losses or thefts, the most downtime from IT failures, andthe largest problems with regulatory compliance. These firms are experiencing more than 15losses or thefts or data each year, 80 or more hours of business downtime from failures occurringin IT, and more than 15 deficiencies in IT that must be corrected to pass audit.
Normative outcomes: Nearly seven in 10 organizations — 68 percent — are operating at thenorm with data loss or theft rates that range from three to 15 each year, between seven and 79hours of business downtime, and between three and 15 compliance deficiencies in IT that mustbe corrected.
The losses organizations are willing to sustainare exceedingly low, and the returns for
improving results are extraordinarily high.
Loss of confidentiality, integrityand availability are larger business
and financial risks than are outsourced ITprojects, systems, information or delays to
critical projects.

8/8/2019 Managing Business Risks From the Use of IT
http://slidepdf.com/reader/full/managing-business-risks-from-the-use-of-it 4/31
Managing Spend on Information Security and Audit for Better Results
3
Best outcomes: Only about one in 10 organizations — 13 percent — are consistently operatingwith the best results, including fewer than three losses or thefts of sensitive information, less thansix hours of business downtime, and fewer than three deficiencies to correct to pass audit.
The financial outcomes being experienced by organizations are directly related to the outcomes being managed within IT.Organizations with the worst outcomes in IT are experiencing highest levels of financial exposure and loss than all others.However, it is the majority of organizations that are overspending on audit.
Financial risks, losses and returns
Financial exposure from the loss of customer data and business disruptions is aligned with outcomesexperienced in IT. These include:
Best-in-class firms experience the lowest and most infrequent financial losses
Normative performing organizations experience higher financial losses
Firms operating at the worse levels experience the highest and most frequent financial losses
The financial exposure from the loss or theft or customer data and business downtime dependsalmost entirely on the practices implemented in IT to manage these risks (Figure 1).
Figure 1: Financial exposure from data theft or loss
Source: IT Policy Compliance Group, 2009
Practices implemented by organizations impact both the magnitude of financial loss and when losses
occur. For example, best-in-class firms delay the onset of data loss or theft to decades or longer, whilealso reducing the magnitude of financial impact. This is in contrast to firms with the worst practices thatexperience more frequent, and higher, financial consequences from theloss of customer records. Unlike the loss or theft of data, the onset of business disruptions or inability to access information is a morecommon occurrence. Fortunately, the loss or theft of customer datadoes not occur every week, or for many organizations every year. Butfor some organizations the loss of data occurs more frequently thanothers.
When the onset of data loss or theft occurs and the frequency and extent of business disruptionsdue to failures and disruptions occurring in IT are taken into account, the average annualized lossesincurred by organizations, while lower, remain substantial (Table 1).
Best in class firms delay the onset of data lossor theft to decades or longer, while also
reducing the magnitude of financial impact.

8/8/2019 Managing Business Risks From the Use of IT
http://slidepdf.com/reader/full/managing-business-risks-from-the-use-of-it 5/31
Managing Spend on Information Security and Audit for Better Results
4
Table 1: Average annualized financial loss rates – data loss-theft and downtime
Annual revenueor budget
Worstpractices
Normativepractices
Bestpractices
$50 million $1.5 million $240,000 $20,500
$500 million $19 million $3.3 million $211,000
$5 billion $329 million $60 million $2.25 million
$50 billion $5 billion $1.2 billion $25 million
Source: IT Policy Compliance Group, 2009
Financial returns for managing data loss-theft and downtime risksThe return on losses organizations are willing to sustain before improving practices ranges from 100percent to more than 1,000 percent annually, depending on size and current practice levels. Based onthese metrics, most organizations have solid financial reason to improve practices without a need for cost-justifications and cost benefit analysis (Figure 2).
Figure 2: Financial returns for managing risks
Source: IT Policy Compliance Group, 2009
Financial returns for integrity: avoiding overspending on auditA majority of organizations are overspending on audit fees andexpenses to sustain audit results each year. The overspending by sevenin 10 organizations includes annual spending that is 66 percent higher than firms with the worst outcomes and annual spending that is 100percent higher than organizations with the best outcomes. Organizationswith the best track-records are spending between 35 percent and 52percent less on audit fees and expenses annually.
Practices for managing risks, reducing costs and improving resultsAll industries, and organizations of all sizes, have an equal opportunity to reduce risks, reduce costsand improve results. Firms in more highly regulated industries have no latent advantages over organizationsin less highly regulated industries when it comes to protecting customer data. Larger enterprises have noinherent advantage over small businesses when it comes to maintaining 24x7 IT services. Although firms
Organizations with the best track-records arespending between 35 percent and 52 percentless on audit fees and expenses annually.

8/8/2019 Managing Business Risks From the Use of IT
http://slidepdf.com/reader/full/managing-business-risks-from-the-use-of-it 6/31
Managing Spend on Information Security and Audit for Better Results
5
in a few industries, such as publishing, media, entertainment, medical devices, and aerospace are experiencingworse or better outcomes than firms in other industries, most firms and most industries are operating at the norm.
The primary factor influencing operational outcomes, financial risk andoverspending are the practices implemented by organizations to managerisk and spending. Organizations with the worst results and highestlosses from the use of IT are actually spending the same amounts oninformation security as the firms with the lowest risks and best outcomes.The differences between the two include practices implemented for managing risk and lower spending on regulatory audit.
The integrity of the controls and procedures being employed to managerisk within IT by these organizations, and the lack of such controls and procedures among others, is reflected by the majorcause of audit problems in IT: almost all of which are directly related to information security and assurance practices, where:
The top five reasons for audit problems are from information security and assurance practices
Seven of the top 10 audit problems are related to information security and assurance practices
Although the theft or loss of customer data results in unwanted press attention, and severe outages maytemporarily garner operational change within an organization, it is the on-going, day-to-day managementof information security and operational assurance that ultimately needs to be improved. Establishingperformance-based budgeting for information security and audit in IT without a commitment to the practicesand actions needed to reduce risk, reduce cost and improve results will not succeed.
Managing spend on information security for better outcomesOrganizations with the worst outcomes and highest financial risks are spending the same amount oninformation security as organizations with the best outcomes and least financial risk. Instead of increasingspend on information security, the worst performers should be reallocating current spending to practicesthat deliver better results.
Unlike the worst performers, a majority of organizations are not spending enough on the practices that matter.In addition to an increase in spending, these organizations should consider eliminating practices that are not working,implementing the practices proven to deliver results, and incrementally reduce financial risks and audit expenses. Thereturns for incremental spending, ranging from more than 100 percent to more than 1,000 percent annually, are highenough that cost justifications and cost benefit analysis are not warranted for a majority of organizations. However,incremental spending should be focused where it will do the most good: on practices that will improve results.
Risk-based performance budgeting for information security and audit in ITThe organizations with the worst result and the largest number of data losses, the most downtime and theworst audit results are spending almost the same amount on information security as the organizations withthe best results. In contrast, a majority of organizations are spending half as much as the others. The results: the worst performers are spendingmoney on information security and audit and are not reaping the benefits.A majority of firms are not spending enough on the correct practices, andthe best performers have aligned spending with practices that aredelivering results. Risk-based performance budgeting for informationsecurity and audit in IT establishes shared goals and objectives for delivering better results.
RecommendationsThe organizations with the best outcomes, the lowest financial losses and the lowest spending on regulatoryaudit take very different actions and implement very different practices than all other firms. The recommendations,based on results being achieved by the best-performers, include:
Establish goals and objectives for managing operational outcomes and financial risk
Manage spending for practices that reduce risk
Establish goals and objectives for reducing spend on regulatory audit
Organize for success by:
- Having the Chief Information Security Officer (CISO) manage information security and compliance
- Placing the IT operations officer or manager in charge of the availability of IT services
- Engaging senior leadership from IT, legal, business and plant security to manage risks
Organizations with the worst results and highestlosses from the use of IT are actually spendingthe same amounts on information security as
the firms with the lowest risks and bestoutcomes.
Risk-based performance budgeting for information security and audit in IT establishes
shared goals and objectives for delivering better results.
8/8/2019 Managing Business Risks From the Use of IT
http://slidepdf.com/reader/full/managing-business-risks-from-the-use-of-it 7/31
Managing Spend on Information Security and Audit for Better Results
6
Take specific actions, including:
- Prioritizing and managing business risks
- Improving IT controls and procedures to manage business risks
- Automating the collection of IT audit data
- Increasing the frequency of monitoring, assessments and reporting to weekly and bi-monthly
Automate more IT controls to manage risks, especially:
- Technical IT security controls
- Authorized user account controls
Score business risks from the use of IT based on:
- Loss of confidentiality, integrity and availability
- Severity of business and mission impact
Routinely use dashboards for reporting on business risks from the use of IT that include:
- Operational quality level reports
- Financial and business impact summaries
- Policy compliance reports
- Legal and regulatory impact reports- Real-time event reports
- IT audit test reports
- IT security test reports
Reducing financial risk and loss, and well as reducing spend onregulatory audit, ultimately depends on whether appropriate actions andpractices are implemented.
For many organizations in the current environment, costs are alreadybeing reduced: the challenge is to accomplish more with less. Spendingon automating controls, continuous monitoring and assessment, and managing information relevant to the principalbusiness risks from the use of IT are necessary table-stakes to improve results. These actions need to be accompanied by
leveraging information to manage risk among other practices. The benefits of risk-based performance budgeting for information security and audit in IT is that everyone, in and outside of IT, knows how to measure the value of the results.
Take specific actions, including: prioritizing and
managing business risks, improving IT controlsand procedures, automating the collection of IT
audit data, and increasing the frequency of assessments and reporting to weekly
and bi-monthly.
Reducing financial risk and loss, as well asreducing spend on regulatory audit ultimatelydepends on whether appropriate actions and
practices are implemented.
8/8/2019 Managing Business Risks From the Use of IT
http://slidepdf.com/reader/full/managing-business-risks-from-the-use-of-it 8/31
Managing Spend on Information Security and Audit for Better Results
7
Benchmark Findings
Primary business risks from the use of ITThe primary business risks associated with the use of IT are directly related to: 1) the availability of IT resources and assets for business purposes; 2) the integrity of IT assets and information; and 3) the confidentiality of information. Measured most recentlyacross 481 organizations, the findings reveal the top business risks include:
1) Loss or theft of customer data
2) Business disruptions from IT failures and disruptions
3) Loss of integrity for critical IT assets and information
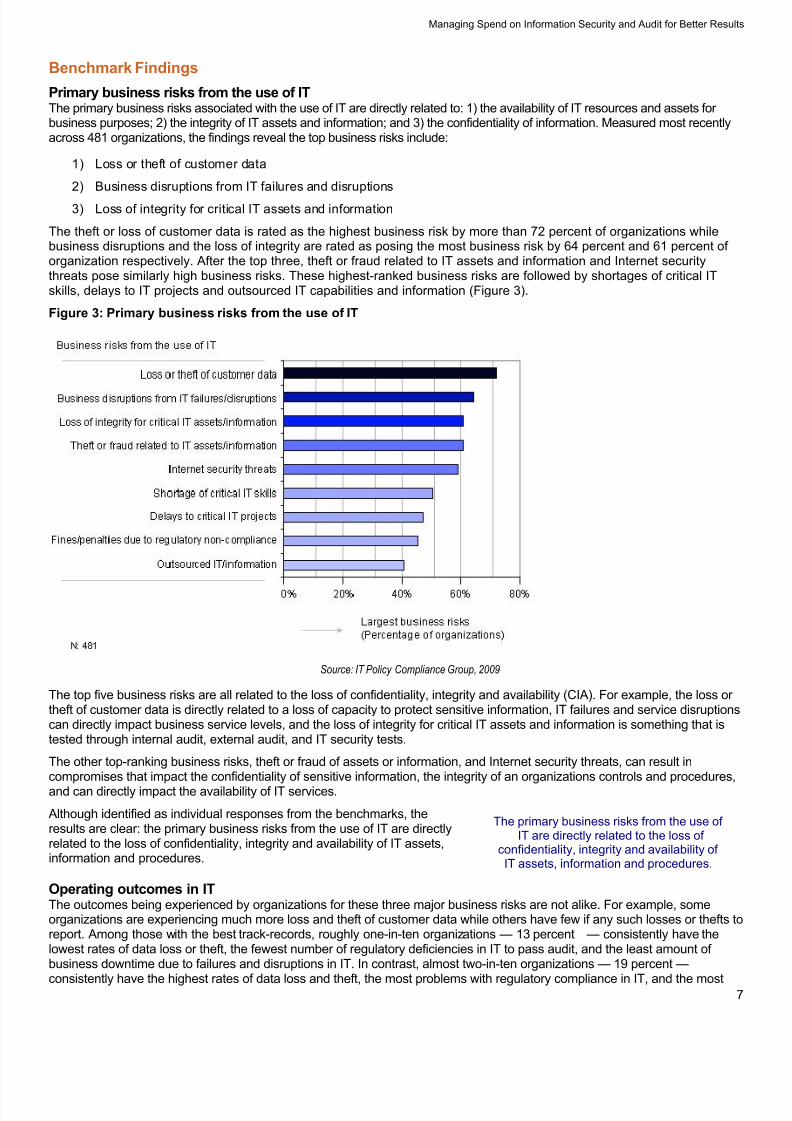
The theft or loss of customer data is rated as the highest business risk by more than 72 percent of organizations whilebusiness disruptions and the loss of integrity are rated as posing the most business risk by 64 percent and 61 percent of organization respectively. After the top three, theft or fraud related to IT assets and information and Internet securitythreats pose similarly high business risks. These highest-ranked business risks are followed by shortages of critical ITskills, delays to IT projects and outsourced IT capabilities and information (Figure 3).
Figure 3: Primary business risks from the use of IT
Source: IT Policy Compliance Group, 2009
The top five business risks are all related to the loss of confidentiality, integrity and availability (CIA). For example, the loss or theft of customer data is directly related to a loss of capacity to protect sensitive information, IT failures and service disruptionscan directly impact business service levels, and the loss of integrity for critical IT assets and information is something that istested through internal audit, external audit, and IT security tests.
The other top-ranking business risks, theft or fraud of assets or information, and Internet security threats, can result incompromises that impact the confidentiality of sensitive information, the integrity of an organizations controls and procedures,and can directly impact the availability of IT services.
Although identified as individual responses from the benchmarks, theresults are clear: the primary business risks from the use of IT are directlyrelated to the loss of confidentiality, integrity and availability of IT assets,information and procedures.
Operating outcomes in ITThe outcomes being experienced by organizations for these three major business risks are not alike. For example, someorganizations are experiencing much more loss and theft of customer data while others have few if any such losses or thefts toreport. Among those with the best track-records, roughly one-in-ten organizations — 13 percent — consistently have thelowest rates of data loss or theft, the fewest number of regulatory deficiencies in IT to pass audit, and the least amount of business downtime due to failures and disruptions in IT. In contrast, almost two-in-ten organizations — 19 percent —
consistently have the highest rates of data loss and theft, the most problems with regulatory compliance in IT, and the most
The primary business risks from the use of IT are directly related to the loss of
confidentiality, integrity and availability of IT assets, information and procedures.

8/8/2019 Managing Business Risks From the Use of IT
http://slidepdf.com/reader/full/managing-business-risks-from-the-use-of-it 9/31
Managing Spend on Information Security and Audit for Better Results
8
business downtime due to failures and disruptions in IT. A majority of organizations — 68 percent — are operating somewherebetween these two extremes, with between four and 15 losses or thefts of sensitive information each year, four to 15compliance deficiencies in IT that must be corrected to pass audit, and between seven and 59 hours of business downtimedue to failures and disruptions occurring in IT (Figure 4).
Figure 4: Operating outcomes from the use of IT
Source: IT Policy Compliance Group, 2009
Once a winner, always a winner What is perhaps most striking from the benchmarks is the consistency with which organizations are experiencing the poorest,normative and best outcomes across the three primary business risks from the use of IT. When an organization does well, itconsistently does well at maintaining the confidentiality, integrity and availability of its information assets: if it is not doing well inone area, results suffer across the board (Figure 5).
Figure 5: Outcome profiles are shared for data loss, theft and regulatory compliance
Source: IT Policy Compliance Group, 2009

8/8/2019 Managing Business Risks From the Use of IT
http://slidepdf.com/reader/full/managing-business-risks-from-the-use-of-it 10/31
Managing Spend on Information Security and Audit for Better Results
9
Almost all (97 percent) of the organizations with the least loss or theft of customer data are the exact same firms with thefewest regulatory compliance deficiencies in IT to correct to pass audit. The other three percent were unlucky and had slightlymore compliance deficiencies.
A majority of the organizations (76 percent) with the highest losses of customer information are the exact same firms with the largest number of compliance deficiencies in IT to correct to pass audit. In between these twoextremes, a majority of organizations (93 percent) operating in the middle hadbetween four and 15 losses or thefts of data and between four and 15regulatory compliance deficiencies that had to be corrected to pass audit in
the past year. The same pattern of outcomes can be seen in the relationshipbetween business downtime and regulatory audit results, where almost all (97percent) of the best performing organizations had the least businessdowntime and the fewest regulatory deficiencies to correct in IT to pass audit. By comparison, about eight in 10 (76 percent) of the worst performers are experiencing more than 60 hours of business downtime and 16 or more regulatory compliancedeficiencies to correct in IT.
Most organizations, almost eight in 10 (76 percent) are posting results that include business downtime levels between sevenand 59 hours annually and between four and 15 regulatory deficiencies to correct in IT (Figure 6).
Figure 6: Outcome profiles are shared for business downtime and regulatory compliance
Source: IT Policy Compliance Group, 2009
Information security, assurance and regulatory compliance in ITThe reason for the similarity of outcomes across arises from the leading causes of deficiencies found from audits. The top fivedeficiencies found in audit are directly related to the loss of confidentiality, integrity and availability: the foundation of information security practices and the primary business risks from the use of IT.
Beyond the top five reasons for compliance deficiencies, seven of the top 10reasons for compliance deficiencies flagged by audits involve the handling
and protection of information and related IT assurance and security functionswithin organizations (Figure 7).
The uncanny relationship between operating outcomes in IT and the fact thata majority, or almost all of the same firms are experiencing similar outcomes, indicates that the integrity of information, assets,and controls in IT has a profound influence on the ability to protect critical information and maintain authorized access toinformation for the organization.
An obvious conclusion from the benchmarks is that the information security and audit practices within IT strongly influencesoperational outcomes for data loss and theft, operational resilience, the integrity of controls for managing risk and conformancewith policies of the organization and its external audit and reporting mandates.
When an organization does well, itconsistently does well at maintaining the
confidentiality, integrity and availability of itsinformation assets; if it is not doing well,
results suffer across the board.
The top five deficiencies found in audit aredirectly related to the loss of confidentiality,
integrity and availability: the primary businessrisks from the use of IT.
8/8/2019 Managing Business Risks From the Use of IT
http://slidepdf.com/reader/full/managing-business-risks-from-the-use-of-it 11/31
Managing Spend on Information Security and Audit for Better Results
10
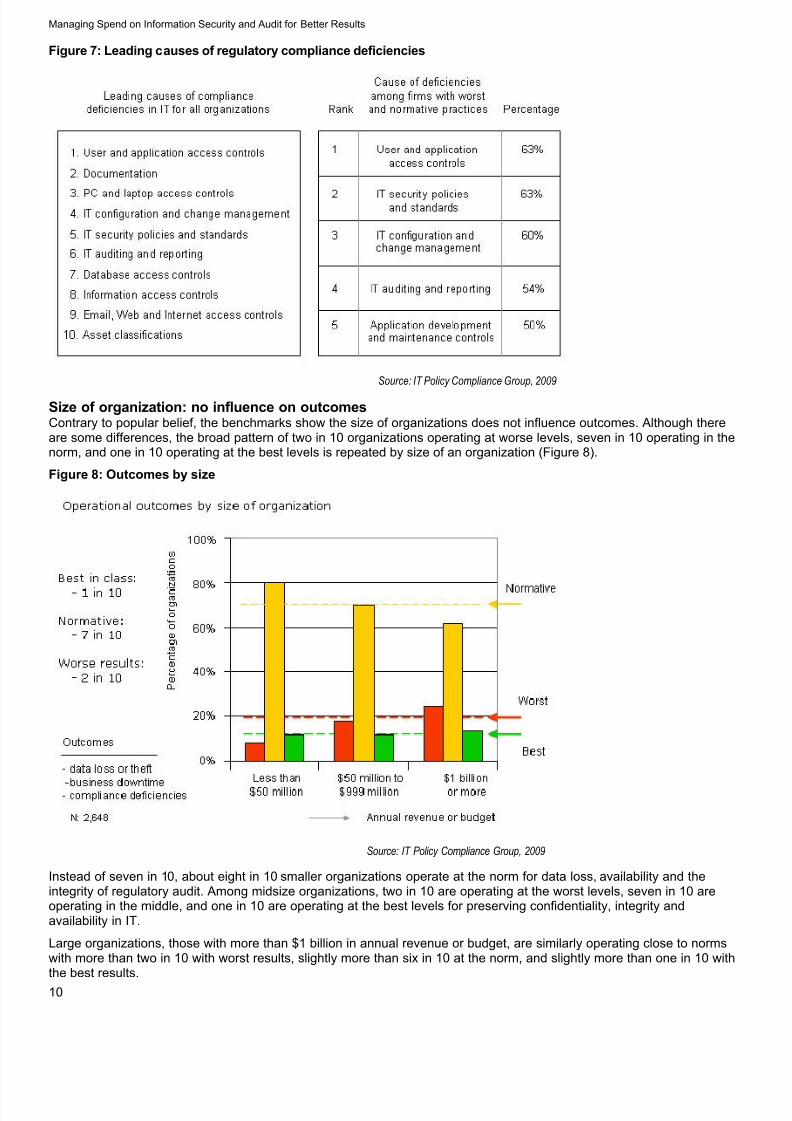
Figure 7: Leading causes of regulatory compliance deficiencies
Source: IT Policy Compliance Group, 2009
Size of organization: no influence on outcomesContrary to popular belief, the benchmarks show the size of organizations does not influence outcomes. Although thereare some differences, the broad pattern of two in 10 organizations operating at worse levels, seven in 10 operating in thenorm, and one in 10 operating at the best levels is repeated by size of an organization (Figure 8).
Figure 8: Outcomes by size
Source: IT Policy Compliance Group, 2009
Instead of seven in 10, about eight in 10 smaller organizations operate at the norm for data loss, availability and theintegrity of regulatory audit. Among midsize organizations, two in 10 are operating at the worst levels, seven in 10 areoperating in the middle, and one in 10 are operating at the best levels for preserving confidentiality, integrity andavailability in IT.
Large organizations, those with more than $1 billion in annual revenue or budget, are similarly operating close to normswith more than two in 10 with worst results, slightly more than six in 10 at the norm, and slightly more than one in 10 withthe best results.

8/8/2019 Managing Business Risks From the Use of IT
http://slidepdf.com/reader/full/managing-business-risks-from-the-use-of-it 12/31
Managing Spend on Information Security and Audit for Better Results
11
Firms in most industries operate in the norm
The conventional wisdom holds that more highly regulated industries are more adept at, and therefore perform better when itcomes to regulatory audit. However, the benchmarks results show that for most firms in most industries, operating in the normis the norm. Although there are unique differences by firms within each industry, the general pattern of two in 10 are havingmore difficulty, seven in 10 are operating at the norm and one in 10 are posting stellar results are found across many differentindustries (Figure 9).
The industries operating in the norm include automotive, banking, chemical,computer hardware and software, education, financial service, governmentagency, healthcare, legal services, insurance, manufacturing, mining, oil,
gas, pharmaceutical, real estate, retail, telecommunications, transportationand wholesale trade among others.
The experience of any one organization within an industry could be anywhere along the spectrum. For example, someorganizations in the telecommunications industry post stellar track records for availability, while the experience of others isdragging down average outcomes for the industry as a whole. Likewise, some healthcare service organizations are doing anoutstanding job of protecting customer data, while the majority of the firms in this industry operate at the norm.
In contrast, a majority of firms in aerospace, agriculture and consumer products goods industries have the best track recordswhen it comes protecting sensitive information, maintaining the integrity of information, and avoiding business downtime fromIT failures. While an argument can be made that the IT systems in the agriculture and animal product industries are not ascomplex as those found within the air travel industry, the findings do not reflect these kinds of differences in IT: the findingssimply show the relative outcomes across the industries.
Unfortunately, a majority of the firms in architecture, construction, engineering, entertainment, food and beverage,management consulting, medical devices, publishing, media, scientific research, and utility industries are experiencing ratesthat are worst than the industry norm. This does not mean that all of the firms in these industries are alike: some are indeedoperating with the best results. However, the overall average shows organizations in these industries are having more difficultythan other industries with protecting information, maintaining service levels from IT, and sustaining regulatory compliance.
Figure 9: Industry results: business risks from the use of IT
Source: IT Policy Compliance Group, 2009
Financial exposure from risks in ITFor a majority of organizations, the seven in 10 operating in the middle, the financial risks from data loss or theft are sixpercent of revenue (annual budgets for government and non-profits). These same organizations are exposed to financiallosses from IT failures and disruptions that range from 0.1 to 1.0 percent of revenue annually, depending upon the scopeand extent of these outages. Lastly, these organizations spend the most on regulatory compliance when compared with alother organizations.
For most firms in most industries,operating in the norm is the norm.

8/8/2019 Managing Business Risks From the Use of IT
http://slidepdf.com/reader/full/managing-business-risks-from-the-use-of-it 13/31
Managing Spend on Information Security and Audit for Better Results
12
For two in 10 organizations, those with the highest rates of data loss, business disruptions, and regulatory non-complianceproblems, the financial exposure is almost 10 percent of revenue (budget) from the loss or theft of data. The exposurefrom disrupted business due to IT failures ranges from 1 to 10 percent depending on the extent of the disruptions.
Organizations with the lowest financial risk from the use of IT are theone in 10 operating at best-in-class-levels. The financial exposureamong these organizations is less than 0.5 percent of revenue (budget)from the loss or theft of customer data. Exposure from disruptedbusiness ranges from 0.02 to 0.2 percent of revenue. Theseorganizations are also spending the least on regulatory audit, with average spending 52 percent lower than the majority of
firms operating at the norm (Figure 10).For example, an organization with $1 billion in annual revenue operating in the middle of the pack for managingconfidentiality, integrity and availability risks is exposed to $64 million from expenses and capital losses after the loss or theft of customer data. This same organization is exposed to expenses that range from $1 to $10 million from businessdisruptions due to IT failures and service disruptions. Spending the most to vet the integrity of its financial filings and other regulatory reporting requirements, these organizations are spending an average of $7.6 million on audit fees andexpenses.
By comparison, best-in-class firms of the same size are exposed to less financial risk and are spending less on audit: lessthan $500,000 from the loss or theft of data; between $200,000 and $2,000,000 from disrupted business operations; andless than $4 million spent on regulatory compliance fees and expenses.
Figure 10: Financial exposure from managing outcomes in IT
Source: IT Policy Compliance Group, 2009
Risk occurrence rates
The frequency of IT failures and disruptions resulting in business disruptions for organizations is more than one each yearexcept for organizations with best practices for managing the availability risks. For organizations with the worst practices,the extent and scope of such outages is more frequent and longer. However, for a majority of organizations, the impactfrom disrupted business operations due to IT failures is one-tenth of the worst outcomes being experience by firms withthe worst practices: a 90 percent decline. The steep decline in loss experiences from disrupted IT services is largely dueto the attention given to business continuity, resumption and disaster recovery during the past twenty years.
The likelihood of experiencing business disruptions from IT failures and disruptions is a function of the total outage and thescope of the impact to the organization. The total outages being experienced annually by organizations is directly relatedto the number of events and the outages for such events. The extent of the financial impact depends on whether it impacts90 percent of productive capacity or a much lower 10 percent of productive capacity. Relative to all other organizations,firms with the best practices for managing downtime from IT failures are experiencing significantly less total businessdowntime annually from IT failures or disruptions that all others (Table 2).
Organizations with the lowest financial risk fromthe use of IT are the one in 10 operating at
best-in-class levels.
8/8/2019 Managing Business Risks From the Use of IT
http://slidepdf.com/reader/full/managing-business-risks-from-the-use-of-it 14/31
Managing Spend on Information Security and Audit for Better Results
13
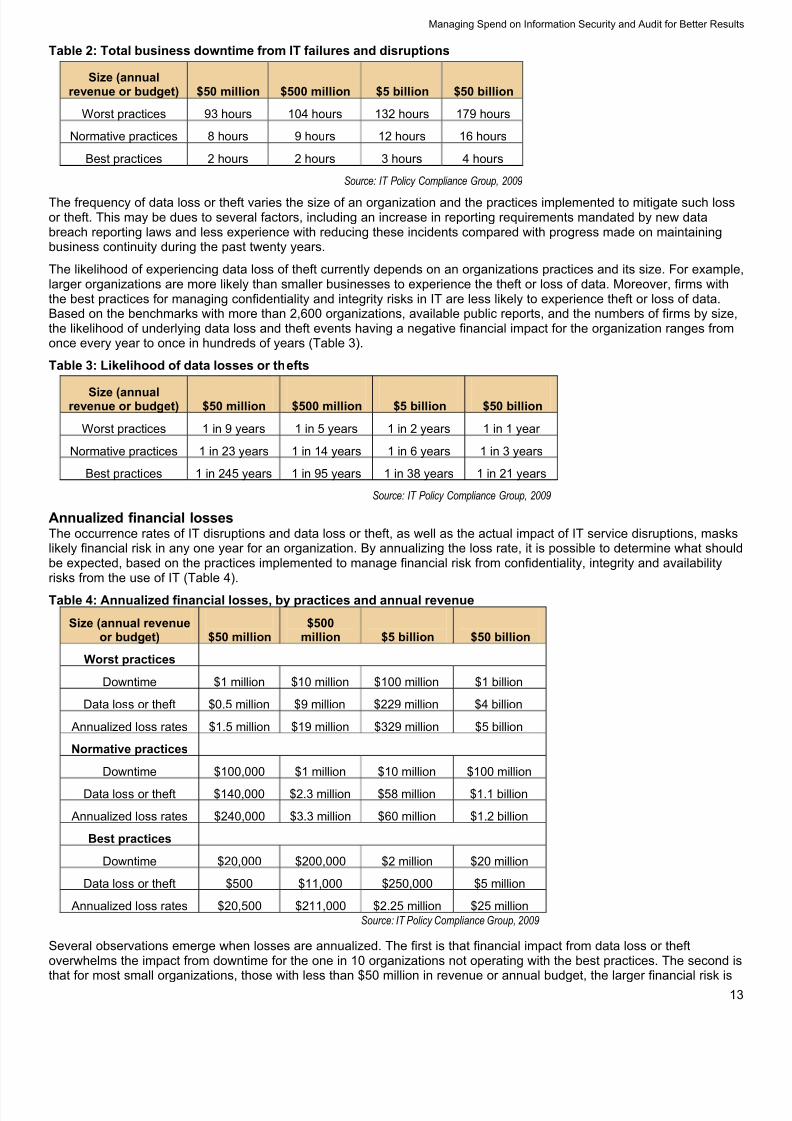
Table 2: Total business downtime from IT failures and disruptions
Size (annualrevenue or budget) $50 million $500 million $5 billion $50 billion
Worst practices 93 hours 104 hours 132 hours 179 hours
Normative practices 8 hours 9 hours 12 hours 16 hours
Best practices 2 hours 2 hours 3 hours 4 hours
Source: IT Policy Compliance Group, 2009
The frequency of data loss or theft varies the size of an organization and the practices implemented to mitigate such lossor theft. This may be dues to several factors, including an increase in reporting requirements mandated by new databreach reporting laws and less experience with reducing these incidents compared with progress made on maintainingbusiness continuity during the past twenty years.
The likelihood of experiencing data loss of theft currently depends on an organizations practices and its size. For examplelarger organizations are more likely than smaller businesses to experience the theft or loss of data. Moreover, firms withthe best practices for managing confidentiality and integrity risks in IT are less likely to experience theft or loss of data.Based on the benchmarks with more than 2,600 organizations, available public reports, and the numbers of firms by size,the likelihood of underlying data loss and theft events having a negative financial impact for the organization ranges fromonce every year to once in hundreds of years (Table 3).
Table 3: Likelihood of data losses or thefts
Size (annualrevenue or budget) $50 million $500 million $5 billion $50 billion
Worst practices 1 in 9 years 1 in 5 years 1 in 2 years 1 in 1 year
Normative practices 1 in 23 years 1 in 14 years 1 in 6 years 1 in 3 years
Best practices 1 in 245 years 1 in 95 years 1 in 38 years 1 in 21 years
Source: IT Policy Compliance Group, 2009
Annualized financial lossesThe occurrence rates of IT disruptions and data loss or theft, as well as the actual impact of IT service disruptions, maskslikely financial risk in any one year for an organization. By annualizing the loss rate, it is possible to determine what shouldbe expected, based on the practices implemented to manage financial risk from confidentiality, integrity and availabilityrisks from the use of IT (Table 4).
Table 4: Annualized financial losses, by practices and annual revenue
Size (annual revenueor budget) $50 million
$500million $5 billion $50 billion
Worst practices
Downtime $1 million $10 million $100 million $1 billion
Data loss or theft $0.5 million $9 million $229 million $4 billion
Annualized loss rates $1.5 million $19 million $329 million $5 billion
Normative practices
Downtime $100,000 $1 million $10 million $100 million
Data loss or theft $140,000 $2.3 million $58 million $1.1 billion
Annualized loss rates $240,000 $3.3 million $60 million $1.2 billion
Best practices
Downtime $20,000 $200,000 $2 million $20 million
Data loss or theft $500 $11,000 $250,000 $5 million
Annualized loss rates $20,500 $211,000 $2.25 million $25 millionSource: IT Policy Compliance Group, 2009
Several observations emerge when losses are annualized. The first is that financial impact from data loss or theftoverwhelms the impact from downtime for the one in 10 organizations not operating with the best practices. The second is
that for most small organizations, those with less than $50 million in revenue or annual budget, the larger financial risk is
8/8/2019 Managing Business Risks From the Use of IT
http://slidepdf.com/reader/full/managing-business-risks-from-the-use-of-it 15/31
Managing Spend on Information Security and Audit for Better Results
14
business downtime, not data loss or theft. Lastly, for most organizations over $50 million in revenue or annual budget, thelarger financial exposure is from the loss or theft of information.
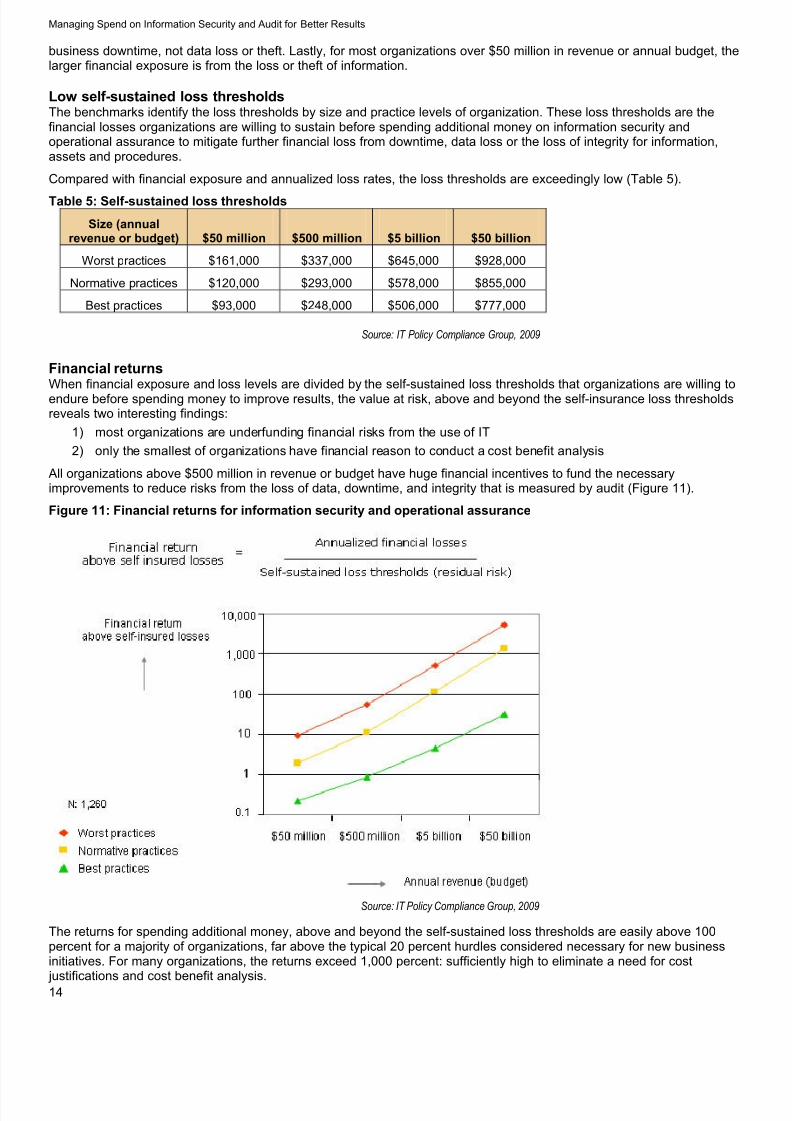
Low self-sustained loss thresholdsThe benchmarks identify the loss thresholds by size and practice levels of organization. These loss thresholds are thefinancial losses organizations are willing to sustain before spending additional money on information security andoperational assurance to mitigate further financial loss from downtime, data loss or the loss of integrity for information,assets and procedures.
Compared with financial exposure and annualized loss rates, the loss thresholds are exceedingly low (Table 5).
Table 5: Self-sustained loss thresholds
Size (annualrevenue or budget) $50 million $500 million $5 billion $50 billion
Worst practices $161,000 $337,000 $645,000 $928,000
Normative practices $120,000 $293,000 $578,000 $855,000
Best practices $93,000 $248,000 $506,000 $777,000
Source: IT Policy Compliance Group, 2009
Financial returnsWhen financial exposure and loss levels are divided by the self-sustained loss thresholds that organizations are willing toendure before spending money to improve results, the value at risk, above and beyond the self-insurance loss thresholdsreveals two interesting findings:
1) most organizations are underfunding financial risks from the use of IT
2) only the smallest of organizations have financial reason to conduct a cost benefit analysis
All organizations above $500 million in revenue or budget have huge financial incentives to fund the necessaryimprovements to reduce risks from the loss of data, downtime, and integrity that is measured by audit (Figure 11).
Figure 11: Financial returns for information security and operational assurance
Source: IT Policy Compliance Group, 2009
The returns for spending additional money, above and beyond the self-sustained loss thresholds are easily above 100percent for a majority of organizations, far above the typical 20 percent hurdles considered necessary for new businessinitiatives. For many organizations, the returns exceed 1,000 percent: sufficiently high to eliminate a need for cost
justifications and cost benefit analysis.

8/8/2019 Managing Business Risks From the Use of IT
http://slidepdf.com/reader/full/managing-business-risks-from-the-use-of-it 16/31
Managing Spend on Information Security and Audit for Better Results
15
Overspending: the financial risk for regulatory auditAlthough there are many different kinds of audits, most audits of IT test the integrity of the information, systems, proceduresand controls that are implemented to manage risk.
Despite this primary focus, audits vary from one to another. For example, PCI audits are skewed more toward testing theintegrity and confidentiality of information, systems and procedures that does Gramm-Leach Bliley audit reporting. SarbanesOxley (SOX) audits focus on the integrity of financial reporting and the systems, procedures and controls related to financialreporting, including general IT controls covered by section 404 of SOX. Differences in focus can also be found across other audits, including HIPAA audits for healthcare information, FDA audits in the pharmaceutical industry, and OCC audits in theBanking industry.
Across more than 2,600 organizations, the money being spent onregulatory audit fees and internal expenses to pass audit demonstrates aparabolic curve directly related to the three primary business risks relatedto the use of IT, the confidentiality of information, the integrity of information,and the availability of information (Figure 12).
Unlike the financial risk associated with data loss and business disruptions, the financial risk from regulatory audit isoverspending, year-in and year-out. A majority of organizations, seven in 10, are overspending on audit fees and internalexpenses, by as much as 35 to 52 percent annually when compared with best-in-class firms.
For example an organization with $1 billion in revenue or budget, spends on average about $7.6 million each year to sustainregulatory audit results, compared with a best-in-class organization that is spending on average about $4 million. Thedifference, $2.6 million, adds up in five years to more than $10 million: money that could be better spent for more productivepurposes.
Normative performing organizations are overspending on audit, in the range of 35 percent to 52 percent each year, comparedto best-in-class organizations. The worst performing organizations are overspending by as much as 20 percent annually.
Figure 12: Overspending: the financial risk from regulatory audit
Source: IT Policy Compliance Group, 2009
Practices dictate outcomes and financial riskAlthough size and industry do not materially impact outcomes for managing business and financial risks from the use of ITthe practices implemented by organizations for managing confidentiality, integrity and availability are responsible for thedifferences in outcomes and financial risks. Throughout all of the findings, the one factor that is aligned with better operational and financial outcomes is the differences in practices being implemented by organizations.
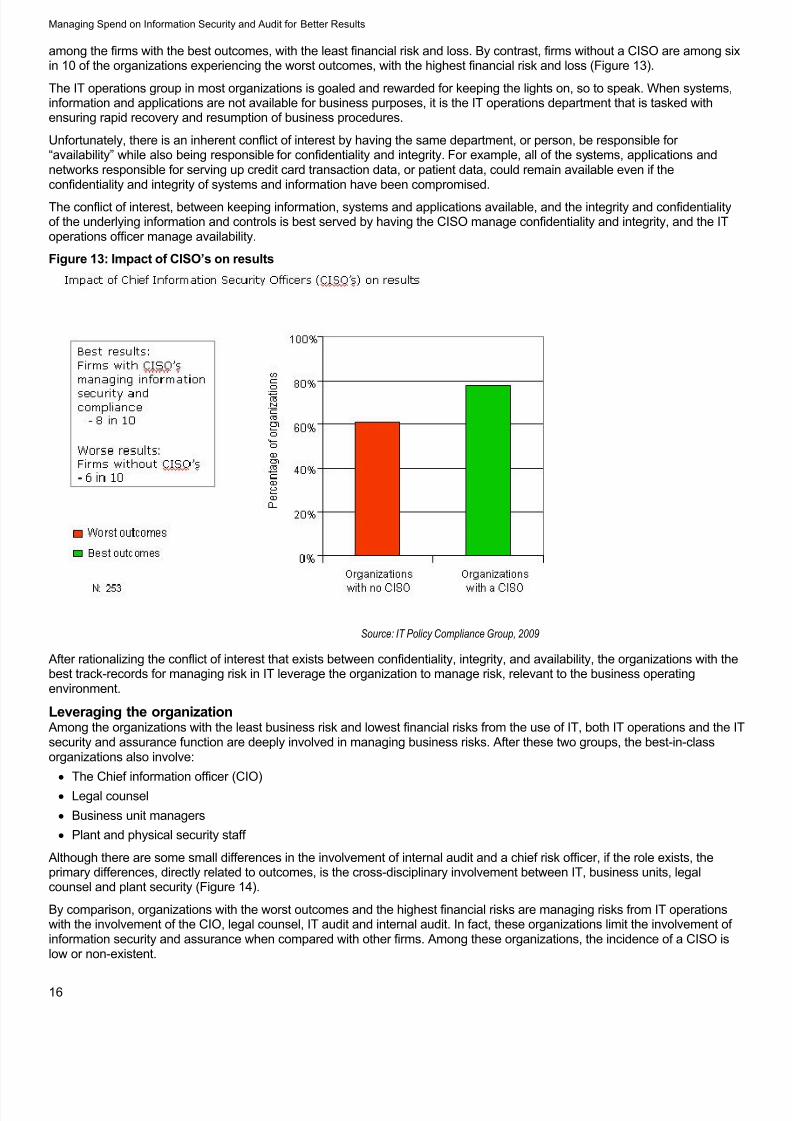
Impact of CISO’s on resultsAbout eight in 10 of the organizations with a chief information security officer (CISO) in place, responsible for managingday-to-day operations and overseeing management responsibility for ensuring the confidentiality and integrity of IT assets, are
Seven in 10 organizations are overspending onaudit fees and expenses, by as much as 35 to
52 percent annually.
8/8/2019 Managing Business Risks From the Use of IT
http://slidepdf.com/reader/full/managing-business-risks-from-the-use-of-it 17/31
Managing Spend on Information Security and Audit for Better Results
16
among the firms with the best outcomes, with the least financial risk and loss. By contrast, firms without a CISO are among sixin 10 of the organizations experiencing the worst outcomes, with the highest financial risk and loss (Figure 13).
The IT operations group in most organizations is goaled and rewarded for keeping the lights on, so to speak. When systems,information and applications are not available for business purposes, it is the IT operations department that is tasked withensuring rapid recovery and resumption of business procedures.
Unfortunately, there is an inherent conflict of interest by having the same department, or person, be responsible for “availability” while also being responsible for confidentiality and integrity. For example, all of the systems, applications andnetworks responsible for serving up credit card transaction data, or patient data, could remain available even if theconfidentiality and integrity of systems and information have been compromised.
The conflict of interest, between keeping information, systems and applications available, and the integrity and confidentialityof the underlying information and controls is best served by having the CISO manage confidentiality and integrity, and the IToperations officer manage availability.
Figure 13: Impact of CISO’s on results
Source: IT Policy Compliance Group, 2009
After rationalizing the conflict of interest that exists between confidentiality, integrity, and availability, the organizations with thebest track-records for managing risk in IT leverage the organization to manage risk, relevant to the business operatingenvironment.
Leveraging the organizationAmong the organizations with the least business risk and lowest financial risks from the use of IT, both IT operations and the ITsecurity and assurance function are deeply involved in managing business risks. After these two groups, the best-in-classorganizations also involve:
The Chief information officer (CIO)
Legal counsel
Business unit managers
Plant and physical security staff
Although there are some small differences in the involvement of internal audit and a chief risk officer, if the role exists, theprimary differences, directly related to outcomes, is the cross-disciplinary involvement between IT, business units, legalcounsel and plant security (Figure 14).
By comparison, organizations with the worst outcomes and the highest financial risks are managing risks from IT operationswith the involvement of the CIO, legal counsel, IT audit and internal audit. In fact, these organizations limit the involvement of information security and assurance when compared with other firms. Among these organizations, the incidence of a CISO islow or non-existent.
8/8/2019 Managing Business Risks From the Use of IT
http://slidepdf.com/reader/full/managing-business-risks-from-the-use-of-it 18/31
Managing Spend on Information Security and Audit for Better Results
17
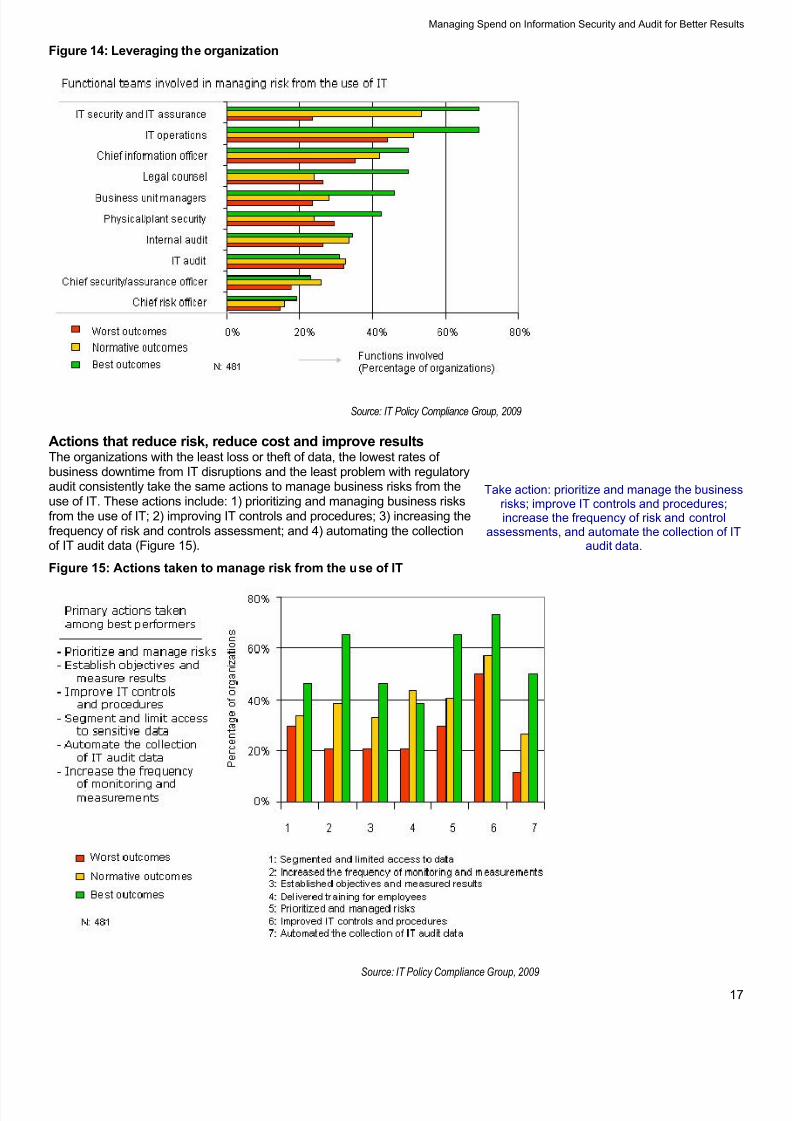
Figure 14: Leveraging the organization
Source: IT Policy Compliance Group, 2009
Actions that reduce risk, reduce cost and improve resultsThe organizations with the least loss or theft of data, the lowest rates of business downtime from IT disruptions and the least problem with regulatoryaudit consistently take the same actions to manage business risks from theuse of IT. These actions include: 1) prioritizing and managing business risksfrom the use of IT; 2) improving IT controls and procedures; 3) increasing thefrequency of risk and controls assessment; and 4) automating the collectionof IT audit data (Figure 15).
Figure 15: Actions taken to manage risk from the use of IT
Source: IT Policy Compliance Group, 2009
Take action: prioritize and manage the businessrisks; improve IT controls and procedures;increase the frequency of risk and control
assessments, and automate the collection of ITaudit data.

8/8/2019 Managing Business Risks From the Use of IT
http://slidepdf.com/reader/full/managing-business-risks-from-the-use-of-it 19/31
Managing Spend on Information Security and Audit for Better Results
18
By comparison, firms operating in the norm depend primarily on employee training as much as those with best track-records.However, these organizations are not implementing the other actions taken by the best-in-class firms. For example, while 65percent of the organizations with the best track records consistently prioritize and manage business risks, only 40 percent of the seven in 10 organizations in the norm take this action.
Continuous assessment and reportingFirms with the best track records, lowest financial risk, and lowest spending on regulatory audit routinely assess theeffectiveness of controls and business risks once every week and once every two weeks, respectively (Figure 16).
Figure 16: Frequency of assessment and reporting for risks and controls
Source: IT Policy Compliance Group, 2009
In contrast the vast majority of the population, the seven in 10 organizations operating in the norm, are measuring theeffectiveness of controls and reporting on the risk profile of the organization once every four to five months. Worse yet, the
organizations with the highest losses have the least frequent assessment schedules: once every five to seven months.
Controls for managing risk in ITControls are procedures implemented by an organization to manage risk: For example, to avoid an inherent financialconflict of interest, a common control implemented by most organizations is separation of duties, where the person incharge of payables is not the same person in charge of vendor receipts.
In the IT department, controls for managing business and financial risk range from those implemented by management,controls implemented in operations, and controls that are actually implemented within the technology responsible for managing information. Examples of the types of controls employed in IT to manage risk include:
Management controlsObjectives, policies, control objectives, standards, frameworks, and risk assessments among others
Operational controlsPhysical and environmental, employee training and awareness, personnel clearances, incident response, contingencyand resumption, change management, information retention and disposal, backup, archive, media storage, upgrades,updates, media labeling, information indexing, retention, disposal and separation of duties among others.
Technical IT security controlsAudit logs, accountability, memory tests, checksums, assets scans, scans, checksums, timestamps, integrity checks,configuration checks, identification, authorization, access controls, and cryptography among others.
Although separation of duties remains an important control, the controls that are most effective for managing risk from theuse of IT are technical IT security controls and authorized user accounts. These two are followed by management,operational and technical controls for policies, standards, regulatory frameworks, offsite storage, backup, archive,acceptable use guidelines, employee training, business contingency plans, business recovery procedures, and IT changemanagement procedures (Figure 17).
8/8/2019 Managing Business Risks From the Use of IT
http://slidepdf.com/reader/full/managing-business-risks-from-the-use-of-it 20/31
Managing Spend on Information Security and Audit for Better Results
19
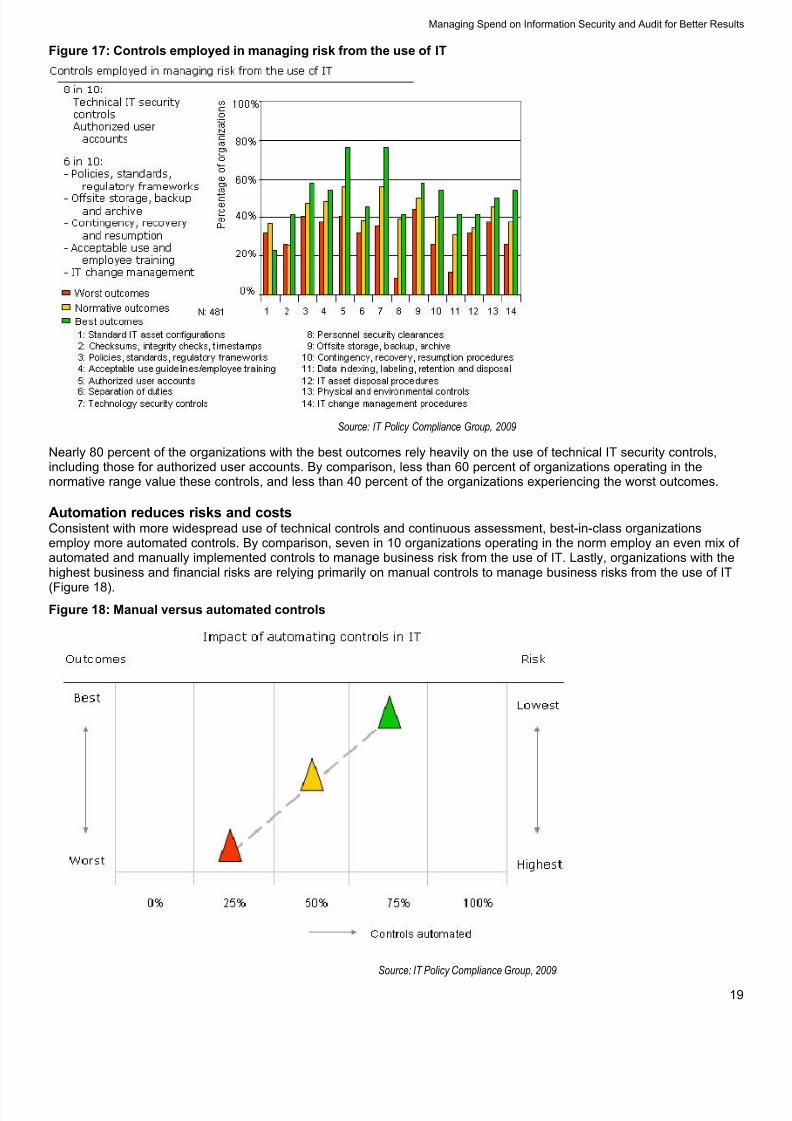
Figure 17: Controls employed in managing risk from the use of IT
Source: IT Policy Compliance Group, 2009
Nearly 80 percent of the organizations with the best outcomes rely heavily on the use of technical IT security controls,including those for authorized user accounts. By comparison, less than 60 percent of organizations operating in thenormative range value these controls, and less than 40 percent of the organizations experiencing the worst outcomes.
Automation reduces risks and costsConsistent with more widespread use of technical controls and continuous assessment, best-in-class organizationsemploy more automated controls. By comparison, seven in 10 organizations operating in the norm employ an even mix of automated and manually implemented controls to manage business risk from the use of IT. Lastly, organizations with thehighest business and financial risks are relying primarily on manual controls to manage business risks from the use of IT
(Figure 18).Figure 18: Manual versus automated controls
Source: IT Policy Compliance Group, 2009

8/8/2019 Managing Business Risks From the Use of IT
http://slidepdf.com/reader/full/managing-business-risks-from-the-use-of-it 21/31
Managing Spend on Information Security and Audit for Better Results
20
Information employed in managing risk in ITThe information deemed most important, and employed substantially differently by organizations with the besttrack-records includes: the criticality of IT assets and information; the likelihood of threats to IT assets and information; thehistory of attacks, threats, vulnerabilities and changes to IT assets and information; the capacity and motivation of attacksand threats; a prioritization of business risks; and an analysis of residual business risks.
By comparison, the only source of information employed by a majority of the firms operating in the norm involves a reviewof IT policies and procedures: all other sources of information for managing business risk from the use of IT are employedat rates far below those used by best-in-class firms.
Lastly, the firms with the worst track-records are not at parity with any information sources being employed to manage risk
with the exception of an analysis of the effectiveness of controls to manage risk, which is too infrequent to be effective.
Despite rating the effectiveness of controls assessments equally, thedifference in the frequency of assessments is a significant reason for thedifferences in the outcomes being experienced by organizations. Thedisparity between the frequency of control and risk assessments amongthe best performers and the other sources of information valued bythese organizations for managing business risks indicates:
Very frequent assessments of controls is considered table-stakes bythe best performers
Additional information is critical to effectively managing risk among the best performers
Understanding the human motivations involved is critical to managing the business risks
While automation is critical to the success being enjoyed by best-performers, it is what these organizations are doing withadditional information to manage risk that makes the difference in better outcomes, lower financial losses, and less moneyspent on audit (Figure 19).
Figure 19: Information used for managing risk from the use of IT
Source: IT Policy Compliance Group, 2009
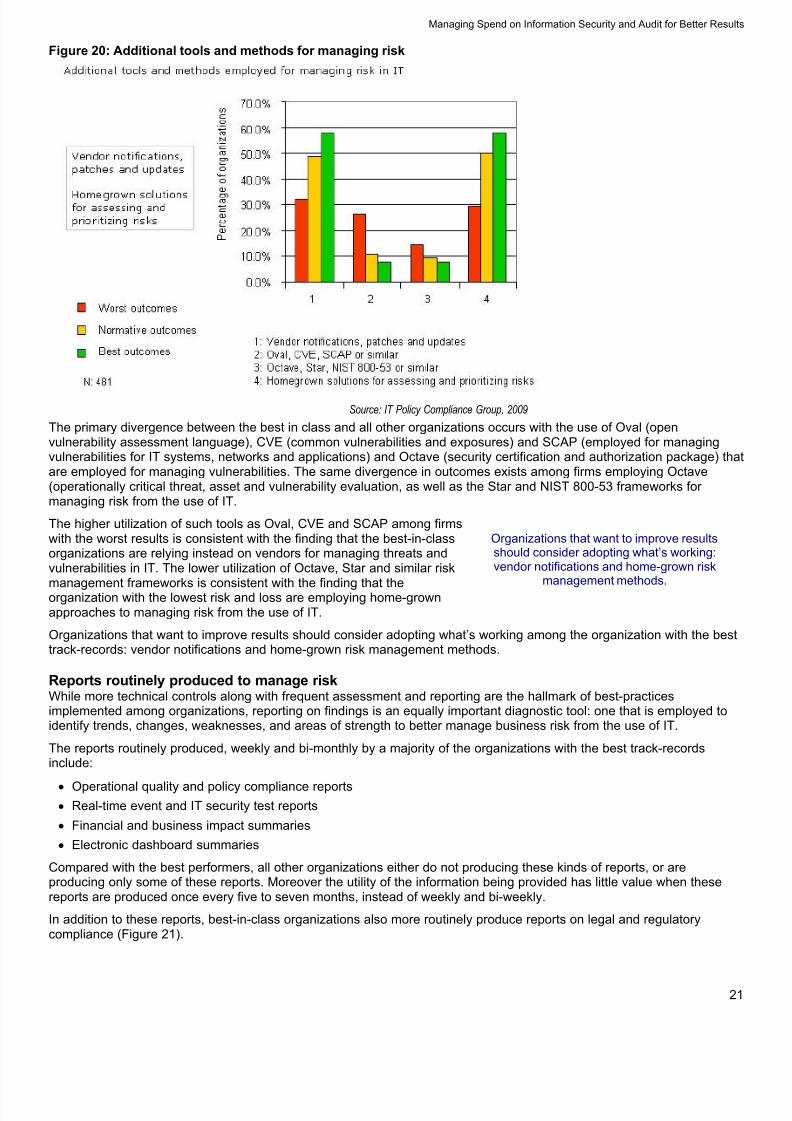
Additional tools and methods for managing riskAmong the firms with the lowest financial and operating risks, additional resources employed by organizations to managebusiness risks from the use of IT are dominated by the use of vendor notification, updates and patches, as well as the useof homegrown risk assessment procedures and methods.
In comparison, the use of such tools and methods as Oval, CVE, SCAP, Octave, Star and NIST frameworks are morewidely employed by organizations that are having greater problems, larger risks and worse operational results from theuse of IT (Figure 20).
While automation is critical to the successenjoyed by the best performers, it is what theseorganizations do with additional information tomanage risk that makes the difference in better
outcomes, lower financial losses and lessmoney being spent on audit.
8/8/2019 Managing Business Risks From the Use of IT
http://slidepdf.com/reader/full/managing-business-risks-from-the-use-of-it 22/31
Managing Spend on Information Security and Audit for Better Results
21
Figure 20: Additional tools and methods for managing risk
Source: IT Policy Compliance Group, 2009
The primary divergence between the best in class and all other organizations occurs with the use of Oval (openvulnerability assessment language), CVE (common vulnerabilities and exposures) and SCAP (employed for managingvulnerabilities for IT systems, networks and applications) and Octave (security certification and authorization package) thatare employed for managing vulnerabilities. The same divergence in outcomes exists among firms employing Octave(operationally critical threat, asset and vulnerability evaluation, as well as the Star and NIST 800-53 frameworks for managing risk from the use of IT.
The higher utilization of such tools as Oval, CVE and SCAP among firmswith the worst results is consistent with the finding that the best-in-classorganizations are relying instead on vendors for managing threats andvulnerabilities in IT. The lower utilization of Octave, Star and similar risk
management frameworks is consistent with the finding that theorganization with the lowest risk and loss are employing home-grownapproaches to managing risk from the use of IT.
Organizations that want to improve results should consider adopting what’s working among the organization with the besttrack-records: vendor notifications and home-grown risk management methods.
Reports routinely produced to manage riskWhile more technical controls along with frequent assessment and reporting are the hallmark of best-practicesimplemented among organizations, reporting on findings is an equally important diagnostic tool: one that is employed toidentify trends, changes, weaknesses, and areas of strength to better manage business risk from the use of IT.
The reports routinely produced, weekly and bi-monthly by a majority of the organizations with the best track-recordsinclude:
Operational quality and policy compliance reports Real-time event and IT security test reports
Financial and business impact summaries
Electronic dashboard summaries
Compared with the best performers, all other organizations either do not producing these kinds of reports, or areproducing only some of these reports. Moreover the utility of the information being provided has little value when thesereports are produced once every five to seven months, instead of weekly and bi-weekly.
In addition to these reports, best-in-class organizations also more routinely produce reports on legal and regulatorycompliance (Figure 21).
Organizations that want to improve resultsshould consider adopting what’s working:vendor notifications and home-grown risk
management methods.

8/8/2019 Managing Business Risks From the Use of IT
http://slidepdf.com/reader/full/managing-business-risks-from-the-use-of-it 23/31
Managing Spend on Information Security and Audit for Better Results
22
Figure 21: Reports routinely produced to manage risk
Source: IT Policy Compliance Group, 2009
Risk scoring, assessment and analysisThe most common dashboard among best-in-class firms includes a simple CIA scoring system ranging from one to three,one to five, or one to 10. In some cases, simple color-coded schemes are employed among the best performingorganizations to flag divergence from desired risk profiles (Figure 22).
Figure 22: Risk Scoring, assessment and analysis
Source: IT Policy Compliance Group, 2009
Augmented by drill-downs across the range of critical business systems, controls and procedures, these risk scoring andanalysis systems are providing mangers with trends in operations and whether changes warrant further investigation andaction by the organization.

8/8/2019 Managing Business Risks From the Use of IT
http://slidepdf.com/reader/full/managing-business-risks-from-the-use-of-it 24/31
Managing Spend on Information Security and Audit for Better Results
23
In combination, the loss of confidentiality, integrity, and availability, the use simpler approaches to gauging the severity of impact to the organization, and analysis of the impact to mission and data criticality is resulting in far better outcomesamong the 60 percent or more of the best performers relying on these approaches for risk scoring and analysis.
By comparison, sophisticated financial loss calculations and even simpler business risk by threat calculations are notwidely employed. Moreover, the key difference between outcomes is clearly centered on scoring the loss of confidentiality,integrity and availability and the business impact of such degradations on the organization.
Managing business and financial risks from the use of ITManaging business risks from the use of IT is very different than the traditional approach employed for managing financial
risk. For example, the most common approach employed for managing financial risk depends upon the assumption of anormal distribution of negative and positive financial returns. The majority of returns, negative and positive, should fitwithin one-sigma. Attempting to manage better outcomes, most organizations try to shift the normal distribution to the righttoward more positive returns while minimizing the left (negative returns) for revenue and profit yield curves (Figure 23).
Figure 23: Approaches to managing financial and business risk
Source: IT Policy Compliance Group, 2009
The incentive for managing positive returns from the use of IT is traditionally associated with optimizing the availability of IT services, new application deployments, new technologies supporting more effective business procedures, and reducingexpenses that drive lower cost of sales, lower cost of goods sold, and lower general and administrative costs.
The mirror side of this, managing financial risks from the use of IT isdirectly related to managing the loss of confidentiality, integrity andavailability to information resources, assets and procedures. Unlike
managing risks for positive and negative outcomes, managing risk fromthe loss of confidentiality, integrity and availability is driven by reducingnegative outcomes at acceptable costs.
Of the three, only the availability of IT services stretches from the positive to negative side of the yield curve, oftenexpressed as the percentage of uptime (positive, 99.9 percent for example) and downtime (negative, 0.1 percent for example). However, managing financial risk from data loss and lapses in the integrity of controls in IT is different thantraditional financial risk management.
Rather than positive and negative outcomes associated with managing traditional financial returns, managing risk from theloss of confidentiality, integrity and availability is optimized when unacceptable negative outcomes are achieved atacceptable costs. The dominant approach to managing business risk from the use of IT is by ensuring risk controls areappropriately managed to reduce events that will otherwise lead to negative financial outcomes.
Managing financial risk from data loss andlapses in the integrity of controls in IT is different
than traditional financial risk management.

8/8/2019 Managing Business Risks From the Use of IT
http://slidepdf.com/reader/full/managing-business-risks-from-the-use-of-it 25/31
Managing Spend on Information Security and Audit for Better Results
24
Managing spend on information security for better outcomesSpend on information security varies by industry and size of organization. Spend increases with size of organization fromlows of four percent of the total IT budget to highs exceeding 10 percent of the total IT budget. However, IT budgets differ by industry and by size of organizations within each industry.
In addition, the relative spending on information security reveals an interesting finding. Organizations experiencing theworst outcomes with the most financial risk are spending 1.8 times more on information security than the seven in 10
organizations with normative outcomes. Furthermore, organizations with the best outcomes and the least financial risksfrom the use of IT are spending twice as much on information security that the seven in 10 organizations with normativeoutcomes (Figure 24).
Figure 24: Relative spending on information security
Source: IT Policy Compliance Group, 2009
Whatever the absolute amount being spent on information security is by a particular firm in a specific industry, the findingsreveal:
Most firms, seven in 10, are under-spending on information security
Organization with vastly different outcomes, worst and best, are spending nearly the same
For example, for every dollar being spent on information security by seven in 10 large organizations in banking or healthcare, there are two in 10 spending between 1.5 and 1.8 times more that are experiencing the highest rates of dataloss or theft, the most downtime from disruptions in IT and the worst problems with regulatory audit.
Conversely, those with the best track-records are spending between1.5 and 2 times more on information security. As a result, the researchclearly shows that to improve results:
Organizations with the worst outcomes need to reallocate currentspending toward practices that deliver better results
A majority of organizations need to increase spending on practicesthat deliver better results.
Financial returns for managing risks from the use of ITThe financial returns for improving practices for managing risks from the loss or theft of customer data, and the loss of productive time due to failures or disruptions in IT are depicted by Figure 11. The returns for seven in 10 organizationsoperating at the norm are more than 100 percent and for most are above 1,000 percent. Financial returns, above andbeyond self-sustained loss thresholds, are far above the typical 20 percent screens for evaluating alternatives for cash andinvestments (Table 6).
Organizations with the worst outcomes need toreallocate current spending for information
security on practices hat deliver better results,
while a majority of firms need to increasespending on practices that deliver better results.

8/8/2019 Managing Business Risks From the Use of IT
http://slidepdf.com/reader/full/managing-business-risks-from-the-use-of-it 26/31
Managing Spend on Information Security and Audit for Better Results
25
Table 6: Returns for improving data loss/theft and downtime results above self-sustained losses
Size (annualrevenue or budget) $50 million $500 million $5 billion $50 billion
Worst practices 960% 5,700% 51,000%% 540,000%
Normative practices 200% 1,130% 11,800% 136,500%
Best practices 22% 85% 450% 3,200%
Source: IT Policy Compliance Group, 2009
Financial returns for improving audit results in ITThe financial returns for improving the integrity of information, information assets, controls and audit results are fromreduced spending on audit fees and internal expenses, year in and year out. As shown, these returns increase to between35 percent and 52 percent annually, when organizations implement practices that improve confidentiality, integrity andavailability within IT (Figure 25).
Figure 25: Annual savings from improvements to integrity and regulatory compliance
Source: IT Policy Compliance Group, 2009
Actions and practices delivering better resultsThe financial returns for improvements to manage business and financial risks from the use of IT are far aboveself-sustained loss thresholds, and far above most financial screens. In fact, the returns are high enough that for mostorganizations, there is no need to conduct cost-justifications or cost benefit analysis.
Improvements from incremental spending to improve practices will yield large returns from annual savings on audit feesand expenses, and from the avoidance of predictable financial loss. Rather than thinking about the amount being spent,organizations should be focusing on the amounts being saved, and how much yield can be purchased.
The actions and practices tied to reallocation of current spending, and increases where needed, include::
Establishing goals and objectives for managing operational outcomes and financial risk from the use of IT
Managing spending for the practices that actually reduce risk
Establishing goals and objectives for reducing spend on regulatory audit
Organizing for success by:
- Having the Chief Information Security Officer (CISO) manage information security and compliance
- Placing the IT operations officer or manager in charge of the availability of IT services
- Engaging senior leadership from IT, legal, business and plant security to manage risks

8/8/2019 Managing Business Risks From the Use of IT
http://slidepdf.com/reader/full/managing-business-risks-from-the-use-of-it 27/31
Managing Spend on Information Security and Audit for Better Results
26
Taking specific actions, including:
- Prioritizing and managing the business risks
- Improving IT controls and procedures to manage the business risks
- Automating the collection of IT audit data
- Increasing the frequency of monitoring, assessments and reporting to weekly and bi-monthly
Automating more IT controls to manage risks, especially:
- Technical IT security controls
- Authorized user account controls
Scoring business risks from the use of IT based on:
- Loss of confidentiality, integrity and availability
- Severity of business and mission impact
Routinely using dashboards for reporting on business risks from the use of IT that include:
- Operational quality level reports
- Financial and business impact summaries
- Policy compliance reports
- Legal and regulatory impact reports
- Real-time event reports
- IT audit test reports
- IT security test reports
8/8/2019 Managing Business Risks From the Use of IT
http://slidepdf.com/reader/full/managing-business-risks-from-the-use-of-it 28/31
Managing Spend on Information Security and Audit for Better Results
27
About the ResearchTopics researched by the IT Policy Compliance Group (IT PCG) benchmarks are part of an ongoing calendar establishedin consultation with advisory members, general members, and supporters of the Group, as well as from findings compiledfrom ongoing research. In addition to specific tracking questions common to each benchmark, the research is designed touncover the relationship between business results, the actions organizations have taken in response to businesspressures, and the capabilities these organizations have to respond to business pressures.
This report includes research findings that date back more than two years, as well as findings from recent benchmarksconducted in the past six months. The findings related to outcomes being experienced in IT, spending on regulatory
compliance, and industry performance profiles are compilations of benchmarks across 2,648 organizations. The financialloss and return findings are from benchmarks conducted with 1,260 organizations. The most recent findings focusing onthe primary business and financial risks along with actions organizations are taking to manage these risks are frombenchmarks conducted with 481 organizations between September and October 2008. Findings from benchmarks on theorganizational structure for IT security, conducted with 253 organizations completed in December 2008, are also included.
A majority of the organizations (90 percent) participating in the benchmarks are located in North America and theremaining ten percent of the participants come from countries located in Africa, Asia Pacific, Europe, the Middle East andSouth America. The financial risks and audit costs of this research are applicable to public and private organizationsoperating in North America. In addition, the operating outcomes and results apply equally well to organizations thathappen to be located in other industrialized geographies from around the world. Although the magnitude of financialoutcomes differs by geography and currency, the practices needed to manage lower financial risk, loss and cost for auditsare independent of geography or currency. As a result, the key recommendations focusing on the practices are applicableto most organizations and areas of the world where IT services are embedded as part of common business procedures.
Industries representedAlmost every industry has participated in the benchmark, including accounting services, advertising, aerospace,agriculture, apparel, architecture, automotive, banking, chemicals, computer equipment and peripherals, computer software and services, construction, consumer durable goods, consumer electronics, consumer packaged goods,distribution, education, engineering services, financial services, general business and repair services, government (local,state and federal level public administration), government (defense and intelligence), health, medical and dental services,insurance, law enforcement, legal services, management services, scientific and consulting services, manufacturing,medical devices, metals and metal products, mining, oil and gas, paper, timber and lumber, pharmaceuticals, publicrelations, publishing, media and entertainment, real estate, rental and leasing services, retail trade, telecommunicationsequipment, telecommunication services, transportation and warehousing, travel, accommodation and hospitality services,utilities, waste management and wholesale trade. The largest industries represented by the benchmark findings arehealthcare, financial services and manufacturing, each of which account for eight percent of participating organizations.
Education and government (public administration at local, state and federal levels) each represent six percent of thesample. All other industries account for less than five percent of benchmark participants.
Revenue of participating organizationsThirty-three percent of the organizations participating in the benchmark have annual revenues or budgets that are lessthan $50 million. Another 31 percent have annual revenues or budgets that are between $50 million and $999 million. Theremaining 36 percent have annual revenues or budgets that are $1 billion or more.
Functional areas of responsibilityForty four percent of the participants work in IT, 28 percent of participants work in finance and internal controls, and 23percent work in legal and compliance functions within their organizations. The remaining eight percent of qualifyingparticipants work in a wide range of job functions, including senior managers in customer service, sales, marketing,manufacturing and development functions.
Job titles of participantsTwenty three percent of the participants in the benchmarks are senior managers, 16 percent are vice presidents, 37percent are managers or directors, and 24 percent are staff.
8/8/2019 Managing Business Risks From the Use of IT
http://slidepdf.com/reader/full/managing-business-risks-from-the-use-of-it 29/31
Managing Spend on Information Security and Audit for Better Results
28
About IT Policy Compliance GroupThe IT Policy Compliance Group is dedicated to promoting the development of actionable findings that will helporganizations meet their IT policy and regulatory compliance objectives. The Group Web site atwww.itpolicycompliance.com features content by some of the leading experts in the world of IT and regulatory complianceinteractive self assessment tools, published research reports, resource links and educational seminars being conductedaround the World.
The Group’s research is designed to help IT, legal, financial, and internal control professionals to:
Benchmark results and efforts against peers and best-in-class performers
Identify key drivers, challenges, and responses to improve results Determine the applicability and use of specific capabilities to improve results
Identify best practices based on results of the benchmarks
The Group relies upon its advisory members, associate members, supporting members and significant benchmark findingsto drive its research and editorial calendar.
IT Policy Compliance Group Supporters
Symantec Corporation The Institute of Internal Information Systems Audit andAuditors Control Association
20330 Stevens Creek Boulevard 247 Maitland Avenue 3701 Algonquin Road, Suite 1010Cupertino, CA 95014 Altamonte Springs, FL 32701 Rolling Meadows, IL 60008+1 (408) 517 8000 +1 (407) 937 1100 +1 (847) 253 1545www.symantec.com www.theiia.org [email protected] [email protected] [email protected]
Computer Security Institute Protiviti IT Governance Institute600 Harrison Street 1290 Avenue of the 3701 Algonquin Road, Suite 1010San Francisco, CA 94107 Americas, 5th Floor Rolling Meadows, IL 60008+1 (415) 947 6320 New York, New York 10104 +1 (847) 660 5600www.gocsi.com +1 (212) 603 8300 [email protected] www.protiviti.com [email protected]

8/8/2019 Managing Business Risks From the Use of IT
http://slidepdf.com/reader/full/managing-business-risks-from-the-use-of-it 30/31
Managing Spend on Information Security and Audit for Bet

8/8/2019 Managing Business Risks From the Use of IT
http://slidepdf.com/reader/full/managing-business-risks-from-the-use-of-it 31/31
Founded in 2005, the IT Policy Compliance Group conducts
benchmarks that are focused on delivering fact-based guidance
on the steps that can be taken to improve results. Benchmark
results are reported through www.itpolicycompliance.com for the
benefit of members.
IT Policy Compliance Group
Contact:
Managing Director, Jim Hurley
Telephone: +1 (216) 373 [email protected]
www.itpolicycompliance.comFebruary 2009
The information contained in this publication has been obtained from sources that the IT Policy Compliance Group believes to be reliable, but is not