managing biodiversity information: development of new ... · managing biodiversity information:...
TRANSCRIPT
1WISER ET AL.: MANAGING BIODIVERSITY INFORMATION
REVIEW ARTICLE
Managing biodiversity information: development of New Zealand’sNational Vegetation Survey databank
Susan K. Wiser, Peter J. Bellingham and Larry E. BurrowsLandcare Research, P.O. Box 69, Lincoln 8152, Canterbury, New Zealand (E-mail: [email protected])
Abstract: The National Vegetation Survey (NVS) databank is designed to safeguard the investment of millions ofdollars spent over the last 50 years collecting, computerising and checking New Zealand vegetation data and tooptimise the potential knowledge gains from these data. Data such as these can be synthesised across a range of spatialand temporal scales, allow novel ecological questions to be considered, and can underpin land management and legalreporting obligations. The NVS databank builds largely on the base of data collected under the auspices of the NewZealand Forest Service from the 1940s to 1987. In more recent years, it has incorporated data from Protected NaturalArea (PNA) surveys and from new and remeasured plots in a range of ecosystems collected by staff of, among others,the Department of Conservation, Landcare Research, regional councils and universities. The databank currently storesdata from approximately 14 000 permanent plots, 52 000 reconnaissance descriptions and PNA plots, and 14 000timber volume plots measured in the 1940s and 1950s. Ecosystems that are best represented are grasslands in montaneand alpine areas and indigenous forests. Geographic coverage is widespread but patchy. As the NVS databankcontinues to develop and grow, a range of data management issues are being addressed. These include (i) developingmechanisms to meet the needs of both data users and data providers and incentives to encourage individuals andorganisations to deposit data into the databank, (ii) ensuring that metadata are adequate to allow raw data to beinterpreted, and (iii) ensuring that the data stored meet set quality standards. In the future, the databank will takeadvantage of changing technology to best meet the needs of data users and providers. Further information about theNVS databank can be obtained from www.landcare.cri.nz/science/nvs.Keywords: biodiversity information; data archive; data management; database; environmental monitoring; informationscience; metadata; New Zealand; permanent plots; vegetation.
Introduction
Data from a broad range of scales are vital if we are toaddress many of the issues at the forefront of ecology(Michener et al., 1997). Such issues often require moredata than an individual or team of researchers couldcollect. In New Zealand, syntheses of broad-scale datahave been used to formulate and test hypotheses aboutfactors controlling vegetation structure and composition(e.g., Holloway, 1954; McKelvey, 1963; Osawa andAllen, 1993; Leathwick et al., 1998; Bellingham et al.,1999). More recently, such syntheses have allowednational-scale issues to be considered that were notanticipated at the time of data collection, such as howmuch carbon is stored in indigenous forests (e.g., Hall etal., 2001). The existence of long-term data from permanent
plots has allowed consideration of questions about forestdynamics (e.g., Mark et al., 1991; Smale et al., 1995),weed invasion in grasslands and forests (e.g., Scott,1993; Wiser et al., 1998), and grazing impacts in non-forest ecosystems (e.g., Dickinson et al., 1992).
Worldwide, efforts are ongoing to ensure thatvegetation data are well documented, archived and madeaccessible (Table 1). In New Zealand, such efforts areseen as increasingly important by agencies that fund datacollection, or use such data to support policy decisionsand assess compliance with legal obligations(Whitehouse, 1998). New Zealand has a range ofinternational reporting requirements as a signatory to theConvention on Biological Diversity and the FrameworkConvention on Climate Change, and as a participant inthe Forest Resource Assessment of the Food and
New Zealand Journal of Ecology (2001) 25(2): 1-17 ©New Zealand Ecological Society

2 NEW ZEALAND JOURNAL OF ECOLOGY, VOL. 25, NO. 2, 2001
Table 1. Examples of international efforts to document, archive and increase access to vegetation data. Vegetation data may be themain emphasis in some or included among a range ecological data. Data include both those from one-off surveys and from permanentplots.Organisation and Project Scope Internet address (URL)
Ecological Monitoring and Provides a metadata search facility to allow http://metadata.cciw.ca/search/main_e.htmlAssessment Network searches for ecological data sets available(EMAN, Canada) from around the world.
National Biological Information Electronic gateway to biological data and http://www.nbii.gov/Infrastructure (NBII), U.S.A. information maintained by U.S. federal, state
and local government agencies and privatesector organisations and other parties around theworld.
Ecological Archives of the Stores data sets of ecological significance http://esapubs.org/archiveEcological Society of America described in, or supplemental to, papers
published in Ecology, Ecological Monographs,and Ecological Applications.
TROPIS - Tree growth and Maintains a searchable index of people and http://www.cifor.cgiar.org/tropis/permanent plot information institutions worldwide that hold permanent plotsystem data in both plantations and natural forests.
U.S. Long Term Ecological Umbrella organisation for 24 research sites http://lternet.eduResearch (LTER) Program in the U.S.A. Sites independently manage
their own long-term data (e.g., from permanentvegetation plots, animal censuses, climate data).
Environmental Change Network The U.K.’s long-term environmental http://www.nmw.ac.uk/ecn/data_info.htm(ECN) (United Kingdom) monitoring programme. It collects, stores,
analyses and interprets long-term data from arange of terrestrial and freshwater sites acrossthe U.K.
Center for Tropical Forest Science Provides data from a number of the 50-ha http://www.ctfs.si.edu/(CTFS) of the Smithsonian Forest Dynamics Plots. Within each plot, treesTropical Research Institute are identified, marked, measured and plotted
on a map.Canada’s National Forest Inventory Intends to provide access to data collected http://www.pfc.cfs.nrcan.gc.ca/monitoring/inventory
(Natural Resources Canada, from a plot-based inventory system acrossCanadian Forest Service) Canada.
National Vegetation Information Developing a national framework for http://www.affa.gov.au/docs/rural_science/nfi/nvis/System (NVIS) compiling and communicating information
about Australia's vegetation.French National Forest Inventory Access to cartographic, mensuration and http://www.ifn.fr/
(Inventaire Forestier National, ecological information collected throughoutIFN), Countryside and Forestry France.Department
U.S. Man and the Biosphere Developing databases of vascular plant and http://ice.ucdavis.edu/mab/(U.S. MAB) Program, in vertebrate animal occurrences on the world’sassociation with the Information biosphere reserves and other protected areas.Center for the Environment
National Vegetation Map of Vegetation survey data from sites across http://www.nbi.ac.za/research/vegmap.htmsouthern Africa Project South Africa.
Nordic vegetation survey Aims to coordinate analysis, description and http://hjem.get2net.dk/lawesson/The%20Nordicclassification of Nordic vegetation. Participants %20vegetation%20survey.htmhave agreed upon a common concept of datasampling, storage, quality control and analysis.
Natural Heritage Network (U.S.) Comprises 85 biodiversity data centres http://www.abi.org/throughout the Western Hemisphere (mostly inthe U.S.A.). Personnel collect, organise andshare data using a common, standards-basedmethodology. The network helps provideinformation for land-use decisions and is alsoconsulted for research and education.

3WISER ET AL.: MANAGING BIODIVERSITY INFORMATION
Agriculture Organisation (FAO) and the Montreal Process(both related to sustainable forest management) (seeBellingham et al., 2000). Domestically, governmentagencies are charged with ensuring compliance with keyenvironmental laws [such as the Conservation Act 1987,Resource Management Act 1991 and the Forests Act1949 (and 1993 amendments)]. Accessible vegetationdata of known quality are required to meet theseobligations. In recent years, the resurgence of interest invegetation monitoring has resulted in a proliferation ofdata collected and stored locally (e.g., by Department ofConservation conservancies, territorial local authoritiesand private consultants). However, these data are oftennot archived or made accessible in ways that allow issuesspanning larger temporal or spatial scales to be considered.Adequate documentation and storage of data are especiallyimportant in long-term studies based on permanent plots(Brunt, 1994).
In New Zealand, the National Vegetation Survey(NVS) databank stores, manages and provides access toa large portion of the data on vegetation composition andstructure collected in this country over the last 50 years.Other important vegetation databases in New Zealandinclude the South Island high country monitoring datacurrently held by Knight Frank (NZ) Ltd. (Webster,1994) and data held by Timberlands West Coast Ltd. Amyriad of smaller vegetation data sets are held byindividuals at universities, in private consultancies, withinnational and local government agencies and CrownResearch Institutes [see Meurk and Buxton (1991) andBellingham (1996) for partial listings]. Some importantvegetation data are not available electronically [e.g.,North Island Ecological Transects: McKelvey andCameron (1958); data from an extensive survey of StewartIsland: Wilson (1987)].
In this paper we describe the history of standardisedcollection of vegetation data in New Zealand and theresulting evolution of the NVS databank from paper tothe current electronic version. We then characterise thetypes of data stored in the databank, including thegeographic, ecosystem and temporal coverage. Finally,we outline future plans for the databank, including plansfor meeting needs of both data users and providers,expanding metadata and quality control, and enhancingflexibility and utility.
Evolution of a New Zealandvegetation databank
History of collection of standardised vegetation data
Leonard Cockayne provided the first comprehensivedescriptions of New Zealand plant communities (e.g.,Cockayne, 1899; 1928). Later, he extended these
descriptions to include changes in plant communitiesover time, based on observations from permanentlymarked sites (e.g., Cockayne and Calder, 1932). Formalnational surveys of New Zealand’s vegetation began in1923 with the National Forest Inventory, a standardisedinventory of the country’s forests to assess their potentialtimber yield (Anon., 1926). The second standardisedsurvey was the National Forest Survey (NFS) of 1946-55,which was primarily a timber inventory but ecologicaldata were also collected (Thomson, 1946; Masters et al.,1957). It mainly covered lowland and mid-altitude forestsfrom which timber could be extracted, with limitedcoverage of upland forests. In 1956/57 this coverage wasextended by the North Island Forest Ecological Survey(Ecosurvey) which provided comprehensive ecologicalinformation on forests not surveyed in the NFS(McKelvey, 1995). The NFS and Ecosurvey provided thefoundation for a community classification of New Zealandforests (e.g., Nicholls, 1976; McKelvey, 1984).
The increasing focus on the role of natural forest andgrassland ecosystems in protecting catchments and thevulnerability of these to the effects of browsing mammalsushered in an era of vegetation monitoring. Standardisedmethods were developed and later refined for forests,grasslands and other non-woody ecosystems (Hollowayand Wendelken, 1957; McKelvey and Cameron, 1958;Wraight, 1962; Scott, 1965; Atkinson, 1975; Wardle andGuest, 1977; Batcheler and Craib, 1985; Dickinson et al.,1992; Allen, 1993; Wiser and Rose, 1997). Vegetationcommunities were described in many parts of New Zealandwhere standardised survey data were scant (e.g., Kelly,1972). Based on methods in widespread useinternationally (e.g., Mueller-Dombois and Ellenberg,1974), standard methods using reconnaissancedescriptions were tailored to New Zealand ecosystemsand adopted for general surveys and for data collection inthe Protected Natural Areas (PNA) Programme (e.g.,Myers et al., 1987; Allen, 1992).
In 1987 the Department of Conservation (DOC) wasestablished. This was during a time of upheaval in theNew Zealand civil service (Kelsey, 1997) and staffturnover was high. During the late 1980s and early1990s, vegetation survey and monitoring was a relativelylow priority for the Department (Bellingham, 1996),although some national initiatives continued, notably thePNA Programme. A result was the loss of many skilledstaff who had undertaken vegetation surveys. Staffattrition resulted in a loss of institutional memory and aloss of appreciation of the value of major data sets(Bellingham, 1996). This led to some unfortunate lossesof irreplaceable vegetation data during this period. Parallelevents and loss of data also occurred in some researchinstitutes and other government agencies.
In the early 1990s, standardised data collectioncontinued in a piecemeal fashion by individuals ingovernment agencies, universities, private consultancies
4 NEW ZEALAND JOURNAL OF ECOLOGY, VOL. 25, NO. 2, 2001
and research institutions. Starting in 1997, newmanagement procedures within DOC led to a revival ofvegetation survey and monitoring, and the Departmentbegan to rebuild the requisite skill base. Standard methodsare now being used increasingly within DOC to ensurecomparability of results. Regional and local authorities,too, are placing more emphasis on vegetation survey andmonitoring to meet requirements of the ResourceManagement Act 1991.
Development of a physical archive and electronicdatabank
From the late 1960s, access to mainframe computersenabled the organisation of data collected using standardmethods into defined electronic data formats. This madeit possible to analyse large amounts of data fromthroughout New Zealand (e.g., Wardle, 1970). The ForestResearch Institute (FRI) and, from the early 1970s to1986, the New Zealand Forest Service, adopted standardmethods of data collection for reconnaissance surveysand permanent plots in forest and grassland. Concurrently,FRI developed standard formats for electronic data entryand storage, and computer packages for data checkingand analysis (Allen et al., 1983; Hall and Allen, 1985).From the early 1980s, data were collected and enteredusing these standard formats for many of thereconnaissance descriptions used in PNA surveys (e.g.,Arand and Glenny, 1990). At that time, however, computerfiles and data sheets were held in offices and storeroomsthroughout New Zealand.
In the late 1980s, the creation of the NIVS (NationalIndigenous Vegetation Survey) database formalised theprocess of obtaining and archiving electronic data, copiesof original field data sheets, maps, aerial and plotphotographs, ancillary information and reports at FRI inChristchurch (Payton et al., 1988; Forest ResearchInstitute, 1989). The NIVS database also included datafrom plot types such as variable area forest plots (Batchelerand Craib, 1985) and those collected using the cruciformmethod (Holloway and Wendelken, 1957). Hard copiesof data sheets and ancillary information were organisedin a central archive and arranged by ecological region anddistrict to allow ready retrieval. At that time, the electronicdatabase and analysis packages could be accessed (read-only) by anyone linked to the Ministry of Forestry VAXcomputer system. Later, 14 reports produced for DOClisted all available data sets for each Conservancy (e.g.,Hall et al., 1991).
The NIVS database and staff associated with itsdevelopment and maintenance transferred from FRI toLandcare Research when it was established in 1992.Agreement was reached that copies of NFS data (plotsheets and electronic data) and attendant maps anddocumentation would form part of NIVS. To adapt to
changing technology, data analysis packages wererewritten to allow them to be run from personal computers(e.g., Hall, 1994a, b).
In 1997, the vegetation database was renamed theNational Vegetation Survey (NVS) databank andincorporated data from the NIVS and NFS (NFS andEcosurvey data: Forest Research Institute, 1989)databases and reconnaissance descriptions collected bythe PNA Programme. The name reflects the intention toencompass data spanning a wide range of New Zealand’svegetation types including communities where eitherindigenous or exotic plants dominate. In 1998, theFoundation for Research, Science and Technologyaccorded the NVS databank the status of a NationallyImportant Database, and since 1999 has funded itsmaintenance.
The NVS databank has two primary functions. Thefirst is to serve as a national archive into which data canbe deposited with confidence that future retrieval will bestraightforward, and that, with provisos, these data maybe made available to others. The second is to achieve asmuch consistency as possible in the manner in which dataare stored and accessed to allow ready analysis ofcombined data sets that span space and time.
What data are stored in the NVSdatabank?
The NVS databank pertains largely to vascular plants.Data have been collected from both permanent plots andone-off surveys (e.g., reconnaissance surveys, PNAsurveys and the NFS). The databank is not a singleagglomerative database; rather, it is composed ofindividual data sets pertaining to individual surveys.These are mostly groups of plots (range 1 to c. 1000)within a defined survey area collected over a set timeperiod. Most data from permanent plots in indigenousforests have been collected from 20-m x 20-m plots,within which individual stems are tagged (Allen, 1993).Data also include seedling and sapling counts. Forgrasslands, permanent plot data consist of frequencymeasurements of all vascular plant species, stature anddensity of dominant tussock species, andstereophotographs (Wiser and Rose, 1997). Data fromreconnaissance descriptions, including those collectedunder the auspices of the PNA Programme, includeassessments of abundance of each species in a given area.Some reconnaissance descriptions are associated withpermanent plots. On all plot types site attributes such asaltitude, slope and aspect have usually been recorded.Spatial location coordinate data (recorded to the nearest100 m) are present for ~95% and ~65% of the permanentforest and grassland plots respectively, for all NFS and

5WISER ET AL.: MANAGING BIODIVERSITY INFORMATION
Ecosurvey plots, and for 80% of the reconnaissancedescriptions from reconnaissance and PNA surveys.
Currently the databank contains data from ~10 000permanent plots in forests, of which ~6500 are 20-m x20-m plots, and of these, ~2100 (34%) have beenremeasured at least once. There are data from ~3800permanent grassland transects [most follow methods ofWraight (1962)], and of these ~390 (10%) have beenremeasured. Data collected under the auspices of NFSand Ecosurvey comprise 14 000 plots. The databank alsocontains data from ~52 000 reconnaissance descriptions(PNA Programme included); of these ~9000 (17%)represent repeat measurements, usually associated withpermanent plots. Hard copies of data sheets completedduring field surveys and ancillary material such as mapsand aerial photographs showing plot locations are storedin the herbarium (CHR) at Landcare Research, Lincoln.Archiving hard copy as well as electronic data is essential;there are many unfortunate stories of the loss of databecause of the dependence on electronic media alone(e.g., Michener et al., 1997). Also, hard copies of datasheets normally contain information such as locationmaps, that is not computerised.
For most data entry, checking, storage, analysis andexport, the NVS databank currently uses a computersystem designed in the 1980s and refined continuallysince. Most data are entered via REFLEX (BorlandInternational, 1989), a database management system. Forstorage and analysis, data are converted to standardisedcondensed formats of ASCII text. Data of different types(e.g., tree diameters, sapling and seedling counts, speciescomposition) from the same survey are stored in fileshaving the same name, but different extensions. Suchcondensed formats were required in the 1980s whenelectronic storage space was limited. Programs for datachecking and analyses are written in FORTRAN (e.g.,Hall, 1994a, b) and remain available for a nominal costfrom Landcare Research (see URL: www.landcare.cri.nz/science/nvs). These programs also allow export ofsummarised data to other formats [e.g., suitable for analysisby statistical packages, and vegetation analysis programssuch as CANOCO (ter Braak and Šmilauer, 1998) andTWINSPAN (Hill, 1979)]. Programs have been written inSASTM (SAS Institute, 1999) to readily manipulate andcombine these ASCII files, and to export and import datato and from a wider range of file types (e.g., MS-ACCESS,MS-EXCEL, tab-delimited). A Microsoft Windows-basedplatform for data entry and management in a relationaldatabase system is currently being developed. Electronicfiles in the NVS databank are stored on a Digital Prioris HX200 MHz Pentium Pro server using Novell Netware version4.11 at Landcare Research, Lincoln. Back-ups are madeevery night with a full back-up performed twice a week.Monthly back-ups are stored in a fire- and earthquake-proof room in a separate building.
Geographic and ecosystem coverage
Forests and grasslands dominated by indigenous speciesare well represented by permanent-plot data in the NVSdatabank. Indigenous ecosystems that are either poorlyor not represented by permanent plots are subalpine andsuccessional shrublands, freshwater and estuarine wetlandsand turfs. Across the two main islands, geographic coverageof permanent plots in indigenous forests is widespreadbut patchy, with some areas well represented (e.g.,Fiordland, southern North Island forests) and others poorlyrepresented (notably Northland, inland Taranaki andnorth Westland) (Fig. 1). In general, upland areas arebetter represented by permanent plots than are lowlandareas. The NVS databank also includes data from plots inforests of the Chatham, Kermadec and Stewart islands.Grasslands in montane and alpine areas are well representedand coverage is strongest in wetter regions and on landmanaged by DOC. Grasslands in drier regions of NewZealand, especially the induced grasslands in the easternSouth Island, are poorly represented, and no permanent plotdata are held for indigenous lowland and coastal grasslands.
Data from one-off surveys (e.g., reconnaissance,PNA, NFS) are more comprehensive in geographiccoverage and the range of vegetation types sampled.One-off surveys include data from coastal turfs to high-altitude grasslands, and both woody and non-woodyvegetation. Reconnaissance descriptions are concentratedon land administered by DOC, and in terms of absolutenumbers there is geographic bias towards some areas(e.g., South Westland).
Temporal coverage
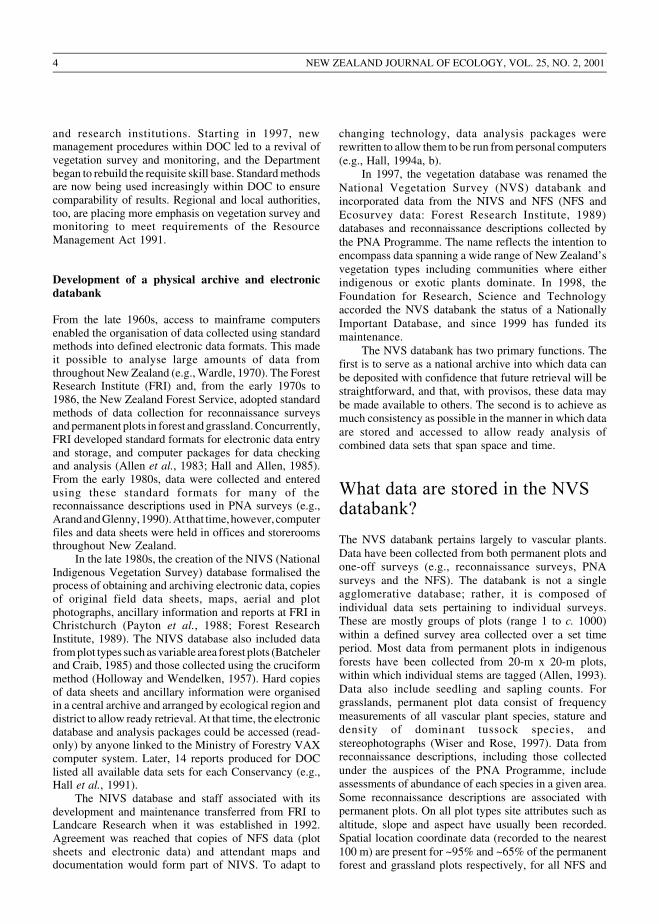
Most permanent plots in grasslands were established in the1960s and 1970s and in forests in the 1970s and 1980s(Fig. 2). With time, these data comprised an increasingproportion of plot remeasurement data versusestablishment data. Most reconnaissance survey data werecollected in the 1970s and 1980s, and PNA data in the1980s. Fewer plots are represented in the databank by datafrom the 1990s, reflecting the lower level of data collectionduring that decade (Fig. 2).
Permanent plots, especially those with a history ofmeasurement, can provide benchmarks against which toassess long-term change in ecosystems (Bakker et al.,1996). The NVS databank contains data from some especiallynotable permanent-plot surveys from forests. These have anaverage measurement span of 21 years (Table 2). Most usedsimilar methods, with plots systematically spaced alongrandomly located transects. As such, they record the averagedynamics and stand structure of the catchment. The databankalso holds data from other notable permanent forest plotnetworks, including data sets from the OrongorongoValley (Campbell, 1990) and the Hunua Ranges. These toohave outstanding histories of measurement, but were basedon different sampling regimes.

6 NEW ZEALAND JOURNAL OF ECOLOGY, VOL. 25, NO. 2, 2001
Figure 1. Locations of plots for which data are stored in the NVS databank, and location data is present, as of December 2000. Theseare overlain on areas mapped as either forest, scrub or tussock grassland by the Landcover Database (derived from a classificationof SPOT satellite imagery acquired in the summer of 1996/97); (a) North Island, (b) South and Stewart islands. Variable area plots,NFS and Ecosurvey plots are excluded.

7WISER ET AL.: MANAGING BIODIVERSITY INFORMATION

8 NEW ZEALAND JOURNAL OF ECOLOGY, VOL. 25, NO. 2, 2001
Progress in archiving new data
Efforts to procure copies of important historical data setsare ongoing. This is particularly important when peopleretire or change jobs. At such times, lifetime collectionsof data are at risk of being lost or forgotten. Currently,archival of new data focuses on types of data alreadystored in the databank. NVS lacks data from other widelyused methods, notably data from height-frequencytransects (Scott, 1965; Dickinson et al., 1992) and foresttransects (McKelvey and Cameron, 1958). Future effortswill focus on incorporating these types of data, and datafrom permanent plots with a notable history ofmeasurement (e.g., Calder and Wardle, 1969).
Where to go from here
The overall goal of the NVS databank is to safeguardmillions of dollars worth of past investment in data andthus facilitate knowledge gains from these data. Theunique time-series record from permanent plots and one-off vegetation records from the past are irreplaceable and
become more valuable with time. For this goal to beachieved, and to become a truly national resource, theNVS databank must be seen as the logical place for long-term storage of vegetation data and the first port-of-callwhen such data are sought (e.g., for design of monitoringprogrammes and for information on vegetation status).Current barriers to achieving this goal, some real, othersperceived, include issues surrounding rights of datausers and providers, provision of adequate metadata tointerpret raw data, assurance of data quality andtechnological issues. These are detailed below.
Meeting needs of both data users and providers
As advances in technology have simplified storage andtransfer of electronic data, issues of data access, ownershipand intellectual property rights have emerged worldwide(e.g., Frankel, 1999). The NVS databank data-accesspolicy has attempted to strike a balance between makingdata freely available and protecting the rights of dataproviders. The databank does not ‘own’ data; rather itserves as an intermediary between data providers anddata users (cf. Nash, 1993). Data providers can set
Table 2. Local networks of 20-m x 20-m plots sampling indigenous forest catchments, having data spanning at least 14 years storedin the NVS databank and the most recent measurement since 1992. Localities of plot networks are ordered from north to south.Locality Latitude, Longitude Number of plots DurationPirongia 37o59'S, 175o02'E 20 20 years (1979-1999)Okataina 38o08'S, 176o27'E 36 17 years (1983-2000)North Pureora 38o23'S, 175o35'E 28 18 years (1975-1993)Kaimanawa 39o12'S, 175o59'E 30 18 years (1982-2000)Kaweka 39o15'S, 176o25'E 140 14+ years (1981-(1995-1999))Ruahine (Pohangina Valley) 40o03'S, 176o02'E 10 21 years (1975-1996)Southern Tararua1 41o01'S, 175o12'E 10 22+ years (1975-(1996-1999))
5 14 years (1985-1999)Hurunui 42o43'S, 172o01'E 102 25+ years (1975-(2000-2001))Kokatahi 42o57'S, 171o12'E 22 23 years (1972-1995)Whitcombe2 43o05'S, 171o01'E 23 27 years (1972-1999)Craigieburn2 43o10'S, 171o35'E 250 30 years (1970-2000)Okarito3 43o13'S, 170o16'E 32 14 years (1983-1997)Arawata (Waipara) 44o15'S, 168o41'E 4 29 years (1971-2000)Kaipo 44o26'S, 167o53'E 10 15 years (1984-1999)Caples-Greenstone 44o55'S, 168o14'E 38 22+ years (1976-(1997-2000))Murchisons 45o18'S, 167o38'E 5 29 years (1969-1998)
34 23 years (1975-1998)Waitutu 46o12'S, 167o04'E 107 19+ years (1978-(1997/1998))Longwood4 46o13'S, 167o50'E 42 20+ years (1977-(1997/1998))North east Stewart Island 46o47'S, 167o59'E 23 24 years (1976-2000)North Stewart Island 46o47'S, 168o00'E 47 18 years (1981-1999)Bench Island 46o54'S, 168o15'E 5 20 years (1979-1999)
Σ = 984 Average = 21 yearsRemeasurements most recently conducted by the Department of Conservation (or its contractors) except by: 1Wellington RegionalCouncil; 2Landcare Research (funded by FRST); 3Timberlands West Coast (plots located on a grid within the catchment rather thanalong randomly located transects); 4Waikato University.Note that the Ruahine and Tararua data sets are small subsets, remeasured in the 1990s, of very large (> 100 plot) surveys establishedin the 1970s and 1980s. Likewise, the Murchisons data set is a subset of a much larger North Fiordland original data set from a surveycovering several of the ranges of northern Fiordland.

9WISER ET AL.: MANAGING BIODIVERSITY INFORMATION
conditions of use. Data users agree to a set of obligationsthat govern use of data (e.g., concerning citation, provisionof data to third parties etc.; see Appendix 1). Worldwide,such agreements are becoming standard, particularly forlarge databanks.
Much of the data stored in the NVS databank (i.e.,data designated as nationally important) lies in the publicdomain. This includes most data collected before 1987(when DOC was formed). The policy of Landcare Researchregarding access to these data is aligned with the policy fornational databases and collections owned by CrownResearch Institutes. That policy was developed by theCrown Company Monitoring Advisory Unit in 1996/97and is designed to provide access to these data for publicgood or personal use, except where the access is clearly notto the benefit of New Zealand (Whitehouse, 1998). Requestsfor public domain data can be met on the basis of cost ofsupply (e.g., costs of downloading electronic archives,determining any restrictions on distribution of data,photocopying original data sheets). Costs may range fromnominal for simple queries to significant whereconsiderable manipulation of data is required. For privategood or commercial use other restrictions and costingsmay apply; these are handled on a case-by-case basis.
The NVS databank also stores data to which accessis restricted by the data provider (Appendix 1). There aretwo levels of restriction. The first, and most common, isthat access is contingent on permission from the dataprovider. Data providers may be individual researchersor institutions (e.g., DOC). This restriction protects theproprietary rights of data providers and is in accord withthe recommendations of Nash (1993) that the generatingresearcher(s) or institution(s) should control access totheir data. In most cases this is formalised via amemorandum of understanding with the data provider.Access restrictions have been put in place because withoutthem many providers will not agree to store their data inthe NVS databank. The second level of restriction isreserved for confidential or commercially sensitive data,where the NVS databank functions as a data archive only.For individual data sets, data access levels are periodicallyreviewed. With time, and agreement of their owners, it isexpected that many currently protected data sets willmove from restricted access into the public domain.
Preparing a data set for deposit requires some effort toensure it is properly documented, hard copies or ancillaryinformation are available and the data are properlyorganised. Clearly, there are advantages to being a datauser; less clear are the advantages to data providers. Thisis a problem faced by databank projects worldwide, andthe solution is to have tangible rewards for data providers(Porter and Callahan, 1994). These could include provisionof resources by funding agencies or databank managers tosupport technical services, such as data entry and qualityassurance, allowing data providers preferential access to adatabank and ensuring that data providers receive adequate
recognition for their efforts (Porter and Callahan, 1994).Recognition may include acknowledgement inpublications, collaboration and co-authorship of anypublications based on their data (or the right to publish adisclaimer), and acknowledgement on the databankwebsite. In response to the recognised lack of incentive fordata providers, the Ecological Society of America hasadopted a policy to encourage publication of ‘data papers’.Such papers emphasise the “collection, organisation,synthesis and thorough documentation of data sets ofecological value” (Peet, 1998). The data will be stored inEcological Archives (Table 1). Providing better incentivesto data providers is an area that needs to be pursued topromote archival of New Zealand vegetation data.
Metadata
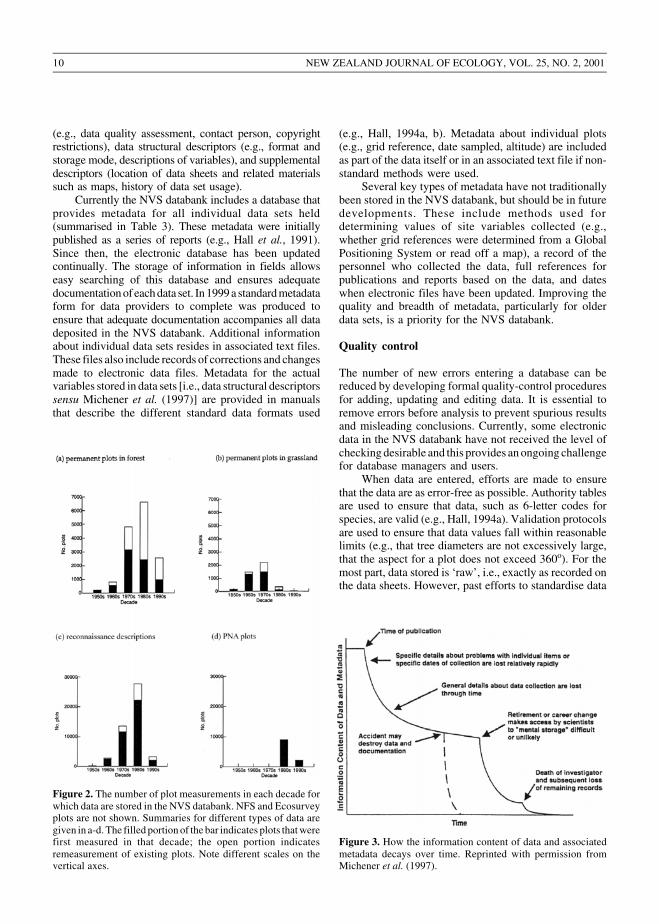
Metadata are the descriptive information about the data.Comprehensive metadata should describe what data arestored, why and how they were collected, their quality,their structure and storage medium and how they can beaccessed (Michener et al., 1997; Michener, 1998).Metadata are essential for two primary reasons (Conleyand Brunt, 1991; Stafford, 1993; Hale, 2000). First,metadata provide the information required for long-termuse of a data set (Colwell, 1995). The importance ofmetadata to the NVS databank has become increasinglyapparent with the uneven financial support for databases,loss of personnel and loss of institutional memory as aresult of the restructuring of New Zealand science overthe last 20 years. Even without such events, gooddocumentation is required because of the difficulty ofremembering details about a research project that wascompleted years ago (Fig. 3). Secondly, metadata allowsusers to ensure their use of the data is not beyond thebounds of the questions that the data can answer(Chrisman, 1994). This is especially important when auser is attempting to scale up point data to regional ornational spatial scales.
The types of metadata required for ecologicaldatabases have been reviewed in numerous articles (e.g.,Colwell, 1995; Michener et al., 1997; Hale, 2000).International standards exist for geospatial data [e.g., theU.S. Spatial Data Transfer Standard; National Institute ofStandards and Technology (1992)] and taxonomic names(e.g., Bisby, 1995). The recently produced BiologicalData Profile (FGDC Biological Data Working Group andUSGS Biological Resources Division, 1999) incorporatesthese standards and provides standards for other types ofmetadata associated with biological data, such as datacollection methods and electronic data field content.Michener et al. (1997) suggested the major categories of‘other’ information, as a minimum, should include data setdescriptors (e.g., originator of the study, research objectives,location), research origin descriptors (e.g., site description,sampling design, personnel), data set status and accessibility
10 NEW ZEALAND JOURNAL OF ECOLOGY, VOL. 25, NO. 2, 2001
(e.g., data quality assessment, contact person, copyrightrestrictions), data structural descriptors (e.g., format andstorage mode, descriptions of variables), and supplementaldescriptors (location of data sheets and related materialssuch as maps, history of data set usage).
Currently the NVS databank includes a database thatprovides metadata for all individual data sets held(summarised in Table 3). These metadata were initiallypublished as a series of reports (e.g., Hall et al., 1991).Since then, the electronic database has been updatedcontinually. The storage of information in fields allowseasy searching of this database and ensures adequatedocumentation of each data set. In 1999 a standard metadataform for data providers to complete was produced toensure that adequate documentation accompanies all datadeposited in the NVS databank. Additional informationabout individual data sets resides in associated text files.These files also include records of corrections and changesmade to electronic data files. Metadata for the actualvariables stored in data sets [i.e., data structural descriptorssensu Michener et al. (1997)] are provided in manualsthat describe the different standard data formats used
(e.g., Hall, 1994a, b). Metadata about individual plots(e.g., grid reference, date sampled, altitude) are includedas part of the data itself or in an associated text file if non-standard methods were used.
Several key types of metadata have not traditionallybeen stored in the NVS databank, but should be in futuredevelopments. These include methods used fordetermining values of site variables collected (e.g.,whether grid references were determined from a GlobalPositioning System or read off a map), a record of thepersonnel who collected the data, full references forpublications and reports based on the data, and dateswhen electronic files have been updated. Improving thequality and breadth of metadata, particularly for olderdata sets, is a priority for the NVS databank.
Quality control
The number of new errors entering a database can bereduced by developing formal quality-control proceduresfor adding, updating and editing data. It is essential toremove errors before analysis to prevent spurious resultsand misleading conclusions. Currently, some electronicdata in the NVS databank have not received the level ofchecking desirable and this provides an ongoing challengefor database managers and users.
When data are entered, efforts are made to ensurethat the data are as error-free as possible. Authority tablesare used to ensure that data, such as 6-letter codes forspecies, are valid (e.g., Hall, 1994a). Validation protocolsare used to ensure that data values fall within reasonablelimits (e.g., that tree diameters are not excessively large,that the aspect for a plot does not exceed 360o). For themost part, data stored is ‘raw’, i.e., exactly as recorded onthe data sheets. However, past efforts to standardise data
Figure 3. How the information content of data and associatedmetadata decays over time. Reprinted with permission fromMichener et al. (1997).
Figure 2. The number of plot measurements in each decade forwhich data are stored in the NVS databank. NFS and Ecosurveyplots are not shown. Summaries for different types of data aregiven in a-d. The filled portion of the bar indicates plots that werefirst measured in that decade; the open portion indicatesremeasurement of existing plots. Note different scales on thevertical axes.
11WISER ET AL.: MANAGING BIODIVERSITY INFORMATION
resulted in units being converted from imperial to metricbefore the data were stored. In some cases this gives theimpression of higher levels of precision (e.g., “500 feet”has become “152 metres”). Diagnostic tests have beenperformed on different subsets of the electronic data toscreen for errors. For example, tree diameter data wererecently examined for 7564 permanent plots in indigenousforests to determine whether tagged trees had plausiblerates of diameter growth.
Other types of errors cannot be recognised simplyby examining existing electronic data. For this reason weconducted a test of data accuracy by remeasuring a set of25 permanent plots in relatively species-rich montanerainforests of the Whitcombe Valley, central Westland(James et al., 1973). As these plots had not been visitedin 19 years and occur in an area where high rainfall causesfrequent flooding and landslides, we anticipated thatrelocation of plots and subplots would be difficult. Infact, all plots were successfully relocated. On average,the locations as recorded on metric NZMS 260 seriesmaps (1:50 000) were 130 horizontal metres from thelocation originally recorded on imperial NZMS 1 seriesmaps (1:63 000). Altitude, aspect and slope data weresimilar to those recorded in the past, althoughmeasurements of aspect when slopes were < 5o provedunrepeatable. In most plots, permanent markers forseedling subplots were relocated readily using metaldetectors; on average 22 of 24 markers per plot wererelocated. For permanently tagged stems having diameters≥ 2.5 cm, species identifications were highly accurate;only 1.6% of c. 2800 stems had been incorrectly identifiedduring the original survey. Taxonomic problems weremore common in seedling subplots, especially for sedges,grasses and some ferns. Some problems resulted fromchanges in taxonomic concepts since the lastremeasurement and taxa such as Hymenophyllum andUncinia only being identified to genus level in the past.Some previous identifications were suspect but could notbe verified because we could not find that taxon on theplot. Other errors arose because original tree tags hadbeen replaced with tags having different numbers; currentdata formats do not distinguish retagged trees fromnewly tagged ones.
Efforts are underway to improve quality controlprocedures for the NVS databank. Automated proceduresto allow longitudinal checks (i.e., comparisons with datacollected in the past) on permanent plot data at the timeof data entry are being developed. Discrepancies aremuch easier to resolve when the people who collected thedata can still remember what they did! For permanentplots, discrepancies that can only be resolved on-site atthe time of next remeasurement are now recorded in textfiles which are retained with the original data sheets(copies of which are given to data providers); these willbe given to the next remeasurement team. To assure dataintegrity, write-access is currently restricted to a highly
trained database administrator who has more than 10years experience working with the NVS databank and itsprecursors. Errors found by data users and those whocurate the databank are corrected on the electronic filesby the database administrator. Currently, data users tendto find errors and correct them on a copy of the file thatthey are using; only rarely are these corrections fed backinto the master copy of the data held by the NVS databank.Conversely, these users do not reap the benefits of ongoingupdates of the electronic data.
Enhancing flexibility and utility
Although the system meets most needs of the currentNVS databank users, it is now desirable to take advantageof evolving technology to improve its capability andflexibility. The technical solutions devised in the 1980santicipated many future developments. With newdevelopments, the underlying strategy is to advance insmall steps that are driven by the needs of data providersand users while retaining the flexibility to allow futuredevelopments that cannot be anticipated. To determineoptimal solutions to enhance the NVS databank, athorough review of how vegetation and permanent plotdatabases have been designed and implemented elsewherein the world is underway. Each development of the NVSdatabank will be preceded by a pilot project to ensure thatthe functionality of the database is improved.
How is flexibility of a database best enhanced bynew developments? In contrast to business data, scientificdata are often less structured and less formally organised,and the needs of users are less predictable (Hale, 1999).Software used for databanks should provide maximumflexibility to import and export data and to allow accessvia different platforms [e.g., IBM, MacIntosh, Sunworkstations; Porter (1998); Burley (1998)]. Manyecological data archives require data to be stored as plainASCII text (sometimes called ‘flat files’) with clearlydefined formats. The advantages of this were summarisedby Colwell (1995) as: (i) ASCII is platform-independent;(ii) ASCII text can be read and written by all proprietarysoftware (e.g., relational database management systems,spreadsheets, statistical packages), whereas directlyreading and writing between software systems is oftenproblematic; and (iii) ASCII offers the maximumflexibility for structuring data. For some ecologicaldatabanks, data entry and quality control work is doneusing a relational database management system, but dataare stored in ASCII text (e.g., Stafford, 1993).
Currently the NVS databank is going through amajor upgrade to increase its flexibility, improveaccessibility of data and integrate it with other LandcareResearch databases. The first goal is to facilitate storageof data that do not fit into the data structures currentlysupported. This will require tailoring structures toaccommodate other widely used survey methods (e.g.,

12 NEW ZEALAND JOURNAL OF ECOLOGY, VOL. 25, NO. 2, 2001
height-frequency data). For plots of standard types alreadysupported, there is a need to accommodate ancillaryinformation such as additional site information (e.g., soilchemistry data, GPS coordinates, topographic variables),and more attributes of individual plants measured onplots [e.g., indices of browsing by introduced animals,(Payton et al., 1999); individual tree heights, spatial
location of trees within a plot, presence of flowers, fruitsand parasitic plants]. To allow storage of vegetation datathat do not fit into a standard format, an approach such asthat of Conley and Brunt (1991) is being adopted. Theydesigned a generalised data structure (stored as ASCIItext) that contains both the data and full documentationin one file that stands alone. The data can be extracted
Table 3. Information stored in the metadata file in the NVS databank that describes individual data sets (modified from Hall et al.,1991). Descriptor classes follow Michener et al. (1997).Descriptor Definition/explanationClass I. Data set descriptors
Survey name Survey name and year data were collected.Class II. Research origin descriptors -overall and specific subproject descriptions
Organiser, organisation The survey organiser or principal investigator and their organisation, governmentdepartment, institution etc.
Department The department or conservancy that initiated the survey.Aims The rationale for the survey.Vegetation Type of vegetation sampled, e.g., forest, scrub, grassland.Location Includes general location, specific location (catchment, hill, forest), Ecological
Region, Ecological District, Ecological Code, DOC Conservancy, topographicalmap code of the imperial NZMS 1 series or the metric NZMS 260 series.
Survey method Describes which of a set of standard sampling methods was used.Modified Describes non-standard sampling methods or how standard methods were
modified.Remeasure Whether the survey remeasures previously surveyed areas or plots. Previous
measurement years listed where relevant.No. lines, plot numbers Number of lines and plots measured.Exclosure Indicates whether the survey includes plots from animal exclosures.Species information Indicates what information was recorded about species (e.g., occurrence in
tiers, cover classes, stem density).Site information Indicates what site information was recorded (e.g., altitude, aspect, slope).Plot coordinates Indicates whether grid coordinates were recorded on data sheets.
Class III. Data set status and accessibilityContact person Whoever knows most about the data at present.Access, access address and phone Proprietary restrictions on use of data; contact details for permission for
access.Class IV. Data structural descriptors
File name and directory Name of computer file and directory where file resides.Size (kb) Size of the computer files in kilobytes.Data entry Data entry operator or data source if imported electronically.
Class V. Supplemental descriptorsData location Agency where the original plot sheets or copies reside.Box number Box number where data sheets reside in the NVS archive at CHR.Missing plot sheets Number of plot sheets not held at Landcare Research.Photocopy Describes whether data sheets in the NVS archive are photocopies of originals,
and whether the quality is adequate.File errors, species errors, missing data,warnings Summaries of results from quality control checks.Corrections Corrections needed to reduce the number of errors found during quality control
checks.Aerial photos, slides, soil records, bird records, Indicates presence/absence of this type of information.animal census, browse records, maps, locationdiagrams on plot sheetsReports/refs The author and year of any published or unpublished material generated from
the data.File distribution Describes who has been provided copies of computer files or data sheets and
when this was done.Notes Any miscellaneous information about the survey.

13WISER ET AL.: MANAGING BIODIVERSITY INFORMATION
from such files with any text editor, then read into thesoftware system of choice (e.g., spreadsheet, statisticalpackage, graphics package).
The second goal of the current databank upgrade isto enable data users to readily query the NVS databankusing software systems of their choice, includingGeographic Information Systems (GIS). Over the nextyear, the data are being restructured to enable just that.Users will be able to access data with conventionalsoftware such as database, spreadsheet, statistical, orgraphics packages, with computer packages designedspecifically for the NVS databank (e.g., Hall, 1994a, b),or specialised vegetation analysis software such as PC-ORD (McCune and Mefford, 1999), CANOCO orTWINSPAN. Conversion of spatial location data to arange of forms is underway to increase the utility of thedata and facilitate interrogation with GIS.
The third goal is development of an internet site tofacilitate access to information about the NVS databankand to data stored there. Currently the site includes generalinformation about the databank, copies of data formatsused, copies of data collection manuals, data request anddeposit forms, and maps of plot locations. In the nearfuture the metadata will be available for querying.Eventually, we hope to have the plot data available as well.
The NVS databank is an invaluable source of pointdata on vegetation composition and structure, and thereare wide-ranging knowledge gains to be made byintegrating these data with other New Zealand databasesand sources of information. To date, this has been doneto a limited extent. GIS has been used to overlay plot andanimal distribution data to determine areas mostsusceptible to damage by exotic animals (e.g., Rose et al.,1994) and to model distributions of species in relation toclimate (e.g., Leathwick et al., 1998). NVS data havebeen linked to species-attribute information in theTaxonomic Names Database held by Landcare Research,to summarise point vegetation data in terms of plantfamily membership and exotic or native status. Geo-referenced plot data can also be used to verify other datasources. Data from forest canopy gaps have been used toverify canopy gap locations generated from digitalcanopy-elevation models derived from aerial photographs(Betts et al., 2000). Vegetation data from which carbonstorage has been calculated have been linked to satelliteimages to allow ground-truthing for carbon monitoring(Pairman et al., 1999).
Concluding comment
Data not only provide the foundation for science, they willincreasingly provide the basis for many of our managementdecisions. As data accumulate, there will be a critical needto standardise, integrate and disseminate biodiversityinformation – we are at the beginning of a revolution(Burley, 1998). Vehicles such as the NVS databank can be
used to ensure that the substantial investment of time spentcollecting, entering, correcting and managing biodiversityinformation is safeguarded for the future. For moreinformation about the NVS databank see the internet sitewww.landcare.cri.nz/science/nvs. Queries about NVS canbe sent to [email protected].
Acknowledgements
We thank Terry Savage for producing the maps, and RobAllen, Ian Payton, Cathy Allan, Ian Whitehouse, JohnLeathwick, David Coomes, Michelle Breach and ChristineBezar who all provided valuable comments on an earlierversion of the manuscript. The NVS databank owes itsexistence to many individuals whose efforts over theyears have allowed it to become what it is today. Theseefforts include, but are not limited to, the work done tostandardise methods, collate and collect hard copies ofplot sheets and ancillary data, computerise data, developdata checking and analysis routines, and documentdatasets. Some of the individuals who played a major roleare: John Holloway, John Nicholls, John Wardle, GraemeHall, Ian Payton, Martin Fastier, Shane Andreasend, RobAllen, Graeme Evans, Mac McLennan, John Leathwick,Shirley Chee, Ngaire Breuton and Michelle Breach.Special thanks go to all those people who wore out theirboots collecting data and those who have saved andprovided data to the databank. Financial support for thepreparation of this paper was provided by the NewZealand Foundation for Research, Science andTechnology as part of contract CO9806.
References
Allen, R.B. 1992. RECCE - an inventory method fordescribing New Zealand vegetation. Forest ResearchInstitute Bulletin 176. Forest Research Institute,Christchurch, N.Z.
Allen, R.B. 1993. A permanent plot method formonitoring changes in indigenous forests. ManaakiWhenua - Landcare Research New Zealand Ltd,Christchurch, N.Z.
Allen, R.B.; Rose, A.B.; Evans, G.R. 1983. Grasslandsurvey manual: A permanent plot method. ForestResearch Institute Bulletin 43. Forest ResearchInstitute, Christchurch, N.Z.
Anon., 1926. The New Zealand official year-book.Government Printer, Wellington, N.Z.
Arand, J.; Glenny, D. 1990. Mathias and Mt HuttEcological Districts. Protected Natural AreasProgramme Survey Report No. 12. Department ofConservation, Wellington, N.Z.
Atkinson, I.A.E. 1975. A method for permanent transectsin vegetation. Tuatara 21: 81-91.

14 NEW ZEALAND JOURNAL OF ECOLOGY, VOL. 25, NO. 2, 2001
Bakker, J.; Olff, H.; Willems, J.H.; Zobel, M. 1996. Whydo we need permanent plots in the study of long-term vegetation dynamics? Journal of VegetationScience 7: 147-156.
Batcheler, C.L.; Craib, D.G. 1985. A variable area plotmethod for assessment of forest condition and trend.New Zealand Journal of Ecology 8: 83-96.
Bellingham, P.J. 1996. Surveys and monitoring ofvegetation. Landcare Research Contract ReportLC9596/026 for the Department of Conservation.Landcare Research, Lincoln, N.Z.
Bellingham, P.J.; Stewart, G.H.; Allen, R.B. 1999. Treespecies richness and turnover throughout NewZealand forests. Journal of Vegetation Science 10:825-832.
Bellingham, P.J.; Wiser, S.K.; Coomes, D.A.;Dunningham, A. 2000. A review of permanent plotsfor long-term monitoring of New Zealand’sindigenous forests. Science for Conservation 151.Department of Conservation, Wellington, N.Z.
Betts, H.; Brown, L.; Stewart, G.H. 2000. Mapping canopygaps in beech forest from a digital elevation model. In:III Southern Connection Congress, Programme andAbstracts, p. 21. Lincoln University, Canterbury, N. Z.
Bisby, F. 1995. Plant names in botanical databases. PlantTaxonomic Database Standards No. 3. Hunt Institutefor Botanical Documentation, Pittsburgh, U.S.A.
Borland International Inc. 1989. REFLEX 2.0. BorlandInternational Inc. Scotts Valley, California, U.S.A.
Brunt, J. W. 1994. Research data management in ecology:A practical approach for long-term projects. In:French, J.C.; Hinterberger, H. (Editors), Seventhinternational working conference on scientific andstatistical database management, pp. 272-275. IEEEComputer Society Press, Washington, D.C., U.S.A.
Burley, J. 1998. Joining the revolution: A strategy for thestandardization, integration and dissemination ofbiodiversity information - as a prospective modelfor the management of other kinds of environmentalinformation. Manaaki Whenua - Landcare Research,Lincoln, N.Z.
Calder, J.W.; Wardle, P. 1969. Succession in subalpinevegetation at Arthur’s Pass, New Zealand.Proceedings of the New Zealand Ecological Society16: 36-47.
Campbell, D.J. 1990. Changes in structure andcomposition of a New Zealand lowland forestinhabited by brushtail possums. Pacific Science 44:277-296.
Chrisman, N.R. 1994. Metadata required to determinethe fitness of spatial data for use in environmentalanalysis. In: Michener, W.K.; Brunt, J.W.;Stafford, S.G. (Editors), Environmentalinformation management and analysis:Ecosystems to global scales, pp. 177-190. Taylor& Francis, London, U.K.
Cockayne, L. 1899. A sketch of the plant geography of theWaimakariri River basin, considered chiefly from anoecological point of view. Transactions andProceedings of the New Zealand Institute 32: 95-136.
Cockayne, L. 1928. The vegetation of New Zealand,Second edition. Engelmann, Leipzig, Germany.
Cockayne, L.; Calder, J.W. 1932. The present vegetationof Arthur’s Pass (New Zealand) as compared withthat of thirty-four years ago. Journal of Ecology 20:270-283.
Colwell, R.K. 1995. Ecological Society of America specialcommittee on ESA communications in the electronicage. Bulletin of the Ecological Society of America76: 120-131.
Conley, W.; Brunt, J.W. 1991. An institute for theoreticalecology? Part V: Practical data management forcross-site analysis and synthesis of ecologicalinformation. Coenoses 6: 173-180.
Dickinson, K.J.M.; Mark, A.F.; Lee, W.G. 1992. Long-term monitoring of non-forest communities forbiological conservation. New Zealand Journal ofBotany 30: 163-179.
FGDC Biological Data Working Group and USGS BiologicalResources Division. 1999. Content standard for digitalgeospatial metadata - biological data profile, FGDC-STD-001.1-1999. Federal Geographic Data Committee.Washington, D.C., U.S.A.
Forest Research Institute. 1989. Databases for NewZealand’s indigenous vegetation. What’s New inForest Research 175. Forest Research Institute,Rotorua, N.Z.
Frankel, M.S. 1999. Public access to data. Science283:1114.
Hale, S.S. 1999. How to manage data badly (part 1).Bulletin of the Ecological Society of America 80:265-268.
Hale, S.S. 2000. How to manage data badly (part 2). Bulletinof the Ecological Society of America 81:101-103.
Hall, G.M.J. 1994a. PC-DIAM: Stem diameter analysis.Landcare Research, Auckland, N.Z.
Hall, G.M.J. 1994b. PC-USTOREY: Seedling and saplingdata analysis. Landcare Research, Auckland, N.Z.
Hall, G.; Allen, R. 1985. Reconnaissance vegetationsurvey programs. Forest Research Institute Bulletin88. Forest Research Institute, Christchurch, N.Z.
Hall, G.M.J.; Payton, I; Burrows, L.; Fastier, M.;Andreasend, S. 1991. National IndigenousVegetation Survey database: Database directories.Forest Research Institute contract report FWE 91/16, prepared for the Department of Conservation.Forest Research Institute, Christchurch, N.Z.
Hall, G.M.J.; Wiser, S.K.; Allen, R.B.; Beets, P.N.;Goulding, C.J. 2001. Strategies to estimate nationalcarbon biomass from forest inventory data: The1990 New Zealand baseline. Global Change Biology7: 389-403.

15WISER ET AL.: MANAGING BIODIVERSITY INFORMATION
Hill, M.O. 1979. TWINSPAN. A FORTRAN program forarranging multivariate data in an ordered two-waytable by classification of the individuals andattributes. Section of Ecology and Systematics,Cornell University, Ithaca, N.Y., U.S.A.
Holloway, J.T. 1954. Forests and climate in the SouthIsland of New Zealand. Transactions of the RoyalSociety of New Zealand 82: 329-410.
Holloway, J.T.; Wendelken, W.J. 1957. Some unusualfeatures of sample plot design. New Zealand Journalof Forestry 7: 77-83.
James, I.L.; Jane, G.; Barr, C. 1973. The forests and sub-alpine shrublands of the Hokitika catchment. Forestand Range Experiment Station, Protection ForestryDivision Report 116. Forest Range and ExperimentStation, Rangiora, N.Z.
Kelly, G.C. 1972. Scenic reserves of Canterbury.Biological Survey of Reserves Report 2. BotanyDivision, Department of Scientific and IndustrialResearch, Wellington, N.Z.
Kelsey, J. 1997. The New Zealand experiment - a worldmodel for structural adjustment. AucklandUniversity Press, Auckland, N.Z.
Leathwick, J.R.; Burns, B.R.; Clarkson, B.D. 1998.Environmental correlates of tree alpha-diversity inNew Zealand primary forests. Ecography 31: 235-246.
Mark, A.F; Baylis, G.T.S.; Dickinson, K.J.M. 1991.Monitoring the impacts of deer on vegetationcondition of Secretary Island, Fiordland NationalPark, New Zealand: A clear case for deer control andecological restoration. Journal of the Royal Societyof New Zealand 21: 43-54.
Masters, S.E.; Holloway, J.T.; McKelvey, P.J. 1957. Thenational forest survey of New Zealand, 1955. NewZealand Forest Service, Wellington, N.Z.
McCune, B.; Mefford, M.J. 1999. PC-ORD. Multivariateanalysis of ecological data, Version 4. MjM SoftwareDesign, Gleneden Beach, Oregon, U.S.A.
McKelvey, P.J. 1963. The synecology of the West Taupoindigenous forests. New Zealand Science Bulletin14. Government Printer, Wellington, N.Z.
McKelvey, P.J. 1984. Provisional classification of SouthIsland virgin indigenous forests. New ZealandJournal of Forestry Science 14: 151-178.
McKelvey, P.J. 1995. Steepland forests. CanterburyUniversity Press, Christchurch, N.Z.
McKelvey, P.J.; Cameron, R.J. 1958. Design for a foreststudy. New Zealand Journal of Forestry 7: 116-122.
Meurk, C.D.; Buxton, R.P. 1991. A New Zealand registerof permanent vegetation plots. Department ofScientific and Industrial Research Land Resources,Christchurch, contract report 91/35, prepared for theDepartment of Conservation. Department of Scientificand Industrial Research, Christchurch, N.Z.
Michener, W.K.; Brunt, J.W.; Helly, J.J.; Kirchner,T.B.; Stafford, S.G. 1997. Nongeospatial metadata
for the ecological sciences. Ecological Applications7: 330-342.
Michener, W.K. 1998. Ecological metadata. In: Michener,W.K.; Porter, J.H.; Stafford, S.G. (Editors). Dataand information management in the ecologicalsciences: A resource guide, pp. 47-51. Long TermEcological Research Network Office, University ofNew Mexico, Albuquerque, New Mexico, U.S.A.
Mueller-Dombois, D.; Ellenberg, H. 1974. Aims andmethods of vegetation ecology. John Wiley & Sons,New York, U.S.A.
Myers, S.C.; Park, G.N.; Overmars, F.B. 1987. The NewZealand Protected Natural Areas Programme - aguidebook for the rapid ecological survey of naturalareas. New Zealand Biological Resources CentrePublication No. 6. Department of Conservation,Wellington, N.Z.
Nash, J.E. 1993. Ownership and outreach: A model foradministration of shared data. Annals of the MissouriBotanical Garden 80: 304-308.
National Institute of Standards and Technology. 1992.Spatial data transfer standard (FederalInformation Processing Standard 173). NationalInstitute of Standards and Technology,Gaithersburg, Maryland, U.S.A.
Nicholls, J.L. 1976. A revised classification of the NorthIsland indigenous forests. New Zealand Journal ofForestry 21: 105-132.
Osawa, A.; Allen, R.B. 1993. Allometric theory explainsself-thinning relationships of mountain beech andred pine. Ecology 74: 1020-1032.
Pairman, D.; McNeill, S.; Scott, N.; Bellis, S. 1999. Vegetationidentification and biomass estimation using AIRSARdata. Geocarto International 14: 67-75.
Payton, I.J.; Hall, G.; Burrows, L.; Hunt, J. 1988.Establishment of a vegetation survey database -progress report, 1987/88. Forest Research Institutereport prepared for the Department of Conservation.Forest Research Institute, Christchurch, N.Z.
Payton, I.J.; Pekelharing, C.J.; Frampton, C.M. 1999.Foliar browse index: A method for monitoringpossum (Trichosurus vulpecula) damage to plantspecies and forest communities. Manaaki Whenua -Landcare Research, Lincoln, N.Z.
Peet, R.K. 1998. ESA journals: Evolution andrevolution. Bulletin of the Ecological Society ofAmerica 79: 177-181.
Porter, J.H. 1998. Scientific databases for environmentalresearch. In: Michener, W.K.; Porter, J.H.; Stafford,S.G. (Editors), Data and information managementin the ecological sciences: A resource guide, pp. 41-46. Long Term Ecological Research Network Office,University of New Mexico, Albuquerque, NewMexico, U.S.A.
Porter, J.H.; Callahan, J.T. 1994. Circumventing adilemma: Historical approaches to data sharing in

16 NEW ZEALAND JOURNAL OF ECOLOGY, VOL. 25, NO. 2, 2001
ecological research. In: Michener, W.K.; Brunt,J.W.; Stafford, S.G. (Editors), Environmentalinformation management and analysis: Ecosystemsto global scales, pp. 193-202. Taylor & Francis,London, U.K.
Rose, A.B.; Wiser, S.K.; Platt, K.H. 1994. Forestsusceptibility to browsing by possums. In: Rose, A.B.(Editor), A review of possums and possum-vulnerablespecies in Nelson/Marlborough Conservancy, pp. 8-21. Landcare Research Contract Report LC9394/119.Landcare Research, Blenheim, N.Z.
SAS Institute, 1999. The SAS system for Windows,release 8.00. SAS Institute, Cary, North Carolina,U.S.A.
Scott, D. 1965. A height frequency method for samplingtussock and shrub vegetation. New Zealand Journalof Botany 3: 253-260.
Scott, D. 1993. Time segment analysis of permanentquadrat data: Changes in Hieracium cover in theWaimakariri in 35 years. New Zealand Journal ofEcology 17: 53-57.
Smale, M.C.; Hall, G.M.J.; Gardner, R.O. 1995. Dynamicsof kanuka (Kunzea ericoides) forest on South KaiparaSpit, New Zealand, and the impact of fallow deer(Dama dama). New Zealand Journal of Ecology 19:131-141.
Stafford, S.G. 1993. Data, data everywhere but not a byteto read: Managing monitoring information.Environmental Monitoring and Assessment 26:1125-141.
ter Braak, C.J.F.; Šmilauer, P. 1998. CANOCO referencemanual and user’s guide to Canoco for Windows:Software for Canonical Community Ordination(version 4). Microcomputer Power, Ithaca, NewYork, U.S.A.
Thomson, A.P. 1946. Design for a forest survey. NewZealand Journal of Forestry 5: 191-199.
Wardle, J.A. 1970. The ecology of Nothofagus solandri.2. The associations. New Zealand Journal of Botany8: 532-570.
Wardle, J.; Guest, R. 1977. Forests of the Waitaki andLake Hawea catchment. New Zealand Journal ofForestry Science 7: 44-67.
Webster, B. 1994. Vegetation monitoring - LandcorpProperty Ltd programme and data. In: Proceedingsof the 1994 New Zealand Conference on SustainableLand Management, pp 192-198. Lincoln University,Canterbury, N.Z.
Whitehouse, I. 1998. Science database and collectionissues: Oceans of data, vulnerable collections, andterabytes of power. Ministry of Research, Scienceand Technology, Wellington, N.Z.
Wilson, H.D. 1987. Vegetation of Stewart Island, NewZealand. New Zealand Journal of BotanySupplement: 1-80.
Wiser, S.K.; Allen, R.B.; Clinton, P.W.; Platt, K.H. 1998.Community structure and forest invasion by anexotic herb over 23 years. Ecology 79: 2071-2081.
Wiser, S.K.; Rose, A.B. 1997. Two permanent plotmethods for monitoring changes in grasslands: Afield manual. Manaaki Whenua Press, Lincoln, N.Z.
Wraight, M.J. 1962. Methods of measurement of alpinegrassland. In: Methods of measuring plantcommunities: Report of a seminar held at Cass on16-18 October [1962] under the auspices of the NewZealand Institute of Agricultural Science with theco-operation of the Botany Department, Universityof Canterbury, pp 15-23. New Zealand Institute ofAgricultural Science, Wellington, N.Z.

17WISER ET AL.: MANAGING BIODIVERSITY INFORMATION
Appendix 1.NVS Protocol
Purpose of the National Vegetation Survey (NVS) DatabankThe goal is to develop NVS as New Zealand’s prime repository for ecological data on vegetation structure and composition, andspecifically:1. to enhance archival data storage of nationally important datasets;2. to enhance availability of archived data to users, while protecting the interests of data suppliers;3 and to encourage users of stored data to provide some benefit which enhances NVS as an in-kind contribution.Protocol for Data Deposition and Storage in NVS4. Hard copies of data, electronic copies where available, and documentation about the data should be provided.5. No costs will be associated with data deposit, storage and retrieval by the provider.6. Landcare Research will not normally purchase data for inclusion in NVS.
Issues of ownership of, and access to, data are of concern to data providers. Specific conditions regarding issues of ownershipand access will be clearly defined in a Memorandum of Understanding between Landcare Research (as curators and custodiansof NVS data) and providers (as per the attached Agreement on Confidential Disclosure of Information and Memorandum ofUnderstanding). All data sets provided will be assigned one of the access levels listed below in consultation with LandcareResearch.
Levels of Proprietary OwnershipLevel 1 (Open Datasets) No limitation on availability of data. The provider puts no conditions on use of the data;Level 2 (Conditional Datasets) The existence of these data will be shown on data listings, but use is restricted by the provider.
Written approval must be obtained from the provider before data will be supplied;Level 3 (Reserved Datasets) Confidential or commercially sensitive (the existence of data will not be advertised; they will
be archived in NVS predominantly for data security).Protocol for Data Use8. Data contained in NVS hardcopy and/or electronic files are copyright and subject to Licence Agreements where used by any party.
Licensed users of NVS data may not use the data for any purpose other than the purpose specified in the Licence Agreement, orsubsequently agreed in writing between Landcare Research and the Licensee.
9. Licensed users of NVS data may not pass this information to any other party in any form unless this use is specifically providedfor in the Licence Agreement, or subsequently agreed in writing between Landcare Research and the Licensee.
10. Data are provided on a single-use basis unless otherwise negotiated.11. Modification or addition of ancillary data does not confer ownership of the original data to the user.Cost of Data Retrieval12. Costs of data handling (e.g., retrieval, copying, analysis) must be met by the user.Acknowledgements13. A clear acknowledgement of NVS as a data source must appear in any products (e.g., publications, unpublished reports) in the
following terms:We <or User/Institution name> acknowledge the use of data <or other information> drawn from the National VegetationSurvey Databank (NVS).Additional acknowledgement of the original collector or organisation may also be necessary as a condition of use.
Data Accuracy14. Landcare Research attempts to hold the most up-to-date and complete copies of data in NVS, but does not guarantee that all data
are error-free. Users are encouraged to furnish copies of updated or corrected data or plot remeasurement data within a sensibletime frame for the purpose of updating records.
User Lists15. Landcare Research will maintain a log of data users for reporting purposes (e.g., to Public Good Science Fund). Information on
other users of requested data may be provided at cost and to the extent allowed by Licence Agreements.
Last updated 14 Jun 2000