managing aid to achieve trade and development results… aid to achieve... · managing aid to...
TRANSCRIPT

Managing Aid to Achieve Trade and Development Results:
An Analysis on Trade-Related Targets
OECD Olivier Cattaneo
Paper prepared for the workshop :
“Aid for Trade: What Have we Learnt? Which way Ahead?”
6 December 2012, International Conference Centre, Geneva

MANAGING AID TO ACHIEVE TRADE AND DEVELOPMENT RESULTS: AN ANALYSIS ON TRADE-RELATED TARGETS 1
Managing Aid to Achieve Trade and Development Results: An Analysis on Trade-Related Targets

MANAGING AID TO ACHIEVE TRADE AND DEVELOPMENT RESULTS: AN ANALYSIS ON TRADE-RELATED TARGETS 2
Managing Aid to Achieve Trade and Development Results: An Analysis on Trade-Related Targets
Executive Summary Aid for trade has become an increasingly important priority in development assistance programs. Therefore, and particularly at a time when aid budgets are under pressure, there is a need to strengthen accountability, and demonstrate that the substantial resources mobilized are well spent and have impact. Towards this end, this paper attempts to develop a logical framework for a results-based management of aid for trade that includes a menu of trade-related targets or possible objectives for aid for trade projects, as well as indicators to measure their performance. The task to identify a menu of aid for trade targets and indicators is complex. In particular, since the launch of the aid for trade initiative in 2005, the patterns of trade have dramatically changed with the further fragmentation of global production and the prevalence of global value chains in business strategies. In other terms, the development partners are dealing with moving targets. The same way the statistics community is moving towards measuring trade in value-added, the development community could review the objectives and targets of aid for trade to reflect the recent changes in trade patterns. This paper starts with a simple question: What are the donors and recipient countries trying to achieve? Then, it distinguishes three different levels of possible objectives, which are qualified as direct, intermediate, and final. Trade is treated as intermediate objective, playing the role of a transmission mechanism, with the increase in the value for trade (measured in terms of jobs, income, socio-economic upgrading, etc.) as the final objective of aid projects. Performance indicators are then listed to help the evaluation of the objectives’ achievements. Beyond its evaluation role, the suggested framework that lists a number of possible objectives of aid for trade should allow the recipient country to more easily understand the complex mechanics of trade, be aware of the tools aid for trade has to offer to achieve such objectives, and ultimately mainstream trade in its development programs. The suggested framework should be seen as an evolving tool: practitioners could add new activities, targets and performance indicators to the existing menu. It is flexible enough to allow prioritization of projects and objectives according to each donor’s or recipient country’s aid and development strategies. It is also meant to be an interactive tool, and could be easily transformed into a user-friendly online database. ------------------------------------------------------------ This paper was written by Olivier Cattaneo

MANAGING AID TO ACHIEVE TRADE AND DEVELOPMENT RESULTS: AN ANALYSIS ON TRADE-RELATED TARGETS 3
DIRECT OBJECTIVES (COMPETITIVENESS AND OPENNESS)
Technical assistance for trade policy and regulations
Suppression/reduction of obstacles to trade at the border
Suppression/reduction of trade-distortive or discriminatory measures beyond the border
Mainstreaming and promotion of trade, trade integration and investment
Economic infrastructure
Improvement of the accessibility/connectivity of the market (telecoms and transport)
Improvement of other domestic infrastructure and basic services
Productive capacity building
Improvement of the legal/regulatory environment for business
Improvement of the organization and performance of markets
Increase in productivity, production and innovation capacities
Trade-related adjustment
Adjustment to tariff and price fluctuations
Restructuration of industries/sectors facing a trade shock
Provision of safety nets and training opportunities for workers affected by trade
Other forms of adjustment
Facilitation of the movement of productive capacities
Enforcement of trade-related rights and obligations
Promotion of responsible business/investment principles and practices
INTERMEDIATE OBJECTIVES (TRADE AND INVESTMENT)
Development of an open, rule-based, predictable and non-discriminatory trading system
Increased competitiveness and attractiveness for foreign investment
Increased exports/export market shares and foreign reserves
Diversification of exports and imports
Increased participation and consolidation of global value chains
Reduction of trade costs and prices of imports/inputs
Reallocation of production capacities to more competitive and higher value-added segments
FINAL OBJECTIVES (VALUE FOR TRADE)
Direct and indirect job creations
Increased level and predictability of income
Economic and social upgrading
Diffusion of technology and knowledge
Better and more sustainable use of resources
Political and economic stability
OU
TCO
MES
IMP
AC
TS

MANAGING AID TO ACHIEVE TRADE AND DEVELOPMENT RESULTS: AN ANALYSIS ON TRADE-RELATED TARGETS 4
Chapter 1
Moving Targets: Managing Aid for Trade in a Context of Changing Trade Patterns
and Paradigms
This chapter presents the efforts that have been made to strengthen the accountability in aid for trade, including through diverse attempts to develop a list of trade-related targets and performance indicators. It suggests that, while building on existing work, it is necessary to review the objectives of aid for trade afresh to reflect the most recent changes in trade patterns and paradigms, including the fragmentation of production and the increasing role of global value chains in trade. 1.1. Managing Aid to Achieve Trade and Development Results: The International Agenda With a view to strengthening accountability and getting improved results in aid for trade, in line with the Paris Declaration (2005) and the Accra Agenda for Action (2008), donors and development partners have stressed the need to set a menu of trade-related targets and use performance indicators (OECD, 2011). The objective, in a context of budget stress faced by most donors, is to allow a results-based management of aid for trade activities, to demonstrate that the substantial resources mobilized are well spent and have impact, and to find ways to further improve the quality and effectiveness of aid for trade (OECD, 2012b). The Busan Partnership for Effective Development Cooperation (2011) also stressed the need to adopt common results frameworks and platforms to assess aid performance based on a manageable number of output and outcome indicators drawn from the development priorities and goals of the developing country. Finally, on the occasion of the third Global Review of Aid for Trade (2011), among others, Members of the World Trade Organization (WTO) equally committed to improve the way to monitor and evaluate the impact of aid for trade. A number of efforts have been made to move the aid for trade evaluation agenda forward. In its recent publication on Strengthening Accountability in Aid for Trade, the OECD provided a good and comprehensive overview of existing evaluation approaches, methods and processes (OECD, 2011). It also paved the way for the elaboration of a harmonized menu of trade-related indicators and the enforcement of a common results-based management system. A number of attempts have also been made in the literature to develop indicators for monitoring trade capacity, trade performance, and aid for trade results. The International Finance Corporation (IFC, The World Bank Group) Doing Business has played a major role in promoting the culture of results by monitoring selected indicators and benchmarking countries against each other. Doing Business contains a Trading Across the Borders indicators series that
MANAGING AID TO ACHIEVE TRADE AND DEVELOPMENT RESULTS: AN ANALYSIS ON TRADE-RELATED TARGETS 5
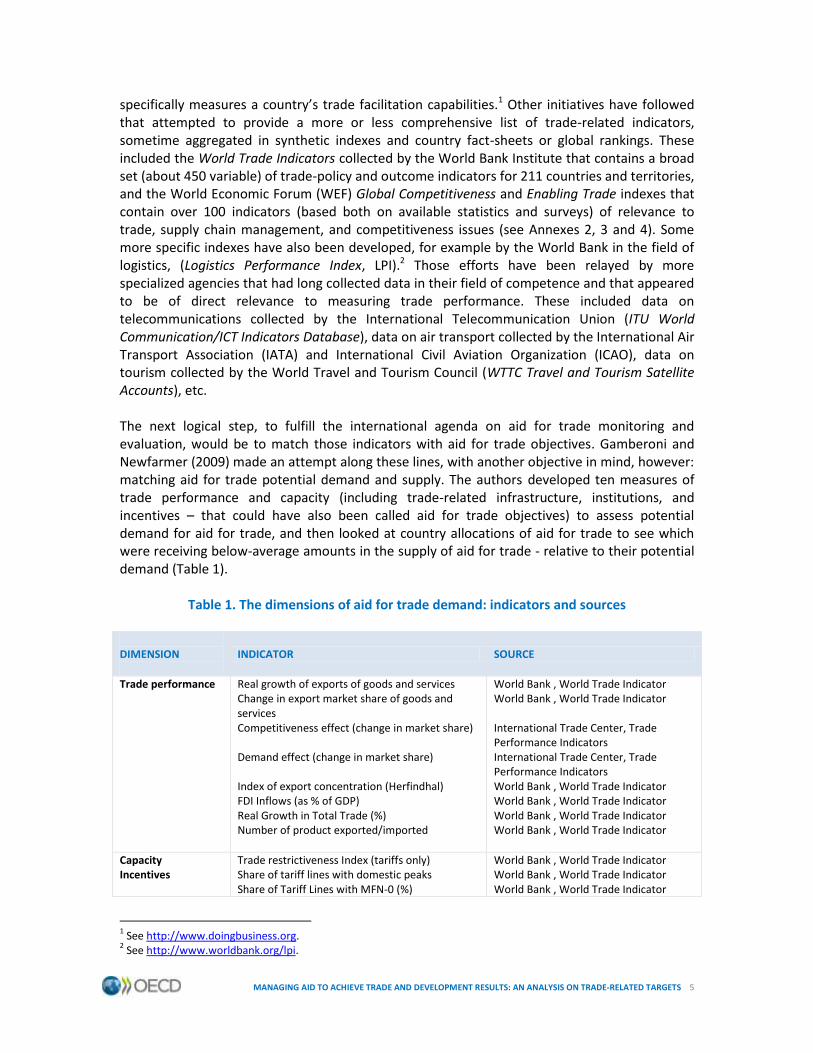
specifically measures a country’s trade facilitation capabilities.1 Other initiatives have followed that attempted to provide a more or less comprehensive list of trade-related indicators, sometime aggregated in synthetic indexes and country fact-sheets or global rankings. These included the World Trade Indicators collected by the World Bank Institute that contains a broad set (about 450 variable) of trade-policy and outcome indicators for 211 countries and territories, and the World Economic Forum (WEF) Global Competitiveness and Enabling Trade indexes that contain over 100 indicators (based both on available statistics and surveys) of relevance to trade, supply chain management, and competitiveness issues (see Annexes 2, 3 and 4). Some more specific indexes have also been developed, for example by the World Bank in the field of logistics, (Logistics Performance Index, LPI).2 Those efforts have been relayed by more specialized agencies that had long collected data in their field of competence and that appeared to be of direct relevance to measuring trade performance. These included data on telecommunications collected by the International Telecommunication Union (ITU World Communication/ICT Indicators Database), data on air transport collected by the International Air Transport Association (IATA) and International Civil Aviation Organization (ICAO), data on tourism collected by the World Travel and Tourism Council (WTTC Travel and Tourism Satellite Accounts), etc. The next logical step, to fulfill the international agenda on aid for trade monitoring and evaluation, would be to match those indicators with aid for trade objectives. Gamberoni and Newfarmer (2009) made an attempt along these lines, with another objective in mind, however: matching aid for trade potential demand and supply. The authors developed ten measures of trade performance and capacity (including trade-related infrastructure, institutions, and incentives – that could have also been called aid for trade objectives) to assess potential demand for aid for trade, and then looked at country allocations of aid for trade to see which were receiving below-average amounts in the supply of aid for trade - relative to their potential demand (Table 1).
Table 1. The dimensions of aid for trade demand: indicators and sources
DIMENSION
INDICATOR SOURCE
Trade performance
Real growth of exports of goods and services Change in export market share of goods and services Competitiveness effect (change in market share) Demand effect (change in market share) Index of export concentration (Herfindhal) FDI Inflows (as % of GDP) Real Growth in Total Trade (%) Number of product exported/imported
World Bank , World Trade Indicator World Bank , World Trade Indicator International Trade Center, Trade Performance Indicators International Trade Center, Trade Performance Indicators World Bank , World Trade Indicator World Bank , World Trade Indicator World Bank , World Trade Indicator World Bank , World Trade Indicator
Capacity Incentives
Trade restrictiveness Index (tariffs only) Share of tariff lines with domestic peaks Share of Tariff Lines with MFN-0 (%)
World Bank , World Trade Indicator World Bank , World Trade Indicator World Bank , World Trade Indicator
1 See http://www.doingbusiness.org.
2 See http://www.worldbank.org/lpi.

MANAGING AID TO ACHIEVE TRADE AND DEVELOPMENT RESULTS: AN ANALYSIS ON TRADE-RELATED TARGETS 6
DIMENSION
INDICATOR SOURCE
Share of Tariff Lines Bound (%) Tariff Overhang (%) Applied Tariff Escalation GATS Commitments Index
World Bank , World Trade Indicator World Bank , World Trade Indicator World Bank , World Trade Indicator World Bank , World Trade Indicator
Infrastructure LPI Quality of Transport and IT Number of internet users, mobile phone and fixed phone subscribers for 1000 inhabitants Percentage of paved road, total km of rail lines, air transport freight costs to US Quality of port and water infrastructure
World Bank, LPI Indicators World Bank, World Development Indicators World Bank, World Development Indicators WEF, Global competitiveness Report
Institutions Efficiency of customs Time to export/import Ease and affordability of arranging international shipments. Domestic logistics costs Timeliness of shipments in reaching destination. Trading Across Borders (rank 1-178, worst)
World Bank, LPI Indicators World Bank, Doing Business database World Bank, LPI Indicators World Bank, LPI Indicators World Bank, LPI Indicators World Bank, Doing Business database
Source: Gamberoni & Newfarmer (2009)
Elliott (2007) did not use the more recent trade indicators, but made a significant step in matching indicators with the outputs and outcomes of donor support aimed at addressing supply-side constraints (Table 2).
Table 2. Indicators for assessing the impact of aid for trade aimed at supply-side constraints Achievement of immediate project goals
Impact on Intermediate Objectives
Impact on ultimate goals
Measures of trade costs, competitiveness
Measures of trade and investment flows
kilometers of roads built, maintained
increases in sea, air port capacity
increases in access to landlines, cell phones, internet
access to credit
reductions in power outages
access to cold storage, especially in rural areas
increased compliance with SPS, other international, standards
rationalization, harmonization of
reduction in number of forms required to import, export
reductions in days for goods to clear customs
reduction in trade taxes, especially on key technologies, other inputs
reduction in internal transit time to market, port, or end user
reduction in total time to get goods to destination
reduction in the share of output not
increased capacity in sectors producing tradable goods or services
increased value-added in tradable goods, services sectors
increased firm-level productivity
change in global export shares—total and in key sectors
diversification of exports—share of top 5 products in total exports
increased private investment (foreign or domestic) in and
higher employment levels in tradable goods or services sectors
increased numbers of subsistence farmers engaging in market activities (local or export if the result of aid for trade assistance to raise productivity, build roads, other activities where spillovers could occur)
lower shares in economic activity, employment for informal sector

MANAGING AID TO ACHIEVE TRADE AND DEVELOPMENT RESULTS: AN ANALYSIS ON TRADE-RELATED TARGETS 7
regulations related to trade, transit in regional trade agreements, especially involving land-locked countries (e.g., common axle loads (appropriate for road capacity) and vehicle dimensions for trucks, rail gauge, operator licenses, etc. that loads do not have to be transferred at borders)
reaching market due to delivery delays
competition measured by market shares of top 5, 10 firms providing logistics, transportation services
reduction in transportation costs—changes in cif/fob factor as proxy if direct costs unavailable
size of inventories held
effects of aid on exchange rate
around infrastructure projects and in productive sectors receiving assistance
higher shares for SMEs in formal sector
higher and sustained growth following increases in trade
higher overall employment if growth stimulated
reductions in poverty rates
Source: Elliott (2007)
The synthesis of these different efforts has not been made, however. Suggested management frameworks have remained narrow in scope and ambit, focusing on projects (project-level evaluation) or specific types of constraints. Often, the focus has also been on the identification of quantitative indicators, which cannot measure the performance of a number of aid for trade projects: qualitative indicators should be equally used (e.g. to assess the impact of technical assistance on regulatory reforms). Similarly, surveys and information provided by the actors of trade and development (in particular civil society organizations and private sector firms operating in developing countries) have often been neglected: a proper evaluation of aid for trade projects will often rely on the information provided by those who do trade, suggesting a need for further multi-stakeholder cooperation in the collection of relevant data. Finally, none has drawn the consequences of the recent quick and fundamental changes in trade patterns and paradigms that should lead to re-thinking aid for trade objectives and performance indicators. 1.2. Changing Trade Patterns and Paradigms: Re-Thinking Aid for Trade and Trade Targets The task to identify a menu of aid for trade targets and indicators has become even more complex in recent years due to rapid changes in trade patterns and paradigms, particularly since the 2008-09 crisis. Desired outcomes for aid for trade have changed since the launch of the initiative in 2005 and the creation of the Task Force in 2006; however, these changes do not seem to have been fully reflected in the aid for trade monitoring and evaluation practice yet. For example, the same way the statistics community is moving towards measuring trade in value-added, measuring the impact of aid for trade solely in terms of balance of payments net trade flows or increase in exports runs the risk of becoming quickly obsolete. Trade targets have moved, and objectives assigned to aid for trade should be reviewed accordingly.

MANAGING AID TO ACHIEVE TRADE AND DEVELOPMENT RESULTS: AN ANALYSIS ON TRADE-RELATED TARGETS 8
New trade patterns and paradigms: New aid for trade objectives The 2008-09 economic crisis has accelerated recent trends in international trade that should be reflected in the practice and evaluation of aid for trade: these include the shift in demand from OECD to emerging markets (Kaplinsky & Farooki, 2010), and the “second unbundling” (Baldwin, 2006) characterized by the split of production across countries and the prevalence of global value chains in business strategies. Four major changes in the trade and development paradigm could be taken into consideration in the assignment of new objectives and targets to aid for trade (Cattaneo and Miroudot, 2013): (1) The change of the relevant strategic framework, from countries to firms and global value
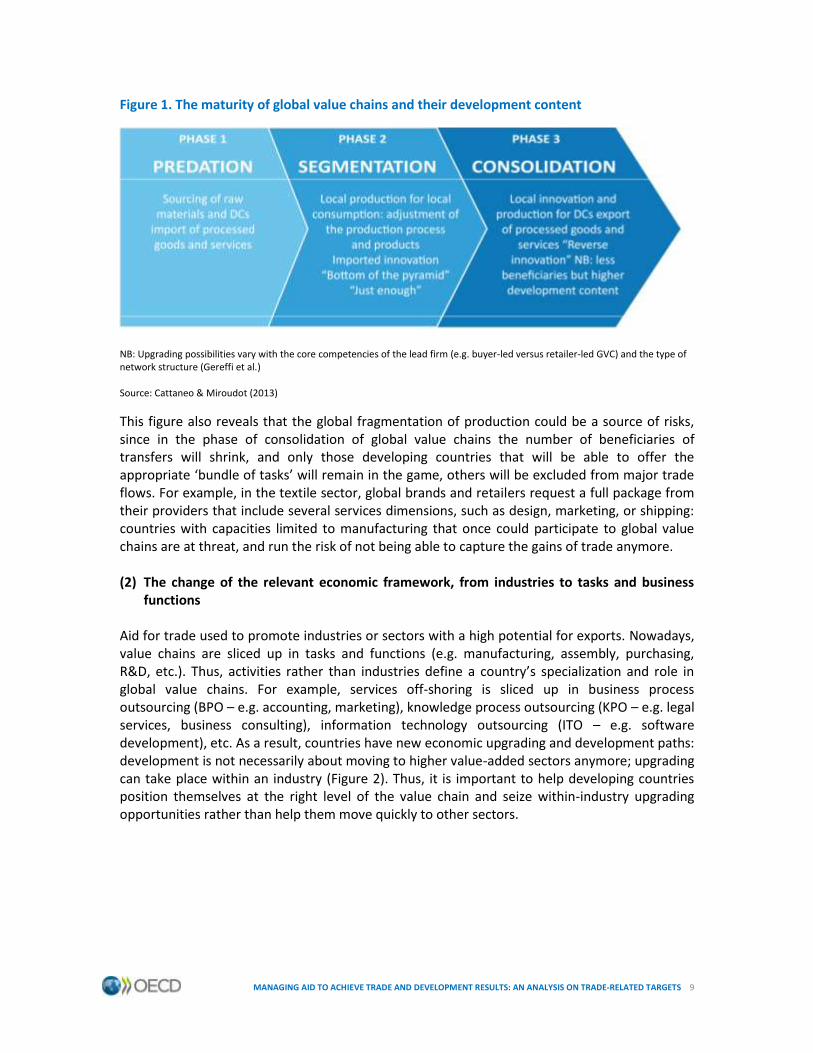
chains The global fragmentation of production is both a source of risks and opportunities for developing countries. A source of opportunities, first, because tasks that were previously executed in developed countries could now be outsourced to developing countries, creating local jobs and value-added, encouraging knowledge and technology transfers, etc. Most of trade now takes place within a production network (trade in intermediate goods and services represents 75% of global trade) or intra-firm. Thus, one of the main objectives of aid for trade could be to link developing countries to major global value chains and production networks. This is not trade promotion as it used to be: one cannot become a major exporter without becoming a major importer. Promoting trade integration is more inward looking than it used to be: it means attracting foreign investors (lead firms) through the improvement of the local business climate, for example by improving the security of investment or intellectual property protection, and facilitating trade flows up- and downstream the production, for example by reducing time for merchandises to cross borders, increasing the reliability of logistical chains, or reducing the costs of international communications. The more mature global value chains have become a major channel of socio-economic upgrading in developing countries with the delocalization of segments of production with a higher content in knowledge (i.e. creating higher-skill jobs) and technology (Staritz et al. 2011). Once confined in the richest countries, innovation started to move to developing countries along global value chains, first to serve the local markets, then to serve the countries of origin of lead multinational firms. Figure 1 suggests that it is not all about exports, but rather about joining the right global value chain to maximize the value for trade, i.e. transfers of all kinds from lead firms to developing countries.
MANAGING AID TO ACHIEVE TRADE AND DEVELOPMENT RESULTS: AN ANALYSIS ON TRADE-RELATED TARGETS 9
Figure 1. The maturity of global value chains and their development content
NB: Upgrading possibilities vary with the core competencies of the lead firm (e.g. buyer-led versus retailer-led GVC) and the type of network structure (Gereffi et al.) Source: Cattaneo & Miroudot (2013)
This figure also reveals that the global fragmentation of production could be a source of risks, since in the phase of consolidation of global value chains the number of beneficiaries of transfers will shrink, and only those developing countries that will be able to offer the appropriate ‘bundle of tasks’ will remain in the game, others will be excluded from major trade flows. For example, in the textile sector, global brands and retailers request a full package from their providers that include several services dimensions, such as design, marketing, or shipping: countries with capacities limited to manufacturing that once could participate to global value chains are at threat, and run the risk of not being able to capture the gains of trade anymore. (2) The change of the relevant economic framework, from industries to tasks and business
functions Aid for trade used to promote industries or sectors with a high potential for exports. Nowadays, value chains are sliced up in tasks and functions (e.g. manufacturing, assembly, purchasing, R&D, etc.). Thus, activities rather than industries define a country’s specialization and role in global value chains. For example, services off-shoring is sliced up in business process outsourcing (BPO – e.g. accounting, marketing), knowledge process outsourcing (KPO – e.g. legal services, business consulting), information technology outsourcing (ITO – e.g. software development), etc. As a result, countries have new economic upgrading and development paths: development is not necessarily about moving to higher value-added sectors anymore; upgrading can take place within an industry (Figure 2). Thus, it is important to help developing countries position themselves at the right level of the value chain and seize within-industry upgrading opportunities rather than help them move quickly to other sectors.

MANAGING AID TO ACHIEVE TRADE AND DEVELOPMENT RESULTS: AN ANALYSIS ON TRADE-RELATED TARGETS 10
Figure 2. New upgrading and development paths
Source: Cattaneo & Miroudot (2013)
(3) The change of the relevant economic assets, from endowments and stocks to flows Aid for trade is about technical assistance and capacity building. Nowadays, productivity and competitiveness are not only shaped by a country’s endowments, but also by the efficiency of backward and forward linkages (e.g. links with customers and retailers - forward, and efficient inputs - backward), as well as flows or transfers within global value chains (e.g. capital, knowledge, technology transfers from the lead firm to foreign branches or contractors). Private sector aid for trade case stories provide a number of examples of such transfers: they range from the training of farmers to the construction of high-tech infrastructure (World Bank, 2011). Hence, it should be an objective of aid for trade to facilitate those transfers (e.g. by improving the security of investment, or by fixing the intellectual property regime to encourage technology dissemination and transfer of R&D, design and other high value-added tasks) and to emulate and scale-up successful private-sector-led capacity building efforts. (4) The change of the relevant barriers/impetus, from public to private Finally, barriers to trade have changed: non-tariff barriers prevail over traditional obstacles at the border (e.g. tariffs, quotas), and private practices (e.g. anticompetitive behaviors, vertical agreements, private standards) threaten to become the new barriers to market access. This, again, suggests a new shift in aid for trade focus to help developing countries overcome those new barriers to trade (e.g. by promoting responsible business or investment principles, or reinforcing competition frameworks), and a need for further cooperation between public and private actors in trade capacity building.

MANAGING AID TO ACHIEVE TRADE AND DEVELOPMENT RESULTS: AN ANALYSIS ON TRADE-RELATED TARGETS 11
In sum, re-thinking aid for trade objectives implies a series of intellectual switches: from countries to global value chains; from exports to imports; from stocks to flows; from industries to tasks; from final to intermediate products or services; from public to private; from trade value to value for trade; etc. All these new dimensions of trade could be reflected in the way aid for trade is conceived and implemented.
MANAGING AID TO ACHIEVE TRADE AND DEVELOPMENT RESULTS: AN ANALYSIS ON TRADE-RELATED TARGETS 12
CHAPTER 2 Chapter 2
Towards Greater Value for Trade:
A Proposal for a Results-Based Aid for Trade Management Framework
This chapter presents a results-based aid for trade management framework (Annex 1) aimed at all development partners that lists three levels of possible objectives for aid for trade projects, as well as a menu of activities and performance indicators for each objective. It also explains the methodology and rationale behind the selection of the trade-related targets, and presents the possible uses and improvements to be made to this tool. 2.1. Building a New Set of Trade-Related Targets The following aims to provide development partners (donors and recipient countries, as well as other actors such as civil society organizations and private companies) with a logical framework for a results-based management of aid for trade. It identifies a set of trade-related targets or possible objectives for aid for trade projects, and lists a number of indicators to measure performance. A results-based aid for trade management framework: For whom and what purpose? Beyond the objectives of the development community spelled in Section 1.1 (i.e. donors’ coordination, impact assessment, benchmarking and cross-country comparison, results-based management, etc.), the suggested results-oriented management framework aims to facilitate the task of two specific actors:
(1) Aid recipient countries Ownership is the basis of a successful aid. The suggested framework puts the recipient country’s objectives at the core of aid for trade projects and the measurement of their results. It is built around a simple question: What is the country trying to achieve? By listing a number of possible objectives, it allows the recipient country to more easily understand the complex mechanics of trade, be aware of the tools aid for trade has to offer to achieve such objectives, and ultimately mainstream trade in its development programs. It also distinguishes between short, medium and long-term objectives to allow a proper management of expectations with regard results.
(2) Donors – and project leaders in particular By listing the objectives that could be assigned to aid for trade projects, and the indicators that could help measure the impact of the projects, the suggested framework considerably facilitates the task of donors and their project leaders. Upfront, the project leader can assess whether the project is trade-related (even if it might have been initially qualified otherwise), and whether the information that will allow impact assessment is available. Right at the beginning of the project,

MANAGING AID TO ACHIEVE TRADE AND DEVELOPMENT RESULTS: AN ANALYSIS ON TRADE-RELATED TARGETS 13
the project leader could fill in the project’s logical framework with baseline indicators against which the project’s results will be ultimately measured. The starting point will always remain, however, the objectives jointly set by the development partners, and not the performance indicators. Starting with the objective, not the measure of the objective It is important to establish a manageable number of trade-related indicators to avoid confusion and allow the coordination, comparison and benchmarking of aid projects (OECD, 2011). However, indicators should not become the drivers of the aid for trade agenda. Showing results is not only an imperative for donors, but also for recipient countries. Governments are looking for “quick wins” and results that can be easily communicated to the public at large. Ministers, within governments, are under pressure to show the importance of their role and actions to maintain their budget and position. As a result, following the emergence of a number of synthetic indicators of performance, governments have sometime put greater emphasis on the measure of the objective than on the objective itself. For example, a common request is “to move up in the Doing Business rankings”: this means playing with a small number of indicators that affect the overall ranking. A minister of transport could also be explicitly asked by her Prime minister “to move up in the Logistics Performance Index (LPI) rankings”. Setting government priorities according to such targets could contribute to missing some of a country’s specific needs: some more urgent reforms could be needed that are not captured by the synthetic indices or indicators. Moreover, rankings are relative: a country can improve its performance but still regress in rankings if other countries achieved faster results for their reforms. Synthetic indicators and rankings are good drivers of political will and reforms. Nonetheless, in order to avoid the above-described biases, the suggested framework puts the objectives first, and not the measures of these objectives. Trade is an intermediate objective in the aid for trade chain of results The main issue raised by literature on aid for trade evaluation is that of attribution (OECD, 2011). Aid for trade, and trade policy at large, are often perceived as aiming solely for an increase in exports and trade flows at large. However, it is difficult to show the link between a given aid for trade project and changes in trade flows, and even more difficult to show the link between trade, growth and poverty reduction. Indeed, many factors influence trade, and an aid for trade project could be successful at the same time an exogenous shock causes the country’s terms of trade to deteriorate; even more factors influence growth and poverty reduction. The suggested framework presents trade as an intermediate objective of aid for trade. It is a link in a chain of results. It is a transmission mechanism that will allow the creation of better and more remunerated jobs, the diffusion of new technologies, political stability, etc. – final objectives that appeal more to policy makers and the general public, and that more concretely affect the lives of people than balance of payments data on trade flows. The objective is not only to have more trade, but more value for trade. The suggested framework proposes a few indicators that measure this value for trade. Three current debates could help justify this methodological choice:
MANAGING AID TO ACHIEVE TRADE AND DEVELOPMENT RESULTS: AN ANALYSIS ON TRADE-RELATED TARGETS 14
(1) The impact of WTO membership or regional trade agreements on trade Support to WTO accession or regional trade integration is commonly provided in the context of aid for trade. At the same time, there is no consensus in the economic literature that WTO membership or participation to a plurilateral trade agreement actually increases trade.3 An analysis of the political economy of these agreements even suggests that they primarily serve non-economic objectives, such as political stability (Cattaneo, 2009). In such case, while trade could remain an intermediate objective, the value for trade is measured in terms of political stability or whatever objectives assigned to the conclusion of the agreement. For example, could one measure the success of the European integration solely against trade flows? In the spirit of the fathers of Europe, trade was clearly an intermediate objective that would increase solidarity and interdependence between France and Germany to make future wars practically impossible.4
(2) Trade and socio-economic upgrading Recent work on socio-economic upgrading – hence poverty reduction – suggests that development perspectives within global value chains depend on the maturity of such chains and the origin of the lead firm or demand (Staritz et al., 2012). Thus, more trade does not necessarily mean better development prospects. Trade growth can sometime coincide with socio-economic economic downgrading, i.e. a diminishing value for trade. Kaplinsky & al. (2011) provide the example of the impact of the shift in demand from Europe to China of timber and cassava productions respectively in Gabon and Thailand. While exports to China grew at a fast pace, transformation industries progressively disappeared in Gabon and Thailand, and the importance of standards (including sustainable management of natural resources) declined. This resulted in serious political distress in those countries, as illustrated by the ban of exports of wooden logs in Gabon in 2009, and the obligation to locally transform up to 80% of the exports. The French government also designed in 2011 an aid for trade project to reverse this trend and help the organization of the timber value chain in Gabon. Such trade patterns also affect OECD countries, e.g. in France where exports of logs to China explode when the local transformation industries are at risk of bankruptcy.5 Thus, trade growth is mostly desirable when the value for trade simultaneously increases, and the ultimate objectives of the country (in the case of timber production) remain its socio-economic upgrading (i.e. capturing more value-added) and the sustainable of its natural resources. In sum, trade is an essential link of a chain of results: it is a necessary but not sufficient condition for development.
(3) Measuring trade The previous example illustrates the challenges raised by the measurement of trade: a country, like China, that is at the end of the global production value chain, and sometime confined to low value-added tasks such as assembly, could have a significant trade surplus without creating much wealth for its people. Both the WTO Director General and the OECD Secretary General have stressed that the way trade is measured has become obsolete in times of global fragmentation of the production, engaging their organizations to launch a joint initiative aimed at measuring trade in value-added (OECD-WTO, 2011).6 Born in the context of international debates on global imbalances, this switch of mind and practice should be reflected in the aid for
3 See for instance the debate launched by Rose, A. K. (2004), "Do We Really Know That The WTO Increases Trade?",
American Economic Review, vol. 94, n°1, pp. 98-114. 4 Schuman, R., Declaration of 9 May 1950, Paris.
5 Garric, A. (2012), “La France exporte de plus en plus son bois vers la Chine”, Le Monde, 20 July.
6 See for instance Lamy, P. (2011), “Made in China Tell us Little about Global Trade”, Financial Times, 24 January;
Gurria, A. (2012), “G20: Understanding Global Value Chains”, Speech at G20 Ministers’ Meeting, Mexico, 19 April.
MANAGING AID TO ACHIEVE TRADE AND DEVELOPMENT RESULTS: AN ANALYSIS ON TRADE-RELATED TARGETS 15
trade agenda. Measuring the impact of aid for trade with old-style trade data, such as balance of payments accounts, would be equally obsolete. Here again, what matters is the value for trade that each country receives (value-added captured by the country that corresponds to activity, jobs, etc.) more than the value of trade in balance of payments terms. Three levels of objectives and possible outcomes If trade is an intermediate objective, the aid for trade management framework could include several levels of objectives and performance indicators. This approach is dictated, more broadly, by the attribution issue: it is unlikely that one project alone will have a significant – if any – impact that is observable at the balance of payments level. This does not mean, however, that the project would not have been successful. For instance, it is enough to show that a training session or another form of technical assistance has prompted a significant change in government practice to claim success; making the link with trade flows, growth and poverty reduction would be too-far-reaching. Nonetheless, the results-oriented management framework should allow for both individual and collective evaluations, since the combination and synergy of multiple aid for trade projects are more likely to have broader macroeconomic effects. Mapping all the projects and measuring their individual and collective impacts could help improving the efficiency of aid for trade. The suggested framework could be assimilated as a chain of results: it distinguishes three levels of objectives and possible outcomes/impacts for aid for trade, that are qualified as ‘direct’, ‘intermediate’, and ‘final’, using the terminology of e.g. the Japan International Cooperation Agency (see JICA, 2005). Using a broader terminology, ‘direct’ and ‘intermediate’ objectives are so-called ‘outcomes’, and ‘final’ objectives are so-called ‘impacts’. The suggested framework does not deal with the so-called ‘output’ level, since outputs are usually easy to identify and project-specific: for example, in the case of a technical assistance seminar, the output is the seminar itself; the difficulty arises when one tries to measure the impact of the seminar, i.e. identify outcomes. This repartition of objectives according to levels could also reflect the timing of the anticipated results, respectively in the short, medium, and long terms. Each project individually, and aid for trade as a whole, could be reviewed through this prism.

MANAGING AID TO ACHIEVE TRADE AND DEVELOPMENT RESULTS: AN ANALYSIS ON TRADE-RELATED TARGETS 16
Box 1. The mechanics of aid for trade as an engine of growth and development The engine (direct outcomes) Aid for trade is a toolbox: it consists in a number of tools that are available to aid-recipient countries (or any country) in need of building or improving the performance of their trade engine. Each tool has a specific purpose and can help the assembly of a specific part of the engine. Depending on the country’s situation, the engine might need more or less tuning. It is unlikely that one can build an engine with a single tool: trade is a complex mechanic. Countries have to identify their needs (with help from local actors, including private sector, and international community, e.g. DTIS). Performance could already be tested at this level, the same way an engine is tested after assembly and before it is attached to the body of the car.
The transmission (intermediate outcomes) It is not enough to have an engine: you need a transmission mechanism to make the car run. Trade is a transmission mechanism. Here again, depending on the country, this transmission mechanism could be altered in different ways, or a different type of transmission might be needed. Different intermediate objectives could be assigned to trade policies depending on the situation of the country. Typically, landlocked countries will try to improve their connectivity to foreign markets (direct) in order to reduce their trade costs and the price of inputs (intermediate); fragile states will need to improve their business climate, lock-in reforms through international
commitments and restore the trust of investors (intermediate) to achieve greater political stability (and vice versa) (final); oil-producing countries will need to diversify their economy and attract investors in non-oil sectors (intermediate); countries at the bottom of the value chain will need to upgrade (final) through the participation to more mature global value chains and the reallocation of their production capacities (intermediate). It is possible to make a typology of intermediate objectives and outcomes on the basis of broad country categories. However, individual situations of countries remain different, and country ownership should incite the donor community to refrain from dictating objectives to countries on the basis on the needs of a pre-defined category. The efficiency (final outcomes) Ultimately, what matters is the performance of the car. Depending on the type of engine and transmission, different rates of efficiency are attained. Efficiency does not necessarily depend on the size of the engine or the length of the transmission. The value for trade measures the efficiency of the trade car.
(1) Level 1: Direct objectives/outcomes (competitiveness and openness)
The first level of the suggested framework assigns possible objectives/outcomes to aid for trade projects. It directly answers the question: ‘what are you trying to achieve?’ and provides a guide to recipient countries and donors about the reforms needed or tools available to manage openness and increase competitiveness. These are tentatively classified according to the Aid for Trade Task Force activity categories. Box 2 presents those objectives. This list is supplemented in Annex 1 by a list of possible reforms/projects that would target those objectives. For example, the objective to

MANAGING AID TO ACHIEVE TRADE AND DEVELOPMENT RESULTS: AN ANALYSIS ON TRADE-RELATED TARGETS 17
suppress/reduce obstacles to trade at the border could be achieved through the suppression of quotas, the reduction of tariffs, the simplification of customs procedures, etc. Suggested trade-related indicators measure the level of achievement of those projects’ objectives. The success of aid for trade projects could thus be measured independently of the achievement of intermediate or final outcomes. For example, if a training course leads to a significant change in the recipient country’s trade policy (e.g. adoption of new rules or practices), it could be considered as successful, without trying to find a causal link between this training course and changes in trade flows or poverty reduction. Of course, some projects will also have intermediate and final outcomes (e.g. the opening of a services sector to competition), but it might be the sum of smaller projects with direct outcomes only that might hit intermediate and final targets. Thus, the suggested framework allows for the evaluation of individual projects, as well as for the sum of aid for trade projects of a specific donor or a group of donors.
Box 2. Direct objectives/outcomes (competitiveness and openness)
Technical assistance for trade policy and regulations
Suppression/reduction of obstacles to trade at the border
Suppression/reduction of trade-distortive or discriminatory measures beyond the border
Mainstreaming and promotion of trade, trade integration and investment
Economic infrastructure
Improvement of the accessibility/connectivity of the market (telecoms and transport)
Improvement of other domestic infrastructure and basic services
Productive capacity building
Improvement of the legal/regulatory environment for business
Improvement of the organization and performance of markets
Increase in productivity, production and innovation capacities
Trade-related adjustment
Adjustment to tariff and price fluctuations
Restructuration of industries/sectors facing a trade shock
Provision of safety nets and training opportunities for workers affected by trade
Other forms of adjustment
Facilitation of the movement of productive capacities
Enforcement of trade-related rights and obligations
Promotion of responsible business/investment principles and practices
MANAGING AID TO ACHIEVE TRADE AND DEVELOPMENT RESULTS: AN ANALYSIS ON TRADE-RELATED TARGETS 18
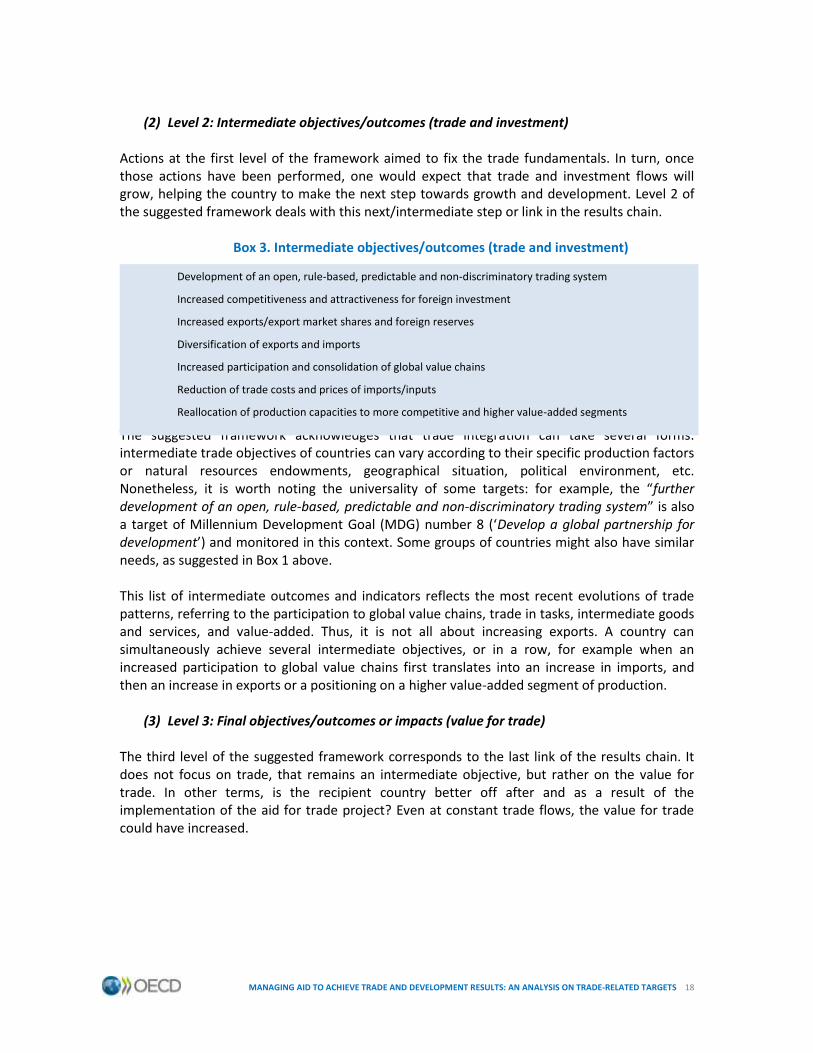
(2) Level 2: Intermediate objectives/outcomes (trade and investment)
Actions at the first level of the framework aimed to fix the trade fundamentals. In turn, once those actions have been performed, one would expect that trade and investment flows will grow, helping the country to make the next step towards growth and development. Level 2 of the suggested framework deals with this next/intermediate step or link in the results chain.
Box 3. Intermediate objectives/outcomes (trade and investment)
The suggested framework acknowledges that trade integration can take several forms: intermediate trade objectives of countries can vary according to their specific production factors or natural resources endowments, geographical situation, political environment, etc. Nonetheless, it is worth noting the universality of some targets: for example, the “further development of an open, rule-based, predictable and non-discriminatory trading system” is also a target of Millennium Development Goal (MDG) number 8 (‘Develop a global partnership for development’) and monitored in this context. Some groups of countries might also have similar needs, as suggested in Box 1 above. This list of intermediate outcomes and indicators reflects the most recent evolutions of trade patterns, referring to the participation to global value chains, trade in tasks, intermediate goods and services, and value-added. Thus, it is not all about increasing exports. A country can simultaneously achieve several intermediate objectives, or in a row, for example when an increased participation to global value chains first translates into an increase in imports, and then an increase in exports or a positioning on a higher value-added segment of production.
(3) Level 3: Final objectives/outcomes or impacts (value for trade) The third level of the suggested framework corresponds to the last link of the results chain. It does not focus on trade, that remains an intermediate objective, but rather on the value for trade. In other terms, is the recipient country better off after and as a result of the implementation of the aid for trade project? Even at constant trade flows, the value for trade could have increased.
Development of an open, rule-based, predictable and non-discriminatory trading system
Increased competitiveness and attractiveness for foreign investment
Increased exports/export market shares and foreign reserves
Diversification of exports and imports
Increased participation and consolidation of global value chains
Reduction of trade costs and prices of imports/inputs
Reallocation of production capacities to more competitive and higher value-added segments
MANAGING AID TO ACHIEVE TRADE AND DEVELOPMENT RESULTS: AN ANALYSIS ON TRADE-RELATED TARGETS 19
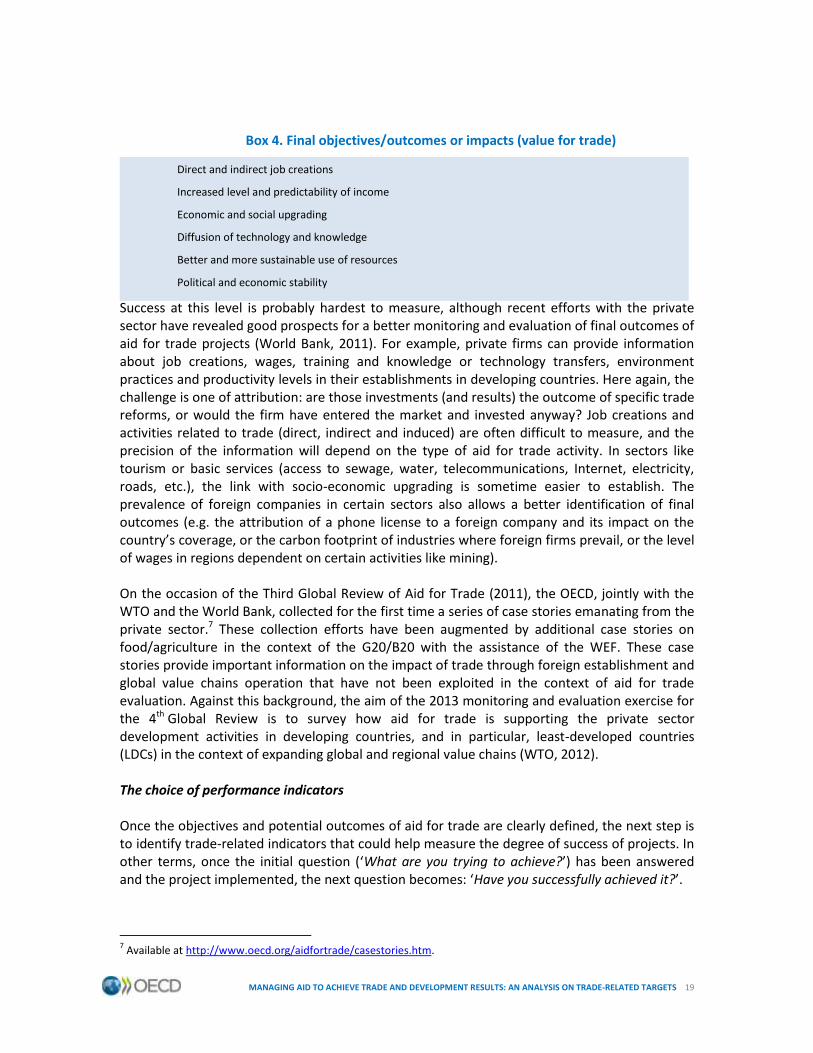
Box 4. Final objectives/outcomes or impacts (value for trade)
Success at this level is probably hardest to measure, although recent efforts with the private sector have revealed good prospects for a better monitoring and evaluation of final outcomes of aid for trade projects (World Bank, 2011). For example, private firms can provide information about job creations, wages, training and knowledge or technology transfers, environment practices and productivity levels in their establishments in developing countries. Here again, the challenge is one of attribution: are those investments (and results) the outcome of specific trade reforms, or would the firm have entered the market and invested anyway? Job creations and activities related to trade (direct, indirect and induced) are often difficult to measure, and the precision of the information will depend on the type of aid for trade activity. In sectors like tourism or basic services (access to sewage, water, telecommunications, Internet, electricity, roads, etc.), the link with socio-economic upgrading is sometime easier to establish. The prevalence of foreign companies in certain sectors also allows a better identification of final outcomes (e.g. the attribution of a phone license to a foreign company and its impact on the country’s coverage, or the carbon footprint of industries where foreign firms prevail, or the level of wages in regions dependent on certain activities like mining). On the occasion of the Third Global Review of Aid for Trade (2011), the OECD, jointly with the WTO and the World Bank, collected for the first time a series of case stories emanating from the private sector.7 These collection efforts have been augmented by additional case stories on food/agriculture in the context of the G20/B20 with the assistance of the WEF. These case stories provide important information on the impact of trade through foreign establishment and global value chains operation that have not been exploited in the context of aid for trade evaluation. Against this background, the aim of the 2013 monitoring and evaluation exercise for the 4th Global Review is to survey how aid for trade is supporting the private sector development activities in developing countries, and in particular, least-developed countries (LDCs) in the context of expanding global and regional value chains (WTO, 2012). The choice of performance indicators Once the objectives and potential outcomes of aid for trade are clearly defined, the next step is to identify trade-related indicators that could help measure the degree of success of projects. In other terms, once the initial question (‘What are you trying to achieve?’) has been answered and the project implemented, the next question becomes: ‘Have you successfully achieved it?’.
7 Available at http://www.oecd.org/aidfortrade/casestories.htm.
Direct and indirect job creations
Increased level and predictability of income
Economic and social upgrading
Diffusion of technology and knowledge
Better and more sustainable use of resources
Political and economic stability
MANAGING AID TO ACHIEVE TRADE AND DEVELOPMENT RESULTS: AN ANALYSIS ON TRADE-RELATED TARGETS 20
The suggested framework presents a number of indicators that could serve this evaluation purpose. It aims “to establish a menu of indicators, although not a definitive or comprehensive one, … reasonably representative of the essential characteristics of aid for trade per activity
sector, as defined by the Aid for Trade Task Force, … that would also be subject to improvement over time as the knowledge base improves” (OECD, 2011, p.92). It is an evolving tool that could be amended by all the development actors, in the public as well as the private spheres. One benefit of this menu is that, while the list of indicators is lengthy, recipient countries and donors are channeled through this ‘maze’ or ‘cloud’ with a limited number of indicators corresponding to each objective assigned to aid for trade projects. Had the measure of the objective prevailed in the methodology, this selectivity would not have been possible. This menu does not create a new set of trade-related indicators: it raises awareness, uses and organizes existing indicators that have lacked visibility among donors and recipient countries, absent the link between the objectives of the projects and their monitoring/evaluation. Every single manager of an aid project should know what her project is trying to achieve; however, she is not necessarily aware of the multiplicity of trade databases and trade-related indicators that exist beyond balance of payments statistics. With a view to avoid any duplication of efforts, this menu relies on existing trade-related indicators compilation efforts made by the donor community, as well as specialized agencies and the private sector. In particular it makes reference to the World Bank World Trade Indicators (WTI) and the World Economic Forum (WEF) Global Competitiveness Index, that both provide a fairly detailed list of trade-related indicators, and reflect both the views of donors and the private sector about what matters in trade. These two lists compile information collected by other entities, hence sometime overlap. The WTI is a subset of the World Bank World Development Indicators that is a reliable open source of data that is more comprehensive and includes all relevant information – the WTI potential discontinuity therefore does not affect the availability of information; the WEF Trade Enabling Index also partially overlaps with the Global Competitiveness Index and could be used as a more targeted source of indicators from the WEF. They are supplemented by indicators published by other specialized agencies, and could be amended over time, in particular to include sector-specific indicators (e.g. for telecommunications, transports, logistics, tourism, etc.). The suggested menu of objectives and indicators was designed to capture most of the dimensions of aid for trade and its direct as well as indirect effects. It attempts to include quantitative as well as qualitative indicators, since the outcome of some activities (typically training) is hardly measurable. It should be noted that some sectors already have fairly detailed information and data on direct and indirect effects of trade: for example, tourism has been subject to more scrutiny than many other sectors.

MANAGING AID TO ACHIEVE TRADE AND DEVELOPMENT RESULTS: AN ANALYSIS ON TRADE-RELATED TARGETS 21
Box 5. The Travel and Tourism Satellite Account: An example of systematic assessment of direct, indirect and induced trade effects
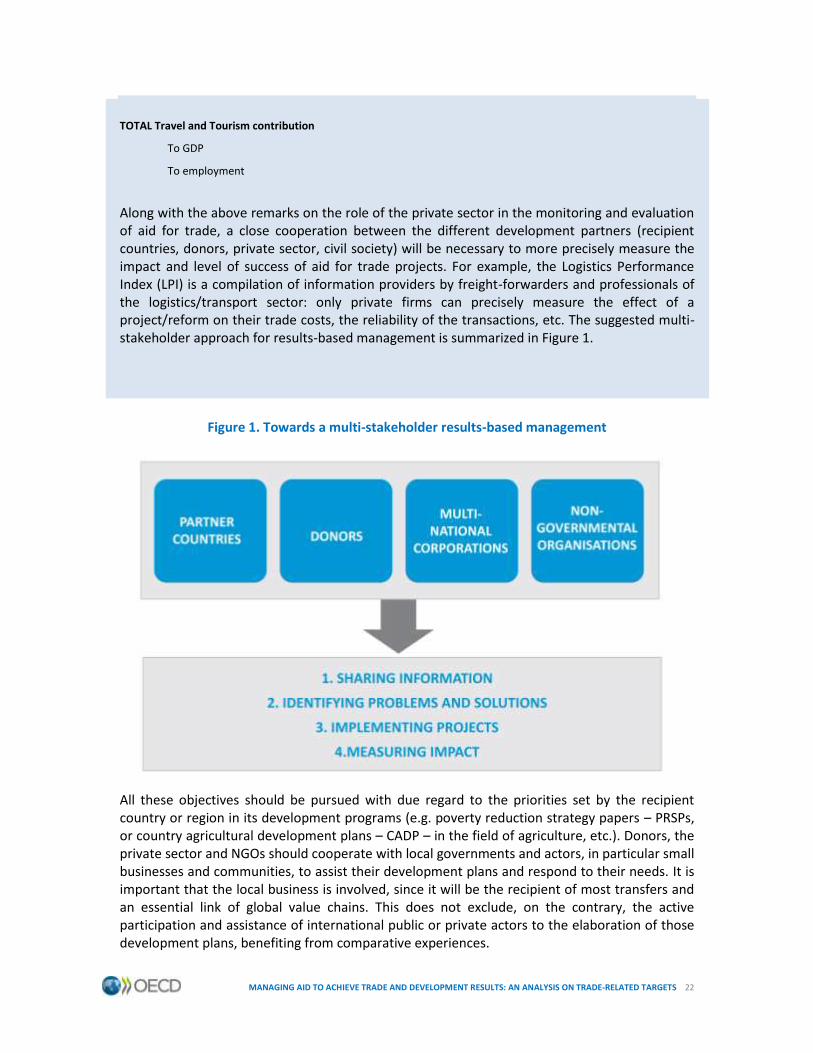
Travel and tourism is an important economic activity in many countries of the world, both developed and developing. Nonetheless, it has been subject to a number of controversies, including about the benefits for the host country: capture of benefits by foreign operators or hotel groups, wages and labor conditions, etc. Here again, a distinction had to be made between trade and value for trade: the ultimate objective is for the host country to benefit from more and better jobs, better infrastructure, etc. As part of this effort, the World Travel and Tourism Council (WTTC) has developed an accounting methodology that aims to capture the direct, indirect and induced impacts of the sector. This could serve as an example for many services (and even manufacturing or agricultural) sectors. The list of the T&T contributions to the economy suggests that focusing on trade flows alone (e.g. the balance of payments statistics on travel and tourism) would not adequately reflect the performance of an aid for trade project in the T&T sector. At the end, what matters is the combined effect of direct, indirect and induced effects (jobs, etc.) rather than the amount of trade. DIRECT Travel and Tourism contribution
COMMODITIES
Accommodation
Transportation
Entertainment
Attractions
INDUSTRIES
Accommodation services
Food and beverage services
Retail trade
Transportation services
Cultural, sports and recreational services
SOURCES OF SPENDING
Residents’ domestic T&T spending
Business’ domestic travel spending
Visitor exports
Individual government T&T spending
INDIRECT Travel and Tourism contribution
T&T investment spending
Government collective T&T spending
Impact of purchases from suppliers
INDUCED contribution (spending of direct and indirect employees)
Food and beverages
Recreation
Clothing
Housing
Household goods
MANAGING AID TO ACHIEVE TRADE AND DEVELOPMENT RESULTS: AN ANALYSIS ON TRADE-RELATED TARGETS 22
TOTAL Travel and Tourism contribution
To GDP
To employment
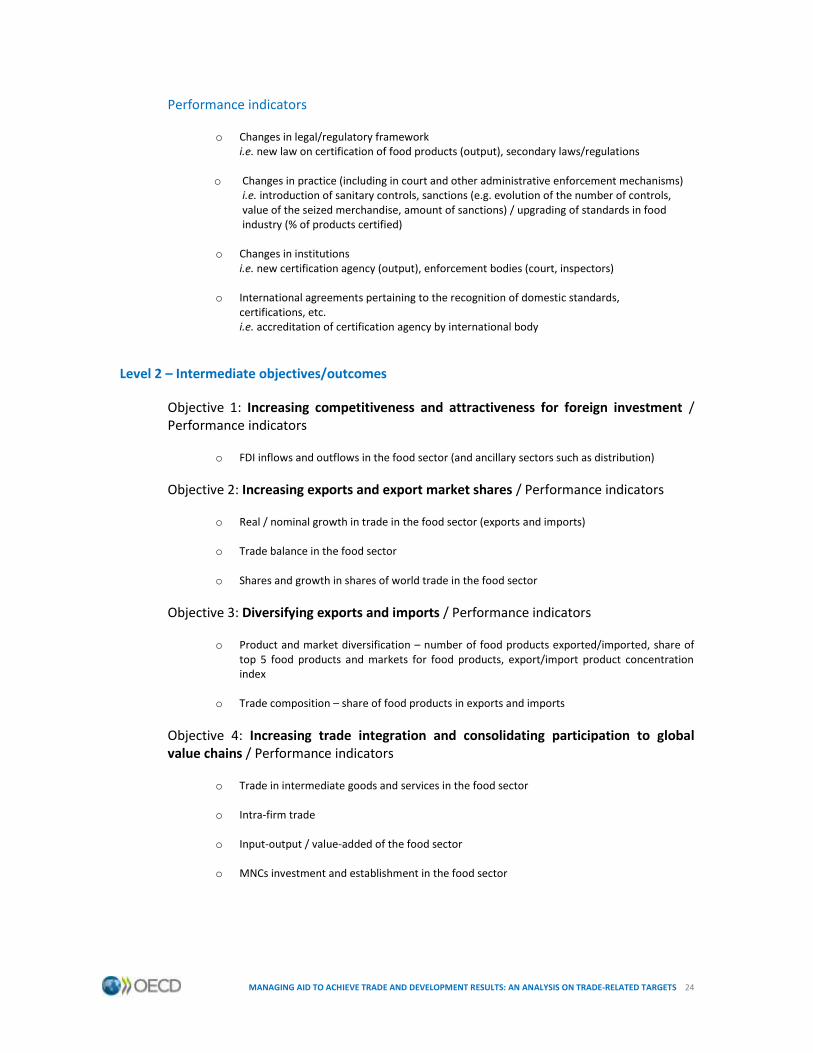
Along with the above remarks on the role of the private sector in the monitoring and evaluation of aid for trade, a close cooperation between the different development partners (recipient countries, donors, private sector, civil society) will be necessary to more precisely measure the impact and level of success of aid for trade projects. For example, the Logistics Performance Index (LPI) is a compilation of information providers by freight-forwarders and professionals of the logistics/transport sector: only private firms can precisely measure the effect of a project/reform on their trade costs, the reliability of the transactions, etc. The suggested multi-stakeholder approach for results-based management is summarized in Figure 1.
Figure 1. Towards a multi-stakeholder results-based management
All these objectives should be pursued with due regard to the priorities set by the recipient country or region in its development programs (e.g. poverty reduction strategy papers – PRSPs, or country agricultural development plans – CADP – in the field of agriculture, etc.). Donors, the private sector and NGOs should cooperate with local governments and actors, in particular small businesses and communities, to assist their development plans and respond to their needs. It is important that the local business is involved, since it will be the recipient of most transfers and an essential link of global value chains. This does not exclude, on the contrary, the active participation and assistance of international public or private actors to the elaboration of those development plans, benefiting from comparative experiences.

MANAGING AID TO ACHIEVE TRADE AND DEVELOPMENT RESULTS: AN ANALYSIS ON TRADE-RELATED TARGETS 23
Figure 2. Country-ownership and multi-stakeholder dialogue
2.2. What This New Framework Could, and Could Not, Help Achieve Methodology: How to use the framework and for what purpose? The results-based management framework aims (1) to help development partners identify aid for trade activities and objectives for achieving greater value for trade, and (2) to measure the impact of aid for trade projects that have been implemented. The starting point of the analysis could be either the choice of the direct outcome (or objective) or the choice of the activity (aid for trade project or output). For example, if the objective is to improve SPS standards, and the aid for trade project consists in drafting a law and creating a certification agency:
Level 1 – Direct objectives/outcomes
Objective: Improving the legal/regulatory/business environment
o SPS standards i.e. certification of food products
Activity:
o Capacity building for certification and accreditation (labs, personnel, resources, etc.) i.e. technical assistance to draft the law and create a certification agency
MANAGING AID TO ACHIEVE TRADE AND DEVELOPMENT RESULTS: AN ANALYSIS ON TRADE-RELATED TARGETS 24
Performance indicators
o Changes in legal/regulatory framework i.e. new law on certification of food products (output), secondary laws/regulations
o Changes in practice (including in court and other administrative enforcement mechanisms) i.e. introduction of sanitary controls, sanctions (e.g. evolution of the number of controls, value of the seized merchandise, amount of sanctions) / upgrading of standards in food industry (% of products certified)
o Changes in institutions i.e. new certification agency (output), enforcement bodies (court, inspectors)
o International agreements pertaining to the recognition of domestic standards, certifications, etc. i.e. accreditation of certification agency by international body
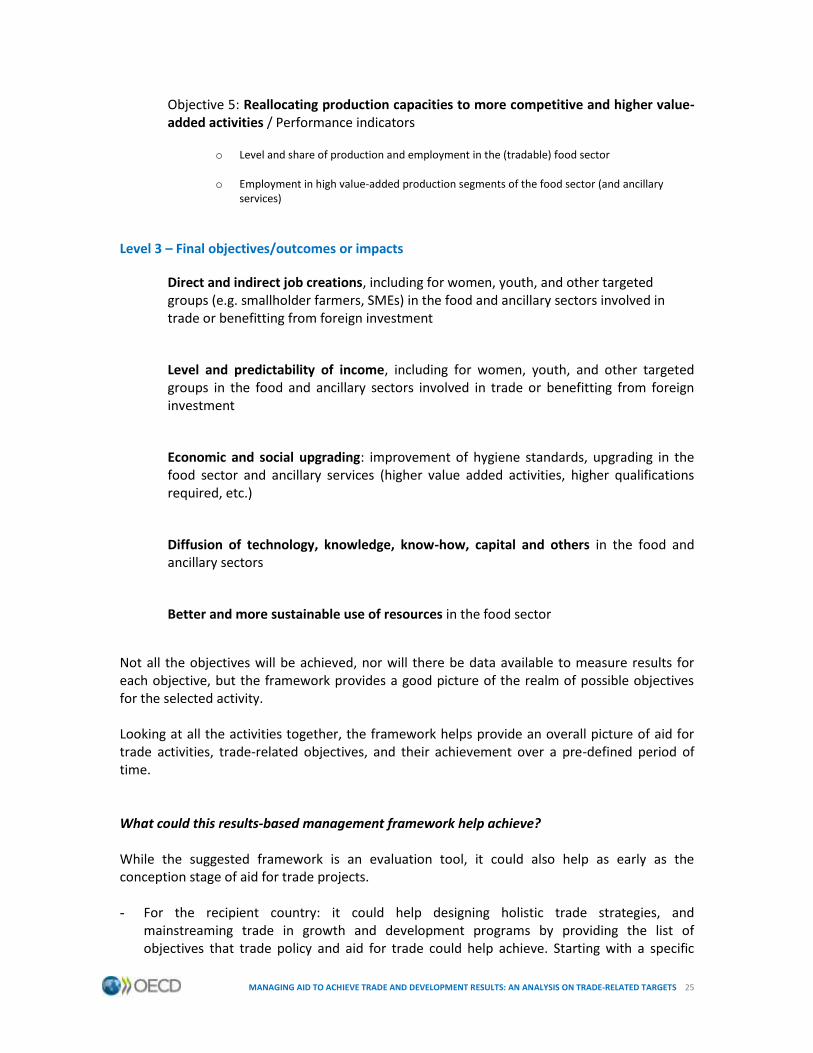
Level 2 – Intermediate objectives/outcomes
Objective 1: Increasing competitiveness and attractiveness for foreign investment / Performance indicators
o FDI inflows and outflows in the food sector (and ancillary sectors such as distribution)
Objective 2: Increasing exports and export market shares / Performance indicators
o Real / nominal growth in trade in the food sector (exports and imports)
o Trade balance in the food sector
o Shares and growth in shares of world trade in the food sector
Objective 3: Diversifying exports and imports / Performance indicators
o Product and market diversification – number of food products exported/imported, share of top 5 food products and markets for food products, export/import product concentration index
o Trade composition – share of food products in exports and imports
Objective 4: Increasing trade integration and consolidating participation to global value chains / Performance indicators
o Trade in intermediate goods and services in the food sector
o Intra-firm trade
o Input-output / value-added of the food sector
o MNCs investment and establishment in the food sector
MANAGING AID TO ACHIEVE TRADE AND DEVELOPMENT RESULTS: AN ANALYSIS ON TRADE-RELATED TARGETS 25
Objective 5: Reallocating production capacities to more competitive and higher value-added activities / Performance indicators
o Level and share of production and employment in the (tradable) food sector
o Employment in high value-added production segments of the food sector (and ancillary services)
Level 3 – Final objectives/outcomes or impacts
Direct and indirect job creations, including for women, youth, and other targeted groups (e.g. smallholder farmers, SMEs) in the food and ancillary sectors involved in trade or benefitting from foreign investment
Level and predictability of income, including for women, youth, and other targeted groups in the food and ancillary sectors involved in trade or benefitting from foreign investment
Economic and social upgrading: improvement of hygiene standards, upgrading in the food sector and ancillary services (higher value added activities, higher qualifications required, etc.)
Diffusion of technology, knowledge, know-how, capital and others in the food and ancillary sectors
Better and more sustainable use of resources in the food sector
Not all the objectives will be achieved, nor will there be data available to measure results for each objective, but the framework provides a good picture of the realm of possible objectives for the selected activity. Looking at all the activities together, the framework helps provide an overall picture of aid for trade activities, trade-related objectives, and their achievement over a pre-defined period of time. What could this results-based management framework help achieve? While the suggested framework is an evaluation tool, it could also help as early as the conception stage of aid for trade projects. - For the recipient country: it could help designing holistic trade strategies, and
mainstreaming trade in growth and development programs by providing the list of objectives that trade policy and aid for trade could help achieve. Starting with a specific

MANAGING AID TO ACHIEVE TRADE AND DEVELOPMENT RESULTS: AN ANALYSIS ON TRADE-RELATED TARGETS 26
objective, the country could identify relevant types of actions and aid for trade projects supporting the necessary reforms. Starting with a specific activity or reform, the country could identify a number of objectives to achieve. The country could also use the full list of trade-related targets to design a more comprehensive trade strategy. Finally, the list of final outcomes and the focus on the value for trade should help making a stronger case for trade in government strategies.
- For the donor (or task manager): it could help assigning specific objectives to a given activity, and provides at the inception stage of the project an indication about the kind of data or evidence that will be needed at the evaluation stage. With a list of possible targets for specific activities or objectives at hand, the task manager could more easily fill in logical frameworks and other project documents. Indeed, most of the time, task managers are not aware of all possible intermediate or final outcomes of a project, and even less so of all existing indicators and databases available to set targets for their project.
The framework reveals the diversity of objectives and possible outcomes/impacts assigned to aid for trade projects: it is not only about reducing traditional barriers to trade, and it is not only about boosting exports. All the reforms affecting a country’s competitiveness or attractiveness for investors could have trade affects: these include reforms affecting security, governance and corruption, health, education, etc. For the first time, a results-based management framework also reflects the recent changes in the trade paradigm, including the role of global value chains, and the value for trade rather than trade value. The framework could help the census/monitoring of aid for trade activities and the mainstreaming of trade in aid projects (by revealing the trade dimension of projects led by non-trade specialists). This would also help solving one of the main problems faced by evaluators: the absence of clear link with trade objectives. Beyond the evaluation of single projects, the framework should help countries assess the overall impact of their aid for trade activities – and the list of indicators could, more broadly, help the governments measure their trade performance (e.g. competitiveness, connectivity, attractiveness, value for trade), pointing where needed to gaps in statistics and data on trade. Indeed, much is about synergy and combined effects of individual activities. The framework should help to map a country’s efforts according to the type of activity, the assigned objectives, and the direct/intermediate/final outcomes. The same could be done for the donors’ community as a whole. In addition, it could help: - Identify the concentration of the donors’ efforts on specific types of activities or outcomes; - Identify complementarities of activities to achieve specific results; - Identify links between specific activities and direct/intermediate/final outcomes; - Measure the overall impact of aid for trade projects, either globally or by recipient country.8 Using and improving the aid for trade results-based management framework As already mentioned, this framework should be seen as an evolving tool: practitioners could add new activities and targets to the existing menu. The framework could play the role of a repertory of ideas for aid for trade project management. However, the objective is not to have a cloud of indicators: synthetic indicators, when they exist, should be used in priority. The menu
8 See Annex 5 for tentative graphic presentations of those analyses.

MANAGING AID TO ACHIEVE TRADE AND DEVELOPMENT RESULTS: AN ANALYSIS ON TRADE-RELATED TARGETS 27
of indicators could also help developing new synthetic indicators that would in turn contribute to the simplification of the framework. Harmonization beyond the point reached in this framework (harmonization of the list of trade-related targets or outcomes) might not even be desirable. “Harmonization of indicators among development partners is neither feasible nor desirable given the differences in operational needs and strategic priorities” (OECD, 2011, p. 91). In other terms, the suggested framework is a tool to help donors and recipient countries design their trade and development strategies. Each donor and each recipient country will have to define its own priorities. The framework is mostly helpful in the sense that it provides, for given activities, a likely chain of results; reversely, for a given desired outcome or impact, it suggests a number of activities likely to contribute to that outcome or impact. Then, donor and recipient countries can more easily identify their priorities and articulate their action with other projects of their own or their partners. The framework also helps making the sum of the donor and recipient country’s programs to identify overlaps, synergies, gaps, etc. and hence help donors’ coordination. For instance, one donor or recipient country might be mostly interested in creating jobs for women and the youth (final outcome); the question then becomes how could trade and investment contribute to that final outcome (i.e. what industries or tasks need a boost of exports, competitiveness, FDI – intermediate outcome); and ultimately, what specific trade constraints are those sectors facing that need to be addressed (direct outcomes)? The existence of the harmonized framework should help to avoid the biases described in the recent meta-evaluation of aid for trade projects, i.e. the absence of trade-related objectives or results in aid for trade projects. Computer technology should also be used to make the framework user-friendly. The first step is to create an interactive tool that would allow the user to select different variables in drop-down menus: after selecting a certain activity or objective, the user would be offered a limited list of possible outcomes and performance indicators to choose from. It is also possible to imagine that links to the referred databases or indicators would be provided. The electronic interactive tool could also allow choosing a specific country or region, and limit the choice of indicators to those for which data is available in that country or region. Similarly, the menu could be tailored to specific sectors. It could also contain CRS codes and other elements facilitating reporting or analysis.

MANAGING AID TO ACHIEVE TRADE AND DEVELOPMENT RESULTS: AN ANALYSIS ON TRADE-RELATED TARGETS 28
Figure 1. Example of template for the interactive tool
One could also imagine that this tool could be used to increase the coordination of donors, development actors (including civil society), and the private sector. For instance, a donor could ask the private companies that benefit from an aid for trade project to provide evidence or data to the impact of the project. By scrolling down the menus, the company could identify the information it has available and is willing to share (e.g. reduction of transit time or trade costs as a result of a customs reform, reduction of production costs as a result of a new infrastructure, job creations as a result of the opening of the market to foreign establishment, etc.). Remaining issues The framework is a first step towards harmonization, providing a menu of possible objectives/outcomes/impacts and performance indicators for aid for trade. However, using the terminology of the UN MDGs, if the goals (and indicators) have been identified, they have not been assigned specific quantifiable targets or dates for achieving those targets. The framework leaves it to project managers to set specific quantifiable targets and timelines for individual projects. Annex 6 also explores the opportunity of setting quantifiable targets at the multilateral level, and suggests that this approach would raise a number of problems. While the framework is based on a chain of results, it does not fully solve the question of attribution. For example, the improvement of food safety standards could coincide with a growth in food exports, but not necessarily be the main cause of it. Thus, uncertainty remains as
MANAGING AID TO ACHIEVE TRADE AND DEVELOPMENT RESULTS: AN ANALYSIS ON TRADE-RELATED TARGETS 29
to the measurement of success. Nonetheless, the breakdown of possible outcomes in three different levels helps the attribution of results to specific projects or combination of projects. Finally, this framework is focused on results (outcomes) and largely ignored the process of aid for trade projects. This choice was deliberate and in line with the recommendations of the donors’ community. However, it should be noted that the way aid for trade is dispensed could directly affect the outcome of a project. For example, the use of local resources for training or research, the use of local consultants or construction companies for infrastructure projects, etc. directly generate exports and jobs. Procurement rules, among others, are an essential element of determination of success in aid for trade like in any other form of aid.

MANAGING AID TO ACHIEVE TRADE AND DEVELOPMENT RESULTS: AN ANALYSIS ON TRADE-RELATED TARGETS 30
References Adhikari, R. (2011), “Evaluating Aid for Trade Effectiveness on the Ground: A Methodological Framework”, Aid for Trade Series, Issue Paper No. 20, ICTSD, Geneva. Baldwin, R. (2006). Globalisation: The great unbundling(s), contribution to the project Globalisation Challenges for Europe and Finland organised by the Secretariat of the Economic Council. Bird, K. (2009), “Aid for Trade: Assessing Impact and Effectiveness”, Speaking Notes for the Second Global Aid for Trade Review, Geneva. Cadot, O., A.M. Fernandes, J. Gourdon and A. Mattoo (2011), “Impact Evaluation of Trade Interventions: Paving the Way”, CEPR Discussion Paper No. DP8428, CEPR, London. Cali, M. and D.W. te Velde (2008), Towards a Quantitative Assessment of Aid for Trade, ODI and Commonwealth Secretariat, London. Cattaneo O., and S. Miroudot (2013, forthcoming), “From Global Value Chains to Global Development Chains”, in Hoekman B., and E. Zedillo (eds), 21
st Century Trade Policy: Back to the Past, Yale University Press, New Haven, CT.
Elliott, K.A. (2007), “Ensuring that Aid for Trade Promotes Development: Indicators for Measuring the Impact”, Paper prepared for the Workshop on Monitoring and Evaluation WTO High-Level Conference on Mobilizing Aid for Trade: A Global Review, November 19, 2007, Geneva. Fernandez-Stark, K., P. Bamber and G. Gereffi (2011). “The Offshore Services Industry: Economic Upgrading and Workforce Development”, Center on Globalization Governance & Competitiveness and RTI International. Gamberoni, E. and R. Newfarmer (2009), “Aid for Trade: Matching Potential Demand and Supply”, World Bank Policy Research Working Paper 4991, World Bank, Washington, DC. JICA (Japan International Cooperation Agency) (2005), Handbook for Selecting Outcome Indicators: A Guide to Practical Evaluation of Technical Cooperation, JICA, Tokyo. Kaplinsky, R. and M. Farooki (2010), “Global Value Chains, the Crisis, and Shift of Markets from North to South”, in Cattaneo, O., G. Gereffi and C. Staritz (eds) (2010). Global Value Chains in a Postcrisis World. A Development Perspective. World Bank. Miroudot, S., R. Lanz and A. Ragoussis (2009). “Trade in intermediate goods and services”, OECD Trade Policy Working Paper No. 93, OECD, Paris. OECD (2012a), “Global Development Goals Beyond 2015”, DCD/DAC(2012)10/REV1, OECD, Paris. OECD (2012b), Succeeding with Trade Reforms: The Role of Aid for Trade, OECD, Paris. OECD (2011), Strengthening Accountability in Aid for Trade, OECD, Paris. OECD/WTO (2011), Aid for Trade at a Glance: Showing Results, OECD, Paris. Staritz, C., G. Gereffi and O. Cattaneo, “Shifting End Markets and Upgrading Prospects in Global Value Chains”, International Journal of Technological Learning, Innovation and Development, 4(1-2-3): 1-12. WEF (World Economic Forum) (2012), Global Competitiveness Report 2011-2012, WEF, Geneva. WEF (World Economic Forum) (2012), The Global Enabling Trade Report 2012: Reducing Supply Chain Barriers, WEF, Geneva. World Bank (2011), The Role of International Business in Aid for Trade: Building Capacity for Trade in Developing Countries, World Bank, Washington, DC.

MANAGING AID TO ACHIEVE TRADE AND DEVELOPMENT RESULTS: AN ANALYSIS ON TRADE-RELATED TARGETS 31
WTO (2012), “Fourth Global Review Aid for Trade Monitoring Exercise”, Background Concept Note by the Secretariat, WT/COMTD/AFT/W/37, 3 August 2012. WTO/OECD (2007), Joint Report on Trade-Related Technical Assistance and Capacity Building, OECD, Paris.

MANAGING AID TO ACHIEVE TRADE AND DEVELOPMENT RESULTS: AN ANALYSIS ON TRADE-RELATED TARGETS 32
Annex 1 Aid for Trade Management Framework: Trade-Related Targets
Level 1: Direct objectives/outcomes
Technical assistance for trade policy and regulation
Objectives
Indicators
Qualitative/Quantitative
Suppressing/reducing obstacles to trade at the border, including trade facilitation Activities to target, among others:
Suppression of quotas and other quantitative restrictions on imports and exports
Reduction of tariffs, suppression of tariff peaks, tariff escalation or simplification of tariff schedules
Customs modernization and reform, harmonization of procedures and cooperation across borders
Simplification of customs procedures, including SPS, TBT, and other certifications, rules of origin, valuation, etc. to conform with relevant agreements or international best practices
Implementation of WTO or regional/bilateral commitments (e.g. common external tariff)
Changes in the legal and/or regulatory framework
Institutional reforms
Changes in practice
Trade restrictiveness Indices – OTRI, TTRI (WTI 1.1)
Binding coverage and bound rates (WDI)
Share of tariff lines with peaks/specific rates (WDI, WTI 1.6)
MFN applied tariffs – AV+AVE or AV only (WDI, WTI 1.2, 1.3)
Applied tariffs incl. preferences (WDI, WTI 1.4)
Tariff escalation (WTI 1.5)
MFN 0 tariff lines / Import value (WTI 1.7)
Tariff bounds / Overhang (WTI 1.8)
Non-AV tariffs (WTI 1.9)
Non-tariff measures (WTI 1.10)
Customs duties (WTI 1.11)
Export restrictions (WTI 1.13)
Logistics performance index and its indicators - efficiency of customs and other border procedures (LPI, WTI 4.1)
Trading across borders – Doing business (IFC, WTI 4.2)
Trade Enabling and Global competitiveness indexes – goods market efficiency: burden of customs procedures, prevalence of trade barriers, trade tariffs, efficiency of customs administration, efficiency of import-export procedures, transparency of border administration (WEF GCI 6.10, 6.11, 6.13, ETI 1.01-

MANAGING AID TO ACHIEVE TRADE AND DEVELOPMENT RESULTS: AN ANALYSIS ON TRADE-RELATED TARGETS 33
4.02)
Average time to clear exports through customs / time to export/import (WDI)
Documents to export/import (WDI)
Suppressing/reducing trade-discriminatory or distortive measures beyond the border Activities to target, among others:
Suppression or reduction of trade-distortive subsidies
Suppression of domestic regulations and measures incompatible with the national treatment and most-favored nation principles, in particular in the domain of services, to include limits on equity, nationality requirements, local content, etc.
Removal of other market access and non-tariff barriers to trade
Implementation of WTO or relevant regional/bilateral commitments (e.g. provisions on services or investment)
Changes in the legal and/or regulatory framework
Institutional reforms
Changes in practice
Services trade restrictiveness indexes (WB and OECD)
GATS commitment restrictiveness index (WTI 1.14)
NTMs statistics – surveys and tariff-equivalents (WITS)
Global competitiveness index – goods market efficiency: agricultural policy costs, prevalence of foreign ownership, business impact of rules on FDI (WEF GCI 6.08, 6.11, 6.12)
Mainstreaming and promoting trade, trade integration and investment, including through multilateral/regional/bilateral agreements and improved market access Activities to target, among others:
Trade negotiations, including training and domestic consultations, for WTO accession, WTO negotiations, plurilateral (e.g. on telecoms), regional and bilateral trade agreements, other types of trade-related agreements, such as bilateral investment treaties, open sky agreements, etc.
Trade-policy reviews, diagnostics, and other forms of monitoring, including data collection
Design of trade strategies and mainstreaming in other development or growth plans
Trade-related research, teaching or training
Significant progress or successful conclusion of trade and trade-related negotiations
Increased occurrence of trade and trade-related issues in growth and development programs (PRSPs, CAS, etc.)
Increased publication, information and data on trade
Market access trade restrictiveness indices (WTI 2.1)
Rest of the world applied tariffs, including preferences (WTI 2.2)
MFN 0 export value (WTI 2.4)
Asia regional integration indicators (ADB)
Number of FTAs / CUs (WTI 2.5)
Preferential exports take up / utilization rates / value (WTI, 2.5)
Share of trade with FTA/CU partners (WTI 2.5)

MANAGING AID TO ACHIEVE TRADE AND DEVELOPMENT RESULTS: AN ANALYSIS ON TRADE-RELATED TARGETS 34
Economic Infrastructure
Objectives
Indicators
Qualitative/Quantitative
Increasing the accessibility and connectivity of the domestic market, and the security, predictability, reliability and efficiency of transports/logistics, telecommunications and ICT Activities to target, among others:
Reforms of the telecommunications sector, including infrastructure, regulation, competition, and access for all segments to include fixed lines and mobiles
Development of the ICT sector and the Internet (infrastructure, regulation, competition, access)
Reforms of the transport, logistics and ancillary services, including infrastructure, regulation, competition for land (road and rail), maritime/water and air
Regional infrastructure for trade corridors, and other forms of regulatory harmonization and cooperation
New infrastructure and trade “links”
Changes in the legal and/or regulatory framework
Changes in institutions (including regulation authorities)
Changes in practice
Logistics performance index and its indicators – quality of transports and IT infrastructure, international transport costs, logistics competence, trackability and timeliness of shipments, domestic transportation costs (WDI, LPI, WTI 4.1)
Trading across borders – Doing business (IFC, WTI 4.2)
Trade Enabling and Global competitiveness indexes – infrastructure: quality of infrastructure overall, roads, railroads, ports, air transport, available seats, fixed telephone lines/100, mobile phone subscriptions/100, availability and quality of transport infrastructure and services, availability and use of ICTs (WEF GCI 2.01-2.09, WEF TEI 4.01-7.05, WDI); – technological readiness (WEF GCI 9.01-9.06)
Africa infrastructure country diagnostic (AICD)
Liner shipping connectivity index (UNCTAD, WTI 4.3)
Baltic Exchange Dry Index (WTI 4.3)
Lead time to export/import (WDI)
Port container traffic (WDI, WTI 4.3)
Total / air freight and costs (WTI, 4.3)
Number of seats available, airlines, international routes, airport passenger statistics (IATA, WDI)
World telecommunication/ICT indicators database and ICT Development Index (ITU)
Foreign participation /
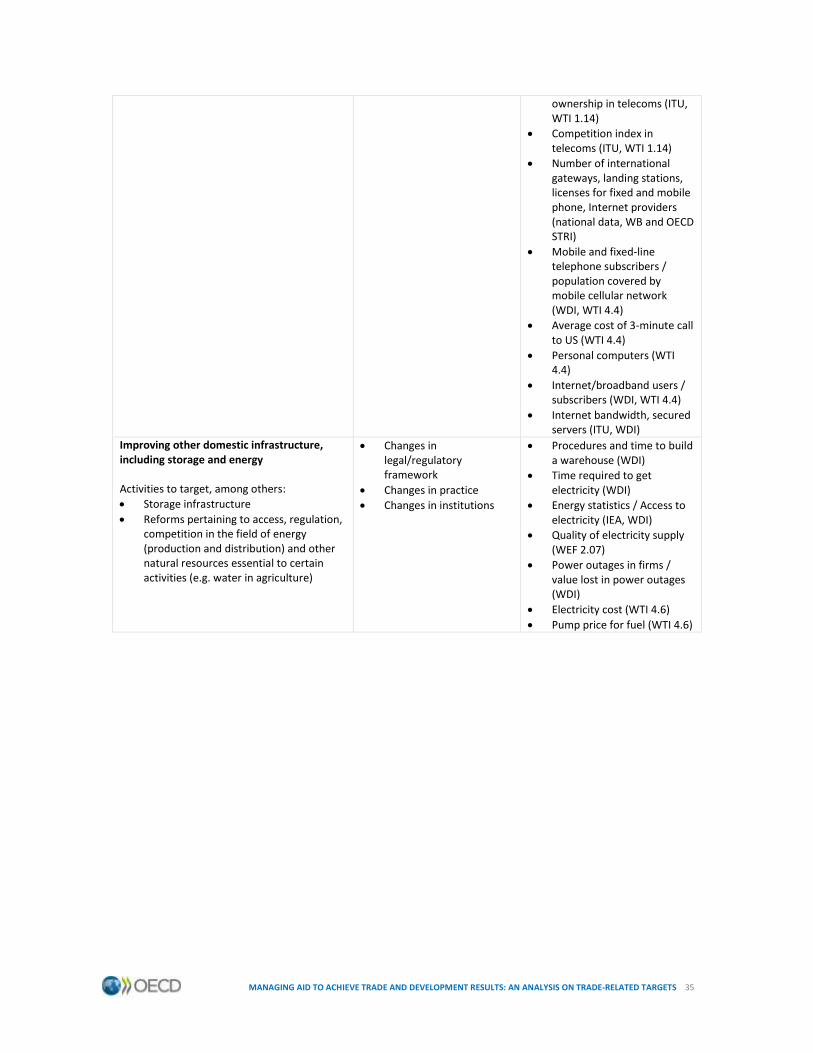
MANAGING AID TO ACHIEVE TRADE AND DEVELOPMENT RESULTS: AN ANALYSIS ON TRADE-RELATED TARGETS 35
ownership in telecoms (ITU, WTI 1.14)
Competition index in telecoms (ITU, WTI 1.14)
Number of international gateways, landing stations, licenses for fixed and mobile phone, Internet providers (national data, WB and OECD STRI)
Mobile and fixed-line telephone subscribers / population covered by mobile cellular network (WDI, WTI 4.4)
Average cost of 3-minute call to US (WTI 4.4)
Personal computers (WTI 4.4)
Internet/broadband users / subscribers (WDI, WTI 4.4)
Internet bandwidth, secured servers (ITU, WDI)
Improving other domestic infrastructure, including storage and energy Activities to target, among others:
Storage infrastructure
Reforms pertaining to access, regulation, competition in the field of energy (production and distribution) and other natural resources essential to certain activities (e.g. water in agriculture)
Changes in legal/regulatory framework
Changes in practice
Changes in institutions
Procedures and time to build a warehouse (WDI)
Time required to get electricity (WDI)
Energy statistics / Access to electricity (IEA, WDI)
Quality of electricity supply (WEF 2.07)
Power outages in firms / value lost in power outages (WDI)
Electricity cost (WTI 4.6)
Pump price for fuel (WTI 4.6)
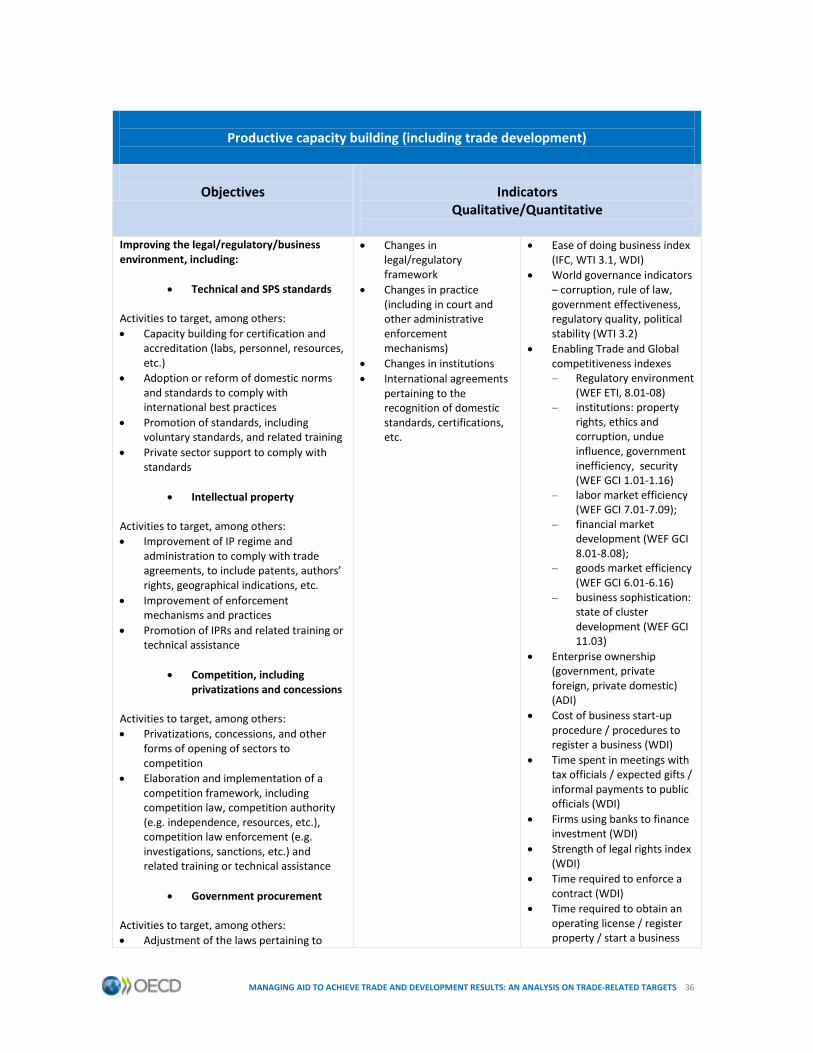
MANAGING AID TO ACHIEVE TRADE AND DEVELOPMENT RESULTS: AN ANALYSIS ON TRADE-RELATED TARGETS 36
Productive capacity building (including trade development)
Objectives
Indicators
Qualitative/Quantitative
Improving the legal/regulatory/business environment, including:
Technical and SPS standards Activities to target, among others:
Capacity building for certification and accreditation (labs, personnel, resources, etc.)
Adoption or reform of domestic norms and standards to comply with international best practices
Promotion of standards, including voluntary standards, and related training
Private sector support to comply with standards
Intellectual property Activities to target, among others:
Improvement of IP regime and administration to comply with trade agreements, to include patents, authors’ rights, geographical indications, etc.
Improvement of enforcement mechanisms and practices
Promotion of IPRs and related training or technical assistance
Competition, including privatizations and concessions
Activities to target, among others:
Privatizations, concessions, and other forms of opening of sectors to competition
Elaboration and implementation of a competition framework, including competition law, competition authority (e.g. independence, resources, etc.), competition law enforcement (e.g. investigations, sanctions, etc.) and related training or technical assistance
Government procurement Activities to target, among others:
Adjustment of the laws pertaining to
Changes in legal/regulatory framework
Changes in practice (including in court and other administrative enforcement mechanisms)
Changes in institutions
International agreements pertaining to the recognition of domestic standards, certifications, etc.
Ease of doing business index (IFC, WTI 3.1, WDI)
World governance indicators – corruption, rule of law, government effectiveness, regulatory quality, political stability (WTI 3.2)
Enabling Trade and Global competitiveness indexes – Regulatory environment
(WEF ETI, 8.01-08) – institutions: property
rights, ethics and corruption, undue influence, government inefficiency, security (WEF GCI 1.01-1.16)
– labor market efficiency (WEF GCI 7.01-7.09);
– financial market development (WEF GCI 8.01-8.08);
– goods market efficiency (WEF GCI 6.01-6.16)
– business sophistication: state of cluster development (WEF GCI 11.03)
Enterprise ownership (government, private foreign, private domestic) (ADI)
Cost of business start-up procedure / procedures to register a business (WDI)
Time spent in meetings with tax officials / expected gifts / informal payments to public officials (WDI)
Firms using banks to finance investment (WDI)
Strength of legal rights index (WDI)
Time required to enforce a contract (WDI)
Time required to obtain an operating license / register property / start a business

MANAGING AID TO ACHIEVE TRADE AND DEVELOPMENT RESULTS: AN ANALYSIS ON TRADE-RELATED TARGETS 37
public procurement, including transparency, selection criteria, national preference, etc.
Security of contracts and investment
Activities to target, among others:
Strengthening investor protection, including rights to challenge domestic regulations/decisions
Development of alternative dispute resolution mechanisms available to foreign investors (e.g. recognition of international arbitration, bolstering of domestic arbitration capacities)
Adjustment of the laws pertaining to nationalization, expropriation, foreign ownership, stability clauses, etc.
Corruption Activities to target, among others:
Reforms aimed at fighting corruption in the public (e.g. customs) and private sectors
Promotion and adoption of relevant international instruments
Administrative burden Activities to target, among others:
Administrative reforms towards simplification and reduction of administrative procedures (e.g. guillotine reform), increase in transparency, predictability, timeliness, and security of administrative decisions (e.g. suppression of authorizations)
Access to finance
Reforms of the financial sector, including micro-finance, to increase affordability and availability of financial services
Export credit and trade finance
Other constraints Activities to target, among others:
Creation of export processing zones, business clusters, technology centers, etc.
Revision of relevant labor regulations towards greater labor market efficiency
Revision of regulations pertaining to the form of business operations and partnerships (e.g. franchises, multi-sector
(WDI)
Banking GATS commitment index (USITC, WTI 1.14)
Export credit – insured exposures (WTI 4.5)
Indicators of financial structure, development and soundness (IMF)
Access to finance (WDI)
Diffusion of voluntary standards and ISO certification ownership (WDI, national statistics)
Value of seized counterfeited goods (national statistics)
Number of registered trademarks, patents, etc. (WIPO, WDI)
Number of competition investigations and sanctions (national statistics)
Public procurement penetration ratio – Public imports / public demand % (national statistics)
Arbitration awards (ICSID and other arbitration bodies statistics)
Protecting investors (ADI)
Security costs (ADI)

MANAGING AID TO ACHIEVE TRADE AND DEVELOPMENT RESULTS: AN ANALYSIS ON TRADE-RELATED TARGETS 38
partnerships, etc.)
Increasing security of operations and staff against crime and violence
Improving business support and the organization, connectivity and performance of markets, including e-commerce Activities to target, among others:
Export and investment promotion and incentives
Analyses and information on markets, opportunities, threats, etc.
Marketing, branding, international presence and promotion efforts
Sectoral, professional or other forms of associations (e.g. chambers of commerce) and consultations
Development of trade corridors, and other regional forms of hard and soft networks (e.g. regional regulatory agency, regional distribution network, etc.)
Development of regional markets and stocks / boards of trade, price regulation mechanisms
Organization of the value-chains and sectors (filières), including storage and distribution channels
Development of e-commerce (e.g. infrastructure, legal framework, protection of data, security of payments, etc.)
Changes in institutions
Changes in the legal/regulatory framework (including at the regional level)
Changes in practice
Logistics performance index and its indicators – quality of transports and IT infrastructure, international transport costs, logistics competence, trackability and timeliness of shipments, domestic transportation costs (WB, WTI 4.1)
Global competitiveness index – business sophistication: extent of marketing, state of cluster development, value chain breadth, control of international distribution production process sophistication, delegation of authority (WEF GDI 11.05-11.09) – goods market efficiency
Value of e-commerce, number of ICT firms, number of secured servers (WDI, ITU, national statistics)
Post-harvest losses (African Postharvest losses Information System)
Bolstering productivity, production and innovation capacities, including human capital and other resources Activities to target, among others:
Innovation policies and incentives (e.g. R&D, innovation centers) and adaptation/diffusion of technologies in trade-oriented sectors
Education and training to match domestic skills with international standards and demand in trade-oriented sectors / upgrading of available skills
Development of production hard (e.g. storage, conditioning, cooling chains, etc.) and soft (e.g. value-chain management) capacities in trade-oriented sectors
Creation of clusters and other task bundling efforts
Changes in production (methods and equipment) towards more efficient and sustainable use of natural resources (e.g. water) and energy
Changes in institutions
Changes in the legal/regulatory framework
Changes in practice
Computer, communications and other services, ICT goods and services imports/exports (WDI)
Investment in telecoms with private participation (WDI)
Firms offering formal training (WDI)
Number of patent applications filed by residents and non-residents, domestically and abroad (WDI, WIPO)
Education statistics – secondary and tertiary education, specialties, male/female, etc. (UNESCO, ILO, WDI)
Global competitiveness index – business sophistication (WEF GCI 11.01-11.09); – innovation (WEF GCI 12.01-12.07)
Extent of staff training (WEF GCI 5.08)

MANAGING AID TO ACHIEVE TRADE AND DEVELOPMENT RESULTS: AN ANALYSIS ON TRADE-RELATED TARGETS 39
Labor statistics – activity rates, unemployment, male/female, etc. (ILO, WDI)
Innovation indicators and surveys – public and private R&D expenditure, high and medium-high technology manufacturing, knowledge intensive services (OECD)
Production capacities – sector output – and productivity statistics (national statistics, WIOD)
Trade-related adjustment
Objectives
Indicators
Qualitative/Quantitative
Adjusting to fluctuations in tariffs and prices Activities to target, among others:
Compensations and reforms linked to tariff erosion and movement from unilateral to reciprocal preferences
Compensations and reforms linked to losses in tariff/custom revenues
Mechanisms and policies to deal with price volatility
Changes in institutions
Changes in the legal/regulatory framework (including fiscal policy)
Changes in practice
Price volatility of imports
Customs/tariffs and other revenues (WITS)
Restructuring industries/sectors facing a trade shock Activities to target, among others:
Soft industrial policy
Industrial adjustment programs, impact mitigation plans
Changes in institutions
Changes in the legal/regulatory framework
Changes in practice
Number of beneficiaries (national statistics)
Changes in production and employment in sectors open to trade and/or affected by trade shocks (national statistics)
Providing safety nets and training opportunities for workers negatively affected by trade Activities to target, among others:
Labor and social adjustment schemes
Changes in institutions
Changes in the legal/regulatory framework
Changes in practice (including in the private sector)
Results of the re-qualification programs (success rate, etc.)
Number of beneficiaries (national statistics)
Employment/unemployment rates in sectors open to trade and/or affected by trade shocks (ILO)
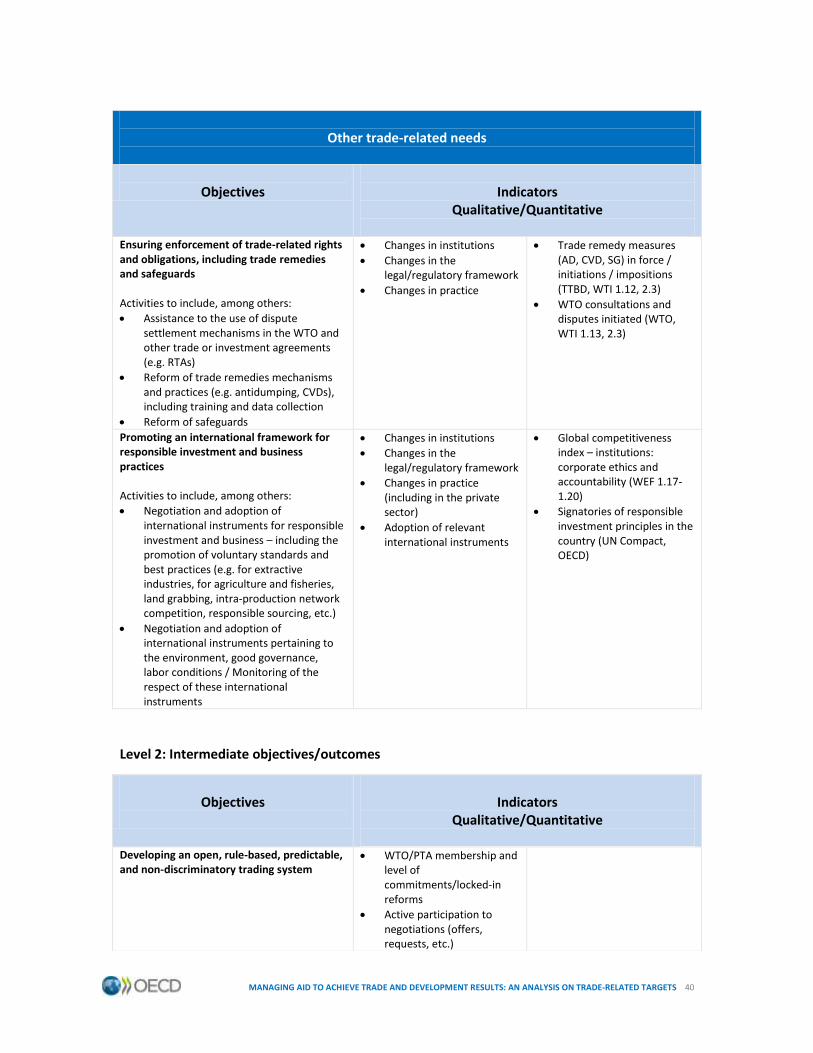
MANAGING AID TO ACHIEVE TRADE AND DEVELOPMENT RESULTS: AN ANALYSIS ON TRADE-RELATED TARGETS 40
Other trade-related needs
Objectives
Indicators
Qualitative/Quantitative
Ensuring enforcement of trade-related rights and obligations, including trade remedies and safeguards Activities to include, among others:
Assistance to the use of dispute settlement mechanisms in the WTO and other trade or investment agreements (e.g. RTAs)
Reform of trade remedies mechanisms and practices (e.g. antidumping, CVDs), including training and data collection
Reform of safeguards
Changes in institutions
Changes in the legal/regulatory framework
Changes in practice
Trade remedy measures (AD, CVD, SG) in force / initiations / impositions (TTBD, WTI 1.12, 2.3)
WTO consultations and disputes initiated (WTO, WTI 1.13, 2.3)
Promoting an international framework for responsible investment and business practices Activities to include, among others:
Negotiation and adoption of international instruments for responsible investment and business – including the promotion of voluntary standards and best practices (e.g. for extractive industries, for agriculture and fisheries, land grabbing, intra-production network competition, responsible sourcing, etc.)
Negotiation and adoption of international instruments pertaining to the environment, good governance, labor conditions / Monitoring of the respect of these international instruments
Changes in institutions
Changes in the legal/regulatory framework
Changes in practice (including in the private sector)
Adoption of relevant international instruments
Global competitiveness index – institutions: corporate ethics and accountability (WEF 1.17-1.20)
Signatories of responsible investment principles in the country (UN Compact, OECD)
Level 2: Intermediate objectives/outcomes
Objectives
Indicators
Qualitative/Quantitative
Developing an open, rule-based, predictable, and non-discriminatory trading system
WTO/PTA membership and level of commitments/locked-in reforms
Active participation to negotiations (offers, requests, etc.)

MANAGING AID TO ACHIEVE TRADE AND DEVELOPMENT RESULTS: AN ANALYSIS ON TRADE-RELATED TARGETS 41
Increasing competitiveness and attractiveness for foreign investment
Global Services Location Index (AT Kearney)
Travel and tourism competitiveness index (WEF)
Global competitiveness / enabling trade index (WEF)
Trade and development index (UNCTAD)
FDI inflows and outflows (WTI 6.10)
Increasing exports and export market shares / Increasing foreign currency reserves or restoring BoP equilibrium
Trade performance index (ITC)
Export/import value/volume index (WDI)
Real / nominal growth in trade – total and per sector (WTI 5.1, 5.2)
Trade balance – goods services, current account – and international reserves (WTI 6.6)
Shares and growth in shares of world trade (WTI 6.7, 6.8)
Trade in value-added (WTO-OECD)
Remittances inflows and outflows / rankings (WTI 6.10)
Diversifying exports and imports (products/services and origin/destination)
Trade performance index (ITC)
Agricultural raw materials, food, fuel, merchandise, manufactures exports/imports (WDI)
Merchandise exports/imports by country/region/income level (WDI)
Trade composition – share of goods, services and sectors (WDI, WTI 6.3, 6.4)
Product and market diversification – number of products exported/imported, share of top 5 products and markets, export/import product concentration index (WTI 6.9)
Increasing trade integration and consolidating participation to global value chains
Trade integration – trade as % of GDP (WTI, 5.5)
Global competitiveness index – business sophistication: value chain breadth, control of

MANAGING AID TO ACHIEVE TRADE AND DEVELOPMENT RESULTS: AN ANALYSIS ON TRADE-RELATED TARGETS 42
Level 3: Final objectives/outcomes or impacts
Objectives
Indicators
Qualitative/Quantitative
Increasing the value for trade (exports and imports):
Direct and indirect job creations, including for women, youth, and other targeted groups (e.g. smallholder farmers, SMEs)
Level and predictability of income, including for women, youth, and
Direct and indirect economic and social progress
Diffusion of technology, knowledge, know-how, capital and others – number of beneficiaries of trainings, innovation
Direct/indirect job creations – by category at micro and macro levels (national statistics)
Income generated in trading sectors/entities – input/output tables, firms’ profits (national statistics)
international distribution, local supplier quantity/quality, state of cluster development, production process sophistication (WEF GCI 11.01-11.09)
Trade in intermediate goods and services; trade in tasks (national statistics)
Intra-firm trade (national statistics)
Input-output tables (national statistics, WIOD)
MNCs investment and establishment (UNCTAD)
Reducing the trade costs (exports) and price of imports/inputs
Cost to export/import (WDI)
Commodity prices (WTI 2.7)
Logistics performance index (LPI, WTI 4.1)
Trading across borders – Doing business (IFC, WTI 4.2)
Freight and air freight cost (WTI 4.3)
Reallocating production capacities to more competitive and higher value-added activities
Sector and economy-wide input-output tables (national statistics, WIOD)
Share of production and employment in tradable goods and services (national statistics, ILO)
Employment in high value-added production segments (national statistics, ILO)
High-technology imports/exports (WDI)
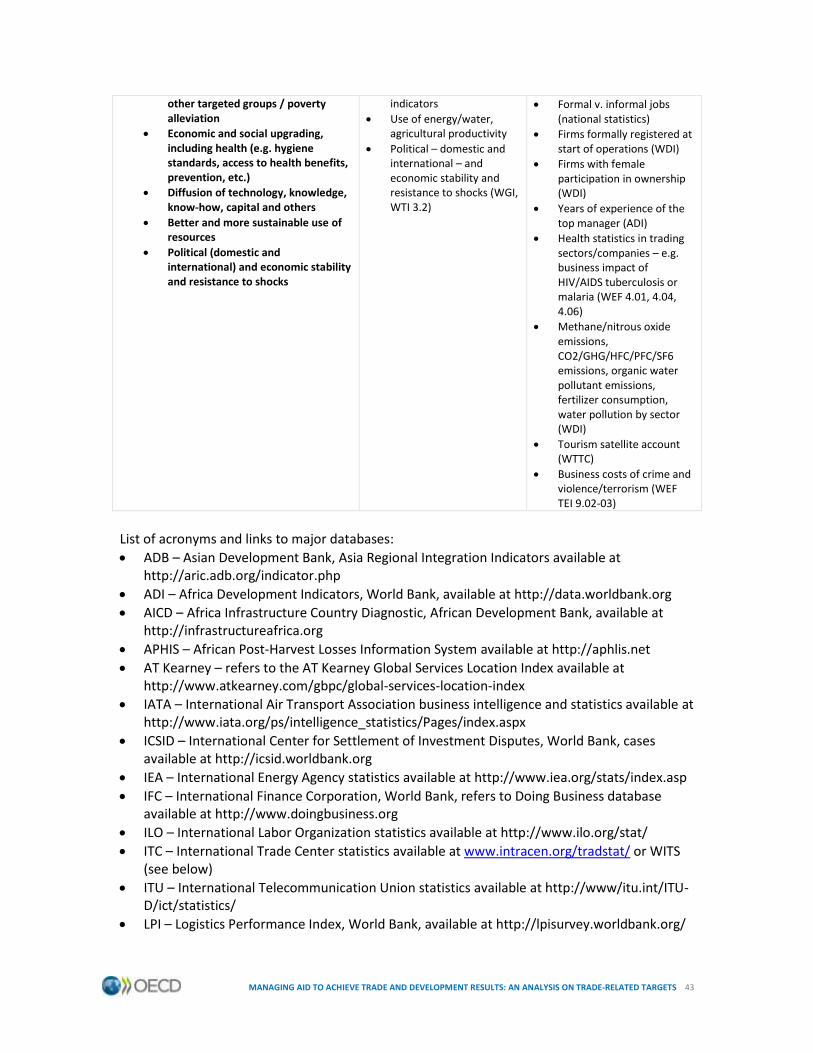
MANAGING AID TO ACHIEVE TRADE AND DEVELOPMENT RESULTS: AN ANALYSIS ON TRADE-RELATED TARGETS 43
other targeted groups / poverty alleviation
Economic and social upgrading, including health (e.g. hygiene standards, access to health benefits, prevention, etc.)
Diffusion of technology, knowledge, know-how, capital and others
Better and more sustainable use of resources
Political (domestic and international) and economic stability and resistance to shocks
indicators
Use of energy/water, agricultural productivity
Political – domestic and international – and economic stability and resistance to shocks (WGI, WTI 3.2)
Formal v. informal jobs (national statistics)
Firms formally registered at start of operations (WDI)
Firms with female participation in ownership (WDI)
Years of experience of the top manager (ADI)
Health statistics in trading sectors/companies – e.g. business impact of HIV/AIDS tuberculosis or malaria (WEF 4.01, 4.04, 4.06)
Methane/nitrous oxide emissions, CO2/GHG/HFC/PFC/SF6 emissions, organic water pollutant emissions, fertilizer consumption, water pollution by sector (WDI)
Tourism satellite account (WTTC)
Business costs of crime and violence/terrorism (WEF TEI 9.02-03)
List of acronyms and links to major databases:
ADB – Asian Development Bank, Asia Regional Integration Indicators available at http://aric.adb.org/indicator.php
ADI – Africa Development Indicators, World Bank, available at http://data.worldbank.org
AICD – Africa Infrastructure Country Diagnostic, African Development Bank, available at http://infrastructureafrica.org
APHIS – African Post-Harvest Losses Information System available at http://aphlis.net
AT Kearney – refers to the AT Kearney Global Services Location Index available at http://www.atkearney.com/gbpc/global-services-location-index
IATA – International Air Transport Association business intelligence and statistics available at http://www.iata.org/ps/intelligence_statistics/Pages/index.aspx
ICSID – International Center for Settlement of Investment Disputes, World Bank, cases available at http://icsid.worldbank.org
IEA – International Energy Agency statistics available at http://www.iea.org/stats/index.asp
IFC – International Finance Corporation, World Bank, refers to Doing Business database available at http://www.doingbusiness.org
ILO – International Labor Organization statistics available at http://www.ilo.org/stat/
ITC – International Trade Center statistics available at www.intracen.org/tradstat/ or WITS (see below)
ITU – International Telecommunication Union statistics available at http://www/itu.int/ITU-D/ict/statistics/
LPI – Logistics Performance Index, World Bank, available at http://lpisurvey.worldbank.org/

MANAGING AID TO ACHIEVE TRADE AND DEVELOPMENT RESULTS: AN ANALYSIS ON TRADE-RELATED TARGETS 44
OECD – Organization for Economic Development and Co-operation statistics available at http://stats.oecd.org
OECD STRI – forthcoming OECD Services Trade Restrictiveness Index, Trade and Agriculture Department
TTBD – Temporary Trade Barriers Database including the Global Antidumping Database, World Bank, available at http://data.worldbank.org
UNCTAD – United Nations Conference on Trade and Development statistics available at http://www.unctad.org/en/Pages/Statistics.aspx/
UNESCO – United Nations Educational, Scientific and Cultural Organization statistics available at http://www.uis.unesco.org
USITC – United States International Trade Commission statistics available at http://www.dataweb.usitc.gov/
WB STRI – refers to the World Bank services trade restrictiveness index available at http://iresearch.worldbank.org/servicetrade/
WDI – World Development Indicators, World Bank, available at http://data.worldbank.org
WEF GCI – World Economic Forum Global Competitiveness Index available at http://www.weforum.org/issues/competitiveness-0/gci2012-data-platform/
WEF ETI – World Economic Forum Enabling Trade Index available at http://reports.weforum.org/global-enabling-trade-report-2012/
WEF TTCI – World Economic Forum Travel and Competitiveness report available at http://www.weforum.org/issues/travel-and-tourism-competitiveness
WGI – World Governance Indicators, World Bank, available at http://info.worldbank.org/governance/wgi/
WIOD – World Input-Output Database available at http://www.wiod.org/
WIPO – World Intellectual Property Organization statistics available at http://www.wipo.int/ipstats/en/general_info.html
WITS – World Integrated Trade Solution, UNCTAD, ITC, UNSD, WTO, World Bank, available at http://wits.worldbank.org/wits/
WTI – World Trade Indicators, World Bank, available through WDI or http://www/worldbank.org/wti
WTTC – World Tourism and Travel Council, refers to tourism satellite accounts and other statistics available at http://www.wttc.org
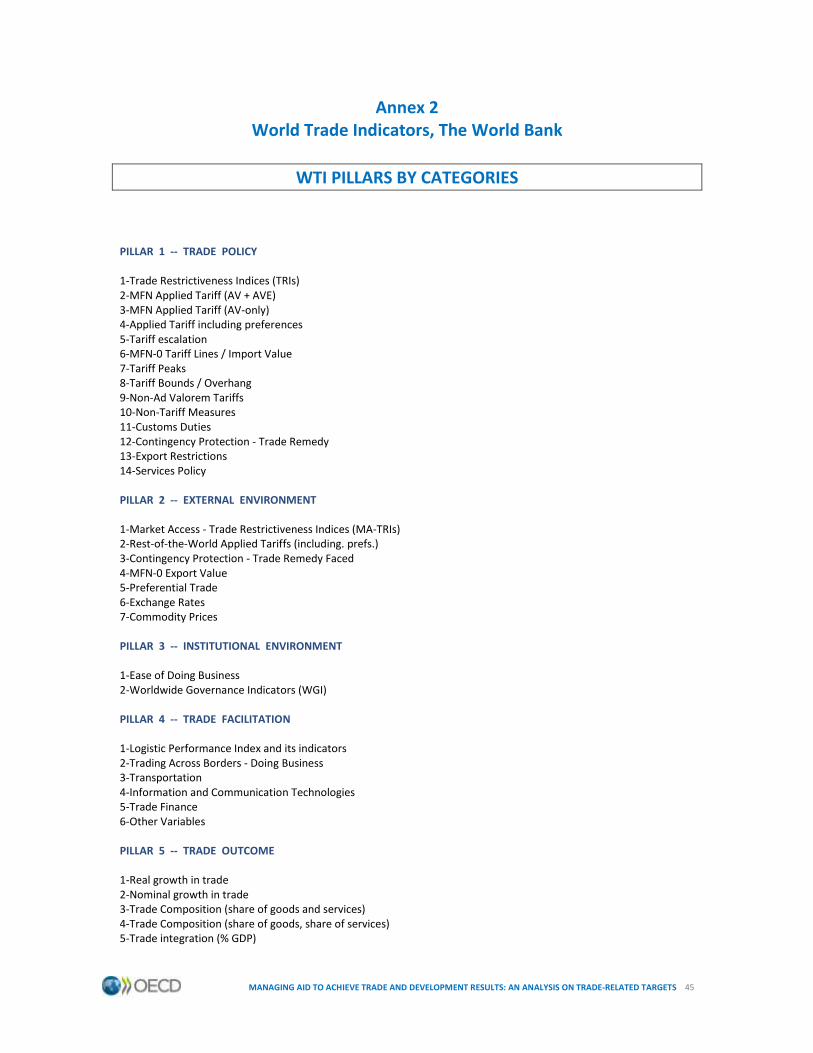
MANAGING AID TO ACHIEVE TRADE AND DEVELOPMENT RESULTS: AN ANALYSIS ON TRADE-RELATED TARGETS 45
Annex 2 World Trade Indicators, The World Bank
WTI PILLARS BY CATEGORIES PILLAR 1 - TRADE POLICY 1-Trade Restrictiveness Indices (TRIs) 2-MFN Applied Tariff (AV + AVE) 3-MFN Applied Tariff (AV-only) 4-Applied Tariff including preferences 5-Tariff escalation 6-MFN-0 Tariff Lines / Import Value 7-Tariff Peaks 8-Tariff Bounds / Overhang 9-Non-Ad Valorem Tariffs 10-Non-Tariff Measures 11-Customs Duties 12-Contingency Protection - Trade Remedy 13-Export Restrictions 14-Services Policy PILLAR 2 - EXTERNAL ENVIRONMENT 1-Market Access - Trade Restrictiveness Indices (MA-TRIs) 2-Rest-of-the-World Applied Tariffs (including. prefs.) 3-Contingency Protection - Trade Remedy Faced 4-MFN-0 Export Value 5-Preferential Trade 6-Exchange Rates 7-Commodity Prices PILLAR 3 - INSTITUTIONAL ENVIRONMENT 1-Ease of Doing Business 2-Worldwide Governance Indicators (WGI) PILLAR 4 - TRADE FACILITATION 1-Logistic Performance Index and its indicators 2-Trading Across Borders - Doing Business 3-Transportation 4-Information and Communication Technologies 5-Trade Finance 6-Other Variables PILLAR 5 - TRADE OUTCOME 1-Real growth in trade 2-Nominal growth in trade 3-Trade Composition (share of goods and services) 4-Trade Composition (share of goods, share of services) 5-Trade integration (% GDP)

MANAGING AID TO ACHIEVE TRADE AND DEVELOPMENT RESULTS: AN ANALYSIS ON TRADE-RELATED TARGETS 46
6-Trade Balances 7-Shares of World Trade 8-Growth in Shares of World Trade 9-Product and Market Diversification 10-Tourism, FDI, and Remittances 11-Other Variables
WTI PILLARS BY CATEGORIES AND INDICATORS*
*Variables in blue italic are new variables added in the 2009/10 database. Variables in orange italic are variables that were calculated by the World Bank Institute for the years 2007 and 2008, or for the entire time period available. Pillar 1. Trade Policy 1-Trade Restrictiveness Indices (TRIs) a) TTRI (MFN applied tariff)-All Goods - TTRI (MFN applied tariff) - Agricultural (AoA) Goods - TTRI (MFN applied tariff) - Non-Agricultural Goods b) OTRI (MFN applied tariff+NTMs) - All Goods - OTRI (MFN applied tariff+NTMs) - Agricultural (AoA) Goods - OTRI (MFN applied tariff+NTMs) - Non-Agricultural Goods c) TTRI (applied tariff, incl. prefs) - All Goods - TTRI (applied tariff, incl. prefs) - Agricultural (AoA) Goods - TTRI (applied tariff, incl. prefs) - Non-Agricultural Goods d) OTRI (applied tariff, incl. prefs+NTMs) - All Goods - OTRI (applied tariff, incl. prefs+NTMs) - Agricultural (AoA) Goods - OTRI (applied tariff, incl. prefs+NTMs) - Non-Agricultural Goods 2- MFN Applied Tariff (AV + AVE) a) MFN applied tariff (AV+AVE) - Simple Average - All Goods (%) - MFN applied tariff (AV+AVE) - Simple Average - Agricultural (AoA) Goods (%) - MFN applied tariff (AV+AVE) - Simple Average - Non-Agricultural Goods (%) b) MFN applied tariff (AV+AVE) - Maximum - All Goods (%) - MFN applied tariff (AV+AVE) - Maximum - Agricultural (AoA) Goods (%) - MFN applied tariff (AV+AVE) - Maximum - Non-Agricultural Goods (%) c) MFN applied tariff (AV+AVE) - Maximum excluding alcohol and tobacco - All Goods (%) - MFN applied tariff (AV+AVE) - Maximum excluding alcohol and tobacco - Agricultural (AoA) Goods (%) - MFN applied tariff (AV+AVE) - Maximum excluding alcohol and tobacco - Non-Agricultural Goods (%) d) MFN applied tariff (AV+AVE) - Dispersion - All Goods (%) - MFN applied tariff (AV+AVE) - Dispersion - Agricultural (AoA) (%) - MFN applied tariff (AV+AVE) - Dispersion - Non-Agricultural Goods (%) e) MFN applied tariff (AV+AVE) - Trade Weighted Average - All Goods (%) - MFN applied tariff (AV+AVE) - Trade Weighted Average - Agricultural (AoA) Goods (%) - MFN applied tariff (AV+AVE) - Trade Weighted Average - Non-Agricultural Goods (%) 3- MFN Applied Tariff (AV-only) a) MFN applied tariff (AV-only) - Simple Average - All Goods (%) - MFN applied tariff (AV-only) - Simple Average - Agricultural (AoA) Goods (%) - MFN applied tariff (AV-only) - Simple Average - Non-Agricultural Goods (%) b) MFN applied tariff (AV-only) - Maximum - All Goods (%) - MFN applied tariff (AV-only)- Maximum - Agricultural (AoA) Goods(%) - MFN applied tariff (AV-only) - Maximum - Non-Agricultural Goods (%) c) MFN applied tariff (AV-only) - Dispersion - All Goods (%)

MANAGING AID TO ACHIEVE TRADE AND DEVELOPMENT RESULTS: AN ANALYSIS ON TRADE-RELATED TARGETS 47
- MFN applied tariff (AV-only)- Dispersion - Agricultural (AoA) Goods(%) - MFN applied tariff (AV-only)- Dispersion - Non-Agricultural Goods (%) d) MFN applied tariff (AV-only) - Trade Weighted Average - All Goods (%) - MFN applied tariff (AV-only) - Trade Weighted Average - Agricultural (AoA) Goods(%) - MFN applied tariff (AV-only)- Trade Weighted Average - Non-Agricultural Goods (%) 4- Applied Tariff including preferences a) Applied Tariff incl. prefs - Simple Average - All Goods (%) - Applied Tariff incl. prefs - Simple Average - Agricultural Goods (%) - Applied Tariff incl. prefs - Simple Average - Non-Agricultural Goods (%) b) Applied Tariff incl. prefs - Maximum - All Goods (%) - Applied Tariff incl. prefs - Maximum - Agricultural Goods (%) - Applied Tariff incl. prefs - Maximum - Non-Agricultural Goods (%) c) Applied Tariff incl. prefs - Dispersion - All Goods (%) - Applied Tariff incl. prefs - Dispersion - Agricultural (AoA) Goods (%) - Applied Tariff incl. prefs - Dispersion - Non-Agricultural Goods (%) d) Applied Tariff incl. prefs - Trade Weighted Average - All Goods (%) - Applied Tariff incl. prefs - Trade Weighted Average - Agricultural (AoA) Goods (%) - Applied Tariff incl. prefs - Trade Weighted Average - Non-Agricultural Goods (%) e) Applied Tariff incl. prefs - Production Weighted Average - All Goods (%) - Applied Tariff incl. prefs - Production Weighted Average - Agricultural (AoA) Goods(%) - Applied Tariff incl. prefs - Production Weighted Average - Non-Agricultural Goods (%) 5- Tariff escalation a) MFN Applied tariff escalation (diff, finished-raw) - All Goods (%) - MFN Applied tariff escalation (diff, finished-raw) - Agricultural (AoA) Goods(%) - MFN Applied tariff escalation (diff, finished-raw) - Non-Agricultural Goods (%) b) MFN Applied tariff escalation (%change, finished-raw) - All Goods (%) - MFN Applied tariff escalation (%change, finished-raw) - Agricultural (AoA) Goods(%) - MFN Applied tariff escalation (%change, finished-raw) - Non-Agricultural Goods (%) 6- MFN-0 Tariff Lines / Import Value a) Share of Tariff Lines with MFN-0 - All Goods (%) - Share of Tariff Lines with MFN-0 - Agricultural (AoA) (%) - Share of Tariff Lines with MFN-0 - Non-Agricultural Goods (%) b) MFN-0 Import Value (% Total Imports) - All Goods - MFN-0 Import Value (% Total Imports) - Agricultural (AoA) Goods - MFN-0 Import Value (% Total Imports) - Non-Agricultural Goods 7- Tariff Peaks a) Share of Tariff Lines with Domestic Peaks - All Goods (%) - Share of Tariff Lines with Domestic Peaks - Agricultural (AoA) Goods (%) - Share of Tariff Lines with Domestic Peaks - Non-Agricultural Goods (%) b) Share of Tariff Lines with International Peaks - All Goods (%) - Share of Tariff Lines with International Peaks - Agricultural (AoA) Goods (%) - Share of Tariff Lines with International Peaks - Non-Agricultural Goods (%) 8- Tariff Bounds / Overhang a) Share of Tariff Lines Bound - All Goods (%) - Share of Tariff Lines Bound - Agricultural (AoA) Goods (%) - Share of Tariff Lines Bound - Non-Agricultural Goods (%) b) Total Overhang - All Goods (%) - Total Overhang - Agricultural (AoA) Goods (%)
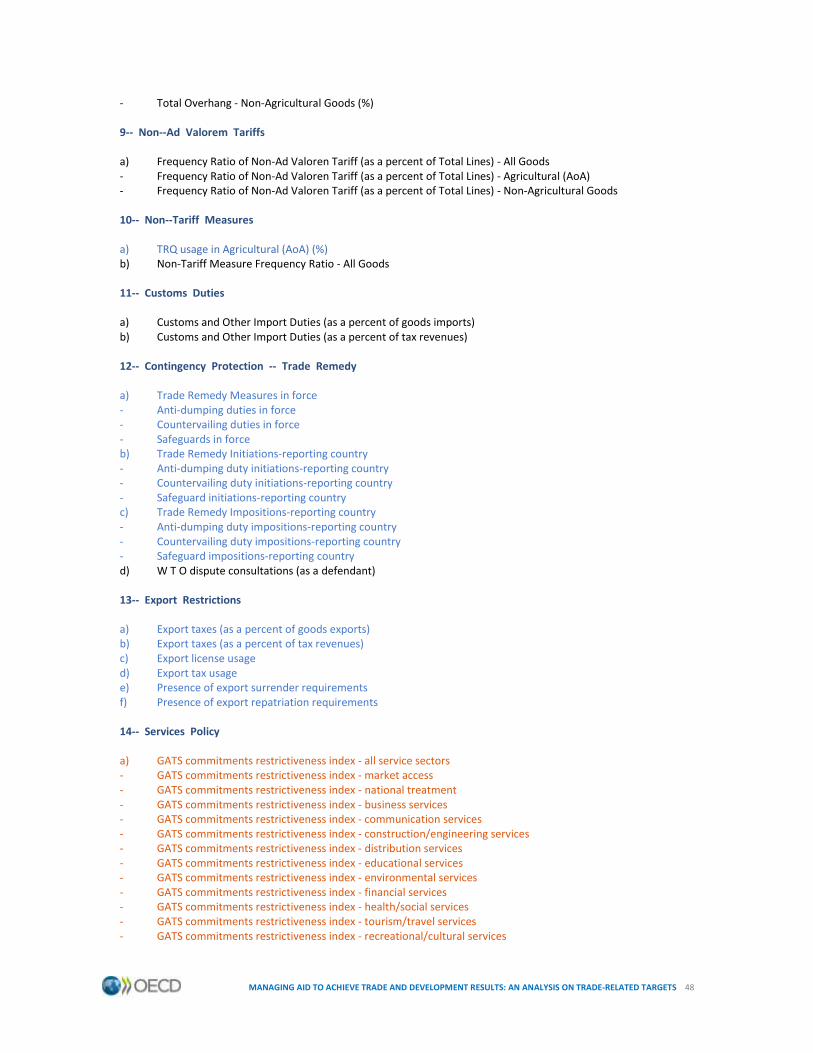
MANAGING AID TO ACHIEVE TRADE AND DEVELOPMENT RESULTS: AN ANALYSIS ON TRADE-RELATED TARGETS 48
- Total Overhang - Non-Agricultural Goods (%) 9- Non-Ad Valorem Tariffs a) Frequency Ratio of Non-Ad Valoren Tariff (as a percent of Total Lines) - All Goods - Frequency Ratio of Non-Ad Valoren Tariff (as a percent of Total Lines) - Agricultural (AoA) - Frequency Ratio of Non-Ad Valoren Tariff (as a percent of Total Lines) - Non-Agricultural Goods 10- Non-Tariff Measures a) TRQ usage in Agricultural (AoA) (%) b) Non-Tariff Measure Frequency Ratio - All Goods 11- Customs Duties a) Customs and Other Import Duties (as a percent of goods imports) b) Customs and Other Import Duties (as a percent of tax revenues) 12- Contingency Protection - Trade Remedy a) Trade Remedy Measures in force - Anti-dumping duties in force - Countervailing duties in force - Safeguards in force b) Trade Remedy Initiations-reporting country - Anti-dumping duty initiations-reporting country - Countervailing duty initiations-reporting country - Safeguard initiations-reporting country c) Trade Remedy Impositions-reporting country - Anti-dumping duty impositions-reporting country - Countervailing duty impositions-reporting country - Safeguard impositions-reporting country d) W T O dispute consultations (as a defendant) 13- Export Restrictions a) Export taxes (as a percent of goods exports) b) Export taxes (as a percent of tax revenues) c) Export license usage d) Export tax usage e) Presence of export surrender requirements f) Presence of export repatriation requirements 14- Services Policy a) GATS commitments restrictiveness index - all service sectors - GATS commitments restrictiveness index - market access - GATS commitments restrictiveness index - national treatment - GATS commitments restrictiveness index - business services - GATS commitments restrictiveness index - communication services - GATS commitments restrictiveness index - construction/engineering services - GATS commitments restrictiveness index - distribution services - GATS commitments restrictiveness index - educational services - GATS commitments restrictiveness index - environmental services - GATS commitments restrictiveness index - financial services - GATS commitments restrictiveness index - health/social services - GATS commitments restrictiveness index - tourism/travel services - GATS commitments restrictiveness index - recreational/cultural services

MANAGING AID TO ACHIEVE TRADE AND DEVELOPMENT RESULTS: AN ANALYSIS ON TRADE-RELATED TARGETS 49
- GATS commitments restrictiveness index - transport services - GATS commitments restrictiveness index - other services b) USITC Banking GATS commitment Index c) ITU foreign participation/ownership in telecom sector (%) d) I T U competition index in telecom sector Pillar 2. External Environment 1- Market Access - Trade Restrictiveness Indices (MA-TRIs) - MA-TTRI (applied tariff incl. prefs.) - Non-Agricultural Goods b) MA-OTRI (applied tariff incl. prefs.+NTMs) - All Goods - MA-OTRI (applied tariff incl. prefs.+NTMs) - Agricultural (AoA) Goods - MA-OTRI (applied tariff incl. prefs.+NTMs) - Non-Agricultural Goods 2- Rest-of-the-World Applied Tariffs (including. prefs) a) ROW Applied Tariff (incl. prefs) - Simple Average - All Goods (%) - ROW Applied Tariff (incl. prefs) - Simple Average - Agricultural (AoA) Goods (%) - ROW Applied Tariff (incl. prefs) - Simple Average - Non-Agricultural Goods (%) b) ROW Applied Tariff (incl. prefs) - Maximum - All Goods (%) - ROW Applied Tariff (incl. prefs) - Maximum - Agricultural (AoA) Goods (%) - ROW Applied Tariff (incl. prefs) - Maximum - Non-Agricultural Goods (%) c) ROW Applied Tariff (incl. prefs) - Dispersion - All Goods (%) - ROW Applied Tariff (incl. prefs) - Dispersion - Agricultural (AoA) Goods (%) - ROW Applied Tariff (incl. prefs) - Dispersion - Non-Agricultural Goods (%) d) ROW Applied Tariff (incl. prefs) - Trade Weighted Average - All Goods (%) - ROW Applied Tariff (incl. prefs) - Trade Weighted Average - Agricultural (AoA) Goods (%) - ROW Applied Tariff (incl. prefs) - Trade Weighted Average - Non-Agricultural Goods (%) a) MA-TTRI (applied tariff incl. prefs.) - All Goods - MA-TTRI (applied tariff incl. prefs.) - Agricultural (AoA) Goods 3- Contingency Protection - Trade Remedy Faced a) Trade remedy initiations faced-exporting country - Anti-dumping duty initiations faced-exporting country - Countervailing duty initiations faced-exporting country b) Trade Remedy Impositions faced-exporting country - Anti-dumping duty impositions faced-exporting country - Countervailing duty impositions faced-exporting country c) W T O dispute consultations (as a complainant) 4- MFN-0 Export Value a) MFN-0 export value (% total exports) - All Goods - MFN-0 Export Value (% total exports) - Agricultural (AoA) Goods - MFN-0 Export Value (% total exports) - Non-Agricultural Goods 5- Preferential Trade a) No. of FTAs / CUs - Goods and Services - No. of FTAs / CUs - Goods - No. of FTAs / CUs - Services b) Preferential exports (EU+US) take-up rate (%) - Preferential exports (EU-only) take-up rate (%) - Preferential exports (US-only) take-up rate (%) c) Preferences (EU+US) utilization rate (%, actual/potential value)
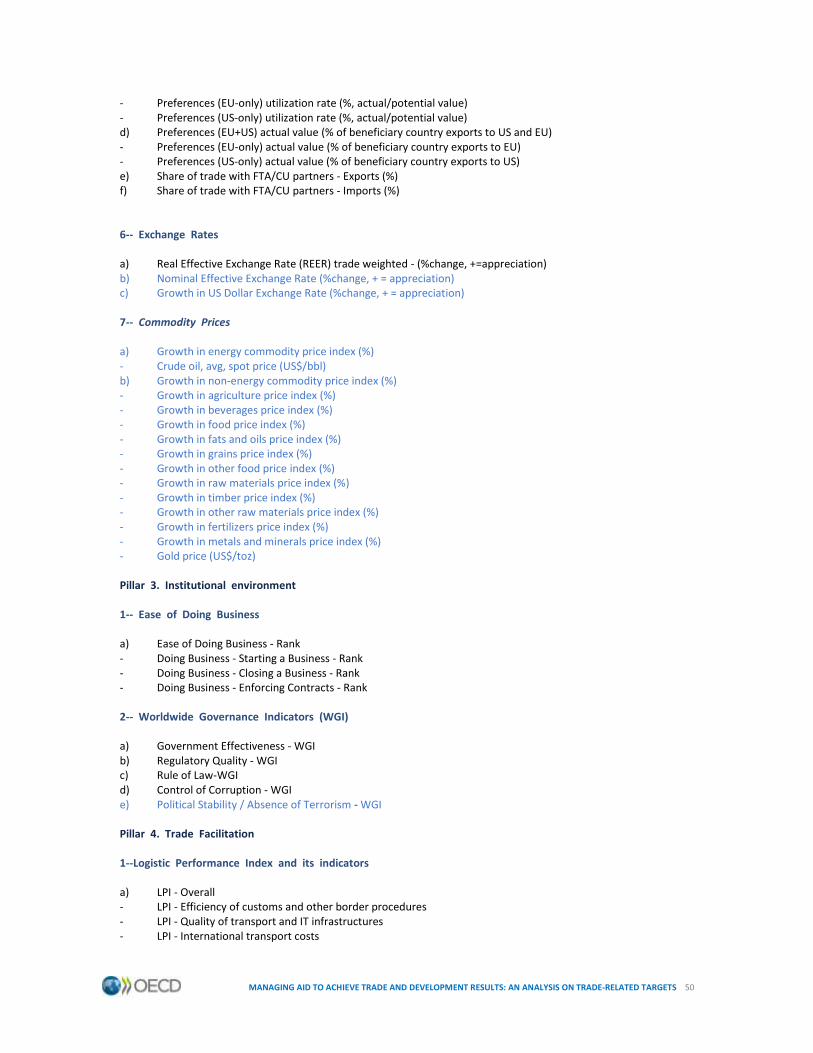
MANAGING AID TO ACHIEVE TRADE AND DEVELOPMENT RESULTS: AN ANALYSIS ON TRADE-RELATED TARGETS 50
- Preferences (EU-only) utilization rate (%, actual/potential value) - Preferences (US-only) utilization rate (%, actual/potential value) d) Preferences (EU+US) actual value (% of beneficiary country exports to US and EU) - Preferences (EU-only) actual value (% of beneficiary country exports to EU) - Preferences (US-only) actual value (% of beneficiary country exports to US) e) Share of trade with FTA/CU partners - Exports (%) f) Share of trade with FTA/CU partners - Imports (%) 6- Exchange Rates a) Real Effective Exchange Rate (REER) trade weighted - (%change, +=appreciation) b) Nominal Effective Exchange Rate (%change, + = appreciation) c) Growth in US Dollar Exchange Rate (%change, + = appreciation) 7- Commodity Prices a) Growth in energy commodity price index (%) - Crude oil, avg, spot price (US$/bbl) b) Growth in non-energy commodity price index (%) - Growth in agriculture price index (%) - Growth in beverages price index (%) - Growth in food price index (%) - Growth in fats and oils price index (%) - Growth in grains price index (%) - Growth in other food price index (%) - Growth in raw materials price index (%) - Growth in timber price index (%) - Growth in other raw materials price index (%) - Growth in fertilizers price index (%) - Growth in metals and minerals price index (%) - Gold price (US$/toz) Pillar 3. Institutional environment 1- Ease of Doing Business a) Ease of Doing Business - Rank - Doing Business - Starting a Business - Rank - Doing Business - Closing a Business - Rank - Doing Business - Enforcing Contracts - Rank 2- Worldwide Governance Indicators (WGI) a) Government Effectiveness - WGI b) Regulatory Quality - WGI c) Rule of Law-WGI d) Control of Corruption - WGI e) Political Stability / Absence of Terrorism - WGI Pillar 4. Trade Facilitation 1-Logistic Performance Index and its indicators a) LPI - Overall - LPI - Efficiency of customs and other border procedures - LPI - Quality of transport and IT infrastructures - LPI - International transport costs
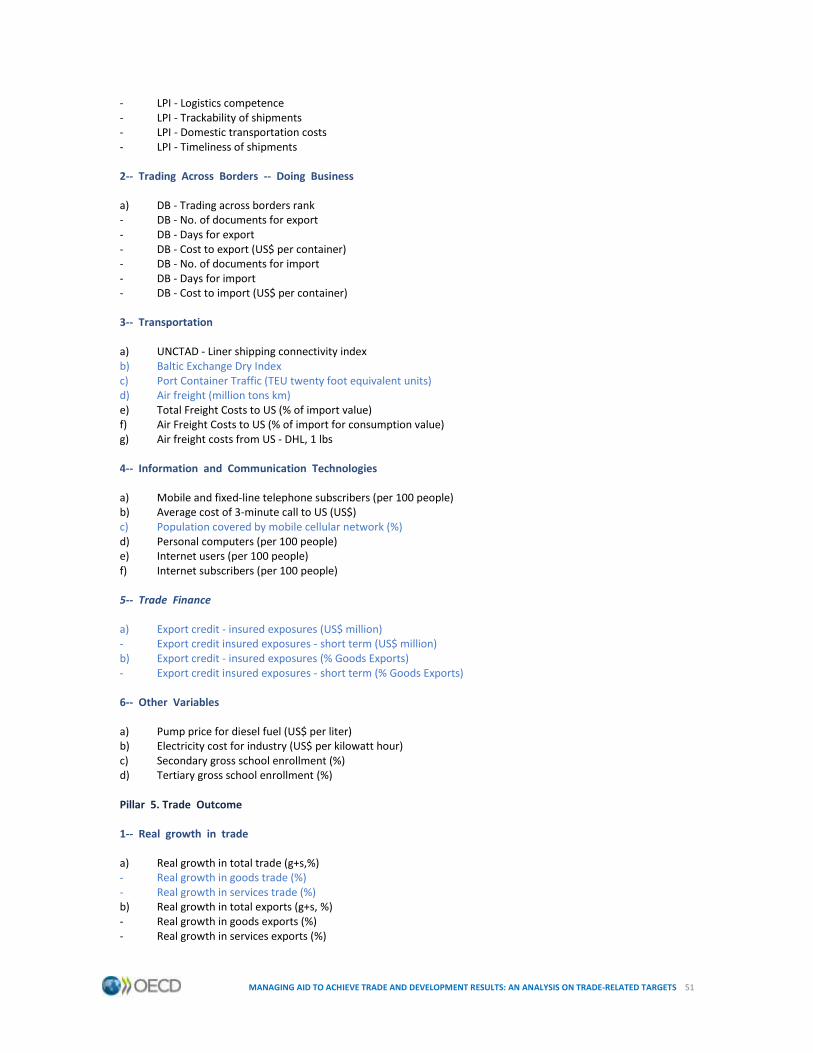
MANAGING AID TO ACHIEVE TRADE AND DEVELOPMENT RESULTS: AN ANALYSIS ON TRADE-RELATED TARGETS 51
- LPI - Logistics competence - LPI - Trackability of shipments - LPI - Domestic transportation costs - LPI - Timeliness of shipments 2- Trading Across Borders - Doing Business a) DB - Trading across borders rank - DB - No. of documents for export - DB - Days for export - DB - Cost to export (US$ per container) - DB - No. of documents for import - DB - Days for import - DB - Cost to import (US$ per container) 3- Transportation a) UNCTAD - Liner shipping connectivity index b) Baltic Exchange Dry Index c) Port Container Traffic (TEU twenty foot equivalent units) d) Air freight (million tons km) e) Total Freight Costs to US (% of import value) f) Air Freight Costs to US (% of import for consumption value) g) Air freight costs from US - DHL, 1 lbs 4- Information and Communication Technologies a) Mobile and fixed-line telephone subscribers (per 100 people) b) Average cost of 3-minute call to US (US$) c) Population covered by mobile cellular network (%) d) Personal computers (per 100 people) e) Internet users (per 100 people) f) Internet subscribers (per 100 people) 5- Trade Finance a) Export credit - insured exposures (US$ million) - Export credit insured exposures - short term (US$ million) b) Export credit - insured exposures (% Goods Exports) - Export credit insured exposures - short term (% Goods Exports) 6- Other Variables a) Pump price for diesel fuel (US$ per liter) b) Electricity cost for industry (US$ per kilowatt hour) c) Secondary gross school enrollment (%) d) Tertiary gross school enrollment (%) Pillar 5. Trade Outcome 1- Real growth in trade a) Real growth in total trade (g+s,%) - Real growth in goods trade (%) - Real growth in services trade (%) b) Real growth in total exports (g+s, %) - Real growth in goods exports (%) - Real growth in services exports (%)

MANAGING AID TO ACHIEVE TRADE AND DEVELOPMENT RESULTS: AN ANALYSIS ON TRADE-RELATED TARGETS 52
c) Real growth in total imports (g+s, %) - Real growth in goods imports (%) - Real growth in services imports (%) 2-Nominal growth in trade a) Nominal growth in total trade (g+s, %) - Nominal growth in goods trade (%) - Nominal growth in services trade (%) b) Nominal growth in total exports (g+s, %) - Nominal growth in goods exports (BOP, %) - Nominal growth in agricultural exports (NA, %) - Nominal growth in food exports (NA, %) - Nominal growth in non-agricultural exports (NA goods export minus agri, %) - Nominal growth in manufactured exports (NA, %) - Nominal growth in fuels exports (NA, %) - Nominal growth in ores and metals exports (NA, %) - Nominal growth in services exports (%) - Nominal growth in transport exports (%) - Nominal growth in travel exports (%) - Nominal growth in other commercial services exports (%) - Nominal growth in financial exports (%) - Nominal growth in computer and information exports (%) - Nominal growth in "other business services" exports (%) - Nominal growth in government services exports (%) c) Nominal growth in total imports (g+s, %) - Nominal growth in goods imports (BOP, %) - Nominal growth in agricultural imports (NA, %) - Nominal growth in food imports (NA, %) - Nominal growth in non-agricultural imports (NA goods imports minus agri, %) - Nominal growth in manufactured imports (NA, %) - Nominal growth in fuels imports (NA, %) - Nominal growth in ores and metals imports (NA, %) - Nominal growth in services imports (%) - Nominal growth in transport imports (%) - Nominal growth in travel imports (%) - Nominal growth in other commercial services imports (%) - Nominal growth in financial imports (%) - Nominal growth in computer and information imports (%) - Nominal growth in "other business services" imports (%) - Nominal growth in government services imports (%) 3-Trade Composition (share of goods and services) a) Goods trade share of total trade (g+s, %) b) Services trade share of total trade (g+s, %) c) Goods exports share of total exports (g+s, %) - Agricultural exports share of total exports (g+s, %) - Food exports share of total exports (g+s, %) - Non-agricultural exports share of total exports (g+s, %) - Manufactures exports share of total exports (g+s, %) - Fuels exports share of total exports (g+s, %) - Ores and metals exports share of total exports (g+s, %) d) Services exports share of total exports (g+s, %) - Transport exports share of total exports (g+s, %) - Travel exports share of total exports (g+s, %) - Other commercial services exports share of total exports (g+s, %) - Financial exports share of total exports (g+s,%)
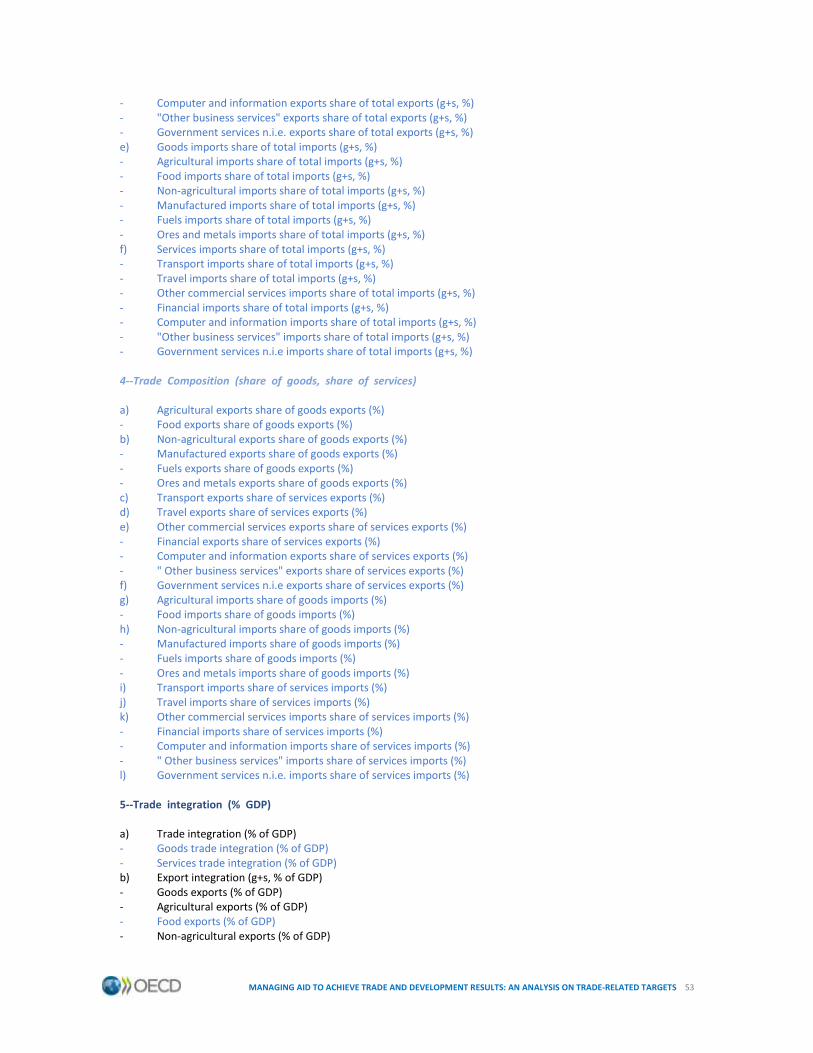
MANAGING AID TO ACHIEVE TRADE AND DEVELOPMENT RESULTS: AN ANALYSIS ON TRADE-RELATED TARGETS 53
- Computer and information exports share of total exports (g+s, %) - "Other business services" exports share of total exports (g+s, %) - Government services n.i.e. exports share of total exports (g+s, %) e) Goods imports share of total imports (g+s, %) - Agricultural imports share of total imports (g+s, %) - Food imports share of total imports (g+s, %) - Non-agricultural imports share of total imports (g+s, %) - Manufactured imports share of total imports (g+s, %) - Fuels imports share of total imports (g+s, %) - Ores and metals imports share of total imports (g+s, %) f) Services imports share of total imports (g+s, %) - Transport imports share of total imports (g+s, %) - Travel imports share of total imports (g+s, %) - Other commercial services imports share of total imports (g+s, %) - Financial imports share of total imports (g+s, %) - Computer and information imports share of total imports (g+s, %) - "Other business services" imports share of total imports (g+s, %) - Government services n.i.e imports share of total imports (g+s, %) 4-Trade Composition (share of goods, share of services) a) Agricultural exports share of goods exports (%) - Food exports share of goods exports (%) b) Non-agricultural exports share of goods exports (%) - Manufactured exports share of goods exports (%) - Fuels exports share of goods exports (%) - Ores and metals exports share of goods exports (%) c) Transport exports share of services exports (%) d) Travel exports share of services exports (%) e) Other commercial services exports share of services exports (%) - Financial exports share of services exports (%) - Computer and information exports share of services exports (%) - " Other business services" exports share of services exports (%) f) Government services n.i.e exports share of services exports (%) g) Agricultural imports share of goods imports (%) - Food imports share of goods imports (%) h) Non-agricultural imports share of goods imports (%) - Manufactured imports share of goods imports (%) - Fuels imports share of goods imports (%) - Ores and metals imports share of goods imports (%) i) Transport imports share of services imports (%) j) Travel imports share of services imports (%) k) Other commercial services imports share of services imports (%) - Financial imports share of services imports (%) - Computer and information imports share of services imports (%) - " Other business services" imports share of services imports (%) l) Government services n.i.e. imports share of services imports (%) 5-Trade integration (% GDP) a) Trade integration (% of GDP) - Goods trade integration (% of GDP) - Services trade integration (% of GDP) b) Export integration (g+s, % of GDP) - Goods exports (% of GDP) - Agricultural exports (% of GDP) - Food exports (% of GDP) - Non-agricultural exports (% of GDP)
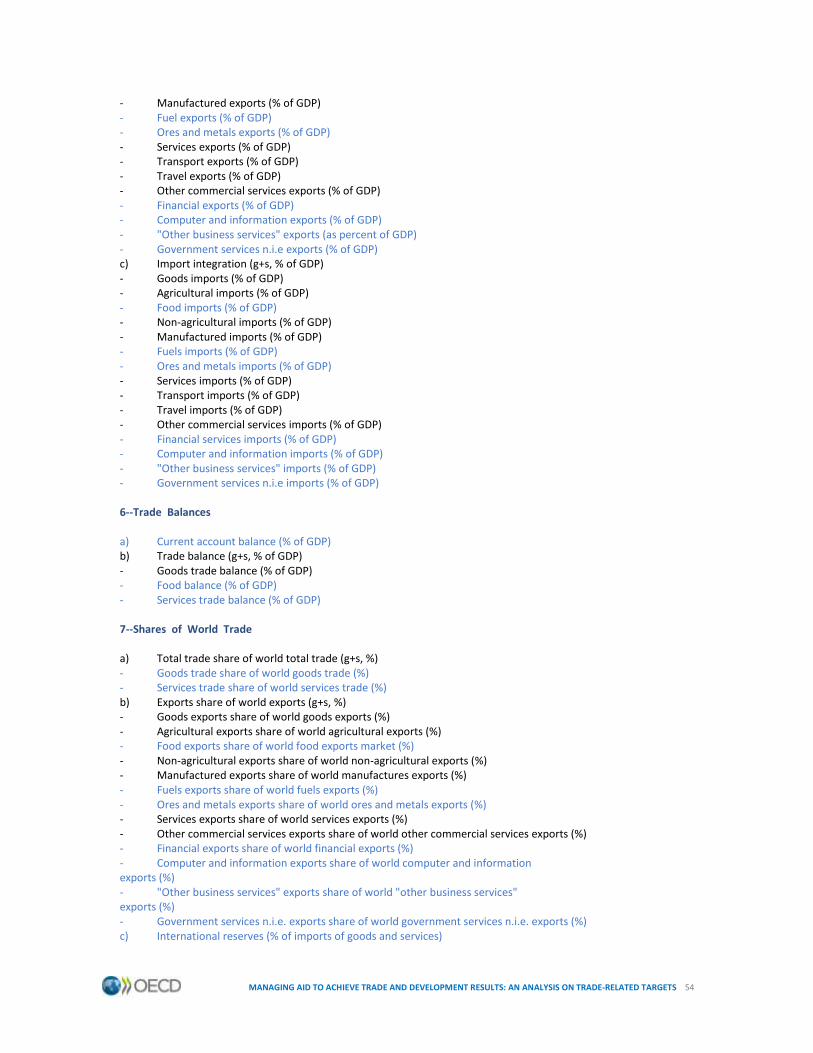
MANAGING AID TO ACHIEVE TRADE AND DEVELOPMENT RESULTS: AN ANALYSIS ON TRADE-RELATED TARGETS 54
- Manufactured exports (% of GDP) - Fuel exports (% of GDP) - Ores and metals exports (% of GDP) - Services exports (% of GDP) - Transport exports (% of GDP) - Travel exports (% of GDP) - Other commercial services exports (% of GDP) - Financial exports (% of GDP) - Computer and information exports (% of GDP) - "Other business services" exports (as percent of GDP) - Government services n.i.e exports (% of GDP) c) Import integration (g+s, % of GDP) - Goods imports (% of GDP) - Agricultural imports (% of GDP) - Food imports (% of GDP) - Non-agricultural imports (% of GDP) - Manufactured imports (% of GDP) - Fuels imports (% of GDP) - Ores and metals imports (% of GDP) - Services imports (% of GDP) - Transport imports (% of GDP) - Travel imports (% of GDP) - Other commercial services imports (% of GDP) - Financial services imports (% of GDP) - Computer and information imports (% of GDP) - "Other business services" imports (% of GDP) - Government services n.i.e imports (% of GDP) 6-Trade Balances a) Current account balance (% of GDP) b) Trade balance (g+s, % of GDP) - Goods trade balance (% of GDP) - Food balance (% of GDP) - Services trade balance (% of GDP) 7-Shares of World Trade a) Total trade share of world total trade (g+s, %) - Goods trade share of world goods trade (%) - Services trade share of world services trade (%) b) Exports share of world exports (g+s, %) - Goods exports share of world goods exports (%) - Agricultural exports share of world agricultural exports (%) - Food exports share of world food exports market (%) - Non-agricultural exports share of world non-agricultural exports (%) - Manufactured exports share of world manufactures exports (%) - Fuels exports share of world fuels exports (%) - Ores and metals exports share of world ores and metals exports (%) - Services exports share of world services exports (%) - Other commercial services exports share of world other commercial services exports (%) - Financial exports share of world financial exports (%) - Computer and information exports share of world computer and information exports (%) - "Other business services" exports share of world "other business services" exports (%) - Government services n.i.e. exports share of world government services n.i.e. exports (%) c) International reserves (% of imports of goods and services)
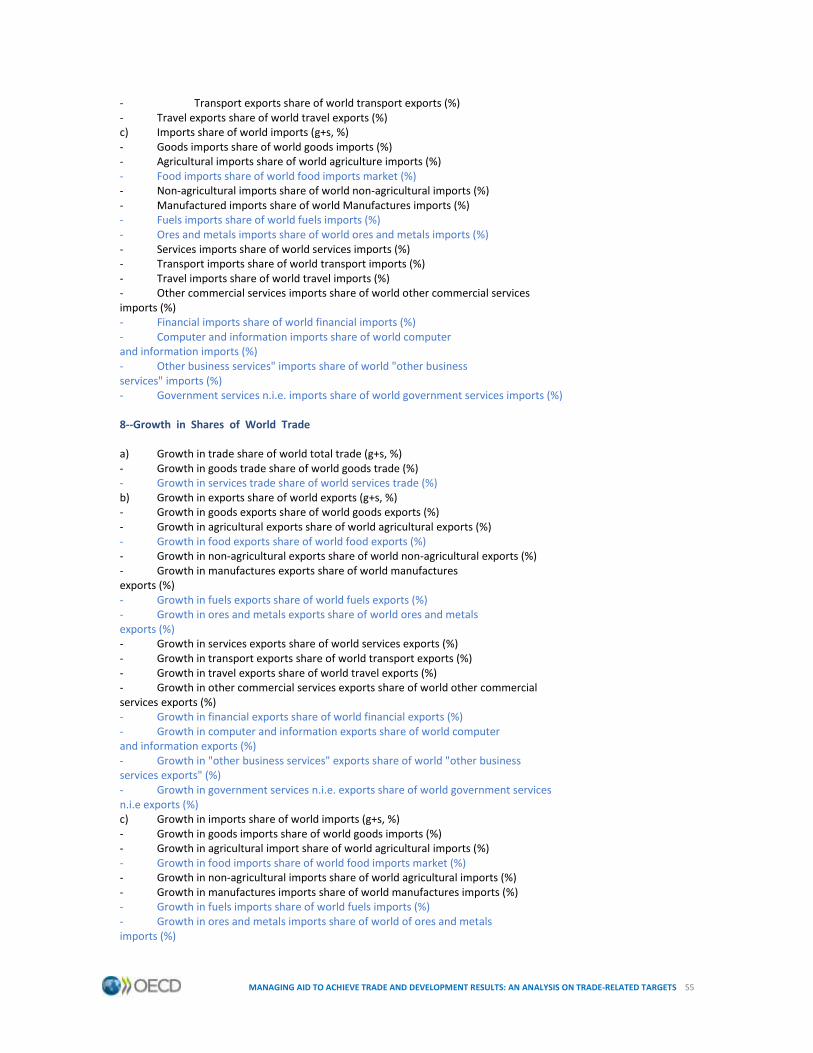
MANAGING AID TO ACHIEVE TRADE AND DEVELOPMENT RESULTS: AN ANALYSIS ON TRADE-RELATED TARGETS 55
- Transport exports share of world transport exports (%) - Travel exports share of world travel exports (%) c) Imports share of world imports (g+s, %) - Goods imports share of world goods imports (%) - Agricultural imports share of world agriculture imports (%) - Food imports share of world food imports market (%) - Non-agricultural imports share of world non-agricultural imports (%) - Manufactured imports share of world Manufactures imports (%) - Fuels imports share of world fuels imports (%) - Ores and metals imports share of world ores and metals imports (%) - Services imports share of world services imports (%) - Transport imports share of world transport imports (%) - Travel imports share of world travel imports (%) - Other commercial services imports share of world other commercial services imports (%) - Financial imports share of world financial imports (%) - Computer and information imports share of world computer and information imports (%) - Other business services" imports share of world "other business services" imports (%) - Government services n.i.e. imports share of world government services imports (%) 8-Growth in Shares of World Trade a) Growth in trade share of world total trade (g+s, %) - Growth in goods trade share of world goods trade (%) - Growth in services trade share of world services trade (%) b) Growth in exports share of world exports (g+s, %) - Growth in goods exports share of world goods exports (%) - Growth in agricultural exports share of world agricultural exports (%) - Growth in food exports share of world food exports (%) - Growth in non-agricultural exports share of world non-agricultural exports (%) - Growth in manufactures exports share of world manufactures exports (%) - Growth in fuels exports share of world fuels exports (%) - Growth in ores and metals exports share of world ores and metals exports (%) - Growth in services exports share of world services exports (%) - Growth in transport exports share of world transport exports (%) - Growth in travel exports share of world travel exports (%) - Growth in other commercial services exports share of world other commercial services exports (%) - Growth in financial exports share of world financial exports (%) - Growth in computer and information exports share of world computer and information exports (%) - Growth in "other business services" exports share of world "other business services exports" (%) - Growth in government services n.i.e. exports share of world government services n.i.e exports (%) c) Growth in imports share of world imports (g+s, %) - Growth in goods imports share of world goods imports (%) - Growth in agricultural import share of world agricultural imports (%) - Growth in food imports share of world food imports market (%) - Growth in non-agricultural imports share of world agricultural imports (%) - Growth in manufactures imports share of world manufactures imports (%) - Growth in fuels imports share of world fuels imports (%) - Growth in ores and metals imports share of world of ores and metals imports (%)

MANAGING AID TO ACHIEVE TRADE AND DEVELOPMENT RESULTS: AN ANALYSIS ON TRADE-RELATED TARGETS 56
- Growth in services imports share of world services imports (%) - Growth in transport imports share of world transport imports (%) - Growth in travel imports share of world travel imports (%) - Growth in other commercial services imports share of world other commercial services imports (%) - Growth in financial imports share of world financial imports (%) - Growth in computer and information imports share of world computer and information imports (%) - Growth in "other business services" imports share of world "other business services" imports (%) - Growth in government services n.i.e. imports share of world government services n.i.e imports (%) 9-Product and Market Diversification a) No. of products exported b) Share of top 5 exports products of total goods exports c) Export product concentration index d) Share of top 5 export markets of total goods exports e) Export market concentration index f) No. of products imported g) Share of top 5 imports products of total goods imports h) Import product concentration index i) Share of top 5 import sources of total goods imports g) Import source concentration index 10-Tourism, FDI, and Remittances a) Growth in tourist arrivals (%) b) Growth in tourist departures (%) c) FDI inflows (% of GDP) d) FDIoutflows(%ofGDP) e) FDI inflows (% of exports of goods and services) f) FDI inflows (% of world FDI inflows) - FDI inflows (% of total FDI inflows to low and middle income countries) - FDI inflows (% of total FDI inflows to low and middle income country excluding China and India) g) Total remittances inflows (% of GDP) h) Total remittances outflows (% of GDP) i) Total remittances inflows (% of exports of goods and services) j) Total remittances inflows (% of world total remittances inflows) k) Total remittances inflows (% of FDI inflows) l) Worker remittances inflows (% of GDP) m) Worker remittances outflows (% of GDP) n) Worker remittances inflows (% of goods exports) o) Worker remittances inflows (% of world worker remittances inflows) 11-Other Variables a) Population b) Real GDP growth (%) c) Real GDP per capita growth (%) d) Nominal trade (g+s) per capita Quarterly Variables Total Trade (g+s), Total Exports (g+s), Total Imports (g+s) - Real Growth Trade (g+s) BOP, year on year

MANAGING AID TO ACHIEVE TRADE AND DEVELOPMENT RESULTS: AN ANALYSIS ON TRADE-RELATED TARGETS 57
- Real Growth Exports (g+s) BOP, year on year - Real Growth Imports (g+s) BOP, year on year - Real Growth Trade (g+s) BOP, quarter on quarter - Real Growth Exports (g+s) BOP, quarter on quarter - Real Growth Imports (g+s) BOP, quarter on quarter - Nominal Growth Trade (g+s) BOP, year on year - Nominal Growth Exports (g+s) BOP, year on year - Nominal Growth Imports (g+s) BOP, year on year - Nominal Growth Trade (g+s) BOP, quarter on quarter - Nominal Growth Exports (g+s) BOP, quarter on quarter - Nominal Growth Imports (g+s) BOP, quarter on quarter Goods Trade, Goods Exports, Goods Imports ␣ Balance of Payments (BoP) - Real Growth Goods Trade BOP, year on year - Real Growth Goods Exports BOP, year on year - Real Growth Goods Imports BOP, year on year - Real Growth Goods Trade BOP, quarter on quarter - Real Growth Goods Exports BOP, quarter on quarter - Real Growth Goods Imports BOP, quarter on quarter - Nominal Growth Goods Trade BOP, year on year - Nominal Growth Goods Exports BOP, year on year - Nominal Growth Goods Imports BOP, year on year - Nominal Growth Goods Trade BOP, quarter on quarter - Nominal Growth Goods Exports BOP, quarter on quarter - Nominal Growth Goods Imports BOP, quarter on quarter Goods Trade, Goods Exports, Goods Imports - National Accounts (NA) - Real Growth Goods Trade NA, year on year - Real Growth Goods Exports NA, year on year - Real Growth Goods Imports NA, year on year - Real Growth Goods Trade NA, quarter on quarter - Real Growth Goods Exports NA, quarter on quarter - Real Growth Goods Imports NA, quarter on quarter - Nominal Growth Goods Trade NA, year on year - Nominal Growth Goods Exports NA, year on year - Nominal Growth Goods Imports NA, year on year - Nominal Growth Goods Trade NA, quarter on quarter - Nominal Growth Goods Exports NA, quarter on quarter - Nominal Growth Goods Imports NA, quarter on quarter Services Trade, Services Exports, Services Imports - Balance of Payments (BoP) - Real Growth Services Trade BOP, year on year - Real Growth Services Exports BOP, year on year - Real Growth Services Imports BOP, year on year - Real Growth Services Trade BOP, quarter on quarter - Real Growth Services Exports BOP, quarter on quarter - Real Growth Services Imports BOP, quarter on quarter - Nominal Growth Services Trade BOP, year on year - Nominal Growth Services Exports BOP, year on year - Nominal Growth Services Imports BOP, year on year - Nominal Growth Services Trade BOP, quarter on quarter - Nominal Growth Services Exports BOP, quarter on quarter - Nominal Growth Services Imports BOP, quarter on quarter
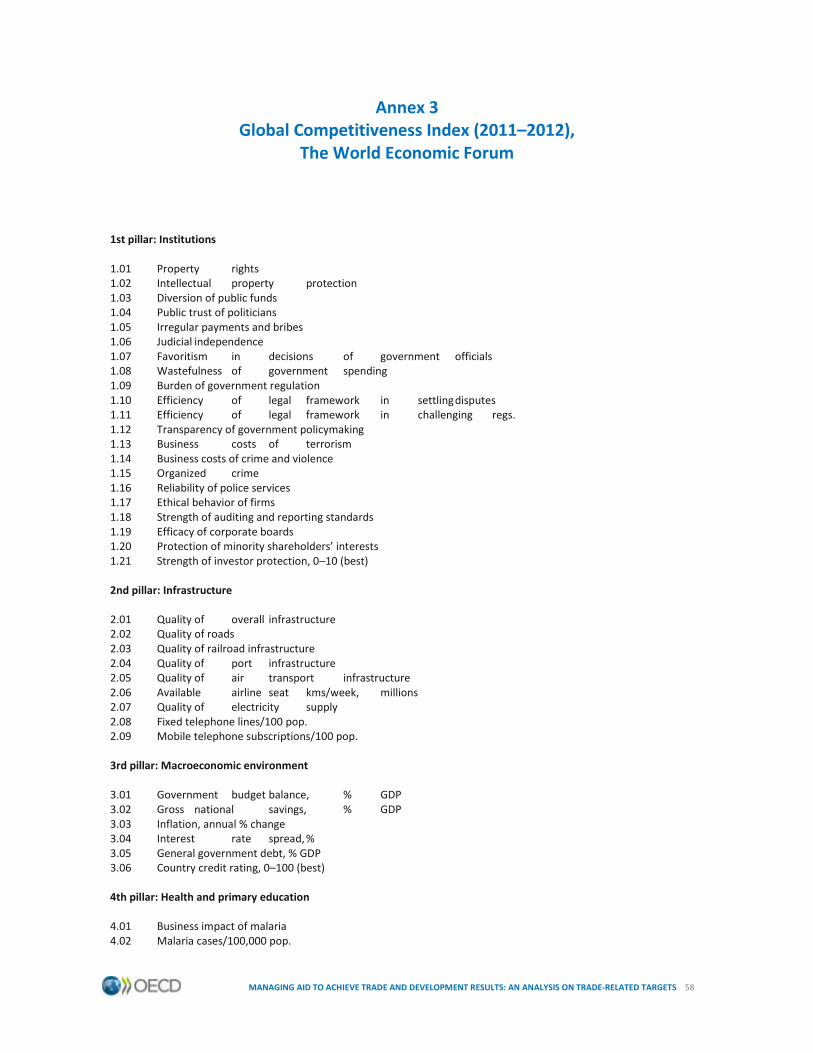
MANAGING AID TO ACHIEVE TRADE AND DEVELOPMENT RESULTS: AN ANALYSIS ON TRADE-RELATED TARGETS 58
Annex 3 Global Competitiveness Index (2011–2012),
The World Economic Forum
1st pillar: Institutions 1.01 Property rights 1.02 Intellectual property protection 1.03 Diversion of public funds 1.04 Public trust of politicians 1.05 Irregular payments and bribes 1.06 Judicial independence 1.07 Favoritism in decisions of government officials 1.08 Wastefulness of government spending 1.09 Burden of government regulation 1.10 Efficiency of legal framework in settling disputes 1.11 Efficiency of legal framework in challenging regs. 1.12 Transparency of government policymaking 1.13 Business costs of terrorism 1.14 Business costs of crime and violence 1.15 Organized crime 1.16 Reliability of police services 1.17 Ethical behavior of firms 1.18 Strength of auditing and reporting standards 1.19 Efficacy of corporate boards 1.20 Protection of minority shareholders’ interests 1.21 Strength of investor protection, 0–10 (best) 2nd pillar: Infrastructure 2.01 Quality of overall infrastructure 2.02 Quality of roads 2.03 Quality of railroad infrastructure 2.04 Quality of port infrastructure 2.05 Quality of air transport infrastructure 2.06 Available airline seat kms/week, millions 2.07 Quality of electricity supply 2.08 Fixed telephone lines/100 pop. 2.09 Mobile telephone subscriptions/100 pop. 3rd pillar: Macroeconomic environment 3.01 Government budget balance, % GDP 3.02 Gross national savings, % GDP 3.03 Inflation, annual % change 3.04 Interest rate spread, % 3.05 General government debt, % GDP 3.06 Country credit rating, 0–100 (best) 4th pillar: Health and primary education 4.01 Business impact of malaria 4.02 Malaria cases/100,000 pop.

MANAGING AID TO ACHIEVE TRADE AND DEVELOPMENT RESULTS: AN ANALYSIS ON TRADE-RELATED TARGETS 59
4.03 Business impact of tuberculosis 4.04 Tuberculosis incidence/100,000 pop. 4.05 Business impact of HIV/AIDS 4.06 HIV prevalence, % adult pop. 4.07 Infant mortality, deaths/1,000 live births 4.08 Life expectancy, years 4.09 Quality of primary education 4.10 Primary education enrollment, net % 5th pillar: Higher education and training 5.01 Secondary education enrollment, gross % 5.02 Tertiary education enrollment, gross % 5.03 Quality of the educational system 5.04 Quality of math and science education 5.05 Quality of management schools 5.06 Internet access in schools 5.07 Availability of research and training services 5.08 Extent of staff training 6th pillar: Goods market efficiency 6.01 Intensity of local competition 6.02 Extent of market dominance 6.03 Effectiveness of anti-monopoly policy 6.04 Extent and effect of taxation 6.05 Total tax rate, % profits 6.06 No. procedures to start a business 6.07 No. days to start a business 6.08 Agricultural policy costs 6.09 Prevalence of trade barriers 6.10 Trade tariffs, % duty 6.11 Prevalence of foreign ownership 6.12 Business impact of rules on FDI 6.13 Burden of customs procedures 6.14 Imports as a percentage of GDP 6.15 Degree of customer orientation 6.16 Buyer sophistication 7th pillar: Labor market efficiency 7.01 Cooperation in labor-employer relations 7.02 Flexibility of wage determination 7.03 Rigidity of employment index, 0–100 (worst) 7.04 Hiring and firing practices 7.05 Redundancy costs, weeks of salary 7.06 Pay and productivity 7.07 Reliance on professional management 7.08 Brain drain 7.09 Women in labor force, ratio to men 8th pillar: Financial market development 8.01 Availability of financial services 8.02 Affordability of financial services 8.03 Financing through local equity market 8.04 Ease of access to loans 8.05 Venture capital availability
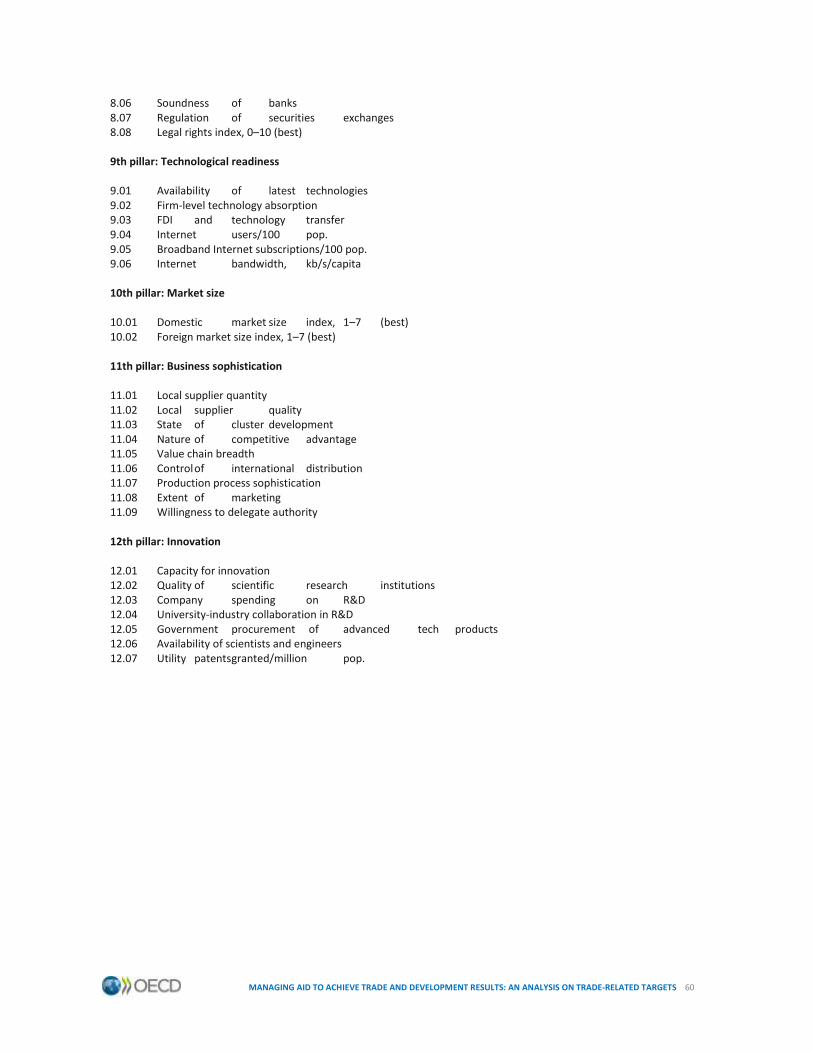
MANAGING AID TO ACHIEVE TRADE AND DEVELOPMENT RESULTS: AN ANALYSIS ON TRADE-RELATED TARGETS 60
8.06 Soundness of banks 8.07 Regulation of securities exchanges 8.08 Legal rights index, 0–10 (best) 9th pillar: Technological readiness 9.01 Availability of latest technologies 9.02 Firm-level technology absorption 9.03 FDI and technology transfer 9.04 Internet users/100 pop. 9.05 Broadband Internet subscriptions/100 pop. 9.06 Internet bandwidth, kb/s/capita 10th pillar: Market size 10.01 Domestic market size index, 1–7 (best) 10.02 Foreign market size index, 1–7 (best) 11th pillar: Business sophistication 11.01 Local supplier quantity 11.02 Local supplier quality 11.03 State of cluster development 11.04 Nature of competitive advantage 11.05 Value chain breadth 11.06 Control of international distribution 11.07 Production process sophistication 11.08 Extent of marketing 11.09 Willingness to delegate authority 12th pillar: Innovation 12.01 Capacity for innovation 12.02 Quality of scientific research institutions 12.03 Company spending on R&D 12.04 University-industry collaboration in R&D 12.05 Government procurement of advanced tech products 12.06 Availability of scientists and engineers 12.07 Utility patents granted/million pop.

MANAGING AID TO ACHIEVE TRADE AND DEVELOPMENT RESULTS: AN ANALYSIS ON TRADE-RELATED TARGETS 61
Annex 4 Trade Enabling Index (2011–2012),
The World Economic Forum
1st pillar: Domestic and foreign market access 1.01 Tariff rate, (%) 1.02 Non-tariff measures, index 0–100 (worst) 1.03 Complexity of tariffs, index 1–7 (best) Tariff dispersion, standard deviation Tariff peaks, % Specific tariffs, % Distinct tariffs, number 1.04 Share of duty-free imports, % 1.05 Tariffs faced, % 1.06 Margin of preference in destination mkts, index 0–100 (best) 2nd pillar: Efficiency of customs administration 2.01 Burden of customs procedures, 1–7 (best) 2.02 Customs services index, 0–12 (best) 3rd pillar: Efficiency of import-export procedures 3.01 Efficiency of the clearance process, 1–5 (best) 3.02 No. of days to import 3.03 No. of documents to import 3.04 Cost to import, US$ per container 3.05 No. of days to export 3.06 No. of documents to export 3.07 Cost to export, US$ per container 4th pillar: Transparency of border administration 4.01 Irregular payments in exports and imports, 1–7 (best) 4.02 Corruption Perceptions Index, 0–10 (best) 5th pillar: Availability and quality of transport infrastructure 5.01 Airport density, number per million pop. 5.02 Transshipment connectivity, index 0–100 (best) 5.03 Paved roads, % of total 5.04 Quality of air transport infrastructure, 1–7 (best) 5.05 Quality of railroad infrastructure, 1–7 (best) 5.06 Quality of roads, 1–7 (best) 5.07 Quality of port infrastructure, 1–7 (best) 6th pillar: Availability and quality of transport services 6.01 Liner Shipping Connectivity Index, 0–152.1 (best) 6.02 Ease and affordability of shipment, 1–5 (best) 6.03 Logistics competence, 1–5 (best)

MANAGING AID TO ACHIEVE TRADE AND DEVELOPMENT RESULTS: AN ANALYSIS ON TRADE-RELATED TARGETS 62
6.04 Tracking and tracing ability, 1–5 (best) 6.05 Timeliness of shipments in reaching destination, 1–5 (best) 6.06 Postal services efficiency, 1–7 (best) 6.07 GATS commitments in the transport sector, index 0–1 (best) 7th pillar: Availability and use of ICTs 7.01 Extent of business Internet use, 1–7 (best) 7.02 Mobile phone subscriptions/100 pop. 7.03 Broadband Internet subscriptions/100 pop. 7.04 Government Online Service Index, 0–1 (best) 7.05 Individuals using Internet, % 8th pillar: Regulatory environment 8.01 Property rights, 1–7 (best) 8.02 Ethics and corruption, 1–7 (best) 8.03 Undue influence, 1–7 (best) 8.04 Government efficiency, 1–7 (best) 8.05 Domestic competition, 1–7 (best) 8.06 Efficiency of the financial market, 1–7 (best) 8.07 Openness to foreign participation, index 1–7 (best) Ease of hiring foreign labor, 1–7 (best) Prevalence of foreign ownership, 1–7 (best) Business impact of rules on FDI, 1–7 (best) Openness to multilateral trade rules, index 0–100 (best) 8.08 Availability of trade finance, 1–7 (best) 9th pillar: Physical security 9.01 Reliability of police services, 1–7 (best) 9.02 Business costs of crime and violence, 1–7 (best) 9.03 Business costs of terrorism, 1–7 (best)
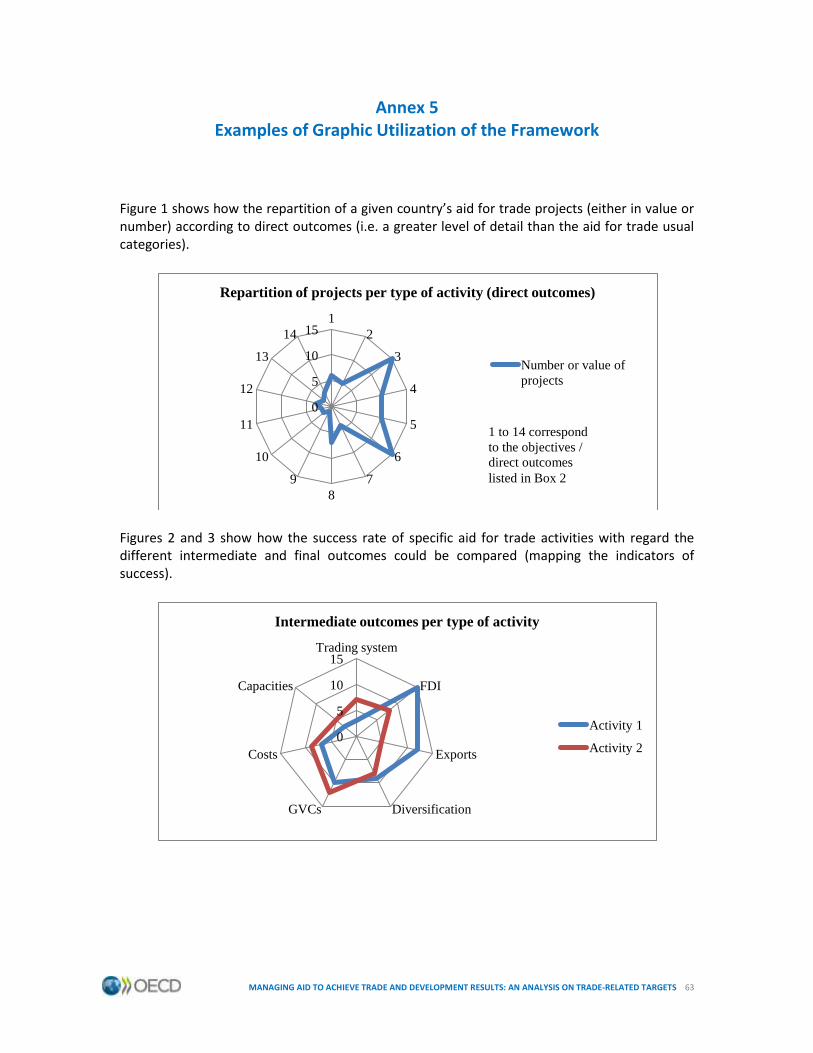
MANAGING AID TO ACHIEVE TRADE AND DEVELOPMENT RESULTS: AN ANALYSIS ON TRADE-RELATED TARGETS 63
Annex 5 Examples of Graphic Utilization of the Framework
Figure 1 shows how the repartition of a given country’s aid for trade projects (either in value or number) according to direct outcomes (i.e. a greater level of detail than the aid for trade usual categories).
Figures 2 and 3 show how the success rate of specific aid for trade activities with regard the different intermediate and final outcomes could be compared (mapping the indicators of success).
0
5
10
15 1
2
3
4
5
6
7
8
9
10
11
12
13
14
Repartition of projects per type of activity (direct outcomes)
Number or value of
projects
0
5
10
15 Trading system
FDI
Exports
Diversification GVCs
Costs
Capacities
Intermediate outcomes per type of activity
Activity 1
Activity 2
1 to 14 correspond
to the objectives /
direct outcomes
listed in Box 2

MANAGING AID TO ACHIEVE TRADE AND DEVELOPMENT RESULTS: AN ANALYSIS ON TRADE-RELATED TARGETS 64
0
5
10
15 Jobs
Income
Upgrading
Technology
Sustainability
Poltical stability
Final outcomes per type of activity
Activity 1
Activity 2

MANAGING AID TO ACHIEVE TRADE AND DEVELOPMENT RESULTS: AN ANALYSIS ON TRADE-RELATED TARGETS 65
Annex 6 Towards Trade Development Goals?
Would it be possible to take the exercise one step further and, along the MDGs model, agree on specific quantifiable targets for each aid for trade goal, to be achieved by 2025 (or any other date)? This approach is enticing, but raises a number of questions. For example: Is it possible to impose such targets on developing countries only? How is it possible to manage the basis risks (i.e. go around the attribution issue)? Nonetheless, this exercise might be worthwhile, and sticking to the MDGs format, the following provides an idea of how this next step could look like (indicative list).
Goal 1: Reduce the number of obstacles to trade at the borders
o Target 1.A: Reduce average tariffs by …%
o Target 1.B: MFN-0 represents …% of the tariff lines
o Target 1.C: Tariffs above …% represent less than …% of the tariff lines
o Target 1.D: Quotas are removed
o Target 1.E: Average time for customs clearance not to exceed …days
o Target 1.F: Custom duties are reduced by …%
Goal 2: Reduce trade-distortive or discriminatory measures beyond the borders
o Target 2.A: Tariff-equivalent of NTMs is reduced by …%
o Target 2.B: Services trade restrictiveness index drops to …%
Goal 3: Mainstream and promote trade, trade integration and investment
o Target 3.A: Trade appears in …% of the PRSPs
o Target 3.B: A new round of negotiations is concluded in the WTO
Goal 4: Improve the accessibility/connectivity of markets (telecoms and transport)
o Target 4.A: Average cost of transport to represent …% of the value of merchandises
o Target 4.B: Average cost of 3mn phone call to the US to not exceed …$
o Target 4.C: Phone penetration rate to reach …%
o Target 4.D: Internet penetration rate to reach …%
Goal 5: Improve other domestic infrastructure and basic services
o Target 5.A: Power outages in firms in a typical month not to exceed …
Goal 6: Improve the legal/regulatory environment for business
o Target 6.A: Number of procedures to enforce a contract not to exceed …
o Target 6.B: Losses due to theft, etc. not to exceed …% of sales
Goal 7: Improve the organization and performance of markets
o Target 7.A: Post-harvest losses not to represent more than …% of production
Goal 8: Increase productivity, production and innovation capacities
o Target 8.A: Number of patents to increase by …%
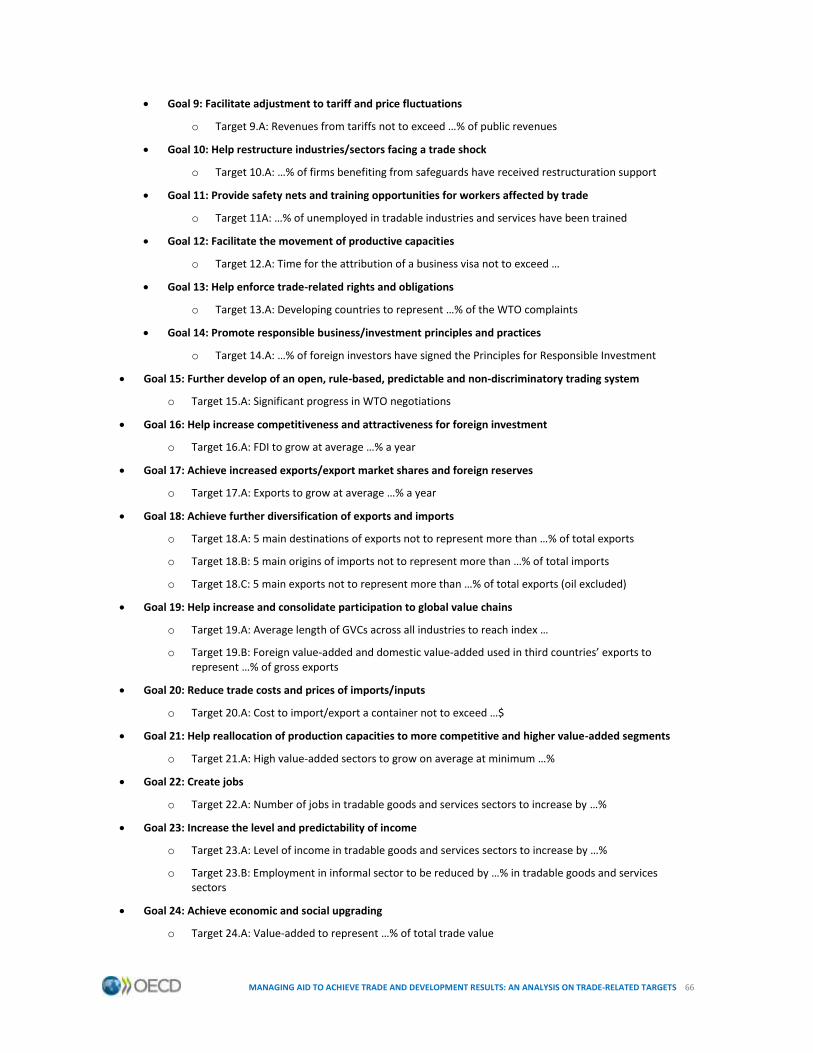
MANAGING AID TO ACHIEVE TRADE AND DEVELOPMENT RESULTS: AN ANALYSIS ON TRADE-RELATED TARGETS 66
Goal 9: Facilitate adjustment to tariff and price fluctuations
o Target 9.A: Revenues from tariffs not to exceed …% of public revenues
Goal 10: Help restructure industries/sectors facing a trade shock
o Target 10.A: …% of firms benefiting from safeguards have received restructuration support
Goal 11: Provide safety nets and training opportunities for workers affected by trade
o Target 11A: …% of unemployed in tradable industries and services have been trained
Goal 12: Facilitate the movement of productive capacities
o Target 12.A: Time for the attribution of a business visa not to exceed …
Goal 13: Help enforce trade-related rights and obligations
o Target 13.A: Developing countries to represent …% of the WTO complaints
Goal 14: Promote responsible business/investment principles and practices
o Target 14.A: …% of foreign investors have signed the Principles for Responsible Investment
Goal 15: Further develop of an open, rule-based, predictable and non-discriminatory trading system
o Target 15.A: Significant progress in WTO negotiations
Goal 16: Help increase competitiveness and attractiveness for foreign investment
o Target 16.A: FDI to grow at average …% a year
Goal 17: Achieve increased exports/export market shares and foreign reserves
o Target 17.A: Exports to grow at average …% a year
Goal 18: Achieve further diversification of exports and imports
o Target 18.A: 5 main destinations of exports not to represent more than …% of total exports
o Target 18.B: 5 main origins of imports not to represent more than …% of total imports
o Target 18.C: 5 main exports not to represent more than …% of total exports (oil excluded)
Goal 19: Help increase and consolidate participation to global value chains
o Target 19.A: Average length of GVCs across all industries to reach index …
o Target 19.B: Foreign value-added and domestic value-added used in third countries’ exports to represent …% of gross exports
Goal 20: Reduce trade costs and prices of imports/inputs
o Target 20.A: Cost to import/export a container not to exceed …$
Goal 21: Help reallocation of production capacities to more competitive and higher value-added segments
o Target 21.A: High value-added sectors to grow on average at minimum …%
Goal 22: Create jobs
o Target 22.A: Number of jobs in tradable goods and services sectors to increase by …%
Goal 23: Increase the level and predictability of income
o Target 23.A: Level of income in tradable goods and services sectors to increase by …%
o Target 23.B: Employment in informal sector to be reduced by …% in tradable goods and services sectors
Goal 24: Achieve economic and social upgrading
o Target 24.A: Value-added to represent …% of total trade value

MANAGING AID TO ACHIEVE TRADE AND DEVELOPMENT RESULTS: AN ANALYSIS ON TRADE-RELATED TARGETS 67
Goal 25: Accelerate the diffusion of technology and knowledge
o Target 25.A: …% employed by foreign company to receive training
Goal 26: Promote a better and more sustainable use of resources
o Target 26.A: CO2 emissions in tradable industries and services to be reduced by …%
o Target 26.B: Organic water pollutant emissions in tradable industries to be reduced by …%
Goal 27: Increase political and economic stability
o Target 27.A: Absence of terrorism