management’ss2.q4cdn.com/510341073/files/doc_downloads/presentations/final-q2... · source: bofa...
TRANSCRIPT

Certain statements made by us in this presentation that are not historical facts or that relate to future plans, events or performances
are forward-looking statements that reflect management’s current outlook for future periods, including statements regarding future
financial performance. These forward-looking statements are based upon our current expectations, and our actual results may differ
materially from those described or contemplated in the forward–looking statements. Factors that may cause our actual results to differ
materially from those contained in the forward-looking statements, include without limitation the following: 1) national and global
economic conditions, including the impact of changes in national and global credit markets and other changes on our customers; 2)
our ability to continue to attract and retain customers and maintain profit margins in the face of new and existing competition; 3) new
laws and regulations that could have a materially adverse effect on our operations and financial results; 4) significant labor
disturbances which could disrupt industries we serve; 5) increased costs and collateral requirements in connection with our insurance
obligations, including workers’ compensation insurance; 6) the adequacy of our financial reserves; 7) our continuing ability to comply
with financial covenants in our lines of credit and other financing agreements; 8) our ability to attract and retain competent employees
in key positions or to find temporary employees to fulfill the needs of our customers; 9) our ability to successfully complete and
integrate the MDT Personnel and other acquisitions that we may make from time to time; and 10) other risks described in our filings
with the Securities and Exchange Commission, including our most recent Form 10-K and Form 10-Q filings.
Use of estimates and forecasts:
Any references made to 2013 are based on management guidance issued April 24, 2013, and are included for informational purposes
only and are not an update or reaffirmation. We assume no obligation to update or revise any forward-looking statement, whether as a
result of new information, future events, or otherwise, except as required by law. Any other reference to future financial estimates are
included for informational purposes only and subject to factors discussed in our 10-K and 10-Q filings.

TRUEBLUE INVESTMENT HIGHLIGHTS
• Specialized leader in blue-collar staffing
• Well-positioned in growing staffing market
• Significant upside as construction market rebounds
• Compelling organic growth strategies
• Successful acquisition strategy
• Strong operating leverage
• Solid capital position supports growth

SPECIALIZED LEADER IN BLUE-COLLAR STAFFING

A CREDIBLE BUSINESS LEADER
Best Practices by
DHS/ICE Partner National
Agreement
Forbes Most
Trustworthy
Companies
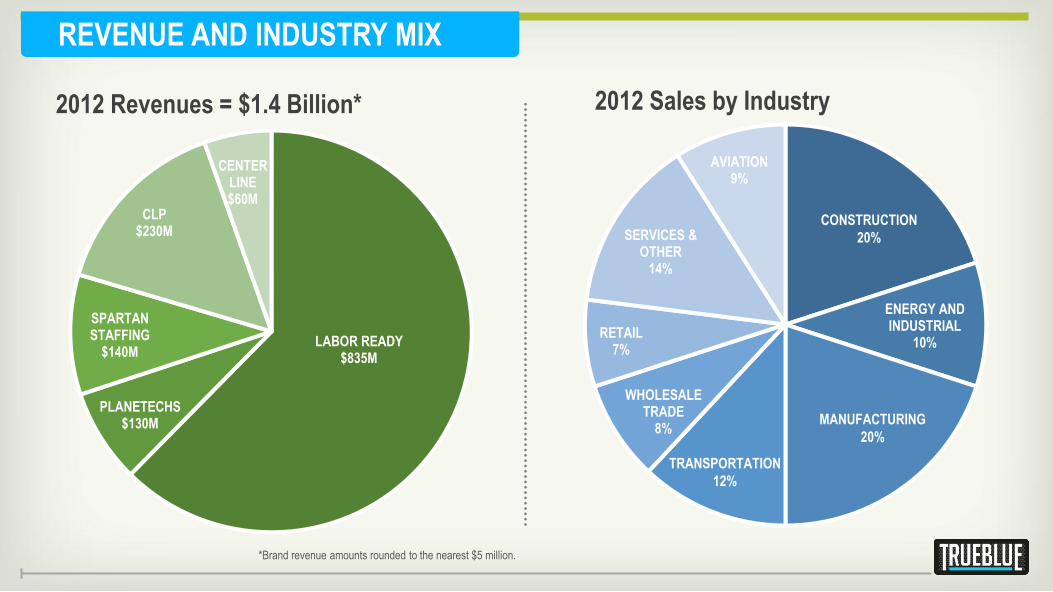
*Brand revenue amounts rounded to the nearest $5 million.
REVENUE AND INDUSTRY MIX
ENERGY AND INDUSTRIAL
10%
WHOLESALE TRADE
8%
RETAIL 7%
SERVICES & OTHER
14%
AVIATION 9%
CONSTRUCTION
20%
TRANSPORTATION
12%
MANUFACTURING
20%
2012 Sales by Industry
LABOR READY $835M
PLANETECHS $130M
SPARTAN STAFFING
$140M
CLP $230M
CENTER LINE $60M
2012 Revenues = $1.4 Billion*

BLUE-COLLAR STAFFING: $29 BILLION INDUSTRY
$100 Billion Overall Industry
$29B
OFFICE IT
FINANCE
HEALTHCARE
OTHER
BLUE-COLLAR
STAFFING
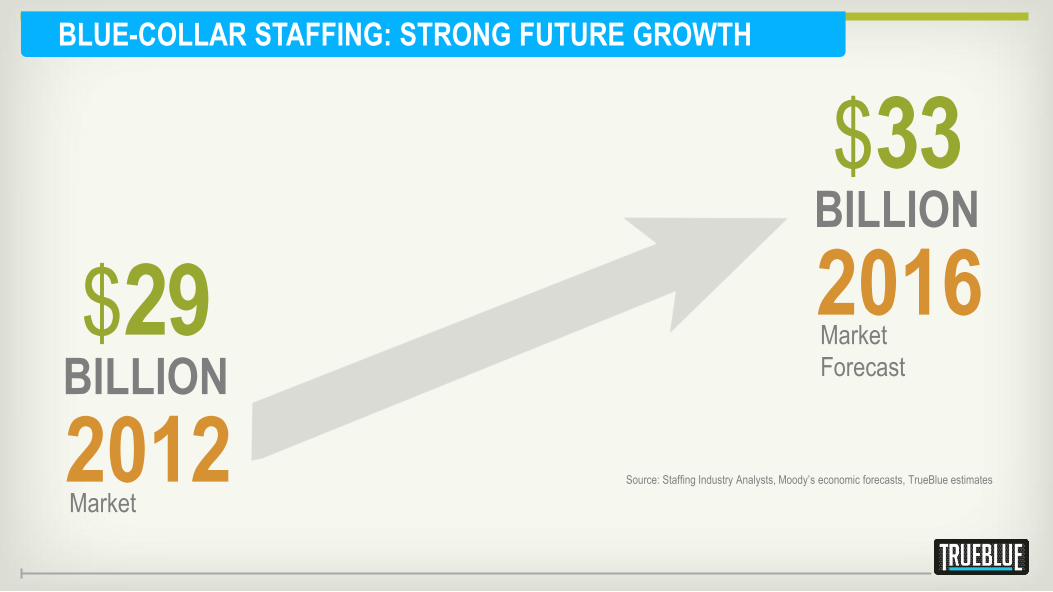
BLUE-COLLAR STAFFING: STRONG FUTURE GROWTH
Source: Staffing Industry Analysts, Moody’s economic forecasts, TrueBlue estimates 2012
2016
$33 BILLION
$29 BILLION
Market
Market
Forecast

BUSINESSES CHOOSE TEMPORARY STAFFING
Why businesses are using more
temporary staffing:
Source: Bureau of Labor Statistics. Measures number of jobs added from help supply services as a
percentage of total non-farm payroll. Timeframe measured is 41 months from the start of the recoveries:
August 1991, May 2003, and September 2009.
Temp jobs as percentage of total jobs
added
1991 - 2003 Recoveries
8%
2009 - 2012 Recovery
16%

STAFFING INDUSTRY GROWTH DRIVERS: AFFORDABLE CARE ACT
Employers with more than 50 full-
time employees (30+ hours per
week) must either offer affordable
health coverage or pay a penalty.
Provide employers with
flexible solutions to comply
with ACA law.
OPPORTUNITY SITUATION

STAFFING INDUSTRY GROWTH DRIVERS: CONSTRUCTION
• Construction employment near
historic lows
• Positive momentum for housing
starts; construction employment
to follow
• Significant construction
revenue increase
• Multiplier effect on logistics,
retail and services
OPPORTUNITY SITUATION

Source: BofA Merrill Lynch Research, BLS, Census Bureau
Ho
usi
ng
Sta
rts
(1
000s
; lag
s fiv
e qt
rs.)
Co
nst
ruct
ion
Jo
bs
(a
s pe
rcen
t of l
abor
forc
e)
POISED FOR CONSTRUCTION REBOUND
Construction Jobs Follow Housing Starts
2500
2000
1500
1000
500
5.2
4.7
4.2
3.7
3.2
1960 1965 1970 1975 1980 1985 1990 1995 2000 2005 2010 2015

TRUEBLUE: STRONG CONSTRUCTION UPSIDE
* Based on incremental construction EBITDA margin assumptions of 20 percent. See 2013 Estimate - Operating Income to EBITDA and Adjusted EBITDA Reconciliation slide.
HISTORIC CONSTRUCTION TRENDS
2006 2012
INCREMENTAL
CONSTRUCTION
UPSIDE
Revenue $ 450M $ 280M $ 170M
Incremental
EBITDA*
$ 35M

STAFFING INDUSTRY GROWTH DRIVERS: MANUFACTURING
• U.S. Manufacturing Renaissance
• Increased incentives to “reshore”
including increasing wages in China,
offshore product quality concerns
• Decline in energy costs
• Provide flexible, skilled
labor force
• Closer-to-customer
improves service
OPPORTUNITY SITUATION
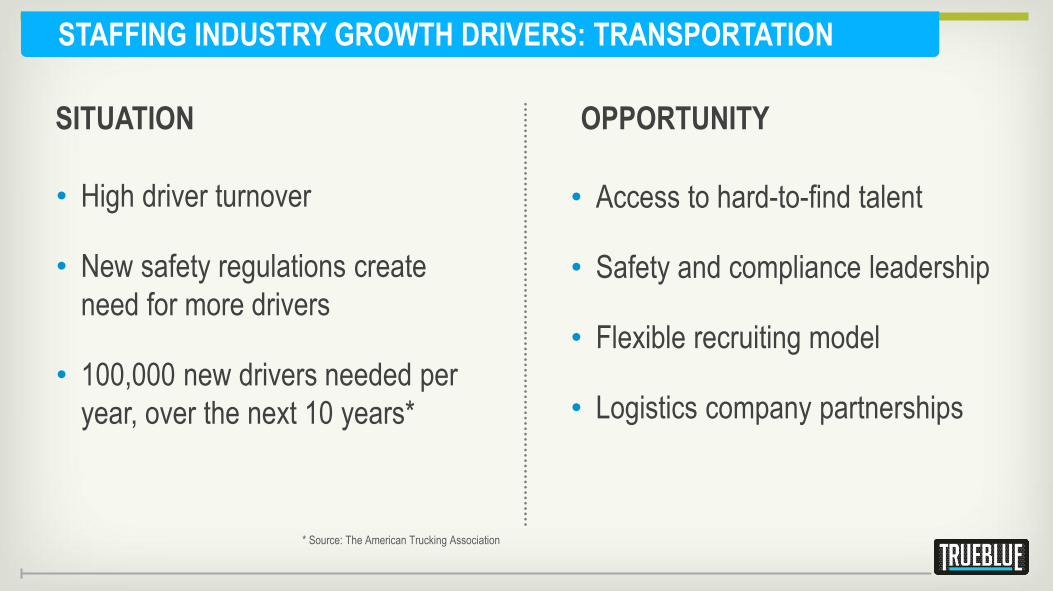
STAFFING INDUSTRY GROWTH DRIVERS: TRANSPORTATION
• High driver turnover
• New safety regulations create
need for more drivers
• 100,000 new drivers needed per
year, over the next 10 years*
• Access to hard-to-find talent
• Safety and compliance leadership
• Flexible recruiting model
• Logistics company partnerships
* Source: The American Trucking Association
OPPORTUNITY SITUATION

STAFFING INDUSTRY GROWTH DRIVERS: ENERGY
• Growing energy independence
• Skilled worker shortages
• More than 100,000 new jobs
in the solar industry by 2016*
• Deliver and manage skilled work
force in remote areas
• Deep technical knowledge within
green industries
• Partner with green industry trades
schools to fill skilled-worker gap
• Business process improvements,
not just service features
OPPORTUNITY SITUATION
* Source: The Solar Energy Industry Association
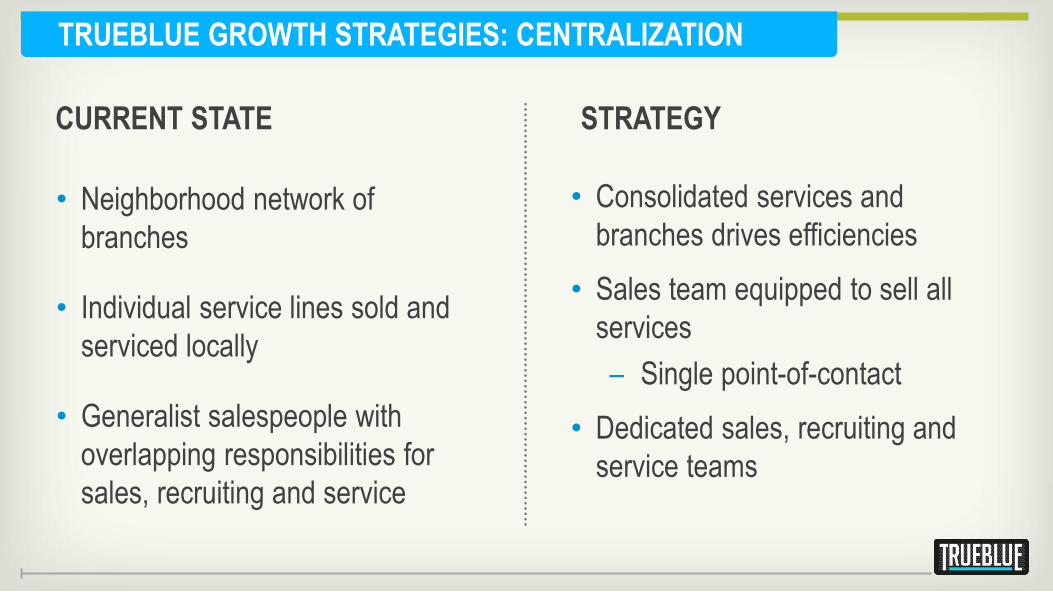
TRUEBLUE GROWTH STRATEGIES: CENTRALIZATION
STRATEGY CURRENT STATE
• Neighborhood network of
branches
• Individual service lines sold and
serviced locally
• Generalist salespeople with
overlapping responsibilities for
sales, recruiting and service
• Consolidated services and
branches drives efficiencies
• Sales team equipped to sell all
services
– Single point-of-contact
• Dedicated sales, recruiting and
service teams

TRUEBLUE GROWTH STRATEGIES: SPECIALIZATION
• Local sales strategies
• National sales and service
• Industry expertise
• Specialized recruiters
• Network of worker access points
• Additional vertical expertise
STRATEGY CURRENT STATE

Metro Area
Rural Area
Rural Area
Rural Area
Rural Area
CENTRALIZATION + SPECIALIZATION DRIVES VALUE
Sales teams equipped to sell all services will deliver higher revenue and specialized recruiters will deliver
higher quality workers as we consolidate our services and branch network to increase efficiency.
TRADITIONAL BRANCH NETWORK FUTURE BRANCH NETWORK
Metro Area
Rural Area
Rural Area
Rural Area
Rural Area

TRUEBLUE GROWTH STRATEGIES: TECHNOLOGY
STRATEGY CURRENT STATE
• Texting
– Fill more orders, faster
– Higher quality, more
workers
• Electronic placement
• Pay cards
• Electronic hiring process
• Social media recruiting
• Enhanced database
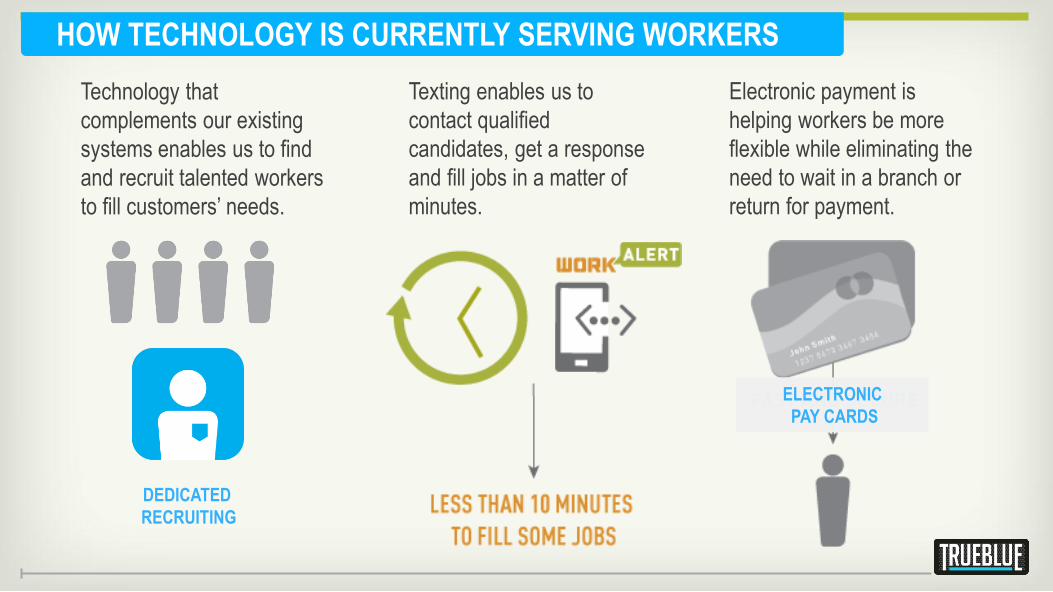
HOW TECHNOLOGY IS CURRENTLY SERVING WORKERS
DEDICATED
RECRUITING
ELECTRONIC
PAY CARDS
Electronic payment is
helping workers be more
flexible while eliminating the
need to wait in a branch or
return for payment.
Texting enables us to
contact qualified
candidates, get a response
and fill jobs in a matter of
minutes.
Technology that
complements our existing
systems enables us to find
and recruit talented workers
to fill customers’ needs.

SUCCESSFUL ACQUISITION STRATEGY
RESULTS CONSIDERATION
• ROIC*
• Strategic fit
• Cultural fit
• Limited financial risk
• New business capabilities
• Talent
• ROI >15% cost of capital
• $220M invested between 2004-2013
• Aggregated acquired companies ~40% of 2012 revenue
• Platforms established to seamlessly tuck in future acquisitions
* Return on Invested Capital

• Combined annual revenue of $1.6 billion
• Creates $1 billion revenue general labor staffing business
• Integration included about 60 branch consolidations
• Infusion of new talent, including industry-experienced sales force
* Based on 2014 estimate; assumes full year of revenue and certain synergies.
MDT: SUCCESSFUL INTEGRATION

Financial Review
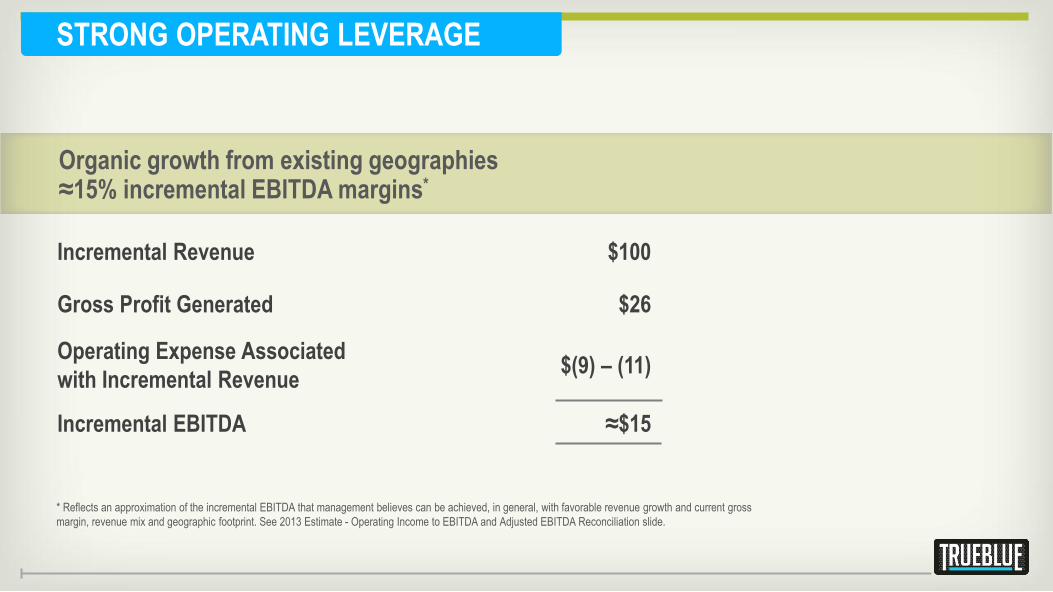
Incremental Revenue $100
Gross Profit Generated $26
Operating Expense Associated
with Incremental Revenue $(9) – (11)
Incremental EBITDA ≈$15
* Reflects an approximation of the incremental EBITDA that management believes can be achieved, in general, with favorable revenue growth and current gross
margin, revenue mix and geographic footprint. See 2013 Estimate - Operating Income to EBITDA and Adjusted EBITDA Reconciliation slide.
Organic growth from existing geographies ≈15% incremental EBITDA margins*
STRONG OPERATING LEVERAGE

Dollar amounts in millions Q-1 2013 Q-4 2012
Cash & investments
$ 111 $ 130
Borrowing Availability $ 71 $ 66
Total Liquidity Strong liquidity position to fund acquisition strategy
$ 182 $ 196
* The company took on debt in 2013 with the acquisition of MDT.
STRONG CAPITAL POSITION SUPPORTS GROWTH
Debt*
Low financial leverage balances strong operating leverage $ 31 $ 0
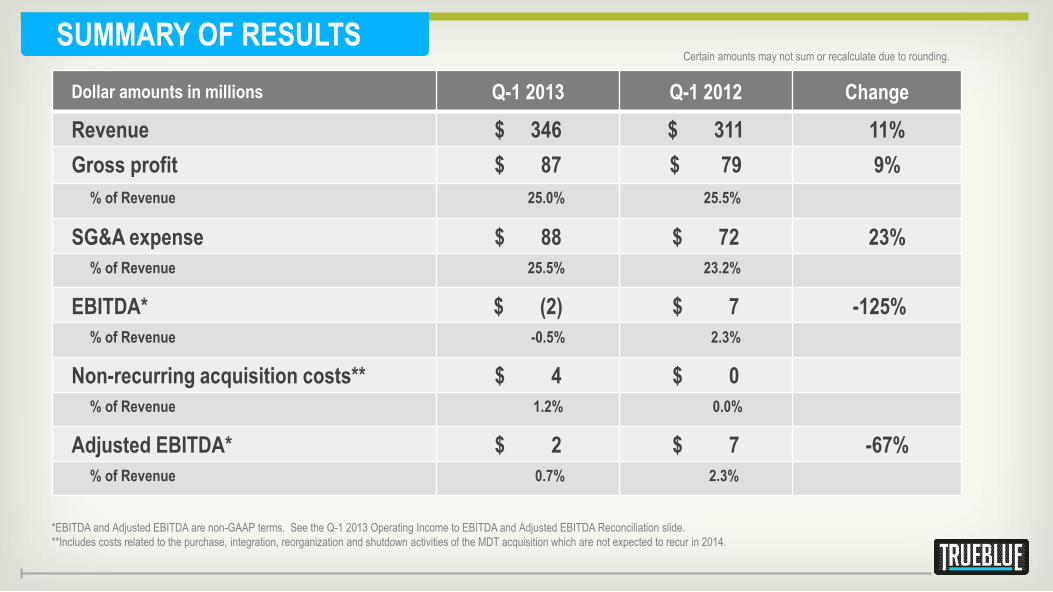
Dollar amounts in millions Q-1 2013 Q-1 2012 Change
Revenue $ 346 $ 311 11%
Gross profit $ 87 $ 79 9%
% of Revenue 25.0% 25.5%
SG&A expense $ 88 $ 72 23%
% of Revenue 25.5% 23.2%
EBITDA* $ (2) $ 7 -125%
% of Revenue -0.5% 2.3%
Non-recurring acquisition costs** $ 4 $ 0
% of Revenue 1.2% 0.0%
Adjusted EBITDA* $ 2 $ 7 -67%
% of Revenue 0.7% 2.3%
*EBITDA and Adjusted EBITDA are non-GAAP terms. See the Q-1 2013 Operating Income to EBITDA and Adjusted EBITDA Reconciliation slide.
**Includes costs related to the purchase, integration, reorganization and shutdown activities of the MDT acquisition which are not expected to recur in 2014.
SUMMARY OF RESULTS Certain amounts may not sum or recalculate due to rounding.

*Adjusted EBITDA excludes non-recurring costs related to the purchase, integration, reorganization and shutdown activities related to the MDT acquisition from EBITDA. EBITDA and Adjusted EBITDA are key
Measures used by management in evaluating performance. EBITDA and Adjusted EBITDA should not be considered a measure of financial performance in isolation or as an alternative to operating income (loss)
In the Statement of Operations in accordance with GAAP, and, as presented, may not be comparable to similarly titled measures of other companies.
Q-1 2013 OPERATING INCOME TO EBITDA AND
ADJUSTED EBITDA RECONCILIATION
Dollar amounts in millions
Q-1 2013 Q-1 2012
Income (loss) from operations $ (7) $ 2
Depreciation & amortization 5 5
EBITDA* (2) 7
Non-recurring acquisition costs 4 0
Adjusted EBITDA* $ 2 $ 7

2013 ESTIMATE – OPERATING INCOME TO EBITDA
AND ADJUSTED EBITDA RECONCILIATION
In millions
TrueBlue
Total
Income from operations 55 $ Depreciation & amortization 22
EBITDA* 77 Non-recurring costs 8
Adjusted EBITDA* 85 $
*Adjusted EBITDA excludes non-recurring costs related to the purchase, integration, reorganization and shutdown activities related to the MDT acquisition from EBITDA. EBITDA and Adjusted EBITDA are key
Measures used by management in evaluating performance. EBITDA and Adjusted EBITDA should not be considered a measure of financial performance in isolation or as an alternative to operating income (loss)
In the Statement of Operations in accordance with GAAP, and, as presented, may not be comparable to similarly titled measures of other companies.

• Specialized leader in blue-collar staffing
• Well-positioned in growing staffing market
• Significant upside as construction market rebounds
• Compelling organic growth strategies
• Successful acquisition strategy
• Strong operating leverage
• Solid capital position supports growth
TRUEBLUE INVESTMENT HIGHLIGHTS