management’s discussion and analysis of … · cash flow hedges reclassified to ... **free cash...
TRANSCRIPT

MANAGEMENT’S DISCUSSION AND ANALYSIS OF FINANCIAL CONDITION AND
RESULTS OF OPERATIONS FOR THE THREE MONTHS ENDED DECEMBER 31 AND SEPTEMBER 30, 2017
AND FOR THE TWELVE MONTHS ENDED DECEMBER 31, 2017 AND 2016

The following discussion of Rosneft’s financial condition and results of operations is based on, and should be read in
conjunction with, the Company’s financial statements and the notes thereto for the periods ended December 31, 2017
and 2016 and September 30, 2017 (the “Consolidated Financial Statements”). Such terms as “Rosneft”, “Company” and “Group” in their different forms in this report mean PJSC Rosneft Oil Company and its
consolidated subsidiaries, its equity share in associates and joint ventures. This report contains forward-looking
statements that involve risks and uncertainties. Rosneft’s actual results may materially differ from those discussed in such forward-looking statements as a result of various factors.
Except as otherwise indicated, oil and gas reserves and production are presented pro-rata for associates and joint ventures and 100% for fully consolidated subsidiaries.
Except as otherwise indicated, all amounts are provided in billions of RUB. All figures are rounded, however, figures
per unit of production are provided based on the actual data.
To convert tonnes of liquid hydrocarbon (except gas condensate of JSC “Rospan International”) to barrels a 7.404
ratio is used. To convert Rospan gas condensate to barrels a 8.3 ratio is used. To convert a thousand of cubic meters
of gas to barrels of oil equivalent a 6.09 ratio is used.

3
Overview ................................................................................................................................................... 5
Financial and operating highlights ......................................................................................................... 5
Significant events in the fourth quarter of 2017 ..................................................................................... 7
Macroeconomic factors affecting results of operations ......................................................................... 8
Changes in Crude Oil, Petroleum Product and Gas Prices ...................................................................... 8
USD/RUB and EUR/RUB Exchange Rates and Inflation ....................................................................... 9
Taxation ..................................................................................................................................................... 9
Mineral Extraction Tax (MET) .................................................................................................... 10
Export Customs Duty on Crude Oil ............................................................................................. 11
Export Customs Duty on Petroleum Products .............................................................................. 12
Changes in Transport Tariffs of Pipeline and Railway Monopolies ..................................................... 12
Financial performance for the three months ended December 31, 2017 and September 30, 2017 and
for the twelve months ended December 31, 2017 and 2016 (Consolidated statement of profit or loss)
.............................................................................................................................................................. 15
Upstream Operating Results ................................................................................................................. 16
Operating indicators ................................................................................................................................ 17
Production of Crude Oil and NGL ............................................................................................... 17
Production of Gas ......................................................................................................................... 18
Financial indicators ................................................................................................................................. 18
Equity share in financial results of upstream associates and joint ventures ................................... 18
Upstream production and operating expenses ............................................................................... 19
Exploration Expenses .................................................................................................................... 19
Mineral extraction tax ................................................................................................................... 19
Downstream Operating Results ............................................................................................................ 20
Operating indicators ................................................................................................................................ 21
Petroleum Product Output ............................................................................................................. 21
Financial indicators ................................................................................................................................. 22
Revenues and equity share in profits of associates and joint ventures ........................................... 22
Cost of Purchased Oil, Gas and Petroleum Products and Refining Costs and others .................. 30
Pipeline Tariffs and Transportation Costs .................................................................................... 33
Excise tax ..................................................................................................................................... 34
Export Customs Duty ................................................................................................................... 35
Operating results of segment “Corporate and others” .......................................................................... 35
Separate indicators of the consolidated financial statements ............................................................... 35
Costs and Expenses ................................................................................................................................. 35
General and Administrative Expenses........................................................................................... 35
Depreciation, Depletion and Amortization .................................................................................... 36
Taxes Other than Income Tax ....................................................................................................... 36
Finance Income and Expenses ...................................................................................................... 36

4
Other Income and Other Expenses ................................................................................................ 36
Foreign Exchange Differences ...................................................................................................... 37
Cash flow hedges reclassified to profit or loss .............................................................................. 37
Income Tax ................................................................................................................................... 37
Net Income ........................................................................................................................................... 37
Liquidity and Capital Resources ........................................................................................................... 38
Cash Flows .............................................................................................................................................. 38
Net cash received from/(used in) operating activities .................................................................... 38
Net cash used in investing activities .............................................................................................. 38
Net cash provided by financing activities ...................................................................................... 38
Capital Expenditures ............................................................................................................................... 39
Financial liabilities and liquid funds ..................................................................................................... 40
Key consolidated financial highlights (in RUB terms) ........................................................................ 41
Calculation of Free Cash Flow ............................................................................................................... 41
Calculation of EBITDA .......................................................................................................................... 42
Calculation of EBITDA Margin ............................................................................................................. 42
Calculation of Net Income Margin ......................................................................................................... 42
Calculation of Current ratio .................................................................................................................... 42
Calculation of Return on Average Equity (ROAE) ............................................................................... 42
Consolidated financial highlights (in USD terms) ................................................................................. 43
Consolidated statement of profit or loss ................................................................................................. 43
Key consolidated financial highlights (in USD terms) ........................................................................ 43
Calculation of Free Cash Flow ............................................................................................................... 44
Calculation of EBITDA Margin ............................................................................................................. 44
Calculation of Net Income Margin ......................................................................................................... 44
Calculation of Current ratio .................................................................................................................... 44
Appendix 1: Average monthly RUB/USD exchange rates, calculated using the Bank of Russia data 45
Appendix 2: Average transportation tariffs in the fourth and third quarters of 2017 in RUB .............. 45
5
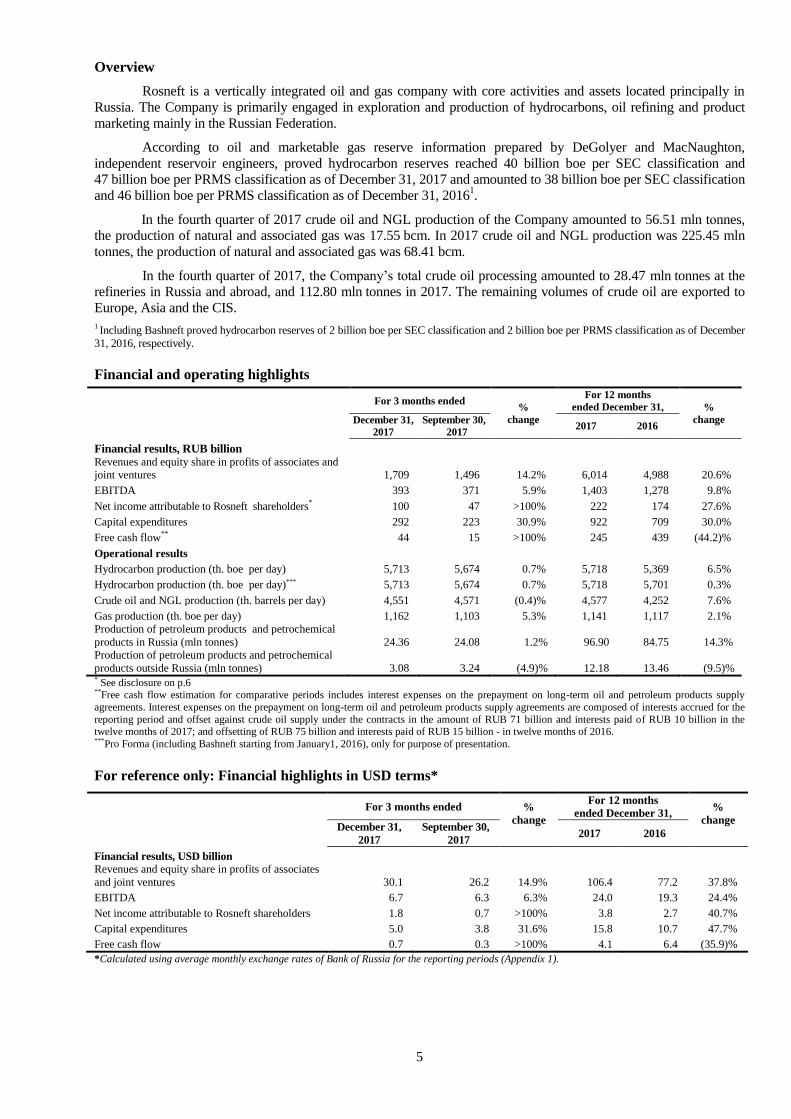
Overview
Rosneft is a vertically integrated oil and gas company with core activities and assets located principally in
Russia. The Company is primarily engaged in exploration and production of hydrocarbons, oil refining and product
marketing mainly in the Russian Federation.
According to oil and marketable gas reserve information prepared by DeGolyer and MacNaughton,
independent reservoir engineers, proved hydrocarbon reserves reached 40 billion boe per SEC classification and
47 billion boe per PRMS classification as of December 31, 2017 and amounted to 38 billion boe per SEC classification
and 46 billion boe per PRMS classification as of December 31, 20161.
In the fourth quarter of 2017 crude oil and NGL production of the Company amounted to 56.51 mln tоnnes,
the production of natural and associated gas was 17.55 bcm. In 2017 crude oil and NGL production was 225.45 mln
tоnnes, the production of natural and associated gas was 68.41 bcm.
In the fourth quarter of 2017, the Company’s total crude oil processing amounted to 28.47 mln tonnes at the
refineries in Russia and abroad, and 112.80 mln tonnes in 2017. The remaining volumes of crude oil are exported to
Europe, Asia and the CIS.
1 Including Bashneft proved hydrocarbon reserves of 2 billion boe per SEC classification and 2 billion boe per PRMS classification as of December
31, 2016, respectively.
Financial and operating highlights
For 3 months ended
%
change
For 12 months
ended December 31, %
change December 31,
2017
September 30,
2017 2017 2016
Financial results, RUB billion
Revenues and equity share in profits of associates and
joint ventures 1,709 1,496 14.2% 6,014 4,988 20.6%
EBITDA 393 371 5.9% 1,403 1,278 9.8%
Net income attributable to Rosneft shareholders* 100 47 >100% 222 174 27.6%
Capital expenditures 292 223 30.9% 922 709 30.0%
Free cash flow**
44 15 >100% 245 439 (44.2)%
Operational results
Hydrocarbon production (th. boe per day) 5,713 5,674 0.7% 5,718 5,369 6.5%
Hydrocarbon production (th. boe per day)*** 5,713 5,674 0.7% 5,718 5,701 0.3%
Crude oil and NGL production (th. barrels per day) 4,551 4,571 (0.4)% 4,577 4,252 7.6%
Gas production (th. boe per day) 1,162 1,103 5.3% 1,141 1,117 2.1%
Production of petroleum products and petrochemical
products in Russia (mln tonnes) 24.36 24.08 1.2% 96.90 84.75 14.3%
Production of petroleum products and petrochemical
products outside Russia (mln tonnes) 3.08 3.24 (4.9)% 12.18 13.46 (9.5)% * See disclosure on p.6 **Free cash flow estimation for comparative periods includes interest expenses on the prepayment on long-term oil and petroleum products supply
agreements. Interest expenses on the prepayment on long-term oil and petroleum products supply agreements are composed of interests accrued for the
reporting period and offset against crude oil supply under the contracts in the amount of RUB 71 billion and interests paid of RUB 10 billion in the twelve months of 2017; and offsetting of RUB 75 billion and interests paid of RUB 15 billion - in twelve months of 2016. ***Pro Forma (including Bashneft starting from January1, 2016), only for purpose of presentation.
For reference only: Financial highlights in USD terms*
For 3 months ended %
change
For 12 months
ended December 31, %
change
December 31,
2017
September 30,
2017 2017 2016
Financial results, USD billion
Revenues and equity share in profits of associates
and joint ventures 30.1 26.2 14.9% 106.4 77.2 37.8%
EBITDA 6.7 6.3 6.3% 24.0 19.3 24.4%
Net income attributable to Rosneft shareholders 1.8 0.7 >100% 3.8 2.7 40.7%
Capital expenditures 5.0 3.8 31.6% 15.8 10.7 47.7%
Free cash flow 0.7 0.3 >100% 4.1 6.4 (35.9)%
*Calculated using average monthly exchange rates of Bank of Russia for the reporting periods (Appendix 1).

6
1Financial results for 12 months 2016 are adjusted for the assessment of the fair price of Bashneft Group
and JSC Targin
Net effect in the income attributable to the Company’s shareholders from the recognition of the assessment of
fair price of Bashneft Group and JSC Targin as of the acquisition date in 2016 was RUB 7 billion in
the consolidated statement of profit or loss in 2016.

7
Significant events in the fourth quarter of 2017
Bashneft Board of Directors approved the terms of out-of-court settlement with Sistema
In December 2017 Rosneft and Bashneft announce that Bashneft Board of Directors approved the terms of the
out-of-court settlement with JSFC Sistema and JSC Sistema-Invest. According to the settlement terms the defendants
are obliged to compensate the agreed damages to Bashneft in the amount of RUB 100 bln. The finalization of the
payments shall be made by March 30, 2018. The parties agreed to restrain from any further claims regarding the
disputable issues upon the above mention payments finalization.
Rosneft closed the deal to acquire a 30% stake in Zohr gas field
In early October 2017, the Company closed a deal with Eni to acquire 30% in a concessional agreement to
develop Zohr field, one of the largest gas fields in the Mediterranean. The project is being undertaken in partnership
with Eni (60% stake) and BP (10% stake). Participation in the development of this unique producing asset will allow
Rosneft to significantly increase gas production abroad in a short time and enter the gas market of Egypt with the
prospect of further activities development in the country and the region as a whole.
Production sharing agreement between Rosneft and Kurdistan government
In October 2017, the Company and the Government of the Kurdish Autonomous Region of Iraq signed the
documents required for the enactment of Production Sharing Agreements (PSA) for five production blocks with a
conservative estimate of recoverable oil reserves of 670 mln bbl which are located in the Kurdish Autonomous
Region. The key terms of the agreements and the basic principles of production distribution are similar to the PSA in
Iraqi Kurdistan that were signed by other international oil and gas companies.
Rosneft and Pertamina set up a Joint Venture for the development of Tuban Grass Root Refinery (TGRR)
project
Rosneft and Indonesian state-owned oil and gas company Pertamina completed the establishment of the joint
venture for the development of Tuban grass root refinery and petrochemical complex (TGRR) in Tuban in the East
Java province of Indonesia. The JV envisages the following participants’ shares in the joint venture: Rosneft – 45%,
Pertamina – 55% and sets out the JV's governance principles.

8
Macroeconomic factors affecting results of operations
Main factors affecting Rosneft’s results of operations are:
Changes in crude oil and petroleum product prices;
RUB/USD exchange rate and inflation;
Taxation including changes in mineral extraction tax, export customs duty and excises;
Changes in tariffs of natural monopolies (for pipeline and railway transport);
Changes in electricity prices.
Changes in prices, export customs duty and transport tariffs may have a significant impact on the mix of
products and distribution channels the Company selects seeking to maximise netback prices of the produced crude oil.
Changes in Crude Oil, Petroleum Product and Gas Prices
World crude oil prices are highly volatile and fluctuate depending on the global balance of supply and demand
on the world crude oil market, political situation mainly in the oil producing regions of the world and other factors.
Crude oil exported by Rosneft via the Transneft’s pipeline system is blended with crude oil of other producers that is
of a different quality. The resulting Urals blend is traded at a discount to Brent. Crude oil exported via Eastern Siberia
– Pacific Ocean (“ESPO”) pipeline is sold at a price which is linked to the price of “Dubai” blend.
Petroleum product prices on international and domestic markets are primarily determined by the level of
world prices for crude oil, supply and demand for petroleum products and competition on different markets. Price
dynamics depends on the type of petroleum products.
The table below sets forth the average crude oil and petroleum products prices worldwide and in Russia in
USD and RUB. The prices nominated in USD are translated into RUB at average USD/RUB exchange rate for the
respective period.
For 3 months ended
Change
For 12 months
ended December 31, Change
December 31,
2017
September 30,
2017 2017 2016
World market (USD per barrel) % (USD per barrel) %
Brent (dated) 61.4 52.0 17.9% 54.3 43.7 24.1%
Urals (average Med and NWE) 60.5 50.8 19.0% 53.1 42.1 26.2% Urals (FOB Primorsk) 59.6 50.2 18.6% 52.0 40.1 29.4%
Urals (FOB Novorossysk) 59.7 50.5 18.1% 52.3 41.0 27.6%
Dubai 59.3 50.5 17.5% 53.2 41.3 28.8% (USD per tonne) % (USD per tonne) %
Naphtha (av. FOB/CIF Med) 543 451 20.2% 472 372 26.9%
Naphtha (av. FOB Rotterdam/CIF NWE) 554 460 20.3% 483 384 25.7% Naphtha (CFR Japan) 570 461 23.7% 494 399 23.9%
Fuel oil (av. FOB/CIF Med) 337 296 13.9% 302 210 44.1%
Fuel oil (av. FOB Rotterdam/CIF NWE) 333 292 13.8% 297 204 45.2% High sulphur fuel oil 180 cst (FOB Singapore) 357 312 14.5% 323 231 39.8%
Gasoil (av. FOB/CIF Med) 542 472 14.9% 484 391 23.7%
Gasoil (av. FOB Rotterdam/CIF NWE) 544 474 14.9% 485 393 23.5% Gasoil(FOB Singapore) 528 466 13.3% 480 383 25.3%
(th. RUB per barrel) % (th. RUB per barrel) %
Brent (dated) 3.58 3.07 16.7% 3.17 2.93 8.0%
Urals (average Med and NWE) 3.53 3.00 17.8% 3.10 2.82 9.9%
Urals (FOB Primorsk) 3.48 2.97 17.3% 3.03 2.69 12.7%
Urals (FOB Novorossysk) 3.49 2.98 16.9% 3.05 2.75 11.1% Dubai 3.46 2.98 16.3% 3.11 2.77 12.1%
(th. RUB per tonne) % (th. RUB per tonne) %
Naphtha (av. FOB/CIF Med) 31.7 26.6 19.0% 27.6 25.0 10.4%
Naphtha (av. FOB Rotterdam/CIF NWE) 32.3 27.2 19.1% 28.2 25.7 9.4%
Naphtha (CFR Japan) 33.3 27.2 22.4% 28.8 26.7 7.8% Fuel oil (av. FOB/CIF Med) 19.7 17.5 12.8% 17.6 14.1 25.5%
Fuel oil (av. FOB Rotterdam/CIF NWE) 19.4 17.2 12.6% 17.3 13.7 26.4%
High sulphur fuel oil 180 cst (FOB Singapore) 20.9 18.4 13.4% 18.8 15.5 21.7% Gasoil (av. FOB/CIF Med) 31.7 27.9 13.7% 28.2 26.2 7.7%
Gasoil (av. FOB Rotterdam/CIF NWE) 31.8 28.0 13.7% 28.3 26.3 7.5%
Gasoil(FOB Singapore) 30.8 27.5 12.1% 28.0 25.7 9.1% Russian market (net of VAT, including excise tax) (th. RUB per tonne) % (th. RUB per tonne) %
Crude oil 17.3 14.5 19.1% 14.6 12.2 19.9%
Fuel oil 10.9 9.7 12.3% 9.6 6.3 51.1%
Summer diesel 34.4 31.3 9.9% 31.8 27.5 15.7% Winter diesel 38.5 33.9 13.4% 34.2 29.1 17.4%
Jet fuel 35.4 29.9 18.2% 30.2 25.1 20.2%
High octane gasoline 36.6 36.5 0.4% 35.7 33.0 8.2% Low octane gasoline 33.4 33.7 (0.9)% 32.1 30.0 7.0%
Sources: average prices were calculated from unrounded data of analytical agencies.

9
The difference between price movements denominated in USD and those denominated in RUB is explained
by nominal RUB appreciation against USD by 1.0% in the fourth quarter of 2017 compared with the third quarter of
2017 and nominal RUB appreciation against USD by 14.9% in the twelve months of 2017 compared with the same
period of 2016.
The Russian Government regulates the price of the gas sold in Russia by Gazprom and its affiliates, which is
considered as the benchmark for domestic gas market. Starting from July 1, 2016 regulated gas price for residential
supply which is set by Federal Anti- Monopoly Service (FAS) grew up by 2% (indexation for other customer group
was not carried out). Starting from July 2017, regulated gas price for all groups of end-users grew up by 3.9%.
Rosneft’s average domestic gas sales price (net of VAT) was RUB 3.44 thousand and RUB 3.29 thousand per th.
cubic meters in the fourth quarter of 2017 and third quarter of 2017, respectively. In 2017 Rosneft’s average domestic
gas sales price (net of VAT) was RUB 3.33 thousand per th. cubic meters compared to RUB 3.24 thousand per th.
cubic meters in the twelve months of 2016.
USD/RUB and EUR/RUB Exchange Rates and Inflation
The USD/RUB and EUR/RUB exchange rates and inflation in Russia affect Rosneft’s results as most of the
Company’s revenues from sales of crude oil and petroleum products are denominated in USD, while most of the
Company’s expenses are denominated in RUB.
The table below provides information on the exchange rates movements and inflation during the periods
analysed:
For 3 months ended
For 12 months
ended December 31,
December 31,
2017
September 30,
2017 2017 2016
Consumer price index (CPI) for the period* 0.8% (0.6)% 2.5% 5.4%
Average RUB/USD exchange rate for the period** 58.41 59.02 58.35 67.03
RUB/USD exchange rate at the end of the period 57.60 58.02 57.60 60.66
Average RUB/EUR exchange rate for the period 68.78 69.29 65.90 74.23
RUB/EUR exchange rate at the end of the period 68.87 68.45 68.87 63.81
Source: the Central Bank of the Russian Federation.
*Producer price index amounted to 7.8% y-o-y at the end of December 2017. **See Average monthly RUB/USD exchange rates in the Appendix 1.
Taxation
The table below provides information on actual tax rates of mineral extraction tax and export customs duty of
crude oil and petroleum products:
For 3 months
ended %
change*
For 12 months
ended December 31, %
change* December 31,
2017
September 30,
2017 2017 2016
Mineral extraction tax
Crude oil (RUB per tonne) 9,719 7,812 24.4% 8,134 5,777 40.8%
Export customs duty for crude oil
Crude oil (US$ per tonne) 96.3 79.8 20.8% 86.7 75.7 14.5% Crude oil (RUB per tonne) 5,629 4,704 19.7% 5,058 5,022 0.7%
Crude oil (RUB per barrel) 760 635 19.7% 683 678 0.7%
Export customs duty for petroleum products
Gasoline (RUB per tonne) 1,687 1,409 19.7% 1,516 3,060 (50.5)%
Naphtha (RUB per tonne) 3,093 2,584 19.7% 2,779 3,562 (22.0)% Light and middle distillates (RUB per tonne) 1,687 1,409 19.7% 1,516 2,006 (24.5)%
Liquid fuels (fuel oil) (RUB per tonne) 5,629 4,704 19.7% 5,058 4,115 22.9%
*Calculated based on unrounded data.
According to Federal law 401-FZ of November 30, 2016 On amendments to Part Two of the Tax Code and
Other Legislative Acts of the Russian Federation” and 355 –FZ of November 27, 2017, new amendments were
introduced from January 1, 2017 and from January 1, 2018 in respect of excise duties.

10
The excise tax rates on the petroleum products are as follows:
Excise duties (RUB per tonne)
Since
January 1
through
March 31,
2016
Since
April 1,
through
December 31,
2016
2017
Since
January 1,
through
June 30,
2018
Since
July 1,
through
December 31,
2018
High octane gasoline
High octane gasoline non-compliant with euro-5 10,500 13,100 13,100 13,100 13,100
High octane gasoline euro-5 7,530 10,130 10,130 11,213 11,892
Naphtha 10,500 13,100 13,100 13,100 13,100
Diesel 4,150 5,293 6,800 7,665 8,258
Lubricants 6,000 6,000 5,400 5,400 5,400
Benzol, paraxylene, ortoxylene 3,000 3,000 2,800 2,800 2,800
Middle distillates 4,150 5,293 7,800 8,662 8,662
In accordance with new amendments of the Federal law 401-FZ, the producer is able to apply an increased
coefficient to excise duty deduction of 1.7 in 2017 depending on certain type of the oil product subject to excise duty.
Effective tax burden of the Company was 42.9% and 41.4% in the fourth and third quarters of 2017,
respectively. In the twelve months 2017 and 2016 effective tax burden of the Company was 42.9% and 39.1%,
respectively.
The mineral extraction tax and the export customs duty accounted for approximately 36.5% and 33.9% of
Rosneft’s total revenues in the fourth and third quarters of 2017, respectively, and also 35.7% and 33.4% in the twelve
months of 2017 and 2016, respectively. Tax withdrawing share in the financial results excluding forex and one off
effects was up to 88% in the twelve months of 2017.
Mineral Extraction Tax (MET)
The rate of mineral extraction tax (MET) for crude oil is linked to the Urals price in the international market,
and it is calculated in USD per barrel of crude oil produced using average exchange rate established by the Central
Bank of Russia for the respective month.
Starting from January 1, 2017 the mineral extraction tax rate will be calculated by multiplying the tax rate of
RUB 919 per tonne (in 2016– RUB 857 per tonne) by the adjustment ratio of ((P - 15) x Eхchange rate / 261), where
“P” is the average Urals price per barrel in USD and “Exchange rate” is the average RUB/USD exchange rate
established by the Central Bank of Russia in the respective month and minus the factor which characterizes crude oil
production at a particular oil field, “Dm”1.
In accordance with the legislation tax relieves are applicable to certain fields. In 2017 the Company applied
different tax relives and special tax treatment of crude oil MET:
Tax relieves in 2017 Applicable in the Company
Zero rates Oil fields with hard to recover reserves, including bazhenov, abalak, khadum,
domanic formations
Reduced MET by coefficient “Dm”, which
characterizes crude oil production at a
particular oil field
Oil fields located:
In Irkutsk region, the republic of Sakha (Yakutia) and Krasnoyarsk
territory which is applicable for the first 25 million tonnes of production
On the territory of the Nenets Autonomous district, Yamalo-nenets
Autonomous district – for the first 15 million tonnes of production
Okhotsk sea fields subject to zero mineral extraction tax rate which is
applicable for the first 30 million tonnes of production
Oil fields with reserve depletion rate of over 80%.
Oil fields with the volume of initial recoverable reserves being less than 5 million
tonnes.
Oil fields with high-viscosity crude oil (in-situ viscosity more than 200 mPas and
less than 10 000 mPas)
Special tax regime for offshore projects in the
Russian Federation
The offshore projects are categorized into one of four groups depending on its
complexity and specify MET rates for each project group ranging from 5% to
30% of hydrocarbon prices (natural gas projects of 3 and 4 groups of difficulty –
1.3% and 1.0% respectively).
Special tax regime exempting the Company
from paying mineral extraction tax. Exploration projects in the Sakhalin-1 psa.
1 The coefficient “Dm” is calculated using base rate (starting 2016 – RUB 559) and factors which characterize the degree of depletion of a
particular field, reserves of a particular field, the degree of difficulty of extraction and region of production and oil properties. Starting from
January 2017, additional MET withdrawals are introduced:+ RUB/tonne 306 in 2017 (RUB/tonne- 357 in 2018, RUB/tonne - 428 in 2019-
2020).

11
MET rate calculation for natural gas and gas condensate
MET rate for natural gas
In the fourth quarter of 2017 and in the third quarter of 2017 average extraction tax for natural gas was
RUB 527 and RUB 524 per th. cubic meters, respectively. In the twelve months of 2017 and 2016 average extraction
tax for natural gas was RUB 521 per th. cubic meters and RUB 535 per th. cubic meters, respectively.
MET rate for gas condensate
The production of gas condensate is mainly subject to MET rate for crude oil because the purification of gas
condensate is compounded in the crude oil production. Mineral extraction gas condensate tax rate is applied in separate
purification of gas condensate.
Significant volume of gas condensate produced at Rospan fields is subject to mineral extraction gas
condensate tax rate, which amounted to RUB 4,051 and RUB 3,834 per tonne in the fourth quarter of 2017 and in the
third quarter of 2017, respectively. In the twelve months of 2017 and 2016 tax rate of mineral extraction gas
condensate was RUB 3,747 per tonne and RUB 3,026 per tonne, respectively.
In accordance with Tax Code of Russian Federation since July 1, 2014, a calculation formula is determined
for MET rate for natural gas and gas condensate. In line with this formula base rate for gas condensate is RUB 42 per
1 tonne and for natural gas – RUB 35 per 1 th. cubic metres. Base rates are multiplied by basic rate of standard fuel
unit and reduced coefficient which estimates the difficulty level of natural gas and (or) gas condensate production.
Starting from January 1, 2017 mineral extraction gas condensate tax rate is adjusted by the multiplying coefficient 6.5
(starting from January 1 until December 31, 2016 – 5.5).
Reduced coefficient in 2017 Applicable in the Company
0.5 License areas: Rospan and Russko-Rechenskoe licensed fields and also at fields of
Krasnodar and Stavropol regions
0.64 License areas: Kynsko-Chaselskoye fields and at a number of fields of
Sibneftegaz, and also at Nenets Autonomous District, the Chechen republic and
Krasnodar region
0.1 License areas: Irkutsk region, in Krasnoyarsk region and in region of Far East or
the sea of Okhotsk
0.21 License areas: Turon deposits reserves of the Kharampurskoye field
0.5-1 Fields with reserve depletion rate of over 70%.
Export Customs Duty on Crude Oil
The rate of export customs duty on crude oil is linked to the Urals price in the international market and is
denominated in USD per tonne.
The table below sets forth the calculation of the ordinary export customs duty for crude oil:
Urals price(USD per tonne) Export customs duty(USD per tonne)
Below and including 109.5 (15 USD per barrel) Export customs duty is not levied
Above 109.5 to 146 including……………………… (15 to 20 USD per barrel)
35% of the difference between the average Urals price in USD per tonne and USD 109.5
Above 146 to 182.5 including ........................................
(20 to 25 USD per barrel)
USD 12.78 plus 45% of the difference between the average Urals price in USD per tonne
and USD 146
Above 182.5 (25 USD per barrel) .................................. USD 29.2 plus 30% of the difference between the average Urals price in USD per tonne
and USD 182.5 (since January 1, 2017)
(For information: plus 42% of the difference between the average Urals price in USD per tonne was applicable since January 1 through December 31, 2016)
The export customs duty is changed every month and the duty for the next month is based on the average
Urals price denominated in USD for crude oil for the period from the 15th day of the previous month to the 14th
day (inclusive) of the current month.
The law on the introduction of a special tax regime in respect of projects on the continental shelf of the
Russian Federation provides a full exemption of hydrocarbons produced at offshore fields from the export customs
duties, which commercial production starting from January 1, 2016. Such an exemption is set for various terms
depending on complexity of a field development project.

12
In 2016, the exemption was set for the East- Messoyakh fields (zero customs duty rate could be applied to
the export of 28.9 mln tonnes) and Srednebotuobinskoe field (zero customs duty rate could be applied to the export
of 10.8 mln tonnes). Starting from 2017 the exemption was set for Kuyumbinskoe field (zero customs duty rate
could be applied to the export of 29.0 mln tonnes)1.
Export customs duty on crude oil export to countries that are members of Eurasian Economic
Agreement
In accordance with the Eurasian Economic Agreement dated May 29, 2014 and effective from
January 1, 2015 export duties are not payable on crude oil export to countries-participants of Eurasian Economic
Agreement. Meanwhile, the Eurasian Economic Agreement enables some export limits on oil and oil products.
Export duties are not payable on crude oil exports to countries that are members of Eurasian Economic
Agreement. At the same time quotes for tax-free sale of crude oil and petroleum products are set. In accordance
with agreement with Armenia and the Kirghiz republic all supplies above the quotes are subject for the duties.
In accordance with agreement between the Governments of Russian Federation and the Kazakhstan
Republic on trade and economic cooperation in crude oil and petroleum products supplies dated December 9, 2010
the export ban was set for a specified list of petroleum products exported from Russian Federation to the
Kazakhstan Republic.
Export Customs Duty on Petroleum Products
Export customs duty on petroleum products (except liquefied petroleum gas (“LPG”)) is set every month as
the marginal export customs duty rate on crude oil multiplied by the estimated ratio depending on the type of
petroleum product.
Export customs duty on LPG is based on the average price of LPG at Poland board (DAF Brest)
denominated in USD per tonne for the period from the 15th day of the previous month to the 14th day (inclusive) of
the current month.
Starting from January 1, 2015 marginal export customs duty for petroleum products is set as a percentage of
the marginal export customs duty for crude oil as listed in table below:
Type of petroleum product
Marginal export customs duty (% of the marginal
export customs duty for crude oil) for the period
January 1-
December 31, 2016 Since January 1, 2017
Light and middle distillates (excluding: naphtha and gasoline), benzene, toluene,
xylenes, lubricants, diesel 40 30
Naphtha 71 55
Gasoline 61 30
Fuel oil, bitumen oil, other dark oil products 82 100
In 2017 and 2016 calculation of the export duty rate for petroleum products is based on the above marginal
rates for each type of petroleum product.
Changes in Transport Tariffs of Pipeline and Railway Monopolies
Rosneft transports most of its crude oil and petroleum products via pipeline network owned and operated
by JSC “AK “Transneft” (“Transneft”), which is a natural state-owned pipeline monopoly. Rosneft also transports
crude oil and petroleum products via railway network mainly owned and operated by Russian railways (“RZD”),
another natural state-owned monopoly.
The FAS2 has the authority to set Transneft’s base tariffs for transportation of crude oil and petroleum
products in Russia, which include a dispatch tariff, a pumping tariff, loading, charge-discharge, transshipment and
other tariffs. Tariffs for railroad transportation are also regulated by the FAS. The tariffs are set in roubles and are
not linked to the exchange rate.
The FAS sets tariffs for each separate route of the pipeline networks depending on the length of relevant
routes, transportation direction and other factors, alternatively tariffs may be set for the entire route of the pipeline
network. Tariffs for railroad transportation often depend on the type of cargo and the transportation route.
1 East- Messoyakh and Kuyumbinskoe fields are developed by the Company within the framework of JV projects.
2The FAS - the Federal Antimonopoly Service.

13
The FAS sets tariffs for gas pipeline transportation. The tariff includes two parts. The first part of tariff is
fixed for “input and output” facilities and mostly depends on the remoteness of facilities. The second part of the
tariff depends on gas transportation by Gazprom in the gas supply system and actual distance of gas transmission in
a gas pipeline. Tariffs are set in roubles.
Recent changes of Transneft transportation tariffs
Crude oil
Starting from January 1, 2018 Transnet tariffs for oil pipeline transportation increased by 3.95%.
Starting from February 1, 2017 transit tariffs via Belarus territory increased by 7.7%.
Starting from January 1, 2017 Transnet tariffs for oil pipeline transportation increased up to 3.5%, and
4.0% indexation was applied to export tariffs for the pipeline VSTO to China and Kozmino.
Recent changes in railroad transportation tariffs
In 2018 tariffs for petroleum products transportation are supposed to grow up by 5.4% to December 2017
level.
Starting from February 1, 2017 there was a standardization of transportation of petroleum products tariff
with decreasing coefficient setting within price limits.
Starting January 1, 2017 railroad transportation tariffs increased by 4.0%. Multiplying factor of 1.134 on
tariffs was no longer applied to the export transportation of petroleum products. In January 2017 there was
additional indexation to the tariff of December 2016 by 2%.
The Rosneft’s average transportation tariffs in rouble terms applied to major transportation routes in the
fourth and the third quarters of 2017 excluding transshipment are presented in the Appendix 2.

14
Business Segments and Intersegment sales
Most of all of Rosneft’s operations and assets are located in the Russian Federation. As geographical regions
of the Russian Federation have similar economic and legal characteristics, Rosneft does not present geographical
segments separately. Rosneft also carries out projects outside Russia, including exploration and production projects in
Norway, United Arab Emirates, Brazil, Vietnam, Venezuela and the USA and also stakes in refineries in Germany and
Belarus.
Operating Segments
As at the reporting date the activities of Rosneft are divided into two main operating segments, based on the
nature of their operations:
● Exploration and production (Upstream). Geological exploration and development of fields and crude oil
and gas production both on the onshore and offshore in the territory of Russia and abroad and internal
oilfield service companies;
● Refining and distribution (Downstream). Refining of crude oil, as well as the purchase, transportation, sale
of crude oil and petroleum products to the third parties in Russia and abroad;
● Other activities form the “Corporate” segment and include banking, financial services and other corporate
services.
Intersegment Sales
Rosneft’s two main business segments are interconnected: the majority of the revenues of one main segment
is included in the expenses of the other main segment. In particular, Upstream Group companies produce
hydrocarbons and gas, Downstream Group companies acquire hydrocarbons and gas from Upstream Group companies
and sell part of crude oil on the domestic market or outside of Russia, and processes the remaining part at own
refineries or at the refineries of affiliates and third parties. Refined petroleum products are then either sold by the
Company through wholesale in the international or domestic markets or sold to the Company’s sale subsidiaries for
subsequent distribution in Russia.
Intercompany sales present operational activity of segments as if the segments operate separately from each
other within the vertically integrated company using transfer prices for settlements between segments. For the
estimation of upstream revenues within vertically integrated company the price of Upstream (and the purchase price of
Downstream) was recalculated using the export market price minus transportation cost, minus export duty, dispatches
and other expenses relating to current sales. The price is established at oil gathering facility (point of sales) or
connection point to Gasprom transportation system where Upstream dispatches the oil and gas to Downstream. All
intercompany operations, including transactions from internal oilfield service companies and corporate service
companies, are eliminated on the consolidation level.

15
Financial performance for the three months ended December 31, 2017 and September 30, 2017
and for the twelve months ended December 31, 2017 and 2016 (Consolidated statement of profit
or loss)
in RUB billions
For 3 months ended
%
change
For 12 months
ended December 31, %
change
December 31,
2017
September 30,
2017 2017 2016
Revenues and equity share in profits of
associates and joint ventures
Oil, gas, petroleum products and
petrochemicals sales 1,665 1 461 14.0% 5,877 4,887 20.3%
Support services and other revenues 21 20 5.0% 77 75 2.7%
Equity share in profits of associates and joint
ventures 23 15 53.3% 60 26 >100%
Total revenues and equity share in profits of
associates and joint ventures 1,709 1,496 14.2% 6,014 4,988 20.6%
Costs and expenses
Production and operating expenses 160 150 6.7% 607 559 8.6%
Cost of purchased oil, gas, petroleum products
and refining costs 257 213 20.7% 837 614 36.3%
General and administrative expenses 57 41 39.0% 172 129 33.3%
Pipeline tariffs and transportation costs 152 146 4.1% 596 575 3.7%
Exploration expenses 6 4 50.0% 15 14 7.1%
Depreciation, depletion and amortization 146 144 1.4% 586 489 19.8%
Taxes other than income tax 550 470 17.0% 1,919 1,296 48.1%
Export customs duty 182 150 21.3% 658 657 0.2%
Total costs and expenses 1,510 1,318 14.6% 5,390 4,333 24.4%
Operating income 199 178 11.8% 624 655 (4.7)%
Finance income 27 24 12.5% 107 91 17.6%
Finance expenses (57) (56) 1.8% (225) (193) 16.6%
Other income 105 3 >100% 109 49 >100%
Other expenses (32) (25) 28.0% (77) (79) (2.5)%
Foreign exchange differences (6) (1) >100% 3 (70) >100%
Cash flow hedges reclassified to profit or loss (37) (36) 2.8% (146) (147) (0.7)%
Income before income tax 199 87 >100% 395 306 29.1%
Income tax expense (54) (27) >100% (98) (114) (14.0)%
Net income 145 60 >100% 297 192 54.7%
Net income attributable to
- Rosneft shareholders 100 47 >100% 222 174 27.6%
- non-controlling interests 45 13 >100% 75 18 >100%

16
Upstream Operating Results
The segment includes Rosneft Group companies that provide operating services, the independent enterprises
that produce oil, gas and gas condensate in Russia and abroad, the joint ventures and exploration units in Russia and
abroad, oil service companies. The segment includes revenues generated by the transfer of oil, gas and NGL to the
Downstream segment for subsequent sales to third parties and all operating costs associated with production and
exploration, and also revenues and costs of oil service companies that provide services to the Group companies.
The results are set in the table below:
For 3 months ended
%
change
For 12 months
ended December 31, %
change
December 31,
2017
September 30,
2017 2017 2016
Operational results
Hydrocarbon production (th. boe per day) 5,713 5,674 0.7% 5,718 5,369 6.5%
Crude oil and NGL production (th. barrels per day) 4,551 4,571 (0.4)% 4,577 4,252 7.6%
Gas production (th. boe per day) 1,162 1,103 5.3% 1,141 1,117 2.1%
Hydrocarbon production (mln boe)1 489.3 483.8 1.1% 1,938.0 1,822.3 6.3%
Financial results, RUB billions
EBITDA 384 330 16.4% 1,297 1,172 10.7%
Capital expenditures2 249 193 29.0% 798 608 31.3%
Upstream operating expenses 97.2 91.5 6.2% 359.0 302.9 18.5%
Indicators per boe
EBITDA, RUB/boe 785 682 15.1% 669 643 4.0%
Capital expenditures, RUB/boe 509 399 27.6% 412 334 23.4%
Upstream operating expenses, RUB/boe4 199 189 5.3% 185 166 11.4%
Upstream operating expenses, USD/boe3,4 3.4 3.2 6.3% 3.2 2.5 28.0% 1 Excluding share in production of associates and joint ventures. 2 Ref. to “Capital expenditures”. 3Calculated using monthly RUB/USD exchange rates for the reporting periods. 4 Excluding the acquisition of Bashneft assets, upstream operating expenses were 177 RUB/boe (3.0 USD/boe) in the twelve months of 2017 and 163 RUB/boe (2.5 USD/boe ) in the twelve months of 2016.
Upstream EBITDA
For 3 months ended
%
change
For 12 months ended
December 31, %
change
December 31,
2017
September 30,
2017 2017 20161
Revenues and equity share in profits of
associates and joint ventures 938 785 19.5% 3,180 2,542 25.1% Including equity share in profits of associates and
joint ventures 15 10 50.0% 42 17 >100%
Expenses net of depreciation 602 504 19.4% 2,076 1,504 38.0%
including
Upstream operating expenses2 97 92 6.2% 359 303 18.5%
General and administrative expenses 16 14 14.3% 57 54 5.6%
Hydrocarbon procurement costs3 9 5 80.0% 35 25 40.0% Pipeline tariffs and transportation costs and other
costs4 6 6 – 32 35 (8.6)%
Exploration expenses 8 5 60.0% 19 14 35.7%
Taxes other than income tax 466 382 22.0% 1,574 1,073 46.7%
Effect of prepayments offsetting 48 49 (2.0)% 193 134 44.0%
EBITDA 384 330 16.4% 1,297 1,172 10.7% 1Effect of acquisition of Bashneft of RUB 26 billion is included in items of revenues and expenses in 2016. 2Percentage is calculated from unrounded data. 3See section “Cost of Purchased Oil, Gas and Petroleum Products and Refining Costs and others”. Since September 2016 main procurement costs and
related transportation expenses were transferred to the Downstream segment. Starting from January 2017 the procurement costs also include crude oil purchases for processing of Bashneft-Polyus. 4Other costs include revision of ecological reserves of RUB 0.1 billion and RUB 0.6 billion in the fourth and in the third quarters of 2017; and
RUB 1.8 billion and RUB 5.4 billion in the twelve months of 2017 and 2016, respectively.

17
Operating indicators
Production of Crude Oil and NGL
Rosneft has main fully consolidated production and development enterprises, which produce crude oil in
Western Siberia, Eastern Siberia, Timan Pechora, Central Russia, Southern part of European Russia and the Russian
Far East. The Company also has a 20% stake in the Sakhalin-1 project and a 50% stake in JSC “Tomskneft” VNK,
both accounted for using proportionate consolidation method. In addition, Rosneft participates in major production
joint ventures accounted for using the equity method: Slavneft – 49.94%, Udmurtneft – 49.57% and
Messoyakhaneftegaz – 50.0%. The Company also participates in international projects in Vietnam, Venezuela and
Egypt. In October 2016 the Company acquired production assets of Bashneft. In April 2017 the Company acquired
100% shares in LLC National Petroleum Company – Projects.
The following table sets forth Rosneft’s crude oil and NGL production:
For 3 months ended %
change
For 12 months
ended December 31, %
change
December 31,
2017
September 30,
2017 2017 2016
(million of barrels) (million of barrels)
RN-Yuganskneftegaz (Western Siberia) 129.5 127.5 1.6% 492.6 471.4 4.5%
Projects of the Vankor group (Eastern Siberia) 39.0 40.6 (3.9)% 163.7 164.0 (0.2)%
Samotlorneftegaz (Western Siberia) 36.9 36.5 1.1% 144.5 148.4 (2.6)%
Bashneft-Dobycha (Central Russia) 30.7 30.7 – 122.7 31.41 >100%
Orenburgneft (Central Russia) 28.9 28.7 0.7% 116.3 122.9 (5.4)%
Samaraneftegaz (Central Russia) 23.6 23.3 1.3% 93.7 92.7 1.1%
RN-Uvatneftegaz (Western Siberia) 15.8 16.7 (5.4)% 71.3 86.0 (17.1)%
Verkhnechonskneftegaz (Eastern Siberia) 15.6 15.2 2.6% 61.3 64.4 (4.8)%
Varyeganneftegaz (Western Siberia) 11.0 11.9 (7.6)% 46.1 45.9 0.4%
RN-Nyaganneftegaz (Western Siberia) 10.7 11.5 (7.0)% 44.4 43.8 1.4%
RN-Purneftegaz (Western Siberia) 9.9 10.0 (1.0)% 38.8 39.3 (1.3)%
Tomskneft (Western Siberia) 8.3 8.8 (5.7)% 34.6 36.1 (4.2)%
RN-Severnaya Neft (Timan Pechora) 5.5 6.2 (11.3)% 24.0 24.9 (3.6)%
Offshore projects (Far East)2 4.9 4.5 8.9% 22.0 28.7 (23.3)%
Sorovskneft (Western Siberia) 3.1 3.7 (16.2)% 15.2 4.41 >100%
Bashneft-Polyus (Timan Pechora)3 2.0 3.1 (35.5)% 14.7 4.5
1 >100%
Taas-Yuryah (Far East) 2.8 2.2 27.3% 9.2 8.1 13.6%
Vostsibneftegaz (Eastern Siberia) 3.4 0.9 >100% 5.5 0.8 >100%
Kondaneft (Western Siberia) 1.6 0.1 >100% 1.7 – –
Other 8.5 9.3 (8.6)% 35.9 36.3 (1.1)%
Crude oil and NGL production by fully
and proportionately consolidated enterprises 391.7 391.4 0.1% 1,558.2 1,454.0 7.2%
Slavneft (Western and Eastern Siberia) 12.6 13.5 (6.7)% 52.9 55.5 (4.7)%
Udmurtneft (Central Russia) 5.6 5.7 (1.8)% 22.4 23.2 (3.4)%
Messoyakhaneftegaz (Western Siberia) 3.4 3.1 9.7% 11.7 2.6 >100%
Other 5.4 6.8 (20.6)% 25.3 21.1 19.9%
Total share in production of associates and JV 27.0 29.1 (7.2)% 112.3 102.4 9.7%
Total crude oil and NGL production 418.7 420.5 (0.4)% 1,670.5 1,556.4 7.3%
Daily crude oil and NGL production
(th. barrels per day) 4,551 4,571 (0.4)% 4,577 4,252 7.6% 1Production from the acquisition date 2Net of royalty and government share. 3Refers to 100% consolidated share in production.
In the fourth quarter of 2017 oil and NGL production amounted to 418.7 mln barrels (0.4% decrease in
comparison with the third quarter of 2017). The Company fulfills its obligations under the Agreement reached earlier
on reduction of world crude oil production by OPEC+.
In the twelve months of 2017 crude oil and NGL production increased by 7.3% compared with the twelve
months of 2016. Significant increase in production resulted from the acquisition of Bashneft assets in the fourth
quarter of 2016, the intensification of production at Brownfields and the active development of new projects, and from
increased share in JV Petromonagas (Venezuela) since May 2016.
The main factors of organic growth of oil and NGL production include: the growth of production at
RN-Yuganskneftegaz driven by high rates of production drilling with implementation of modern technologies for
research and completion of wells, development of the new key projects such as Suzun, Yurubcheno-Tokhomskoe and
East Messoyakh fields, and the increase in production at a number of Brownfields including RN-Nyaganneftegaz,
Varyeganneftegaz, Samaraneftegaz due to increased drilling activity and geological and technical measures.

18
In twelve months of 2017 the Company increased its development drilling by 29.5% up to 12 mln meters
compared with the twelve months of 2016. Horizontal wells share increased up to 36%, the number of new horizontal
wells with multi-stage hydraulic fracturing increased by 67%. The share of in-house drilling services in the total
meterage drilled is app. 60%.
Production of Gas
The table below sets forth Rosneft’s used gas1 production:
For 3 months ended
%
change
For 12 months
ended December 31, %
change
December 31,
2017
September 30,
2017 2017 2016
bcm bcm Sibneftegas(Western Siberia) 3.19 3.16 0.9% 12.58 12.14 3.6%
Projects of the Vankor group (Eastern Siberia)2 2.08 2.00 4.0% 8.37 8.70 (3.8)%
Rospan International (Western Siberia) 1.65 1.65 – 6.45 6.22 3.7% RN-Purneftegaz (Western Siberia)2 1.53 1.53 – 6.07 6.11 (0.7)%
Samotlorneftegaz (Western Siberia) 1.52 1.34 13.4% 5.82 5.94 (2.0)%
RN-Yuganskneftegaz (Western Siberia) 1.25 1.24 0.8% 4.64 4.60 0.9%
Offshore projects (Far East)2,3 1.20 0.79 51.9% 4.13 2.82 46.5%
Varyeganneftegaz (Western Siberia) 1.05 1.00 5.0% 3.97 3.40 16.8% RN-Krasnodarneftegaz (Southern Russia) 0.56 0.56 – 2.47 2.91 (15.1)%
RN-Nyaganneftegaz (Western Siberia) 0.43 0.48 (10.4)% 1.79 1.59 12.6%
Orenburgneft (Central Russia) 0.42 0.40 5.0% 1.74 2.32 (25.0)% Tomskneft (Western Siberia) 0.25 0.24 4.2% 0.94 0.90 4.4%
Bashneft-Dobycha (Central Russia)2 0.14 0.13 7.7% 0.53 0.134 >100%
Samaraneftegaz (Central Russia) 0.14 0.11 27.3% 0.47 0.48 (2.1)% RN-Sakhalinmorneftegaz (Far East) 0.10 0.09 11.1% 0.35 0.33 6.1%
RN-Uvatneftegaz (Western Siberia) 0.06 0.06 – 0.24 0.25 (4.0)%
Verkhnechonskneftegaz (Eastern Siberia) 0.06 0.06 – 0.23 0.19 21.1% RN-Severnaya Neft (Timan Pechora) 0.05 0.05 – 0.21 0.23 (8.7)%
Sorovskneft (Western Siberia) 0.03 0.02 50.0% 0.11 0.034 >100%
Bashneft-Polyus (Timan Pechora) 5 0.01 0.02 (50.0)% 0.06 0.024 >100% Other 0.31 0.24 29.2% 1.20 1.17 2.6%
Total gas production by fully and
proportionately consolidated enterprises 16.03 15.17 5.7% 62.37 60.48 3.1%
Purgaz (Western Siberia) 1.34 1.30 3.1% 5.30 5.75 (7.8)% Slavneft (Western and Eastern Siberia) 0.11 0.11 – 0.45 0.47 (4.3)%
Other 0.07 0.08 (12.5)% 0.29 0.40 (27.5)%
Total share in production of associates and
JV 1.52 1.49 2.0% 6.04 6.62 (8.8)%
Total gas production 17.55 16.66 5.3% 68.41 67.10 2.0%
Natural gas 7.95 7.86 1.1% 31.58 30.99 1.9%
Associated gas 9.60 8.80 9.1% 36.83 36.11 2.0%
Daily gas production (mcm per day) 190.8 181.1 5.4% 187.4 183.3 2.2% 1Production volume equals extracted volume minus flared volume and gas used for NGL production. 2 Including gas injection to maintain reservoir pressure. 3 Net of royalty and government share. 4Production from the acquisition date in 2016. 5Refers to 100% consolidated share in production.
Gas production in the fourth quarter of 2017 amounted to 17.55 bcm, higher by 5.3% compared with the third
quarter of 2017. The production growth was mainly due to scheduled preventive maintenance at onshore oil treatment
facility of Chaivo, maintenance of gas-compression station at Tyumen and Sibur gas processing facility in the third
quarter of 2017.
Gas production in the twelve months of 2017 amounted to 68.41 bcm, increasing by 2.0% compared with the
twelve months of 2016. The growth was mainly driven by the acquisition of Bashneft assets in the fourth quarter of
2016, the launch of new wells at Varyeganneftegaz in 2017 and increased gas delivery through the Tyumen
compressor station after reconstruction, launch of new wells and optimisation of operating wells at Sibneftegaz.
The level of utilization of associated petroleum gas in the twelve months of 2017 was 89.2%.
Financial indicators
Equity share in financial results of upstream associates and joint ventures
The equity share in financial results of upstream associates and joint ventures was RUB 15 billion in the
fourth quarter of 2017 due to positive dynamics of profits of JV projects. In the third quarter of 2017, the equity share
in the financial results of upstream associates and joint ventures was RUB 10 billion of profit.
19
The equity share in the financial results of upstream associates and joint ventures was RUB 42 billion and
RUB 17 billion of profit in the twelve months of 2017 and 2016, respectively. Income growth is mainly due to
increased income of Messoyakhneftegaz after the launch of the East−Messoyakh field in September 2016, also income
from the international projects.
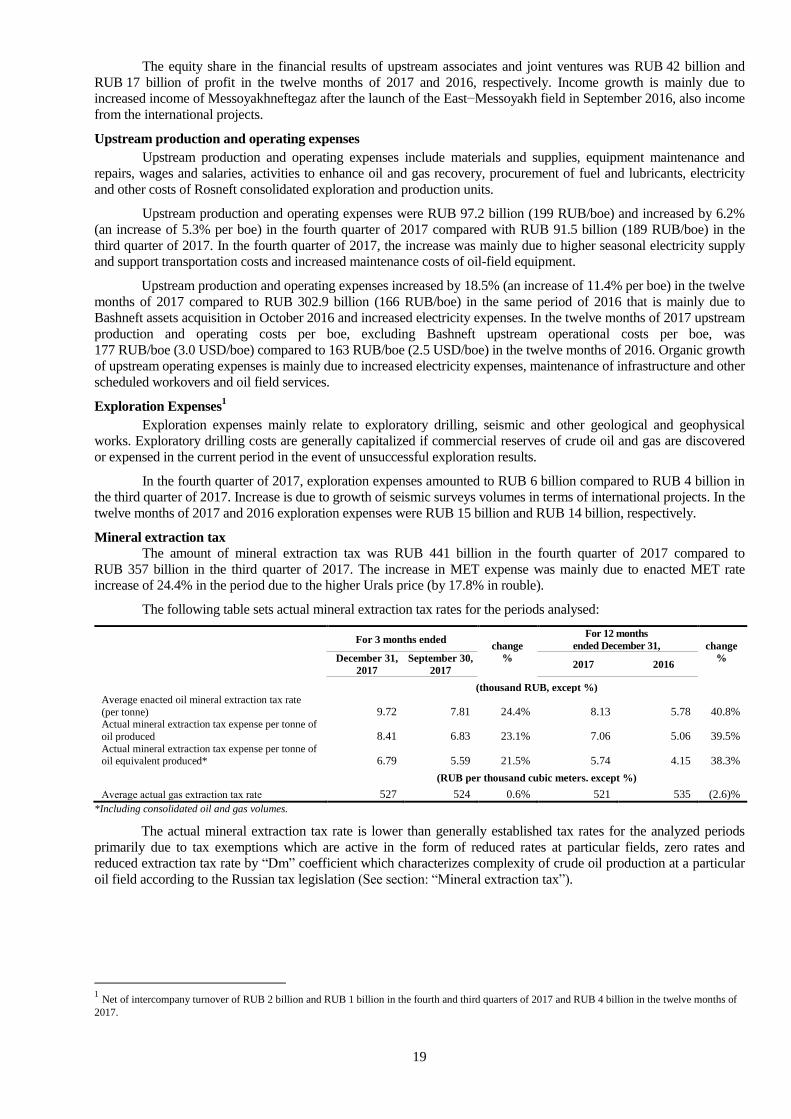
Upstream production and operating expenses
Upstream production and operating expenses include materials and supplies, equipment maintenance and
repairs, wages and salaries, activities to enhance oil and gas recovery, procurement of fuel and lubricants, electricity
and other costs of Rosneft consolidated exploration and production units.
Upstream production and operating expenses were RUB 97.2 billion (199 RUB/boe) and increased by 6.2%
(an increase of 5.3% per boe) in the fourth quarter of 2017 compared with RUB 91.5 billion (189 RUB/boe) in the
third quarter of 2017. In the fourth quarter of 2017, the increase was mainly due to higher seasonal electricity supply
and support transportation costs and increased maintenance costs of oil-field equipment.
Upstream production and operating expenses increased by 18.5% (an increase of 11.4% per boe) in the twelve
months of 2017 compared to RUB 302.9 billion (166 RUB/boe) in the same period of 2016 that is mainly due to
Bashneft assets acquisition in October 2016 and increased electricity expenses. In the twelve months of 2017 upstream
production and operating costs per boe, excluding Bashneft upstream operational costs per boe, was
177 RUB/boe (3.0 USD/boe) compared to 163 RUB/boe (2.5 USD/boe) in the twelve months of 2016. Organic growth
of upstream operating expenses is mainly due to increased electricity expenses, maintenance of infrastructure and other
scheduled workovers and oil field services.
Exploration Expenses1
Exploration expenses mainly relate to exploratory drilling, seismic and other geological and geophysical
works. Exploratory drilling costs are generally capitalized if commercial reserves of crude oil and gas are discovered
or expensed in the current period in the event of unsuccessful exploration results.
In the fourth quarter of 2017, exploration expenses amounted to RUB 6 billion compared to RUB 4 billion in
the third quarter of 2017. Increase is due to growth of seismic surveys volumes in terms of international projects. In the
twelve months of 2017 and 2016 exploration expenses were RUB 15 billion and RUB 14 billion, respectively.
Mineral extraction tax
The amount of mineral extraction tax was RUB 441 billion in the fourth quarter of 2017 compared to
RUB 357 billion in the third quarter of 2017. The increase in MET expense was mainly due to enacted MET rate
increase of 24.4% in the period due to the higher Urals price (by 17.8% in rouble).
The following table sets actual mineral extraction tax rates for the periods analysed:
For 3 months ended
change
%
For 12 months
ended December 31, change
% December 31,
2017
September 30,
2017 2017 2016
(thousand RUB, except %)
Average enacted oil mineral extraction tax rate
(per tonne) 9.72 7.81 24.4% 8.13 5.78 40.8% Actual mineral extraction tax expense per tonne of
oil produced 8.41 6.83 23.1% 7.06 5.06 39.5% Actual mineral extraction tax expense per tonne of oil equivalent produced* 6.79 5.59 21.5% 5.74 4.15 38.3%
(RUB per thousand cubic meters. except %)
Аverage actual gas extraction tax rate 527 524 0.6% 521 535 (2.6)%
*Including consolidated oil and gas volumes.
The actual mineral extraction tax rate is lower than generally established tax rates for the analyzed periods
primarily due to tax exemptions which are active in the form of reduced rates at particular fields, zero rates and
reduced extraction tax rate by “Dm” coefficient which characterizes complexity of crude oil production at a particular
oil field according to the Russian tax legislation (See section: “Mineral extraction tax”).
1 Net of intercompany turnover of RUB 2 billion and RUB 1 billion in the fourth and third quarters of 2017 and RUB 4 billion in the twelve months of
2017.

20
Downstream Operating Results
The segment includes Group companies that provide services for oil and gas processing, petrochemical
production in Russia and abroad, joint ventures, sales units of oil, gas and petroleum products to counterparties in
Russia and abroad. The segment includes revenue generated from the sale of oil, gas, petrochemical products and
petroleum products to third parties, and all operating costs associated with processing, trading and logistics.
The results set in the table below:
For 3 months ended
%
change
For 12 months
ended December 31,
%
change
December, 31
2017
September 30,
2017 2017 2016
Operational results, mln tonne
Crude oil processing at refineries 28.47 28.31 0.6% 112.80 100.26 12.5%
Processing at Company’s own refineries in Russia 23.33 22.96 1.6% 92.61 79.95 15.8%
Processing at Company’s own refineries outside Russia 3.02 3.15 (4.1)% 12.00 12.72 (5.7)%
Processing at Associates’ refineries 2.12 2.20 (3.6)% 8.19 7.59 7.9%
Financial results, RUB billion
EBITDA 37 57 (35.1)% 180 150 20.0%
Capital expenditures of refineries1 21 18 16.7% 65 65 −
Operating expenses of processing in Russia 36.6 33.1 10.6% 129.1 88.3 46.2%
Operating expenses of processing outside Russia 8.3 5.0 66.0% 22.6 31.4 (28.0)%
Indicators per tonne of the output, RUB per tonne 2
EBITDA, 1,404 2,183 (35.7)% 1,721 1,619 6.3%
Capital expenditure of refineries 911 575 58.4% 621 701 (11.4)%
Operating expenses for processing in Russia 1,569 1,442 8.8% 1,394 1,105 26.2%
Operating expenses for processing outside Russia3 1,689
3 1,587 6.4% 1,883 2,469 (23.7)%
1Refer to “Capital expenditures”. 2Calculated from unrounded data. 3Excluding the expenses of the previous quarters of 2017 recognized in the fourth quarter of 2017 and the pre-turnaround costs related to the
turnarounds scheduled for February 2018 at a number of refineries outside Russia.
Downstream EBITDA
For 3 months ended
%
сhange
For 12 months
ended December 31, %
сhange
December 31,
2017
September 30,
2017 2017 20161
RUB billion RUB billion
Revenues and equity share in profits
of associates and joint ventures 1,722 1,522 13.1% 6,099 5,012 21.7%
Including equity share in profits of associates
and joint ventures 7 5 40.0% 16 8 100.0%
Expenses net of depreciation 1,685 1,465 15.0% 5,919 4,862 21.7%
including
Operating expenses at refineries, cost of additives
and materials procured for processing 51 46 10.9% 176 163 8.0%
Operating expenses of retail companies 13 13 − 50 45 11.1%
Cost of purchased oil, gas, petroleum products
and refining costs including intersegment
turnover 1,209 1,021 18.4% 4,080 3,173 28.6%
Administrative expenses including doubtful debt
allowances 12 9 33.3% 39 36 8.3%
Pipeline tariffs and transportation costs and other
costs 147 145 1.4% 587 560 4.8%
Taxes other than income tax 92 96 (4.2)% 360 222 62.2%
Export customs duty 182 150 21.3% 658 657 0.2%
Effect of intragroup oil products inventory and
others (12) 1 − (11) 12 −
EBITDA 28 41 (31.7)% 160 144 11.1% Effect of intragroup crude oil inventory
(income)/expense (9) (16) (43.8)% (20) (6) >100%
EBITDA adjusted 2 37 57 (35.1)% 180 150 20.0%
1 Effect of the acquisition of Bashneft of RUB 2 billion is included in revenues and expenses in 2016. 2Adjusted for the effect from intragroup crude oil inventory

21
Operating indicators
Petroleum Product Output
Rosneft processes produced and procured crude oil at its refineries: the Tuapse refinery on the Black Sea coast
in the South of Russia, the Komsomolsk refinery in the Russian Far East, the Achinsk and Angarsk refineries in
Eastern Siberia, the Kuibyshevsk, Novokuibyshevsk and Syzran refineries in the Samara region, the Saratov and
Ryazan refineries (the European part of Russia) and others. Rosneft also processes crude oil in Belarus and in
Germany. At the end of December 2016 the Company completed the restructuring of foreign refining assets of
Ruhr Oel GmbH in Germany and increased its share in the Bayernoil refinery up to 25% (from 12.5%), in the
Mineraloelraffinerie Oberrhein GmbH – up to 24% (from 12%), and the PCK Raffinerie GmbH up to 54.17% (from
35.42%), including additional share, which was acquired earlier in 2015. Starting from October 2016 crude oil
processing at Bashneft refineries is incorporated in the oil processing of Rosneft group.
The following table sets forth Rosneft’s crude oil processing and petroleum product output volumes:
For 3 months ended
%
change
For 12 months
ended December 31, %
change
December 31,
2017
September 30,
2017 2017 2016
mln of tonnes mln of tonnes
Crude oil processing at refineries in Russia* 25.36 25.03 1.3% 100.55 87.47** 15.0% Crude oil processing at refineries outside Russia 3.11 3.28 (5.2)% 12.25 12.79 (4.2)%
including crude oil processing in German*** 3.02 3.15 (4.1)% 12.00 12.72 (5.7)%
including crude oil processing in Belarus 0.09 0.13 (30.8)% 0.25 0.07 >100%
Total Group crude oil processing 28.47 28.31 0.6% 112.80 100.26 12.5%
Petroleum product output: High octane gasoline 3.85 3.86 (0.3)% 15.18 12.49 21.5%
Low octane gasoline 0.02 0.03 (33.3)% 0.11 0.14 (21.4)%
Naphtha 1.64 1.49 10.1% 6.22 5.97 4.2% Diesel 8.30 8.19 1.3% 33.01 27.51 20.0%
Fuel oil 5.76 5.29 8.9% 23.04 22.65 1.7%
Jet fuel 0.83 0.90 (7.8)% 3.31 3.06 8.2% Petrochemicals 0.38 0.34 11.8% 1.52 0.90 68.9%
Other 3.58 3.98 (10.1)% 14.51 12.03 20.6%
Product output at Rosneft’s refineries in Russia 24.36 24.08 1.2% 96.90 84.75 14.3% Product output at refineries outside Russia 3.08 3.24 (4.9)% 12.18 13.46 (9.5)% including crude oil output in Germany 2.99 3.13 (4.5)% 11.95 13.40 (10.8)%
including product output in Belarus 0.09 0.11 (18.2)% 0.23 0.06 >100%
Total Group product output 27.44 27.32 0.4% 109.08 98.21 11.1% *Including processing at YANOS refinery. ** Including the Bashneft assets acquisition effect of 4.82 mln tonnes in 2016. ***Excluding additives obtained for processing
In the fourth quarter of 2017 Rosneft’s total refinery throughput in Russia increased by 1.3% and amounted to
25.36 mln tonnes. The increase in production at Russian refineries compared to the third quarter of 2017 was mainly
due to the growth of utilization rate at refineries in terms of current demand.
In the twelve months of 2017 crude oil processing volume at refineries in Russia was higher by 15.0% if
compared with the same period of 2016, which is mainly attributable to the acquisition of Bashneft assets in the fourth
quarter of 2016.
In the fourth quarter of 2017, processing at the refineries in Germany decreased by 4.1% in comparison with
the third quarter of 2017 that is mainly driven by processing growth in the third quarter of 2017 in terms of positive
macroeconomic environment and due to scheduled seasonal turnarounds.

22
Financial indicators
Revenues and equity share in profits of associates and joint ventures*
In the fourth quarter of 2018 revenues and equity share in profits of associates and joint ventures amounted to
RUB 1,709 billion in comparison with RUB 1,496 billion in the third quarter of 2017. Increase in revenues in
RUB terms is mainly due to raising of worldwide crude oil price (17.8% in RUB terms compared to the third quarter
of 2017).
In the twelve months of 2017 and 2016 revenues and equity share in profits of associates and joint ventures
amounted to RUB 6,014 billion and RUB 4,988 billion, respectively.
The table below presents revenues from sales of crude oil, gas, petroleum and petrochemical products and
other revenues in billions of RUB**
:
For 3 months ended
%
change
For 12 months ended December 31,
%
change
December 31,
2017
September 30,
2017 2017 2016
% of
revenue
% of
revenue
% of
revenue
% of
revenue
RUB billion, except %
Crude oil
International Sales to non-CIS 668 39.0% 560 37.5% 19.3% 2,279 37.9% 1,977 39.6% 15.3%
Europe and other directions 383 22.3% 335 22.5% 14.3% 1,324 22.0% 1,128 22.6% 17.4%
Asia 285 16.7% 225 15.0% 26.7% 955 15.9% 849 17.0% 12.5%
International sales to CIS 42 2.5% 35 2.3% 20.0% 145 2.4% 118 2.4% 22.9%
Domestic sales 39 2.3% 31 2.1% 25.8% 116 1.9% 82 1.6% 41.5%
Total crude oil 749 43.8% 626 41.9% 19.6% 2,540 42.2% 2,177 43.6% 16.7%
Gas 61 3.6% 48 3.2% 27.1% 215 3.6% 214 4.3% 0.5%
Petroleum products
International Sales to non-CIS 444 26.0% 380 25.4% 16.8% 1,626 27.1% 1,309 26.3% 24.2%
Europe and other directions 338 19.8% 276 18.4% 22.5% 1,210 20.2% 984 19.8% 23.0%
Asia 106 6.2% 104 7.0% 1.9% 416 6.9% 325 6.5% 28.0%
International Sales to CIS 39 2.3% 35 2.3% 11.4% 117 1.9% 65 1.3% 80.0%
Domestic sales 330 19.3% 330 22.1% 0.0% 1,226 20.4% 963 19.3% 27.3%
Wholesale 204 11.9% 204 13.7% 0.0% 751 12.5% 545 10.9% 37.8%
Retail 126 7.4% 126 8.4% 0.0% 475 7.9% 418 8.4% 13.6%
Sales of bunker fuel to end-users 17 1.0% 15 1.0% 13.3% 57 0.9% 36 0.7% 58.3%
Total petroleum products 830 48.6% 760 50.8% 9.2% 3,026 50.3% 2,373 47.6% 27.5%
Sales of LNG 1 0.1% 8 0.5% (87.5)% 12 0.2% 3 0.1% >100%
Petrochemical products 24 1.4% 19 1.3% 26.3% 84 1.4% 120 2.4% (30.0)%
International sales 9 0.5% 7 0.5% 28.6% 31 0.5% 96 1.9% (67.7)%
Domestic sales 15 0.9% 12 0.8% 25.0% 53 0.9% 24 0.5% >100%
Sales of petroleum products,
petrochemicals and LNG 855 50.1% 787 52.6% 8.6% 3,122 51.9% 2,496 50.1% 25.1%
Support services and other
revenues 21 1.2% 20 1.3% 5.0% 77 1.3% 75 1.5% 2.7%
Equity share in profits of associates
and joint ventures 23 1.3% 15 1.0% 53.3% 60 1.0% 26 0.5% >100%
Total revenues and equity share in
profits of associates and joint
ventures 1,709 100.0% 1,496 100.0% 14.2% 6,014 100.0% 4,988 100.0% 20.6%
* Under IFRS consolidated financial statements. **The difference between percentages presented in the above table and other section is a result of rounding.

23
Sales Volumes
The table below analyses crude oil, gas, petroleum and petrochemical product sales volumes:
For 3 months ended
%
change
For 12 months
ended December 31,
%
change
December 31,
2017
September 30,
2017 2017 2016
mln
bbl
% of
total
volume
mln
bbl
% of
total
volume
mln
bbl
% of
total
volume
mln
bbl
% of
total
volume
Crude oil
International Sales to non-CIS 214.0 47.0% 214.6 47.3% (0.3)% 839.6 46.9% 791.5 47.9% 6.1%
Europe and other directions 121.4 26.6% 127.3 28.1% (4.6)% 486.4 27.2% 472.4 28.5% 3.0%
Asia 92.6 20.4% 87.3 19.2% 6.1% 353.2 19.7% 319.1 19.4% 10.7%
International Sales to CIS 15.6 3.4% 14.8 3.3% 5.4% 62.2 3.5% 59.2 3.6% 5.1%
Domestic 14.8 3.3% 14.1 3.1% 5.0% 51.1 2.9% 42.2 2.6% 21.1%
Total crude oil 244.4 53.7% 243.5 53.7% 0.4% 952.9 53.3% 892.9 54.1% 6.7%
Crude oil
mln
tonnes
mln
tonnes
mln
tonnes
mln
tonnes
International Sales to non-CIS 28.9 47.0% 29.0 47.3% (0.3)% 113.4 46.9% 106.9 47.9% 6.1%
Europe and other directions 16.4 26.6% 17.2 28.1% (4.6)% 65.7 27.2% 63.8 28.5% 3.0%
Asia 12.5 20.4% 11.8 19.2% 6.1% 47.7 19.7% 43.1 19.4% 10.7%
International Sales to CIS 2.1 3.4% 2.0 3.3% 5.4% 8.4 3.5% 8.0 3.6% 5.1%
Domestic sales 2.0 3.3% 1.9 3.1% 5.0% 6.9 2.9% 5.7 2.6% 21.1%
Total crude oil 33.0 53.7% 32.9 53.7% 0.4% 128.7 53.3% 120.6 54.1% 6.7%
Petroleum products
International Sales to non-CIS 15.6 25.5% 14.8 24.2% 5.4% 63.7 26.3% 61.1 27.4% 4.3%
Europe and other directions 11.8 19.3% 10.2 16.7% 15.7% 46.0 19.0% 45.9 20.6% 0.2%
Asia 3.8 6.2% 4.6 7.5% (17.4)% 17.7 7.3% 15.2 6.8% 16.4%
International Sales to CIS 1.3 2.1% 1.4 2.3% (7.1)% 4.4 1.8% 2.6 1.2% 69.2%
Domestic sales 10.0 16.3% 10.2 16.6% (2.0)% 38.7 16.0% 32.8 14.7% 18.0%
Wholesale 6.9 11.3% 7.2 11.7% (4.2)% 27.0 11.2% 21.9 9.8% 23.3%
Retail 3.1 5.0% 3.0 4.9% 3.3% 11.7 4.8% 10.9 4.9% 7.3%
Sales of bunker fuel to end-users 0.7 1.1% 0.8 1.3% (12.5)% 2.8 1.2% 1.9 0.9% 47.4%
Total petroleum products 27.6 45.0% 27.2 44.4% 1.5% 109.6 45.3% 98.4 44.2% 11.4%
Sales of LNG 0.0 0.0% 0.5 0.8% (100.0)% 0.6 0.2% 0.2 0.1% >100%
Petrochemical products 0.8 1.3% 0.7 1.1% 14.3% 2.8 1.2% 3.5 1.6% (20.0)%
International sales 0.3 0.5% 0.3 0.4% 0.0% 1.1 0.5% 2.4 1.1% (54.2)%
Domestic sales 0.5 0.8% 0.4 0.7% 25.0% 1.7 0.7% 1.1 0.5% 54.5%
Total crude oil and products, LNG 61.4 100.0% 61.3 100.0% 0.2% 241.7 100.0% 222.7 100.0% 8.5%
Gas bcm bcm bcm bcm
Sales Volumes 17.59 14.42 22.0% 63.91 65.00 (1.7)%

24
Average Sales Prices
The following table sets forth Rosneft’s average export and domestic prices of crude oil, gas, petroleum
products and petrochemical products (the average sales prices may differ from official market prices provided by
specialized agencies due to different quality of products and sales terms)*:
For 3 months ended
%
change
For 12 months ended
December 31,
%
change
December 31,
2017
September 30,
2017 2017 2016
th.RUB/
barrel
th.RUB/
tonne
th.RUB/
barrel
th.RUB/
tonne
th.RUB/
barrel
th.RUB/
tonne
th.RUB/
barrel
th.RUB/
tonne
Average prices on foreign markets
Crude oil, non-CIS 3.36 24.9 2.85 21.1 18.0% 2.95 21.9 2.68 19.9 10.1%
Europe and other directions** 3.31 24.5 2.81 20.8 17.8% 2.89 21.4 2.61 19.3 10.9%
Asia** 3.43 25.4 2.91 21.6 17.6% 3.06 22.6 2.81 20.8 8.7%
Crude oill, CIS 2.69 19.9 2.29 17.0 17.1% 2.32 17.1 1.98 14.7 16.3%
Petroleum products, non- CIS 28.9 25.6 12.9% 25.8 21.6 19.4%
Europe and other directions 29.3 26.8 9.3% 26.6 21.6 23.1%
Asia 27.7 23.0 20.4% 23.6 21.7 8.8%
Petroleum products, CIS 29.7 26.2 13.4% 26.7 24.8 7.7%
Sales of LNG 18.9 18.8 0.5% 18.9 20.0 (5.5)%
Petrochemical products 31.5 27.1 16.2% 29.1 39.3 (26.0)%
Average domestic prices
Crude oil 2.61 19.3 2.22 16.4 17.7% 2.26 16.7 1.94 14.4 16.0%
Petroleum products 33.0 32.2 2.5% 31.7 29.4 7.8%
Wholesale 29.5 28.3 4.2% 27.8 24.9 11.6%
Retail 41.2 41.4 (0.5)% 40.7 38.3 6.3%
Gas (RUB./the cubic meter) *** 3.44 3.29 4.6% 3.33 3.24 2.8%
Petrochemical products 32.8 31.6 3.8% 32.0 22.3 43.5%
Sales of bunker fuel to end-users 21.4 20.0 7.0% 20.0 18.5 8.1% *Average price is calculated from unrounded figures.
**Price excludes revenues under prepaid long-term crude oil supply contracts and revenues from crude oil sales to Transneft (RUB 32 billion and
RUB 27 billion, in the fourth quarter of 2017 and in the third quarter of 2017;RUB 111 billion and RUB 97 billion in the twelve months of 2017 and
2016, respectively). ***
Including gas sales outside Russian Federation average gas prices were 3.47 th.RUB./th. cubic meter in the fourth quarter of 2017 and
3.32 th.RUB./th. cubic meter in the third quarter of 2017, 3.36 th.RUB./th. cubic meter and 3.30 th.RUB./th. cubic meter in the twelve months of 2017 and 2016, respectively.
International Crude Oil Sales to non-CIS
Revenues from international crude oil sales to non-CIS countries in the fourth quarter of 2017 amounted to
RUB 668 billion compared to RUB 560 billion in the third quarter of 2017. Revenue increase was due to the 18.0%
upturn in average price or RUB 108 billion and was partially offset by decrease in sales volumes by 0.3% (unfavorable
impact on revenue of RUB 1 billion).
In the twelve months of 2017 revenues from international crude oil sales to non-CIS countries increased by
15.3% compared with the same period of 2016. Average sales price upturn by 10.1% (positive impact on revenue of
RUB 228 billion) was accompanied by increase in sales volume by 6.1% (favorable impact on revenue of
RUB 128 billion).
International Crude Oil Sales to CIS
Revenue from sales of crude oil to CIS in the fourth quarter of 2017 amounted to RUB 42 billion in
comparison with RUB 35 billion in the third quarter of 2017. The upturn of average sales price by 17.1% (favorable
impact on revenues of RUB 6 billion) was accompanied by increase in sales volume of 5.4% (positive impact on
revenue of RUB 1 billion).
In the twelve months of 2017 and 2016 revenues from international crude oil sales to CIS countries amounted
to RUB 145 billion and RUB 118 billion, respectively. Increase in average sales price of 16.3% (favorable impact on
revenues of RUB 21 billion) was accompanied by increase in sales volume by 5.1% (favorable impact on revenue of
RUB 6 billion)

25
Domestic Sales of Crude Oil
In the fourth quarter of 2017 revenues from domestic sales of crude oil amounted to RUB 39 billion, which is
25.8% higher than in the third quarter of 2017, due to volume increase of 5.0% (favorable impact on revenue of
RUB 2 billion) and was accompanied by average sales price upturn up to 17.7% (favorable impact on revenue of
RUB 6 billion).
In the twelve months of 2017 revenues from domestic crude oil sales amounted RUB 116 billion that were
41.5% higher in comparison with the same period of 2016, which was mainly attributable to growth of crude oil sales
volumes up to 21.1% (favorable effect on revenues of RUB 17 billion) and was accompanied by upturn of average
sales price by 16.0% (positive impact on revenue of RUB 17 billion).
International Petroleum Product Sales to Non-CIS
The table below sets forth Rosneft’s revenue, volume and average price per tonne of petroleum products sold
to non-CIS countries in the fourth quarter of 2017 and in the third quarter of 2017*:
*Average price is calculated from unrounded figures.
** Average price change was due to mix product
Revenues from the international sales of petroleum products to non-CIS countries in the fourth quarter of
2017 were RUB 444 billion in comparison with RUB 380 billion in the third quarter of 2017, which is 16.8% higher
due to the upturn of average price up to 12.9% (positive impact on revenues of RUB 46 billion) which was
accompanied by increase in sales volumes of 5.4% (favorable impact on revenues of RUB 18 billion).
The table below sets forth Rosneft’s revenues, volume and average price per tonne of petroleum products sold
to non-CIS countries in the twelve months of 2017 and 2016*:
For 12 months ended December 31, % change
2017 2016
RUB
billion
million of
tonnes
Average
price
th.RUB/
tonne
RUB
billion
million of
tonnes
Average
Price
th.RUB/
tonne
RUB
billion
million of
tonnes
Average
price
th.RUB/
tonne
High octane gasoline 21 0.6 35.2 15 0.5 32.4 40.0% 20.0% 8.6%
Naphtha 171 6.1 27.9 148 5.8 25.4 15.5% 5.2% 9.8%
Diesel (Gasoil) 426 15.8 26.9 338 13.7 24.6 26.0% 15.3% 9.3%
Fuel oil 449 25.0 18.6 375 25.0 15.3 19.7% 0.0% 21.6%
Other 26 1.0 26.6 18 0.8 23.8 44.4% 25.0% 11.8%
Petroleum products exported to
non-CIS 1,093 48.5 22.9 894 45.8 19.7 22.3% 5.9% 16.2%
Petroleum products sold from
German refineries 416 10.6 39.3 328 11.1 29.6 26.8% (4.5)% 32.8% Petroleum product purchased and sold outside Russia 117 4.6 25.4 87 4.2 20.9 34.5% 9.5% 21.5%
Trading of petroleum products
outside Russia 533 15.2 35.1 415 15.3 27.2 28.4% (0.7)% 29.0%
Total 1,626 63.7 25.8 1,309 61.1 21.6 24.2% 4.3% 19.4%
*Average price is calculated from unrounded figures.
For 3 months ended % change
December 31, 2017 September 30, 2017
RUB
billion
mln of
tonnes
Average
price
th. RUB/
tonne
RUB
billion
mln of
tonnes
Average
price
th.RUB/
tonne
RUB
billion
mln of
tonnes
Average
price
th.RUB/
tonne
High octane gasoline 5 0.1 37.3 5 0.2 34.6 0.0% (50.0)% 7.8%
Naphtha 47 1.4 32.1 42 1.6 27.1 11.9% (12.5)% 18.5%
Diesel (Gasoil) 114 3.9 29.8 88 3.2 26.5 29.5% 21.9% 12.5%
Fuel oil 120 6.1 20.8 105 5.7 18.6 14.3% 7.0% 11.8%
Other 7 0.2 32.7 7 0.4 21.0 0.0% (50.0)% 55.7%**
Petroleum products exported to
non-CIS 293 11.7 25.6 247 11.1 22.4 18.6% 5.4% 14.3%
Petroleum products sold from German
refineries 116 2.8 41.6 112 2.8 39.3 3.6% 0.0% 5.9% Petroleum products bought and sold
outside Russia 35 1.1 31.8 21 0.9 23.3 66.7% 22.2% 36.5%
Trading of petroleum products
outside Russia 151 3.9 38.8 133 3.7 35.6 13.5% 5.4% 9.0%
Total 444 15.6 28.9 380 14.8 25.6 16.8% 5.4% 12.9%

26
In the twelve months of 2017 revenues from sales of petroleum products to non-CIS countries were 24.2%
higher than in the twelve months of 2016 and amounted to RUB 1,626 billion mainly due to average price upturn by
19.4% (favourable impact on revenues of RUB 265 billion), and sales volumes growth of 4.3% (favorable impact
on revenues of RUB 57 billion) taking into account the acquisition of new assets in 2016.
Growth of sales of petroleum products purchased and sold outside Russia resulted from an increased
trading activity of the foreign division of the Company.
International Petroleum Product Sales to CIS
Revenues from sales of petroleum products to the CIS countries were RUB 39 billion in the fourth quarter
of 2017, 11.4% higher, in comparison with the third quarter of 2017 mainly due to upturn of average sales price by
13.4% (favorable effect on revenues of RUB 5 billion), and was partially offset by the decrease in sales volumes by
7.1% (negative impact on revenues of RUB 1 billion).
Revenues from sales of petroleum products to the CIS countries in the twelve months of 2017 were
approximately twofold higher (or increase of RUB 52 billion) compared to the same period of 2016, that were due
to significant increase in petroleum products sales volumes by 69.2% (favorable effect on revenues of RUB 45
billion) and upturn of average sales price by 7.7% or RUB 7 billion.
Domestic Sales of Petroleum Products
The table below sets forth Rosneft’s revenue, volume and average price per tonne of petroleum products
sold in Russia in the fourth quarter of 2017 and in the third quarter of 2017*:
For 3 months ended % change
December 31, 2017 September 30, 2017
RUB
billion
mln of
tonnes
Average
price th.
RUB/
tonne
RUB
billion
mln of
tonnes
Average
price th.
RUB/
tonne
RUB
billion
mln of
tonnes
Average
price th.
RUB/
tonne
High octane gasoline 154 3.8 40.9 162 3.9 41.1 (4.9)% (2.6)% (0.5)% Diesel (Gasoil) 114 3.0 38.3 110 3.3 33.4 3.6% (9.1)% 14.7% Fuel oil 13 1.1 12.6 8 0.6 10.9 62.5% 83.3% 15.6% Jet fuel 31 0.9 34.6 28 0.9 31.5 10.7% 0.0% 9.8% Other 18 1.2 14.1 22 1.5 15.6 (18.2)% (20.0)% (9.6)%
Total 330 10.0 33.0 330 10.2 32.2 0.0% (2.0)% 2.5%
*Average price is calculated from unrounded figures.
Revenues from sales of petroleum products on the domestic market were RUB 330 billion in the fourth
quarter of 2017. A 2.5% upturn of average sales price (positive effect on revenue of RUB 8 billion), was offset by
decrease in petroleum products sales volume of 2.0% (unfavorable effect on revenue of RUB 8 billion).
The table below sets forth Rosneft’s revenue, volume and average price per tonne of petroleum products
sold in Russia in the twelve months of 2017 and 2016*:
For 12 months ended December 31, % change
2017 2016
RUB
billion
million of
tonnes
Average
price
th.RUB/
tonne
RUB
billion
million of
tonnes
Average
price
th.RUB/
tonne
RUB
billion
million of
tonnes
Average
price
th.RUB/
tonne
High octane gasoline 609 15.3 39.8 483 12.8 37.7 26.1% 19.5% 5.6%
Diesel (Gasoil) 408 11.8 34.6 328 10.7 30.7 24.4% 10.3% 12.7%
Fuel oil 36 3.2 11.2 15 2.0 7.4 >100.0% 60.0% 51.4%
Jet fuel 103 3.3 31.5 85 3.0 27.9 21.2% 10.0% 12.9%
Other 70 5.1 13.7 52 4.3 12.3 34.6% 18.6% 11.4%
Total 1,226 38.7 31.7 963 32.8 29.4 27.3% 18.0% 7.8%
*Average price is calculated from unrounded figures.
Revenues from sales of petroleum products on the domestic market in the twelve months of 2017 amounted
to RUB 1,226 billion and were 27.3% higher compared to the same period of 2016. The increase was due to sales
volume growth of 18.0% (favorable effect on revenue of RUB 173 billion) and average sales price growth of 7.8%
(favorable effect on revenue of RUB 90 billion).
Sales of LNG
The Company supplies LNG under a contract with the Egyptian Natural Gas Holding Company, concluded
in August of 2015. Sales volumes in the twelve months of 2017 amounted to 0.6 mln tonnes (RUB 12 billion).

27
Sales of bunker fuel
The Company sells bunker fuel (fuel oil, low-viscosity marine fuel and diesel fuel) in the seaports (the Far
East, the North, the North West and the South of the European part of Russia) and river ports (the Volga-Don basin
and in the rivers of Siberia) of the Russian Federation and in the ports outside the Russian Federation.
Revenues from sales of bunker fuel in the fourth quarter of 2017 increase in comparison with the third
quarter of 2017 and amounted to RUB 17 billion, mainly due to increase in average sales price.
Revenues from sales of bunker fuel in the twelve months of 2017 increased by 58.3% or RUB 21 billion in
comparison with the same period of 2016 due to sales volumes growth of 47.4% (positive effect on revenue of
RUB 17 billion), accompanied by average sales price upturn of 8.1% (favorable effect on revenue of
RUB 4 billion).
Petrochemical Products Sales
Revenues from sales of petrochemical products in the fourth quarter of 2017 and in the third quarter of
2017 amounted to RUB 24 billion (0.8 mln tonnes) and RUB 19 billion (0.7 mln tonnes), respectively.
Petrochemical products sales volumes from the German refineries amounted to 0.13 mln tonnes and
0.14 mln tonnes in the fourth and third quarters of 2017, respectively.
Revenues from sales of petrochemical products in the twelve months of 2017 decreased by RUB 36 billion
and amounted to RUB 84 billion compared to the same period of 2016. International revenues decreased by
RUB 65 billion due to decline in sales volumes of 54.2% (negative impact on revenues of RUB 51 billion) which
was accompanied by downturn in average sales price by 26.0% (negative impact on revenues of RUB 14 billion).
Domestic sales of petrochemical products increased by RUB 29 billon mainly due to the 43.5% upturn in the
average sales price (positive impact on revenues of RUB 16 billion) and increase in sales volumes of 54.5%
(positive impact on revenues of RUB 13 billion).
Gas Sales
The Company strategy envisages gas business expansion on the Russian gas domestic market. In order to
increase its share on the gas domestic market Rosneft implements gas program aimed at diversification of trading
channels and building of long-term contracts portfolio.
The table below sets forth revenues, volumes and average price of gas sales by Rosneft*:
For 3 months ended %
change
For 12 months ended
December 31, %
change
December 31,
2017
September 30,
2017 2017 2016
RUB billion RUB billion
Revenue
In the Russian Federation 59.8 47.0 27.2% 210.4 208.0 1.2%
Outside the Russian Federation 1.2 0.9 33.3% 4.4 6.4 (31.3)%
Total 61.0 47.9 27.3% 214.8 214.4 0.2%
Sales volumes bcm
bcm
In the Russian Federation 17.41 14.28 21.9% 63.22 64.19 (1.5)%
Outside the Russian Federation 0.18 0.14 28.6% 0.69 0.81 (14.8)%
Total 17.59 14.42 22.0% 63.91 65.00 (1.7)%
Average price
th. RUB/th.
of cubic metres th. RUB/th.
of cubic metres
In the Russian Federation 3.44 3.29 4.6% 3.33 3.24 2.8%
Outside the Russian Federation 6.93 6.22 11.4% 6.34 7.82 (18.9)%
Average price of the Company 3.47 3.32 4.5% 3.36 3.30 1.8%
*Average price is calculated from unrounded figures.
In the fourth quarter of 2017 revenues from gas sales in the Russian Federation increased compared to the
third quarter of 2017 and amounted to RUB 59.8 billion. Higher revenues were due to increased sales volumes by
21.9% (positive impact on revenues of RUB 10.2 billion) that was driven by seasonal demand and growth of
average sales prices by 4.6% (+RUB 2.6 billion).
In the Russian Federation gas sales upturn of 1.2% in the twelve months of 2017 compared with the same
period of 2016 resulted from average sales price upturn of 2.8% (positive impact on revenues of RUB 5.6 billion),
despite the decrease in gas sales volumes of 1.5% or RUB 3.2 billion.

28
Support Services and Other Revenues
Rosneft owns service companies that render drilling, construction, repairs and other services mainly to the
companies within the Group. Revenues from services rendered to third parties are reported in the consolidated
statements of profit or loss.
The following table sets forth Rosneft’s other revenues for the periods analysed:
For 3 months ended
%
change
For 12 months ended December 31,
%
change
December 31,
2017
September 30,
2017 2017 2016
% of total
revenue
% of total
revenue
% of total
revenue
% of total
revenue
billion RUB, except %
Drilling services 0.9 4.3% 1.1 5.5% (18.2)% 4.3 5.6% 2.9 3.9% 48.3%
Sales of materials 7.9 37.8% 7.9 39.7% 0.0% 27.4 35.6% 25.4 33.8% 7.9%
Repairs and maintenance services
0.6 2.9% 0.7 3.5% (14.3)% 2.5 3.2% 3.0 4.0% (16.7)%
Rent services 1.3 6.2% 1.1 5.5% 18.2% 5.3 6.9% 5.3 7.0% 0.0%
Construction services 0.2 1.0% 0.1 0.5% 100.0% 0.5 0.6% 0.2 0.3% >100.0%
Transport services 3.7 17.7% 3.6 18.1% 2.8% 14.7 19.0% 14.8 19.7% (0.7)%
Electric power sales and
transmission 3.0 14.4% 2.3 11.6% 30.4% 9.9 12.8% 7.8 10.4% 26.9%
Other revenues 3.3 15.7% 3.1 15.6% 6.5% 12.6 16.3% 15.8 20.9% (20.3)%
Total 20.9 100.0% 19.9 100.0% 5.0% 77.2 100.0% 75.2 100.0% 2.7%
Support services and other revenues in the fourth quarter of 2017 amounted to RUB 21 billion and were
5.0% higher in comparison with the third quarter of 2017.
Support services and other revenues in the twelve months of 2017 increased by 2.7% compared with the
same period of 2016.
Equity share in profits of downstream associates and joint ventures
The equity share in net financial results (profits) of downstream associates and joint ventures amounted to
RUB 7 billion and RUB 5 billion in the fourth and third quarters of 2017, respectively1. The equity share in net
financial results (profits) growth was driven by the income from the Essar project (RUB 4.6 billion) in the fourth
quarter of 2017. The equity share in net financial results of downstream associates and joint ventures was RUB 16
billion and RUB 8 billion in the twelve months of 2017 and 2016, respectively.
Downstream production and operating costs
Downstream operating expenses include*:
For 3 months ended
%
change
For 12 months ended
December 31, %
change December 31,
2017
September 30,
2017 2017 2016**
billion RUB, except %
Operating expenses at refineries in Russia 36.6 33.1 10.6% 129.1 88.3 46.2% Operating expenses at refineries and cost of additives
and materials procured for processing outside Russia 14.7 11.9 23.5% 46.5 75.1 (38.1)%
Operating expenses of retail companies including: 13.0 12.9 0.8% 49.8 44.6 11.7%
operating expenses 9.4 8.9 5.6% 35.2 30.9 13.9%
purchase cost of other inventories 3.6 4.0 (10.0)% 14.6 13.7 6.6%
Downstream operating expenses 64.3 57.9 11.1% 225.4 208.0 8.4%
Intragroup inventory effect and others (21.3) (14.7) 44.9% (30.8) 6.0 −
Total Downstream Operating expenses*** 43.0 43.2 (0.5)% 194.6 214.0 (9.1)% *The difference between percentages presented in the above table and other sections is a result of rounding. **Effect of the acquisition of Bashneft assets of RUB 11.9 billion is included in the expenses in 2016. ***Cost of materials for blending at the retail companies was presented in the “Cost of Purchased Oil, Gas and Petroleum Products and Refining
Costs”. The comparative periods were adjusted respectively.
Operating expenses of refineries and retail companies in the fourth quarter of 2017 increased by 11.1%
compared with the third quarter of 2017 and amounted to RUB 64.3 billion.
In the twelve months of 2017, operating expenses of refineries and retail companies increased by 8.4%
compared with the same period of 2016, that was mainly driven by the acquisition of Bashneft assets.
1See the equity share in net financial results of upstream associates and joint ventures in the section “Upstream operating results”.

29
Operating expenses at Company’s refineries
The table below shows operating expenses at Rosneft’s refineries:
For 3 months ended
%
change
For 12 months ended
December 31, %
change December 31,
2017
September 30,
2017 2017 2016
Operating expenses at refineries in Russia (RUB billion) 36.6 33.1 10.6% 129.1 88.3* 46.2%
Operating expenses per tonne of petroleum product and petrochemical output (RUB per tonne) 1,634 1,497 9.2% 1,444 1,137 27.0%
Operating expenses per tonne of crude oil throughput (RUB
per tonne) 1,569 1,442 8.8% 1,394 1,105 26.2%
Operating expenses at refineries outside Russia (RUB
billion)** 8.3 5.0 66.0% 22.6 31.4 (28.0)%
Operating expenses per tonne of petroleum product and petrochemical output (RUB per tonne) 1,706*** 1,597 6.8% 1,891 2,345 (19.4)%
Operating expenses per tonne of crude oil throughput (RUB
per tonne) 1,689*** 1,587 6.4% 1,883 2,469 (23.7)%
Total operating expenses at Rosneft’s refineries (RUB
billion) 44.9 38.1 17.8% 151.7 119.7 26.7% *Operating expenses include the effect of acquisition of Bashneft assets of RUB 10.84 billion in 2016. **Refineries outside Russia also procured the additives and materials for processing: in the fourth quarter of 2017 – RUB 6.4 billion, in the third
quarter of 2017 – RUB 6.9 billion; in the twelve months of 2017 and 2016 – RUB 23.9 billion and RUB 43.7 billion, respectively. ***The effect of costs related to carrying out the turnarounds at refineries scheduled for February 2018 and expenses of the previous periods of 2017
recognized in the fourth quarter of 2017, amounted to RUB 3.2 billion, and this amount is excluded for the estimation of operating expenses per tonne
for the relevant period of 2017.
Operating expenses of Rosneft’s refineries in Russia in the fourth quarter of 2017 amounted to
RUB 36.6 billion and increased by 10.6% compared with the third quarter of 2017. Increase in operating expenses
is mainly driven by scheduled increase in volumes of turnarounds, maintenance services and seasonal growth of
energy consumption caused by the production upturn in the fourth quarter of 2017.
In the twelve months of 2017 operating expenses of Rosneft’s refineries in Russia increased by 46.2%
compared with the same period of 2016 mainly due to the acquisition of Bashneft assets in the fourth quarter of
2016, increased tariffs of natural monopolies and indexation of wages.
Operating expenses of Rosneft’s refineries outside Russia increased in the fourth quarter of 2017 in
comparison with the third quarter of 2017 due to recognized expenses of the previous periods of 2017 and incurred
costs of carrying out the turnarounds at some of the refineries scheduled for February 2018, in the total amount of
RUB 3.2 billion. Excluding this effect the operating expenses amounted to RUB 5.1 billion and increased by 2.0%
compared with the third quarter of 2017 due to higher volumes of turnarounds. Reduction of operating expenses at
the refineries outside Russia in the twelve months of 2017 in comparison with the same period of 2016 resulted
from completion of the restructuring of ROG (JV with BP Group in oil processing and sales in Western Europe) and
RUB appreciation against the euro.
In the fourth quarter of 2017 operating costs per tonne of crude oil throughput of Rosneft’s refineries in
Russia increased by 8.8% compared with the third quarter of 2017 and amounted to RUB 1,569 per tonne. The
increase was mostly due to higher scheduled turnaround expenses. The increase of 26.2% in operating costs per
tonne at refineries in Russia in the twelve months of 2017 compared with the same period of 2016 was due to the
acquisition of Bashneft assets with higher operating costs caused by more complex process production (production
of fuel oil and aromatics) and by increased tariffs of natural monopolies, indexation of wages.
Operating expenses per tonne of crude oil throughput of Rosneft’s refineries outside Russia were
RUB 1,689 per tonne in the fourth quarter of 2017 (an increase of 6.4%) compared with the third quarter of 2017.
Operating expenses per tonne of crude oil throughput of Rosneft’s refineries outside Russia decreased
to RUB 1,883 per tonne in the twelve months of 2017 (a decrease of 23.7%), compared with the twelve months
of 2016 that was mainly due to reduction in maintenance and turnaround expenses and RUB appreciation of 12.6%
in the twelve months of 2017.

30
Cost of Purchased Oil, Gas and Petroleum Products and Refining Costs and others
The following table shows Rosneft’s crude oil, gas and petroleum products procurement costs and volumes
and third-party refining costs*:
For 3 months ended
%
change
For 12 months ended
December 31, %
change December 31,
2017
September 30,
2017 2017 2016
Crude oil and gas procurement
Cost of crude oil and gas procured (RUB billion)**
205 170 20.6% 651 454 43.4%
including Domestic market 84 62 35.5% 273 206 32.5%
International market 121 108 12.0% 378 248 52.4%
Volume of crude oil procured (millions of barrels) 66.5 67.3 (1.2)% 243.9 191.9 27.1%
including Domestic market 28.1 26.9 4.5% 108.7 99.7 9.0%
International market 38.4 40.4 (5.0)% 135.2 92.2 46.6%
Volume of gas procured (bcm) 4.76 2.41 97.5% 15.25 15.77 (3.3)%
LNG procurement
Cost of LNG (RUB billion) 1 8 (87.5)% 11 3 >100%
Volume of LNG procured (millions of tonnes) 0.06 0.43 (86.0)% 0.62 0.17 >100%
Petroleum products procurement
Cost of petroleum products procured (RUB billion)***
44 27 63.0% 146 121 20.7%
Volume of petroleum products procured
(millions of tonnes) 1.44 1.11 29.7% 5.67 5.13 10.5%
Crude oil, gas and petroleum products refining
services
Cost of refining of crude oil under processing agreements
(RUB billion) 7.7 7.8 (1.3)% 29.0 28.7 1.0%
Volumes of crude oil and petroleum products, refined
under processing agreements (millions of tonnes) 2.3 2.6 (11.5)% 9.6 8.8 9.1%
Volumes of gas refined under processing agreements
(bcm) 2,8 2.6 7.7% 10.4 10.3 1.0%
Cost of products procured for blending on retail
companies (RUB billion) 6.3 6.6 (4.5)% 24.7 25.8 (4.3)%
Including intercompany purchases (RUB billion) 6.3 6.3 − 24.1 25.2 (4.4)%
Inventory revaluation written off − − − − 7 (100)%
Total cost of procured oil, gas and petroleum
products and refining costs (RUB billion) 257 213 20.7% 837 614 36.3% *Cost of purchases under IFRS consolidated financial statements (net of intercompany turnover). **Including costs of Upstream segment in the amount of RUB 9 billion in the fourth quarter of 2017, RUB 5 billion in the third quarter of 2017 and
RUB 35 billion and RUB 25 billion in the twelve months of 2017 and 2016, respectively. ***Average procurement price of petroleum products purchased from third parties may be higher than the average selling price of petroleum products due to differences in the mix of procured and sold petroleum products.
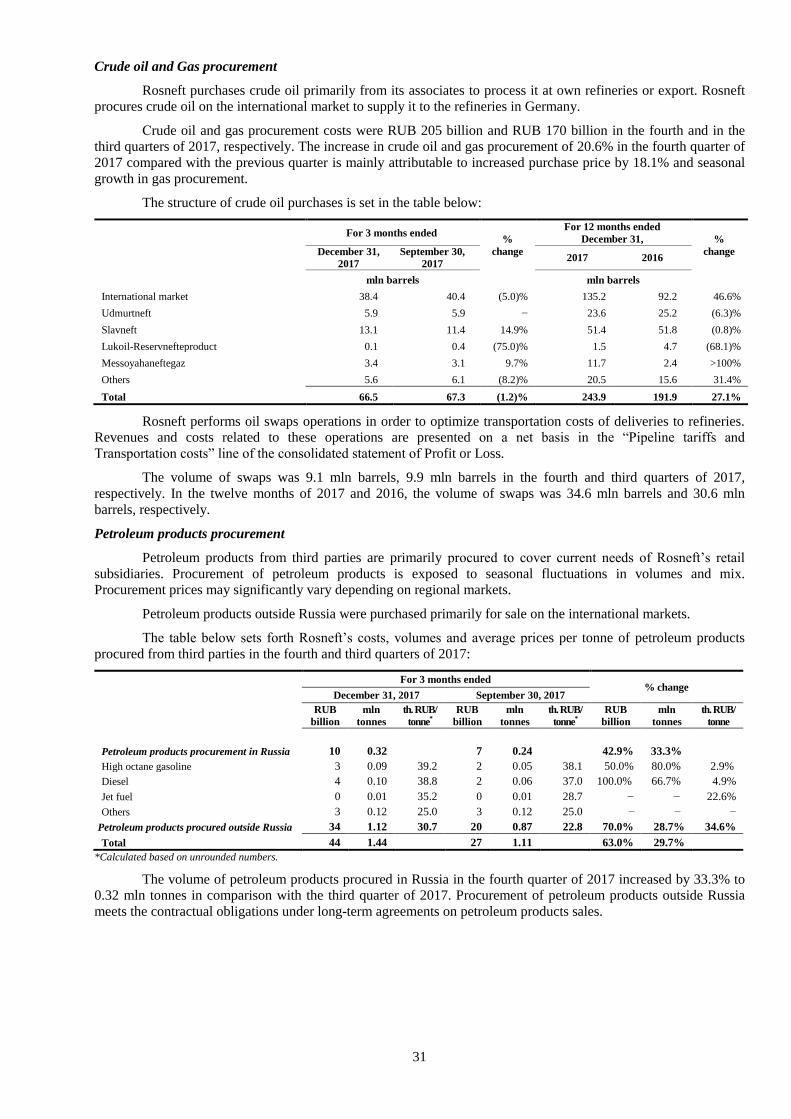
31
Crude oil and Gas procurement
Rosneft purchases crude oil primarily from its associates to process it at own refineries or export. Rosneft
procures crude oil on the international market to supply it to the refineries in Germany.
Сrude oil and gas procurement costs were RUB 205 billion and RUB 170 billion in the fourth and in the
third quarters of 2017, respectively. The increase in crude oil and gas procurement of 20.6% in the fourth quarter of
2017 compared with the previous quarter is mainly attributable to increased purchase price by 18.1% and seasonal
growth in gas procurement.
The structure of crude oil purchases is set in the table below:
For 3 months ended
%
change
For 12 months ended
December 31, %
change December 31,
2017
September 30,
2017 2017 2016
mln barrels mln barrels
International market 38.4 40.4 (5.0)% 135.2 92.2 46.6%
Udmurtneft 5.9 5.9 − 23.6 25.2 (6.3)%
Slavneft 13.1 11.4 14.9% 51.4 51.8 (0.8)%
Lukoil-Reservnefteproduct 0.1 0.4 (75.0)% 1.5 4.7 (68.1)%
Messoyahaneftegaz 3.4 3.1 9.7% 11.7 2.4 >100%
Others 5.6 6.1 (8.2)% 20.5 15.6 31.4%
Total 66.5 67.3 (1.2)% 243.9 191.9 27.1%
Rosneft performs oil swaps operations in order to optimize transportation costs of deliveries to refineries.
Revenues and costs related to these operations are presented on a net basis in the “Pipeline tariffs and
Transportation costs” line of the consolidated statement of Profit or Loss.
The volume of swaps was 9.1 mln barrels, 9.9 mln barrels in the fourth and third quarters of 2017,
respectively. In the twelve months of 2017 and 2016, the volume of swaps was 34.6 mln barrels and 30.6 mln
barrels, respectively.
Petroleum products procurement
Petroleum products from third parties are primarily procured to cover current needs of Rosneft’s retail
subsidiaries. Procurement of petroleum products is exposed to seasonal fluctuations in volumes and mix.
Procurement prices may significantly vary depending on regional markets.
Petroleum products outside Russia were purchased primarily for sale on the international markets.
The table below sets forth Rosneft’s costs, volumes and average prices per tonne of petroleum products
procured from third parties in the fourth and third quarters of 2017:
For 3 months ended % change
December 31, 2017 September 30, 2017
RUB
billion
mln
tonnes
th. RUB/
tonne*
RUB
billion
mln
tonnes
th. RUB/
tonne*
RUB
billion
mln
tonnes
th. RUB/
tonne
Petroleum products procurement in Russia 10 0.32
7 0.24
42.9% 33.3%
High octane gasoline 3 0.09 39.2 2 0.05 38.1 50.0% 80.0% 2.9%
Diesel 4 0.10 38.8 2 0.06 37.0 100.0% 66.7% 4.9%
Jet fuel 0 0.01 35.2 0 0.01 28.7 − − 22.6%
Others 3 0.12 25.0 3 0.12 25.0 − − −
Petroleum products procured outside Russia 34 1.12 30.7 20 0.87 22.8 70.0% 28.7% 34.6%
Total 44 1.44 27 1.11 63.0% 29.7%
*Calculated based on unrounded numbers.
The volume of petroleum products procured in Russia in the fourth quarter of 2017 increased by 33.3% to
0.32 mln tonnes in comparison with the third quarter of 2017. Procurement of petroleum products outside Russia
meets the contractual obligations under long-term agreements on petroleum products sales.

32
The table below sets forth Rosneft’s costs, volumes and average prices per tonne of petroleum products
procured from third parties in the twelve months of 2017 and 2016:
For 12 months ended December 31, % change
2017 2016
RUB
billion
mln
tonnes
th. RUB/
tonne*
RUB
billion
mln
tonnes
th. RUB/
tonne*
RUB
billion
mln
tonnes
th. RUB/
tonne
Petroleum products procurement in
Russia 30 1.01
24 0.79 25.0% 27.8%
High octane gasoline 9 0.27 32.8 7 0.17 35.3 28.6% 58.8% (7.1)%
Diesel 12 0.34 35.7 10 0.31 33.5 20.0% 9.7% 6.6%
Jet fuel 0 0.02 30.4 0 0.02 26.2 − − 16.0%
Others 9 0.38 20.4 7 0.29 24.8 28.6% 31.0% (17.7)% Petroleum products and petrochemicals
procured outside Russia 116 4.66 23.1 97 4.34 23.7 19.6% 7.4% (2.5)% Including petroleum products procurement 115 4.64 23.1 87 4.18 19.1 32.2% 11.0% 20.9%
Total 146 5.67 30.3 121 5.13 23.1 20.7% 10.5% 31.2% *Calculated based on unrounded numbers.
Average purchase prices may be different from average sale prices depending on different regional
structure of purchases and mix structure of the petroleum products.
Volume of petroleum products procured in Russia increased (by 0.22 mln tonnes) in the twelve months of
2017 compared with 2016.
Petroleum products and petrochemicals procurement outside Russia
Petroleum products and petrochemicals procured outside Russia amounted to RUB 34 billion
(1.12 mln tonnes) in the fourth quarter of 2017. Procurement of petroleum products outside Russia meets the
contractual obligations under long-term agreements on sales petroleum products.
The volume of petroleum products and petrochemicals procured outside Russia in the twelve months of
2017 significantly increased (by 7.4%) in comparison with 4.34 mln tonnes in the twelve months of 2016 and was
driven by an upturn in supply under new projects long-term sales agreements.
Сrude oil and gas processing, petroleum products processing
Starting from April 2014, associated petroleum gas sales to PJSC “Sibur” and purchases of dry stripped gas
from PJSC “Sibur” are presented on a net basis in the Company’s financial statements in processing costs.
Processing costs were RUB 14.00 billion and RUB 15.01 billion in the twelve months of 2017 and 2016,
respectively.

33
Pipeline Tariffs and Transportation Costs
Transportation costs are costs incurred by Rosneft to transport crude oil for refining and to end customers, and
to deliver petroleum products from refineries to end customers (these may include pipeline tariffs and railroad tariffs,
handling costs, port fees, sea freight and other costs) and also costs to transport gas via gas pipeline system.
In the fourth quarter of 2017 Rosneft’s transportation costs increased by 4.1% and amounted to
RUB 152 billion compared to RUB 146 billion the third quarter of 2017. The growth in transportation costs was
mainly caused by increased volumes of petroleum products export and increase in share of high cost routes (higher
share of railroad transportation due to the termination of the navigation period).
The table below sets forth the comparison of costs per tonne of crude oil and petroleum products transported
by pipeline, railroad and mixed transportation and gas transportation costs via gas pipeline system in the fourth and
third quarters of 2017, respectively:
For 3 months ended % change
December 31, 2017 September 30, 2017
Volume,
mln
tonnes
Share in
export
volumes
Cost,
bln
RUB1
Cost per
tonne,
th.RUB/t1
Volume,
mln
tonnes
Share in
export
volumes
Cost,
bln
RUB1
Cost per
tonne,
th.RUB/t1
Volume Cost
Cost
per
tonne
CRUDE OIL
International sales
Pipeline 26.80 86.5% 54.6 2.03 26.5 85.5% 54.3 2.05 1.1% 0.6% (1.0)%
Railroad and mixed 0.6 1.9% 2.0 3.27 0.5 1.6% 1.8 3.32 20.0% 11.1% (1.5)%
Pipeline and FCA2 3.6 11.6% 4.0 12.9% (10.0)%
Transportation to refineries
Pipeline3 25.9 19.1 0.74 25.6 18.2 0.71 1.2% 4.9% 4.2%
Railroad and mixed 2.6 9.4 3.66 2.7 9.1 3.36 (3.7)% 3.3% 8.9%
PETROLEUM PRODUCTS
International sales
Pipeline 1.9 10.7% 5.1 2.72 1.8 10.5% 4.5 2.58 5.6% 13.3% 5.4%
Railroad and mixed 13.0 73.0% 31.4 2.42 12.4 72.5% 29.2 2.35 4.8% 7.5% 3.0%
Pipeline and FCA4 2,9 16,3% 2.9 17.0% −
GAS bcm RUB/bcm bcm RUB/bcm
Pipeline 5 11.6 13.7 1.19 9.7 12.2 1.26 19.6% 12.3% (5.6)%
Other transportation expenses6 17 17 -
Total 77.3 152 76.4 146 1.2% 4.1% 1Calculated based on unrounded data. 2Rosneft exported part of crude oil, on FCA terms, and through the foreign trading subsidiary of the Company, where Rosneft does not bear
transportation expenses directly, except for transshipment and dispatching cargo costs. 3Including crude oil purchased on international market, which was delivered to the German refineries. 4Rosneft exported part of petroleum products through its own export terminal in Tuapse. 5Part of gas volumes was dispatched on terms under which Rosneft does not bear transportation expenses. In the fourth and third quarters of 2017 the volumes were 6.0 bcm and 4.7 bcm, respectively. 6Other transportation expenses include cost of railroad transportation of petroleum products from refineries to tank farms and road transportation from
tank farms to fuel filling station.
Crude oil pipeline transportation cost per tonne of international sales in the fourth quarter of 2017 remained
practically unchanged and amounted to RUB 2.03 thousand per tonne.
Crude oil railroad and mixed transportation cost per tonne of international sales was 1.5% lower due to
change in structure of transportation routes.
Crude oil pipeline transportation cost per tonne of supplies to refineries increased by 4.2% in the fourth
quarter of 2017 compared to the third quarter of 2017 that was caused by change in structure of transportation structure
and increased share of higher cost routes.
Crude oil railroad and mixed transportation cost per tonne of supplies to refineries in the fourth quarter of
2017 increased by 8.9% compared with the third quarter of 2017 due to change in transportation routes.
The increase in pipeline cost per tonne of petroleum product international sales of 5.4% in the fourth quarter
of 2017 compared to the previous quarter was mainly due to change in transportation structure.
Gas transportation costs downturn of 5.6% in the fourth quarter of 2017 compared to the third quarter of 2017
resulted from decrease in average distance to final consumers. In the fourth and third quartes of 2017 indexation of gas
transportation tariffs was not carried out.

34
The table below sets forth comparison for costs per tonne of crude oil and petroleum products transported by
pipeline, railway and mixed transportation and gas transportation costs via gas pipeline system in the twelve months of
2017 and 2016, respectively:
For 12 months ended December 31, % change
2017 2016
Volume,
mln
tonnes
Share in
export
volumes
Cost,
bln
RUB1
Cost per
tonne,
th.RUB/t
Volume,
mln
tonnes
Share in
export
volumes
Cost,
bln
RUB1
Cost per
tonne,
th.RUB/t
Volume Cost
Cost
per
tonne
CRUDE OIL
International sales
Pipeline 106.3 87.3% 215.5 2.03 111.6 97.6% 216.8 1.94 (4.7)% (0.6)% 4.6%
Railroad and mixed 2.2 1.8% 7.3 3.33 2.8 2.4% 9.8 3.41 (21.4)% (25.5)% (2.3)%
Pipeline and FCA2 13.3 10.9%
Transportation to refineries
Pipeline3 102.5 75.8 0.74 91.4 68.1 0.77 12.1% 11.3% (3.9)%
Railroad and mixed 10.2 34.3 3.36 8.7 29.1 3.56 17.2% 17.9% (5.6)%
PETROLEUM PRODUCTS
International sales
Pipeline 8.0 11.2% 22.1 2.76 4.8 7.1% 13.9 2.84 66.7% 59.0% (2.8)%
Railroad and mixed 52.1 73.0% 127.9 2.46 52.6 78.2% 136.2 2.59 (1.0)% (6.1)% (5.0)%
Pipeline and FCA4 11.3 15.8% 9.9 14.7% 14.1%
GAS bcm RUB/bcm bcm RUB/bcm
Pipeline 5 43.1 50.8 1.18 43.8 48.2 1.10 (1.6)% 5.4% 7.3%
Other transportation expenses6 63 53 18.9%
Total 305.9 596 281.8 575 8.6% 3.7% 1Calculated based on unrounded data. 2Rosneft exported part of crude oil, on FCA terms, and through the foreign trading subsidiary of the Company, where Rosneft does not bear
transportation expenses directly, except for transshipment and dispatching cargo costs. 3Including crude oil purchased on international market, which was delivered to German refineries. 4Rosneft exported part of petroleum products through its own export terminal in Tuapse. 5Part of gas volumes was dispatched on terms where Rosneft does not bear transportation expenses. In the twelve months of 2017 and 2016 these
volumes amounted to 20.9 bcm and 21.2 bcm, respectively. 6Other transportation expenses include cost of railroad transportation of petroleum products from refineries to tank farms and road transportation from tank farms to fuel filling stations.
The change in transportation costs per tonne of products sold (for crude oil and petroleum products) for the twelve
months of 2017 compared with the same period of 2016 mainly resulted from tariffs indexation and supply chain
optimization. The change in shipping cost of gas (per bcm) was mainly caused by growth of average transportation
distance to final consumers.
Excise tax
In the fourth quarter of 2017 excise tax was RUB 83 billion, including additional costs related to processing
outside Russian Federation in the amount of RUB 25 billion1, in comparison with RUB 88 billion in the third quarter
of 2017.
Excise tax, excluding additional costs related to processing outside Russian Federation, amounted to
RUB 229 billion in the twelve months of 2017 in comparison with RUB 171 billion in the same period of 2016 due to
increased excise tax rate for petroleum products and the acquisition of Bashneft assets.
1These costs are recharged to final buyers (consumers).

35
Export Customs Duty
Export customs duties include crude oil and petroleum products export customs duties. The export customs
duties are also discussed above under “Macroeconomic Factors Affecting the Results of Operations – Taxation”.
The following table sets forth Rosneft’s export customs duties for the periods analyzed:
For 3 months ended
%
change
For 12 months
ended December 31, %
change December 31,
2017
September 30,
2017 2017 2016
RUB billion, except %
Export customs duty for crude oil 133 111 19.8% 480 497 (3.4)%
Export customs duty for petroleum products 49 39 25.6% 178 160 11.3%
Total export customs duty 182 150 21.3% 658 657 0.2%
Export customs duty amounted to RUB 182 billion in the fourth quarter of 2017 compared to
RUB 150 billion in the third quarter of 2017 (a 21.3% increase). This increase was mainly caused by the growth in
export duty rates (+19.7% in RUB terms) due to higher Urals price with relatively small positive export duty time lag
effect in the fourth quarter of 2017.
In the twelve months of 2017 export customs duty expenses did not change significantly that is mainly due to
relatively stable customs duty rates (an increase of 0.7% in the average customs duty rate on crude oil in RUB terms in
2017) with higher volumes of crude oil exports subject to customs duty exemptions (from oilfields with low customs
duty rate), and a significant growth of petroleum products exports due to the acquisition of new assets.
The following table sets forth certain information about the export customs duty on crude oil:
For 3 months ended
%
change
For 12 months ended
December 31, %
change December 31,
2017
September 30,
2017 2017 2016
Urals (average Med and NWE) (USD/bbl) 60.5 50.8 19.0% 53.1 42.1 26.2% Hypothetical export customs duty on crude oil1
(th. RUB/tonne) 6.25 5.06 23.5% 5.30 5.38 (1.5)% Enacted export customs duty on crude oil (th. RUB/tonne) 5.63 4.70 19.7% 5.06 5.02 0.7% Average customs duty on crude oil exports
subject to regular rate (th. RUB/tonne) 5.54 4.66 18.9% 5.01 4.98 0.6% 1Hypothetical customs duty is calculated using the average Urals price for the period (i.e. without time lag).
The deviation of an actual average customs duty on exports is caused by irregular monthly export volumes,
which are subject to different export customs duty.
Operating results of segment “Corporate and others”
Segment includes the Group companies that provide corporate services and holdings’ expenses.
For 3 months ended %
change
For 12 months ended
December 31, %
change December 31,
2017
September 30,
2017 2017 2016
Financial results, RUB billion
EBITDA (28) (16) (75.0)% (74) (44) (68.2)%
Capital expenditures* 15 7 >100% 37 16 >100% *Refer to “Capital expenditures”.
Separate indicators of the consolidated financial statements
Costs and Expenses
General and Administrative Expenses
General and administrative expenses include wages, salaries and social benefits (except for wages and
social benefits of technical staff of production and refining entities), banking commissions, third-party fees for
professional services, insurance expenses (except for insurance of oil and gas production and refining entities),
maintenance of social infrastructure, lease expenses, allowances for doubtful accounts and other general expenses.
General and administrative expenses were RUB 54 billion (net of the allowance for doubtful debt of
RUB 3 billion) in the fourth quarter of 2017 in comparison with RUB 34 billion (net of the allowance for doubtful
debt of RUB 7 billion) in the third quarter of 2017.

36
The 24.6% growth of general and administrative expenses (excluding one-off recognition of allowance for
doubtful debt) in the twelve months of 2017 compared to the same period of 2016 was due to incurred expenses in
terms of the development of strategic projects and acquisition of new assets. The Company continues the
monitoring of general and administrative expenses in view of current inflation level and growth of operating
activity.
Depreciation, Depletion and Amortization
Depreciation, depletion and amortization include depreciation of crude oil and gas producing assets and other
production and corporate assets.
In the fourth and third quarters of 2017 DDA amounted to RUB 146 billion and RUB 144 billion,
respectively. The growth relates to crude oil production increase, growth of fixed assets put into operation and one-off
recognition of DDA of refineries in Germany in terms of recognition of final assessment of assets.
In the twelve months of 2017 DDA was 19.8% higher if compared to the same period of 2016 due to the
acquisition of Bashneft assets in October 2016 and new oilfield assets in 2017.
Taxes Other than Income Tax
Taxes other than income tax include the mineral extraction tax, the excise tax, the property tax and other
taxes. The basis for calculation of mineral extraction tax is set in the section “Macroeconomic Factors Affecting
Results of Operations – Taxation – Mineral Extraction Tax” above.
The following table sets forth Rosneft’s taxes other than income tax (excluding export duties) for the periods
analysed (in RUB billion):
For 3 months ended
%
change
For 12 months ended
December 31, %
change December 31,
2017
September 30,
2017 2017 2016
Mineral extraction tax 441 357 23.5% 1,488 1,007 47.8%
Excise tax 83 88 (5.7)% 326 197 65.5%
Social security tax 15 14 7.1% 61 50 22.0%
Property tax 10 10 − 38 36 5.6%
Other taxes, interest, penalties and other
payments to budget 1 1 − 6 6 −
Total taxes other than income tax 550 470 17.0% 1,919 1,296 48.1%
Taxes other than income tax were RUB 550 billion and increased by 17.0% in the fourth quarter of 2017,
compared to RUB 470 billion in the third quarter of 2017 due to growth of the mineral extraction tax expense because
of average tax rate growth of crude oil by 24.4%.
In the twelve months of 2017, taxes other than income tax increased approximately by 1.5 times in
comparison with the same period of 2016 due to excise rate and MET base rate growth and acquisition of Bashneft
assets in the fourth quarter of 2016.
Finance Income and Expenses
Finance income and expenses include interest received on deposits, deposit certificates and loans issued,
interest paid on loans and borrowings received, results from changes in fair value of financial assets measured at fair
value, results from operations with derivative financial instruments, increase in provision due to the unwinding of
discount, results from disposal of financial assets and other finance income and expenses.
In the fourth quarter of 2017, net finance expenses decreased to RUB 30 billion from RUB 32 billion in the
third quarter of 2017 mainly due to the increase in capitalized borrowing costs and RUB appreciation against USD.
In the twelve months of 2017, net finance expenses increased to RUB 118 billion compared to
RUB 102 billion in the same period of 2016. In 2017, finance expenses increased mainly due to the interest accrued on
other borrowings under repurchase agreement operations concluded at the end of 2016 and recognition of losses from
disposal of financial assets. The increase in finance expenses was compensated by the growth of interest income on
long-term advances issued.
Other Income and Other Expenses
In the twelve months of 2017 other income was RUB 109 billion (including RUB 105 billion in the fourth
quarter of 2017) in comparison with RUB 49 billion the same period of 2016. One-off income of RUB 100 billion was
recognized in the Profit or loss statement in the fourth quarter of 2017 as a result of the achieved out-of-court
settlement with AFK “Sistema”.

37
In the fourth and third quarters of 2017 other expenses amounted to RUB 32 billion and RUB 25 billion.
Other expenses include assets impairment, effect of fixed assets disposal in the course of operating activities and other
expenses. In the twelve months of 2017 and 2016 other expenses were RUB 77 billion and RUB 79 billion,
respectively.
Foreign Exchange Differences
Foreign exchange effects are mostly attributable to monthly revaluation of assets and liabilities denominated
in foreign currency at the exchange rate at the end of the period.
In the fourth quarter of 2017 foreign exchange loss recognized in profit or loss statement was
RUB 6 billion. In the twelve months of 2017 foreign exchange gain recognized in profit or loss statement was
RUB 3 billion. In the twelve months of 2016 foreign exchange loss was RUB 70 billion.
Exchange differences from foreign currency borrowings used for capital construction projects and the
acquisition of property, plants and equipment were RUB 27 billion and RUB 0 billion in the twelve months of 2017
and 2016, respectively.
Cash flow hedges reclassified to profit or loss
Cash flow hedges reclassified to profit or loss recognized in the consolidated statement of profit or loss in the
fourth and in the third quarters of 2017 were RUB 37 billion and RUB 36 billion, respectively. In the twelve months of
2017 and 2016 cash flow hedges reclassified to profit or loss recognized in the consolidated statement of profit or loss
were RUB 146 billion and RUB 147 billion, respectively.
Income Tax
The following table sets forth the Company’s effective income tax rate under IFRS for the periods analysed:
For 3 months ended For 12 months ended December 31,
December 31,
2017
September 30,
2017 2017 2016
Effective rate of income tax (IFRS) 26.1% 31.0% 24.3% 24.81% 1 Excluding one-off recognition of income tax of RUB 38 billion accrued on sale of share in the subsidiary.
.
The Company applies the provisions of IAS 12 “Income taxes” to determine income tax in the Consolidated
profit or loss statement. The effective income tax rate for the fourth quarter of 2017 and for the twelve months of 2017
differs from the statutory rate of 20% because of differences in recognition of expenses and income for IFRS and tax
purposes and due to application of tax relief.
In accordance with the consolidated statement of comprehensive income, income tax was RUB 54 billion and
RUB 27 billion in the fourth and third quarters of 2017, respectively. In the fourth quarter of 2017, the Company
recognized tax of RUB 20 billion from the non-operating income of achieved the out-of-court settlement with
JSFC “Sistema”. In the twelve months of 2017 and 2016 income tax expense was RUB 98 billion and
RUB 114 billion, respectively.
Net Income
Net income amounted to RUB 145 billion (RUB 100 billion attributable to Rosneft shareholders) in the fourth
quarter of 2017 compared with the net income of RUB 60 billion (RUB 47 billion attributable to Rosneft shareholders)
in the third quarter of 2017. One-off income of RUB 100 billion was recognized in the Profit or loss statement in the
fourth quarter of 2017 as a result of the achieved out-of-court settlement with JSFC “Sistema”. According to the
settlement terms the defendants (JSFC “Sistema”) are obliged to compensate the agreed damages to Bashneft in the
amount of RUB 100 billion. The finalization of the payments shall be made by March 30, 2018.
Net effect from the recognition of this non-operating income in the Profit or loss statement of 2017 was RUB
80 billion, including positive effect of RUB 48 billion in the net income attributable to Rosneft shareholders.
Net income amounted to RUB 297 billion (RUB 222 billion attributable to Rosneft shareholders) in the
twelve months of 2017 compared to RUB 192 billion (RUB 174 billion attributable to Rosneft shareholders) in the
twelve months of 2016.

38
Liquidity and Capital Resources
Cash Flows
The principal items of the statement of cash flows for the periods analysed are as follows:
For 3 months ended %
change
For 12 months ended
December 31, %
change December 31,
2017
September 30,
2017 2017 2016
RUB billion RUB billion
Net cash received from/(used in) operating activities 125 (1) − 337 679 (50.4)%
Net cash used in investing activities (257) (497) (48.3)% (1,162) (973) 19.4%
Net cash received from financing activities 228 287 (20.6)% 381 645 (40.9)%
Net cash received from/(used in) operating activities
Net cash provided by operating activity for the analysed periods is presented in the table below:
For 3 months ended
%
change
For 12 months ended
December 31, %
change December 31,
2017
September 30,
2017 2017 2016*
RUB billion RUB billion
Net cash provided by/(used in) operating
activity 125 (1) − 337 679 (50.4)%
Effect from operations with trading securities − − − − (4) (100.0)% Adjusted net cash provided by/(used in)
operating activity 125 (1) − 337 675 (50.1)% Offsetting of prepayments received under long
term supply contracts at average ex.rate 140 144 (2.8)% 542 288 88.2% Interest expense for prepayments under long term supply contracts** 20 20 − 81 90 (10.0)%
Financing of future deliveries 51 75 (32.0)% 207 95 >100% Adjusted net cash provided by operating
activity 336 238 41.2% 1,167 1,148 1.7% * Comparative periods were revised due to adjustment set above. **Interest expenses for prepayments under long term supply contracts were included into adjusted operating cash flows for comparative periods. Interest
expenses on the prepayment on long-term oil and petroleum products supply agreements are composed of interests accrued for the reporting period and offset against crude oil supply under the contracts in the amount of RUB 71 billion and interests paid of RUB 10 billion in the twelve months of 2017;
and offsetting of RUB 75 billion and interests paid of RUB 15 billion on twelve months of 2016.
In the fourth quarter of 2017, adjusted operating cash flow was RUB 336 billion compared with
RUB 238 billion in the third quarter of 2017. In the twelve months of 2017 and 2016 adjusted operating cash flow was
RUB 1,167 billion and RUB 1,148 billion, respectively.
Net cash used in investing activities
Net cash used in investing activities was 257 billion in the fourth quarter of 2017 compared to
RUB 497 billion in the third quarter of 2017. In the fourth quarter of 2017 the Company’s investing activity mainly
referred to capital expenditures, acquisition of licenses and financing of new strategic assets. The reduction in cash
used in the investing activity compared to the third quarter of 2017 resulted from the investments to Essar project
made in the previous quarter.
In the twelve months of 2017 planned growth of investing activity was mainly due to the acquisition of new
assets, acquisition of interest in associates and joint ventures and planned capital expenditures. Net cash used in
investing activities was 1,162 billion if compared to RUB 973 billion used in investing activities in the twelve months
of 2016.
Net cash provided by financing activities
Net cash provided by financing activities was RUB 228 billion in the fourth quarter of 2017 compared to
RUB 287 billion in the third quarter of 2017. In the fourth quarter of 2017 the Company raised long-term and short-
term rouble funds. Effect from raising rouble funds was partially compensated by dividend payment of
RUB 68 billion (including dividends on the Company’s common shares in the amount of RUB 41 billion).
In the twelve months of 2017 net cash provided by financing activities was RUB 381 billion compared to
RUB 645 billion. Total dividends payments (including dividends paid to minority) were RUB 142 billion in 2017 and
RUB 126 billion in 2016, respectively.

39
Capital Expenditures
The table below sets forth Rosneft’s capital expenditures by operating segments and license acquisition costs:
For 3 months ended
%
change
For 12 months ended
December 31, %
change December 31,
2017
September 30,
2017 2017 2016
RUB billion RUB billion
RN-Yuganskneftegaz 62 49 26.5% 207 158 31.0%
Vankor projects 18 16 12.5% 62 72 (13.9)%
Orenburgneft 13 7 85.7% 34 29 17.2%
Samotlorneftegaz 15 13 15.4% 50 44 13.6%
Offshore projects 2 4 (50.0)% 11 30 (63.3)%
RN-Uvatneftegaz 7 5 40.0% 26 26 −
Verkhnechonskneftegaz 5 4 25.0% 19 17 11.8%
RN-Purneftegaz 8 5 60.0% 24 19 26.3%
Rospan International 11 14 (21.4)% 50 42 19.0%
Samaraneftegaz 10 8 25.0% 31 24 29.2%
Varyoganneftegaz 6 4 50.0% 19 18 5.6%
VSNGK 7 6 16.7% 23 21 9.5%
Tomskneft VNK 2 1 100.0% 8 7 14.3%
RN-Nyaganneftegaz 6 5 20.0% 19 12 58.3%
RN-Severnaya Neft 5 3 66.7% 14 14 −
Tyumenneftegaz 7 7 − 23 10 >100%
Taas-Yuryah Neftegazodobycha 8 9 (11.1)% 37 22 68.2%
Sibneftegaz 1 1 − 4 5 (20.0)%
Bashneft-Dobycha 8 7 14.3% 24 7 >100%
Bashneft-Polyus 4 6 (33.3)% 20 4 >100%
Sorovskneft 2 1 100.0% 7 2 >100%
Kondaneft 7 5 40.0% 17 − −
Upstream projects (Zohr) 12 − − 12 − −
Other 27 16 68.8% 65 33 97.0%
Government grants (4) (3) 33.3% (8) (8) −
Total upstream segment 249 193 29.0% 798 608 31.3%
Tuapse refinery 2 3 (33.3)% 10 11 (9.1)%
Kuibyshev refinery 2 2 − 7 10 (30.0)%
Novokuibyshevsk refinery 2 2 − 6 8 (25.0)%
Syzran refinery 1 1 − 3 5 (40.0)%
Angarsk refinery 2 1 100.0% 5 5 −
Achinsk refinery 1 1 − 3 4 (25.0)%
Ryazan refinery 2 1 100.0% 5 4 25.0%
Komsomolsk refinery − 1 (100.0)% 2 2 −
Saratov refinery 1 1 − 2 1 100.0%
Bashneft refineries 3 2 50,0% 8 5 60,0%
Other refineries 5 3 66.7% 14 10 40.0%
Marketing Business Units and others 7 5 40.0% 22 20 10.0%
Total downstream segment 28 23 21.7% 87 85 2.4%
Total other activities 15 7 >100% 37 16 >100%
Total capital expenditures 292 223 30.9% 922 709 30.0%
Acquisition of licenses 5 13 (61.5)% 42 24 75.0%
Return of auction advances − (8) − (8) (13) (38.5)%
In the fourth quarter of 2017 total capital expenditures amounted to 292 billion (an increase of 30.9%)
compared with RUB 223 billion in the third quarter of 2017. In the twelve months of 2017 and 2016 total capital
expenditures were RUB 922 billion and RUB 709 billion, respectively. The increase in capital expenditures in the
twelve months of 2017 compared with the same period of 2016 is mainly driven by the development of investment
program in key business segments and the acquisition of new assets.
In the fourth quarter of 2017 upstream capital expenditures amounted to RUB 249 billion (an increase of
29.0% or RUB 56 billion) in comparison with RUB 193 billion in the third quarter of 2017. In the twelve months of
2017 upstream capital expenditures were RUB 798 billion. The growth in upstream capital expenses of 31.3%
compared to RUB 608 billion in the twelve months of 2016 is mainly due to the development of drilling program
(+29.5% to the twelve months of 2016), scheduled investments at the Greenfields and the acquisition of new assets.

40
In the fourth quarter of 2017 downstream capital expenditures were RUB 28 billion, including capital
expenditures of investment tariffs, and increased by 21.7% in comparison with RUB 23 billion in the third quarter of
2017. Downstream capital expenditures in the twelve months of 2017 compared to the same period of 2016
increased by RUB 2 billion and amounted to RUB 87 billion.
In the fourth quarter of 2017 capital expenditures of refineries amounted to RUB 21 billion compared with
RUB 18 billion in the third quarter of 2017. In the twelve months of 2017 and 2016 capital expenditures of refineries
amounted to RUB 65 billion, and were aimed at refinery upgrade program and maintenance of current projects.
Capital expenditures of other activities are mainly related to scheduled purchases of IT, transport and other
equipment assets and amounted to RUB 15 billion in the fourth quarter of 2017 and RUB 7 billion in the third
quarter of 2017, respectively. In the twelve months of 2017 and 2016 capital expenditures of other activities
amounted to RUB 37 billion and RUB 16 billion, respectively.
The license acquisition costs in the fourth quarter of 2017 amounted to RUB 5 billion and RUB 13 billion
in the third quarter of 2017, respectively. In the third quarter of 2017 the Company returned the advance in the
amount of RUB 8 billion issued in the previous period for the participation in the auction. The license acquisition
costs in the twelve months of 2017 amounted to RUB 42 billion and referred to acquisition of new licenses for
research, exploration and production at Samara, Orenburg and Saratov regions, Republic of Bashkortostan,
Republic of Sakha (Yakutia), the Khanty-Mansi and the Yamal-Nenets Autonomous areas.
The license acquisition costs in the twelve months of 2016 amounted to RUB 24 billion and the Company
returned the advance in the amount of RUB 13 billion issued in the previous period for the participation in the
auction.
Financial liabilities and liquid funds
Financial liabilities detailed by currencies and liquid funds are set in the table below: currency in bln
As of the date December 31, 2017 September 30, 2017 December 31, 2016
USD RUB Euro
Other
(RUB
equi-
valent)
USD RUB Euro
Other
(RUB
equi-
valent)
USD RUB Euro
Other
(RUB
equi-
valent)
Financial liabilities (30.1) (2,028) (3.6) − (31.4) (1,815) (1.2) − (37.5) (1,180) (0.6) −
Liquid funds* 6.5 377 5.4 2 6.2 312 5.3 2 14.5 763 0.7 3
Net financial liabilities (23.6) (1,651) 1.8 2 (25.2) (1,503) 4.1 2 (23.0) (417) 0.1 3
*include cash and cash equivalents, short-term financial assets and part of bank deposits
The level of financial liabilities and liquid funds, which generate additional yield to fulfil the Company’s
commitments, remained at the point which strongly secured the Company's high financial stability.

41
Key consolidated financial highlights (in RUB terms)
Rosneft monitors and evaluates its activities on an ongoing basis. Key financial ratios are set forth below:
For 3 months ended For 12 months ended December 31,
December 31,
2017
September 30,
2017 2017 2016
EBITDA margin 22.4% 24.0% 22.6% 25.0%
Net income margin attributable to Rosneft shareholders 5.9% 3.1% 3.7% 3.5%
Current ratio 0.60 0.52 0.60 0.83
RUB / bbl
EBITDA/bbl 1,003 948 900 879
Upstream capital expenditures/bbl 636 493 512 418
Upstream operating expenses/bbl 248 234 230 208
Free cash flow /bbl 112 38 157 302
RUB / boe
EBITDA/boe 803 767 724 701
Upstream capital expenditures/boe 509 399 412 334
Upstream operating expenses/boe* 199 189 185 166
Free cash flow /boe 90 31 126 241 *Excluding the acquisition of Bashneft assets upstream operating expenses are 177 RUB/boe (3.0 USD/boe) in the twelve months of 2017 and
163 RUB/boe (2.5 USD/boe) in the twelve months of 2016.
The Company considers EBITDA/bbl, upstream operating expenses/bbl, upstream operating expenses/boe
and the related indicators as important measures of its operating performance. In addition, these measures are
frequently used by financial analysts, investors and other interested parties in the evaluation of oil and gas companies.
These measures have limitations as analytical tools and should not be considered in isolation, or as a substitute for
analysis of the Company’s operating results as reported under IFRS.
All the 'per unit of production' indicators are calculated by dividing the total amount in RUB by the total
production volume (in mln bbl or mln boe).
The following tables set forth relevant numbers relating to these measures for the periods and as of the dates
indicated:
Upstream Measures*
For 3 months ended For 12 months ended December 31,
December 31,
2017
September 30,
2017 2017 2016
Crude oil and NGL production (mln bbl) 391.7 391.4 1,558.2 1,454.0
Crude oil, NGL and gas production (mln boe) 489.3 483.8 1,938.0 1,822.3 * Excluding share in production of associates and joint ventures.
Calculation of Free Cash Flow
For 3 months ended For 12 months ended December 31,
December 31,
2017
September 30,
2017 2017 2016
RUB billion
Operating cash flow 125 (1) 337 679
Capital expenditures (292) (223) (922) (709)
Trading securities operations − − − (4)
Offsetting of prepayments under long term supply contracts * 140 144 542 288 Interest expense on prepayments under long term supply
contracts** 20 20 81 90
Financing of future deliveries 51 75 207 95
Free cash flow (RUB equivalent) 44 15 245 439 * Based on average exchange rates during the reporting periods (monthly basis). ** Free cash flow estimation for comparative periods includes interest expenses on the prepayments under long-term oil and petroleum products supply agreements. Interest expenses on the prepayments under long-term oil and petroleum products supply agreements are composed of interests accrued for
the reporting period and offset against crude oil supply under the contracts in the amount of RUB 71 billion and interests paid of RUB 10 billion in the twelve months of 2017; and offsetting of RUB 75 billion and interests paid of RUB 15 billion in the twelve months of 2016.

42
Calculation of EBITDA
For 3 months ended For 12 months ended December 31,
December 31,
2017
September 30,
2017 2017 2016
RUB billion Revenues and equity share in profits of associates and joint ventures 1,709 1,496 6,014 4,988
Effect of prepayments offsetting 48 49 193 134
Costs and expenses (1,510) (1,318) (5,390) (4,333)
Depreciation, depletion and amortization 146 144 586 489
EBITDA 393 371 1,403 1,278
Calculation of EBITDA Margin
For 3 months ended For 12 months ended December 31,
December 31,
2017
September 30,
2017 2017 2016
RUB billion (except %)
EBITDA 393 371 1,403 1,278 Revenues and equity share in profits of associates and joint
ventures 1,709 1,496 6,014 4,988
Effect of prepayments offsetting 48 49 193 134
Adjusted revenues 1,757 1,545 6,207 5,122
EBITDA margin 22.4% 24.0% 22.6% 25.0%
Calculation of Net Income Margin
For 3 months ended For 12 months ended December 31,
December 31,
2017
September 30,
2017 2017 2016
RUB billion (except %)
Net income attributable to Rosneft shareholders 100 47 222 174 Revenues and equity share in profits of associates and joint
ventures 1,709 1,496 6,014 4,988
Net income margin 5.9% 3.1% 3.7% 3.5%
Calculation of Current ratio
As of the date December 31, 2017 September 30, 2017 December 31, 2016
RUB billion (except ratios)
Current assets 2,292 1,833 2,300
Current liabilities 3,836 3,505 2,773
Current ratio 0.60 0.52 0.83
.
Calculation of Return on Average Capital Employed (ROACE)
For 12 months ended December 31,
2017 2016
(RUB billion, except %)
Revenue and equity share in profits of associates and joint ventures 6,014 4,988
Total costs and expenses (5,390) (4,333)
Effect of prepayments offsetting 193 134
Income tax expense (98) (114)
Return used for the calculation of ROACE 719 675
Average capital employed 6,209 4,871
ROACE 11.6% 13.9%
Calculation of Return on Average Equity (ROAE)
For 12 months ended December 31,
2017 2016
(RUB billion, except %)
Net income attributable to Rosneft shareholders 222 174 Average equity, including non-controlling interests 3,983 3,356
ROAE 5.6% 5.2%

43
Consolidated financial highlights (in USD terms)
Consolidated statement of profit or loss*
For 3 months ended For 12 months ended December 31,
December 31,
2017
September 30,
2017 2017 2016
USD billion Total revenues and equity share in profits of associates
and joint ventures 30.1 26.2 106.4 77.2
Costs and expenses Production and operating expenses 2.7 2.6 10.4 8.4 Cost of purchased oil, gas, petroleum products
and refining costs 4.4 3.6 14.3 9.3 General and administrative expenses 0.9 0.7 2.9 1.9 Pipeline tariffs and transportation costs 2.6 2.5 10.2 8.6 Exploration expenses 0.1 0.1 0.3 0.2 Depreciation, depletion and amortization 2.5 2.4 10.0 7.4 Taxes other than income tax 9.6 7.8 33.0 19.6 Export customs duty 3.1 2.6 11.3 9.9 Total costs and expenses 25.9 22.3 92.4 65.3 Operating income 4.2 3.9 14.0 11.9 Finance income 0.4 0.4 1.8 1.4 Finance expenses (1.0) (1.0) (3.9) (2.9) Other income 1.8 0.1 1.9 0.8 Other expenses (0.5) (0.5) (1.3) (1.2) Foreign exchange differences (0.9) (0.9) (3.3) (3.0)
Cash flow hedges reclassified to profit or loss (0.6) (0.6) (2.5) (2.2) Income before income tax 3.4 1.4 6.7 4.8 Income tax expense (0.8) (0.5) (1.6) (1.8)
Net income 2.6 0.9 5.1 3.0
Net income attributable to Rosneft shareholders 1.8 0.7 3.8 2.7 *Calculated using average monthly exchange rates based on the Bank of Russia data for the reporting period (Appendix 1).
Key consolidated financial highlights (in USD terms)
Key financial ratios in USD equivalent for the periods indicated are set forth below:
For 3 months ended For 12 months ended December 31,
December 31,
2017
September 30,
2017 2017 2016
EBITDA margin 22.3% 24.0% 22.6% 25.0%
Net income margin 6.0% 2.7% 3.6% 3.5%
Current ratio 0.60 0.52 0.60 0.83
USD/bbl*
EBITDA/bbl 17.1 16.1 15.4 13.3
Upstream capital expenditures/bbl 10.9 8.4 8.8 6.3
Upstream operating expenses/bbl 4.2 4.0 3.9 3.1
Free cash flow/bbl 1.9 0.7 2.6 4.4
USD/boe
EBITDA/boe 13.7 13.0 12.4 10.6
Upstream capital expenditures/boe 8.7 6.8 7.1 5.0
Upstream operating expenses/boe 3.4 3.2 3.2 2.5
Free cash flow/boe 1.5 0.6 2.1 3.5 *Calculated from unrounded data.

44
Calculation of Free Cash Flow
For 3 months ended For 12 months ended December 31,
December 31,
2017
September 30,
2017 2017 2016
USD billion
Operating cash flow 2.1 – 5.6 10.0
Capital expenditures (5.0) (3.8) (15.8) (10.7)
Trading securities operations – – – (0.1)
Offsetting of prepayments under long term supply contracts 2.4 2.5 9.3 4.4 Interest expense on prepayments under long term supply contracts 0.3 0.3 1.4 1.3
Financing of future deliveries 0.9 1.3 3.6 1.5
Free cash flow 0.7 0.3 4.1 6.4
Calculation of EBITDA Margin
For 3 months ended For 12 months ended December 31,
December 31,
2017
September 30,
2017 2017 2016
USD billion (except %)
Revenues and equity share in profits of associates and joint
ventures 30.1 26.2 106.4 77.2
Operating expenses (25.9) (22.3) (92.4) (65.3)
Depreciation, depletion and amortization 2.5 2.4 10.0 7.4
EBITDA 6.7 6.3 24.0 19.3 Revenues and equity share in profits of associates and joint ventures 30.1 26.2 106.4 77.2
EBITDA margin 22.3% 24.0% 22.6% 25.0%
Calculation of Net Income Margin
For 3 months ended For 12 months ended December 31,
December 31,
2017
September 30,
2017 2017 2016
USD billion (except %)
Net income attributable to Rosneft shareholders 1.8 0.7 3.8 2.7 Revenues and equity share in profits of associates and joint
ventures 30.1 26.2 106.4 77.2
Net income margin 6.0% 2.7% 3.6% 3.5%
Calculation of Current ratio
As of the date December 31, 2017 September 30, 2017 December 31, 2016
USD billion (except ratios)
Current assets 39.8 31.6 37.9
Current liabilities 66.6 60.4 45.7
Current ratio 0.60 0.52 0.83

45
Appendix 1: Average monthly RUB/USD exchange rates, calculated using the Bank of Russia data
Appendix 2: Average transportation tariffs in the fourth and third quarters of 2017 in RUB
The table sets forth Rosneft’s average transportation tariffs applied to major transportation routes in the
fourth and third quarters of 2017 excluding transshipment:
For 3 months ended For 3 months ended
December 31, 2017 September 30, 2017
th. RUB/tonne
CRUDE OIL
Domestic
Pipeline
RN-Nyaganneftegaz (Krasnoleninsk) – Tuapse refinery 1.67 1.67
Samotlorneftegaz – Omsk refinery 0.55 0.55
RN-Yuganskneftegaz (Karkateevy) – Novoil 0.69 0.69
Export
Pipeline
Vankorneft (Purpe) – China 2.46 2.46
Verkhnechonskneftegaz (Talakan) – Kozmino 2.46 2.46
RN-Uvatneftegaz (Demyanskoe) – China (to Russia – Kazakhstan
boarder) 1.39 1.39
RN-Yuganskneftegaz (Karkateevy) – Primorsk Port 1.87 1.87
RN-Yuganskneftegaz (Yuzhny Balyk) – Primorsk Port 1.85 1.85
PETROLEUM PRODUCTS (Export)
Railroad
Angarsk refinery – Nakhodka Port 5.40 5.40
Komsomolsk refinery – Nakhodka Port 2.13 2.13
Saratov refinery – Novorossiysk Port 2.12 2.12
Ryazan refinery – Ust-Luga Port 2.17 2.17
Achinsk refinery – Lugskaya Port 5.55 5.55
YaNOS − Avtovo Port 1.53 1.53
Samara refineries –Taman Port 2.68 2.68
Source: Transneft, RZD, Rosneft.
2017 2016
RUB/USD
January 59.96 76.31
February 58.40 77.23
March 58.11 70.51
April 56.43 66.69
May 57.17 65.67
June 57.83 65.31
July 59.67 64.34
August 59.65 64.93
September 57.70 64.60
October 57.73 62.68
November 58.92 64.37
December 58.59 62.20